british social attitudes 31 social attitudes 31 ... the 31st british social attitudes report to...
TRANSCRIPT

BRITISHSOCIALATTITUDES31
2014 Edition
Editors:Alison Park, Caroline Bryson, and John Curtice

British Social Attitudes 31
NatCen Social Research
At NatCen Social Research we believe that social research has the power to make life better. By really understanding the complexity of people’s lives and what they think about the issues that affect them, we give the public a powerful and influential role in shaping decisions and services that can make a difference to everyone. And as an independent, not for profit organisation we’re able to focus our time and energy on meeting our clients’ needs and delivering social research that works for society.
Publication details
Park, A., Bryson, C. and Curtice, J. (eds.) (2014), British Social Attitudes: the 31st Report, London: NatCen Social Research, available online at: www.bsa-31.natcen.ac.uk
© NatCen Social Research 2014First published 2014
You may print out, download and save this publication for your non-commercial use. Otherwise, and apart from any fair dealing for the purposes of research or private study, or criticism or review, as permitted under the Copyright, Designs and Patents Act, 1988, this publication may be reproduced, stored or transmitted in any form, or by any means, only with the prior permission in writing of the publishers, or in the case of reprographic reproduction, in accordance with the terms of licences issued by the Copyright Licensing Agency. Enquiries concerning reproduction outside those terms should be sent to NatCen Social Research.
NatCen Social Research35 Northampton SquareLondonEC1V 0AX
ISBN 978-1-907236-33-4

British Social Attitudes 31 | Contents
NatCen Social Research
i
Contents
Key findings ii
Democracy 1Critical consensus? Britain’s expectations and evaluations of democracySarah Butt and Rory Fitzgerald
Scotland 25Can Scotland and the rest of the UK get along?John Curtice
Independence referendum 42A question of identity, economics or equality?John Curtice
National identity 61Exploring BritishnessZsolt Kiss and Alison Park
Immigration 78A nation divided?Robert Ford and Anthony Heath
Benefits and the cost of living 95Pressures on the cost of living and attitudes to benefit claimingBen Baumberg
Technical details 123

British Social Attitudes 31 | Key findings
NatCen Social Research
ii
Key findingsIdentity, integration and inclusion have been at the forefront of public policy debates throughout 2014. The Scottish independence referendum, on-going rows about the implications of immigration, and the rise of the UK Independence Party have made us think more deeply about the UK’s boundaries, where decision making about its laws should lie and who should be allowed to come and live here. This summary considers what Britain feels about itself – its boundaries, its identity, and its inhabitants – and the clues this gives us about Britain and its future.
Becoming British?The threshold to being considered ‘British’ has got higher over time. Most people see Britishness as determined by a mix of factors, some which can be acquired over time and others which are largely determined early on in life.
A United Kingdom?Within the next few months Scotland will decide whether it should remain in or leave the United Kingdom. Public opinion across Great Britain will not raise insurmountable barriers to putting either outcome into practice.
ImmigrationA large majority would like to see immigration levels reduced, but this masks considerable diversity of opinion about the impact it has had on Britain’s economy and culture.
Almost everyone (95%) thinks that to be ‘truly British’ you have to speak English, up from 85% in 1995. 77% think a person has to have lived in Britain for most of his or her life, up from 71% in 1995.
Londoners and graduates are among the most likely to think immigration has a positive impact on Britain’s economy. 54% of Londoners take this view, compared with 28% elsewhere in Britain. So do 60% of graduates, compared with 17% of those with no qualifications.
86% of people in Scotland would like to be able to carry on watching the BBC after independence, while 82% of those in England and Wales think they ‘definitely’ or ‘probably’ should be allowed to do so.
77%71%
95%85%
1995 2013
LONDON
ELSEWHERE IN BRITAIN 28%
54%
86%

British Social Attitudes 31 | Key findings
NatCen Social Research
iii
Britain 2014
Identity, integration and inclusion have been at the forefront of public policy debates throughout 2014. The Scottish independence referendum, on-going rows about the implications of immigration, and the rise of the UK Independence Party on an anti-European Union (EU) ticket have made us think more deeply about the UK’s boundaries, where decision making about its laws should lie and who should be allowed to come and live here. Meanwhile, few weeks go by without discussion about whether and how Britain should ‘protect’ itself from the outside world, for example in relation to the role of foreign-owned firms in Britain’s energy market or the impact of foreign ownership on London’s housing market.
In a few years’ time the UK as it currently exists could look very different. A Yes vote in Scotland in September will see Scotland leave the UK by March 2016, according to the Scottish Government’s ideal timetable at least. And if the Conservative Party wins a majority at the 2015 General Election, an in-out referendum on the UK’s membership of the EU will follow by the end of 2017. A Yes at both referendums will mean a future Britain that looks very different to Britain today.
In this summary we pull together key strands from the six chapters included in the 31st British Social Attitudes report to consider what Britain feels about itself – its boundaries, its identity, and its inhabitants. These raise important questions; people’s social identities, especially their national identity (or identities), are often thought to matter for both political legitimacy and social cohesion. People’s willingness to accept the right of a government to govern depends on their feeling that it represents and symbolizes the ‘nation’ to which they feel a sense of belonging. Their willingness to share social risks, for example via a common form of welfare, depends on a shared sense that they belong to the same (imagined) community. And people’s willingness to accept the right of others to come and live within their country depends on the degree to which migrants are regarded as ‘us’ rather than ‘other’, opening up the question of what features people think matter when defining who they think belongs.
Being British?A shared sense of Britishness is often seen as the glue that helps keep the UK together. But it coexists with other ‘national’ identities; Scottish, English, Irish, Northern Irish and Welsh. In England (and outside the UK) the terms ‘English’ and ‘British’ are often seen as synonymous – leading to their being called a distinction without a difference (Cohen, 1995; Kumar, 2003). But there is some evidence that devolution elsewhere in the UK has sharpened people’s appreciation of these differences, and led to an increase in the proportion of people in England who choose to describe themselves as English (Curtice, 2013). In 1992, 31 per cent described themselves as “English” when asked to choose which national identity best described them, now 41 per cent do so (47 per cent describe themselves as British, down from 63 per cent in 1992). However, this shift took place in the late 1990s, during the advent of devolution elsewhere in the UK; since then there has been little change.
There is no doubt that a sense of being Scottish is more widespread and deeply held north of the border than are any feelings of Britishness. In 2013, only one in ten people say that they are either “British, not Scottish” or “More British than Scottish”. In contrast as many as a quarter (25 per cent) say they
In this summary we pull together key strands from the six chapters included in the 31st British Social Attitudes report to consider what Britain feels about itself – its boundaries, its identity, and its inhabitants

British Social Attitudes 31 | Key findings
NatCen Social Research
iv
are Scottish and not British at all. That leaves a majority (62 per cent) however who acknowledge some combination of both identities. For many then, their sense of being Scottish sits alongside a complementary sense of being British rather than in opposition to it.
So that is how people in England and Scotland would describe their own identity.[1] But what do they think matters when it comes to whether someone can be considered British? We first tackled this topic in 1995 by asking how important a range of different attributes were for a person being “truly British”. Now, as then, most people see Britishness as being determined by a mix of factors, some of which can be acquired over time, such as speaking English (seen as important by a near unanimous 95 per cent), respecting Britain’s laws and institutions or having British citizenship (the latter two both being chosen as important by 85 per cent). Others are largely determined early on in life and far harder to acquire (such as being born in Britain, chosen as important by 74 per cent). Earlier this year Sajid Javid MP, the UK’s first Asian secretary of state, was quoted as saying that migrants to the UK should learn English and respect Britain’s way of life; our findings suggest most see these as being fundamental aspects of being British.[2]
As our National identity chapter describes, a key finding is that the threshold to being considered British has got higher over time. The proportion who think being able to speak English is important has gone up by ten percentage points, from 85 per cent in 1995 to 95 percent now. And whereas in 1995, 71 per cent thought having lived one’s life in Britain was important; now 77 per cent think this matters. But despite Prime Minister David Cameron’s assertions that the UK is a “Christian country”,[3] being Christian is only seen as an important element of Britishness by a minority, and a shrinking one at that – down from 32 per cent in 1995 to 24 per cent now. This no doubt reflects the wider decline in religious belonging in the UK over the period (Park and Rhead, 2013).
Beliefs about immigrantsDiscussions about what it is to be British and immigration often go hand in hand. In our Immigration chapter we dig beneath the surface of public opposition to tease out the perceptions that people have of migrants and the impact they have on Britain. It shows that there is considerable diversity of opinion about the impact that immigration has had on Britain’s economy and culture, with the most economically and socially advantaged being far more positive than other groups. So, while 60 per cent of graduates think immigration has been good for Britain’s economy (overall 31 per cent think this), this is true of only 17 per cent of those with no qualifications. Echoing the recent divide between London and the rest of Britain when it came to support for the UK Independence Party in the elections to the European Parliament in May 2014, London also stands out in its views on immigration. Over half (54 per cent) of Londoners think immigration has been beneficial for Britain’s economy, nearly double the figure (28 per cent) found elsewhere in Britain.
Different sections of the population have very different mental pictures of migrants and the reasons they come to Britain. A quarter (24 per cent) put claiming benefits ahead of studying, working or asylum as the main attraction for new migrants, a view which is particularly strongly held among those who most disapprove of immigration. This perhaps helps explain the fact that 61 per cent think immigrants from the European Union should wait three years or more to be able to claim benefits – 83 per cent say they should wait for one year
95% think speaking English is important for being “truly British”

British Social Attitudes 31 | Key findings
NatCen Social Research
v
or more. In reality, a minimum earnings threshold came into force earlier this year which requires European migrants in the UK to show they are earning at least £149 a week for three months before they can access a range of benefits, demonstrating a considerable gap between public opinion and reality. Concern about access to benefits perhaps underpin the fact that, while in 2003 40 per cent thought legal immigrants should have the same rights as British citizens, just 27 per cent think the same now.
As our National identity chapter shows, there is a close link between people’s views about immigration and what they think matters when it comes to being “truly British”. Those who emphasise a mix of civic factors (like speaking English) and ethnic ones (like being born in Britain) are far more likely to oppose immigration than those who think only civic factors matter.
Issues such as immigration cause huge headaches for politicians, not least because party supporters are so divided on the issue. Any policy which satisfies those on one side of the debate will tend to infuriate those on the other. In the case of immigration, it is also evident that politicians and policy makers tend to be drawn heavily from the more socially advantaged and highly educated end of the spectrum, creating a potential for disconnect and distrust between a more liberal political class which accepts immigration and an electorate among whom many find it intensely threatening.
Political legitimacyPeople’s sense of pride in being British has fallen – from the 43 per cent in 2003 who said they were “very proud” to 35 per cent now (Young, 2014). This change has taken place across much of British society and it is only those who were the most fiercely proud in 2003, the over 65s and the least well educated, whose views remain unchanged.
Perhaps this is not surprising. After all, many of Britain’s most important institutions have been under pressure in recent times. As we reported last year (Lee and Young, 2013), public levels of trust in government have declined over the last 30 years. In 2013, a third (32 per cent) say that they “almost never” trust “British governments of any party to place the needs of the nation above the interests of their own political party”, three times as many as took this view in 1986 (11 per cent). At the same time, the proportion who trust government “just about always” or “most of the time” has more than halved (17 per cent in 2013, down from 38 per cent in 1986). Politics and politicians are not alone in having seen their reputations harmed. Banks and bankers have suffered even more, as has the press (Park et al., 2013).
Given this, how do people think that the UK should best be governed? As our Independence referendum chapter discusses, the decision Scotland is due to make in September 2014 will partly be about Scottish people’s sense of national identity. But the practical consequences of independence, and particularly the perceived economic consequences of leaving or staying in the UK, will also play an important role in people’s thinking when it comes to choosing whether to vote Yes or No. This suggests that whichever way Scotland eventually votes, the outcome should be interpreted with caution. The victors are likely to claim either that Scotland has shown its commitment to the future of the Union (by voting No), or has proven that it wants to govern itself just like any other nation does (by voting Yes). But the reality is likely to be rather more prosaic – that the outcome represents voters’ best judgment as to which way prosperity appears
The practical consequences of Scottish independence, and particularly the perceived economic consequences of leaving or staying in the UK, will also play an important role in people’s thinking when it comes to choosing whether to vote Yes or No

British Social Attitudes 31 | Key findings
NatCen Social Research
vi
to lie. Meanwhile, there is little appetite in England for it having devolution itself; only one in three would like either an English Parliament (19 per cent) or an assembly in each English region (15 per cent), and these figures are almost the same as they were as long ago as when the Scottish Parliament was first established in 1999 (Curtice, 2014).
The recent success of the UK Independence Party is a reminder of the considerable opposition to the EU that exists across much of the UK. As our National identity chapter shows, overall just one in four (21 per cent) think that Britain benefits from EU membership, while just six per cent think that the EU should have more power than the national governments of its member states. As with immigration, there is a close link between people’s views about the EU and what they think matters when it comes to being “truly British”. Those who emphasise a mix of civic factors (like speaking English) and ethnic ones (like being born in Britain) are far more likely to be Eurosceptics those who think only civic factors matter.
Our Democracy chapter considers how well people think the political system in Britain delivers on what they think matters most. People clearly have high expectations, with a broad consensus among the British public that democracy, in addition to guaranteeing free and fair competitive elections and protecting civil liberties, should also protect people against poverty and involve citizens in decision-making. But, when it comes to the extent to which the British political system delivers, a sizeable minority perceive there to be a democratic deficit. Almost one in five (18 per cent) think that it is extremely important in a democracy for the courts to treat everyone equally but think this does not happen sufficiently in Britain. And a quarter (24 per cent) are dissatisfied with how well the government engages with the public.
Although over a half (56 per cent) of people think that “the creation of the welfare state is one of Britain’s proudest achievements”, there has been a long-term decline in levels of support for benefit claiming. As our Welfare chapter shows, over half of the British public agree with the statement “around here, most unemployed people could find a job if they really wanted one” (54 per cent) and that “benefits for unemployed people are too high and discourage them from finding paid work” (57 per cent). Despite this, however, when told how much money someone living on a specific benefit would receive, many feel they do not provide enough to live on and would like to see more spending on particular types of claimant.
A future Britain
So what might the future hold? A crucial decision will take place on 18th September 2014, when Scotland votes on whether or not it should leave the United Kingdom. If Scotland votes No, there is little to suggest it will not be able to reach a constitutional agreement that is acceptable both north and south of the border. As our Scotland chapter shows, while it is true that public opinion in England would like to stop Scottish MPs from voting on English laws, most people in Scotland would not appear to mind this change very much either. Nor does Scotland’s share of public spending seem to be a point of serious contention between the two publics. A non-independent Scotland would, in principle, like to see its devolved institutions have more responsibility for taxation and welfare, but there is little sign that many in England and Wales would oppose this. In fact, there is actually a considerable lack of enthusiasm
24% are dissatisfied with how well the government engages with the public

British Social Attitudes 31 | Key findings
NatCen Social Research
vii
among the Scottish public to see greater devolution translate into major policy differences between Scotland and its neighbours. For instance, only 37 per cent in Scotland, and 28 per cent in England, think it would be OK if the value of the old age pension differed north and south of the border.
Even if Scotland does vote Yes, it will still need to work with the rest of the UK to agree the terms of its divorce and whether and how best to collaborate in the future. This appears perfectly possible. People in England and Wales are broadly happy for Scotland to keep the same King or Queen as them (65 per cent think this should be allowed) while only 13 per cent oppose the idea of Scots being allowed access to the BBC as now. No sign here that public opinion in England and Wales will be a barrier to continuing collaboration on these matters (about both of which the majority of Scots are in favour). But there is potential for disagreement when it comes to whether people in Scotland should be allowed to retain their existing British citizenship (as desired by the Scottish Government) while claiming a new Scottish one. This is not because the two publics take a different view on the subject but because both are apparently rather suspicious of allowing people to carry more than one passport. In England and Wales, a third (33 per cent) think that citizens of a newly independent Scotland should be able to have a British and a Scottish passport; in Scotland, just under a half (47 per cent) agree.
These findings suggest that, whatever the referendum result in September may be, public opinion across Great Britain will not raise insurmountable barriers to putting it into practice. What is harder to assess, however, is the likely direction of travel when it comes to some of the wider issues raised in this summary. This partly reflects the fact that changing attitudes often reflect a number of different pressures. One is the longer term and gradual change caused either by demographic shifts (such as the growing proportion of graduates or an ageing population) or the impact of generational differences (whereby younger generations have very different views, which change little as they get older, to the generations which preceded them). Were these sorts of pressure all that mattered, we might expect to see a future Britain that was more open about who it considered to be British and welcoming to those who seek to move here. But of course other factors shape public opinion too, including heated debates about issues such as immigration numbers and the relationship between the UK and the EU, as well as the impact of specific events such as 9/11, the Olympic Games in 2012 and, as we may perhaps find, the outcome of the independence referendum in Scotland this September. Events and debates like these are also likely to affect public attitudes towards identity, governance and belonging. Might a Yes vote in Scotland in September rekindle debates in England about how it should best be governed or spark further change in the way in which the English think about their own national identity? How will attitudes to immigration change, given the pressure on other parties caused by the UK Independence Party’s recent success? And what impact will these and other events have on what people think matters when it comes to being British? We look forward to returning to these and other questions in future editions of this report.
People in England and Wales are broadly happy for Scotland to keep the same King or Queen as them

British Social Attitudes 31 | Key findings
NatCen Social Research
viii
Notes 1. Unfortunately it is not possible to include analysis of national identity in Wales
because surveys using a comparable methodology have not been conducted there since 2007. For information on the surveys that have been conducted since then and the trends in respect of national identity and constitutional preference they suggest have occurred see Curtice (2013), and Wyn Jones and Scully (2012).
2. See www.bbc.co.uk/news/uk-politics-27459468.
3. See www.gov.uk/government/speeches/easter-reception-at-downing-street-2014.
ReferencesCohen, R. (1995), ‘Fuzzy frontiers of identity: the British case’, Social Identities, 1: 35–62
Curtice, J. (2013), Future Identities: Changing Identities in the UK – the next 10 years, London: Government Office for Science (Foresight Project on Future Identities), available at: www.gov.uk/government/publications/national-identity-and-constitutional-change
Curtice, J. (2014), Does England want Scotland to leave or stay?, NatCen Social Research: London
Curtice, J., Devine, P. and Ormston, R. (2013), ‘Identities and constitutional preferences across the UK’, in Park., A., Bryson, C., Clery, E., Curtice, J. and Phillips, M. (eds.), British Social Attitudes: the 30th Report, London: NatCen
Kumar, K. (2003), The Making of English National Identity, Cambridge: Cambridge University Press
Lee, L. and Young, P. (2013), ‘A disengaged Britain? Political interest and participation over 30 years’, in Park., A., Bryson, C., Clery, E., Curtice, J. and Phillips, M. (eds.), British Social Attitudes: the 30th Report, London: NatCen
Young, P. (2014), A matter of pride, NatCen Social Research, available at: www.natcen.ac.uk/blog/a-matter-of-pride
Park., A., Bryson, C., Clery, E., Curtice, J. and Phillips, M. (2013), ‘Key findings’, in Park., A., Bryson, C., Clery, E., Curtice, J. and Phillips, M. (eds.), British Social Attitudes: the 30th Report, London: NatCen
Park, A. and Rhead, R. (2013), ‘Changing attitudes towards sex, marriage and personal relationships’, in Park., A., Bryson, C., Clery, E., Curtice, J. and Phillips, M. (eds.), British Social Attitudes: the 30th Report, London: NatCen
Wyn Jones, R. and Scully, R. (2012), Wales Says Yes: Devolution and the 2011 Referendum, Cardiff: University of Wales Press
British Social Attitudes 31 | Table and figure conventions
NatCen Social Research
ix
Table and figure conventions
1. Data in the tables are from the 2013 British Social Attitudes survey unless otherwise indicated.
2. Tables are percentaged as indicated by the percentage signs.
3. In tables, ‘*’ indicates less than 0.5 per cent but greater than zero, and ‘–’ indicates zero. Unless otherwise stated.
4. Percentages equal to or greater than 0.5 have been rounded up (e.g. 0.5 per cent = one per cent; 36.5 per cent = 37 per cent). Unless otherwise stated.
5. In many tables the proportions of respondents answering “Don’t know” or not giving an answer are not shown. This, together with the effects of rounding and weighting, means that percentages will not always add up to 100 per cent.
6. The self-completion questionnaire was not completed by all respondents to the main questionnaire (see Technical details). Percentage responses to the self-completion questionnaire are based on all those who completed it.
7. The bases shown in the tables (the number of respondents who answered the question) are printed in small italics. Both the weighted and unweighted bases are given.
8. In time series line charts, survey readings are indicated by data markers. While the line between data markers indicates an overall pattern, where there is no data marker the position of the line cannot be taken as an accurate reading for that year.

British Social Attitudes 31 | Contributors
NatCen Social Research
x
Contributors
Ben Baumberg Lecturer in Sociology and Social Policy at the University of Kent and the Centrefor Analysis of Social Exclusion at the London School of Economics
Caroline Bryson Partner of Bryson Purdon Social Research (BPSR)
Sarah Butt European Social Survey Research Fellow at City University London
John Curtice Professor of Politics at the University of Strathclyde and Research Consultant atNatCen Social Research
Rory Fitzgerald Director of the European Social Survey at City University London
Robert Ford Senior Lecturer in Politics at the University of Manchester
Anthony Heath Professor of Sociology and Emeritus Fellow at Nuffield College, University of Oxford and Professor of Sociology at the University of Manchester
Zsolt Kiss Resarch Director at NatCen Social Research
Alison Park Research Group Director at NatCen Social Research and Co-Director of theBritish Social Attitudes survey series

British Social Attitudes 31 | Acknowledgements
NatCen Social Research
xi
Acknowledgements
British Social Attitudes could not take place without its many generous funders. A number of government departments have regularly funded modules of interest to them, while respecting the independence of the study. In 2013 we gratefully acknowledge the support of the Department for Work and Pensions, the Department for Transport, the Department for Communities and Local Government, the Government Equalities Office and the Department for Business, Innovation and Skills.
Thanks are also due to the King’s Fund, the Economic and Social Research Council (ESRC), Unbound Philanthropy, the Trust for London, the Joseph Rowntree Foundation, the Joseph Rowntree Charitable Trust, the Paul Hamlyn Foundation and the Diana, Princess of Wales Memorial Fund.
The ESRC continued to support the participation of Britain in the International Social Survey Programme (ISSP), a collaboration whereby surveys in over 40 countries administer an identical module of questions in order to facilitate comparative research. Some of the results are described in our National identity chapter.
We are also grateful to Professor Richard Topf of London Metropolitan University for all his work in creating and maintaining access to an easy to use website that provides a fully searchable database of all the questions that have ever been carried on a British Social Attitudes survey, together with details of the pattern of responses to every question. This site provides an invaluable resource for those who want to know more than can be found in this report. It is located at www.britsocat.com.
The British Social Attitudes survey is a team effort. The report editors could not do their job without the invaluable editorial support provided by the BSA senior researcher, Ian Simpson. The survey is heavily dependent too on staff who organise and monitor fieldwork and compile and distribute the survey’s extensive documentation, for which we would pay particular thanks to Emma Fenn and her colleagues in NatCen’s administrative office in Brentwood. Thanks are also due to the fieldwork controllers, area managers and field interviewers who are responsible for all the interviewing, and without whose efforts the survey would not happen at all. We are also grateful to Sue Corbett in our computing department who expertly translates our questions into a computer assisted questionnaire, and to Roger Stafford who has the unenviable task of editing, checking and documenting the data. Many thanks are also due to Soapbox who worked with us on producing the report.
Finally, we must praise all the people who anonymously gave up their time to take part in one of our surveys over the last thirty years, not least those who participated in 2013. They are the cornerstone of this enterprise. We hope that some of them might come across this report and read about themselves and the story they tell of modern Britain with interest.

British Social Attitudes 31 | Democracy
NatCen Social Research
1
DemocracyCritical consensus? Britain’s expectations and evaluations of democracySurveys of public opinion frequently show that the British public think it is important to live in a democracy and are agreed that, although it may have its problems, democracy is better than any other form of government. But what does this actually mean in practice? Is there a consensus about what living in a democracy should involve? How far do people think the political system in Britain currently delivers what they expect from a democracy?
High expectations People expect a lot from democracy. There is broad consensus among the British public that democracy, in addition to guaranteeing free and fair competitive elections and protecting civil liberties, should protect people against poverty and involve citizens in decision-making.
Democratic deficit A sizeable minority of people think that the current political system fails to deliver what they expect from democracy i.e. they perceive there to be a democratic deficit in Britain.
A quarter of people (24%) are dissatisfied with how well the government engages with the public, believing it to be extremely important that the government explains its decisions to voters but feeling that this does not happen in Britain.
People also have concerns about key democratic institutions such as the judiciary; almost one in five people (18%) think that it is extremely important in a democracy for the courts to treat everyone equally but feel that this does not happen in Britain.
A majority of people – 58% – think that it is extremely important for democracy in general that the government protects all citizens against poverty, rating this at least 9 out of 10.
Among the things people consider most important in a democracy are that the courts treat everyone equally (average importance rating of 8.9 out of 10), that national elections are free and fair (8.8 out of 10) and that the government explains its decisions to voters (8.7 out of 10).
18%24%
8.9/10 8.8/10 8.7/10 58%

British Social Attitudes 31 | Democracy
NatCen Social Research
2
Introduction
British national identity is commonly seen, by politicians and the public alike, as being synonymous with democracy and democratic values. Echoing earlier speeches on Britishness made by Tony Blair and Gordon Brown, in 2011 David Cameron addressed the need for Britain to develop a clear sense of shared national identity, and listed democracy and the rule of law as two of the key values that should be part of this shared identity.[1] As the National Identity chapter, by Zsolt Kiss and Alison Park, describes most people (85 per cent) think that having respect for Britain’s political institutions and laws is very or fairly important for being truly British. People are more likely to consider this as being important than having been born in Britain (74 per cent) and much more likely to consider it as being important than having British ancestry (51 per cent).
But what do people actually mean when they refer to Britain as a democracy or say that it is important for its citizens to adhere to democratic values? To what extent do people have a shared vision of the essential features of a democratic system or agree on the extent to which these features are currently being realised in Britain?
An appreciation of the public’s understanding and evaluations of democracy is important not only in order to understand British identity but also to ensure the continued health and vitality of the political system itself. Unless people care about democracy and are committed to democratic values, these values may come under strain, especially in times of war or in the face of economic, environmental or other pressures (Coggan, 2013). If people have high expectations of democracy but feel that the current system fails to live up to these expectations, the perceived ‘democratic deficit’ may undermine the legitimacy of the system and erode public support. Even in established democracies such as Britain continued dissatisfaction with how the process functions may alienate people from the political process, posing a threat to the representativeness of democracy as well as undermining the belief in democracy itself (Stoker, 2006; Birdwell et al., 2013).
The European Social Survey provides a unique opportunity to understand more about what it is that the public understands by and wants from democracy.[2] Whereas previous research on public attitudes to democracy has largely been restricted to asking people about their commitment to or evaluations of democracy in general, the 2012/13 European Social Survey contains a substantial battery of questions which ask respondents for their attitudes towards specific aspects of the democratic system including its procedures, institutions and outcomes (Kriesi et al., 2012).
In this chapter we use European Social Survey data to try to isolate exactly what it is about living in a democracy that people in Britain consider to be important. We examine the depth and breadth of their commitment to different aspects of democracy, and the extent to which there is consensus across different groups in society. The chapter also examines the extent to which people believe that the features they consider to be important in a democracy apply in Britain today, and thus whether or not there is a perceived ‘democratic deficit’ among the British public. Finally, we consider the potential consequences of any perceived deficit for future political engagement. Is it the case that dissatisfaction with democratic performance is leading people to become disillusioned with and disengage from politics? Or, as Pippa Norris has argued, is the democratic deficit part of a healthy democracy in which “critical citizens” continue to engage with and challenge the political system to improve (Norris, 1999; 2011)?
An appreciation of the public’s understanding and evaluations of democracy is important not only in order to understand British identity but also to ensure the continued health and vitality of the political system itself
Authors
Sarah Butt and Rory FitzgeraldSarah Butt is a European Social Survey Research Fellow at City University London. Rory Fitzgerald is the Director of the European Social Survey at City University London
British Social Attitudes 31 | Democracy
NatCen Social Research
3
Answers to these questions may point to key areas on which policy makers seeking to maintain confidence in British democracy and re-engage with a disillusioned electorate in the run up to the 2015 general election should focus their attention. They are also pertinent to current discussions about the future of British democracy including the debate surrounding Scottish independence and the future of Britain in Europe, both issues that will or are likely to be decided by referendum.
What do British people think of democracy?
The prevailing wisdom regarding public attitudes to democracy is that the public are committed to the ideal of democracy and consider it important to live in a democracy, even though they may be dissatisfied with the way democracy works in practice (Dalton, 2004; Norris, 2011). The 2008 European Values Study found that 88 per cent of people in Britain agreed that “A democracy may have problems but it’s better than any other form of government”.[3] European Social Survey data support this picture. Respondents were asked to respond to the following questions, each time using an 11-point scale from 0 to 10, shown to them on a card:
How important is it for you to live in a country that is governed democratically? (0 was labelled ‘not at all important’ and 10 as ‘extremely important’)
How democratic do you think Britain is overall? (0 was labelled ‘not at all democratic’ and 10 as ‘completely democratic’)
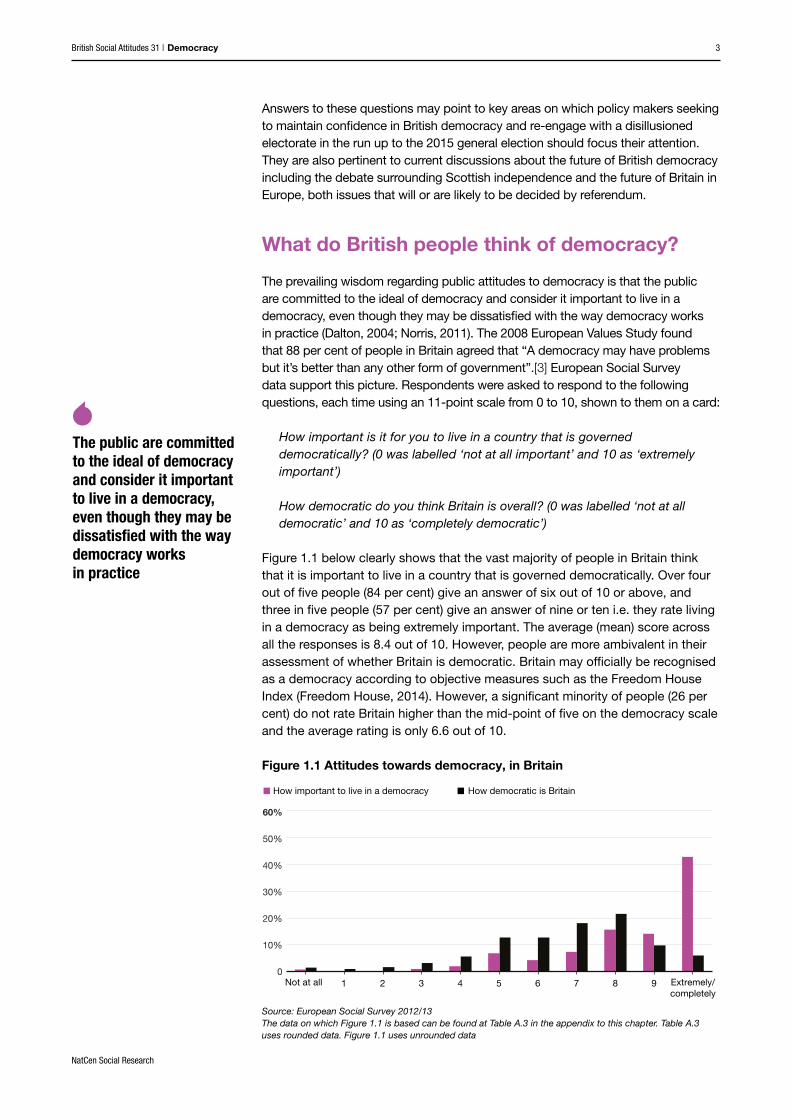
Figure 1.1 below clearly shows that the vast majority of people in Britain think that it is important to live in a country that is governed democratically. Over four out of five people (84 per cent) give an answer of six out of 10 or above, and three in five people (57 per cent) give an answer of nine or ten i.e. they rate living in a democracy as being extremely important. The average (mean) score across all the responses is 8.4 out of 10. However, people are more ambivalent in their assessment of whether Britain is democratic. Britain may officially be recognised as a democracy according to objective measures such as the Freedom House Index (Freedom House, 2014). However, a significant minority of people (26 per cent) do not rate Britain higher than the mid-point of five on the democracy scale and the average rating is only 6.6 out of 10.
Figure 1.1 Attitudes towards democracy, in Britain
Source: European Social Survey 2012/13The data on which Figure 1.1 is based can be found at Table A.3 in the appendix to this chapter. Table A.3 uses rounded data. Figure 1.1 uses unrounded data
The public are committed to the ideal of democracy and consider it important to live in a democracy, even though they may be dissatisfied with the way democracy works in practice
1 2 3 4 5 6 7 8 9 Extremely/completely
Not at all0
10%
20%
30%
40%
60%
50%
How important to live in a democracy How democratic is Britain

British Social Attitudes 31 | Democracy
NatCen Social Research
4
This picture is mirrored across the European countries for which European Social Survey data are available. In all countries shown in Table 1.1 – with the important exception of Russia – people living in each country consider it very important to live in a democracy, assigning an average score greater than seven out of 10.[4] However, in many cases, people provide more lukewarm evaluations of how democratic their country is. The importance attached to living in a democracy – and evaluations of the current system – are highest in Scandinavia. The mismatch between how important it is to live in a democracy and how democratic the country actually is is greatest in some of the newer democracies of central and eastern Europe such as Slovenia and Bulgaria. Britain is somewhere in the middle, rating democracy lower on average than Scandinavia and Germany but higher than much of southern and eastern Europe.
Table 1.1 Attitudes towards democracy, by country (mean score out of 10)
How important to live in
democracy? (0–10)
How democratic is country?
(0–10)
Difference (important
– evaluation)
Min weighted
base
Min unweighted
base
Cyprus 9.5 6.0 3.5 1086 1085
Denmark 9.4 8.2 1.3 1625 1625
Sweden 9.3 7.8 1.6 1822 1822
Norway 9.3 7.7 1.6 1610 1610
Iceland 9.3 6.8 2.5 732 733
Israel 9.2 7.0 2.3 2474 2473
Switzerland 9.0 8.1 1.0 1476 1476
Germany 9.0 7.2 1.9 2929 2932
Finland 8.9 7.4 1.5 2152 2152
Kosovo 8.8 4.8 4.0 1233 1217
Hungary 8.5 5.3 3.3 1912 1912
Bulgaria 8.5 4.0 4.4 2156 2150
Netherlands 8.4 6.9 1.5 1805 1800
Spain 8.4 5.5 2.9 1829 1829
Ireland 8.4 6.6 1.8 2525 2525
Britain 8.4 6.6 1.8 2066 2070
Belgium 8.2 6.6 1.6 1860 1860
Slovenia 8.2 4.6 3.5 1218 1217
Poland 8.2 5.9 2.3 1819 1822
Slovakia 8.2 5.7 2.5 1828 1823
Portugal 8.1 5.9 2.2 2084 2083
Estonia 8.0 5.7 2.3 2291 2291
Czech Republic 7.9 6.2 1.7 1949 1950
Russia 6.6 4.4 2.2 2319 2320
Source: European Social Survey 2012/13
Examining responses to these two broad questions however can tell us only so much about public attitudes to democracy. It is relatively easy for people to give the socially desirable positive response to a one-off survey question asking whether they consider it important to live in a democracy. But what does this tell us about the extent of their commitment to democracy in practice? Just because people say that it is important to them to live in a democracy, it does not necessarily guarantee their acceptance of liberal democratic values (Welzel
Britain is somewhere in the middle, rating democracy lower on average than Scandinavia and Germany but higher than much of southern and eastern Europe

British Social Attitudes 31 | Democracy
NatCen Social Research
5
and Klingemann, 2007) or provide an insight into what they expect their role as citizens in a democracy to be (Webb, 2013). Similarly, knowing that people are dissatisfied with the political system is not particularly informative in the absence of information about why they are dissatisfied or how they think the situation might be improved. The remainder of this chapter provides a more detailed look at attitudes to democracy in Britain.
What are people’s specific expectations of democracy? Democracy can mean different things to different people (Dahl, 1998; Diamond, 2003). It is generally accepted that free and fair competitive elections which can be used to hold the government accountable are an essential feature of any democratic system (Schumpeter, 1976). In addition, established European democracies are assumed to be ‘liberal’ democracies based on the rule of law and which guarantee certain rights and freedoms for their citizens such as free expression and the protection of minority groups (Dalton et al., 2007). However, there are other aspects of democracy over which there is more debate. For example, to what extent should democracy be required to achieve certain material outcomes for its citizens? People also hold differing opinions over the public’s role in a representative democracy – i.e. how far policy should be responsive to public opinion and/or whether the public should have a say in important political decisions – and the extent to which there should be a more participatory model of direct democracy (Webb, 2013).
We can use the European Social Survey to identify how far the British public shares a particular liberal democratic view of democracy. We can also assess the extent of public support for other potential features of democracy including the achievement of certain social outcomes or the wider involvement of members of the public in political decision-making. Respondents were asked to say how important they thought different things were “for democracy in general” (original emphasis). (They were told that they would be asked later about their views on how democracy was working in Britain.)[5] They answered using an 11-point scale, where 0 signified that they thought something was “not at all important for democracy in general” and 10 signified they thought it was “extremely important for democracy in general”.
Table 1.2 summarises people’s expectations of what democracy should deliver. In the first column, we show the average (mean) importance assigned to each aspect of democracy (from a maximum score of 10). The second column shows the variance in these averages. This provides a measure of how much agreement there is among the population as to whether or not something is important for democracy: the lower the variance the greater the degree of consensus. The third column shows the percentage of people who consider each aspect as being extremely important for democracy i.e. rate it nine or ten on a 0 to 10 scale. The items in the table have been organised into four groups according to whether they are associated primarily with the electoral component of democracy, principles of liberal democracy, outcomes associated with social democracy or features of a participatory democracy.[6]
Knowing that people are dissatisfied with the political system is not particularly informative in the absence of information about why they are dissatisfied

British Social Attitudes 31 | Democracy
NatCen Social Research
6
Table 1.2 Expectations of democracy, in Britain[7]
How important is it for democracy in general that …
Mean score (0–10)
Variance in mean score
% saying extremely important
(i.e. scoring 9 or 10)
Electoral democracy
… national elections are free and fair 8.8 3.1 65
… governing parties are punished in elections when they have done a bad job 8.2 4.2 49
… opposition parties are free to criticise the government 8.1 4.0 47
… different political parties offer clear alternatives to one another 7.6 4.6 34
Liberal democracy
… the courts treat everyone the same 8.9 3.2 71
… the courts able to stop the government acting beyond its authority 8.6 3.7 58
… the rights of minority groups are protected 7.9 4.5 44
… the media provide citizens with reliable information to judge the government 8.2 4.8 53
… the media are free to criticise the government 7.8 5.0 44
Social democracy
… the government protects all citizens against poverty 8.4 4.4 58
… the government takes measures to reduce differences in income levels 7.4 5.8 36
Participatory democracy
… the government explains its decisions to voters 8.7 3.6 64
… citizens have the final say on the most important issues by referendum 8.1 4.3 47
Source: European Social Survey 2012/13
It is clear that the British public demands a lot of different things from democracy. All of the aspects of democracy asked about are considered important and given an average rating of between seven and nine out of ten on the original 11-point scale. People attach importance to essential procedural features of democracy such as national elections which are free and fair (average importance rating 8.8) as well as equal treatment by the courts (8.9) and legal constraints on government authority (8.6).[8] However, there is also widespread support for the idea that any democracy has a commitment to achieve certain outcomes for its citizens; including the government protecting all its citizens against poverty (an average score of 8.4). People also strongly believe that they should be involved in the political process; with people considering it important that the government explains its decisions to voters (average score 8.7) and that citizens should have the final say in important decisions via referendums (8.1). This evidence is consistent with previous analysis of British Social Attitudes data which found strong support for constitutional reforms which would provide for more direct democracy (Curtice and Seyd, 2012).
All of the aspects of democracy asked about are considered important and given an average rating of between seven and nine out of ten on the original 11-point scale

British Social Attitudes 31 | Democracy
NatCen Social Research
7
The variance levels in the second column of Table 1.2 show that there is most public consensus around the importance of key procedural aspects of democracy such as there being free and fair elections (variance = 3.1) or the courts treating everyone equally (3.2). There is also widespread support for the importance of governments explaining decisions to voters (3.6). Opinion is more divided on other things including whether the government should take measures to reduce differences in income levels (variance = 5.8) reflecting ongoing political divisions between those on the left and the right regarding the importance of redistribution as a means of promoting prosperity.
Table 1.2 also indicates that, while the public generally recognise that liberal democratic ideals such as freedom of speech are important for democracy; absolute commitment to these ideals is not universal. For example, fewer than half of people (44 per cent) think that it is extremely important for democracy that the media is free to criticise the government or that the rights of minorities are protected. This may in part reflect the fact that many people in Britain today take these basic rights for granted. However, in the absence of strong public support, such values remain vulnerable to being undermined even in an established democracy such as Britain.
How do people vary in their expectations of democracy? Having considered what the British public as a whole expect from democracy, we now examine whether and how the strength of people’s commitment to democracy and the nature of their priorities vary across different groups in society. Which groups have particularly high expectations of democracy? Are there certain groups with a weaker commitment to democracy which might place them at risk of disengaging from the democratic process?
What role does education play? There has been a trend in many established democracies, including Britain, towards growing dissatisfaction with democracy (Dalton, 2004; Norris, 2011). Dalton (2004) argues that one reason for this trend may be that an increasingly educated and well-informed public now has higher expectations of what democracy can and should entail. These rising expectations have led to the emergence of “critical citizens” (Norris, 1999) whose dissatisfaction with the political system does not reflect disillusionment with democracy per se but rather a desire to reform the current political system so that it becomes even more democratic.
Table 1.3 provides evidence that the more educated people are, the higher their expectations of democracy tend to be. Reporting on the same issues as in Table 1.2, Table 1.3 shows the average importance score (out of 10) of people with no qualifications; those with GCSE or A level qualifications (or equivalent); and those educated to degree level or above. Most aspects of democracy asked about in the European Social Survey are rated as being more important by those educated to degree level or above.[9] There are three exceptions to this. The expectation that governments should take measures to reduce differences in income levels is seen as being more important by those educated below degree level. Also, citizens having the final say in referendums and punishing governing parties in elections when they have done a bad job both receive similarly strong support across all educational groups. The expectations gap between the more
The more educated people are, the higher their expectations of democracy tend to be

British Social Attitudes 31 | Democracy
NatCen Social Research
8
and less educated is largest with respect to the importance attached to the broad principles underpinning liberal democracy such as freedom of expression and equality before the law.
However, while expectations of democracy are generally significantly lower among those with no qualifications compared to those educated to degree level this is not to say that those with no qualifications do not have high or wide-ranging expectations of democracy. Even among the least educated group, all aspects of democracy are rated important with scores, on average, of at least seven on the importance scale. Furthermore, ordering the different elements of democracy based on the average score assigned reveals similar rankings across the different educational groups: all three groups, for instance, rate free and fair elections, courts treating everyone equally and government explaining its decisions to voters as among the most important things for democracy.
Table 1.3 Expectations of democracy, in Britain, by highest level of education
No qualifications
GCSE or A level Degree
Diff degree vs. no quals
How important is it for democracy in general that …
Mean importance
(0–10)
Mean importance
(0–10)
Mean importance
(0–10)
Electoral democracy
… national elections are free and fair 8.1 8.6 9.5 1.34
… governing parties are punished in elections when they have done a bad job 8.2 8.2 8.2 0.04
… opposition parties are free to criticise the government 7.8 7.8 8.8 1.05
… different political parties offer clear alternatives to one another 7.1 7.5 8.0 0.88
Liberal democracy
… the courts treat everyone the same 8.3 8.9 9.4 1.05
… the courts able to stop the government acting beyond its authority 8.0 8.6 8.9 0.92
… the rights of minority groups are protected 7.2 7.8 8.8 1.54
… the media provide citizens with reliable information to judge the government 7.6 8.0 8.9 1.25
… the media are free to criticise the government 7.5 7.6 8.5 1.05
Social democracy
… the government protects all citizens against poverty 8.1 8.4 8.6 0.52
… the government takes measures to reduce differences in income levels 7.4 7.6 7.0 -0.40
Participatory democracy
… the government explains its decisions to voters 8.1 8.7 9.0 0.84
… citizens have the final say on the most important issues by referendum 7.8 8.2 7.9 0.07
Min weighted base 390 847 424Min unweighted base 437 812 415
Source: European Social Survey 2012/13Items where figures are shown in bold are ones where the difference in expectations between those with a degree and those with no formal educational qualifications is statistically significant at the 95% level

British Social Attitudes 31 | Democracy
NatCen Social Research
9
Are young people committed to democracy? Levels of political engagement are particularly low among young people. Turnout among 18 to 24 year olds in the 2010 general election was only 45 per cent compared with 69 per cent among the population as a whole (Lee and Young, 2013). Young people are less likely to be interested in politics or feel a duty to vote (Butt and Curtice, 2010). Is this political apathy also reflected in a weaker commitment to democracy among young people?
Table 1.4 shows that young people under 25 attach less importance to some aspects of democracy compared with older age groups. For example, they attach less importance to opposition parties or the media being free to criticise the government or to the media providing citizens with reliable information. On the basis of data collected at just one point in time it is impossible to know whether this represents a generational shift in attitudes, with young people today perhaps being more inclined to take democratic rights and freedoms for granted compared with previous generations, or whether becoming politically aware and recognising the value of democracy is simply something that comes with age. Previous studies of political attitudes among young people suggest that both factors may be at work (Lee and Young, 2013).
It is important, however, not to overstate the extent of young people’s apathy towards democracy. They generally have relatively high expectations of democracy, rating all items seven or higher on the importance scale, and their expectations are similar in several respects to those of other age groups. For example, like the rest of the population, young people expect citizens to be involved in the democratic process, seeing it as very important that governments explain their decisions to voters and that citizens have the final say on important issues via referendums.[10]
Young people under 25 attach less importance to some aspects of democracy compared with older age groups

British Social Attitudes 31 | Democracy
NatCen Social Research
10
Table 1.4 Expectations of democracy, in Britain, by age
Aged <25 Aged 25+Diff
<25 vs. 25+
How important is it for democracy in general that …
Mean importance
(0–10)
Mean importance
(0–10)
Electoral democracy
… national elections are free and fair 8.5 8.8 -0.33
… governing parties are punished in elections when they have done a bad job 7.6 8.3 -0.61
… opposition parties are free to criticise the government 7.3 8.2 -0.90
… different political parties offer clear alternatives to one another 7.5 7.6 -0.06
Liberal democracy
… the courts treat everyone the same 8.6 9.0 -0.34
… the courts able to stop the government acting beyond its authority 8.3 8.6 -0.32
… the rights of minority groups are protected 7.8 7.9 -0.09
… the media provide citizens with reliable information to judge the government 7.6 8.2 -0.58
… the media are free to criticise the government 7.1 7.9 -0.85
Social democracy
… the government protects all citizens against poverty 8.2 8.5 -0.29
… the government takes measures to reduce differences in income levels 7.1 7.5 -0.34
Participatory democracy
… the government explains its decisions to voters 8.5 8.7 -0.24
… citizens have the final say on the most important issues by referendum 8.0 8.1 -0.16
Min weighted base 247 1777Min unweighted base 172 1855
Source: European Social Survey 2012/13Items where figures are shown in bold are ones where the difference in expectations between those under 25 and those 25 and above is statistically significant at the 95% level
Is there a left-right divide in expectations? Given that policy makers have the potential to shape the nature of democracy through constitutional reform it is worth considering the extent to which there is consensus across the political spectrum regarding the essential attributes of democracy, or whether people on different sides of the political divide prioritise different things. Consistent with the strong association between left-wing ideology and support for redistribution and welfare provision (Jacoby, 1994), we might expect those on the left to attach more importance to social justice. People placing themselves on the right of the political spectrum have traditionally held more authoritarian views and tended to be more socially conservative (Kitschelt, 1994). This may mean that they attach less importance to people having the freedom to challenge authority or the protection of minority rights.
British Social Attitudes 31 | Democracy
NatCen Social Research
11
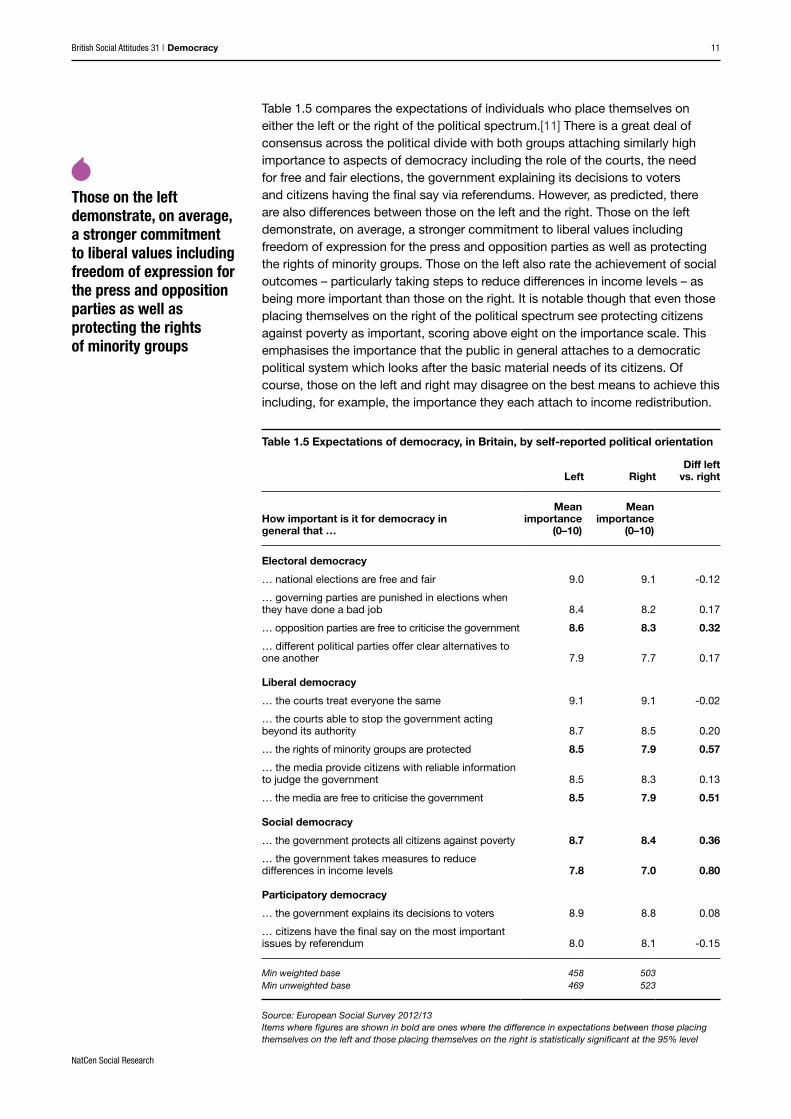
Table 1.5 compares the expectations of individuals who place themselves on either the left or the right of the political spectrum.[11] There is a great deal of consensus across the political divide with both groups attaching similarly high importance to aspects of democracy including the role of the courts, the need for free and fair elections, the government explaining its decisions to voters and citizens having the final say via referendums. However, as predicted, there are also differences between those on the left and the right. Those on the left demonstrate, on average, a stronger commitment to liberal values including freedom of expression for the press and opposition parties as well as protecting the rights of minority groups. Those on the left also rate the achievement of social outcomes – particularly taking steps to reduce differences in income levels – as being more important than those on the right. It is notable though that even those placing themselves on the right of the political spectrum see protecting citizens against poverty as important, scoring above eight on the importance scale. This emphasises the importance that the public in general attaches to a democratic political system which looks after the basic material needs of its citizens. Of course, those on the left and right may disagree on the best means to achieve this including, for example, the importance they each attach to income redistribution.
Table 1.5 Expectations of democracy, in Britain, by self-reported political orientation
Left RightDiff left
vs. right
How important is it for democracy in general that …
Mean importance
(0–10)
Mean importance
(0–10)
Electoral democracy
… national elections are free and fair 9.0 9.1 -0.12
… governing parties are punished in elections when they have done a bad job 8.4 8.2 0.17
… opposition parties are free to criticise the government 8.6 8.3 0.32
… different political parties offer clear alternatives to one another 7.9 7.7 0.17
Liberal democracy
… the courts treat everyone the same 9.1 9.1 -0.02
… the courts able to stop the government acting beyond its authority 8.7 8.5 0.20
… the rights of minority groups are protected 8.5 7.9 0.57
… the media provide citizens with reliable information to judge the government 8.5 8.3 0.13
… the media are free to criticise the government 8.5 7.9 0.51
Social democracy
… the government protects all citizens against poverty 8.7 8.4 0.36
… the government takes measures to reduce differences in income levels 7.8 7.0 0.80
Participatory democracy
… the government explains its decisions to voters 8.9 8.8 0.08
… citizens have the final say on the most important issues by referendum 8.0 8.1 -0.15
Min weighted base 458 503Min unweighted base 469 523
Source: European Social Survey 2012/13Items where figures are shown in bold are ones where the difference in expectations between those placing themselves on the left and those placing themselves on the right is statistically significant at the 95% level
Those on the left demonstrate, on average, a stronger commitment to liberal values including freedom of expression for the press and opposition parties as well as protecting the rights of minority groups

British Social Attitudes 31 | Democracy
NatCen Social Research
12
Does the current political system meet people’s expectations?
As well as asking respondents how important they consider different things to be for democracy in general, the European Social Survey then goes on to ask respondents to rate how they think democracy is working in Britain today. Respondents are asked to indicate the extent to which they think each of the things listed in Table 1.2 actually applies in Britain.[12] They answered using an 11-pont scale with 0 signifying that they think it does not apply to Britain at all and 10 indicating that the respondent thinks it applies completely.[13]
Table 1.6 summarises people’s evaluations of democracy in Britain. In the first column, we show the average (mean) evaluation given to each aspect of democracy (from a maximum score of 10). The second column shows the variance in these averages. The third column shows the percentage of people who consider that each aspect of democracy does not apply in Britain i.e. rate it less than five on a 0 to 10 scale.
There is a clear consensus that some key features of democracy do apply in Britain – for example that elections in Britain are free and fair (average evaluation = 8.2) and that opposition parties and the media are free to criticize the government (7.8 and 7.7). However, evaluations of other aspects of democracy are decidedly more mixed. This is particularly true as regards people’s evaluations of how far democracy in Britain serves to involve its citizens in decision-making or ensure the material well-being of its citizens. Over one in three people (36 per cent) believe that the government in Britain does not explain its decisions to voters – rating this aspect below the mid-point of five on the evaluation scale and nearly two in five people (38 per cent) believe that the government does not protect its citizens from poverty.
36%believe that the government in Britain does not explain its decisions to voters

British Social Attitudes 31 | Democracy
NatCen Social Research
13
Table 1.6 Evaluations of democracy, in Britain[14]
To what extent does it apply in Britain that …
Mean score (0–10)
Variance in mean
score
% saying does not apply
(i.e. scoring <5)
Electoral democracy
… national elections are free and fair 8.2 3.8 4
… governing parties are punished in elections when they have done a bad job 6.1 7.7 25
… opposition parties are free to criticise the government 7.8 4.3 6
… different political parties offer clear alternatives to one another 5.9 6.0 23
Liberal democracy
… the courts treat everyone the same 6.3 8.0 25
… the rights of minority groups are protected 6.8 4.6 12
… the media provide citizens with reliable information to judge the government 5.9 6.9 27
… the media are free to criticise the government 7.7 4.8 8
Social democracy
… the government protects all citizens against poverty 5.3 8.0 38
… the government takes measures to reduce differences in income levels 4.9 6.9 39
Participatory democracy
… the government explains its decisions to voters 5.3 7.3 36
… citizens have the final say on the most important issues by referendum 5.5 9.4 33
Source: European Social Survey 2012/13
By comparing people’s evaluations of democracy in Britain with their expectations regarding democracy in general, we can see how far the performance of the current political system matches – or fails to match up to – what the public think democracy should deliver. To what extent do people perceive a democratic deficit in Britain i.e. do people feel that the current system is failing to live up to their high expectations? Is there any evidence of a perceived democratic surplus i.e. do people feel that some democratic rights and freedoms have been extended too far and should be scaled back?
Table 1.7 presents a measure of the perceived democratic deficit or surplus on each item. It measures the difference in the extent to which the respondent thinks something applies in Britain and how important they consider that thing to be for democracy in general. Assuming that people will be more concerned by a failure to deliver something they consider to be particularly important, differences are weighted according to the importance attached to that item, with more important items generating a proportionally bigger deficit/surplus. The resulting measure ranges from -1 to +1 with negative scores indicating that there is a perceived democratic deficit and positive scores a surplus.[15] There is no evidence that people want less democracy than the British political system currently delivers; the average score on each items is less than 0. People in fact perceive a significant democratic deficit in a number of areas including equal treatment by the courts and the government’s ability to achieve social outcomes or involve citizens sufficiently in decision-making.
People in fact perceive a significant democratic deficit in a number of areas

British Social Attitudes 31 | Democracy
NatCen Social Research
14
Table 1.7 Perceived democratic deficit, in Britain[16]
Mean deficit/surplus (-1 to 1)
% saying feature extremely
important but does not apply in Britain
Electoral democracy
… national elections are free and fair -0.06 1
… governing parties are punished in elections when they have done a bad job -0.19 12
… opposition parties are free to criticise the government -0.04 2
… different political parties offer clear alternatives to one another -0.16 9
Liberal democracy
… the courts treat everyone the same -0.25 18
… the media provide citizens with reliable information to judge the government -0.22 15
… the media are free to criticise the government -0.04 2
… the rights of minority groups are protected -0.12 4
Social democracy
… the government protects all citizens against poverty -0.30 24
… the government takes measures to reduce differences in income levels -0.24 16
Participatory democracy
… the government explains its decisions to voters -0.32 24
… citizens have the final say on the most important issues by referendum -0.24 17
Source: European Social Survey 2012/13
Table 1.7 also shows the proportion of people who perceived there to be a democratic deficit i.e. who rate an item as being extremely important for democracy (scoring it nine or ten on the importance scale) but do not think it applies in Britain (evaluating it less than five on the 0 to 10 evaluation scale). Nearly one in five people (18 per cent) feel that the courts do not live up to their expectations in terms of treating everyone equally[17] and around one in seven (15 per cent) perceive a deficit in terms of the quality of the information the media provide.
There is also a substantial group of people who perceive there to be a democratic deficit in terms of the delivery of material outcomes; nearly a quarter (24 per cent) of people think both that it is extremely important in a democracy for the government to protect its citizens against poverty and that this does not apply in Britain. Similarly, there is a perceived deficit in terms of how well the government communicates with voters; 24 per cent of people think that it is extremely important that the government explains its decisions to voters but that this does not apply, while 17 per cent think it is extremely important that citizens have the final say in key decisions via referendums but that this does not apply sufficiently in Britain.
1 in 5people (18 per cent) feel that the courts do not live up to their expectations in terms of treating everyone equally
British Social Attitudes 31 | Democracy
NatCen Social Research
15
What are the implications of a democratic deficit for political engagement?
How serious is the perceived democratic deficit for the long-term health of democracy in Britain? One way in which to examine this issue is to look at the association between the public’s attitudes towards democracy and their levels of political engagement. Are dissatisfied democrats nevertheless participating in the democratic process as ‘critical citizens’ or is their dissatisfaction expressed via apathy and disengagement?
To establish whether there is an association between people’s perceptions of a democratic deficit and their propensity to participate politically, we need to discount the possibility that any relationship we observe between participation and attitudes is simply the result of people with certain background characteristics being both more or less likely to participate and to hold certain attitudes. Therefore, we ran multivariate regression analysis which enables us to look at the association between perceptions and participation after controlling for any differences in socio-demographics. We looked separately at associations with voting in elections and with engagement in non-institutionalised forms of participation, including signing petitions and taking part in demonstrations. We used four summary measures to capture perceptions of the democratic deficit, measuring the average deficit perceived on a) the four items making up the electoral dimension of democracy b) the four items making up the liberal dimension c) the two items making up the social dimension d) the two items making up the participatory dimension.
The results of our analyses, further details of which can be found in the appendix to this chapter, paint a mixed picture. There is support for the ‘critical citizens’ hypothesis that a perceived deficit need not be a sign of disengagement and may even encourage political participation. The larger the perceived deficit in participatory democracy, the more likely people were to have voted in the 2010 general election or to have participated in protest activities in the past year. People were also more likely to have participated in protest activities the larger the perceived deficit in the realisation of liberal democratic ideals.
However, there is also evidence that failing to deliver what people want in terms of material outcomes may contribute to political disengagement. Even after controlling for a range of background characteristics including education and left-right orientation, the more people perceived there to be a deficit in terms of the government’s ability to protect citizens from poverty or reduce differences in income levels, the less likely they were to have voted in the 2010 election. This is a potential challenge for all three of the main political parties: while the perceived deficit in social outcomes is largest among individuals on the left, those in the centre and on the right also perceive a deficit on this dimension.[18]
Conclusions
This chapter confirms the importance attached to democracy and democratic values by the British public. Not only do people in Britain consider it important to live in a democracy, they have high and wide-ranging expectations about what this entails. The strength of people’s commitment to democratic values increases with age and education and there are differences between those on the left and right of the political spectrum. However, the main thing to emerge from the analysis presented is that there is a broad consensus among all sections of the
There is evidence that failing to deliver what people want in terms of material outcomes may contribute to political disengagement

British Social Attitudes 31 | Democracy
NatCen Social Research
16
British public that, in addition to guaranteeing free and fair competitive elections and protecting civil liberties, it is important for any democracy to achieve certain social outcomes and involve citizens in decision-making.
The current political system however does not always live up to people’s expectations. Many people perceive there to be a democratic deficit in Britain and think that features they consider important for democracy do not apply in practice. There is a marked deficit in how successful the government is considered to be in protecting its citizens from poverty, perhaps not surprising given the current economic climate. There is also a large deficit regarding how well the government is thought to explain its decisions to voters and, perhaps most worryingly, a substantial minority of people believes that the British courts do not treat everyone equally. The government should consider and address the reasons for this deficit in the perceived fairness of the judicial system.
The possible implications of the perceived democratic deficit for the future health of democracy in Britain are uncertain. There is currently no evidence that the perceived failure of the system to deliver more participatory democracy or live up to liberal democratic ideals is leading people to become disengaged. Those with the highest expectations and who therefore perceive the biggest deficit remain engaged as ‘critical citizens’ and continue to participate in democracy through a variety of channels. However, the continued failure of government to deliver desired outcomes such as protecting citizens from poverty or reducing differences in income may be contributing to feelings of disillusionment and leading people to switch off from the political process. The government needs to do more to protect citizens’ material well-being and find ways to communicate better with voters. Unless these issues are addressed there is always a risk that the existing political system may come under pressure from non-mainstream forces who promise to deliver these things, even if this comes at the expense of other features of liberal democracy.
Notes1. Blair, T. (2000), speech on Britishness, London, Mar 28. Retrieved 27 March 2014,
from www.guardian.co.uk/britain/article/0,2763,184950,00.html. Brown, G. (2006), “The Future of Britishness”, speech presented to the Fabian Society’s New Year Conference, London, 14 January. Retrieved 27 March 2014, from www.fabians.org.uk. Cameron, D. (2011), speech on radicalization and Islamic extremism, speech presented at the Munich Security Conference, Munich, 5 February. Retrieved 27 March 2014, from www.britishpoliticalspeech.org/speech-archive.htm?speech=329.
2. The European Social Survey provides nationally representative probability samples of all residents aged 15 and over in a number of European countries and covers a wide range of social and political topics. Six rounds of the survey have been carried out to date. Unlike the British Social Attitudes survey, the European Social Survey collects data for the whole of the United Kingdom, including Northern Ireland. However, NI cases are excluded from the analysis presented here and the remaining respondents were asked to evaluate democracy in Britain. The data for this chapter are from Round 6 of the survey conducted in the UK between September 2012 and January 2013. European Social Survey Round 6: European Social Survey Round 6 Data (2012/13). Data file edition 1.2. Design weights were applied in all analyses. Post-stratification weights were not available at the time of analysis but have since been added to the data file (Edition 2.0). Further information about the survey can be found at: www.europeansocialsurvey.org.

British Social Attitudes 31 | Democracy
NatCen Social Research
17
3. European Values Study (2011): European Values Study 2008: Integrated Dataset (European Values Study 2008). GESIS Data Archive, Cologne. ZA4800 Data file Version 3.0.0, doi:10.4232/1.11004.
4. European Social Survey Round 6 data were available for 24 countries. A second data release in May 2014 included data from further countries.
5. The full question wording was:
Now some questions about democracy. Later on I will ask you about how democracy is working in Britain. First, however, I want you to think instead about how important you think different things are for democracy in general. There are no right or wrong answers so please just tell me what you think
6. The four groupings are informed by theory and have been shown to work well empirically, producing high Cronbach’s alpha scores. Electoral dimension α = 0.80. Liberal dimension α = 0.82. Social dimension α = 0.74. Participatory dimension α = 0.71.
7. Bases for Table 1.2 are as follows:
Expectations of democracy, in Britain
How important is it for democracy in general that …
Mean score (0–10)
% saying extremely important
(i.e. scoring 9 or 10)
Weighted base
Unweighted base
Weighted base
Unweighted base
Electoral democracy
… national elections are free and fair 2108 2111 2200 2204
… governing parties are punished in elections when they have done a bad job 2047 2056 2200 2204
… opposition parties are free to criticise the government 2079 2086 2200 2204
… different political parties offer clear alternatives to one another 2058 2059 2200 2204
Liberal democracy
… the courts treat everyone the same 2107 2108 2200 2204
… the courts able to stop the government acting beyond its authority 2031 2036 2200 2204
… the rights of minority groups are protected 2057 2057 2200 2204
… the media provide citizens with reliable information to judge the government 2086 2086 2200 2204
… the media are free to criticise the government 2093 2099 2200 2204
Social democracy
… the government protects all citizens against poverty 2099 2103 2200 2204
… the government takes measures to reduce differences in income levels 2068 2069 2200 2204
Participatory democracy
… the government explains its decisions to voters 2100 2104 2200 2204
… citizens have the final say on the most important issues by referendum 2062 2066 2200 2204
Source: European Social Survey 2012/13

British Social Attitudes 31 | Democracy
NatCen Social Research
18
8. Mean scores are based on the average response given by all those expressing an opinion. There is obviously a question regarding how reasonable it is to expect people to have thought about and formed meaningful opinions about all of the specific aspects of democracy asked about in the European Social Survey questionnaire. However, although around 5 per cent of respondents did answer “don’t know”, the vast majority of respondents were able to give an answer European Social Survey data showed.
Expectations of democracy, in Britain, item non-response
How important is it for democracy in general that … % “Don’t know” responses
Electoral democracy
… national elections are free and fair 4
… governing parties are punished in elections when they have done a bad job 7
… opposition parties are free to criticise the government 5
… different political parties offer clear alternatives to one another 6
Liberal democracy
… the courts treat everyone the same 4
… the courts are able to stop the government acting beyond its authority 8
… the rights of minority groups are protected 6
… the media provide citizens with reliable information to judge the government 5
… the media are free to criticise the government 5
Social democracy
… the government protects all citizens against poverty 4
… the government takes measures to reduce differences in income levels 6
Participatory democracy
… the government explains its decisions to voters 4
… citizens have the final say on the most important issues by referendum 6
Weighted base 2200Unweighted base 2204
Source: European Social Survey 2012/13
9. Respondents with no educational qualifications are also less likely to hold an opinion about the requirements of democracy – with levels of “don’t knows” ranging from 9 per cent to 15 per cent across items – as are young people under 25 (7 per cent to 14 per cent “don’t knows”).
10. Whether people would actually participate in a referendum is another matter. Support for direct democracy in principle is not always matched by high turnout in practice. In the 2011 referendum regarding the electoral system used to elect MPs, for example, turnout was just 42 per cent nationally (www.electoralcommission.org.uk/i-am-a/journalist/electoral-commission-media-centre/news-releases-referendums/Complete-set-of-provisional-turn-out-figures-for-referendum-now-published). Turnout in the 2012 elections to elect local police commissioners was even lower.

British Social Attitudes 31 | Democracy
NatCen Social Research
19
11. European Social Survey respondents are asked:
In politics people sometimes talk of “left” and “right”. Using this card, where would you place yourself on this scale, where 0 means the left and 10 means the right?
Responses 0 to 4 on the scale are categorised as being on the political left, 5 is categorised as centrist (group not shown in analysis) and responses 6 to 10 are categorised as being on the political right.
12. The items were the same as in Table 1.2 with one exception. Respondents were not asked to evaluate whether “… the courts are able to stop the government acting beyond its authority” applies in Britain. This item is not therefore included in any subsequent analysis.
13. The full question wording was:
Now some questions about the same topics, but this time about how you think democracy is working in Britain today. Again, there are no right or wrong answers, so please just tell me what you think
14. Bases for Table 1.6 are as follows:
Evaluations of democracy, in Britain
To what extent does it apply in Britain that … Mean score (0–10)
% saying does not apply (i.e. scoring <5)
Weighted base
Unweighted base
Weighted base
Unweighted base
Electoral democracy
… national elections are free and fair 2118 2122 2200 2204
… governing parties are punished in elections when they have done a bad job 2030 2041 2200 2204
… opposition parties are free to criticise the government 2086 2093 2200 2204
… different political parties offer clear alternatives to one another 2056 2061 2200 2204
Liberal democracy
… the courts treat everyone the same 2078 2081 2200 2204
… the rights of minority groups are protected 2016 2019 2200 2204
… the media provide citizens with reliable information to judge the government 2075 2076 2200 2204
… the media are free to criticise the government 2098 2106 2200 2204
Social democracy
… the government protects all citizens against poverty 2085 2094 2200 2204
… the government takes measures to reduce differences in income levels 2042 2044 2200 2204
Participatory democracy
… the government explains its decisions to voters 2075 2083 2200 2204
… citizens have the final say on the most important issues by referendum 2004 2017 2200 2204
Source: European Social Survey 2012/13

British Social Attitudes 31 | Democracy
NatCen Social Research
20
15. Responses on the importance and evaluation scales were rescaled to be between 0 and 1 rather than 0 and 10. The democratic deficit measure for each item, y, was then calculated as follows: (Importance of y (0 to 1) – Evaluation of whether y applies in Britain (0 to 1)) x Importance (0–1).
16. Bases for Table 1.7 are as follows:
Perceived democratic deficit, in Britain
Mean deficit/surplus (-1 to 1)
% saying feature extremely important but does not apply in Britain
Weighted base
Unweighted base
Weighted base
Unweighted base
Electoral democracy
… national elections are free and fair 2077 2079 2200 2204
… governing parties are punished in elections when they have done a bad job 1988 2000 2200 2204
… opposition parties are free to criticise the government 2045 2052 2200 2204
… different political parties offer clear alternatives to one another 2002 2004 2200 2204
Liberal democracy
… the courts treat everyone the same 2035 2039 2200 2204
… the rights of minority groups are protected 1972 1973 2200 2204
… the media provide citizens with reliable information to judge the government 2046 2041 2200 2204
… the media are free to criticise the government 2061 2071 2200 2204
Social democracy
… the government protects all citizens against poverty 2054 2059 2200 2204
… the government takes measures to reduce differences in income levels 1996 1995 2200 2204
Participatory democracy
… the government explains its decisions to voters 2045 2052 2200 2204
… citizens have the final say on the most important issues by referendum 1968 1977 2200 2204
Source: European Social Survey 2012/13
17. European Social Survey data collected in 2010/11 as part of a module of questions on Trust in Justice provide further insights on this topic (Jackson et al., 2010). As many as 50 per cent of people in the UK think that a poor person is more likely than a rich person to be found guilty of an identical crime they did not commit while 30 per cent of respondents feel that someone of a different race or ethnic group from the majority would be more likely to be found guilty. (European Social Survey Round 5 Data (2010). Data file edition 3.0.)
18. The average deficit on the social democracy dimension was -0.35 among those placing themselves on the left of the political spectrum, -0.25 among those in the centre and -0.20 among those on the right.

British Social Attitudes 31 | Democracy
NatCen Social Research
21
ReferencesBirdwell, J., Tryhorn, C., Feve, S. and Vibla, N. (2013), Backsliders: Measuring Democracy in the EU, London: Demos
Butt, S. and Curtice, J. (2010), ‘Duty in decline? Trends in attitudes to voting’ in Park, A., Curtice, J., Thomson, K., Phillips, M., Clery, E. and Butt, S. (eds.), British Social Attitudes: the 26th Report, London: Sage
Coggan, P. (2013), The Last Vote: The Threats to Western Democracy, London: Allen Lane
Curtice, J., and Seyd, B. (2012), ‘Constitutional reform: a recipe for restoring faith in our democracy?’ in Park, A., Clery, E., Curtice, J., Phillips, M. and Utting, D. (eds.), British Social Attitudes: the 29th Report, London: NatCen Social Research, available at: www.bsa-29.natcen.ac.uk
Dahl, R.A. (1998), On democracy, New Haven: Yale University Press
Dalton, R.J. (2004), Democratic challenges, democratic choices. The erosion of political support in advanced industrial democracies, New York: Oxford University Press
Dalton, R.J., Shin, D.C. and Jou, W. (2007), Popular Conceptions of the Meaning of Democracy: Democratic Understanding in Unlikely Places, UC Irvine: Center for the Study of Democracy, available at: http://escholarship.org/uc/item/2j74b860
Diamond, L. (2003), ‘Defining and Developing Democracy’ in Dahl, R.A., Shapiro, I. and Cheibub, J.A. (eds.), The Democracy Sourcebook, Cambridge: The MIT Press
Freedom House (2014), Freedom in the World 2014, available at: www.freedomhouse.org/report/freedom-world/freedom-world-2014
Jackson, J., Hough, M., Farrall, S., Aromaa, K. and de Keijser, J. (2010), Trust in Justice: A Comparative European Analysis, available at: www.europeansocialsurvey.org/docs/round5/questionnaire/ESS5_final_trust_in_police_courts_module_template.pdf
Jacoby. W.G. (1994), ‘Public attitudes to government spending’, American Journal of Political Science, 38: 336–361
Kitschelt, H. (1994), The transformation of European social democracy, Cambridge: Cambridge University Press
Kriesi, H., Morlino, L., Magalhaes, P., Alonso, S. and Ferrin, M. (2012), European’s understandings and evaluations of democracy, available at: www.europeansocialsurvey.org/docs/round6/questionnaire/ESS6_final_understandings_and_evaluation_of_democracy_module_template.pdf
Lee, L. and Young, P. (2013), ‘A disengaged Britain? Political interest and participation over 30 years’, in Park, A., Bryson, C., Clery, E., Curtice, J. and Phillips, M. (eds.), (2013), British Social Attitudes: the 30th Report, London: NatCen Social Research, available at: www.bsa-30.natcen.ac.uk
Norris, P. (1999), Critical Citizens: Global Support for Democratic Governance, Oxford: Oxford University Press
Norris, P. (2011), Democratic deficit. Critical Citizens Revisited, New York: Cambridge University Press
Schumpeter, J.A. (1976), Capitalism, socialism, and democracy, 5th ed., London: Allen and Unwin
Stoker, G. (2006), Why Politics Matters: Making Democracy Work, Basingstoke: Palgrave Macmillan

British Social Attitudes 31 | Democracy
NatCen Social Research
22
Webb, P. (2013), ‘Who is willing to participate? Dissatisfied democrats, stealth democrats and populists in the United Kingdom’, European Journal of Political Research, 52: 747–772
Welzel, C. and Klingemann, H-D. (2007), Understanding democratic congruence: a demand-supply perspective, UC Irvine: Center for the Study of Democracy, available at: https://escholarship.org/uc/item/3nb7x3qs
AcknowledgementsEuropean Social Survey Round 6 was funded by the European Commission (FP7, Research Infrastructures, Grant Agreement 262208), the European Science Foundation and academic funding bodies in participating countries (the ESRC in the UK). The views expressed are those of the authors alone.
AppendixThe multivariate analysis technique used is logistic regression (see the Technical details chapter for further explanation of this type of analysis).
The dependent variable in Table A.1 is whether the respondent voted in the 2010 general election or not. A positive coefficient on the demographic variables indicates that the group is more likely than the reference group (shown in brackets) to have voted while a negative coefficient indicates that the group is less likely than the reference group to have voted. The deficit measure has been recoded so that higher values indicate a greater perceived deficit. A positive coefficient therefore indicates that perceiving a democratic deficit is associated with a higher likelihood of voting while a negative coefficient indicates that perceiving a deficit is associated with a lower likelihood of voting.
Table A.1 Voted vs. not voted in 2010 general election logistic regression
Coefficient Standard error p value
Age 0.05** 0.01 0.000
Sex (male) 0.04 0.16 0.799
Education (no qualifications)
GCSE or A level 0.75** 0.23 0.001
Higher qualification – not degree 1.04** 0.28 0.000
Degree 1.61** 0.28 0.000
Self-reported position on left-right scale (left)
Centre -0.45* 0.20 0.023
Right 0.14 0.23 0.541
Deficit – electoral democracy -0.16 0.82 0.847
Deficit – liberal democracy -0.03 0.79 0.972
Deficit – social democracy -1.07** 0.40 0.007
Deficit – participatory democracy 1.98** 0.49 0.000
Constant -2.33 0.44 0.000
R2 (adjusted) 0.15
Weighted base: 1432Unweighted base: 1448
Source: European Social Survey 2012/13*= significant at 95% level **= significant at 99% level

British Social Attitudes 31 | Democracy
NatCen Social Research
23
The dependent variable in Table A.2 is whether the respondent has taken part in any form of non-institutionalized political action in the past 12 months (defined as signing a petition, taking part in a lawful demonstration or boycotting certain products). A positive coefficient on the demographic variables indicates that the group is more likely than the reference group (shown in brackets) to have taken part while a negative coefficient indicates that the group is less likely than the reference group to have taken part. The deficit measure has been recoded so that higher values indicate a greater perceived deficit. A positive coefficient therefore indicates that perceiving a democratic deficit is associated with a higher likelihood of taking part while a negative coefficient indicates that perceiving a deficit is associated with a lower likelihood of taking part.
Table A.2 Participated in non-institutionalised political action in last 12 months vs. not logistic regression
Coefficient Standard error p value
Age 0.01* 0.00 0.015
Sex (male) 0.27* 0.12 0.025
Education (no qualifications)
GCSE or A level 0.71** 0.19 0.000
Higher qualification – not degree 1.23** 0.22 0.000
Degree 1.40** 0.21 0.000
Self-reported position on left-right scale (left)
Centre -0.53** 0.15 0.000
Right -0.23 0.17 0.176
Deficit – electoral democracy 0.32 0.63 0.613
Deficit – liberal democracy 1.30* 0.58 0.026
Deficit – social democracy -0.59 0.33 0.072
Deficit – participatory democracy 0.77* 0.39 0.048
Constant -1.59 0.32 0.000
R2 (adjusted) 0.08
Weighted base: 1494Unweighted base: 1492
Source: European Social Survey 2012/13*= significant at 95% level **= significant at 99% level

British Social Attitudes 31 | Democracy
NatCen Social Research
24
The data on which Figure 1.1 is based are shown below.
Table A.3 Attitudes towards democracy
How important to live in democracy?
How democratic is country?
% %
Not at all important/democratic 1 1
1 * 1
2 * 2
3 1 3
4 2 6
5 7 13
6 4 13
7 7 18
8 16 22
9 14 10
Extremely important/ completely democratic 43 6
Weighted base 2200 2200Unweighted base 2204 2204
Source: European Social Survey 2012/13

British Social Attitudes 31 | Scotland
NatCen Social Research
25
What if Scotland votes ‘Yes’?Public opinion on the two sides of the border does not represent a major barrier to continuing collaboration between Scotland and the rest of the UK in the event of independence.
86% of people in Scotland would like to be able to carry on watching the BBC after independence, while 82% of those in England and Wales think they ‘definitely’ or ‘probably’ should be allowed to do so.
62% in Scotland think an independent Scotland should keep the same King or Queen as England; 65% in England and Wales agree.
What if Scotland votes ‘No’?Neither old grievances nor new pressures appear to be insurmountable to achieving an accommodation in the event that Scotland chooses to remain part of the UK.
But there is reluctance on both sides of the border to accept the idea that tax rates and benefit levels could be different in Scotland than in England. For example, only 34% of people in Scotland, and 28% in England, think it would be OK for the old age pension to be different.
As many as 63% of people in Scotland would like the Scottish Parliament to be responsible for taxes and welfare benefits in Scotland. 49% of people in England and Wales take the same view.
49%63%
86%
PENSION BOOK
PENSION BOOK
62%
34%
65%
28%
ENGLAND AND WALES
ENGLAND AND WALES
ENGLAND
SCOTLAND
SCOTLAND
SCOTLAND
ScotlandCan Scotland and the rest of the UK get along?Irrespective of the outcome of the referendum on Scottish independence on 18th
September 2014, Scotland and the rest of the United Kingdom will have to get along with each other, despite a referendum campaign that might have created antagonism between the two publics. What does opinion either side of the border tell us about the prospects for the future relationship between Scotland and the Rest of the UK in the event of either a ‘Yes’ or a ‘No’ vote?

British Social Attitudes 31 | Scotland
NatCen Social Research
26
Introduction
Irrespective of the outcome of the referendum on independence on 18th September 2014, Scotland and the rest of the United Kingdom will have to get along with each other, one way or another. If Scotland votes to leave the UK, the two neighbours will have to agree the terms of the divorce and how far and in what ways they wish to collaborate in the future. If Scotland votes to stay in the UK, a constitutional settlement will have to be reached that is acceptable to the existing UK as a whole.
However, the claims and the counterclaims made during the referendum campaign may make reaching either kind of accommodation difficult. Inevitably, the campaign in favour of independence is critical of the way in which the UK is currently run. It argues that the economy meets the needs of (the south east of) England rather than those of the UK as a whole. Britain is portrayed as a relatively unequal society, and it is suggested that this reflects a less egalitarian outlook amongst voters in England compared with those in Scotland. More generally, supporters of independence suggest that Scotland is at perpetual risk of having public policies imposed upon it that are at variance with the views of a majority of Scotland’s population (Scottish Government, 2013).
Those on the other side of the campaign fence point out that Scotland currently enjoys higher public spending per head than does either England or Wales, but that due to declining oil revenues it would be unlikely to be able to sustain this position under independence. Indeed, it is argued that Scotland’s economy would suffer more generally under independence (HM Government, 2013). Meanwhile, doubts – or even outright opposition – are raised about the prospects for future collaboration between Scotland and the rest of the UK, not least in respect of a number of proposals put forward by the Scottish Government, including sharing the pound and continued access in Scotland to the BBC (Scottish Government, 2013; HM Government, 2014a). At the same time, it is argued that Scotland’s social needs can be met more effectively and securely if welfare is funded from the larger pool of UK-wide resources rather than from the smaller Scottish tax base alone (HM Government, 2014b).
The expression of such sentiments could well come at a price – of greater antagonism between the publics on the two sides of the border. People in Scotland could become more critical of what they feel they currently get out of their country’s membership of the United Kingdom. Those in the rest of the UK may increasingly think that Scotland is incapable of recognising a good deal when it sees one. As a result, the two publics’ aspirations for the future may diverge, making it more difficult for their political leaders to reach an accommodation once the referendum ballot is counted and concluded.
In this chapter we look at public opinion on both sides of the border and what this might mean once the referendum is over. We start by looking at the prospects for a political accommodation in the event of a ‘Yes’ vote. Is there agreement on how the two countries should collaborate and, in particular, on the merits of the quite considerable sharing of facilities and institutions envisaged by the current Scottish Government? We then consider some of the issues that might have to be addressed if Scotland votes ‘No’. Do the two publics agree or disagree about how Scotland should be governed within the framework of the Union? Or might a ‘No’ vote simply be a prelude to further wrangling between London and Edinburgh?
We look at public opinion on both sides of the border
Author
John CurticeJohn Curtice is Professor of Politics at the University of Strathclyde and Research Consultant at NatCen Social Research

British Social Attitudes 31 | Scotland
NatCen Social Research
27
We address these themes using data from two sources. The first comprises respondents to the British Social Attitudes survey who are resident in England or Wales. The second consists of the Scottish Social Attitudes survey, an entirely separate survey from British Social Attitudes, but one that is conducted north of the border using exactly the same methodological approach. In 2013 the two surveys asked a variety of questions that either were worded identically or else covered the same subject matter from the perspective of their particular part of the UK. In some cases these questions have also been asked in the past, enabling us to look at whether attitudes have actually grown apart or not.
What if Scotland votes ‘Yes’?
The Scottish Government’s vision for independence envisages considerable continuing collaboration between Scotland and the rest of the UK (Scottish Government, 2013). It proposes that Scotland would continue to keep the Queen as its Head of State. Although it would establish its own public broadcasting corporation, the new body would continue to broadcast existing BBC channels, simply inserting its own programmes into the BBC schedule (much as BBC Scotland currently ‘opts out’ of the corporation’s network coverage). Meanwhile the Scottish Government proposes that Scotland would continue to use the pound as part of a currency union with the rest of the UK, a proposition that the UK government (and the opposition Labour Party) has already indicated it would reject (Balls, 2014; HM Government, 2014a).
Shared institutions?There are two important questions to be asked of the Scottish Government’s proposals for collaboration. First, do people in Scotland necessarily want the collaboration that the current Scottish Government envisages? Second, are people in the rest of Britain willing to accept the idea that they should share institutions and procedures with a part of the UK that has just voted to leave? Unless we can answer both questions in the affirmative, it is likely to prove more difficult for negotiators on the two sides to broker the kind of deal that the Scottish Government has proposed.
First of all we consider whether Scotland wishes to keep the Queen. On the 2013 Scottish Social Attitudes survey respondents were asked whether an independent Scotland, “should keep the same King or Queen as England, or should it have its own President instead?” Most said they would like to retain the monarchy, though only 44 per cent said Scotland should “definitely” do so (while another 18 per cent only reckoned it “probably” should). In contrast, only a third definitely or probably wanted a President.
Scotland appears to be even keener to retain access to the BBC. We asked:
The BBC currently provides public service television in Scotland. If Scotland became an independent country, which of these statements on this card comes closest to your view?
The BBC should be available in Scotland in the same way as it is nowThe BBC should be replaced by Scotland’s own public TV serviceThe BBC should be available and Scotland should have its own independent public TV service
Most said they would like to retain the monarchy

British Social Attitudes 31 | Scotland
NatCen Social Research
28
As many as 61 per cent said they would simply like to keep the access they already have and do not feel that the country should develop its own independent public television service. Another 25 per cent want both the BBC and for Scotland to have its own independent television service, while just 11 per cent believe the BBC should be replaced by Scotland’s own public broadcaster. In short the overwhelming majority of people in Scotland, no less than 86 per cent, would like to keep the BBC available to viewers and listeners in Scotland. Just over one in three (36 per cent) want any kind of separate or additional public television service. It seems that here the Scottish public are even more enthusiastic about continuing collaboration than is their current government.
Keeping the pound is also a popular idea north of the border. The 2013 Scottish Social Attitudes Survey asked people the following question:
If Scotland became independent which do you think it should use, the pound, the euro or its own new currency?
Eight in ten (79 per cent) said it should continue to use the pound. Only 11 per cent said that it should have its own new currency and just 7 per cent opted for the euro. It should be noted, however, that the question did not distinguish between using the pound as part of a formal currency union with the rest of the UK (as proposed by the Scottish Government) and using it unilaterally without any such formal agreement. At the time the 2013 survey was being conducted (in the summer and early autumn of that year) this distinction was not one that had received much attention in the public debate. More recently it has done so, not least as a result of the controversial announcement that all the principal parties currently represented in the House of Commons would oppose the creation of such a union (Balls, 2014; HM Government, 2014a). Even so, it appears that long before that announcement in February 2014, there was quite a widespread appreciation that Scotland might not be allowed to use the pound. For when respondents to the 2013 Scottish Social Attitudes survey were asked separately “if Scotland became independent which currency do you think it would be using after a few years”, just 57 per cent named the pound. Overall, no less than 28 per cent of people said they wanted to be able to use the pound if Scotland became independent, but anticipated that in practice this would not be possible.
So for the most part public opinion in Scotland backs continuing collaboration on the monarchy, the pound, and the BBC. But if such collaboration is to be sustainable then it will need to be acceptable to public opinion south of the border. But is public opinion in the rest of Britain willing to accept such arrangements with an independent Scotland? It appears that in each case the answer is, ‘yes’, albeit not overwhelmingly so.
This is certainly the picture that emerged in respect of the monarchy when we asked:
If Scotland becomes an independent country, separate from the rest of the UK, should Scotland be allowed to keep the same King or Queen as England and Wales or not?
Around two-thirds (65 per cent) of people in England and Wales think that an independent Scotland should be allowed to keep the same King or Queen, while only around a quarter (26 per cent) believe it should not. That said, just 35 per cent said that it should “definitely” be allowed to do so, while 30 per
79%of people in Scotland think Scotland should continue to use the pound in the event of independence
65%of people in England and Wales think an independent Scotland should be allowed to keep the same King or Queen

British Social Attitudes 31 | Scotland
NatCen Social Research
29
cent only agreed that it should “probably” be allowed to keep the monarchy. Such apparent equivocation might exist because many respondents had not considered the issue before – or it might reflect a feeling that Scotland should be allowed to share the Queen so long as the arrangement formed part of a wider settlement that was acceptable to both sides.
Such hesitancy is less apparent when it comes to sharing the BBC. No less than 54 per cent say that everyone in an independent Scotland should “definitely be allowed” to “watch BBC television programmes just as they do now” while another 27 per cent think they should “probably be allowed” to do so. Only 13 per cent oppose the idea. Doubtless such willingness would be conditional on people in Scotland continuing to pay the same television licence fee as everyone in the rest of the UK, but it would appear that there is an appetite on both sides of the border to continue to have access to the common body of news information and cultural entertainment that the BBC currently provides.
There is rather less enthusiasm about the prospect of allowing Scotland to share the pound, where the balance of opinion closely mirrors that on sharing the same monarchy. On the one hand, 69 per cent in England and Wales said that an independent Scotland should be allowed “to continue to use the pound as its currency if it wants to”, while just 26 per cent were opposed. Those figures appear to cast doubt on the suggestion that most people in the rest of the UK would not be willing to contemplate the formation of a currency union with an independent Scotland (Holehouse, 2014). On the other hand, only 38 per cent think an independent Scotland should “definitely be allowed” to use the pound while almost as many, 31 per cent, only say that it should “probably be allowed” to do so. This suggests the issue is one where the eventual balance of public opinion in the rest of the UK could well depend on the lead given by its politicians. The public south of the border may come to decide that a currency union is a bad idea if that is the message they hear (Curtice, 2014); equally it seems that they could also be persuaded to tolerate the idea.
For the most part, then, it appears that British public opinion does not look like a serious barrier to continuing collaboration between the two countries in the event of independence. Both publics seem at least willing to tolerate sharing the monarchy, the BBC and the pound, though perhaps tolerance should not be mistaken for enthusiasm.
Citizenship in a new ScotlandOne of the key issues that both governments would have to decide between them in the event of a ‘Yes’ vote in the independence referendum is who would have the right to become a Scottish citizen and who among those living north of the border would be allowed to retain their existing British citizenship. The Scottish Government has indicated that any British citizen born in Scotland or living in Scotland on independence day would automatically become a Scottish citizen. At the same time, however, so far as the Scottish Government is concerned such persons would also be able to keep their British citizenship should they wish to do so (Scottish Government, 2013). The UK government has been a little less forthcoming; it has acknowledged that it normally allows individuals to hold dual citizenship, but also states:
it cannot be guaranteed that dual nationality would be available to all persons who would be British citizens prior to independence, and who then became Scottish citizens. (HM Government, 2014c: 62)
British public opinion does not look like a serious barrier to continuing collaboration between the two countries in the event of independence

British Social Attitudes 31 | Scotland
NatCen Social Research
30
On this topic, however, neither government can be confident that its policy position reflects the broad swathe of public opinion in their part of Britain. As the concept of ‘citizenship’ is not that widely understood amongst the public in Britain, we addressed the issue in terms of one of the key concomitants of citizenship, the right to hold a passport. In Scotland we posed the following question:
If Scotland became independent what choices about passports should be available to citizens living here?
People should have to choose whether they keep their British passport or have a Scottish onePeople should be able to keep their British passport and have a Scottish onePeople should only be able to have a Scottish passport
Just under a half (47 per cent) of those living in Scotland think that people should be able to keep their British passport and have a Scottish one too. A third (32 per cent) feel people should have to choose between the two, and 17 per cent think people should only be able to have a Scottish passport. Perhaps the pattern of responses reflects an innate suspicion of people being allowed to have two passports, but it could equally well indicate that many people feel that those who become Scottish citizens should demonstrate some commitment to the new country.
To ascertain people’s views on this issue in England and Wales we asked:
Say that Scotland becomes an independent country, separate from the rest of the UK, and everyone living in Scotland who currently has a British passport becomes entitled to have a Scottish passport. Which of the statements on this card comes closest to your own view about what should then happen?
People in Scotland should have to choose whether they want to keep their British passport or have a Scottish one insteadIf they want, people in Scotland should be able to keep their British passport and have a Scottish one as well
Here the majority view is that British citizens living in a newly independent Scotland should have to make a clear choice, with just under six in ten (58 per cent) backing that position. Only a third (33 per cent) think people should be able to have both. The UK government might thus find itself under some pressure to limit the ability of those who take up Scottish citizenship to retain their full rights as British citizens as well.
Nuclear weaponsThere is, however, one area where the Scottish Government has set its face against continuing collaboration with the rest of the UK. The UK’s current submarine based nuclear weapons facility is based on the estuary of the River Clyde. That fact alone would mean that a key UK defence establishment would be located on foreign soil should Scotland become independent. But to make matters more complicated, the Scottish National Party (SNP) is opposed to the possession of nuclear weapons and thus, in the event of independence, the current SNP Scottish Government would seek the removal of the UK’s nuclear weapons from Scottish waters. Meanwhile, although the UK government has delayed making a final decision on the future of the UK’s nuclear weapons facility until 2016, in 2007 the House of Commons voted in favour of initial proposals to replace the current Trident facility when it comes to the end of its operational life.
47%of those living in Scotland think people should be able to keep their British passport and have a Scottish one too

British Social Attitudes 31 | Scotland
NatCen Social Research
31
However, public opinion on the subject of nuclear weapons is nothing like as different on the two sides of the border as these different governmental stances might suggest. In Table 2.1 we show how people in the two parts of the UK responded when asked their view about the principle of Britain having its own nuclear weapons. On the one hand, it is the case that, in England and Wales more people (43 per cent) support having nuclear weapons than oppose their possession (36 per cent), whereas in Scotland, where 37 per cent are in favour and 46 per cent opposed, the opposite is true. On the other hand, the differences in the level of support are not that large, and both parts of the UK could reasonably be described as being divided on the subject. A decision either to retain or to scrap Britain’s nuclear capability could be expected to meet considerable opposition on both sides of the border.
Table 2.1 Attitudes towards Britain’s possession of nuclear weapons, England and Wales and Scotland
England and Wales Scotland
Are you in favour or against Britain having its own nuclear weapons? % %
Strongly in favour 18 13
Somewhat in favour 25 24
Neither in favour nor against 17 16
Somewhat against 16 18
Strongly against 20 28
Weighted base 991 1497Unweighted base 984 1497
Source: England and Wales – British Social Attitiudes (respondents living in England and Wales only);Scotland – Scottish Social Attitudes
Given the division of opinion, we should not perhaps be surprised that people in Scotland are not necessarily convinced that becoming independent should require the removal of British nuclear weapons. In fact slightly more people agree (41 per cent) than disagree (37 per cent) with the proposition that:
If Scotland becomes independent, Britain’s nuclear weapons submarines should continue to be based here
The country is evidently just as divided over what it would want the rest of the UK to do with its weapons in the event of independence as it is over the principle of their possession in the first place.
However, people in England and Wales are more of one mind on this issue. Here the question we asked was:
At the moment, Britain’s nuclear weapon submarines are based in Scotland. Regardless of whether you support or oppose Britain having nuclear weapons, if Scotland became an independent country, separate from the rest of the UK, should Britain’s nuclear weapons remain in Scotland or should they be moved to somewhere else in Britain?
Only around a quarter (26 per cent) think Britain’s nuclear weapons should remain in Scotland in these circumstances, while 63 per cent feel they should “definitely”
People in Scotland are not necessarily convinced that becoming independent should require the removal of British nuclear weapons

British Social Attitudes 31 | Scotland
NatCen Social Research
32
or “probably” be moved elsewhere. Ironically, should Scotland vote ‘Yes’, it is public opinion in the rest of the UK that would be keen to see Britain’s nuclear weapons removed from Scotland rather than people within Scotland itself – most likely in many cases out of a wish to ensure that those weapons are still in a location that is fully within the UK’s control.
SummaryFor the most part, public opinion on the two sides of the border does not appear to represent a major barrier to the development of a collaborative arrangement between Scotland and the rest of the UK. However, Scotland might find that there is a demand south of the border for Britain’s nuclear weapons to be moved out of Scotland, even if a future Scottish Government were not to insist on their removal from the Clyde. Meanwhile both governments might find that there are limits to public tolerance of any approach that allowed large numbers of people to claim dual citizenship of both Scotland and the rest of the UK. Here perhaps is an issue where both governments would need to tread carefully.
What if Scotland votes ‘No’?
What if Scotland chooses to remain in the United Kingdom? Will it be possible to find an arrangement for the governance of the UK that the public on both sides of the border would find acceptable? There are, after all, already some well-aired grievances about the allegedly advantageous position that the current asymmetric devolution settlement affords Scotland. Some question the right of Scottish MPs to vote on laws that will not apply north of the border when English MPs have no say over any equivalent Scottish legislation (Conservative Democracy Task Force, 2008; Heffer, 2005; Russell and Lodge, 2006). Others suggest it is unfair that Scotland enjoys a higher level of public spending per head than England, especially when it is not necessarily obvious that such spending can be justified by levels of need (McLean, 2005; McLean et al., 2008). Meanwhile, north of the border, various proposals have been put forward for giving the Scottish Parliament more powers and responsibilities (Devo Plus Group, 2012; Campbell, 2012; Lodge and Trench, 2014; Scottish Labour Devolution Commission, 2014; Trench, 2013). So there may well be pressure for Scotland to be given even more devolution than it enjoys now, a pressure to which the rest of the UK may or may not be willing to accede.
Current grievancesWe start by considering how far public opinion in England is exercised about some of the alleged unfairness of the current devolution settlement. As Table 2.2 shows, people in England are certainly not very happy about the fact that Scottish MPs can vote on laws that only affect England. As many as 62 per cent agree that they should not, while only 8 per cent take the opposite view. However, the level of agreement is no higher now than it was in the early days of devolution, and to that extent people in England have not become increasingly concerned about the issue – though the proportion who “agree strongly” that Scottish MPs should not vote on English laws has grown by some ten percentage points or so since the early years of devolution. It seems unlikely that this issue will go away, though as yet the proposals of a government appointed commission to address the apparent anomaly through creating an opportunity for English MPs alone to express their views on ‘English’ laws are at present still gathering dust (McKay, 2013).
63%of people in England and Wales think Britain’s nuclear weapons should be moved elsewhere if Scotland becomes an independent country
62%of people in England agree that Scottish MPs should not vote on laws that only affect England

British Social Attitudes 31 | Scotland
NatCen Social Research
33
Table 2.2 Attitudes in England towards Scottish MPs voting on English laws, 2000–2013
2000 2001 2003 2007 2010 2012 2013
Now that Scotland has its own parliament, Scottish MPs should no longer be allowed to vote in the House of Commons on laws that only affect England % % % % % % %
Agree strongly 18 19 22 25 31 29 29
Agree 45 38 38 36 35 36 33
Neither agree nor disagree 19 18 18 17 17 15 26
Disagree 8 12 10 9 6 7 7
Disagree strongly 1 2 1 1 1 1 1
Weighted base 1721 2387 1548 752 794 806 823Unweighted base 1695 2341 1530 739 773 802 815
Note: In 2013 respondents were not offered the option ‘Can’t choose’ (the results for which are not shown). In previous years they wereSource: British Social Attitudes (respondents living in England only)
On the other hand, England seems to be rather less concerned about Scotland’s share of public spending, though critics are more numerous than they once were. We asked:
Would you say that compared with other parts of the UK, Scotland gets pretty much its fair share of government spending, more than its fair share, or less than its fair share of government spending?
Please choose your answer from this card.1. Much more than its fair share of government spending2. A little more than its fair share of government spending3. Pretty much its fair share of government spending4. A little less than its fair share of government spending5. Much less than its fair share of government spending
As Table 2.3 shows, only just over a third (36 per cent) now think Scotland gets more than its “fair share”. At least as many (37 per cent) think that it simply secures “pretty much its fair share”, though only one in twenty feels that Scotland gets less than its fair share. The proportion who think that Scotland gets more than its fair share is undoubtedly higher now than in the early years of devolution, when only a little under a quarter were of that opinion, but it is slightly lower than the figure of two in five or so that hitherto has prevailed since 2008. So while there is some resentment about Scotland’s perceived share of public spending, it is far from widespread and is not necessarily continuing to grow. It is also notable that each year between a quarter and a fifth of respondents say they do not know whether Scotland secures its fair share or not, an indication perhaps that the subject is not very salient in many people’s minds.
England seems to be rather less concerned about Scotland’s share of public spending

British Social Attitudes 31 | Scotland
NatCen Social Research
34
Table 2.3 Attitudes in England towards Scotland’s share of public spending, 2000–13
2000 2001 2002 2003 2007 2008 2009 2010 2011 2012 2013
Would you say that compared with other parts of the UK, Scotland gets … % % % % % % % % % % %
Much more than its fair share 8 9 9 9 16 21 18 21 22 21 18
A little more than its fair share 13 15 15 13 16 20 22 17 22 23 18
Pretty much its fair share 42 44 44 45 38 33 30 29 30 30 37
A little less than its fair share 10 8 8 8 6 3 4 3 3 4 4
Much less than its fair share 1 1 1 1 1 * * 1 * 1 1
Don’t know 25 23 22 25 22 23 25 28 23 22 23
Weighted base 1956 2786 2931 1929 870 1001 992 928 974 937 936Unweighted base 1928 2761 2897 1917 859 982 980 913 967 937 925
Source: British Social Attitudes (respondents living in England only)
But how do people in Scotland react when these propositions are put to them? Would they be upset if the rights of Scottish MPs to vote on English laws were to be limited? Does Scotland itself feel that it gets a good financial deal out of the UK, or might it think it should attract more government spending?
It seems that there would be relatively little objection in Scotland to limiting the right of Scottish MPs to vote on English laws. As Table 2.4 shows, typically just over half agree that Scotland’s MPs should not be voting on such laws, while only around one in five or so disagree. Both proportions have changed little since the advent of devolution, other than that perhaps opposition to the idea may have fallen a little (from 24 per cent in 2001 to 18 per cent now), while the proportion that “agree strongly” has increased from 14 per cent in 2000 to 21 per cent now.
Table 2.4 Attitudes in Scotland towards Scottish MPs voting on English laws, 2000–13
2000 2001 2003 2007 2009 2012 2013
Now that Scotland has its own parliament, Scottish MPs should no longer be allowed to vote in the House of Commons on laws that only affect England % % % % % % %
Agree strongly 14 15 13 14 15 19 21
Agree 39 36 34 36 32 33 32
Neither agree nor disagree 17 21 29 26 28 27 28
Disagree 19 16 18 18 18 15 15
Disagree strongly 4 8 5 4 4 5 3
Weighted base 1663 1605 1508 1508 1482 1229 1340Unweighted base 1663 1605 1508 1508 1482 1229 1340
Source: Scottish Social Attitudes
There would be relatively little objection in Scotland to limiting the right of Scottish MPs to vote on English laws

British Social Attitudes 31 | Scotland
NatCen Social Research
35
Scotland is not so sanguine when it comes to its share of public spending. When asked exactly the same question as we have already seen was posed to people in England, two in five (40 per cent) of those living north of the border say that Scotland secures less than its fair share of spending, while only around one in ten (11 per cent) believe the country is being treated generously. However, people in Scotland are less likely to be critical of the share of spending that they get than they were in the early days of devolution, when as many as 58 per cent said that Scotland received less than its fair share. Indeed, it is notable that this perception has been less common ever since the SNP first came to power in Edinburgh in 2007 (when the proportion feeling that Scotland gets less than its fair share fell from 49 per cent two years earlier to 36 per cent). Any move to reduce Scotland’s share of public spending, as a minority of people in England would seemingly like to happen, would doubtless be unpopular, but it seems that there is no reason to anticipate any imminent public pressure from north of the border for Scotland to be given a bigger slice of the cake than it already enjoys.
Table 2.5 Attitudes in Scotland towards Scotland’s share of public spending, 2000–13
2000 2001 2003 2005 2007 2009 2010 2011 2012 2013
% % % % % % % % % %
Much more than its fair share 2 2 2 3 3 2 2 2 2 2
A little more than its fair share 8 8 8 7 13 11 12 9 11 9
Pretty much its fair share 27 36 34 32 37 39 41 39 39 42
A little less than its fair share 35 32 35 32 25 29 28 30 30 28
Much less than its fair share 23 15 13 17 11 8 10 12 12 12
Don’t know/not answered 4 6 7 8 11 9 7 8 6 6
Weighted base 1663 1605 1508 1549 1508 1482 1495 1197 1229 1497Unweighted base 1663 1605 1508 1549 1508 1482 1495 1197 1229 1497
Source: Scottish Social Attitudes
Future changesOn the other hand, should Scotland decide to vote in favour of staying in the UK there is likely to be pressure for the country’s devolved institutions to be given more power and responsibility. Some changes are indeed already in train; under the provisions of the 2012 Scotland Act the Parliament will become responsible (in 2015) for landfill tax and stamp duty on property purchases and (in 2016) for the first 10p of income tax.[1] However, this still means that the bulk of decisions about taxation and welfare will remain the preserve of the UK government at Westminster, and that these will remain the principal areas of domestic policy that are not wholly or primarily in Edinburgh’s hands. Yet a clear majority of people in Scotland would appear to want their devolved parliament to be more powerful than this. As Table 2.6 shows, in recent years typically around a third or so have said that the Scottish Parliament should make all the key decisions for Scotland (a proposition that is tantamount to independence) while another third have indicated that it should be responsible for everything apart from defence and foreign affairs.
40%of those living north of the border say that Scotland secures less than its fair share of spending
A clear majority of people in Scotland would appear to want their devolved parliament to be more powerful
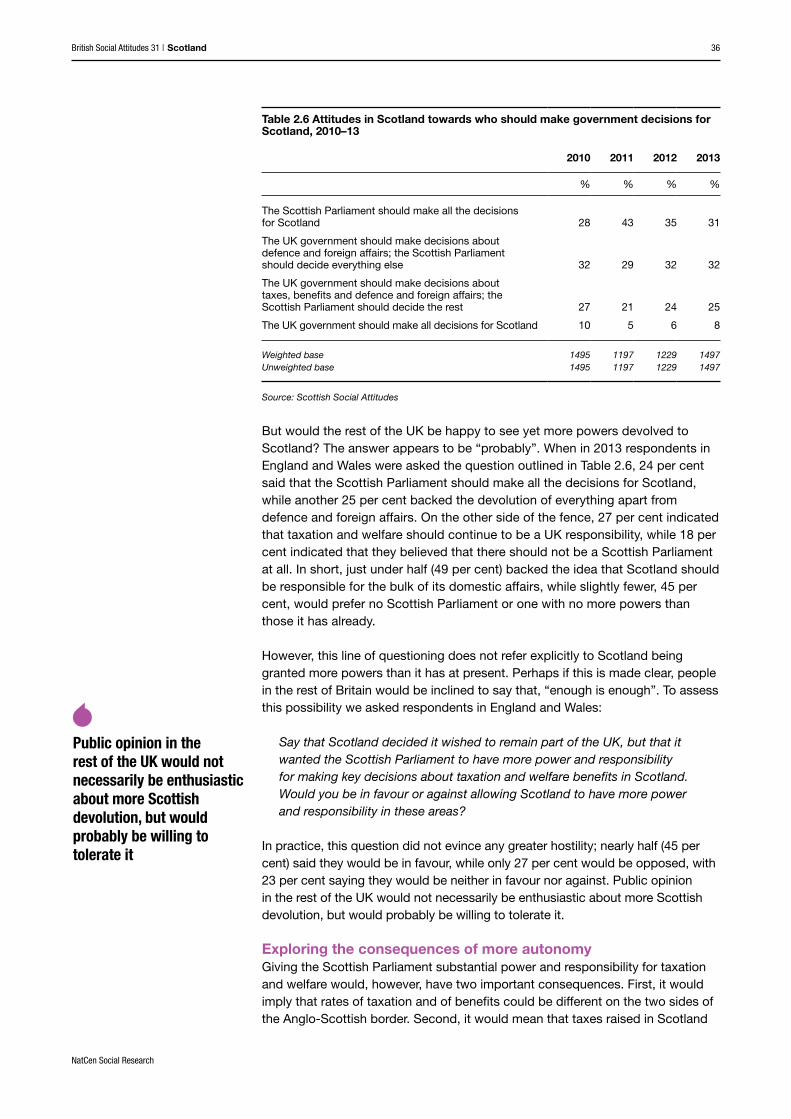
British Social Attitudes 31 | Scotland
NatCen Social Research
36
Table 2.6 Attitudes in Scotland towards who should make government decisions for Scotland, 2010–13
2010 2011 2012 2013
% % % %
The Scottish Parliament should make all the decisions for Scotland 28 43 35 31
The UK government should make decisions about defence and foreign affairs; the Scottish Parliament should decide everything else 32 29 32 32
The UK government should make decisions about taxes, benefits and defence and foreign affairs; the Scottish Parliament should decide the rest 27 21 24 25
The UK government should make all decisions for Scotland 10 5 6 8
Weighted base 1495 1197 1229 1497Unweighted base 1495 1197 1229 1497
Source: Scottish Social Attitudes
But would the rest of the UK be happy to see yet more powers devolved to Scotland? The answer appears to be “probably”. When in 2013 respondents in England and Wales were asked the question outlined in Table 2.6, 24 per cent said that the Scottish Parliament should make all the decisions for Scotland, while another 25 per cent backed the devolution of everything apart from defence and foreign affairs. On the other side of the fence, 27 per cent indicated that taxation and welfare should continue to be a UK responsibility, while 18 per cent indicated that they believed that there should not be a Scottish Parliament at all. In short, just under half (49 per cent) backed the idea that Scotland should be responsible for the bulk of its domestic affairs, while slightly fewer, 45 per cent, would prefer no Scottish Parliament or one with no more powers than those it has already.
However, this line of questioning does not refer explicitly to Scotland being granted more powers than it has at present. Perhaps if this is made clear, people in the rest of Britain would be inclined to say that, “enough is enough”. To assess this possibility we asked respondents in England and Wales:
Say that Scotland decided it wished to remain part of the UK, but that it wanted the Scottish Parliament to have more power and responsibility for making key decisions about taxation and welfare benefits in Scotland. Would you be in favour or against allowing Scotland to have more power and responsibility in these areas?
In practice, this question did not evince any greater hostility; nearly half (45 per cent) said they would be in favour, while only 27 per cent would be opposed, with 23 per cent saying they would be neither in favour nor against. Public opinion in the rest of the UK would not necessarily be enthusiastic about more Scottish devolution, but would probably be willing to tolerate it.
Exploring the consequences of more autonomyGiving the Scottish Parliament substantial power and responsibility for taxation and welfare would, however, have two important consequences. First, it would imply that rates of taxation and of benefits could be different on the two sides of the Anglo-Scottish border. Second, it would mean that taxes raised in Scotland
Public opinion in the rest of the UK would not necessarily be enthusiastic about more Scottish devolution, but would probably be willing to tolerate it
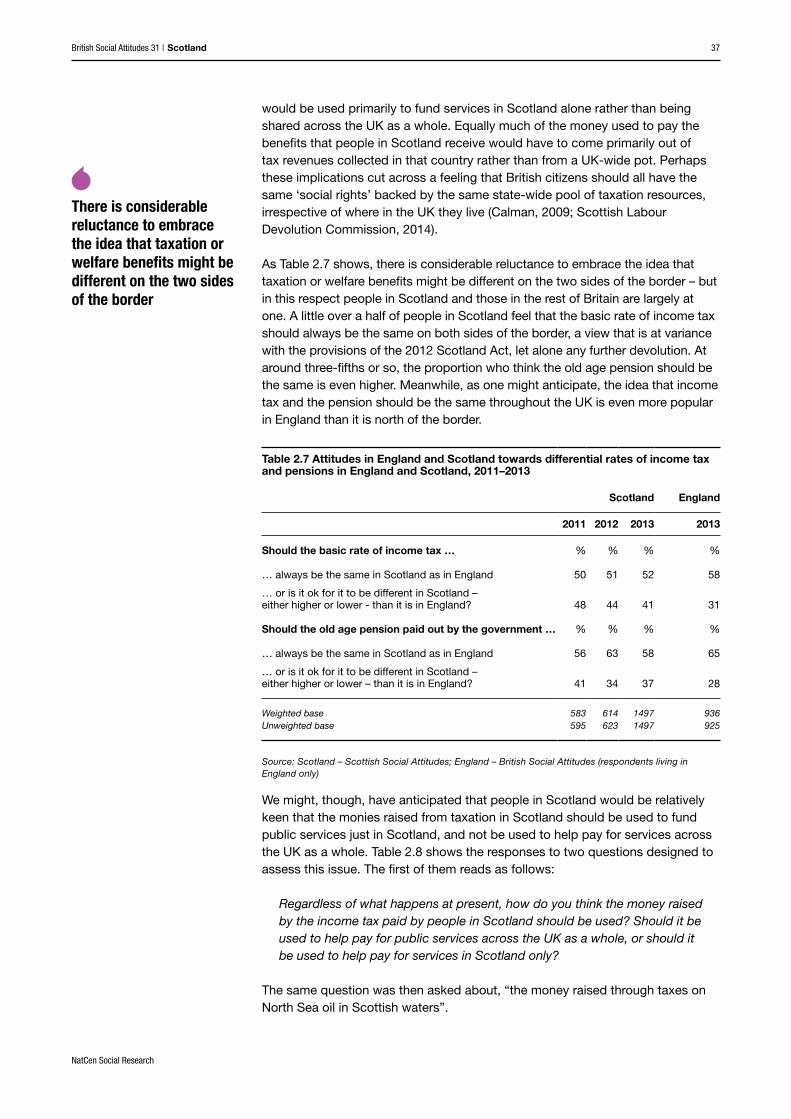
British Social Attitudes 31 | Scotland
NatCen Social Research
37
would be used primarily to fund services in Scotland alone rather than being shared across the UK as a whole. Equally much of the money used to pay the benefits that people in Scotland receive would have to come primarily out of tax revenues collected in that country rather than from a UK-wide pot. Perhaps these implications cut across a feeling that British citizens should all have the same ‘social rights’ backed by the same state-wide pool of taxation resources, irrespective of where in the UK they live (Calman, 2009; Scottish Labour Devolution Commission, 2014).
As Table 2.7 shows, there is considerable reluctance to embrace the idea that taxation or welfare benefits might be different on the two sides of the border – but in this respect people in Scotland and those in the rest of Britain are largely at one. A little over a half of people in Scotland feel that the basic rate of income tax should always be the same on both sides of the border, a view that is at variance with the provisions of the 2012 Scotland Act, let alone any further devolution. At around three-fifths or so, the proportion who think the old age pension should be the same is even higher. Meanwhile, as one might anticipate, the idea that income tax and the pension should be the same throughout the UK is even more popular in England than it is north of the border.
Table 2.7 Attitudes in England and Scotland towards differential rates of income tax and pensions in England and Scotland, 2011–2013
Scotland England
2011 2012 2013 2013
Should the basic rate of income tax … % % % %
… always be the same in Scotland as in England 50 51 52 58
… or is it ok for it to be different in Scotland – either higher or lower - than it is in England? 48 44 41 31
Should the old age pension paid out by the government … % % % %
… always be the same in Scotland as in England 56 63 58 65
… or is it ok for it to be different in Scotland – either higher or lower – than it is in England? 41 34 37 28
Weighted base 583 614 1497 936Unweighted base 595 623 1497 925
Source: Scotland – Scottish Social Attitudes; England – British Social Attitudes (respondents living in England only)
We might, though, have anticipated that people in Scotland would be relatively keen that the monies raised from taxation in Scotland should be used to fund public services just in Scotland, and not be used to help pay for services across the UK as a whole. Table 2.8 shows the responses to two questions designed to assess this issue. The first of them reads as follows:
Regardless of what happens at present, how do you think the money raised by the income tax paid by people in Scotland should be used? Should it be used to help pay for public services across the UK as a whole, or should it be used to help pay for services in Scotland only?
The same question was then asked about, “the money raised through taxes on North Sea oil in Scottish waters”.
There is considerable reluctance to embrace the idea that taxation or welfare benefits might be different on the two sides of the border

British Social Attitudes 31 | Scotland
NatCen Social Research
38
In both cases public opinion in Scotland is split more or less evenly on the issue. Indeed, despite the fact that “it’s Scotland’s oil” was a famous slogan that the SNP used during its first electoral breakthrough in the 1970s (and even though allegations of misuse of those revenues by the UK government forms part of the nationalist case for independence), slightly more people (50 per cent) think the revenues from North Sea oil should be shared across the UK as a whole than feel they should be spent exclusively in Scotland (44 per cent). However, there is no doubt where the balance of public opinion on this subject lies in England and Wales – there most people feel the revenues from Scottish taxation should be used to help pay for services across the UK as a whole, and this feeling is particularly widespread when it comes to the revenues from North Sea oil.
Table 2.8 Attitudes in England and Wales and in Scotland towards the use of tax revenues raised in Scotland
England and Wales Scotland
Help pay for services
across the UK
Help pay for services in Scotland
only
Help pay for services
across the UK
Help pay for services in Scotland
only
Use of money raised through income tax in Scotland % 66 25 % 47 48
Use of money raised through taxes on North Sea oil % 81 12 % 50 44
Weighted base 991 991 1497 1497Unweighted base 984 984 1497 1497
Source: England and Wales – British Social Attitudes (respondents living in England and Wales only); Scotland – Scottish Social Attitudes
Scotland itself is even less keen on funding welfare benefits out of its own resources than it is on keeping its tax revenues to itself. This became evident when respondents were asked:
What about the cost of paying benefits to people in Scotland who lose their job through no fault of their own? Regardless of what happens at present, should the money to pay this come from the taxes collected across the UK as a whole, or from those collected in Scotland only?
The same question was also asked in relation to the “cost of paying the government old age pension to people living in Scotland”. As Table 2.9 shows, in both cases around three-fifths would prefer the necessary funding to come from across the UK as a whole. In contrast, people in England and Wales take much the same view of how these welfare benefits should be funded as they do about how income tax revenues should be used, with two-thirds (66%) saying they should be funded from a UK-wide pot.
Scotland itself is even less keen on funding welfare benefits out of its own resources than it is on keeping its tax revenues to itself

British Social Attitudes 31 | Scotland
NatCen Social Research
39
Table 2.9 Attitudes in England and Wales and in Scotland towards the funding of welfare benefits paid in Scotland
England and Wales Scotland
From taxes collected
across the UK
From taxes collected in
Scotland only
From taxes collected
across the UK
From taxes collected in
Scotland only
Money to pay for unemployment benefits % 66 27 % 58 36
Money to pay for old age pension % 66 27 % 61 34
Weighted base 991 991 1497 1497Unweighted base 984 984 1497 1497
Source: England and Wales – British Social Attitudes (respondents living in England and Wales only); Scotland – Scottish Social Attitudes
There are perhaps two ways of looking at the apparent inconsistency, evident on both sides of the border, between a largely favourable attitude towards the principle of devolving decisions about taxation and welfare in Scotland to the Scottish Parliament and less favourable views towards some of the consequences of doing so. On the one hand, it suggests that exercising the powers of further devolution may be more difficult than is immediately apparent, and that, in particular, future Scottish Governments may find it politically quite difficult to introduce different tax rates from those found south of the border. If so, that would appear to reduce the risk that tax (and welfare) devolution might come to offend English and Welsh sensibilities. On the other hand, the inconsistency also indicates that public opinion on both sides of the border remains sympathetic to the principle of sharing resources and benefits across the UK as a whole, and that might be thought to provide a valuable foundation for continuing collaboration across the UK as a whole should Scotland eventually decide to vote No.
Conclusions
One clear theme runs through this chapter. Whether Scotland votes ‘Yes’ or ‘No’ on 18th September 2014, there is broad agreement between people in Scotland and those in the rest of the UK about how their future relationship should be handled. Should Scotland vote ‘Yes’, the country would like to keep the monarchy, the BBC and the pound, and it appears that public opinion in the rest of Britain could be persuaded to accept such arrangements. The Scottish Government’s wish to see Britain’s nuclear weapons facility removed from the Clyde might be thought a potential flashpoint, but it seems that whatever people in Scotland think, their counterparts in England and Wales would not want these weapons to stay in an independent Scotland anyway. The one issue where there might be some difficulty is whether people in Scotland should be allowed to retain their existing British citizenship while claiming a new Scottish one, not because the two publics take a different view on the subject but because both are apparently rather suspicious of allowing people to carry more than one passport.
Future Scottish Governments may find it politically quite difficult to introduce different tax rates from those found south of the border
Should Scotland vote ‘Yes’, the country would like to keep the monarchy, the BBC and the pound

British Social Attitudes 31 | Scotland
NatCen Social Research
40
If Scotland votes ‘No’ there are potentially both old grievances and new pressures that would have to be addressed. Yet neither seems insurmountable. Public opinion in England would like to stop Scottish MPs from voting on English laws, but it seems that most people in Scotland would not object. Meanwhile, Scotland’s share of public spending still does not seem to be a point of serious contention between the two publics. Scotland would, in principle, at least like to see its devolved institutions have more responsibility for taxation and welfare, but this appears to be a pressure to which England would be willing to accede. In any event, there is a lack of enthusiasm among the Scottish public to see greater responsibility translate into major policy differences between Scotland and its neighbours. Meanwhile, both publics are still willing to accept the idea of sharing the risks and responsibilities associated with taxation and welfare across the United Kingdom.
There is nothing inevitable about this state of affairs and attitudes could well change. For example, we have seen that public opinion in England has become a little more concerned about Scotland’s share of public spending and having Scottish MPs voting on English laws than it was in the early days of devolution. The rhetoric of the referendum campaign might yet create differences between the two publics. But once the heat of the battle is over and the combatants on both sides have to deal with the consequences of whatever vote transpires, it seems that if they listen to their publics they should be able to reach an accommodation with which most people would be willing to live.
Notes1. www.legislation.gov.uk/ukpga/2012/11/contents/enacted.
ReferencesBalls, E. (2014), ‘Currency union with Scots “won’t happen”’, The Scotsman, 14 February, available at: www.scotsman.com/news/ed-balls-currency-union-with-scots-won-t-happen-1-3305547
Calman, Sir K., chairman, (2009), Serving Scotland Better: Scotland and the United Kingdom in the 21st Century, Edinburgh: Commission on Scottish Devolution
Campbell, Sir M. (2012), Federalism: The Best Future for Scotland, Edinburgh: Scottish Liberal Democrats, available at: http://scotlibdems.org.uk/homerule
Conservative Democracy Task Force (2008), Answering the Question: Devolution the West Lothian Question and the Future of the Union, London: Conservative Party
Curtice, J. (2014), ‘Is the rest of the UK becoming more concerned about independence?’. Posted at: http://blog.whatscotlandthinks.org/2014/03/is-the-rest-of-the-uk-becoming-more-concerned-about-scottish-independence/
Devo Plus Group (2012), A New Union, Edinburgh: Devo Plus, available at: www.devoplus.com
HM Government (2013), Scotland Analysis: Macroeconomic and Fiscal Performance, Cm 8694, London: The Stationery Office
HM Government (2014a), Scotland Analysis: Assessment of a Sterling Currency Union, Cm 8815, London: The Stationery Office
HM Government (2014b), Scotland Analysis: Work and Pensions, Cm 8849, London: The Stationery Office
Public opinion in England has become a little more concerned about Scotland’s share of public spending

British Social Attitudes 31 | Scotland
NatCen Social Research
41
HM Government (2014c), Scotland Analysis: Borders and Citizenship, Cm 8726, London: The Stationery Office
Heffer, S. (2005), ‘A Tory answer to the West Lothian question’, Daily Telegraph, available at: www.telegraph.co.uk/comment/personal-view/3621386/A-Tory-answer-to-the-West-Lothian-Question.html
Holehouse, M. (2014), ‘Scottish independence: give English a vote on sharing currency’, Daily Telegraph, 31 March, available at: www.telegraph.co.uk/news/uknews/scotland/scottish-politics/10733980/Scottish-independence-give-English-a-vote-on-sharing-currency.html
Lodge, G. and Trench, A. (2014), Devo More and Welfare: Developing Benefits and Policy for a Stronger Union, London: Institute for Public Policy Research
McKay, Sir W., chairman, (2013), Report of the Commission on the Consequences of Devolution for the House of Commons, London: Commission on the Consequences of Devolution for the House of Commons
McLean, I. (2005), The Fiscal Crisis of the United Kingdom, Basingstoke: Palgrave Macmillan
McLean, I., Schmuecker, K. and Lodge, G. (2008), Fair Shares? Barnett and the politics of public expenditure, London: IPPR, available at: www.ippr.org/publications/fair-shares-barnett-and-the-politics-of-public-expenditure
Russell, M. and Lodge, G. (2006), ‘The government of England by Westminster’, in Hazell, R. (ed.), The English Question, Manchester: Manchester University Press
Scottish Government (2013), Scotland’s Future: Your Guide to an Independent Scotland, Edinburgh: Scottish Government
Scottish Labour Devolution Commission (2014), Powers for a Purpose – Strengthening Accountability and Empowering People, Glasgow: Scottish Labour Party, available at: www.scottishlabour.org.uk/campaigns/entry/devolution-commission
Trench, A. (2013), Funding Devo More: Fiscal Options for Strengthening the Union, London: Institute for Public Policy Research
AcknowledgementsThe research reported in this chapter was funded by the Economic and Social Research Council as part of its research initiative on The Future of the UK and Scotland (ES/K007149/1 and ES/K006460/1). The author would like to acknowledge the advice and support of fellow participants in that research, Jan Eichhorn, Rachel Ormston and Lindsay Paterson as well as of the British and Scottish Social Attitudes teams. Responsibility for the views expressed here lies solely with the author.
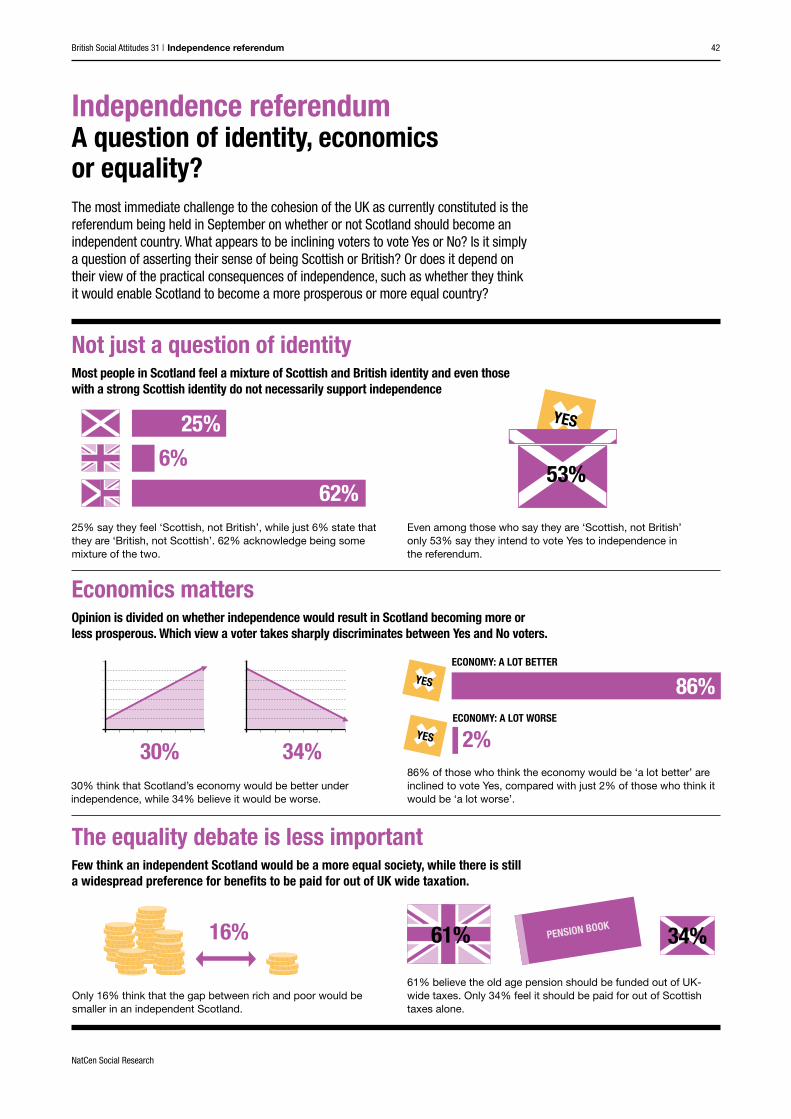
British Social Attitudes 31 | Independence referendum
NatCen Social Research
42
yes
yes
yes
Independence referendumA question of identity, economics or equality?The most immediate challenge to the cohesion of the UK as currently constituted is the referendum being held in September on whether or not Scotland should become an independent country. What appears to be inclining voters to vote Yes or No? Is it simply a question of asserting their sense of being Scottish or British? Or does it depend on their view of the practical consequences of independence, such as whether they think it would enable Scotland to become a more prosperous or more equal country?
Not just a question of identityMost people in Scotland feel a mixture of Scottish and British identity and even those with a strong Scottish identity do not necessarily support independence
25% say they feel ‘Scottish, not British’, while just 6% state that they are ‘British, not Scottish’. 62% acknowledge being some mixture of the two.
Even among those who say they are ‘Scottish, not British’ only 53% say they intend to vote Yes to independence in the referendum.
Economics mattersOpinion is divided on whether independence would result in Scotland becoming more or less prosperous. Which view a voter takes sharply discriminates between Yes and No voters.
The equality debate is less important Few think an independent Scotland would be a more equal society, while there is still a widespread preference for benefits to be paid for out of UK wide taxation.
Only 16% think that the gap between rich and poor would be smaller in an independent Scotland.
86% of those who think the economy would be ‘a lot better’ are inclined to vote Yes, compared with just 2% of those who think it would be ‘a lot worse’.
61% believe the old age pension should be funded out of UK-wide taxes. Only 34% feel it should be paid for out of Scottish taxes alone.
30%
16%
34%
PENSION BOOK34%61%
30% think that Scotland’s economy would be better under independence, while 34% believe it would be worse.
53%
86%
2%
ECONOMY: A LOT BETTER
ECONOMY: A LOT WORSE
25%
6%
62%

British Social Attitudes 31 | Independence referendum
NatCen Social Research
43
Introduction
On 18th September 2014, Scotland will decide whether it wishes to remain part of the United Kingdom or whether it prefers instead to become an independent state. Under the terms of the agreement between the Scottish and UK governments that paved the way for the referendum (Scottish Government, 2012) both governments have pledged to respect the outcome. That means that if a majority vote in favour of independence, the UK government is pledged to enter into talks on the terms of Scotland’s exit from the UK, an outcome that the Scottish Government at least would like to achieve by March 2016. The ballot in September thus clearly represents a major challenge to the future cohesion and integrity of the United Kingdom as currently constituted.
But what underlies the choice that voters in Scotland are being asked to make? One seemingly obvious answer is national identity. Rather than being a classic European nation state, the United Kingdom has always been a multi-national state that combines three distinct nations – England, Wales and Scotland – with (since 1922) part of a fourth nation – Ireland – across all of which a common sense of Britishness has come to be forged (Colley, 2005). However, Scotland in particular can look back on a long, if far from secure, history as a separate kingdom until James VI of Scotland inherited the English crown as James I in 1603 – and as a separate ‘state’ until the Treaty of Union in 1707. Even thereafter, Scotland retained a distinct legal, religious and educational settlement that, together with a distinctive culture and associated iconography, would seem more than enough to sustain a separate sense of Scottish identity (Devine, 2006). So, perhaps what underlies support for independence is simply a wish amongst those who feel a strong sense of Scottish identity for their distinctive sense of nationhood to be recognised through independent statehood, much as is currently the position in much of the rest of Europe (Gellner, 1983).
This is not, though, an argument that is made explicitly by those campaigning in favour of independence. In its White Paper setting out the case for independence (Scottish Government, 2013), the Scottish Government preferred to argue that it would be more ‘democratic’ for Scotland to be able to choose its own governments, and not be at risk of being governed by a government in London for which relatively few in Scotland had voted – as is the case with the current Conservative-Liberal Democrat coalition. However, such an argument assumes that Scotland is indeed a distinct ‘demos’ that thus has the right to govern itself should it so wish. That inevitably brings us back to how far people in Scotland feel a distinctive sense of identity that leads them to question whether they should be part of a Britain-wide system of governance.
There are, though, other more obviously instrumental reasons why a territorial unit such as Scotland might want to seek independence. One that comes most immediately to mind is a belief that such a step would enhance the territory’s level of prosperity. It could have access to resources that it might be better off keeping to itself rather than sharing with a wider polity (Hechter, 2000; Sorens, 2005). Certainly, ‘It’s Scotland’s oil’ was a key battle cry of the pro-independence Scottish National Party (SNP) as the first oil started to flow from the North Sea in the early 1970s (Lynch, 2013). Meanwhile a territory might well feel that it would be more prosperous if it were able to run its own economy rather than being part of a larger unit for whom that particular territory’s interests are not a central concern of economic management. This is certainly an argument that receives considerable emphasis in the Scottish Government’s White Papers.
The United Kingdom has always been a multi-national state that combines three distinct nations
Author
John CurticeJohn Curtice is Professor of Politics at the University of Strathclyde and Research Consultant at NatCen Social Research

British Social Attitudes 31 | Independence referendum
NatCen Social Research
44
There is, however, another instrumental argument that is also to be found in that document. This is that an independent Scotland would be a fairer country than the UK is at present. The White Paper complains that the United Kingdom is one of the most unequal countries in the world, the result, it is suggested, of policies pursued by Labour as well as Conservative governments. The SNP is wont to argue that Scotland has a more social democratic ethos than England, and, thus, left to its own devices would be more likely to pursue policies designed to bring about a more equal society (Salmond, 2006; 2007). It has certainly been critical of many of the cuts to welfare benefits that have been implemented by the UK coalition government.
In this chapter, we assess the degree to which these possible motivations for backing independence appear to be playing a role in shaping voters’ inclinations to vote Yes or No in September. Is support for independence simply rooted in a wish to see a distinctive sense of Scottish identity reflected in how the country is governed? Or do more instrumental considerations play a role too? Do people want independence because they believe it would bring either greater prosperity or more equality? We address these questions using data from the British Social Attitude’s sister survey, the Scottish Social Attitudes survey. We focus in particular on the most recent evidence gathered from a representative sample of 1,497 people interviewed between June and October 2013.
Support for independence
Throughout the chapter our analysis will focus on why people intend to vote one way or the other in the referendum. To ascertain their intentions, respondents to the 2013 Scottish Social Attitudes survey were asked:
In the referendum, you will be asked, ‘Should Scotland be an independent country?’ If you do vote, will you vote ‘Yes’ or vote ‘No’ – or haven’t you decided yet?
In response, 20 per cent said that they intended to vote Yes, while 42 per cent indicated that they would vote No. However, as many as 34 per cent said that they had not decided as yet. This last set of respondents were then asked a follow-up question:
At the moment, which way do you think you are most likely to vote, Yes or No?
Of those who were asked this question, 28 per cent said that they were most likely to vote Yes, while 34 per cent stated they were most likely to vote No. A further 36 per cent indicated that they really did not know what they would do. If we combine the responses to the two questions, and classify as a Yes voter anyone who said that they would vote Yes in answer to either the first or the second question (and identify No voters similarly), this produces a final tally of 30 per cent who said they would or were most likely to vote Yes, while 56 per cent said they were inclined to vote No. The remaining 16 per cent were truly undecided. Throughout our analysis a Yes voter is someone who responded Yes to either of our two questions, while No voters are defined similarly.
Our analysis will focus on why people intend to vote one way or another in the referendum

British Social Attitudes 31 | Independence referendum
NatCen Social Research
45
As one might anticipate, those belonging to certain social groups were more likely than others to say they would vote Yes rather than No. Perhaps the most striking difference is between men and women; no less than 34 per cent of the former said that they intended to vote Yes compared with only 26 per cent of women (Ormston, 2013). At the same time, older people are less keen on independence too; as many as 62 per cent of those aged 65 or over indicated that they intended to vote No while just 21 per cent said they were inclined to vote Yes. Those in routine and semi-routine occupations (32 per cent of whom said they would vote Yes) are rather keener on independence than those in professional or managerial jobs (26 per cent) (Curtice, 2013). These differences may, of course, arise simply because of variations between these social groups in the incidence of Scottish identity or in their perceptions of the consequences of independence.
IdentityOur first task is to establish how far support for and opposition to a Yes vote is a reflection of people’s sense of national identity. Are Yes voters primarily people who feel strongly Scottish and perhaps reject any sense of British identity at all? Conversely, is support for No primarily a reflection of a strong commitment to Britishness, accompanied perhaps by little or no sense of being Scottish?
To ascertain people’s feelings of identity, Scottish Social Attitudes asked them the so-called Moreno question (Moreno, 1988). This invites respondents to choose between five possible descriptions of themselves:
Which, if any, of the following best describes how you see yourself?
Scottish, not BritishMore Scottish than BritishEqually Scottish and BritishMore British than ScottishBritish, not Scottish
There is no doubt that a sense of being Scottish is more widespread and deeply held north of the border than are any feelings of Britishness (Table 3.1). In 2013, only one in ten people say that they are either “British, not Scottish” or else “More British than Scottish”. In contrast as many as a quarter (25 per cent) claim to be Scottish while denying that they are British. However, the majority of people, 62 per cent, acknowledge some combination of the two identities. In fact, the proportion of the Scottish public who deny that they are British has been rather lower in recent years: whereas between 1999 and 2006 the figure was never less than 30 per cent, since 2007 it has only been in the mid to high 20 per cents. So, in short, for many people their sense of being Scottish sits alongside a complementary sense of being British rather than in opposition to it, and if anything rather more people now acknowledge some sense of dual identity. That makes it far from immediately obvious how people’s sense of identity will be reflected in their willingness to vote for independence.
34% of men intended to vote yes, compared with only 26% of women

British Social Attitudes 31 | Independence referendum
NatCen Social Research
46
Table 3.1 Trends in Moreno National Identity, Scotland, 1999–2013
1999 2000 2001 2003 2005 2006 2007 2009 2010 2011 2012 2013
% % % % % % % % % % % %
Scottish not British 32 37 36 31 32 33 27 27 28 29 23 25
More Scottish than British 35 31 30 34 32 32 30 31 30 33 30 29
Equally Scottish and British 22 21 24 22 22 21 28 26 26 23 30 29
More British than Scottish 3 3 3 4 4 4 5 4 4 5 5 4
British not Scottish 4 4 3 4 5 5 6 4 4 5 6 6
Weighted base 1482 1663 1605 1508 1549 1594 1508 1482 1495 1197 1229 1497Unweighted base 1482 1663 1605 1508 1549 1594 1508 1482 1495 1197 1229 1497
Source: Scottish Social Attitudes
People’s sense of national identity does make some difference to the likelihood that they are inclined to vote Yes rather than No. As Table 3.2 shows, the more Scottish as opposed to being British someone feels, the more likely it is that they intend to vote Yes in September. Conversely, the more British and the less Scottish someone feels, the more they are inclined to vote No. However, the pull of the two identities seems to be asymmetric. Having some sense of a British identity seems to do much more to persuade people to vote No than having even a strong Scottish identity does to incline them to back Yes. So, even amongst those who say they are Scottish and deny that they are British, only just over half (53 per cent) say that they anticipate voting Yes. In contrast no less than 82 per cent of those who feel more British than Scottish (if they feel Scottish at all) say they will vote No. Meanwhile, nearly three quarters (73 per cent) of those who say that they are “equally Scottish and British” are inclined to vote in favour of staying in the UK.
Table 3.2 Referendum vote intention, by Moreno National Identity
Moreno National Identity
Scottish, not British
More Scottish
than British
Equally Scottish
and British
More British than Scottish/British
not Scottish*
Referendum vote intention % % % %
Yes 53 34 12 7
No 29 48 73 82
Undecided 14 14 11 5
Weighted base 368 435 433 151Unweighted base 368 439 432 166
Source: Scottish Social Attitudes*The two response categories are combined here due to small sample sizes
Nearly three quarters of those who say that they are “equally Scottish and British” are inclined to vote in favour of staying in the UK

British Social Attitudes 31 | Independence referendum
NatCen Social Research
47
So having a sense of being Scottish is an almost ubiquitous attribute in Scotland. But on its own at least, feeling that way seems to be far from sufficient to ensure that people are willing to support independence. Many also feel a sense of British identity, and this seems to make them draw away from supporting independence. This suggests that if we are going to pin down what draws people towards backing independence, we need to look at more than identity. Perhaps the secret lies in people’s expectations of what the practical consequences of independence might be?
Economics
Perceived difference that independence would makeAs we noted above, the Scottish Government’s first instrumental claim is that independence would enable Scotland to become a more prosperous country. To examine how far the public share this vision, we can examine the responses to the following four questions:
As a result of independence, would Scotland’s economy become better, worse, or would it make no difference?
As a result of independence would the standard of living in Scotland be higher, lower, or would it make no difference?
If Scotland were to become an independent country, do you think that as a result you personally would be better off financially, worse off, or would it make no difference?
Do you think that, as a result of independence, taxes in Scotland would become higher, lower or would it make no difference?
In each case, respondents were asked to reply using a five-point scale. So, for the questions on the economy and personal finance, respondents could choose to say “a lot better”, “a little better”, “no difference”, “a little worse” or “a lot worse”. Similarly, the five response options for the other two questions ranged from “a lot higher” to “a lot lower”.
So far as the jury of public opinion is concerned, it would appear that the economic case for independence remains ‘not proven’ (Table 3.3).[1] Roughly the same proportion of people say that Scotland’s economy would be “worse” (34 per cent) under independence as claim it would be “better” (30 per cent). Likewise, the proportions of people who say that the standard of living would be higher or lower under independence were almost identical to each other (27 and 28 per cent respectively). People seem, however, rather dubious about the idea that they themselves might be better off as a result of independence – or indeed that it would make much difference to them at all. Only one in eleven (nine per cent) reckon that they would be better off, while just over half (52 per cent) reckon it would not make any difference to them either way. Meanwhile when it comes to taxes there is a widespread perception – shared by as many as 56 per cent – that these would go up.

British Social Attitudes 31 | Independence referendum
NatCen Social Research
48
Table 3.3 Perceptions of the economic consequences of independence
Perceived effect of independence on
Scotland’s economy
Living standards
Personal finances Taxes
% % % %
Very positive (a lot better/higher/lower*) 5 5 2 5
Quite positive (a little better/higher/lower*) 24 22 7 1
No difference 26 36 52 30
Quite negative (a little worse/lower/higher) 22 20 18 40
Very negative (a lot worse/lower/higher) 12 7 11 16
Weighted base 1340 1340 1497 1340Unweighted base 1340 1340 1497 1340
Source: Scottish Social Attitudes*For the economy and personal finances, a positive answer is regarded as the economy being “a lot” or “a little better”; for standard of living, it is “a lot” or “a little higher”, and for taxes, it is that they would be “a lot” or “a little lower”
However, when it comes to identifying who is more or less likely to intend to vote Yes, some of these perceptions matter more than others. In the top left hand cell of Table 3.4 we show that, among those who think that Scotland’s economy would be “a lot better” under independence, no less than 86 per cent say that they intend to vote Yes in the referendum. In contrast, as we can see from the bottom left hand cell in the same column, only two per cent of those who think the economy would be “a lot worse” state the same intention. Looking down the first column, we can see that the less optimistic that people are about the implications of independence for Scotland’s economy, the less likely they are to be inclined to vote Yes. The perceived consequences of independence for the economy as a whole appear to be particularly important when it comes to whether voters are inclined to vote Yes or No.
Table 3.4 Intention to vote Yes in the referendum, by perceptions of the economic consequences of independence[2]
Perceived effect of independence on
% intending to vote YesScotland’s
economyLiving
standardsPersonal finances Taxes
A lot better/higher/lower* 86 74 89 **
A little better/higher/lower* 67 65 82 (53)
No difference 23 26 35 37
A little worse/lower/higher 5 5 7 33
A lot worse/lower/higher 2 3 3 6
Source: Scottish Social Attitudes*For the economy and personal finances, a positive answer is regarded as the economy being “a lot” or “a little better”; for standard of living, it is “a lot” or “a little higher”, and for taxes, it is that they would be “a lot” or “a little lower” **Too few cases on which to base an estimate. Figure in brackets in the cell below is for all those who think taxes would be better (i.e. lower)
86% of people who think that Scotland’s economy would be “a lot better” under independence say that they intend to vote Yes

British Social Attitudes 31 | Independence referendum
NatCen Social Research
49
None of our other three questions on people’s perceptions of what would happen economically under independence is more effective than the question on the Scottish economy at discriminating between those who intend to vote Yes and those who are inclined to back No. True, nearly everyone who thinks that their personal finances would be better is inclined to vote Yes, while few who think that they would be worse under independence appear likely to do so. But here we have to remember that relatively few think independence will make much difference either way. Meanwhile, we can see from the table that although those who are optimistic about the impact of independence on Scottish standards of living are far more likely than are those who are pessimistic to back the idea, the gap is rather narrower than for perceptions of the impact on the economy as a whole. At the same time, we can see that perceptions of what independence might do for levels of taxation apparently do not make a great deal of difference at all.
One other feature of Table 3.4 should also be noted. Those who think that independence would not make much difference either way are largely disinclined to vote Yes. In particular less than a quarter (23 per cent) who think that independence would make no difference to Scotland’s economy say that they will do so; roughly twice as many (55 per cent) say that they will vote No (data not shown). It appears that unless people in Scotland are positively convinced of the case for independence, they are largely inclined to stick with the existing constitutional arrangements.
Meanwhile, the link between perceptions of the economic consequences of independence and voting intentions in the referendum is clearly stronger than the equivalent link with national identity. As we noted earlier, even amongst those who say they are Scottish and not British, only just over half are inclined to vote Yes, far less than the equivalent proportion of 86 per cent amongst those who say Scotland’s economy would be a lot better under independence. It appears that people’s perceptions of the economic consequences of independence matter more in shaping their propensity to vote Yes or No than does their sense of national identity.
Who benefits from the Union?The choice between a Yes and a No vote may, however, not just simply be a question of the perceived merits of independence. Voters might also be asking themselves how well they think Scotland does out of being part of the Union at present. If voters think that Scotland does rather well out of the Union they might be less inclined to vote for independence than if they feel it gets a bad deal. Ever since the advent of devolution, Scottish Social Attitudes has regularly asked its respondents:
On the whole, do you think that England’s economy benefits more from having Scotland in the UK, or that Scotland’s economy benefits more from being part of the UK, or is it about equal?
In the early years of devolution, people in Scotland were much more likely to say that England’s economy benefited more from the Union than did Scotland’s. In 2000, for example, as many as 42 per cent said that England’s economy benefited more, whereas just 16 per cent reckoned that Scotland’s did. True, the group that felt that England’s economy benefited more was still only a minority, but it was a far from inconsiderable one. However, in the years immediately after the SNP first came to power as a minority Scottish Government in 2007,
In the early years of devolution, people in Scotland were much more likely to say that England’s economy benefited more from the Union

British Social Attitudes 31 | Independence referendum
NatCen Social Research
50
the proportion who felt that England’s economy benefited more was much the same as the proportion who reckoned that Scotland’s economy secured most advantage. At the same time, up to 45 per cent felt that the two economies benefited equally. It appeared as though having the SNP in power, and thus a government that was widely reckoned to be effective at advocating Scotland’s interests helped persuade some voters that their country was getting quite a good deal out of the Union after all (Curtice and Ormston, 2011). More recently the proportion who believe that England’s economy benefits most has again increased somewhat, but it remains rather lower than it typically was in the early years of devolution.
Table 3.5 Whose economy benefits more from the Union? 1999–2013
1999 2000 2001 2003 2005 2007 2009 2010 2011 2012 2013
% % % % % % % % % % %
England benefits more 36 42 38 30 36 27 28 23 29 28 32
Scotland benefits more 22 16 18 24 21 25 24 26 22 22 20
Equal 36 36 39 40 34 39 40 45 44 45 41
Weighted base 1482 1663 1605 1508 1549 1508 1482 1495 1197 1229 1497Unweighted base 1482 1663 1605 1508 1549 1508 1482 1495 1197 1229 1497
Source: Scottish Social Attitudes
Those who think that England derives more benefit from the Union are markedly more likely to say they will vote Yes in the referendum on Scottish independence than are those who think the two countries profit equally from the relationship, let alone those who think that it is actually Scotland’s economy that benefits the more (see Table 3.6). No fewer than 60 per cent of those who think that England’s economy benefits more are inclined to vote Yes, as compared with just 18 per cent of those who think the two countries benefit equally and only seven per cent of those who think Scotland is the principal beneficiary. It would appear that the fact that a smaller proportion of people now than a decade ago think that England gets more benefit has served to undermine somewhat the force of one of the potential reasons as to why people in Scotland might want to leave the UK.
Table 3.6 Referendum vote intention, by perceptions of whose economy benefits most from the Union
England’s benefits more Both equally
Scotland’s benefits more
Referendum vote intention % % %
Yes 60 18 7
No 25 66 81
Undecided 12 11 9
Weighted base 476 615 295Unweighted base 454 618 310
Source: Scottish Social Attitudes
60% of those who think that England’s economy benefits more are inclined to vote Yes

British Social Attitudes 31 | Independence referendum
NatCen Social Research
51
It seems then that people’s views of the economic consequences of independence – and of the benefit or otherwise that Scotland currently derives from the Union – are playing a key role in shaping people’s inclinations to vote Yes or No in the independence referendum. Indeed, further evidence to that effect comes from the answers that people gave when they were asked whether they would support or oppose independence if they thought that, on average, people would be £500 a year better off. They were asked:
Say it was clear that if Scotland became an independent country (separate from the rest of the UK) the standard of living would be higher and people would on average be £500 a year better off. In those circumstances would you be in favour or against Scotland becoming an independent country?
In these circumstances, no less than 52 per cent said that they would be in favour and just 29 per cent opposed. (In contrast when asked how they would feel if everyone would on average be £500 worse off, just 16 per cent said they would support the idea, while 70 per cent indicated they would be opposed.) However, at the time of the 2013 survey at least, most people in Scotland had yet to be persuaded that independence would be economically beneficial. And in the absence of that positive perception of what independence might bring there seems to be a marked reluctance to leave the UK.
Equality
We now turn to the Scottish Government’s second principal argument of an instrumental character as to why Scotland should become an independent country: that it would be better able to respond to the more social democratic ethos that is thought to pervade Scottish society, and create a more equal society than the UK is at present.
One way of approaching how far this argument appears to be persuasive in the eyes of the Scottish public is to take much the same approach as we did in respect of the economy: we can examine whether or not people expect independence to result in more or less inequality within Scotland. Respondents were asked to answer the following question using a five-point scale from “a lot bigger” to “a lot smaller”:
As a result of independence, would the gap between rich and poor in Scotland be bigger, smaller or would it make no difference?
As many as 49 per cent say that independence would not make any difference. As many as a quarter say that the gap would become bigger, while only 16 per cent believe it would be smaller (Table 3.7).[3] This does not immediately suggest that the argument has a strong resonance.
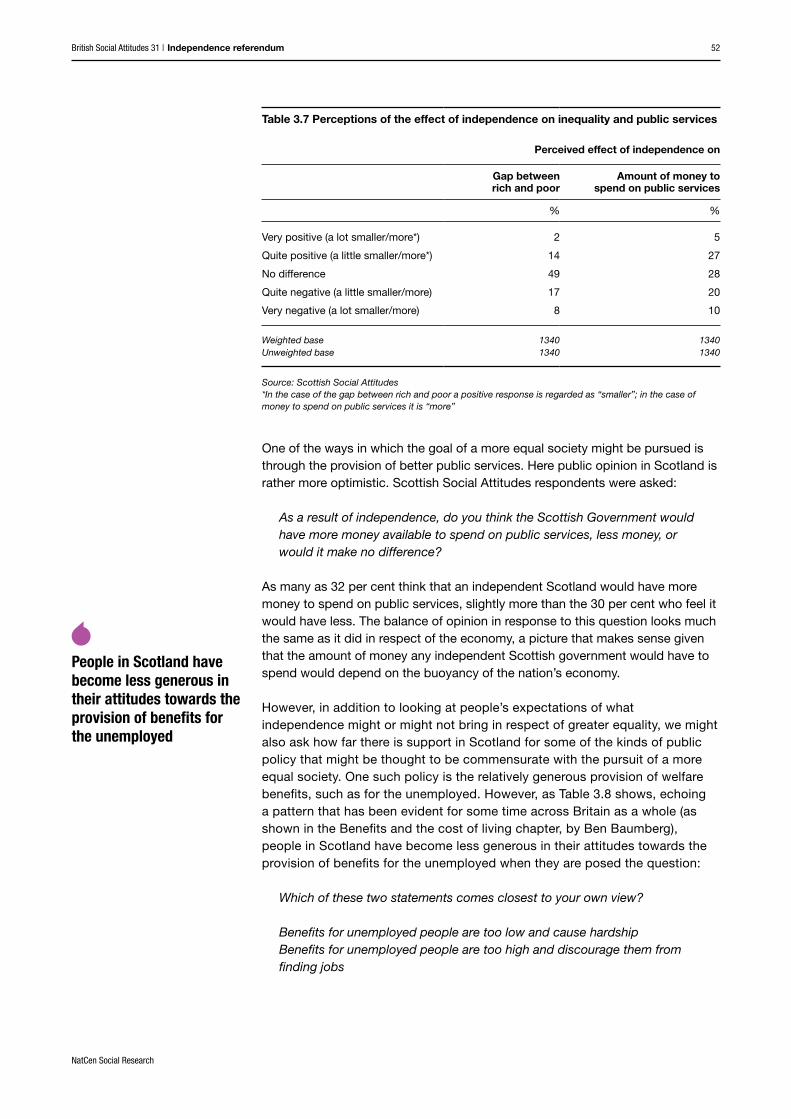
British Social Attitudes 31 | Independence referendum
NatCen Social Research
52
Table 3.7 Perceptions of the effect of independence on inequality and public services
Perceived effect of independence on
Gap between rich and poor
Amount of money to spend on public services
% %
Very positive (a lot smaller/more*) 2 5
Quite positive (a little smaller/more*) 14 27
No difference 49 28
Quite negative (a little smaller/more) 17 20
Very negative (a lot smaller/more) 8 10
Weighted base 1340 1340Unweighted base 1340 1340
Source: Scottish Social Attitudes*In the case of the gap between rich and poor a positive response is regarded as “smaller”; in the case of money to spend on public services it is “more”
One of the ways in which the goal of a more equal society might be pursued is through the provision of better public services. Here public opinion in Scotland is rather more optimistic. Scottish Social Attitudes respondents were asked:
As a result of independence, do you think the Scottish Government would have more money available to spend on public services, less money, or would it make no difference?
As many as 32 per cent think that an independent Scotland would have more money to spend on public services, slightly more than the 30 per cent who feel it would have less. The balance of opinion in response to this question looks much the same as it did in respect of the economy, a picture that makes sense given that the amount of money any independent Scottish government would have to spend would depend on the buoyancy of the nation’s economy.
However, in addition to looking at people’s expectations of what independence might or might not bring in respect of greater equality, we might also ask how far there is support in Scotland for some of the kinds of public policy that might be thought to be commensurate with the pursuit of a more equal society. One such policy is the relatively generous provision of welfare benefits, such as for the unemployed. However, as Table 3.8 shows, echoing a pattern that has been evident for some time across Britain as a whole (as shown in the Benefits and the cost of living chapter, by Ben Baumberg), people in Scotland have become less generous in their attitudes towards the provision of benefits for the unemployed when they are posed the question:
Which of these two statements comes closest to your own view?
Benefits for unemployed people are too low and cause hardshipBenefits for unemployed people are too high and discourage them from finding jobs
People in Scotland have become less generous in their attitudes towards the provision of benefits for the unemployed

British Social Attitudes 31 | Independence referendum
NatCen Social Research
53
Now only 26 per cent feel that “benefits for the unemployed are too low and cause hardship” compared with 45 per cent in 2001. Conversely, over the same period the proportion who think unemployment benefits are too high and discourage people from finding jobs has doubled from 26 per cent to 52 per cent. This does not particularly suggest that, in the immediate future at least, the government of an independent Scotland would be facing public pressure to develop a more generous welfare system, at least so far as benefits for the unemployed are concerned.
Table 3.8 Attitudes towards benefits for unemployed people, 1999–2013
1999 2000 2001 2002 2003 2006 2009 2010 2013
% % % % % % % % %
Benefits for unemployed people are too low and cause hardship 36 43 45 41 41 33 31 30 26
Benefits for unemployed people are too high and discourage them from finding jobs 33 28 26 31 32 39 42 43 52
(Neither) 22 17 16 12 16 18 17 15 15
Weighted base 1482 1663 1605 1665 1508 1594 1482 1495 1497Unweighted base 1482 1663 1605 1665 1508 1594 1482 1495 1497
Source: Scottish Social Attitudes Note: The response “neither” was not offered as a possible answer to respondents but was accepted and recorded when it was given
Equally – and again mirroring wider trends across the UK – enthusiasm for more ‘tax and spend’ appears to have diminished from what it was in the early days of the last Labour government, before that government began to embark on a substantial expansion of public expenditure (Table 3.9). This becomes apparent in the responses given to the question:
Suppose the government had to choose between the three options on this card. Which do you think it should choose?
Reduce taxes and spend less on health, education and social benefitsKeep taxes and spending on these services at the same level as nowIncrease taxes and spend more on health, education and social benefits
Back in 2001 as many as 63 per cent of people in Scotland said that taxes should increase and more should be spent on “health, education and social benefits”. But just five years later, in 2006, that figure had fallen to 41 per cent, and it has remained at more or less that level ever since. Once again, it is not immediately obvious that there would be marked public pressure in the early years of an independent Scotland for a much bigger role for the state.
Enthusiasm for more ‘tax and spend’ appears to have diminished

British Social Attitudes 31 | Independence referendum
NatCen Social Research
54
Table 3.9 Attitudes towards taxation and spending, 1999–2013
1999 2000 2001 2002 2003 2004 2006 2009 2010 2013
% % % % % % % % % %
Reduce taxes and spend less
3 4 3 3 3 5 6 5 7 6
Keep taxes and spending at the same level as now 38 39 30 32 34 35 45 53 49 48
Increase taxes and spend more 55 54 63 60 58 56 41 37 40 42
Weighted base 1482 1663 1605 1665 1508 1637 1594 1482 1495 1497Unweighted base 1482 1663 1605 1665 1508 1637 1594 1482 1495 1497
Source: Scottish Social Attitudes
Still, what we see here does not necessarily mean that support for the idea of a more equal Scotland – and a belief that independence would help bring that about – is not one of the features of the referendum debate that inclines people to vote in one way rather than the other. Indeed, as Table 3.10 shows, those who think that, as a result of independence, the gap between rich and poor would be smaller, and that there would be more money to spend on public services are more likely to say they will vote Yes than are those of the opposite view.
However, we should remember that very few people (just two per cent of our sample) think that the gap between rich and poor would be “a lot” smaller. On this issue the vast majority of people are in one of the three middle rows, and the difference between the level of Yes support amongst those who think the gap would be a little smaller (53 per cent) and those who think it would be a little bigger (25 per cent) is, at 28 percentage points, much lower than for any of the equivalent responses about economic issues (bar taxes) as seen in Table 3.4. In short, people’s views on whether inequality would or would not be reduced in an independent Scotland make relatively little difference to their chances of being a Yes or a No voter.
True, how much money people think there might be to spend on public services seems to matter rather more, but even here we should note, for example, that at 77 per cent, the level of support for independence amongst those who think that there would be a lot more money to spend is less than the figure of 86 per cent amongst those who think the economy would be a lot better.
Table 3.10 Intention to vote Yes in the referendum, by perceptions of the effect of independence on equality and public services[4]
Perceived effect of independence on
% intending to vote YesGap between rich and poor
Amount of money to spend on public services
A lot smaller/more* 81** 77
A little smaller/more* 53 60
No difference 29 27
A little bigger/less 25 7
A lot bigger/less 9 2
Source: Scottish Social Attitudes*In the case of the gap between rich and poor a positive response is regarded as “smaller”; in the case of money to spend on public services it is “more”**Figures based on just 31 (weighted) cases

British Social Attitudes 31 | Independence referendum
NatCen Social Research
55
Meanwhile, people’s views about specific welfare policies do not seem to distinguish Yes from No voters very well at all. At 33 per cent, the proportion of those who would like more tax and spend who are inclined to vote Yes is only a little higher than the equivalent proportion amongst those who are either content for taxes and spending to remain as they are, or maybe even think they should be reduced (26 per cent). The picture is only a little different when it comes to people’s views about benefits for the unemployed. Just 37 per cent of those who think that these benefits are too low reckon they will vote Yes, a figure not markedly different from the 26 per cent figure for those who think benefits are too high.
However, there is another side to the referendum debate about welfare that we should also address. If Scotland were to become independent, it would mean that benefits such as those for the unemployed and those above retirement age would have to be funded out of tax revenues raised in Scotland. On the other hand, if Scotland remains part of the UK, then so long as responsibility for those is not transferred to the Scottish Parliament, such benefits will continue to be funded out of the UK-wide pool of taxation. Some of those arguing against independence suggest that such an arrangement makes it more likely that Scotland would be able to afford the kinds of benefits that help ensure a more equal society in which people are insured against some of the social risks that occur in everyday life (Scottish Labour Devolution Commission, 2014).
There seems to be not inconsiderable sympathy for that view, as is evident when respondents to Scottish Social Attitudes were asked:
What about the cost of paying benefits to people in Scotland who lose their job through no fault of their own? Regardless of what happens at present, should the money to pay this come from the taxes collected across the UK as a whole, or from those collected in Scotland only?
No less than 58 per cent of people in Scotland believe that the benefits paid to unemployed people in Scotland should be funded out of taxes collected from across the UK as a whole; only 36 per cent reckon they should be financed solely out of revenues raised north of the border. Equally, when asked an equivalent question about the “government old age pension”, as many as 61 per cent said that it should be funded out of UK-wide taxation, while only 34 per cent felt it should be paid for out of Scottish revenues, as can be seen in Table 2.9 of the chapter on Scotland, also by John Curtice. Moreover, these views do appear to be quite strongly related to whether someone is inclined to vote Yes or No (Table 3.11). For example, amongst those who think that pensions should be funded out of UK taxes as a whole, nearly three-quarters (71 per cent) are inclined to vote No, while just one in seven (14 per cent) say they will vote Yes. Conversely, amongst those who think that pensions should be funded out of Scotland’s taxes, just a little under a quarter (24 per cent) are minded to vote No while well over half (58 per cent) state they will vote Yes. The picture is almost exactly the same in respect of unemployment benefit.
People’s views about specific welfare policies do not seem to distinguish Yes from No voters very well at all

British Social Attitudes 31 | Independence referendum
NatCen Social Research
56
Table 3.11 Referendum vote intention, by views on how welfare benefits should be funded
Benefits for unemployed should be funded out of
Old age pension should be funded out of
Referendum vote intention
UK-wide taxes
Scotland only taxes
UK-wide taxes
Scotland only taxes
% % % %
Yes 13 58 14 58
No 71 27 71 24
Undecided 11 13 11 14
Weighted base 873 545 911 508Unweighted base 910 505 946 476
Source: Scottish Social Attitudes
So the second instrumental debate about whether independence would herald a more equal society, underpinned by a social democratic orientation to policy, appears to be less important in voters’ minds than the debate about the possible economic consequences of independence. Relatively few believe that the gap between rich and poor would be smaller in an independent Scotland, while it is far from clear that, in the short term at least, public opinion in Scotland would be pushing for more tax and spend or a more generous welfare system than it has at present. Rather there seems to be an inclination to retain a UK-wide system of funding welfare. Above all, apart from the question of how welfare should be funded, these perceptions and beliefs about equality and welfare seem to be less effective at distinguishing between Yes and No voters than are voters’ views about the economic consequences of leaving the UK. So far as the practical consequences of independence at least are concerned, it would seem that that economics matters more to voters than equality.
Putting it all together
So far we have looked separately at the degree to which people’s sense of identity, their perceptions of the economics of independence, and their views about equality and the welfare state appear to help us to identify who is more or less likely to vote Yes or No. However, it could well be the case that those with a strong sense of Scottish identity are also more likely to think that independence would be beneficial economically and also that it would help to make Scotland a more equal society. This makes it less than straightforward to identify which of these possible considerations does actually matter most to voters. To obtain a clearer picture we need to undertake a multivariate statistical analysis that identifies which of all the possible considerations we have examined in this chapter are most strongly linked to whether people say they are going to vote Yes or No after taking into account the apparent influence of all the other considerations. (See the Technical details chapter for more details on multivariate statistical analysis).
Full details of the results are given in the Appendix.[5] But they are relatively straightforward. Of all of the issues examined in this chapter, the one that is most clearly linked to whether people are inclined to vote Yes rather than No is whether they think that the economy would be better or worse under
There seems to be an inclination to retain a UK-wide system of funding welfare

British Social Attitudes 31 | Independence referendum
NatCen Social Research
57
independence. Also of particular importance seems to be whether people feel that pensions should be funded out of a UK-wide pool or whether people are content for them to be paid for out of Scottish taxes alone. Thereafter two further financial indicators prove to be moderately important – whose economy is thought to benefit more from the Union and whether or not people think they would personally be better off if Scotland were to become independent. National identity does still play some role even when all of these more instrumental considerations are taken into account, indicating that for some if not most voters voting Yes or No is simply a question of affirming their Scottish or British identity. Finally, those who think that unemployment benefits are too low are marginally more likely to back independence. Otherwise the debate about equality does not appear to play much of a role in voters’ minds at all.
So it seems that for most voters the debate about the economic consequences of independence together with their perceptions of how good a deal Scotland gets currently out of the Union appears to be key to the decision they are inclined to take. Few seem willing to vote Yes unless they are convinced that independence would be economically beneficial. At the same time, people’s views about how welfare should be funded in Scotland also play a role, but on the other hand the quest for a more equal society that perhaps enjoys a bigger welfare state has little or no traction. People’s sense of national identity sits there in the background, and indeed for some it is sufficient to account for which way they are inclined to vote, but it appears that is not the case for most voters. They need practical reasons to persuade them to vote one way or the other too.
Conclusions
The debate about Scotland’s future is partly about people’s perceptions about who they feel they are: their sense of national identity. Those who feel a Scottish identity and little, if any, sense of being British are much more likely to say they will vote Yes than are those whose primary sense of belonging is to Britain as a whole. To that extent, it is clear some people in Scotland at least have relatively little affective commitment to the maintenance of the United Kingdom as currently constituted.
However, the debate is not just about identity. Even those who feel strongly Scottish are not universally inclined to vote Yes. Meanwhile many feel a dual sense of identity, that they are both Scottish and British, leaving it far from clear how they might express their sense of belonging in a referendum that would seem to ask them to choose between the two. In these circumstances, it perhaps should not surprise us that the practical consequences of independence are apparently playing an important role in people’s minds when it comes to deciding whether to vote Yes or No. They would seem to need to bring other considerations to bear in order to make their choice one way or another. And of those possible considerations, it appears to be the perceived economic consequences of leaving or staying in the UK that matter most in voters’ minds.
That suggests that whichever way Scotland eventually votes, the outcome will need to be interpreted with caution. Doubtless the victors will be inclined to claim either that Scotland has shown its commitment to the future of the Union, or that it has proven that it wants to govern itself just like any other nation does. The reality is likely to be more prosaic – the outcome will represent voters’ best judgement as to which way prosperity appears to lie. Consequently, if Scotland
Few seem willing to vote Yes unless they are convinced that independence would be economically beneficial
It appears to be the perceived economic consequences of leaving or staying in the UK that matter most in voters’ minds

British Social Attitudes 31 | Independence referendum
NatCen Social Research
58
votes Yes and independence proves to be economically disadvantageous, many a voter may well come to regret their decision. But equally if Scotland votes No, it will have signalled that it is willing to stay in the Union in the expectation that the United Kingdom will look after and promote its material interests; the future cohesion of the Union will then depend on whether that expectation is fulfilled.
Notes1. Much the same pattern of response was obtained when three of the four questions
(on the economy, the standard of living and taxes) were previously asked on the 2011 and 2012 surveys.
2. Bases for Table 3.4 are as follows:
Weighted bases
Perceived effect of independence on
% intending to vote YesScotland’s
economyLiving
standardsPersonal finances Taxes
A lot better/higher/lower* 74 66 27 –
A little better/higher/lower* 323 293 106 (78)
No difference 349 488 782 393
A little worse/lower/higher 295 274 271 532
A lot worse/lower/higher 131 96 158 217
Unweighted bases
Perceived effect of independence on
% intending to vote YesScotland’s
economyLiving
standardsPersonal finances Taxes
A lot better/higher/lower* 65 58 26 –
A little better/higher/lower* 322 305 108 (63)
No difference 357 485 767 401
A little worse/lower/higher 291 271 270 515
A lot worse/lower/higher 132 98 170 243
3. The picture was much the same when the question was also asked in 2012: then 47 per cent said it would not make any difference, 25 per cent that the gap would be
bigger and just 19 per cent that it would be smaller.
4. Bases for Table 3.10 are as follows:
Weighted bases
Perceived effect of independence on
% intending to vote YesGap between rich and poor
Amount of money to spend on public services
A lot smaller/more* 31 71
A little smaller/more* 193 361
No difference 660 376
A little bigger/less 228 275
A lot bigger/less 107 137

British Social Attitudes 31 | Independence referendum
NatCen Social Research
59
Unweighted bases
Perceived effect of independence on
% intending to vote YesGap between rich and poor
Amount of money to spend on public services
A lot smaller/more* 26 70
A little smaller/more* 182 335
No difference 637 392
A little bigger/less 252 278
A lot bigger/less 1015 140
5. Note that neither sex, age or social class proved to be significant independently of the considerations that were included in the model. So the gender, age and class differences identified earlier in the chapter simply reflect differences between these groups in the incidence of identity and/or perceptions of the consequences of independence.
ReferencesColley, L. (2005), Britons: Forging the Nation 1707–1837, New Haven, Conn.: Yale University Press
Curtice, J. (2013), Who Supports and Opposes Independence – and Why?, Edinburgh: ScotCen Social Research, available at: www.scotcen.org.uk/media/176046/2012-who-supports-and-opposes-independence-and-why.pdf
Curtice, J. and Ormston, R. (2011), ‘So who is winning the debate? Constitutional preferences in Scotland after four years of Nationalist rule’, Scottish Affairs, 74: 24–44
Devine, T. (2006), The Scottish Nation 1700 to 2000, London: Penguin
Gellner, E. (1983), Nations and Nationalism, Ithaca, NY: Cornell University Press
Hechter, M. (2000), Containing Nationalism, Oxford: Oxford University Press
Lynch, P. (2013), SNP: The History of the Scottish National Party, Cardiff: Welsh Academic Press
Moreno, L. (1988), ‘Scotland and Catalonia: The path to home rule’, in McCrone D. and Brown A. (eds.) The Scottish Government Yearbook 1988, Edinburgh: Unit for the Study of Government in Scotland
Ormston, R. (2013), Why Don’t More Women Support Independence?, Edinburgh: ScotCen Social Research, available at: www.scotcen.org.uk/media/176043/gender-and-indep-paper-final-2012.pdf
Salmond, A. (2006), Speech to SNP Conference, 13 October 2006, available at: www.scotsindependent.org/features/alex_salmond_perth_06.htm
Salmond, A. (2007), Speech to SNP Conference, 18 March 2007, available at: www.scotsindependent.org/features/alex_salmond_glasgow_07.htm
Scottish Government (2012), Agreement between the United Kingdom Government and the Scottish Government on a referendum on independence for Scotland, available at: www.scotland.gov.uk/About/Government/concordats/Referendum-on-independence
Scottish Government (2013), Scotland’s Future: Your Guide to an independent Scotland, Edinburgh: Scottish Government

British Social Attitudes 31 | Independence referendum
NatCen Social Research
60
Scottish Labour Devolution Commission (2014), Powers for a Purpose – Strengthening Accountability and Empowering People, Glasgow: Scottish Labour Party, available at: www.scottishlabour.org.uk/campaigns/entry/devolution-commission
Sorens, J. (2005), ‘The Cross-Sectional Determinants of Secessionism in Advanced Democracies’, Comparative Political Studies, 38: 304–26
AcknowledgementsThe research reported in this chapter was funded by the Economic and Social Research Council as part of its research initiative on The Future of the UK and Scotland (ES/K007149/1 to NatCen and ES/K006460/1 to AqMen). The author would like to acknowledge the advice and support of fellow participants in that research, Jan Eichhorn, Rachel Ormston and Lindsay Paterson as well as of the Scottish Social Attitudes teams. Responsibility for the views expressed here lies solely with the author.
Appendix The following table shows the results of a logistic regression analysis of whether people are inclined to vote Yes rather than No in the referendum. All variables examined in the chapter were available for inclusion in the model, but only those that were statistically significant at the 5% level are actually included. People’s age, sex and social class were also available for inclusion but none proved to be independently significant after taking account of the variables that are included in the model. People’s views of the economic consequences of independence, its implications for their personal finance and their Moreno national identity were all regarded as interval level variables, with “don’t know” responses assigned to the middle category. Other variables were regarded as categorical variables and each coefficient measures the impact of being in that category as opposed to the one shown in brackets.
Table A.1 Logistic regression of referendum vote intention
Coefficient Standard error Wald score p value
Economy better under independence 1.23 .14 76.8 .00
Pensions paid from (Scottish taxes)
UK taxes -2.00 .23 78.8 .00
Depends -0.88 .51 2.9 .09
Economy benefits from Union (equal)
England’s 1.53 .24 42.0 .00
Scotland’s -0.60 .35 3.0 .09
Personal finances better under independence 1.21 .22 30.4 .00
Scottish rather than British identity 0.54 .12 21.8 .00
Unemployment benefits (too low)
Too high -0.71 .25 8.0 .01
Neither etc. -0.77 .33 5.6 .02
Nagelkerke R-squared = 73% Sample size = 1067

British Social Attitudes 31 | National identity
NatCen Social Research
61
National identity Exploring BritishnessThe chapter explores how people think about ‘Britishness’ and the importance of factors such as languge, ancestry and residence. Do you have to be born British, or can Britishness be aquired over time? It starts by considering whether views on these issues have changed since 1995, when the survey first covered this topic. It then examines whether the way people think about British identity relates to their wider views about how Britain should interact with the outside world, focusing on attitudes to immigration, trade and the European Union.
What makes a person ‘truly British’?The most common view is that a mixture of ‘civic’ factors (which can be acquired over time – for example, speaking English) and ‘ethnic’ ones (which are largely determined early on in life – for example, being born in Britain) shape whether someone can be considered British. The majority (63%) think both matter, while 31% think that only civic factors are important.
Britain and the rest of the worldThe way people think about Britishness is strongly linked to the way they think about Britain’s relationship with the rest of the world.
In a number of cases the threshold to being considered British has got higher. A near unanimous 95% think that being able to speak English is important for being ‘truly British’, up from 85% in 1995.
1995 19952013 2013
24% think being Christian is important, down from 32% in 1995, no doubt reflecting the decline in religious faith in Britain since 1995.
95%85%24%32%
Of those who see Britishness as determined by both ethnic and civic factors, 25% take a very ‘Britain-focused’ view about how the country should deal with international organisations and foreign trade. This compares with 4% of those who think civic factors alone determine whether someone is British.
36% of people who emphasise ethnic and civic factors are very Eurosceptic, compared with 15% of those who think it is civic factors alone that make a person British.
25%
4%
BRITISHNESS DEFINED AS ETHNIC AND CIVIC
BRITISHNESS DEFINED AS CIVIC
36%
15%
BRITISHNESS DEFINED AS ETHNIC AND CIVIC
BRITISHNESS DEFINED AS CIVIC
WHO HAS THE MOST BRITAIN-FOCUSED VIEW? WHO HAS THE MOST EUROSCEPTIC VIEW?

British Social Attitudes 31 | National identity
NatCen Social Research
62
Introduction
Earlier this year NatCen released initial findings from the 2013 British Social Attitudes survey that showed a decline in people’s pride in being British, with a particular fall in the proportion who say they are “very proud”, from 43 per cent in 2003 to 35 per cent now (Young, 2014). This change has taken place across much of British society and it is only those who were the most fiercely proud in 2003, the over 65s and the least well educated, whose views remain unchanged. In this chapter we develop this discussion by focusing on the very concept of ‘Britishness’ and what people think it means. Is it a question of language, ancestry or residence? Do you have to be born British, or can Britishness be acquired over time?
We last tackled this issue in our 21st Report which included a chapter about British national identity, based on findings from the 2003 survey (Tilley et al., 2004). The authors examined whether it was helpful to classify people in Britain according to whether they saw national identity as being based on ‘civic’ factors (such as residence or citizenship) or ‘ethnic’ ones (such as ancestry). They found that people’s views fell into different camps, but that the largest group was those who think both ethnic and civic factors matter when thinking about whether a person can be considered “truly British”.
Of course, much has changed since 2003. We might expect views about Britishness to have been affected by events as diverse as the Iraq war, the 2012 Olympics, immigration from Eastern Europe (following the accession of eight countries to the EU in 2004), the global financial crisis that began in 2007 and debates about increasing foreign ownership of previously British organisations and assets (for example, the takeover bid by Pfizer for UK drugs firm AstraZeneca).
So, ten years later, this chapter starts by revisiting how Britain thinks about national identity and how this has changed since 2003. It then investigates attitudes to immigration and Britain’s relationship both with the outside world in general, and with the EU in particular, to see how these issues relate to the way we think about what it means to be British. To do this we use data from a set of questions developed as part of the International Social Survey Programme (ISSP) and included on the British Social Attitudes surveys in 1995, 2003 and 2013.
The concept of national identity
There are two widely accepted conceptions of nationality: ‘ethnic’ and ‘civic’, both of which are linked to the development of nations and states in Europe. The civic conception of nationalism helps explain the development of nations in states that had already emerged as political and geographical units (for example, France). As such, the nation was defined as the totality of people living within the boundaries of that state and abiding by its laws. This is why in the French conception of nationalism the words ‘nationality’ and ‘citizenship’ denote the same thing: belonging to the French state. Indeed, in the civic conception of nationalism, the nation and the citizenry are one and the same, which is why such states are often referred to as nation states. Consequently, when we think of national identity in civic terms, we think of an inclusive form of identity: a person associates themselves with the citizenry and the political
There are two widely accepted conceptions of nationality: ‘ethnic’ and ‘civic’
Authors
Zsolt Kiss and Alison ParkZsolt Kiss is a Resarch Director at NatCen Social Research. Alison Park is Director of the Society and Social Change group at NatCen Social Research and Co-Director of the British Social Attitudes survey series

British Social Attitudes 31 | National identity
NatCen Social Research
63
and legal institutions of the state. His or her identity is defined by attachment to the state as embodied by its institutions and rules and not by traditions, language or religion. Conversely, when we think of ethnic nationalism, traditions, language, religion and ancestry are precisely the things that matter. As opposed to the civic nation, the ethnic conception of nationalism came into existence in Germany and Eastern Europe as a response of communities in highly fragmented societies (such as the Austro-Hungarian empire) searching to define themselves. While civic nationalism emerged after, and as a response to, the emergence of a physical state, ethnic nationalism emerged and solidified culturally distinct communities who were looking to form their own state. This is why in nation states where the ethnic conception of nationalism dominates there is a clear distinction between citizenship and nationality. Citizenship denotes a person’s legal status vis-à-vis the state; nationality denotes his or her intrinsic identity. Ethnic national identity is characterised by an attachment to one’s ancestry, tradition, culture and language – and not necessarily to the state a person was born and lives in. This is why an ethnic national identity is exclusive: if you are not born into it, you cannot acquire it (Ignatieff, 1995).
This discussion assumes a very clear distinction between the two types of national identity. While this is accurate in certain circumstance and some states neatly fit into one or other category (for example, France and Germany), the picture in the UK is more complicated. Tilley et al., (2004) cite Cohen (1994) who describes Britishness as being a ‘fuzzy’ concept that cannot be readily placed into either of these two buckets. As such, they propose a matrix within which these two types of national identity intersect with one another, producing four possible types of national identity. This is illustrated in Figure 4.1. Their analysis of the 1995 and 2003 ISSP data suggests that most people in Britain think of national identity in a way which combines both ethnic and civic dimensions.
Figure 4.1 The two dimensions of national identity
When we think of ethnic nationalism, traditions, language, religion and ancestry are precisely the things that matter
Ethnic national identity
Both ethnic and civic national
identity
Neither civic nor ethnic national
identity
Civic national identity
High ethnic identity
Low ethnic identity
Low civic identity High civic identity

British Social Attitudes 31 | National identity
NatCen Social Research
64
Defining British identity
We assessed how people think of national identity by asking the following questions as part of the 1995, 2003 and 2013 British Social Attitudes surveys:
Some people say that the following things are important for being truly British. Others say that they are not important. How important do you think each of the following is?
To have been born in BritainTo have British citizenshipTo have lived in Britain for most of one’s lifeTo be able to speak EnglishTo be a ChristianTo respect Britain’s political institutions and lawsTo feel BritishTo have British ancestry
We asked an additional question to assess the extent to which shared customs and traditions matter:
Now we would like to ask a few questions about minority groups in Britain. How much do you agree or disagree with the following statement? It is impossible for people who do not share Britain’s customs and traditions to become fully British
Table 4.1 shows the results. Of the nine attributes we asked about, six are seen as “very” or “fairly” important by around three-quarters of people or more. The most important factor is being able to speak English (which 95 per cent think is important), followed by having British citizenship and respecting Britain’s political institutions and laws (both 85 per cent). Around three-quarters think being born in Britain is important, but only half that having British ancestry matters. It is notable that only a quarter think that being Christian is important for being “truly British”.
If we look at the data from a historical perspective, it is clear that, despite little change between 1995 and 2003, there have been some major shifts since then. In particular, the perceived importance of being able to speak English has increased by nearly ten percentage points. There has also been an increase in the proportion who think it important that someone has lived for most of their life in Britain, up from 69 per cent in 2003 to 77 per cent now.
95% think being able to speak English is important for being “truly British”

British Social Attitudes 31 | National identity
NatCen Social Research
65
Table 4.1 Importance of different attributes for being “truly British”, 1995–2013
% saying “very important” or “fairly important” 1995 2003 2013
Change: 1995 to 2003
Change: 2003 to 2013
Ability to speak English 85 86 95 1 pp 9 pp
Having British citizenship 83 83 85 0 pp 2 pp
Respecting institutions/laws 82 82 85 0 pp 3 pp
Feel British 73 74 78 1 pp 5 pp
Live life in Britain 71 69 77 -2 pp 8 pp
Been born in Britain 76 70 74 -6 pp 4 pp
Have British ancestry n/a 46 51 n/a 5 pp
Sharing customs/traditions* 50 52 50 2 pp -2 pp
Be a Christian 32 31 24 -1 pp -7 pp
Weighted base 1079 881 894Unweighted base 1058 873 904
* For this question the table shows the per cent who “strongly agree” or “agree”
To understand how these results correspond to the two identity dimensions we mentioned earlier (ethnic versus civic) we used a technique called factor analysis (for more information about factor analysis please see the Technical details chapter). The results of this analysis are provided in the Appendix to this chapter and show that responses to the questions in Table 4.1 do indeed divide into two different dimensions, which correspond well with the differences between ethnic and civic conceptions of national identity. These are shown in Table 4.2.
Table 4.2 National and civic dimensions of being British
Ethnic dimension Civic dimension
To have been born in Britain To have British citizenship
To have lived in Britain for most of one’s life To be able to speak English
To be a Christian To respect Britain’s political institutions and laws
To have British ancestry
To share customs and traditions
We then calculated an ethnic identity score and a civic identity score for each respondent, based on how they had answered these questions.[1] In each case, the closer the score is to 5, the more weight that person puts on the relevant dimension of national identity, and the closer it is to 0, the less weight. The results, presented in Table 4.3, show that the vast majority of Britons do not see whether or not someone is “truly British” as being down to solely civic or ethnic criteria – instead, many see both as playing a role. Those in this category can be found in the bottom right hand quadrant of Table 4.3. Another, smaller, group have an entirely civic view of national identity (they are in the top right hand quadrant). Almost nobody has an entirely ethnic view (bottom left hand quadrant). Finally, there is also evidence of a group whose views about national identity have neither an ethnic nor a civic component (top left hand quadrant).

British Social Attitudes 31 | National identity
NatCen Social Research
66
Table 4.3 Distribution of scores (%) on the ethnic and civic national identity scales
Civic national identity
2 or less 2.01–3 3.01–4 4.01–5
Ethnic national identity
2 or less * 3 4 5
2.01–3 * 2 8 17
3.01–4 0 * 8 27
4.01–5 0 0 3 21
Base: 868
* = less than 1%
These results are summarised in Table 4.4. It shows that the majority of people (nearly two thirds) attach importance to both ethnic and civic aspects of national identity while about one third tend to think of national identity only in civic terms. Six per cent do not appear to think of national identity in either ethnic or civic terms. Comparing these findings with those from earlier years shows considerable continuity, although there is the hint of a small increase in the proportion of the population with a civic notion of national identity, from 23 per cent in 1995 to 34 per cent in 2003 and 31 per cent in 2013.[2] There has also been a small change in the proportion who think that both civic and ethnic aspects of national identity matter: after a 4 percentage point dip between 1995 and 2003, by 2013 this proportion had returned to its 1995 level of 63 per cent.
Table 4.4 Distribution of conceptions of national identity, 1995, 2003 and 2013
1995 2003 20132003 and 2013
combined
% % % %
Civic and ethnic 63 59 63 61
Only civic 23 34 31 32
Neither civic nor ethnic 13 7 6 7
Weighted base – 807 863 1670Unweighted base 961 791 868 1659
Results for 1995 are taken from Tilley et al., (2004)
Of course, these overall findings are likely to mask considerable differences between particular groups. An obvious starting point here is age; we know from earlier work that there are clear age differences in national pride, with younger groups being less likely than older ones to express pride in being British (Young, 2014). We explore this in Table 4.5. However, rather than focusing on age, we examine the views of specific generations as there are strong reasons to suspect that their different experiences during their formative years (particularly in terms of their exposure to war and conflict) will have had an impact on the way they think about Britain and British identity.
To do this we pooled together our 2003 and 2013 findings (to increase the sample size available for analysis) and then allocated people into one of three different generational groups: those born before 1945; those born between 1945 and 1964; and those born after 1964. The results show that there are
The majority of people attach importance to both ethnic and civic aspects of national identity

British Social Attitudes 31 | National identity
NatCen Social Research
67
indeed considerable generational differences; nearly nine in ten of the pre-1945 generation have a civic and ethnic view of British national identity, but the same is only true of six in ten of those born between 1945 and 1964, falling to five in ten among the youngest generation. Conversely, while 40 per cent of those born after 1964 have a view of British national identity based only on civic factors, this is true of just 13 per cent of those born before 1945.
Table 4.5 Distribution of conceptions of national identity, by generation, 2003 and 2013
Born pre-1945 Born 1945–1964 Born post-1964
% % %
Civic and ethnic 86 61 50
Only civic 13 33 40
Neither civic nor ethnic 2 5 10
Weighted base 341 591 737Unweighted base 408 588 663
These findings suggest that, over time, the importance attached to ascribed ethnic factors in thinking about national identity may well decline, as older generations die out and are replaced by generations who are less likely to think of Britishness as dependent on factors such as birth, ancestry and sharing customs and traditions.
National identity and attitudes to immigration
Since our last detailed look at this topic, immigration has become an issue of huge public concern. As Rob Ford and Anthony Heath discuss in the Immigration chapter, widespread public anxieties about migration levels and the impact of new arrivals in Britain mean that a large majority would like to see immigration levels reduced. Might immigration explain some of the changes we have found in what people think matters when it comes to being British, and particularly the rise in the importance attached to being able to speak English?
In this section we examine how people’s views about immigration relate to the way they think and feel about national identity. We do this by focusing on a set of questions about immigration, which we introduce to respondents as follows:
There are different opinions about immigrants from other countries living in Britain. (By ‘immigrants’ we mean people who come to settle in Britain). How much do you agree or disagree with each of the following statements?
Table 4.6 shows the precise question wording of each statement. The findings are mixed and show that opinions on immigration have shifted in both a positive and negative direction over the last ten years. However, the largest change is in a negative direction and relates to people’s attitude towards whether legal immigrants should have the same rights as British citizens. In 2013 only 27 per cent of people agree with this statement, down from 40 per cent in 2003.
40% of those born after 1964 have a view of British national identity based only on civic factors

British Social Attitudes 31 | National identity
NatCen Social Research
68
Table 4.6 Attitudes towards immigration, 2003–2013
% agree that 2003 2013Change:
2003 to 2013
Immigrants increase crime rates 37 43 6 pp
Immigrants are generally good for Britain’s economy 21 32 11 pp
Immigrants take jobs away from people who were born in Britain 43 50 7 pp
Immigrants improve British society by bringing new ideas and cultures 33 40 7 pp
Legal immigrants to Britain who are not citizens should have the same rights as British citizens 40 27 -13 pp
Britain should take stronger measures to exclude illegal immigrants 80 82 2 pp
Weighted base 881 894Unweighted base 873 904
To help our analysis we created a summary measure of attitudes towards immigration for each respondent, based on their responses to the questions in Table 4.6.[3] The results are shown in Table 4.7 and confirm there is a clear relationship between a person’s stance on immigration and what they think matters when it comes to determining whether someone is “truly British”. In general, those who think national identity has at least some ethnic element are more likely to be opposed to immigration; a third (34 per cent) fall into the most anti-immigration category, compared with just 7 per cent of those whose view of national identity emphasizes civic factors alone.
Table 4.7 Attitudes towards immigration, by attitudes towards national identity, 2003–2013
Ethnic and civic Only civic Neither All
% % % % % % % %
2003 2013 2003 2013 2003 2013 2003 2013
Most anti-immigration 30 34 7 7 12 10 21 24
| 57 54 42 37 46 44 51 48
|| 13 12 45 52 39 40 25 26
Most pro-immigration * 1 6 4 2 6 2 2
Weighted base 430 508 243 246 49 49 722 802Unweighted base 438 542 219 224 48 43 705 809
* = less than 1%.
To tease out the relationship between views about immigration and national identity we carried out multivariate logistic regression to identify the factors that are significantly associated with whether someone has an ethic and civic view of national identity (as opposed to one that has no ethnic element at all). We included a large set of other variables in our model, including age, sex, education, occupation, religion, country and parental citizenship, as well as respondents’ underlying libertarian-authoritarian, left-right economic values and whether they think that ‘feeling British’ is an important factor in being British. Further details of this technique can be found in the Technical details
Those who think national identity has at least some ethnic element are more likely to be opposed to immigration

British Social Attitudes 31 | National identity
NatCen Social Research
69
section of the report, and the full results of our analysis are shown in the Appendix to this chapter. The findings confirm that a person’s views about immigration are significantly related to whether they see British national identity as having an ethnic as well as a civic component. A number of other factors also matter. As we would expect from our earlier generational analysis, older people, the less educated and those who identify with the Church of England are more likely to have an ethnic and civic view of national identity. So too are workers in clerical, routine non-manual jobs or in working class occupations when compared to those in professional and managerial jobs (the ‘salariat’). Those who think that “feeling British” is an important aspect of “being truly British” are also more likely to see national identity in ethnic and civic terms. Finally, there is also an association between having an authoritarian mindset (as opposed to a libertarian one) and thinking of national identity in ethnic terms. Unsurprisingly, people whose parents were not UK citizens are less likely to think of national identity in ethnic terms.
In the previous section we showed that the most common view is that “being truly British” has both an ethnic and a civic component. We have now seen that people’s attitudes towards immigration are associated with the way they think about national identity, even when factors such as age and class are taken into account. Table 4.8 develops this further by looking at how views about Britishness have changed among groups with different views about immigration. Because of the small sample sizes at the pro-immigration end of our scale, here we focus on three groups only: the quarter (24 per cent in 2013) who are most opposed to immigration; the half (48 per cent in 2013) who are less opposed but sceptical about immigration; and the remaining quarter (28 per cent) who adopt a more pro-immigration view. The table shows that the increase in the proportion of people who see national identity as comprising both ethnic and civic elements is confined to those who are opposed to immigration – up from 84 per cent to 89 per cent among those with the most anti-immigration views and from 66 per cent to 71 per cent among the half of the population who are moderately opposed to immigration. There has been no statistically significant change among those who are more pro-immigration, a group who are far less likely to think that ethnic characteristics matter when it comes to whether or not someone is “truly British”.
Table 4.8 Attitudes towards national identity, by attitudes towards immigration, 2003–2013
Most anti-
immigrationAnti-
immigrationImmigration
friendly Total
% % % % % % % %
2003 2013 2003 2013 2003 2013 2003 2013
Ethnic and civic identity 84 89 66 71 29 29 60 63
Civic only identity 12 9 28 24 61 61 34 31
Neither ethnic nor civic identity 4 2 6 6 10 10 7 6
Weighted base 151 193 370 384 201 225 722 802Unweighted base 154 204 361 397 190 208 705 809
What can we take from these findings? They certainly show that views about immigration are closely associated with how people think about what it means to be British. But they also suggest that changing views about what it is to
The increase in the proportion of people who see national identity as comprising both ethnic and civic elements is confined to those who are opposed to immigration
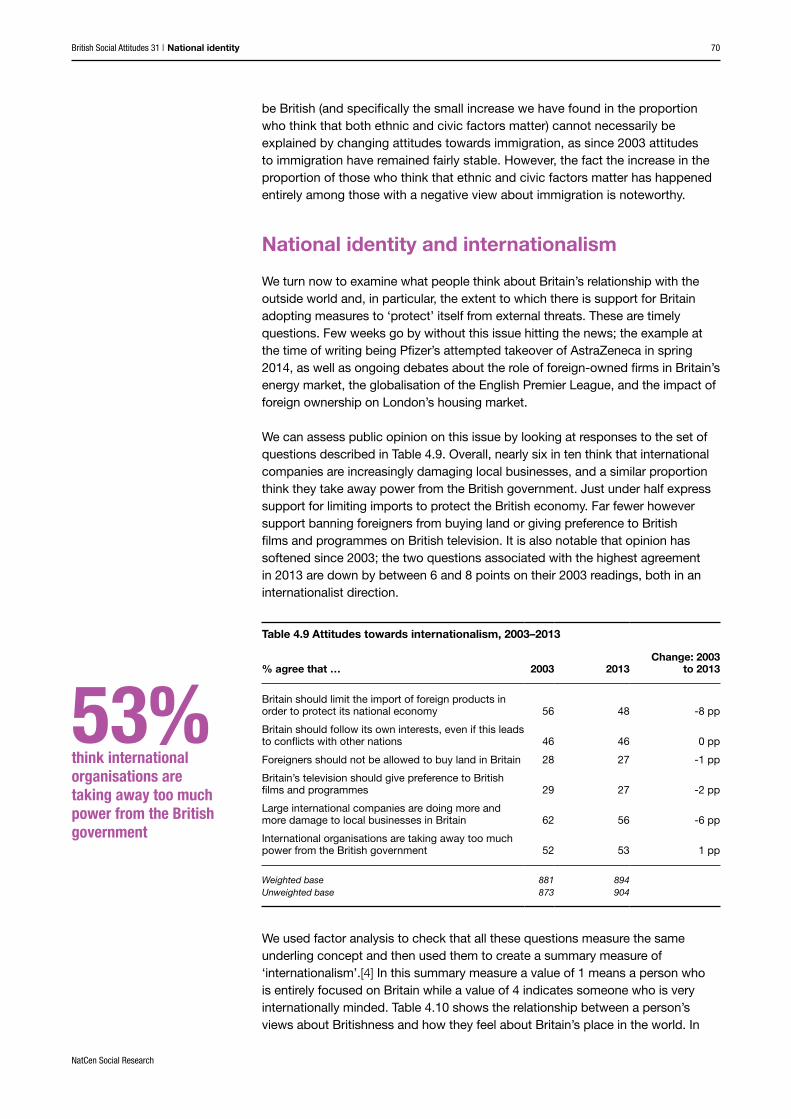
British Social Attitudes 31 | National identity
NatCen Social Research
70
be British (and specifically the small increase we have found in the proportion who think that both ethnic and civic factors matter) cannot necessarily be explained by changing attitudes towards immigration, as since 2003 attitudes to immigration have remained fairly stable. However, the fact the increase in the proportion of those who think that ethnic and civic factors matter has happened entirely among those with a negative view about immigration is noteworthy.
National identity and internationalism
We turn now to examine what people think about Britain’s relationship with the outside world and, in particular, the extent to which there is support for Britain adopting measures to ‘protect’ itself from external threats. These are timely questions. Few weeks go by without this issue hitting the news; the example at the time of writing being Pfizer’s attempted takeover of AstraZeneca in spring 2014, as well as ongoing debates about the role of foreign-owned firms in Britain’s energy market, the globalisation of the English Premier League, and the impact of foreign ownership on London’s housing market.
We can assess public opinion on this issue by looking at responses to the set of questions described in Table 4.9. Overall, nearly six in ten think that international companies are increasingly damaging local businesses, and a similar proportion think they take away power from the British government. Just under half express support for limiting imports to protect the British economy. Far fewer however support banning foreigners from buying land or giving preference to British films and programmes on British television. It is also notable that opinion has softened since 2003; the two questions associated with the highest agreement in 2013 are down by between 6 and 8 points on their 2003 readings, both in an internationalist direction.
Table 4.9 Attitudes towards internationalism, 2003–2013
% agree that … 2003 2013Change: 2003
to 2013
Britain should limit the import of foreign products in order to protect its national economy 56 48 -8 pp
Britain should follow its own interests, even if this leads to conflicts with other nations 46 46 0 pp
Foreigners should not be allowed to buy land in Britain 28 27 -1 pp
Britain’s television should give preference to British films and programmes 29 27 -2 pp
Large international companies are doing more and more damage to local businesses in Britain 62 56 -6 pp
International organisations are taking away too much power from the British government 52 53 1 pp
Weighted base 881 894Unweighted base 873 904
We used factor analysis to check that all these questions measure the same underling concept and then used them to create a summary measure of ‘internationalism’.[4] In this summary measure a value of 1 means a person who is entirely focused on Britain while a value of 4 indicates someone who is very internationally minded. Table 4.10 shows the relationship between a person’s views about Britishness and how they feel about Britain’s place in the world. In
53% think international organisations are taking away too much power from the British government

British Social Attitudes 31 | National identity
NatCen Social Research
71
2013, but also in 2003, we see that those who think ethnic elements matter when it comes to British national identity are by far the most likely to be Britain-focused in their outlook on the world; 25 per cent fall into this category, compared with just 4 per cent of those who have a civic view of national identity.
Table 4.10 Attitudes towards internationalism, by attitudes towards national identity, 2003–2013
Ethnic and civic Only civic Neither All
% % % % % % % %
2003 2013 2003 2013 2003 2013 2003 2013
More Britain-focused 30 25 8 4 3 5 21 18
| 56 60 49 44 46 48 53 55
|| 13 15 39 47 44 43 24 26
More internationally minded * * 5 5 7 4 2 2
Weighted base 414 496 232 219 50 45 696 761Unweighted base 417 531 211 207 48 39 676 777
* = less than 1%
To look at these relationships in more depth we, once again, relied on multivariate regression analysis and tried to identify the key predictors of a person’s view about internationalism. The results are presented in the Appendix to this chapter and show that while controlling for all other characteristics, people whose view of national identity is entirely civic are considerably more likely to be internationally oriented than those who take an ethnic and civic view of identity.[5] The regression also shows that, while controlling for a range of other factors (including identity), those who think that “feeling British” is important for “being truly British” are less likely to be internationally minded. Internationalism also increases with the level of education received.
National identity and the EU
Perhaps the most relevant current example of internationalism relates to people’s openness towards the EU. In the previous section we saw that those with an ethnic component to their sense of British identity are less international in their outlook; what do this group make of Europe? We assess this by using responses to the three following questions:
Generally speaking, would you say that Britain benefits or does not benefit from being a member of the European Union?
Britain should follow European Union decisions, even if it does not agree with them?
Generally, do you think that the European Union should have ... much more, more, as much, less, or much less power than the national governments of its member states?
Overall just one in five (21 per cent) think that Britain “greatly” or “largely” benefits from EU membership, while 15 per cent think Britain should follow all EU decisions. Only six per cent think that the EU should have more power than
People whose view of national identity is entirely civic are considerably more likely to be internationally orientated

British Social Attitudes 31 | National identity
NatCen Social Research
72
the national governments of its member states. Factor analysis shows the three questions reliably measure the same underlying concept, so we used them to create a summary scale with, at one end, what we will call the ‘Eurosceptics’ and, at the other, the ‘Europhiles’.[6] The results are shown in Table 4.11, which shows that those who think of national identity in ethnic and civic terms are twice as likely as those who see it in civic only terms to be at the most Eurosceptic end of the scale (36 and 15 per cent respectively).
Table 4.11 Attitudes towards the EU, by attitudes towards national identity, 2013
Ethnic and civic Only civic Neither Total
% % % %
Europhile * 5 14 3
| 15 39 34 24
|| 48 39 35 44
Eurosceptic 36 15 16 29
Weighted base 387 210 35 633Unweighted base 416 187 31 634
* = less than 1%
We also carried out regression to check whether these findings hold true once other factors such as age and education are taken into account. The results are presented in the Appendix and confirm that a person’s views about national identity are associated with their views about Europe, in the direction suggested by Table 4.11. Those who see British national identity in solely civic terms are far less likely to be Eurosceptics than those who see identity as having both ethnic and civic components. Once more the results also show that Euroscepticism is less likely among those with higher levels of education.
Conclusions
This chapter set out to examine how British identity is constructed and what relationships exist between the way someone thinks about identity and their attitudes towards the world beyond the UK’s borders. We began by showing that people can be divided into three different groups when it comes to what they think makes a person “truly British”. First, there are those who see being British as depending on both civic and ethnic considerations. For this group, being British is dependent on attributes one can achieve (such as speaking English) as well as on those which are largely ascribed (such as being born in Britain). This group is by far the largest, accounting for nearly two thirds (63 per cent) of the population. Second, we have a considerably smaller group (31 per cent) who think of British identity only in terms of civic factors and do not see ethnic ones as important. Finally, there is a very small group (six per cent) who seemingly do not see identity as either depending on ethnic or civic considerations.
The relative size of these groups has not changed markedly since the mid-1990s. However, there have been two small shifts; an increase since 1995 in the proportion of people who take a ‘civic only’ view of British national identity, and a small rise since 2003 in the proportion who think that both civic and ethnic factors matter. These two changes are likely to be shaped by quite different pressures. The first is likely to reflect, at least partly, the fact that younger generations are more
Those who see British national identity in solely civic terms are far less likely to be Eurosceptics

British Social Attitudes 31 | National identity
NatCen Social Research
73
likely than older ones to hold a civic view of Britishness. Younger generations are less likely than their elders to think that ascribed factors such as being born in Britain, being Christian or having British ancestry matter in determining whether or not someone is ‘really’ British. Consequently, as older generations die out, we would expect to see a gradual increase in the proportion of people who think that only civic, and not ethnic, factors matter. By contrast, the increase since 2003 in the proportion who think that civic and ethnic factors matter is likely to reflect some of the key events of the last decade; the fact that this increase has only occurred among those with negative views about immigration hints that the two might be linked. Changing patterns of immigration may also help explain the considerable increase in the proportion of people who think that speaking English is an important determining factor in whether or not someone can be considered “truly British” (95 per cent see this as an important factor).
Perhaps not surprisingly, the way people think about Britishness is strongly linked to the way they think about Britain’s relationship with the rest of the world. Those who think that both ethnic and civic factors determine whether someone is British are far more likely than others to want Britain to ‘protect’ itself from international trade, are more opposed to immigration, and would like to see Britain have fewer ties with the European Union. It is not possible to be clear about the causal link that underpins this relationship, but it is clear that the way people think about who ‘really’ belongs within modern Britain is closely linked to the way they think about Britain’s place in the world and their views about how open it should be to external influences. How this will change over time is not clear. As is the case in the Immigration chapter, by Rob Ford and Anthony Heath, this is another area characterised by a tension between the longer term trends that we might expect to see as a result of gradual generational change, and more unpredictable and shorter term responses to political and social events. Given the success of UKIP in the European elections in June, this tension looks likely to remain for some time.
Notes1. To obtain each score we added up (summed) the values of the respective variables
and then divided the resulting number by the number of questions, to produce a scale from 1 to 5.
2. Caution should be taken when comparing the 1995 results with those for subsequent years as the construction of the national identity variable in that year was slightly different to the formulation used in 2003 and 2013. Specifically, it did not include “being Christian” but did include “feeling British”.
3. The scaled variable was obtained by adding up (summing) the values of the six questions for each respondent, having first reversed the order of the second and fourth questions in Table 4.6 so that for each question agreement indicated an anti-immigration position. The results were divided by 6 to obtain a scale which varies between 1 and 5.
4. The summary variable was computed in the same way as is described in note 3 above.
5. Intriguingly, those whose conception of national identity is neither civic nor ethnic are even more likely to be internationally minded, supporting the conclusion that it is indeed seeing the ethnic component of Britishness as important that is more closely linked to being British-focused.
6. The summary variable was computed in the same way as is described in note 3 above.
As older generations die out, we would expect to see a gradual increase in the proportion of people who think that only civic, and not ethnic, factors matter
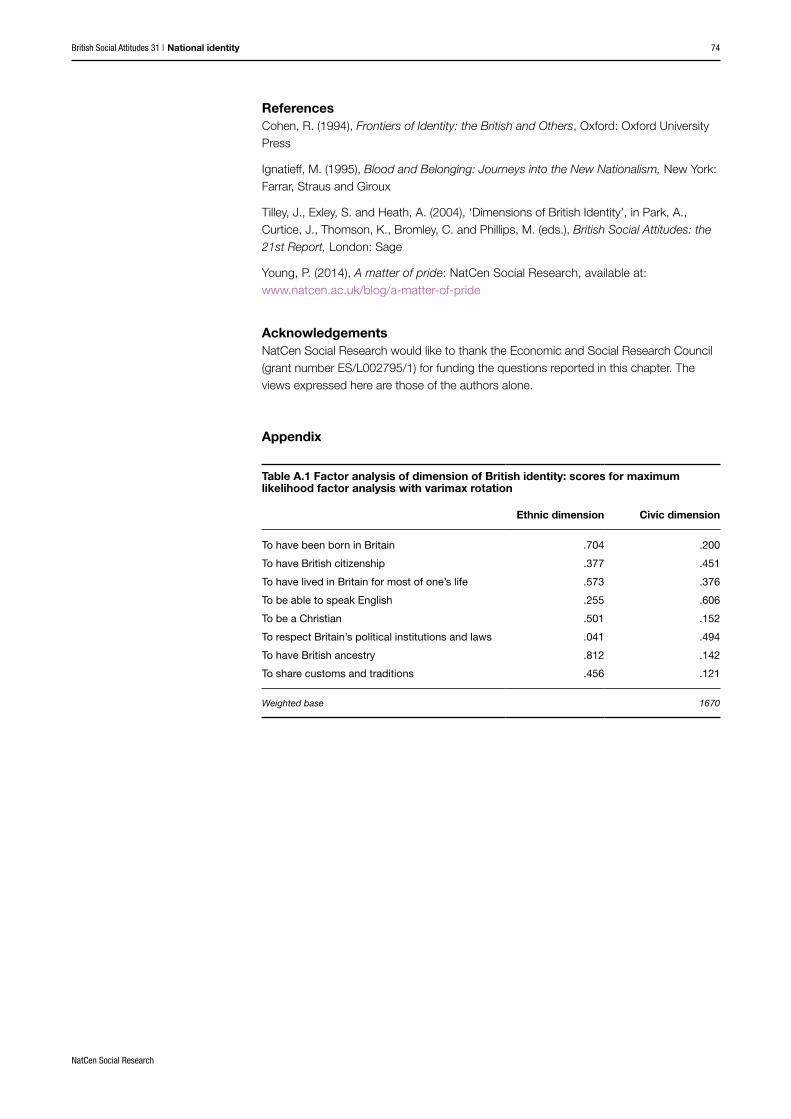
British Social Attitudes 31 | National identity
NatCen Social Research
74
ReferencesCohen, R. (1994), Frontiers of Identity: the British and Others, Oxford: Oxford University Press
Ignatieff, M. (1995), Blood and Belonging: Journeys into the New Nationalism, New York: Farrar, Straus and Giroux
Tilley, J., Exley, S. and Heath, A. (2004), ‘Dimensions of British Identity’, in Park, A., Curtice, J., Thomson, K., Bromley, C. and Phillips, M. (eds.), British Social Attitudes: the 21st Report, London: Sage
Young, P. (2014), A matter of pride: NatCen Social Research, available at: www.natcen.ac.uk/blog/a-matter-of-pride
AcknowledgementsNatCen Social Research would like to thank the Economic and Social Research Council (grant number ES/L002795/1) for funding the questions reported in this chapter. The views expressed here are those of the authors alone.
Appendix
Table A.1 Factor analysis of dimension of British identity: scores for maximum likelihood factor analysis with varimax rotation
Ethnic dimension Civic dimension
To have been born in Britain .704 .200
To have British citizenship .377 .451
To have lived in Britain for most of one’s life .573 .376
To be able to speak English .255 .606
To be a Christian .501 .152
To respect Britain’s political institutions and laws .041 .494
To have British ancestry .812 .142
To share customs and traditions .456 .121
Weighted base 1670

British Social Attitudes 31 | National identity
NatCen Social Research
75
Table A.2 Logistic regression. Dependent variable: ethnic identity versus other
Odds ratio Standard error P value
Anti-immigration 3.165** 0.484 0.000
Importance of feeling British for being British 1.363** 0.086 0.000
Gender: female 1.200 0.200 0.273
2013 compared to 2003 1.021 0.018 0.253
Clerical compared to salariat 1.835* 0.466 0.017
Petty bourgeois compared to salariat 2.294* 0.804 0.018
Foremen/technicians compared to salariat 1.775* 0.477 0.033
Working class compared to salariat 1.550* 0.352 0.054
Race: non-white 0.482 0.228 0.123
Age 2.270** 0.384 0.000
Birth cohort 1.375 0.233 0.061
Education 0.863* 0.060 0.035
Catholic compared to non-religious 1.109 0.296 0.699
Christian/Protestant compared to non-religious 1.414 0.306 0.110
Church of England compared to non-religious 1.978* 0.456 0.003
Non-Christian compared to non-religious 0.505 0.272 0.205
Wales compared to England 1.238 0.462 0.567
Scotland compared to England 0.864 0.213 0.554
Libertarian – authoritarian 1.648** 0.227 0.000
Left – right 0.946 0.099 0.592
Parents non-citizens 0.498* 0.175 0.048
Intercept 0.000 0.000 0.168
Pseudo R2 0.318Weighted base 1374
*= significant at 95% level **= significant at 99% level

British Social Attitudes 31 | National identity
NatCen Social Research
76
Table A.3 OLS regression results. Dependent variable: internationalism
OLS coefficient Standard error P value
Importance of feeling British for being British -0.064** 0.016 0.000
National identity – civic only (compared to ethnic and civic) 0.356** 0.045 0.000
National identity – neither civic nor ethnic (compared to ethnic and civic) 0.358** 0.083 0.000
Gender: female 0.052 0.039 0.174
2013 compared to 2003 0.000 0.004 0.970
Clerical compared to salariat -0.083 0.053 0.119
Petty bourgeois compared to salariat -0.100 0.084 0.236
Foremen/technicians compared to salariat -0.183* 0.062 0.003
Working class compared to salariat -0.142* 0.052 0.007
Race: non-white -0.149 0.091 0.101
Age 0.028 0.035 0.429
Birth cohort 0.074 0.039 0.059
Education 0.121** 0.015 0.000
Catholic compared to non-religious 0.025 0.063 0.688
Christian/Protestant compared to non-religious -0.118* 0.052 0.023
Church of England compared to non-religious -0.090 0.050 0.068
Non-Christian compared to non-religious 0.033 0.111 0.766
In work -0.138 0.086 0.106
Wales compared to England 0.068 0.057 0.234
Scotland compared to England 0.180* 0.077 0.019
Parents non-citizens 2.588 7.919 0.744
Intercept -0.064** 0.016 0.000
R2 0.308Weighted base 1335
*= significant at 95% level **= significant at 99% level
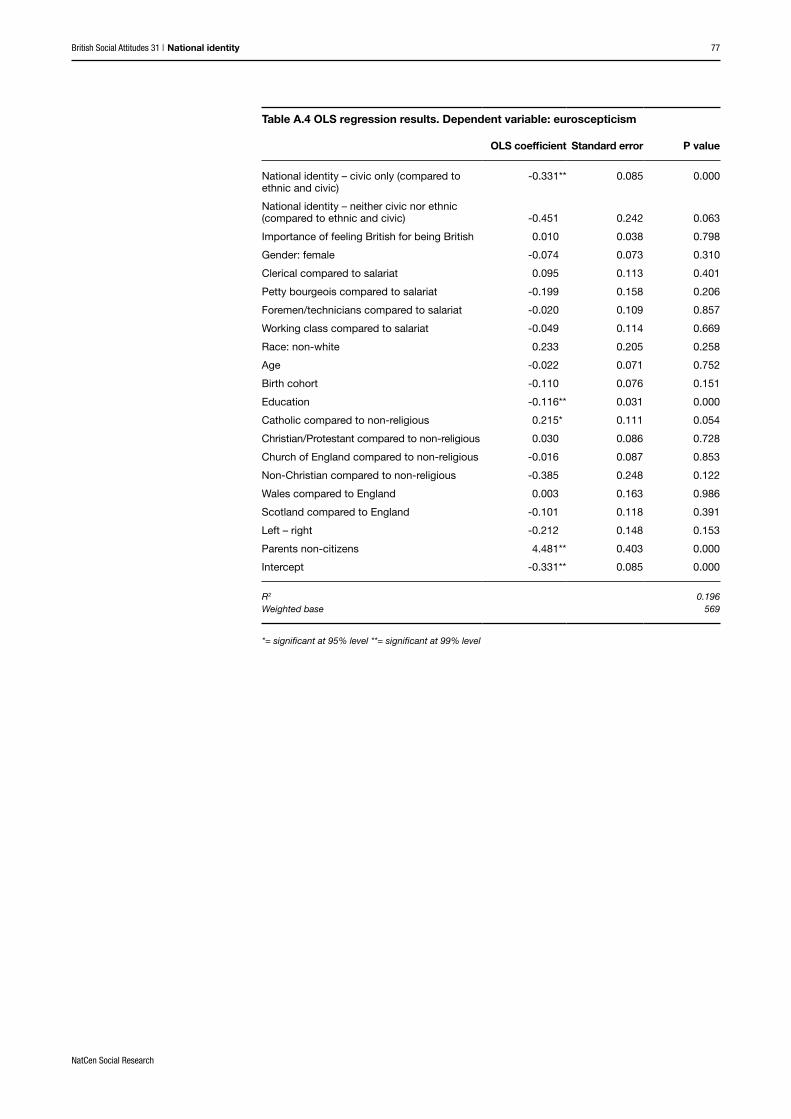
British Social Attitudes 31 | National identity
NatCen Social Research
77
Table A.4 OLS regression results. Dependent variable: euroscepticism
OLS coefficient Standard error P value
National identity – civic only (compared to ethnic and civic)
-0.331** 0.085 0.000
National identity – neither civic nor ethnic (compared to ethnic and civic) -0.451 0.242 0.063
Importance of feeling British for being British 0.010 0.038 0.798
Gender: female -0.074 0.073 0.310
Clerical compared to salariat 0.095 0.113 0.401
Petty bourgeois compared to salariat -0.199 0.158 0.206
Foremen/technicians compared to salariat -0.020 0.109 0.857
Working class compared to salariat -0.049 0.114 0.669
Race: non-white 0.233 0.205 0.258
Age -0.022 0.071 0.752
Birth cohort -0.110 0.076 0.151
Education -0.116** 0.031 0.000
Catholic compared to non-religious 0.215* 0.111 0.054
Christian/Protestant compared to non-religious 0.030 0.086 0.728
Church of England compared to non-religious -0.016 0.087 0.853
Non-Christian compared to non-religious -0.385 0.248 0.122
Wales compared to England 0.003 0.163 0.986
Scotland compared to England -0.101 0.118 0.391
Left – right -0.212 0.148 0.153
Parents non-citizens 4.481** 0.403 0.000
Intercept -0.331** 0.085 0.000
R2 0.196Weighted base 569
*= significant at 95% level **= significant at 99% level

British Social Attitudes 31 | Immigration
NatCen Social Research
78
ImmigrationA nation divided?The British view that current immigration levels are too high is well established and stable. This chapter delves deeper into public opinion to examine how the public perceive the economic and social impact of the largest wave of migration in British history, and how differing views about these impacts colour people’s perceptions of specific migrant groups and their motives for coming to Britain. It also considers views about the best policy response to immigration, particularly in terms of access to benefits, and how these views vary between groups. It concludes by drawing out the key lessons for policymakers, and the tension between responding to those with the most negative views, particularly in the context of the growth in support for the UK Independence Party, and the risk of alienating voters with more pro-migration views.
Deep divides in public opinion A large majority in Britain would like to see immigration levels reduced, but this figure masks considerable diversity of opinion about the impact that it has had on Britain’s economy and culture.
Migrants and welfare benefitsDifferent sections of the population have different mental pictures of migrants and the reasons they come to Britain. They also have very different views about whether and when migrants should be allowed to access welfare benefits:
Among those with the most negative view of the impact immigration has had on Britain, 55% think the main reason migrants come to the country is to claim benefits. Among those who have the most positive view of immigration, only 7% see this as the most common reason for immigration.
31% think that immigration has been good for Britain’s economy and 47% think it has been bad. 20% think it has been neither good nor bad.
The most economically advantaged are far more positive than average about immigration. 60% of graduates think immigration has benefited Britain economically, compared with 17% of those with no qualifications.
31%
47%
55%
20%
37%24% 30%
60%
17%
37% think that EU migrants who are working and paying taxes in Britain should be able to access the same benefits as British citizens immediately or after one year. 24% think they should have access after three years and 30% after five years or more.
7%

British Social Attitudes 31 | Immigration
NatCen Social Research
79
Introduction
Immigration has been a contentious issue in Britain for most of the past fifteen years. Historically high rates of settlement in Britain have been accompanied by widespread public concern, leading voters to consistently name immigration as one of the top issues facing the country (Duffy and Frere-Smith, 2014). In an effort to respond to widespread public concern, the Conservative Party committed to reducing net migration to “tens of thousands” ahead of the 2010 general election, and has pursued a range of restrictive reforms in government in an effort to achieve this goal. These have included changes to the rules on student migration, limiting the educational options to foreign students and their employment options in Britain on graduation, changes to family reunion migration rules, new income requirements for those looking to bring dependants into the country, and changes to labour migration rules limiting the number of work permits issued to non-EEA workers looking to migrate to Britain (Gower and Hawkins, 2013; Robinson, 2013).
Intense policy and enforcement activity brought an initial fall in migration inflows, but in the past year migrant arrivals have rebounded as migration from the EU, which the government has little power to restrict, has risen sharply (Office for National Statistics, 2014). At the same time, public concern about the issue has rebounded, reflecting not just the increased numbers but a renewed voter focus on this issue as anxieties about the economy have receded (Ipsos MORI, 2014).
Polling over the past decade has consistently found that large majorities feel immigration levels are too high. The British Social Attitudes data are no exception to this trend. We asked:
Do you think the number of immigrants to Britain nowadays should be increased a lot, increased a little, remain the same as it is, reduced a little or reduced a lot?
In 2013, 77 per cent of people want immigration reduced “a little” or “a lot”, with 56 per cent wanting a large reduction. Both figures are up sharply on 1995 (when they stood at 63 and 39 per cent respectively) but are largely unchanged since 2008 (Ford et al., 2012). The British view that current immigration is too high is well established and stable. In this chapter, we delve deeper into public opinion to examine how the public perceive the economic and social impact of the largest wave of migration in British history, and how differing views about these impacts colour people’s perceptions of specific migrant groups and their motives. We then consider views about the best policy response to immigration, particularly in terms of access to benefits, and how these vary between groups. We conclude by drawing out the key lessons for policy makers, and the tension between responding to those with the most negative views, particularly in the context of the growth in support for the UK Independence Party (UKIP), and the risk of alienating voters with more pro-migration views.
Overall attitudes to immigration: persistent concerns, deep dividesWe begin by looking at public views about the overall economic and cultural impact of immigration. To assess this we asked the following two questions:
77%of people want immigration reduced
Authors
Robert Ford and Anthony HeathRobert Ford is Senior Lecturer in Politics at the University of Manchester. Anthony Heath is Professor of Sociology and Emeritus Fellow at Nuffield College, University of Oxford and Professor of Sociology at the University of Manchester

British Social Attitudes 31 | Immigration
NatCen Social Research
80
On a scale of 0 to 10, where 0 is extremely bad and 10 is extremely good, would you say it is generally bad or good for Britain’s economy that migrants come to Britain from other countries?
And on a scale of 0 to 10, would you say that Britain’s cultural life is generally undermined or enriched by migrants coming to live here from other countries?
As Table 5.1 shows, the balance of opinion is negative in both cases, but attitudes vary considerably. Thirty-one per cent think immigration has been good for the British economy, while 35 per cent believe it has enriched British culture. Another fifth think the economic and cultural impact of immigration has been broadly neutral. In all, therefore, around half of the public feel that immigration has not had negative economic or cultural effects. The other half of the public take a much more negative view: 47 per cent think immigration has had a negative economic impact, while 45 per cent think it has undermined British cultural life. It is worth noting that the views of immigration critics are more intensely held – 18 per cent regard the cultural and economic impact of immigration as being very negative, compared to the 6 and 3 per cent respectively who take the most positive view of its impact. If we compare these figures with the earlier finding that 77 per cent of people would like to see immigration levels reduced it is clear that those who would like to see less immigration include people who do not necessarily think it has been bad for Britain.
Table 5.1 Views about the economic and cultural impacts of immigration on Britain
Economic impact %
Very good (9–10) 3
Good (6–8) 28
Neither good nor bad (5) 20
Bad (2–4) 29
Very bad (0–1) 18
Don’t know/refuse 1
Net score -16
Cultural impact %
Strongly enriched (9–10) 6
Enriched (6–8) 29
Neither enriched nor undermined (5) 19
Undermined (2–4) 27
Strongly undermined (0–1) 18
Don’t know/refuse 2
Net score -11
Weighted base 3244Unweighted base 3244
The Net Score (in italics) for economic impact is calculated by subtracting the percentage answering “very bad” or “bad” from the percentage answering “very good” or “good”. ‘The Net Score (in italics) for cultural impact is calculated by subtracting the percentage answering “strongly undermined” or “undermined” from the percentage answering “strongly enriched” or “enriched”.The Net score (in italics) may not always reflect the percentage figures in the table, due to rounding
These overall figures suggest more diversity of opinion about immigration than is commonly assumed – while the balance of opinion clearly favours the sceptics, whose views are more intensely held, a lot of people are positive about immigration or see its impact as neutral.
31%think immigration has been good for the British economy

British Social Attitudes 31 | Immigration
NatCen Social Research
81
Of course, these aggregate statistics will mask wide social divides. Views about migration are likely to be influenced by a wide range of factors, including a person’s social position, their ideological values more generally and their own experience of migration (which will vary considerably, as migrants are unevenly distributed both geographically and socially). Table 5.2 focuses on two of the key social factors which we might expect to be associated with attitudes to migration – social class and education – and not surprisingly reveals significant social divides. The most economically secure and higher status sections of society – the professional middle classes and degree holders – are very positive about both the economic and cultural impact of immigration, while all the groups in less privileged positions within the social hierarchy are more negative. Those in the most precarious positions – unskilled manual workers and those with no educational qualifications – are the most intensely negative about immigration’s effects.[1] This is particularly true with regard to education; while 60 per cent of graduates think immigration has had beneficial economic consequences for Britain, the same is true of 32 per cent of those whose highest qualification is at A level or equivalent, and just 17 per cent of those with no qualifications at all. Another way of comparing groups is via their net score, which is the difference between the proportion in a group who take a positive view of immigration and those who take a negative view. This varies from +38 (among graduates) to -45 (among those with no qualifications), showing a huge gap in the balance of opinion between the university educated and those who left school at the earliest opportunity.
Table 5.2 Views about the impact of immigration on Britain, by social class and education[2]
Economic impact Cultural impact
Positive Neutral Negative Net
score Positive Neutral Negative Net
score
All 31 20 47 -16 35 19 45 -10
Social class
Routine manual % 22 21 55 -33 % 23 20 54 -31
Lower supervisory/technical % 16 24 59 -43 % 22 17 59 -37
Self-employed % 27 20 51 -24 % 28 23 47 -19
Intermediate % 26 21 53 -27 % 33 19 46 -13
Professionals/managers % 45 19 35 +10 % 48 17 35 +13
Education level
No qualifications % 17 21 61 -45 % 17 23 56 -39
O level/ GCSE/CSE % 17 21 61 -44 % 19 20 59 -41
A level % 32 22 45 -13 % 36 21 43 -7
Higher education below degree % 28 22 49 -21 % 35 17 47 -12
Degree % 60 16 22 +38 % 65 13 22 +43
The Net Score (in italics) is calculated by subtracting the percentage with a negative view of the impact of immigration from the percentage who have a positive view. The Net score (in italics) may not always reflect the percentage figures in the table, due to rounding
60%of graduates think immigration has had beneficial economic consequences for Britain

British Social Attitudes 31 | Immigration
NatCen Social Research
82
While socially marginal groups worry the most about the impact of immigration, those most likely to be directly exposed to migration in their daily lives have much more positive views. As Table 5.3 shows, Londoners, those with migrant heritage, and those with migrant friends (all of whom are more likely to have regular direct contact with migrants) have more positive than negative views about immigration’s effects. The most intensely negative views are found among the oldest voters, and those with no migrant friends. For example, 17 per cent of those aged 70 and over think immigration has had a positive impact on Britain’s economy, while 53 per cent think it has had a negative impact – compared with 36 per cent and 40 per cent respectively among the 18–29 age groups. There are hints here that it is often those most removed from direct experience of immigration who find it the most threatening.
Table 5.3 Views about the impact of immigration on Britain, by age, migrant heritage, region and number of migrant friends[3]
Economic impact Cultural impact
Positive Neutral Negative Net
score Positive Neutral Negative Net
score
All % 31 20 47 -16 % 35 19 45 -10
Age
18–29 % 36 21 40 -4 % 40 19 38 +2
30–39 % 40 16 43 -3 % 44 18 36 +8
40–49 % 34 21 45 -11 % 38 17 45 -7
50–59 % 27 17 54 -27 % 30 17 51 -21
60–69 % 29 20 50 -21 % 29 28 50 -21
70 plus % 17 29 53 -36 % 21 24 54 -33
Migrant heritage
Migrant % 51 26 20 +31 % 53 26 17 +36
Migrant parents % 43 22 34 +9 % 50 17 33 +17
Native born, native parents % 27 19 53 -26 % 30 18 51 -21
Region
London % 54 22 22 +32 % 55 20 24 +31
All other regions % 28 20 51 -23 % 31 19 48 -17
Migrant friends
Several % 50 22 27 +23 % 53 20 25 +28
One/a few % 33 22 43 -10 % 39 19 41 -2
None % 18 18 63 -45 % 19 18 61 -42
The Net Score (in italics) is calculated by subtracting the percentage with a negative view of the impact of immigration from the percentage who have a positive view. The Net score (in italics) may not always reflect the percentage figures in the table, due to rounding
The underlying distribution of attitudes revealed in this table suggests a deep divide between the politically and socially dominant social groups, and those in regular social contact with migrants, and the rest of the British population. Middle-class professionals, graduates and Londoners (the groups who tend to dominate British political and social institutions) all tend to be more positive about immigration, while majorities of most other groups are negative. This divide may
Those most likely to be directly exposed to migration in their daily lives have much more positive views

British Social Attitudes 31 | Immigration
NatCen Social Research
83
explain the commonly made claim that the ‘ruling classes’ are out of touch on the issue. Political and social elites may sincerely find the intense negative sentiments about immigration found among other groups hard to comprehend, because these are sentiments they rarely encounter in their everyday experience, and which run strongly counter to their own views on the issue.
Weighing up the costs and benefits of specific migrant groupsThere is clearly a deep social divide in people’s overall assessments of immigration. These figures, however, relate to the perceived impact of immigration in the abstract – it is not clear who respondents have in mind when making these overall assessments, or how consistent this mental image is from one person to the next. This is important, because previous research has established that the public have widely differing views of different migrant groups (Ford et al., 2012), and tend to over-estimate the prominence of the groups they like least (Blinder, 2013).
In Table 5.4 we show the results of more clearly defined questions about the costs and benefits of specific migrant groups. We began by asking the following:
I would like you to think about people who come to work in Britain from other countries that are part of the European Union. Do you think the benefits these people bring, for example through working and paying taxes, outweigh the costs they bring, for example through pressures on housing and services, or do the costs outweigh the benefits?
We asked similar questions about “people who come to work in Britain from other countries that are outside the EU”, “international students from outside the European Union” and “husbands and wives coming from other countries to join their spouses who live in Britain”.[4]
Overall views of the impact of these different migrant groups vary, though the general tendency is to take a negative view. Assessments of student migrants are the most positive: 35 per cent believe the benefits they bring to Britain outweigh the costs, 34 per cent feel the costs outweigh the benefits and 23 per cent feel the costs and benefits are about the same. Public views about spousal reunion are the most negative; only 14 per cent feel spousal reunion migration brings greater benefits than costs, while 57 per cent believe their costs outweigh the benefits.
Views about the costs and benefits of labour migration fall in between these two extremes, but are also negative on balance. Only around a fifth of people feel labour migration is of net benefit to Britain, another fifth feel the costs and benefits are about equal, while a clear majority feel Britain loses more than it gains from such migration. Views about labour migration from inside the EU (which is largely unrestricted) and from outside the EU (which is more tightly regulated) are largely identical. This may reflect general hostility to labour migration, regardless of its source, as well as low awareness of the different policy regimes that regulate migration inside and outside the EU. Previous research has shown that a majority of the public regard highly qualified professional migrants as valuable to Britain (Ford et al., 2012; Ford, 2012) and under the current points system most labour migrants from outside the EU will fall into this category.
There is clearly a deep social divide in people’s overall assessments of immigration

British Social Attitudes 31 | Immigration
NatCen Social Research
84
Table 5.4 Views about the costs and benefits to Britain of different migrant groups
Students from
outside EUEU labour migrants
Labour migrants from
outside EU
Spousal reunion
migrants
% % % %
Benefits to Britain are much greater than the costs 17 7 7 5
Benefits to Britain are a little greater than the costs 18 14 14 9
Benefits and costs are about equal 23 20 20 23
Costs to Britain are a little greater than the benefits 17 25 23 25
Costs to Britain are a lot greater than the benefits 17 28 30 32
Don’t know/it depends/refusal 8 5 7 6
Net benefit score +1 -32 -34 -44
Weighted base 2181 1063 1084 1097Unweighted base 2181 1063 1084 1097
The Net Score (in italics) is calculated by subtracting the percentage who think the costs to Britain of immigration are greater than the benefits from the percentage who think the benefits to Britain from immigration are greater than the costs. The Net score (in italics) may not always reflect the percentage figures in the table, due to rounding
These findings suggest that the government’s policies to introduce minimum income requirements for residents looking to sponsor relatives to come to the UK are in line with public views in this area – and may help to assuage public concerns about the costs of spousal reunion. But government policy will only reassure the public if they are aware of it; widespread public ignorance about the much longer established ‘points system’ and the different migration regimes that relate to EU and non-EU citizens suggest this may be an uphill struggle for the government. To explore awareness of the current system governing migration we asked:
Please tell me whether you think the following statement is true or false. There is a limit on the number of work permits the government issues each year to migrants coming to Britain from outside the EU who want to come and work in Britain. Most of these permits are reserved for those with better qualifications and English language skills.
Under half (45 per cent) thought this statement was “true” (the correct answer). A similar proportion (42 per cent) thought it was false, and 14 per cent said they did not know.
As Table 5.5 shows, there is a clear relationship between people’s policy awareness and their views about the costs and benefits to Britain of labour migrants from outside the EU. The first column shows the views of those who knew the answer to our question about how migration from outside the EU is governed, the second shows those who answered it incorrectly, and the third those who said they did not know. Those who are aware of the points system are much more positive than the other groups about the contribution that labour migrants make; 27 per cent think that the benefits of their migration outweigh the costs (compared with 13 per cent of those who answered incorrectly), and a further 23 per cent think the costs and benefits are about equal. Although 25 per cent think the costs of labour migration from outside the EU are “a lot greater than the benefits”, this compares with 39 per cent of those who gave
Those who are aware of the points system are much more positive than the other groups about the contribution that labour migrants make

British Social Attitudes 31 | Immigration
NatCen Social Research
85
the incorrect answer to our question about how labour migration is governed. We should not read too much into this relationship, as it could be driven in part by factors like education – highly educated respondents are both more knowledgeable about policy and more positive about immigration. Despite these limitations, the relationship does suggest that greater knowledge of Britain’s restrictive points system may encourage more positive views of the migrants admitted under this regime.
Table 5.5 Views about labour migrants from outside the EU, by knowledge of Britain’s non-EU work permit policy
Correct answer to work permits
question
Incorrect answer to work permits
questionDon’t know
Difference correct-
incorrect
% % %
Benefits to Britain are much greater than the costs 11 3 5 +8
Benefits to Britain are a little greater than the costs 16 10 10 +6
Benefits and costs are about equal 23 19 18 +4
Costs to Britain are a little greater than the benefits 21 24 19 -3
Costs to Britain are a lot greater than the benefits 25 39 31 -14
Don’t know/it depends/refusal 4 6 18 -1
Weighted base 246 218 84Unweighted base 247 211 88
Table 5.6 shows how people’s views of specific migrant groups relate to their overall views about immigration. To do this, we put people into one of four groups, depending on their answers to the two questions about the economic and social impact of immigration on Britain shown in Table 5.1.[5] According to this classification, around a third of the population (34 per cent) have positive views about immigration, a fifth (17 per cent) have neutral ones, just under a third (30 per cent) have somewhat negative views and a fifth (20 per cent) have very negative views. The rows then show their views about the relative costs and benefits to Britain of the specific groups of migrants we have already considered. Two things are immediately apparent. Firstly, there is a broad consensus over the relative merits of the different specific migrant groups, irrespective of a person’s general views about immigration. Students are seen as being of the most benefit to Britain, and spousal reunion migrants of the most cost, with labour migrants (regardless of origin) falling in between. Secondly, overall assessments about the impact of immigration strongly predict views about specific migrant groups. The liberal third of the population who see immigration in general as positive for Britain are extremely positive about student migration (which 51 per cent see as being of benefit and only 10 per cent as being a cost, a net benefit score of +41), somewhat positive about EU and non-EU labour migration (38 and 35 per cent see each group as being of benefit, with net benefit scores of +8 and +6 respectively), and mildly negative about spousal reunion (21 per cent think it benefits Britain, with a net benefit score of -12). Those who have neutral overall assessments of migration are mildly positive about the benefits of students (36 per cent see them as benefiting Britain, with a net benefit score of +11), but are negative about the other migrant groups. Those who have negative overall assessments about the impact of migration, around half of the population and split in the final two columns of the table between the somewhat negative and
Overall assessments about the impact of immigration strongly predict views about specific migrant groups

British Social Attitudes 31 | Immigration
NatCen Social Research
86
the strongly negative, believe the costs of all four specific migrant groups always outweigh the benefits, typically by lopsided margins. The intensity gap observed in general attitudes to immigration is visible again here – those who are positive about immigration in general regard three of the four migrant groups as being modestly beneficial for Britain; those who are negative about immigration regard all four migrant groups as very costly for Britain.
Table 5.6 Views about different migrant types, by overall views about impact of immigration on Britain
Overall view of impact of immigration on Britain
Positive Neutral Somewhat
negativeStrongly negative
Students from outside the EU % % % %
Benefits to Britain outweigh costs 51 36 22 15
Neutral/depends/don’t know 28 39 32 23
Costs to Britain outweigh benefits 10 25 46 62
Net benefit score +41 +11 -24 -47
EU labour migrants % % % %
Benefits to Britain outweigh costs 38 12 12 9
Neutral/depends/don’t know 33 36 19 10
Costs to Britain outweigh benefits 30 52 69 81
Net benefit score +8 -40 -57 -72
Non-EU labour migrants % % % %
Benefits to Britain outweigh costs 35 19 13 11
Neutral/depends/don’t know 36 37 18 10
Costs to Britain outweigh benefits 29 44 69 79
Net benefit score +6 -25 -56 -68
Spousal reunion migrants % % % %
Benefits to Britain outweigh costs 21 17 9 9
Neutral/depends/don’t know 47 30 18 11
Costs to Britain outweigh benefits 33 53 73 80
Net benefit score -12 -36 -64 -71
Weighted base 1070 550 928 625Unweighted base 992 549 972 660
So what should we do? Views about migration policy
We have found the same deep and uneven divide in general and specific views of migrants. A third of the public see immigration as moderately beneficial in general, and sees student and labour migration as valuable for the country. Around half regards the impact of immigration as negative, and all specific forms of immigration as being costly for Britain. How does this social divide translate into views about the specific policies that politicians of all parties must formulate to address public concerns and bridge this divide in attitudes? We focus here on the issue of migrant access to the welfare state, which was a highly salient part of the public debate about immigration when the survey

British Social Attitudes 31 | Immigration
NatCen Social Research
87
was conducted in 2013. At that time there was intensive discussion about the consequences of the forthcoming lifting of restrictions on Bulgarian and Romanian migration to Britain on 1st January 2014, and concern about ‘benefit tourism’ – the worry that large numbers of migrants from these poorest EU countries would be attracted to Britain by the offer of state welfare benefits. Currently there is little evidence that benefit provision encourages migrant inflows or imposes significant costs on the British state, and several academic analyses of the topic have concluded that migrants are not a drain on welfare resources as they are less likely to claim benefits than native born Britons, and more likely to work (Vargas-Silva, 2013; Dustmann and Frattini, 2013). Despite this, anxieties about the issue are widely held, prompting intense discussion about policy reforms to restrict migrant access to benefits. This is more difficult to achieve with regards to EU migrants, as curbs on the provision of benefits risks falling foul of EU law defining the rights of workers moving across borders (although the extent of these rights is still being debated).
The salience of the welfare benefits issue to the public became clear when we were developing the immigration questions for the survey. One of the new questions we tested asked people about what they perceived to be migrants’ main motives for coming to Britain. Initially we offered as possible responses the motives recorded in official statistics – work (split into EU and non-EU), study, spousal reunion and asylum. However, when testing the question prior to the main survey we found that many people favoured a motive that was not on our list: the desire to claim welfare benefits. We decided to carry out a survey experiment to test whether prompting for the issue of ‘welfare tourism’ influenced the responses we got. We did this by randomly splitting the sample in half and giving one half the list of motives for immigration based on official statistics (recording welfare benefits as the main motive if this was spontaneously offered) and the other half the same list with “welfare benefits” added as one of the response options. The wording of our question was:
Migrants come to Britain for many reasons and from many places. Which one of the reasons on the card do you think is the most common reason for migration to Britain?
The options shown on the card, and the results obtained, are shown in Table 5.7. Three important findings emerge. Firstly, and in line with previous research (Blinder, 2013), there is a large gap between the motives most frequently recorded in official statistics and those which loom largest in public opinion. International Passenger Survey statistics record study (176,000), work within the EU (129,000) and work from outside the EU (43,000) as the largest sources of long term migration (defined as for over 12 months) (Office for National Statistics, 2014). However, students are far less salient in the public image of migration: only 7 to 8 per cent of our respondents named study as the most common motive for migration depending on which version of the question was asked. Around half named labour migration as the main motive – most pointing to workers moving within the EU (40 to 43 per cent) rather than arriving from outside the EU (10 to 13 per cent). Two motives loom far larger in the public imagination than they do in the statistics: asylum was named as the main motive by 10 to 17 per cent, although the most recent asylum statistics show inflows of 24,000, a small fraction of those for student and labour migration. Welfare also featured heavily as a motive – 8 per cent named it spontaneously when it was not listed as an option for them to choose, and 24 per cent chose it as the main motive for migration when it was

British Social Attitudes 31 | Immigration
NatCen Social Research
88
offered with the other choices. Secondly, perceptions about migrants’ primary motives are closely tied to people’s views about the effects of immigration. A large majority of those who are positive about immigration, and a modest majority of those who are neutral, see work as the main motive for migration, particularly workers moving from elsewhere in the EU. Those with negative views of migration are much more likely to see migrants as motivated by a desire to claim benefits, or to claim asylum in Britain. Thirdly, concerns about ‘benefit tourism’ are strongly concentrated among those groups with the most negative views about migrants. Only a small minority of those who are neutral or positive see this as the primary motive for migrants, even when it is listed as a response category. But the issue looms large for those with strongly negative views of immigration: 22 per cent spontaneously named it as the main motive for migration, while when it was included on the list of response categories, over half (55 per cent) picked it, overwhelming all the other options on offer.
Table 5.7 Views about most common reason for migration to Britain, by overall views about impact of immigration on Britain
Overall view of impact of immigration on Britain
Positive Neutral Somewhat
negativeStrongly negative All
Benefits not offered as response option % % % % %
Coming to work from inside EU 56 43 39 27 43
Coming to work from outside EU 15 12 15 11 13
Refugees coming to claim asylum 9 18 22 25 17
Study in British universities 10 11 7 5 8
Husbands and wives coming to join their partners 5 6 6 6 6
Coming to claim welfare benefits (offered spontaneously) 2 5 7 22 8
Benefits offered as response option % % % % %
Coming to work from inside EU 55 44 38 13 40
Coming to work from outside EU 12 11 11 7 10
Refugees coming to claim asylum 7 9 11 17 10
Study in British universities 13 7 5 1 7
Husbands and wives coming to join their partners 3 4 7 7 5
Coming to claim welfare benefits 7 18 25 55 24
Weighted base 516 259 463 308 1546Unweighted base 481 261 484 319 1545
These findings show that different sections of the British population have very different mental pictures of migrants: those who are positive about immigration see them as driven by a desire to work, while those who are most negative see them as primarily attracted by a desire to claim benefits.
Many people clearly regard migrant access to welfare as an important part of the immigration debate, but how do they think the state should respond? To assess this we asked people the following question:
Concerns about ‘benefit tourism’ are strongly concentrated among those groups with the most negative views about migrants

British Social Attitudes 31 | Immigration
NatCen Social Research
89
Thinking about migrants from other countries in the European Union who are working and paying taxes in Britain. How soon, if at all, should they be able to access the same welfare benefits as British citizens?
Half the sample were randomly assigned this question about EU migrants, whose rights to British welfare benefits have been the focus of recent debate, and the other half were asked about migrants from outside the EU, whose access to welfare was already more restricted and who have not featured so prominently in discussion. The options shown on the card, and the results obtained, are shown in Table 5.8. It shows that the divide in views about the overall impact of immigration drives an important divide in relation to policy responses. If we split the policy options on offer into two categories: ‘open’ (granting migrants access to benefits in a year or less) and ‘restrictive’ (restricting access to benefits for five years or more) we find that the positive third of the population favours an open approach by a large margin; the proportion who favour an open approach outweigh those who favour a more restrictive one by some 38 percentage points. Meanwhile, the negative half favours a restrictive approach; among those who are strongly negative 63 per cent favour a restrictive approach, and just 18 per cent an open one. Those with neutral views are evenly split.
We also find some willingness to adopt a more liberal approach towards EU migrants than to those from outside the EU – the balance of opinion overall is slightly in favour of open policies for EU migrants, and restrictive policies for non-EU migrants. This pattern is replicated among all the sub-groups of our sample, suggesting the notion that EU migrants have a right to somewhat more favourable treatment is widely shared. The problem for policy makers is that a large majority of the public would favour a more restrictive approach to EU migrants than is currently possible. Even in the pro-migration third, a majority favours imposing a qualification period of at least a year, while in the more restrictive sections of the public the majority preference is for a waiting time of three years or more. Currently, EU migrants can access most benefits within a matter of months, and it would be difficult to square the restrictions favoured by most respondents with the demands of EU law.
The problem for policy makers is that a large majority of the public would favour a more restrictive approach to EU migrants than is currently possible
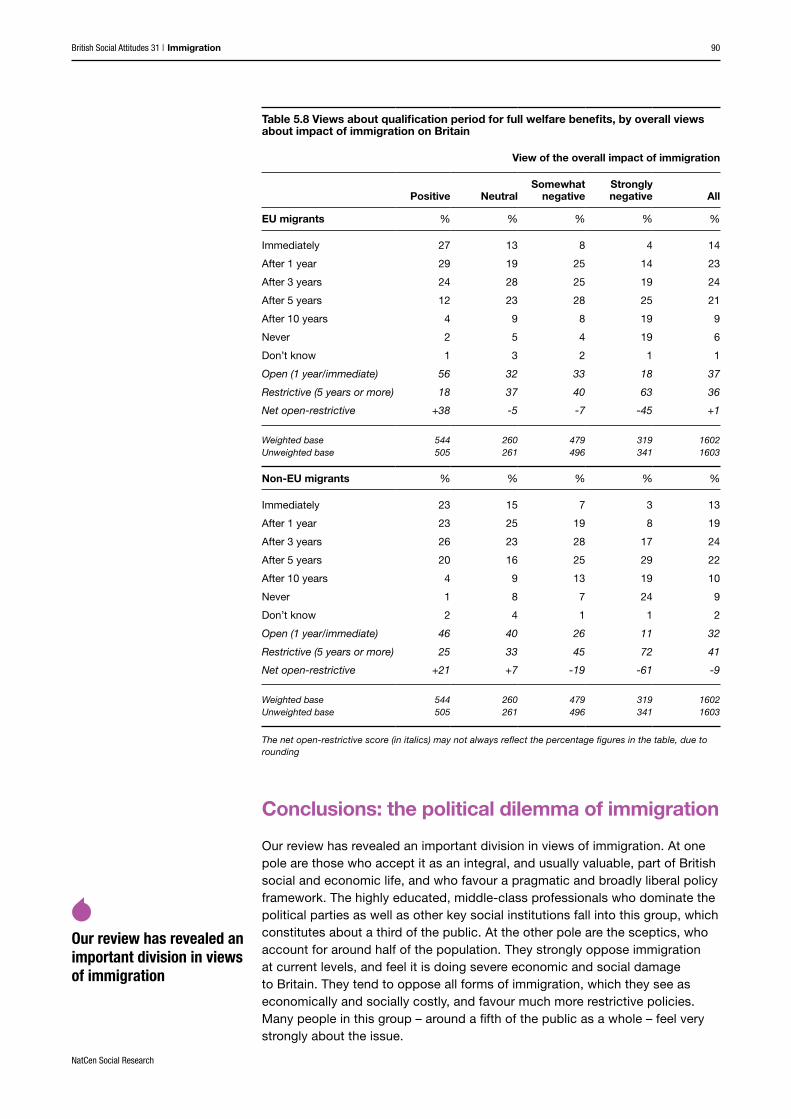
British Social Attitudes 31 | Immigration
NatCen Social Research
90
Table 5.8 Views about qualification period for full welfare benefits, by overall views about impact of immigration on Britain
View of the overall impact of immigration
Positive NeutralSomewhat
negativeStrongly negative All
EU migrants % % % % %
Immediately 27 13 8 4 14
After 1 year 29 19 25 14 23
After 3 years 24 28 25 19 24
After 5 years 12 23 28 25 21
After 10 years 4 9 8 19 9
Never 2 5 4 19 6
Don’t know 1 3 2 1 1
Open (1 year/immediate) 56 32 33 18 37
Restrictive (5 years or more) 18 37 40 63 36
Net open-restrictive +38 -5 -7 -45 +1
Weighted base 544 260 479 319 1602Unweighted base 505 261 496 341 1603
Non-EU migrants % % % % %
Immediately 23 15 7 3 13
After 1 year 23 25 19 8 19
After 3 years 26 23 28 17 24
After 5 years 20 16 25 29 22
After 10 years 4 9 13 19 10
Never 1 8 7 24 9
Don’t know 2 4 1 1 2
Open (1 year/immediate) 46 40 26 11 32
Restrictive (5 years or more) 25 33 45 72 41
Net open-restrictive +21 +7 -19 -61 -9
Weighted base 544 260 479 319 1602Unweighted base 505 261 496 341 1603
The net open-restrictive score (in italics) may not always reflect the percentage figures in the table, due to rounding
Conclusions: the political dilemma of immigration
Our review has revealed an important division in views of immigration. At one pole are those who accept it as an integral, and usually valuable, part of British social and economic life, and who favour a pragmatic and broadly liberal policy framework. The highly educated, middle-class professionals who dominate the political parties as well as other key social institutions fall into this group, which constitutes about a third of the public. At the other pole are the sceptics, who account for around half of the population. They strongly oppose immigration at current levels, and feel it is doing severe economic and social damage to Britain. They tend to oppose all forms of immigration, which they see as economically and socially costly, and favour much more restrictive policies. Many people in this group – around a fifth of the public as a whole – feel very strongly about the issue.
Our review has revealed an important division in views of immigration

British Social Attitudes 31 | Immigration
NatCen Social Research
91
This social divide creates problems for policy makers for three reasons. Firstly, any policy which satisfies those on one side of the divide will anger those on the other side of the divide. Secondly, policy makers and the interest groups they deal with regularly tend to be drawn heavily from the liberal end of the spectrum, creating a potential for disconnect and distrust between a more liberal political class which accepts immigration and an electorate among whom many find it intensely threatening. Thirdly, in many areas of migration policy, constraints on current policy mean it is more liberal than even the most pro-migration parts of the public would like, generating widespread public discontent which is hard to address. For example, EU rules make it very hard for the government to restrict migrant numbers, or regulate migrant access to the welfare state, in accordance with the wishes of most of the public.
This combination of persistent public anxiety, the disconnect in attitudes between political elites and voters, and constraints on policy makers’ ability to respond have helped to fuel the rise in support for UKIP, who have been most successful among those who are most anxious about immigration. This is clear in Table 5.9 which shows the proportions identifying with different political parties among the four groups we have considered throughout this chapter. Among those who are strongly negative about immigration, 13 per cent identify with UKIP, compared to just 1 per cent among those with positive views of migration (see also Ford and Goodwin, 2014). While Labour are relatively weaker among anti-immigration voters than among pro-immigration voters, both of the big two parties have reasons to worry about UKIP competition, as large numbers of the most anti-immigration voters also identify with each of these parties. The Liberal Democrats have the least to fear from UKIP competition, as they prosper among the pro-migration section of the electorate, where UKIP are absent, and have virtually no identifiers among the strongly negative respondents.
Table 5.9 Party identification, by overall views about impact of immigration on Britain
Liberal Democrats Labour Conservatives UKIP None
Weighted base
Unweighted base
Positive % 11 38 20 1 15 1068 990
Neutral % 5 35 27 4 19 550 549
Somewhat negative % 4 28 28 5 19 927 972
Strongly negative % 2 28 22 13 25 626 660
All % 6 33 25 5 18 3171 3171
The emergence of UKIP is generating a dilemma for policy makers in the governing parties. Although UKIP competition creates a short-term demand for restrictive migration policies, such policies in turn may cause problems for them in the longer run. Advocating strongly restrictive immigration policies risks alienating the more liberal third of the population, and given constraints on policy and high political distrust, may not convince the most anti-immigration voters anyway. Moreover, long-term demographic change is moving society in the opposite direction, because the most pro-migration social groups – university graduates and professionals – are steadily growing, while the most anti-migration groups – unskilled manual workers and those with no qualifications – are in sharp decline.[6] This is the political dilemma of immigration: there is a clear, and intense, demand for action on the issue from
Among those who are strongly negative about immigration, 13 per cent identify with UKIP

British Social Attitudes 31 | Immigration
NatCen Social Research
92
one section of the electorate, a demand politicians ignore at their peril. Yet responding to the concerns of the voters worried about immigration today risks alienating the rising sections of the electorate whose political voice will become steadily louder in elections to come.
Notes1. Here we summarise people’s views about the economic and social impacts of
migration (the two scales shown in Table 5.1). For each scale, those whose score was above the neutral point were rated “positive”, those whose score was equal to neutral were rated neutral, and those whose score was below the neutral point were rated “negative”.
2. Bases for Table 5.2 are as follows:
Views about the impact of immigration on Britain, by social class and education
Weighted base Unweighted base
Social class
Routine manual 911 903
Lower supervisory/technical 269 277
Self-employed 298 287
Intermediate 466 479
Professionals/managers 1168 1165
Education level
No qualifications 577 690
O level/GCSE/CSE 727 715
A level 577 496
Higher education below degree 341 328
Degree 750 714

British Social Attitudes 31 | Immigration
NatCen Social Research
93
3. Bases for Table 5.3 are as follows:
Views about the impact of immigration on Britain, by age, migrant heritage, region and number of migrant friends
Weighted base Unweighted base
All
Age
18–29 629 429
30–39 565 524
40–49 563 550
50–59 548 542
60–69 486 578
70 plus 447 616
Migrant heritage
Migrant 431 335
Migrant parents 304 261
Native born, native parents 2543 2648
Region
London 429 325
All other regions 2815 2919
Migrant friends
Several 780 663
One/a few 1159 1129
None 1295 1428
4. The question wording for international students read simply “overall do you think the benefits for Britain of international students from outside the European Union outweigh the costs they bring, or do the costs outweigh the benefits?”
5. For this analysis we use a measure that combines people’s views about the economic and social impacts of migration (that is, the two measures shown in Table 5.1). Those whose average score on the two scales was above the neutral point were rated “positive”, those whose combined score was equal to neutral were rated neutral, those whose average score on both scales was equivalent to a somewhat negative score on each individual scale were rated “somewhat negative” and those whose average across the two scales was equivalent to strongly negative scores on both were rated “strongly negative”.
6. In 1989, 7 per cent of British Social Attitudes respondents were graduates, and 44 per cent had no qualifications. Now graduates (25 per cent) outnumber those without any qualifications (20 per cent). Meanwhile, the proportion of people in professional and managerial jobs has increased from 35 to 37 per cent, accompanied by a drop from 37 to 29 per cent in the proportion in semi-skilled or unskilled manual work.

British Social Attitudes 31 | Immigration
NatCen Social Research
94
ReferencesBlinder, S. (2013), ‘Imagined Immigration: The Impact of Different Meanings of “Immigrants” in Public Opinion and Policy Debates in Britain’, Political Studies, published online June 2013, DOI: 10.1111/1467-9248.12053
Duffy, B. and Frere-Smith, T. (2014), Perceptions and Reality: Public Attitudes to Immigration, London: Ipsos MORI Social Research Institute
Dustmann, C. and Frattini, T. (2013), The Fiscal Effects of Immigration to the UK, UCL Centre for Research and Analysis of Migration discussion paper 22/13, available at: www.cream-migration.org/publ_uploads/CDP_22_13.pdf
Ford, R., Morrell, G. and Heath, A. (2012), ‘Fewer but Better? British attitudes to immigration’, British Social Attitudes: the 29th Report, London: NatCen Social Research, available at: www.bsa-29.natcen.ac.uk
Ford, R. (2012), Parochial and Cosmopolitan Britain: Examining the social divide in reactions to immigration, report for the George Marshall Foundation ‘Transatlantic Trends: Immigration’ project
Ford, R. and Goodwin, M. (2014) Revolt on the Right: Explaining Support for the Radical Right in Britain, Abingdon: Routledge
Gower, M. and Hawkins, O. (2013), Immigration and Asylum Policy: Government Plans and Progress Made, House of Commons Library Standard Note SN/HA/5829, available at: www.parliament.uk/briefing-papers/sn05829.pdf
Ipsos MORI (2014), Issues Index March 2014, available at: www.ipsos-mori.com/researchpublications/researcharchive/3360/EconomistIpsos-MORI-March-2014-Issues-Index.aspx
Office for National Statistics (2014), Migration Statistics Quarterly Report February 2014, available at: www.ons.gov.uk/ons/rel/migration1/migration-statistics-quarterly-report/february-2014/index.html
Robinson, D. (2013), ‘Migration Policy under the Coalition Government’, People, Place and Policy 13(2): 73–81
Vargas-Silva, C. (2013), Briefing: The Fiscal Impact of Immigration in the UK, Migration Observatory Briefing Papers, available at: http://migrationobservatory.ox.ac.uk/briefings/fiscal-impact-immigration-uk
Acknowledgements The author and NatCen Social Research would like to thank Unbound Philanthropy, the Joseph Rowntree Foundation, the Joseph Rowntree Charitable Trust, the Trust for London, the Diana, Princess of Wales Memorial Fund and the Paul Hamlyn Foundation for funding the questions reported in this chapter. In addition, we would like to thank the Department for Business, Innovation and Skills for funding the question about students from outside the EU. The views expressed here are those of the authors alone.

British Social Attitudes 31 | Benefits and the cost of living
NatCen Social Research
95
Benefits and the cost of livingPressures on the cost of living and attitudes to benefit claimingThroughout the relative economic prosperity of the 1990s and early years of the 21st Century, British Social Attitudes tracked falling public support for benefit claimants and the benefits system. While the ten-year period in which working-age households’ incomes have not risen might be expected to turn the attitudinal tide on benefit claiming, until recently there has been little sign of this. This chapter updates the picture on public attitudes to the benefits system, and looks in particular at the views of Britain’s working ‘squeezed middle’. What do people in working households think about benefit claiming – and how closely are their attitudes linked to their feelings about their own financial situations or their views about levels of poverty in Britain? To what extent might recent increasing pressures around the cost of living for these working households have changed people’s views about benefit claiming?
The resilience of supportThere has been a long-term decline in levels of support for benefit claiming – but many people still do not feel that benefits provide enough to live on, and support more spending on most types of claimant, bar the unemployed.
Pressures on the cost of livingPeople in working households feel more pressures around the cost of living than they used to, and think that poverty levels are rising.
Since the start of the recession, more working households feel they are struggling financially and there has been a sharp increase in the perception of these people that levels of poverty in Britain rose over the preceding decade. In 2000, 36% felt this way. In 2013, 64% did.
People in working households are more supportive of the benefits system when they themselves are struggling to make ends meet, but there are signs that this is changing – at least when it comes to attitudes to unemployment benefits.
44% of people think that unemployment benefits are not enough to live on. When told the actual amount that unemployed claimants receive in benefit, this figure rises to 56%. However, noticeably fewer people think this now than in past decades.
More people support increases in spending than support cuts for nearly every type of benefit, except unemployment benefits.
SUPPORT FOR INCREASES
UNEMPLOYMENT BENEFITS TOO LOWRISING POVERTY
SUPPORT FOR CUTS
36%64% 41%
32%
17% 18%
44% 56%
CARER CLAIMANTS 73% 1%
LOW INCOME WORKING PARENTS
CLAIMANTS59% 5%
UNEMPLOYED CLAIMANTS 15% 49%
2000 20102013 2013

British Social Attitudes 31 | Benefits and the cost of living
NatCen Social Research
96
Introduction
In recent decades, British Social Attitudes has provided much-cited evidence of public attitudes hardening towards the benefits system. Over a period of economic growth from the mid-1990s, the British public has come to view benefit claimants as less deserving and the disincentive effects of the benefits system as greater. Partly as a result, people have become generally less supportive of spending on benefits (e.g. Taylor-Gooby and Martin, 2008; Clery et al., 2013). Last year’s British Social Attitudes report pointed to some signs that attitudes towards benefit claiming might be starting to soften (Pearce and Taylor, 2013). This seems likely to be what has been called a ‘thermostat’ effect (Stuart and Wlezien, 2005; Curtice, 2010): as a room gets warmer or colder we want to turn the heat down or up, even if our ideal temperature is unchanged. When it comes to the benefits system, this would mean that when people think that benefits are being cut – for example, as a result of the coalition government’s reductions in benefits spending – they may be more likely to want an increase in spending on benefits, even if their underlying view about the ideal level of spending is unchanged. As described above there is some evidence for this.[1] Given that spending cuts on benefits are likely to continue – only six per cent of the proposed public spending cuts were implemented by the time of the 2012 British Social Attitudes survey cited in last year’s report (Adam et al., 2012:47) – we might expect this kind of thermostatic trend to carry on.
Yet there is another way in which attitudes can change to reflect the world around them: as levels of social need rise, support for the benefits system may change. We have seen considerable changes in social need in recent years, although this is less to do with rising unemployment than might be imagined. Unemployment among the working-age population rose during the economic downturn, from five per cent in late 2007 to a peak of nine per cent in late 2011, and still high at almost eight per cent in mid-2013. However, the unemployment peak is lower than in recent recessions, and inactivity has also declined, so the overall employment rate is only just below the pre-2007 level.[2]
Rising social need instead reflects a number of other trends. Increasing numbers of people do not claim unemployment benefits – for example, the take-up of income-based Jobseeker’s Allowance among those who would be eligible fell from 71–84% to 51–60% over the decade from 1997/8, before rising slightly back to 60–67% in 2009–10 (DWP, 2012). Moreover, for those people who are reliant on the benefits and tax credits system, there have been various reductions in spending as a result of policy changes which total over £15 billion for 2013/14 (Downing and Kennedy, 2013:21), alongside a more than doubling in the sanctioning/disallowance rate for JSA claimants since 2006 (Webster 2014: Figure 2). There is also a debate about whether some food bank networks are right to say that the single largest reason that rising numbers of people come to them is because of difficulties with the benefits system – a claim that has been heavily contested, with little robust evidence by which to adjudicate (Downing and Kennedy, 2013).
The change that has captured the public mood the most, though, is the ‘cost of living’ debate. This debate was partly prompted by rising costs in household essentials: the cost of energy bills rose by more than 60 per cent between the start of the economic crisis in 2008 and 2013, and food, water and transport costs all rose by more than 20 per cent (Adams et al., 2014). Yet rises in costs have not been matched by rising earnings: one reason why unemployment has not risen further is because the downturn was absorbed through lower earnings,
The change that has captured the public mood the most, though, is the ‘cost of living’ debate
Author
Ben BaumbergBen Baumberg is a Lecturer in Sociology and Social Policy at the University of Kent and at the Centre for Analysis of Social Exclusion, London School of Economics

British Social Attitudes 31 | Benefits and the cost of living
NatCen Social Research
97
following an earlier period in which median earnings stagnated. In combination, all of this means that the average (median) household is six per cent worse off in real terms in 2013/14 than its pre-crisis peak (Adams et al., 2014), and the average working-age household in 2011/12 was no better off than they were fully ten years earlier (Office for National Statistics, 2013). This is a sharp change from the year-on-year improvements in living standards to which we had become accustomed. As a result, a greater proportion of those living in poverty in 2011/12 were in working families rather than in workless ones, unlike in the previous fifteen years (MacInnes et al., 2013:27).
It is therefore perhaps unsurprising that the cost of living has therefore become central to political and media debate. The term ‘the squeezed middle’ was the Oxford Dictionary’s word of the year for 2011 after being popularised (although not coined) by the Labour leader Ed Miliband; and while the Prime Minister David Cameron and Liberal Democrat leader Nick Clegg have eschewed the term ‘the squeezed middle’, living standards are a key issue across the political spectrum. For example, the Labour Party is promising to freeze energy prices if elected, and the government is cutting energy bills by reducing environmental obligations on energy companies in 2013.
There has been little written on the perceptions towards the benefits system of those people struggling with the cost of living within working households (barring brief mentions in Hills, 2001; Bromley, 2003). There are certainly at least two schools of thought about how they might feel. One argument is that if people themselves are struggling then they may be more likely to support the benefits system. There is certainly evidence that self-interest is one influence on people’s attitudes towards benefits (Sundberg, 2014) resulting in economic downturns often being times of raised support for benefits (Clery, 2012). Rising awareness of the financial struggles of other people may also make us see claimants as more ‘deserving’ (van Oorschot, 2000). A second argument, however, is that the financial worries of people in working households will lead to a resentment towards benefit claimants, whose ‘unfair’, undeserving claims are contrasted with the daily struggles of ‘hard-working families’ (Hoggett et al., 2013). While all political parties have talked this way at times, it is most famously captured in George Osborne’s 2012 remark:
Where is the fairness, we ask, for the shift-worker, leaving home in the dark hours of the early morning, who looks up at the closed blinds of their next door neighbour sleeping off a life on benefits?[3]
This political stance has been covered in the dramatic rise in press coverage of the benefits system since the start of the recession. While this raised coverage cannot be described simply as being more negative towards benefit claiming than before, there is a definite longer-run trend for benefits to be increasingly described as ‘handouts’ (Baumberg et al., 2012). One possibility, then, is that the attitudes of the ‘squeezed middle’ may follow the winds of these political and media discourses like a ‘weathervane’ (Curtice, 2010), hardening attitudes further.
In this chapter, we first look at trends in attitudes in the population as a whole to see if cost of living pressures – or policy changes, or rising social need – have led to recent changes in attitudes (as well as putting these in the context of the sweeping longer-term shifts that previous researchers have shown). We then look for evidence as to whether, within the current economic and political context, Britain’s struggling working households are becoming more or less sympathetic to those claiming benefits.

British Social Attitudes 31 | Benefits and the cost of living
NatCen Social Research
98
Public attitudes to the benefits system: are they changing?
So, we return firstly to the question of whether, ten years after the income of working-age households began to flatline, five years into recession and three years since the coalition government came to power, British Social Attitudes can identify any shifts in public attitudes to the benefits system. With this overall question in mind, we look at public opinions about three issues: Are benefits enough to live on? Are benefit claimants deserving of help? And should government benefit spending be reduced or raised?
The generosity of benefitsPeople’s views of the benefits system are in part related to their perceptions of ‘how well’ benefit claimants live on the benefits provided. Since 1994, British Social Attitudes surveys have periodically asked people to:
Think of a 25 year-old unemployed woman living alone. Her only income comes from state benefits. Would you say that she …
… has more than enough to live on …… has enough to live on …… is hard up …… or, is really poor?
They are then asked a follow-up question, in which they are told how much money the unemployed woman receives in state benefits which, in 2013, was £72 a week:
Now thinking again of that 25-year-old unemployed woman living alone. After rent, her income is £72 a week. Would you say that she … has more than enough to live on, has enough to live on, is hard up, or, is really poor?
These two questions together show how far general public perceptions of the adequacy of benefit levels are based on assumptions rather than knowledge about the actual amounts paid. They are particularly helpful in understanding the public’s views of unemployment benefits, rather than about welfare support more widely, as they focus on a single person without dependents, whose sole eligibility for benefits is through their worklessness status.[4] (We see later that this group generally receives far lower levels of public support than other claimants.)
In 2013, before being told the actual benefit level, under half (44 per cent) of the British public think that the benefits available to an unemployed single woman would not provide her with enough to live on (that is, they think she would be “really poor” or “hard up”, Table 6.1). The same percentage think she would have “enough” or ”more than enough” to live on, and one in eight (12 per cent) say they do not know. When they find out that she would be given £72 a week, the proportion who thinks that she would not have enough to live on increases to 56 per cent, although the increase is primarily accounted for by people who could not provide an answer to the first question – the proportion thinking that benefits are not enough to live on only drops slightly (from 44 per cent to 42 per cent). This fits other evidence that unemployment benefits are less than most (but not all) people think is enough to live on. For example, in a study in which researchers priced up

British Social Attitudes 31 | Benefits and the cost of living
NatCen Social Research
99
what a representative group of British people considered necessary for people to live on, benefits for single people were found to cover less than 40 per cent of the minimum income considered to be an acceptable standard of living (Hirsch, 2013).
Table 6.1 Perceived standard of living of 25-year old woman living alone on state benefits, 1994–2013
Before knowing the true amount of
benefits
After knowing the true amount of
benefits
1994 2000 2013 1994 2000 2013
Would say that she is … % % % % % %
More than enough 1 3 7 2 3 6
Has enough 21 31 37 25 28 36
Hard up 54 46 38 55 55 46
Really poor 16 10 6 16 13 10
(Combined answers) % % % % % %
Enough (or more than enough) to live on 22 34 44 27 31 42
Not enough to live on (hard up or really poor) 70 56 44 71 68 56
Weighted base 1187 3426 3244 1187 3426 3244Unweighted base 1167 3426 3244 1167 3426 3244
However, the public in 2013 appear to be more likely to think that the benefits available to an unemployed single person are enough to live on than they were in earlier decades. When the question was last asked in 2000, more than half (56 per cent) of people thought that the benefits were not enough to live on, a figure which rose to 68 per cent when they heard the actual benefit amount. And it is an even greater change from 1994, when 70 per cent of people felt the unemployed woman would not have enough to live on (71 per cent after knowing the amount). These findings are of particular interest given that the real value of unemployment benefits has fallen slightly over that period. In 2011/12 prices, an unemployed person’s benefits fell from £76 per week in 1994 to £71 in 2012. Moreover, in a study by Rutherford (2013), its value compared to average earnings fell from 14 per cent of average earnings in 1994 to 12 per cent in 2012. So, rather than reflecting actual changes in the generosity of benefits, the shift in attitudes towards the adequacy of the benefits may be linked to increasingly inaccurate perceptions about the level of benefits (the trend is sharper before people are told the true value of benefits), to wider feelings about the ‘deservingness’ of unemployed, or perhaps to the perceived difference between benefit levels and stagnating wages, discussed further below.
However, while public perceptions of the adequacy of unemployment benefit levels have hardened over the past twenty years, it is worth stressing that even today there is very little feeling that benefits provide a very generous standard of living; only seven per cent of people believe that benefits provide “more than enough to live on”, whereas 81 per cent think they only provide “enough to live on” or less.
Deservingness of claimantsDeservingness of welfare support is a multifaceted concept (van Oorschot, 2000; Baumberg et al., 2012), and, for three decades, British Social Attitudes has included a number of questions which cover different aspects of deservingness.
The public in 2013 appear to be more likely to think that the benefits available to an unemployed single person are enough to live on than they were in earlier decades

British Social Attitudes 31 | Benefits and the cost of living
NatCen Social Research
100
People are asked to respond using a scale from “agree strongly” to “disagree strongly” to statements such as[5]:
Around here, most unemployed people could find a job if they really wanted oneMany people who get social security don’t really deserve any help Most people on the dole are fiddling in one way or anotherLarge numbers of people these days falsely claim benefits
British Social Attitudes also captures whether people think the benefits system itself is encouraging ‘undeserving’ people to remain on benefits, with high benefit levels disincentivising paid work, or whether in fact levels are set unfairly low – combining people’s attitudes to the generosity of benefits with their perceptions of deservingness. People are asked:
Opinions differ about the level of benefits for unemployed people. Which of these two statements comes closest to your own view:
1. Benefits for unemployed people are too low and cause hardship, or …2. Benefits for unemployed people are too high and discourage them from finding jobs?
The trends in responses to these questions since 1993 are shown in Figure 6.1 (with further detail in appendix Table A.1), with levels of agreement to the first four statements above combining those who “agreed” or “agreed strongly”. In 2013, there is widespread concern about benefits for unemployed people. Over half of the British public agrees that “most unemployed people could find a job if they really wanted one” (54 per cent) and thinks that “unemployment benefits are too high” and discourage people from finding paid work (57 per cent). Beyond unemployment benefits, three-quarters (77 per cent) of people agree that “large numbers of people” falsely claim benefits. Yet only minorities agree that “most people on the dole are fiddling in one way or another”, or that “many people who get social security do not really deserve any help”. The most likely explanation here is that the “large numbers” that people believe claim falsely make up a sizeable minority of claimants (who are large in number), rather than a majority of claimants per se. This fits with other evidence that people are very concerned about some undeserving claimants getting benefits, but they do not think that most claimants are outright false or fraudulent – rather, they think this applies only to a substantial minority of claimants (Baumberg et al., 2012).
On the face of it, it also seems slightly puzzling that so many people think that unemployment benefits do not provide enough to live on (44 per cent, reported in the previous section), while only 22 per cent of people think that unemployment benefits are too low and cause hardship, rather than too high and disincentivising work (see appendix Table A.1). One possible explanation may be that people think that low-paid work also leaves people with too little to live on, so that inadequate benefits may still provide a disincentive to work. This seems to be confirmed by an earlier (1999) British Social Attitudes question, where 68 per cent of people said that a 25-year old single woman on the minimum wage would not have enough to live on, and by more recent polling elsewhere.[6]
77%of people agree that “large numbers of people” falsely claim benefits

British Social Attitudes 31 | Benefits and the cost of living
NatCen Social Research
101
Figure 6.1 Trends in perceived deservingness of benefit claimants, 1993–2013
The data on which Figure 6.1 is based can be found at Table A.1 in the appendix to this chapter
Looking over time, it is clear that attitudes have changed considerably over the past two decades. As previous British Social Attitudes reports have catalogued, claimants are today viewed as noticeably less deserving than they were up until 1996, and this is particularly true for attitudes to unemployment claimants (e.g. Clery et al., 2013). Our particular interest is in whether there are signs of the impact of the growing pressures on living standards since around 2003 and particularly since the financial crisis in 2007, and of the public’s reactions to the coalition government’s austerity cuts regarding benefits. On the issue of living standards, there is some evidence that attitudes towards benefit claimants in general, and unemployed claimants in particular, softened in the late years of the Labour government as the economic recession hit in 2008/9 (although levels of support for claimants by no means returned to that of the earlier period of the Labour government). For example, public agreement that many social security claimants do not deserve help rose from 24 per cent in 1993 to 31 per cent in 2000, and to 40 per cent by 2005, before falling back by 2009 to the current level of 33 to 35 per cent. Similarly, 2008/9 saw a sharp decline in the number of people agreeing that most unemployed people could find a job – not enough to cancel out the earlier rise, but still easily visible to the naked eye.
In the years of the coalition government (2010 to 2013), there has also been a slight fall in levels of public agreement that large numbers of people falsely claim benefits, back to a level last seen in 2000 – providing some further support for the idea that attitudes have been ‘softening’ in response to changes in government policies and to rising social need. Yet beyond this, there are only small signs of any other changes since 2010. For example, the minority proportion in 2013 who agree that many claimants do not deserve help (33 per cent) is only slightly different from the 35 per cent in 2010. Views on whether most unemployed people could find a job have stayed static, and views on whether unemployment benefits discourage work have fluctuated with no clear pattern.
So, overall, while there are some signs of attitudes softening slightly in recent years, the picture is primarily one of a long-term decline in the perceived deservingness of benefit claimants (primarily happening in the late 1990s and early 2000s), with little change since. Nevertheless, it is worth stressing that public attitudes to benefits are not quite as negative as they are sometimes portrayed, an issue to which we return in the Conclusions.
0%
10%
20%
30%
40%
50%
60%
70%
80%
90%
93 95 97 99 01 03 05 07 09 11 1394 96 98 00 02 04 06 08 10 12
% agreeing most unemployed could �nd job % agreeing large numbers falsely claim % agreeing unemployed bene�t discourages work % agreeing many claimants don't deserve help
Labour elected
Coalition elected
Onset of recession

British Social Attitudes 31 | Benefits and the cost of living
NatCen Social Research
102
Support for benefit spendingSo far we have reported on what the British public think about benefit claimants and about the level of benefits. But perhaps the most important indicator of public support for the benefits system (at least from the short-term perspectives of politicians looking to garner votes) is whether people say they want increases or cuts to benefits spending. This issue depends not only on people’s attitudes to benefits, but also whether or not they support higher taxes, and whether or not they perceive a need to change levels of public spending. This latter point is made in the context that all three main political parties have talked about the need to reduce the public spending deficit. British Social Attitudes has frequently asked how far people agree or disagree (using a five-point scale) that:
The government should spend more money on welfare benefits for the poor even if it leads to higher taxes
In 2013, the public is split on this issue, with slightly more people agreeing than disagreeing that there should be more spending on welfare benefits for the poor (36 per cent versus 32 per cent). However, levels of support are now at their highest since the economic downturn in 2008. Looking over the past 15 years in Table 6.2, support for more spending declined between 2002 and 2004, and further declined again between 2008 and 2011 in the economic downturn, only to have risen by 2013. This seems to follow a ‘thermostatic’ pattern as we outlined in the Introduction: as benefit spending is (perceived to) increase, fewer people believe that we should spend more, and vice versa. So, after a period of government cuts, public support for more spending on benefits seems to be rising.
Table 6.2 Attitudes to spending on “welfare benefits for the poor”, 1998–2013
1998 2002 2004 2006 2008 2011 2013
Government should spend more on welfare benefits for the poor, even if this means higher taxes % % % % % % %
Agree 43 44 36 35 35 28 36
Neither agree nor disagree 29 27 30 34 28 32 30
Disagree 26 26 32 29 35 39 32
Weighted base 2546 2929 2610 2813 2956 2841 2825Unweighted base 2531 2900 2609 2822 3000 2845 2832
However, “welfare benefits for the poor” covers a diverse set of different benefits, and it is revealing to look at the public’s responses to the following question which asks about spending more or less (again on a five-point scale) on each of a series of different types of benefits and tax credits:
Some people think that there should be more government spending on social security, while other people disagree. For each of the groups I read out please say whether you would like to see more or less government spending on them than now. Bear in mind that if you want more spending, this would probably mean that you would have to pay more taxes. If you want less spending, this would probably mean paying less taxes.
The public is split on this issue, with slightly more people agreeing than disagreeing that there should be more spending on welfare benefits for the poor

British Social Attitudes 31 | Benefits and the cost of living
NatCen Social Research
103
Benefits for unemployed people?Benefits for single parents?Benefits for disabled people who cannot work?Benefits for people who care for those who are sick or disabled?Benefits for retired people?Benefits for parents who work on very low incomes?
The answers in Table 6.3 show a clear distinction between the public’s perception of ‘deserving’ and ‘less deserving’ claimants. In 2013, there is majority support for more spending on those who cannot work because they are disabled (54 per cent) or caring for someone who is sick or disabled (73 per cent), and for working parents on very low incomes (59 per cent). For these three groups, almost no one (five per cent or fewer) believes there should be less government spending. For retired people and single parents, more people think that government should raise spending rather than cut it (48 per cent versus seven per cent; and 31 per cent versus 19 per cent respectively). In stark contrast, far more people think that government should spend less (49 per cent) on benefits for unemployed people than think it should spend more (15 per cent).
Table 6.3 Attitudes to government spending on different benefits claimants, 1998–2013
1998 2002 2004 2006 2008 2011 2013
% would like to see more government spending on benefits for …
… people who care for those who are sick or disabled 82 82 81 82 83 74 73
… parents who work on very low incomes 68 69 62 66 67 58 59
… disabled people who cannot work 72 69 63 62 61 53 54
… retired people 71 73 73 72 72 57 48
… single parents 34 39 35 38 37 29 31
… unemployed people 22 21 15 16 14 15 15
% would like to see less government spending on benefits for …
… people who care for those who are sick or disabled 1 1 1 1 1 1 1
… parents who work on very low incomes 3 4 4 4 4 5 5
… disabled people who cannot work 2 2 3 3 4 5 4
… retired people 2 2 2 2 2 3 7
… single parents 21 18 18 19 17 21 19
… unemployed people 35 36 44 45 54 51 49
Weighted base 3146 3435 3199 3228 3333 3311 3244Unweighted base 3146 3435 3199 3240 3358 3311 3244
Of course, these questions are not asking about absolute spending, but rather about whether the government should be spending more or less than it is currently doing. Therefore, the public’s views on whether there should be more or less state spending on particular groups are given in the context of perceived current spending on each. Thus, any suggested increases or decreases may reflect not only views on the ‘deservingness’ of each group, but also perceptions of whether real spending has got more or less generous – the ‘thermostatic’ element to people’s responses that we mentioned above.
49% think that government should spend less on benefits for unemployed people

British Social Attitudes 31 | Benefits and the cost of living
NatCen Social Research
104
Take retired people, for instance. It is notable that support for more spending on retired people fell noticeably between 2011 and 2013, unlike for other groups. This may well be a thermostatic response to the fact that pensioners’ incomes have been rising over the past ten years, and even over the past five years, in stark contrast to working-age households (Office for National Statistics, 2013). It may also be a reaction to the very clear message from the coalition government that pensioner benefits are being protected for the life of this Parliament in contrast to other benefits, such as this statement from David Cameron in 2012:
There is also a debate about some of the extra benefits that pensioners can receive – and whether they should be means-tested. On this I want to be very clear. Two years ago I made a promise to the elderly of the country and I am keeping it. I was elected on a mandate to protect those benefits – so that is what we have done.[7]
In general, though, these attitudes appear to reflect the British public’s perceptions of the deservingness of each group rather than actual spending. Indeed, there is a ‘hierarchy of deservingness’ that can be seen across nearly all countries at nearly all times, whereby unemployed people are seen as less deserving than disabled people or pensioners (van Oorschot, 2000).
In terms of changes in levels of support over the past 15 years, there has been a long-term reduction in support for more spending on unemployed people and disabled people (the change primarily occurring between 2002 and 2004). More recently we can see that support for more spending went down between 2008 and 2011, as politicians of all major parties spoke about reducing the government spending deficit. Yet, in general, it is remarkable how resilient these preferences for more spending are for all groups except for unemployed people. Even in the context of politicians stressing the need for reducing the deficit, there is more support for raising rather than lowering spending on benefits for all claimants except for the unemployed.
In this chapter, we have seen a long-term decline in support for benefits claimants and spending, but – despite changes in spending levels, social need and considerable media attention – there has been relatively little change in the past few years (barring occasional signs of slightly softening attitudes). So far, however, we have been looking at the views of the British population as a whole. We now explore in more detail the attitudes of those who are struggling financially themselves, or think that others are struggling. Are they more supportive of the benefits system than those living more comfortably, feeling closer to those living on low-income benefit levels and or more likely to feel the need for the benefits system? Or are they in fact less supportive, perceiving an injustice between their earned income and the income available from benefits?
Benefits and the cost of living ‘squeeze’: the attitudes of working householdsWe might expect people’s attitudes towards benefit claiming to be influenced both by whether they themselves feel they are struggling financially to live on earned income, and by whether they think that many other people are struggling on low incomes. We have used the following question to identify people who live in ‘working households’ – that is, working-age households whose main source
We have seen a long-term decline in support for benefits claimants and spending

British Social Attitudes 31 | Benefits and the cost of living
NatCen Social Research
105
of income is not benefits, containing a person in work[8] – who are struggling financially, as well as those who live comfortably:
Which of the phrases on this card would you say comes closest to your feelings about your household’s income these days?
1. Living really comfortably on present income 2. Living comfortably on present income 3. Neither comfortable nor struggling on present income 4. Struggling on present income 5. Really struggling on present income
In 2013, only a minority (44 per cent) of people living in working households in Britain feel that they are living comfortably on their current income (Table 6.4). While a similar proportion (38 per cent) of people report that they are neither financially comfortable nor struggling, our particular interest is in the one in five people (18 per cent) who tell us that they are struggling. These are the people who are earning money from work, but who find it difficult to make ends meet on that income.
Unsurprisingly, those with low household incomes are much more likely to feel they are struggling than those with higher incomes (for instance, those in the lowest income quartile are more than seven times more likely to say so than those in the highest income quartile – 42 per cent compared to six per cent). However, the fact that some higher income households struggle financially (perhaps due to the number of dependents on that income)[9] highlights the importance of using this subjective measure of financial ‘coping’ rather than simply raw figures on household income. It is striking that even among the second-highest income quartile, a majority (57 per cent) say they are not living comfortably.
British Social Attitudes does not include a question which captures people’s perceptions of how far other people in Britain are struggling financially. However, a reasonable proxy is a question which asks about people’s perceptions of poverty in Britain:
Some people say there is very little real poverty in Britain today. Others say there is quite a lot. Which comes closest to your view …
… that there is very little real poverty in Britain …… or, that there is quite a lot?
Almost two-thirds (62 per cent) of people in working households believe that there is “quite a lot” of real poverty in Britain today. Although this is the view of a majority of people in each income quartile, slightly fewer of those in the highest-income households think this (54 per cent compared to 65 to 67 per cent of people in other income groups).
44% of people living in working households in Britain feel that they are living comfortably

British Social Attitudes 31 | Benefits and the cost of living
NatCen Social Research
106
Table 6.4 Feeling about household’s income, by household gross income quartile
AllLow
(<£20k)
Second-lowest
(£20–32k)
Second-highest
(£32–50k)Highest (>£50k)
Feeling about household’s income these days … % % % % %
Living (really) comfortably 44 15 34 43 66
Neither 38 42 41 48 28
(Really) struggling 18 42 25 10 6
Perceived amount of real poverty in Britain today … % % % % %
Very little 34 31 31 30 41
Quite a lot 62 67 65 67 54
Weighted base 1860 316 316 390 521 Unweighted base 1650 328 304 350 426
Restricted to those of working age (men aged 16–64, women 18–59 for consistency over time), excluding people whose main source of income is benefits or where neither the respondent nor their partner works (see note 8). The table also excludes those who did not respond to any of these questions (unlike other tables in this chapter)
While the focus here is on financial struggles among working households, in order to speak to current debates, we should also be aware of the much greater financial struggles of households whose main income source is benefits. Indeed, the majority of these households say they are struggling financially (58 per cent). It is also crucial to realise that ‘working households’ and ‘benefit-claiming households’ are neither mutually nor permanently exclusive categories. Most people who claim benefits do so for short periods and work at other times, and many British people claim benefits at some point in their lives. Moreover, the respondent or their partner in a small number (4 per cent) of these ‘working households’ claim out-of-work benefits while 15 per cent claim tax credits; it is just that these are not their main source of income. Similarly, just over 20 per cent of these ‘working households’ include an adult who is not working (either the respondent or their partner).
Still, our main interest is in the attitudes to benefits of working households, and whether their views differ dependent on the financial situation of their own household, and on their perception of how well others in Britain are faring financially. We are interested both in the current picture, and in whether attitudes converge or diverge in times of economic prosperity or austerity over the past 10 to 15 years.
The current pictureSo, in 2013, around one in five people in working households say their household is struggling financially and almost two-thirds believe there is quite a lot of poverty in Britain – but how does this relate to their attitudes to the benefits system? As set out in the Introduction, we might expect the attitudes of the ‘squeezed middle’ to be different to those able to live comfortably on their income. Likewise, among people in working households, we might expect different views from those people who feel that there are a lot of British people living in poverty and those who think poverty is less common. However, it is hard to predict who will be more or less positive about the benefits system. The answers to this question are shown in Tables 6.5 and 6.6, where we show how levels of support for benefit claiming varies between those struggling financially and living comfortably, and those who think there is more or less poverty in Britain, revisiting six of the key questions that were discussed earlier in the chapter.
Around one in five people in working households say their household is struggling financially

British Social Attitudes 31 | Benefits and the cost of living
NatCen Social Research
107
In each table, higher percentages indicate a greater level of sympathy with claimants or support for the benefits system. In order to identify how someone’s financial situation is associated with their views on benefit claiming, we have controlled for the socio-demographic differences between those who were struggling and those who were comfortably off. (For example, those struggling financially are more likely to be women, middle-aged (25–44) and to have lower qualifications than those living comfortably). So, the percentages in the tables assume that the profile of people in the two groups were the same in terms of gender, age, and education.[10]
In several respects, people in working households who are themselves struggling financially are more supportive of the benefits system than those living comfortably. They are statistically significantly more likely to think that unemployment benefits are not enough to live on (9 percentage point gap) and that they are too low (seven percentage point gap). They are also more supportive of welfare spending than those who are comfortably off (16 percentage point gap). However, the other differences are not statistically significant, meaning that they are small enough that they could simply be down to chance.
Table 6.5 Attitudes to benefits, by how well households are coping financially
Feeling about household’s income these days
(Really) struggling
Living (really) comfortably
Difference struggling–
comfortable
Adjusted* percentages agreeing that …
Benefits for unemployed are not enough to live on 53 44 9
Benefit of £72/wk after rent is not enough to live on 62 58 4
Unemployment benefits too low and cause hardship 22 16 7
Disagreeing that many on dole are fiddling 34 35 -1
Disagreeing that many claimants don’t deserve help 31 28 3
Should spend more on welfare benefits for the poor 42 26 16
Weighted base (varies by question) 285–323 676–775Unweighted base (varies by question) 269–303 591–672
Restricted to those of working age (men aged 16–64, women 18–59 for consistency over time), excluding people whose main source of income is benefits or where neither the respondent nor their partner works. Only certain differences are statistically significant at conventional levels (that is, they are unlikely to be due to random variation from only taking a sample rather than speaking to the full population) – see text *‘Adjusted’ means that we have controlled for differences between the groups in age, gender and education[10]
The parallel results for those who think there is a lot or little poverty in Britain are shown in Table 6.6. Again the table focuses on people living in working households, and again we have controlled for differences in the socio-demographic profile of those who perceive a lot or little poverty. We also control for people’s views of what ‘poverty’ is.[11] Holding these other factors constant, people who think there is quite a lot of poverty in Britain today have different attitudes to the benefits system than those who perceive very little poverty. There are statistically significant differences across several measures: the perceived generosity of benefits, the view that unemployment benefits are too
In several respects, people in working households who are themselves struggling financially are more supportive of the benefits system than those living comfortably

British Social Attitudes 31 | Benefits and the cost of living
NatCen Social Research
108
low and cause hardship (similar patterns are seen for the other deservingness questions, but the differences are smaller and not statistically significant), and whether people want more spending on benefits per se. So for example, 36 per cent of those who perceive quite a lot of poverty agree that we should spend more on welfare benefits for the poor, compared to only 20 per cent of those who perceive very little poverty (a 16 percentage point gap).
Table 6.6 Attitudes to benefits, by perceptions of poverty
Perceived amount of real poverty in Britain today
Quite a lot Very littleDifference quite a
lot–very little
Adjusted* percentages agreeing that …
Benefits for unemployed are not enough to live on 50 36 14
Benefit of £72/wk after rent is not enough to live on 62 51 11
Unemployment benefits too low and cause hardship 21 11 10
Disagreeing that many on dole are fiddling 33 28 5
Disagreeing that many claimants don’t deserve help 31 24 6
Should spend more on welfare benefits for the poor 36 20 16
Weighted base (varies by question) 515–594 955–1068Unweighted base (varies by question) 458–522 859–957
Restricted to those of working age (men aged 16–64, women 18–59 for consistency over time), excluding people whose main source of income is benefits or where neither the respondent nor their partner works. Only certain differences are statistically significant at conventional levels (that is, they are unlikely to be due to random variation from only taking a sample rather than speaking to the full population) – see text *‘Adjusted’ means that we have controlled for differences between the groups in age, gender and education[10]
It remains quite possible that people do not have different attitudes because they are struggling financially themselves or perceive others as having financial difficulties, with these patterns instead reflecting other, unobserved factors.[12] Still, in 2013, it seems that working households who perceive cost-of-living pressures (either their own struggles or wider poverty) are often more sympathetic to the plight of people living on benefits and more in favour of higher benefits spending than those who are more comfortably off. But has this always been the case, and do recent pressures on the cost of living appear to have affected the views of these working households? To answer this, we must first understand whether there have been changes in households’ financial struggles and, likewise, whether people in working households have shifted perceptions on the amount of people in Britain living in poverty.
Trends in financial struggling and perceived poverty levelsWhile there is little question that public discourse about the cost of living has grown, underpinned by some hard economic data (see Introduction), there is relatively little evidence on whether, over time, people in working households have come to feel more or less able to cope on their household’s earnings, or feel that increasing numbers of people around them are living in poverty. British Social Attitudes offers an opportunity to examine this, having asked questions on these two issues for at least twenty years. The answer categories for the
36% of those who perceive quite a lot of poverty agree that we should spend more on welfare benefits for the poor, compared to only 20% of those who perceive a little poverty

British Social Attitudes 31 | Benefits and the cost of living
NatCen Social Research
109
question on the extent to which people themselves are living comfortably or struggling on their current income changed in 2010, moving from a four to a five-point response scale, and from asking about “finding things difficult” to “struggling”.[13] Although these changes do appear to have affected how people answered the question (and therefore the periods 1995 to 2009 and 2010 to 2013 are shown separately in Figure 6.2), they provide a pattern of how working households feel they have coped over the past two decades.[14]
Within working households, people’s views on their financial situation do appear to have followed what has happened in the British economy over that period. In the period of economic growth from the mid-1990s to 2002, the proportion of people in working households who found things financially difficult fell from 14 per cent in 1995 to 10 per cent in 2003. (Appendix Table A.2 shows there was also a reduction in those saying they were merely coping, and an increase in those feeling comfortably off.) Proportions reporting financial difficulties began to increase from 2003 when median incomes stopped rising, at which point ever-fewer people felt financially comfortable and increasing numbers found things difficult. But there was a step-change from 2007 with the financial crisis, with 21 per cent of people in working households saying they were finding things financially difficult in 2008. Since the change in question wording from 2010, the numbers reporting financial struggles have increased from 14 to 18 per cent. Likewise, the number perceiving “quite a lot” of poverty rose from 58 per cent to 62 per cent between 2009 and 2013, and there was a particularly sharp rise in people thinking that poverty had risen over the past ten years (from 47 per cent in 2009 to 64 per cent in 2013).[15] The recent rise in perceived poverty is particularly striking as people have become slightly less generous between 2010 and 2013 in what they take ‘poverty’ to mean.[16] All of these changes are statistically significant.
If we assume that the year-on-year changes would have been the same with the old question responses as we see with the newer ones, then the numbers of people struggling or finding it difficult in 2013 is at the same level as in 2008 but otherwise higher than any other time during the period 1995 to 2013 (see also note 14). This also fits much of the picture that we can get from other sources.[17]
Figure 6.2 Trends in people’s perceptions around cost of living, 1995–2013
Restricted to those of working age (men aged 16–64, women 18–59 for consistency over time), excluding people whose main source of income is benefits or where neither the respondent nor their partner works. The data on which Figure 6.2 is based can be found at Table A.2 and Table A.3 in the appendix to this chapter
0%
10%
20%
30%
40%
50%
60%
70%
95 97 99 01 03 05 07 09 11 1396 98 00 02 04 06 08 10 12
Own �nances dif�cult Own �nances struggling Poverty rising in Britain Quite a lot of poverty in Britain
British Social Attitudes 31 | Benefits and the cost of living
NatCen Social Research
110
Attitudes towards benefit claiming and trends in financial struggling and perceived poverty levelsWe know that, in 2013, people struggling financially within working households are generally more positive about the benefits system, as are people in working households who feel that quite a lot of people in Britain are living in poverty. Is this feeling of cohesiveness or support for their benefit dependent working-age counterparts from these groups a function of the recent increases in pressures on the cost of living? Or has this been the case in earlier times of greater economic prosperity?
To address this question, we focus on those questions in the section on ‘the current picture’ that were measured repeatedly over time: whether unemployment benefits are too low and cause hardship (or too high and disincentivise work), whether many dole claimants are fiddling, whether many claimants don’t deserve help, and whether people think we should spend more on welfare benefits for the poor. Clearly, there may well have been some changes in the socio-demographic profile of those who view themselves as “struggling financially” or “living comfortably” over this period. If we want to understand whether the gap between the two groups has narrowed or widened over time, we need to control for these differences, as we did in Tables 6.5 and 6.6. The changes over time in the benefit attitudes of those struggling vs. those living comfortably are therefore shown in Tables 6.7 and 6.8, after controlling for any changes in age, gender and education, separating the results for 2000–2009 and 2010–2013 due to the change in question wording.
So for example, in 2000 in Table 6.7, 55 per cent of those who were finding it difficult financially and 33 per cent of those who were living comfortably thought that unemployment benefits were too low: a 22 percentage point gap. By 2009, these figures were 41 per cent and 24 per cent, with the gap between them now 17 per cent. Although this appears to be a convergence of opinions between the two groups, this five percentage point narrowing of the gap was not statistically significant. However, between 2010 and 2013 in Table 6.8, the gap has narrowed statistically significantly. In 2013, those who are struggling financially are still more likely than those who are living comfortably to support the benefits system. However, their views are not as different to those of the more comfortably off than they were in 2010. This is consistent with the hypothesis set out in the Introduction that people struggling financially but not claiming benefits may become more sensitive to a perceived lack of incentives to work in a context where real median wages are not rising.
Looking at the rest of Table 6.7 and 6.8, we see no other such statistically significant shift in the attitudes towards welfare spending. However, in nearly every case the direction of change has been for the gaps between those with financial struggles and those living comfortably to narrow both 2003–2009 and 2010–2013. (Furthermore, the 2010–2013 change is close to being statistically significant for the question on whether many on the dole are fiddling).[18] In other words, working households struggling financially are generally more supportive of the benefits system than those living comfortably, but the extent of this has fallen since the year 2000 – particularly for views about unemployment benefits since 2010. The one exception to this is for agreement that we should spend more on welfare benefits for the poor in the more recent period: 17 percentage points more of those struggling financially agreed with this in 2010 than those living comfortably, and this increased to a 21 percentage point gap in 2013.
Working households struggling financially are generally more supportive of the benefits system than those living comfortably, but the extent of this has fallen since the year 2000

British Social Attitudes 31 | Benefits and the cost of living
NatCen Social Research
111
Table 6.7 Attitudes to benefits, by living comfortably vs. finding it difficult on present income (working households only), 2000–2009
2000 2009
Difference: finding it difficult vs. living
comfortably
Find
ing
it
diffi
cult
Livi
ng
com
fort
ably
Find
ing
it
diffi
cult
Livi
ng
com
fort
ably
Gap
in a
gre
e
in 2
000
Gap
in a
gre
e
in 2
009
Cha
nge
in g
ap
fro
m 2
000
to 2
009
Adjusted* percentages agreeing that …
Unemployment benefits too low and cause hardship 55 33 41 24 22 17 -5
Disagreeing that many on dole are fiddling 32 27 28 30 6 -3 -8
Disagreeing that many claimants don’t deserve help 49 35 36 29 14 7 -7
Should spend more on welfare benefits for the poor 50 34 35 22 17 13 -3
Unweighted bases 335–389 797–897 184–221 314–360 n/a n/a n/aWeighted bases 303–345 868–976 175–210 325–374 n/a n/a n/a
Table 6.8 Attitudes to benefits, by living comfortably vs. struggling on present income (working households only), 2010–2013
2010 2013Difference: struggling vs. living comfortably
Str
ugg
ling
Livi
ng
com
fort
ably
Str
ugg
ling
Livi
ng
com
fort
ably
Gap
in 2
010
Gap
in 2
013
Cha
nge
in g
ap
fro
m 2
010
to 2
013
Adjusted* percentages agreeing that …
Unemployment benefits too low and cause hardship 41 17 32 18 25 14 -10
Disagreeing that many on dole are fiddling 34 28 32 33 6 -1 -7
Disagreeing that many claimants don’t deserve help 38 26 34 28 12 6 -6
Should spend more on welfare benefits for the poor 42 25 51 30 17 21 4
Unweighted bases 426–526 1251–1450 523–613 1168–1329 n/a n/a n/aWeighted bases 422–515 1274–1471 512–598 1169–1338 n/a n/a n/a
Restricted to those of working age (men aged 16–64, women 18–59, as used in official statistics at the start of the period), excluding people whose main source of income is benefits or where neither the respondent nor their partner works. Only some changing gaps are statistically significant (that is, we are reasonably confident that they are real patterns rather than just random statistical noise in the data) – see text *‘Adjusted’ means that we have controlled for differences between the groups in age, gender and education[10]
British Social Attitudes 31 | Benefits and the cost of living
NatCen Social Research
112
This is noticeably less pronounced when we look at people’s perceptions of whether other people in Britain are struggling financially. Working households who believe there is quite a lot of poverty are considerably more supportive of the benefits system than those who believe there is a little (as above), but the size of this gap has changed little over the entire period 2000 to 2013.[19]
So for example, in 2000, 45 per cent of those who believed there is quite a lot of poverty in Britain agreed that there should be more spending on welfare benefits for the poor, compared to only 26 per cent of those who believe there is very little poverty. However, the respective figures in 2013 are almost identical at 43 per cent and 23 per cent (after holding constant people’s age, gender and education).
Overall there is therefore some support for the idea that people’s cost of living pressures have been associated with a greater sensitivity to the disincentives to work in the benefits system, in that the additional support for unemployment claimants among those struggling financially and those living comfortably has narrowed between 2010 and 2013. However, we only see a statistically significant pattern for this on one measure. Otherwise, the general picture is therefore much as it was described above: people’s financial struggles are only a relatively weak determinant of most attitudes, while the perception of widespread poverty in Britain remains a moderately strong determinant of what people think of benefits claimants and benefits spending.
Conclusions
Attitudes to benefitsThere has been a widely-reported hardening in public attitudes to the benefits system in the past two decades. More recently, though, there are good reasons to have expected public attitudes to benefit claiming to have changed. If people’s views respond like a thermostat, reacting to how much they think is being spent on benefits, we might expect to see an increased proportion in favour of raising benefits spending following recent reductions in spending. There have also been rises in levels of social need in Britain – rising unemployment, benefits cuts and sanctioning – and also cost of living pressures even for those who are working. It is hard to predict whether this might lead to more support for the benefits system (both through rising self-interest and rising perceptions of genuine need), or to less support (through increased resentment of benefit claimants).
However, despite all these changes, the first part of this chapter shows that attitudes have actually changed relatively little in the past few years. There are occasional signs of attitudes softening:[20] fewer believe that “large numbers of people these days falsely claim benefits” and levels of support for spending more on welfare benefits for the poor are now at their highest since the economic downturn in 2008 (although there is no rise in support for spending when we look at benefits for specific groups, and there is even a drop in support for spending on benefits for retired people). Furthermore, one attitude that was thought in last year’s report to be softening has since gone in the reverse direction, about whether unemployment benefits are too low and cause hardship versus disincentivisingly high. Overall, changes in attitudes since 2009 are relatively few, and much smaller in scale than the far-reaching shifts over the fifteen years that preceded them. This seems to confirm that the longer-term changes in attitudes were neither simply reactions to a period of economic
Attitudes have actually changed relatively little in the past few years

British Social Attitudes 31 | Benefits and the cost of living
NatCen Social Research
113
growth (which has now ended) nor to perceived increases in the generosity of the benefits system under the Labour government of the time (which has now been replaced).
However, it is crucial to stress that considerable support for the benefits system remains – a fact that is often lost when the longer-term trends are reported. Over 60 per cent of the British public believes that there is quite a lot of real poverty in Britain and that poverty has been increasing over the past ten years (both of which have risen since the question was last asked). People do not believe that benefits on their own are particularly generous; few people believe that unemployment benefits provide more than enough to live on, and when people are told the actual level of unemployment benefits, most people think they do not provide enough to live on. (That said, people also believe that low-paid jobs do not provide enough to live on, which seems to be the reason that a majority still believe that unemployment benefits are too high.) Previous British Social Attitudes reports have shown that majorities of people still believe that the government should be mainly responsible for ensuring people have enough money to live in retirement, if they become unemployed, or if they become disabled (Clery, 2012). Only a minority agree that many social security claimants do not deserve help, or that most unemployment claimants are “fiddling” – despite unemployment claimants being the most unpopular type of claimant in the benefits system – even if most people think that large numbers falsely claim benefits. Elsewhere we have shown that despite widespread concern about benefit fraud, most people do not think that most claimants are ‘false’ or ‘fraudulent’ (Baumberg et al., 2012). Finally, the numbers of people wanting to raise spending on benefits in general, or raise pensioner and single parent benefits are greater than the numbers who want to cut them – and there are outright majorities in favour of more spending on disabled people, carers, and parents working on low incomes.
This is not to deny that there has been a considerable hardening in attitudes towards claimants, or that many are ambivalent or favour lower spending on unemployment benefits, which are seen as too high compared to low-waged work. Still, an accurate view of public attitudes must be aware of the levels of support for benefits spending that nonetheless remain, which are often overlooked in debates about benefits in Britain.
Attitudes to benefits and cost of living pressuresWhile concerns about the cost of living are clear in both political debate and in hard economic data, the link between these concerns and people’s attitudes about the benefits system has rarely been explored. The slight recent changes in attitudes that have occurred – and the absence of more far-reaching changes – also raise further questions about the link between cost of living pressures and attitudes about the benefits system. We looked at whether ‘squeezed’ households (working-age households containing a working adult whose main source of income is not benefits, who report struggling financially) have different attitudes to benefit claiming, or whether there are any differences among those who perceive many others as struggling financially. And we report on how the attitudes of this group have changed over time.
In British Social Attitudes, just under one in five people say their household is struggling financially, a majority say they are not living comfortably, and a majority believe there is quite a lot of poverty in Britain. At the start of the chapter, we presented the fact that a reasonable case could be made that the
Considerable support for the benefits system remains

British Social Attitudes 31 | Benefits and the cost of living
NatCen Social Research
114
‘squeezed middle’ might have either harder or softer attitudes to benefit claiming than their more comfortably off counterparts. Their own financial struggles may make people more supportive of benefit claimants and the benefits system; yet equally plausibly the struggles of these ‘hard-working families’ may make them resentful of benefits spending. In practice, and after taking into account people’s age, gender and class we find that people struggling financially are noticeably more supportive of greater spending on “welfare benefits for the poor”, and they are more likely to think that unemployment benefits are not enough to live on. Likewise, where people in working households perceive that others’ poverty is widespread, they are more supportive than those who think that poverty affects only a minority of claimants and benefits spending.
More people are struggling financially than they have been in the past, and they also perceive others as being in the same plight. Although comparisons over time are made slightly more complex by a slight change of question in 2010, we see an increase in the proportion of working households in financial difficulties from 11 per cent to 17 per cent between 2006 and 2009, and then a rise in the proportion struggling from 14 per cent to 18 per cent between 2010 and 2013. There has also been a rise in the proportion of people perceiving there to be “quite a lot” of poverty, from 58 per cent to 62 per cent between 2009 and 2013, and a very sharp rise over the same period in the perception that poverty has increased in the past ten years, from 47 per cent to 64 per cent. In this sense, people’s experiences and perceptions do seem to have at least partly followed both political debate and the lack of growth in average living standards in the past ten years.
Finally, this raises the question of whether it has always been the case that those in working households who struggle financially are more supportive of the benefits system, or whether this is affected by the economic cycle. It appears that the answer is ‘yes’: most of the differences we see today are also visible in the year 2000. However, more recently financial strugglers in working households have become more sensitive to the disincentive effects of unemployment benefits, with their views converging a little with those living comfortably. This is not the case when we look at those who perceive there to be little or a lot of poverty in Britain, with the gap in attitudes between these two groups as wide now as it was in 2000.
Final thoughtsThe cost of living debates in the past few years have happened alongside occasional signs of a softening of public attitudes to the benefits system, both in terms of the perceived deservingness of claimants and in terms of preferences for spending on “benefits for the poor”. At the same time, those struggling financially also seem to have become more worried about the disincentive effects of unemployment benefits, relative to those living comfortably. However, there is little sign of change in other attitudes (including those around perceived deservingness and spending preferences), and even those trends that exist are relatively slight in comparison to the more far-reaching hardening of attitudes that came in the preceding 10 to 15 years. And despite this hardening, considerable sympathy for the benefits system does remain – which can be seen most clearly of all in the fact that even in 2013, there are greater numbers who want more spending on benefits for disabled people, carers, single parents, pensioners, parents working on low incomes and on benefits in general than the numbers who want less spending.
More people are struggling financially than they have in the past, and they also perceive others as being in the same plight

British Social Attitudes 31 | Benefits and the cost of living
NatCen Social Research
115
Notes1. See also http://inequalitiesblog.wordpress.com/2013/09/11/a-softening-of-
attitudes/.
2. ONS Labour Market Statistics, March 2014, Table A03 for people aged 15 to 59/64, seasonally adjusted (www.ons.gov.uk/ons/publications/re-reference-tables.html?edition=tcm%3A77-301417 accessed 15/4/2014).
3. www.newstatesman.com/blogs/politics/2012/10/george-osbornes-speech-conservative-conference-full-text, accessed 20/3/2014.
4. See Baumberg et al. (in preparation) for a discussion of other scenario questions asked in previous BSA surveys, involving an unemployed single mother and a retired woman.
5. Survey respondents respond to the first three statements using a five-point response scale including a mid-point “neither agree nor disagree”, while the fourth statement has a four-point scale.
6. In a TUC poll, people said (i) that an unemployed couple with two children would have substantially less than they ‘need to live on … without luxuries’, but (ii) that they nevertheless would be worse off if one of them took 30hrs/wk of a minimum wage job. Again, this implies that people do not regard a minimum wage job as sufficient to live on (www.tuc.org.uk/social/tuc-21796-f0.cfm, accessed 17/4/2014; this data is analysed further in Baumberg et al. in Preparation).
7. www.telegraph.co.uk/news/politics/david-cameron/9354163/David-Camerons-welfare-speech-in-full.html, accessed 2/4/2014.
8. We have followed the approach of the Resolution Foundation in focusing on working-age people, given that real incomes among pensioners have continued to rise while incomes among working-age households have been static (Office for National Statistics, 2013). The Resolution Foundation’s definition of the ‘squeezed middle’ is of people in households below average (median) income, excluding both the poorest 10 per cent and ‘benefit-reliant’ households (those that receive more than 20 per cent of their income from means-tested benefits, excluding tax credits). The definition here differs primarily due to the restricted income measure available in British Social Attitudes, which is banded (making it hard to exclude the poorest 10 per cent in a consistent way) and does not take into account the different sizes of households (known as ‘equivalising’).
9. Note that British Social Attitudes only includes information on raw household income, rather than equivalised income which takes account of household size. Therefore, those struggling on seemingly high incomes may have large households or other dependents outside of the household.
10. In the second half of the chapter, I look twice at the differences between those who say they are struggling financially vs. those living comfortably – the first time just looking at 2013, and the second time looking at how these differences have changed 2000–2013. In both cases, the results are presented using regression adjusted percentages, having ‘controlled’ for respondents’ age, gender, and education. This note explains how this ‘controlling’ was conducted.
The underlying logic between these comparisons is simple – they look at the average effect of these controls on the outcome, and then look at the association of financial struggles with the outcome, net of the average effects of the controls. In practice, because the outcomes were all categorical variables, we use multinomial logit models with dummy variables for age (dummies for 25–34, 35–44, 45–54, 55–59 and 60–64 (men only) vs. aged 18–24 as the base category), gender (female

British Social Attitudes 31 | Benefits and the cost of living
NatCen Social Research
116
vs. male as the base category), and education (degree, greater than A level but less than degree, less than A level qualifications vs. no qualifications as the base category).
Regression coefficients for categorical data are difficult to interpret, so to make these results easier to understand, we present the results in terms of the estimated percentage point differences across the sample (technically known as average marginal effects). It is these average marginal effects that are shown in the tables in the main part of the chapter, but the full regression tables for the models are available from the author’s website www.benbaumberg.com.
11. British Social Attitudes also asks people how they define poverty. People were asked “Would you say someone in Britain was or was not in poverty …” in three situations. Few people (19 per cent) agree that poverty is where people “had enough to buy the things they really needed, but not enough to buy the things most people take for granted”. About half (47 per cent) agree that poverty is where people “had enough to eat and live, but not enough to buy other things they needed”. And nearly everyone agrees (87 per cent) that someone is in poverty “if they had not got enough to eat and live without getting into debt”. In Table 6.6, we control for whether people agree with each of these statements, and then look at whether people who perceive more vs. less poverty have different attitudes to the benefits system.
12. For example, these patterns might reflect the fact that people who are struggling financially, or think that many other British people are, might have different expectations about living standards (Hills, 2001), or that they have other features of their lives (such as disabilities) that make them simultaneously more likely to struggle financially and more positive about the benefits system. It might even be the case that people’s beliefs about the benefits system – or their wider political beliefs – cause them to think differently about financial struggles, given evidence that people are much more receptive to information and ideas that fit with their pre-existing beliefs (Jerit and Barabas, 2012).
13. Question on feelings about household income: 2010–2013
Which of these phrases on this card would you say comes closest to your feelings about your household’s income these days?
1. Living really comfortably on present income 2. Living comfortably on present income 3. Neither comfortable nor struggling on present income 4. Struggling on present income 5. Really struggling on present income
Question on feelings about household income: Pre 2010
Which of these phrases comes closest to your feelings about your household’s income these days?
1. Living comfortably on present income 2. Coping on present income 3. Finding it difficult on present income 4. Finding it very difficult on present income
14. Comparable data on benefit claimants is only available from 1995, but we can look at longer-run trends if we look at the full population. The 2009 level of financial difficulties (21 per cent) is higher than any year since 1996 in the full population, but lower than any year between 1984 and 1995 (where it reached a high of 29 per cent in 1985). Likewise, perceptions of poverty hit a high in the pre-1995 period; in 1994 71 per cent believed there was quite a lot of poverty in Britain and

British Social Attitudes 31 | Benefits and the cost of living
NatCen Social Research
117
68 per cent believed that poverty had increased over the past ten years (up from 55 per cent and 51 per cent respectively in 1986).
15. This question asked:
Over the last ten years, do you think that poverty in Britain has been increasing, decreasing or staying at about the same level?
16. There has been a decline in the proportion believing that people are in poverty if “they had enough to eat and live, but not enough to buy other things they needed”.
Data shown here:
Trends in perceptions of poverty 2000–2013
2000 2003 2006 2009 2010 2013
Would you say someone in Britain was or was not in poverty … [% agreeing]
Enough to buy the things they really needed, but not enough to buy the things most people take for granted 26 18 21 n/a 19 16
Enough to eat and live, but not enough to buy other things they needed 58 47 50 n/a 51 46
Not got enough to eat and live without getting into debt 93 91 89 n/a 91 88
Weighted base 2047 1935 1959 n/a 1872 1864Unweighted base 1860 1777 1845 n/a 1697 1652
Restricted to those of working age (men aged 16–64, women 18–59 for consistency over time), excluding people whose main source of income is benefits or where neither the respondent nor their partner works
The change in people’s definitions of poverty is one possible explanation for why the rise in people’s contemporaneous perceptions of poverty (where definitions have changed) is less marked than the rise in people’s perception that poverty has increased in the past ten years (where people are making comparisons over time within whatever definition of poverty they prefer). See also Hills, 2001 for an in-depth discussion of these questions in the British Social Attitudes survey.
17. The findings here are similar to Ipsos MORI polling that asks people to describe how well they are “keeping up with their bills and credit commitments at the moment”. In 2006, 12 per cent of people said either they were “keeping up with all bills and commitments, but it is a constant struggle” or that they were “falling behind with some/many bills or credit commitments”, but by 2013 this has risen to 19 per cent (Money Advice Trust 2013 report and 2006 FSA baseline survey).
A similar question is also asked in the major survey that follows a representative sample of British people over time (the British Household Panel Survey until 2008, Understanding Society afterwards), which asks respondents how ‘you yourself are doing financially these days’. The British Household Panel Survey finds a slight rise in the people saying they are finding it (quite/very) difficult from six per cent in 2001–2007 to 7.5 per cent in 2008 (Measuring National Well-Being: Life in the UK, 2014: Table 6.4). However, Understanding Society then shows a decline (12 per cent to 11 per cent) in the new survey more recently, from 12.3 per cent in 2009/10 to 10.9 per cent in 2011/12. This seems likely to be because a certain number of people drop out of longitudinal surveys every year (particularly towards the start of the survey), making them a less robust way of looking at what the British population think than the British Social Attitudes series.
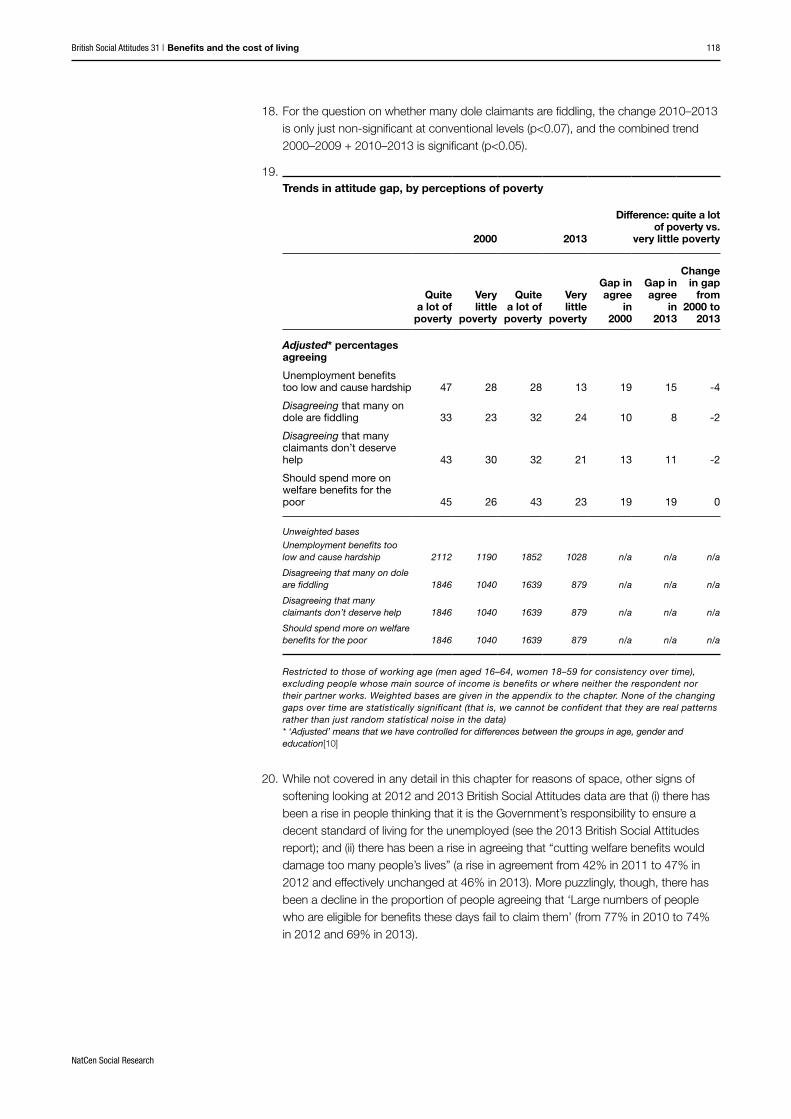
British Social Attitudes 31 | Benefits and the cost of living
NatCen Social Research
118
18. For the question on whether many dole claimants are fiddling, the change 2010–2013 is only just non-significant at conventional levels (p<0.07), and the combined trend 2000–2009 + 2010–2013 is significant (p<0.05).
19. Trends in attitude gap, by perceptions of poverty
2000 2013
Difference: quite a lot of poverty vs.
very little poverty
Quite a lot of
poverty
Very little
poverty
Quite a lot of
poverty
Very little
poverty
Gap in agree
in 2000
Gap in agree
in 2013
Change in gap
from 2000 to
2013
Adjusted* percentages agreeing
Unemployment benefits too low and cause hardship 47 28 28 13 19 15 -4
Disagreeing that many on dole are fiddling 33 23 32 24 10 8 -2
Disagreeing that many claimants don’t deserve help 43 30 32 21 13 11 -2
Should spend more on welfare benefits for the poor 45 26 43 23 19 19 0
Unweighted basesUnemployment benefits too low and cause hardship 2112 1190 1852 1028 n/a n/a n/a
Disagreeing that many on dole are fiddling 1846 1040 1639 879 n/a n/a n/a
Disagreeing that many claimants don’t deserve help 1846 1040 1639 879 n/a n/a n/a
Should spend more on welfare benefits for the poor 1846 1040 1639 879 n/a n/a n/a
Restricted to those of working age (men aged 16–64, women 18–59 for consistency over time), excluding people whose main source of income is benefits or where neither the respondent nor their partner works. Weighted bases are given in the appendix to the chapter. None of the changing gaps over time are statistically significant (that is, we cannot be confident that they are real patterns rather than just random statistical noise in the data) * ‘Adjusted’ means that we have controlled for differences between the groups in age, gender and education[10]
20. While not covered in any detail in this chapter for reasons of space, other signs of softening looking at 2012 and 2013 British Social Attitudes data are that (i) there has been a rise in people thinking that it is the Government’s responsibility to ensure a decent standard of living for the unemployed (see the 2013 British Social Attitudes report); and (ii) there has been a rise in agreeing that “cutting welfare benefits would damage too many people’s lives” (a rise in agreement from 42% in 2011 to 47% in 2012 and effectively unchanged at 46% in 2013). More puzzlingly, though, there has been a decline in the proportion of people agreeing that ‘Large numbers of people who are eligible for benefits these days fail to claim them’ (from 77% in 2010 to 74% in 2012 and 69% in 2013).

British Social Attitudes 31 | Benefits and the cost of living
NatCen Social Research
119
ReferencesAdam, S., Brewer, M., Browne, J., Crawford, R., Emmerson, C., Fitzsimons, E., Goodwin, A., Jin, W., Johnson, P., Joyce, R., Miller, H., Phillips, D., Rogger, D., Slater, A., Stoye, G. and Tetlow, G. (2012), The IFS Green Budget, London: Institute of Fiscal Studies (IFS)
Adams, A., Hood, A. and Levell, P. (2014), The squeeze on incomes, The IFS Green Budget 2014, London: Institute of Fiscal Studies (IFS)
Baumberg, B., Bell, K., Gaffney, D., with Deacon, R., Hood, C. and Sage, D. (2012), Benefits stigma in Britain, London: Elizabeth Finn Care/Turn2us
Baumberg, B. et al. (in preparation), ‘“Benefit myths”? Beliefs about the benefits system, their accuracy, and their consequences’
Bromley, C. (2003), ‘Has Britain become immune to inequality?’, in Park, A., Curtice, J., Thomson, K., Jarvis, L. and Bromley, C. (eds.), British Social Attitudes: Continuity and change over two decades, London: Sage
Clery, E. (2012), ‘Are tough times affecting attitudes to welfare?’, in Park, A., Clery, E., Curtice, J., Phillips, M. and Utting, D. (eds.), British Social Attitudes: the 29th Report, London: NatCen Social Research
Clery, E., Lee, L. and Kunz, S. (2013), Public attitudes to poverty and welfare, 1983–2011: Analysis using British Social Attitudes data, London: NatCen for the Joseph Rowntree Foundation
Curtice, J. (2010), ‘Thermostat or weathervane? Public reactions to spending and redistribution under New Labour’, in Park, A., Curtice, J., Thomson, K., Philips, M., Clery, E. and Butt, S. (eds.), British Social Attitudes: the 26th Report, London: Sage
Downing, E. and Kennedy, S. (2013), Food Banks and Food Poverty, House of Commons Library Standard Note SN06657, updated 16/12/2013, London: House of Commons Library
DWP (2012), Income Related Benefits: Estimates of Take-up in 2009–10. London: Department for Work and Pensions (DWP)
Hills, J. (2001), ‘Poverty and social security: What rights? Whose responsibilities?’, in Park, A., Curtice, J., Thomson, K., Jarvis, L. and Bromley, C. (eds.), British Social Attitudes: the 18th Report, London: SAGE publications in association with the National Centre for Social Research
Hirsch, D. (2013), A Minimum Income Standard for the UK in 2013, York: Joseph Rowntree Foundation
Hoggett, P., Wilkinson, H. and Beedell, P. (2013), ‘Fairness and the Politics of Resentment’, Journal of Social Policy, 42: 567–585
Jerit, J. and Barabas, J. (2012), ‘Partisan Perceptual Bias and the Information Environment’, The Journal of Politics, 74: 672–684
MacInnes, T., Aldridge, H., Bushe, S., Kenway, P. and Tinson, A. (2013), Monitoring Poverty and Social Exclusion 2013, York: Joseph Rowntree Foundation
Office for National Statistics (2013), Middle Income Households, 1977–2011/12
Pearce, N. and Taylor, E. (2013), ‘Changing attitudes towards the role of the state’, in Park, A., Bryson, C., Clery, E., Curtice, J. and Phillips, M. (eds.), British Social Attitudes: the 30th Report, London: NatCen Social Research

British Social Attitudes 31 | Benefits and the cost of living
NatCen Social Research
120
Rutherford, T. (2013), Historical Rates of Social Security Benefits, House of Commons Standard Note SN/SG 6762, updated 22/11/2013, London: House of Commons Library
Stuart, N. and Wlezien, C. (2005), ‘Opinion-Policy Dynamics: Public Preferences and Public Expenditure in the United Kingdom’, British Journal of Political Science, 35: 665–689
Sundberg, T. (2014), A Crisis in Welfare Legitimacy? A review of citizens’ support for the welfare state in times of change PhD thesis, Canterbury: University of Kent
Taylor-Gooby, P. and Martin, R. (2008), ‘Trends in sympathy for the poor’, in Park, A., Curtice, J., Thomson, K., Phillips, M., Johnson, M. and E. Clery (eds.), British Social Attitudes 2007–2008: The 24th Report, London: National Centre for Social Research
van Oorschot, W. (2000), ‘Who should get what, and why? On deservingness criteria and the conditionality of solidarity among the public’, Policy & Politics, 28: 33–48
Webster, D. (2014), The DWP’s JSA/ESA Sanctions Statistics Release 19 February 2014. Briefing available via the Welfare Conditionality project, www.welfareconditionality.ac.uk/2014/03/the-great-sanctions-debate/
AcknowledgementsNatCen Social Research is grateful to the Department for Work and Pensions for their financial support which enabled us to ask the questions reported in this chapter. The views expressed are those of the author alone.

British Social Attitudes 31 | Benefits and the cost of living
NatCen Social Research
121
Appendix The data on which Figure 6.1 is based are shown below.
Table A.1 Trends in perceptions of deservingness of benefit claimants, 1993–2013
1993 1994 1996 1997 1998 1999 2000 2001 2002 2003
% agreeing that …
Most unemployed could find a job if they really wanted one 27 32 39 n/a 54 57 61 63 65 66
Most people on the dole are fiddling in one way or another 32 34 35 n/a 39 36 40 35 38 39
Large numbers these days falsely claim benefits n/a 72 n/a n/a 83 84 77 79 81 78
Many people who get social security don’t deserve help 24 26 28 n/a 32 27 31 32 36 39
Opinion about level of benefits for unemployed people …
… Too low and cause hardship 55 53 48 46 29 33 40 37 29 34
… Too high and discourage them from finding jobs 24 24 32 28 47 42 36 38 47 40
BasesWeighted base – large numbers falsely claim n/a 3469 n/a n/a 3146 3143 3426 3287 3435 3276
Weighted base – opinion about benefits for unemployed people 2945 3469 3620 1355 3146 3143 3426 3287 3435 3276
Weighted base – other questions 2595 2957 3103 n/a 2546 2478 2991 2821 2929 881
Unweighted base – large numbers falsely claim n/a 3469 n/a n/a 3146 3143 3426 3287 3435 3272
Unweighted base – opinion about benefits for unemployed people 2945 3469 3620 1355 3146 3143 3426 3287 3435 3272
Unweighted base – other questions 2567 2929 3085 n/a 2531 2450 2980 2795 2900 873
2004 2005 2006 2007 2008 2009 2010 2011 2012 2013
% agreeing that …
Most unemployed could find a job if they really wanted one 69 70 67 67 68 55 54 56 54 54
Most people on the dole are fiddling in one way or another 41 39 32 40 36 34 35 37 37 33
Large numbers these days falsely claim benefits 84 n/a 84 n/a 82 n/a 84 n/a 81 77
Many people who get social security don’t deserve help 39 40 29 36 37 34 35 35 35 33
Opinion about level of benefits for unemployed people …
… Too low and cause hardship 23 26 23 26 21 29 24 19 22 22
… Too high and discourage them from finding jobs 54 50 54 54 61 51 54 62 51 57
BasesWeighted base – large numbers falsely claim 3199 n/a 3228 n/a 3333 n/a 1083 n/a 3248 3244
Weighted base – opinion about benefits for unemployed people 3199 3210 3228 3082 3333 1134 3297 3311 3248 3244
Weighted base – other questions 2610 2697 2813 2663 2956 963 2810 2841 2865 2825
Unweighted base – large numbers falsely claim 3199 n/a 3240 n/a 3358 n/a 1081 n/a 3248 3244
Unweighted base – opinion about benefits for unemployed people 3199 3193 3240 3094 3358 1139 3297 3311 3248 3244
Unweighted base – other questions 2609 2699 2822 2672 3000 967 2791 2845 2855 2832

British Social Attitudes 31 | Benefits and the cost of living
NatCen Social Research
122
The data on which Figure 6.2 is based are shown below, in Table A.2 and Table A.3.
Table A.2 Trends in perceptions of household income, 1995–2013
1995 1996 1999 2000 2001 2002 2003
Feeling about household’s income these days … (–2009) % % % % % % %
(Really) difficult 14 11 12 10 10 12 10
Coping 57 53 46 41 47 43 40
Living comfortably 29 35 42 49 43 45 50
Weighted base 660 721 1237 1392 2008 725 2658Unweighted base 618 668 1109 1255 1835 667 2424
2004 2005 2006 2007 2008 2009
Feeling about household’s income these days … (–2009) % % % % % %
(Really) difficult 10 13 11 15 21 17
Coping 44 44 46 46 46 46
Living comfortably 46 43 44 39 34 38
Weighted base 1337 1911 643 1244 1306 1371Unweighted base 1228 1775 610 1133 1205 1272
2010 2011 2012 2013
NEW VERSION: Feeling about household’s income these days … % % % %
(Really) struggling 14 17 16 18
Neither 36 39 38 38
Living (really) comfortably 50 44 46 44
Weighted base 1867 646 1823 1860Unweighted base 1692 574 1567 1650
Restricted to those of working age (men aged 16–64, women 18–59 for consistency over time), excluding people whose main source of income is benefits or where neither the respondent nor their partner works
A.3 Trends in perceptions of poverty, 2000–2013
2000 2003 2006 2009 2010 2013
Perceived amount of real poverty in Britain today …
% answering “Quite a lot” 65 58 54 58 n/a 62
Weighted base 2047 1935 1959 2046 n/a 1864Unweighted base 1860 1777 1845 1912 n/a 1652
Perceived trend in poverty in Britain over the last ten years …
% answering “Increasing” 36 35 32 47 n/a 64
Weighted base 2047 1935 1959 2046 n/a 1864Unweighted base 1860 1777 1845 1912 n/a 1652
Restricted to those of working age (men aged 16–64, women 18–59 for consistency over time), excluding people whose main source of income is benefits or where neither the respondent nor their partner works

British Social Attitudes 31 | Technical details
NatCen Social Research
123
Technical details
In 2013, the sample for the British Social Attitudes survey was split into three equally-sized portions. Each portion was asked a different version of the questionnaire (versions A, B and C). Depending on the number of versions in which it was included, each ‘module’ of questions was thus asked either of the full sample (3,244 respondents) or of a random third or two-thirds of the sample.
Sample design
The British Social Attitudes survey is designed to yield a representative sample of adults aged 18 or over. Since 1993, the sampling frame for the survey has been the Postcode Address File (PAF), a list of addresses (or postal delivery points) compiled by the Post Office.[1]
For practical reasons, the sample is confined to those living in private households. People living in institutions (though not in private households at such institutions) are excluded, as are households whose addresses were not on the PAF.
The sampling method involved a multi-stage design, with three separate stages of selection.
Selection of sectorsAt the first stage, postcode sectors were selected systematically from a list of all postal sectors in Britain. Before selection, any sectors with fewer than 500 addresses were identified and grouped together with an adjacent sector; in Scotland all sectors north of the Caledonian Canal were excluded (because of the prohibitive costs of interviewing there). Sectors were then stratified on the basis of:
• 37 sub-regions;• population density, (population in private households/area of the postal sector
in hectares), with variable banding used in order to create three equal-sized strata per sub-region; and
• ranking by percentage of homes that were owner-occupied.
This resulted in the selection of 261 postcode sectors, with probability proportional to the number of addresses in each sector.
Selection of addressesTwenty-six addresses were selected in each of the 261 sectors or groups of sectors. The issued sample was therefore 261 x 26 = 6,786 addresses, selected by starting from a random point on the list of addresses for each sector, and choosing each address at a fixed interval. The fixed interval was calculated for each sector in order to generate the correct number of addresses.
The Multiple-Occupancy Indicator (MOI) available through the PAF was used when selecting addresses in Scotland. The MOI shows the number of accommodation spaces sharing one address. Thus, if the MOI indicated more than one accommodation space at a given address, the chances of the given

British Social Attitudes 31 | Technical details
NatCen Social Research
124
address being selected from the list of addresses would increase so that it matched the total number of accommodation spaces. The MOI is largely irrelevant in England and Wales, as separate dwelling units (DUs) generally appear as separate entries on the PAF. In Scotland, tenements with many flats tend to appear as one entry on the PAF. However, even in Scotland, the vast majority (98.9 per cent) of MOIs in the sample had a value of one. The remainder had MOIs greater than one. The MOI affects the selection probability of the address, so it was necessary to incorporate an adjustment for this into the weighting procedures (described below).
Selection of individualsInterviewers called at each address selected from the PAF and listed all those eligible for inclusion in the British Social Attitudes sample – that is, all persons currently aged 18 or over and resident at the selected address. The interviewer then selected one respondent using a computer-generated random selection procedure. Where there were two or more DUs at the selected address, interviewers first had to select one DU using the same random procedure. They then followed the same procedure to select a person for interview within the selected DU.
Weighting
The weights for the British Social Attitudes survey correct for the unequal selection of addresses, DUs and individuals, and for biases caused by differential non-response. The different stages of the weighting scheme are outlined in detail below.
Selection weightsSelection weights are required because not all the units covered in the survey had the same probability of selection. The weighting reflects the relative selection probabilities of the individual at the three main stages of selection: address, DU and individual. First, because addresses in Scotland were selected using the MOI, weights were needed to compensate for the greater probability of an address with an MOI of more than one being selected, compared with an address with an MOI of one. (This stage was omitted for the English and Welsh data). Secondly, data were weighted to compensate for the fact that a DU at an address that contained a large number of DUs was less likely to be selected for inclusion in the survey than a DU at an address that contained fewer DUs. (We used this procedure because in most cases where the MOI is greater than one, the two stages will cancel each other out, resulting in more efficient weights). Thirdly, data were weighted to compensate for the lower selection probabilities of adults living in large households, compared with those in small households.
At each stage the selection weights were trimmed to avoid a small number of very high or very low weights in the sample; such weights would inflate standard errors, reducing the precision of the survey estimates and causing the weighted sample to be less efficient. Less than one per cent of the selection weights were trimmed at each stage.

British Social Attitudes 31 | Technical details
NatCen Social Research
125
Non-response modelIt is known that certain subgroups in the population are more likely to respond to surveys than others. These groups can end up over-represented in the sample, which can bias the survey estimates. Where information is available about non-responding households, the response behaviour of the sample members can be modelled and the results used to generate a non-response weight. This non-response weight is intended to reduce bias in the sample resulting from differential response to the survey.
The data was modelled using logistic regression, with the dependent variable indicating whether or not the selected individual responded to the survey. Ineligible households[2] were not included in the non-response modelling. A number of area-level and interviewer observation variables were used to model response. Not all the variables examined were retained for the final model: variables not strongly related to a household’s propensity to respond were dropped from the analysis.
The variables found to be related to response were: Government Office Region (GOR), the relative condition of the immediate local area, the relative condition of the address, population density, dwelling type, and whether there were entry barriers to the selected address. Full details of the response model are available on request.
The non-response weight was calculated as the inverse of the predicted response probabilities saved from the logistic regression model. The non-response weight was then combined with the selection weights to create the final non-response weight. The top one per cent of the weight were trimmed before the weight was scaled to the achieved sample size (resulting in the weight being standardised around an average of one).
Calibration weightingThe final stage of weighting was to adjust the final non-response weight so that the weighted sample matched the population in terms of age, sex and region.
Only adults aged 18 or over are eligible to take part in the survey, therefore the data have been weighted to the British population aged 18+ based on 2011 Census data from the Office for National Statistics/General Register Office for Scotland.
The survey data were weighted to the marginal age/sex and GOR distributions using raking-ratio (or rim) weighting. As a result, the weighted data should exactly match the population across these three dimensions.
The calibration weight is the final non-response weight to be used in the analysis of the 2013 survey; this weight has been scaled to the responding sample size.
Effective sample sizeThe effect of the sample design on the precision of survey estimates is indicated by the effective sample size (neff). The effective sample size measures the size of an (unweighted) simple random sample that would achieve the same precision (standard error) as the design being implemented. If the effective sample size is close to the actual sample size, then we have an efficient design with a good level of precision. The lower the effective sample size is, the lower the level of precision. The efficiency of a sample is given by the ratio of the effective sample

British Social Attitudes 31 | Technical details
NatCen Social Research
126
size to the actual sample size. Samples that select one person per household tend to have lower efficiency than samples that select all household members. The final calibrated non-response weights have an effective sample size (neff) of 2,575 and efficiency of 75 per cent.
All the percentages presented in this report are based on weighted data.
Questionnaire versions
Each address in each sector (sampling point) was allocated to one of the portions of the sample: A, B or C. As mentioned earlier, a different version of the questionnaire was used with each of the three sample portions. If one serial number was version A, the next was version B and the third version C. Thus, each interviewer was allocated ten cases from each of versions A, B and C. There were 2,262 issued addresses for each of the three versions of the sample.
FieldworkInterviewing was mainly carried out between June and September 2013, with a small number of interviews taking place in October and November.
Fieldwork was conducted by interviewers drawn from NatCen Social Research’s regular panel and conducted using face-to-face computer-assisted interviewing.[3] Interviewers attended a one-day briefing conference to familiarise them with the selection procedures and questionnaires, with the exception of very experienced interviewers who completed a self-briefing containing updates to the questionnaire and procedures.
The mean interview length was 62 minutes for version A of the questionnaire, 67 minutes for version B and 61 minutes for version C.[4] Interviewers achieved an overall response rate of between 53.6 and 53.8 per cent. Details are shown in Table A.1.

British Social Attitudes 31 | Technical details
NatCen Social Research
127
Table A.1 Response rate1 on British Social Attitudes, 2013
NumberLower limit of response (%)
Upper limit of response (%)
Addresses issued 6786
Out of scope 729
Upper limit of eligible cases 6057 100
Uncertain eligibility 32 0.5
Lower limit of eligible cases 6025 100
Interview achieved 3244 53.6 53.8
With self-completion 2832 46.8 47.0
Interview not achieved 2781 45.9 46.2
Refused2 2185 36.1 36.3
Non-contacted3 261 4.3 4.3
Other non-response 335 5.5 5.6
1 Response is calculated as a range from a lower limit where all unknown eligibility cases (for example, address inaccessible, or unknown whether address is residential) are assumed to be eligible and therefore included in the unproductive outcomes, to an upper limit where all these cases are assumed to be ineligible and therefore excluded from the response calculation
2 ‘Refused’ comprises refusals before selection of an individual at the address, refusals to the office, refusal by the selected person, ‘proxy’ refusals (on behalf of the selected respondent) and broken appointments after which the selected person could not be recontacted
3 ‘Non-contacted’ comprises households where no one was contacted and those where the selected person could not be contacted
As in earlier rounds of the series, the respondent was asked to fill in a self-completion questionnaire which, whenever possible, was collected by the interviewer. Otherwise, the respondent was asked to post it to NatCen Social Research. If necessary, up to three postal reminders were sent to obtain the self-completion supplement.
A total of 412 respondents (13 per cent of those interviewed) did not return their self-completion questionnaire. Version A of the self-completion questionnaire was returned by 85 per cent of respondents to the face-to-face interview, version B of the questionnaire was returned by 89 per cent and version C by 88 per cent. As in previous rounds, we judged that it was not necessary to apply additional weights to correct for non-response to the self-completion questionnaire.
Advance letterInterviewers were supplied with letters describing the purpose of the survey and the coverage of the questionnaire, which they posted to sampled addresses before making any calls.[5]
Analysis variablesA number of standard analyses have been used in the tables that appear in this report. The analysis groups requiring further definition are set out below. For further details see Stafford and Thomson (2006). Where relevant the name given to the relevant analysis variable is shown in square brackets – for example [REarn].
RegionThe dataset is classified by the 12 Government Office Regions.

British Social Attitudes 31 | Technical details
NatCen Social Research
128
Standard Occupational ClassificationRespondents are classified according to their own occupation, not that of the ‘head of household’. Each respondent was asked about their current or last job, so that all respondents except those who had never worked were coded. Additionally, all job details were collected for all spouses and partners in work.
Since the 2011 survey, we have coded occupation to the Standard Occupational Classification 2010 (SOC 2010) instead of the Standard Occupational Classification 2000 (SOC 2000). The main socio-economic grouping based on SOC 2010 is the National Statistics Socio-Economic Classification (NS-SEC). However, to maintain time-series, some analysis has continued to use the older schemes based on SOC 90 – Registrar General’s Social Class and Socio-Economic Group – though these are now derived from SOC 2000 (which is derived from SOC 2010).
National Statistics Socio-Economic Classification (NS-SEC)The combination of SOC 2010 and employment status for current or last job generates the following NS-SEC analytic classes:
• Employers in large organisations, higher managerial and professional• Lower professional and managerial; higher technical and supervisory• Intermediate occupations• Small employers and own account workers• Lower supervisory and technical occupations• Semi-routine occupations• Routine occupations
The remaining respondents are grouped as “never had a job” or “not classifiable”. For some analyses, it may be more appropriate to classify respondents according to their current socio-economic status, which takes into account only their present economic position. In this case, in addition to the seven classes listed above, the remaining respondents not currently in paid work fall into one of the following categories: “not classifiable”, “retired”, “looking after the home”, “unemployed” or “others not in paid occupations”.
Registrar General’s Social ClassAs with NS-SEC, each respondent’s social class is based on his or her current or last occupation. The combination of SOC 90 with employment status for current or last job generates the following six social classes:
I Professional etc. occupations
II Managerial and technical occupations ‘Non-manual’
III (Non-manual) Skilled occupations
III (Manual) Skilled occupations
IV Partly skilled occupations ‘Manual’
V Unskilled occupations
They are usually collapsed into four groups: I & II, III Non-manual, III Manual, and IV & V.

British Social Attitudes 31 | Technical details
NatCen Social Research
129
Socio-Economic GroupAs with NS-SEC, each respondent’s Socio-Economic Group (SEG) is based on his or her current or last occupation. SEG aims to bring together people with jobs of similar social and economic status, and is derived from a combination of employment status and occupation. The full SEG classification identifies 18 categories, but these are usually condensed into six groups:
• Professionals, employers and managers• Intermediate non-manual workers• Junior non-manual workers• Skilled manual workers• Semi-skilled manual workers• Unskilled manual workers
As with NS-SEC, the remaining respondents are grouped as “never had a job” or “not classifiable”.
IndustryAll respondents whose occupation could be coded were allocated a Standard Industrial Classification 2007 (SIC 07). Two-digit class codes are used. As with social class, SIC may be generated on the basis of the respondent’s current occupation only, or on his or her most recently classifiable occupation.
Party identificationRespondents can be classified as identifying with a particular political party on one of three counts: if they consider themselves supporters of that party, closer to it than to others, or more likely to support it in the event of a general election. The three groups are generally described respectively as ‘partisans’, ‘sympathisers’ and ‘residual identifiers’. In combination, the three groups are referred to as ‘identifiers’. Responses are derived from the following questions:
Generally speaking, do you think of yourself as a supporter of any one political party? [Yes/No]
[If “No”/“Don’t know”]Do you think of yourself as a little closer to one political party than to the others? [Yes/No]
[If “Yes” at either question or “No”/“Don’t know” at 2nd question]Which one?/If there were a general election tomorrow, which political party do you think you would be most likely to support?
[Conservative; Labour; Liberal Democrat; Scottish National Party; Plaid Cymru; Green Party; UK Independence Party (UKIP)/Veritas; British National Party (BNP)/National Front; RESPECT/Scottish Socialist Party (SSP)/Socialist Party; Other party; Other answer; None; Refused to say]
IncomeTwo variables classify the respondent’s earnings [REarn] and household income [HHInc]. The bandings used are designed to be representative of those that exist in Britain and are taken from the Family Resources Survey (see http://research.dwp.gov.uk/asd/frs/). Four derived variables give income deciles/quartiles: [RearnD], [REarnQ], [HHIncD] and [HHIncQ]. Deciles and quartiles are calculated based on individual earnings and household incomes in Britain as a whole.

British Social Attitudes 31 | Technical details
NatCen Social Research
130
Attitude scalesSince 1986, the British Social Attitudes surveys have included two attitude scales which aim to measure where respondents stand on certain underlying value dimensions – left–right and libertarian–authoritarian.[6] Since 1987 (except in 1990), a similar scale on ‘welfarism’ has also been included. Some of the items in the welfarism scale were changed in 2000–2001. The current version of the scale is shown below.
A useful way of summarising the information from a number of questions of this sort is to construct an additive index (Spector, 1992; DeVellis, 2003). This approach rests on the assumption that there is an underlying – ‘latent’ – attitudinal dimension which characterises the answers to all the questions within each scale. If so, scores on the index are likely to be a more reliable indication of the underlying attitude than the answers to any one question.
Each of these scales consists of a number of statements to which the respondent is invited to “agree strongly”, “agree”, “neither agree nor disagree”, “disagree” or “disagree strongly”.
The items are:
Left–right scale
Government should redistribute income from the better off to those who are less well off [Redistrb]
Big business benefits owners at the expense of workers [BigBusnN]
Ordinary working people do not get their fair share of the nation’s wealth. [Wealth][7]
There is one law for the rich and one for the poor [RichLaw]
Management will always try to get the better of employees if it gets the chance [Indust4]
Libertarian–authoritarian scale
Young people today don’t have enough respect for traditional British values [TradVals]
People who break the law should be given stiffer sentences [StifSent]
For some crimes, the death penalty is the most appropriate sentence [DeathApp]
Schools should teach children to obey authority [Obey]
The law should always be obeyed, even if a particular law is wrong [WrongLaw]
Censorship of films and magazines is necessary to uphold moral standards [Censor]

British Social Attitudes 31 | Technical details
NatCen Social Research
131
Welfarism scale
The welfare state encourages people to stop helping each other [WelfHelp]
The government should spend more money on welfare benefits for the poor, even if it leads to higher taxes [MoreWelf]
Around here, most unemployed people could find a job if they really wanted one [UnempJob]
Many people who get social security don’t really deserve any help [SocHelp]
Most people on the dole are fiddling in one way or another [DoleFidl]
If welfare benefits weren’t so generous, people would learn to stand on their own two feet [WelfFeet]
Cutting welfare benefits would damage too many people’s lives [DamLives]
The creation of the welfare state is one of Britain’s proudest achievements [ProudWlf]
The indices for the three scales are formed by scoring the leftmost, most libertarian or most pro-welfare position, as 1 and the rightmost, most authoritarian or most anti-welfarist position, as 5. The “neither agree nor disagree” option is scored as 3. The scores to all the questions in each scale are added and then divided by the number of items in the scale, giving indices ranging from 1 (leftmost, most libertarian, most pro-welfare) to 5 (rightmost, most authoritarian, most anti-welfare). The scores on the three indices have been placed on the dataset.[8]
The scales have been tested for reliability (as measured by Cronbach’s alpha). The Cronbach’s alpha (unstandardised items) for the scales in 2013 are 0.82 for the left–right scale, 0.75 for the welfarism scale and 0.81 for the libertarian–authoritarian scale. This level of reliability can be considered “good” for the left–right and libertarian–authoritarian scales and “respectable” for the welfarism scale (DeVellis, 2003: 95–96).
Other analysis variablesThese are taken directly from the questionnaire and to that extent are self-explanatory. The principal ones are:
• Sex • Age • Household income • Economic position • Religion • Highest educational qualification obtained• Marital status• Benefits received
Sampling errorsNo sample precisely reflects the characteristics of the population it represents, because of both sampling and non-sampling errors. If a sample were designed

British Social Attitudes 31 | Technical details
NatCen Social Research
132
as a random sample (if every adult had an equal and independent chance of inclusion in the sample), then we could calculate the sampling error of any percentage, p, using the formula:
s.e. (p) = p(100 - p)
n
where n is the number of respondents on which the percentage is based. Once the sampling error had been calculated, it would be a straightforward exercise to calculate a confidence interval for the true population percentage. For example, a 95 per cent confidence interval would be given by the formula:
p ± 1.96 x s.e. (p)
Clearly, for a simple random sample (srs), the sampling error depends only on the values of p and n. However, simple random sampling is almost never used in practice, because of its inefficiency in terms of time and cost.
As noted above, the British Social Attitudes sample, like that drawn for most large-scale surveys, was clustered according to a stratified multi-stage design into 242 postcode sectors (or combinations of sectors). With a complex design like this, the sampling error of a percentage giving a particular response is not simply a function of the number of respondents in the sample and the size of the percentage; it also depends on how that percentage response is spread within and between sample points.
The complex design may be assessed relative to simple random sampling by calculating a range of design factors (DEFTs) associated with it, where:
DEFT = Variance of estimator with complex design, sample size n
Variance of estimator with srs design, sample size n
and represents the multiplying factor to be applied to the simple random sampling error to produce its complex equivalent. A design factor of one means that the complex sample has achieved the same precision as a simple random sample of the same size. A design factor greater than one means the complex sample is less precise than its simple random sample equivalent. If the DEFT for a particular characteristic is known, a 95 per cent confidence interval for a percentage may be calculated using the formula:
p ± 1.96 x complex sampling error (p)
= p ± 1.96 x DEFT x p(100 - p)
n
Table A.2 gives examples of the confidence intervals and DEFTs calculated for a range of different questions. Most background questions were asked of the whole sample, whereas many attitudinal questions were asked only of a third or two-thirds of the sample; some were asked on the interview questionnaire and some on the self-completion supplement.

British Social Attitudes 31 | Technical details
NatCen Social Research
133
Table A.2 Complex standard errors and confidence intervals of selected variables
% (p)
Complex standard error of p
95% confidence
interval DEFT Base
Classification variables
Party identification (full sample)
Conservative 24.3 1.1 22.2–26.5 1.427 3242
Labour 32.6 0.9 30.8–34.5 1.142 3242
Liberal Democrat 6.0 0.5 5.1–7.0 1.148 3242
Housing tenure (full sample)
Owns 66.1 1.2 63.6–68.5 1.496 3244
Rents from local authority 9.1 0.6 7.9–10.5 1.278 3244
Rents privately/HA 23.8 1.2 21.4–26.3 1.654 3244
Religion (full sample)
No religion 50.4 1.3 47.9–52.9 1.442 3244
Church of England 16.2 0.8 14.7–17.8 1.236 3244
Roman Catholic 8.7 0.7 7.5–10.2 1.385 3244
Home internet access (full sample)
Yes 86.8 0.6 85.3–87.8 1.056 3244
No 13.4 0.6 12.2–14.7 1.053 3244
Urban or rural residence (full sample)
A big city 10.4 1.2 8.2–13.1 2.330 3244
The suburbs or outskirts of a big city 25.2 1.7 22.0–28.7 2.236 3244
A small city/town 46.3 2.0 42.3–50.4 2.339 3244
Country village 15.4 1.3 13.0–18.2 2.068 3244
Farm/home in the country 2.0 0.4 1.3–3.0 1.730 3244
Attitudinal variables (face-to-face interview)
Benefits for the unemployed are … (full sample)
… too low 21.9 0.9 20.2–23.8 1.233 3244
… too high 57.1 1.0 55.1–59.2 1.196 3244
How serious a problem is traffic congestion in towns, cities (full sample)
A very serious problem 13.7 0.9 12.1–15.6 1.470 3244
A serious problem 31.6 1.1 29.5–33.9 1.372 3244
Not a very serious problem 38.5 1.1 36.3–40.7 1.314 3244
Not a problem at all 15.9 0.8 14.4–17.6 1.249 3244

British Social Attitudes 31 | Technical details
NatCen Social Research
134
Table A.2 Complex standard errors and confidence intervals of selected variables (continued)
% (p)
Complex standard error of p
95% confidence
interval DEFT Base
I would like you to think about people who come to work in Britain from other countries that are part of the European Union. Do you think the benefits these people bring, for example through working and paying taxes, outweigh the costs they bring, for example through pressures on housing and services, or do the costs outweigh the benefits? Please use this card (one third of the sample)
The benefits to Britain are much greater than the costs 7.2 0.9 5.6–9.2 1.131 1063
The benefits to Britain are a little greater than the costs 13.9 1.2 11.7–16.4 1.112 1063
The benefits and costs to Britain are about equal 20.4 1.4 17.8–23.2 1.110 1063
The costs to Britain are a little greater than the benefits 25.4 1.4 22.7–28.3 1.068 1063
The costs to Britain are much greater than the benefits 27.9 1.5 24.9–31.0 1.122 1063
Attitudinal variables (self-completion)
Government should redistribute income from the better off to those who are less well off (two thirds of the sample)
Agree strongly 10.1 0.7 8.8–11.5 1.216 2832
Agree 32.1 1.1 29.9–34.4 1.272 2832
Neither agree nor disagree 26.3 0.9 24.5–28.2 1.119 2832
Disagree 23.1 0.9 21.4–24.9 1.117 2832
Disagree strongly 6.1 0.5 5.1–7.3 1.224 2832
Which of these statements comes closest to your view about general elections?
In a general election … (one third of the sample)
It’s not really worth voting 16.2 1.2 14.0–18.8 1.005 904
People should only vote if they care who wins 24.1 1.6 21.1–27.4 1.120 904
It’s everyone’s duty to vote 57.5 1.8 53.8–61.0 1.111 904
The table shows that most of the questions asked of all sample members have a confidence interval of around plus or minus two to three per cent of the survey percentage. This means that we can be 95 per cent certain that the true population percentage is within two to three per cent (in either direction) of the percentage we report.
Variables with much larger variation are, as might be expected, those closely related to the geographic location of the respondent (for example, whether they live in a big city, a small town or a village). Here, the variation may be as large as six or seven per cent either way around the percentage found on the survey. Consequently, the design effects calculated for these variables in a clustered sample will be greater than the design effects calculated for variables less strongly associated with area. Also, sampling errors for percentages based only on respondents to just one of the versions of the questionnaire, or on subgroups within the sample, are larger than they would have been had the questions been asked of everyone.

British Social Attitudes 31 | Technical details
NatCen Social Research
135
Analysis techniques
RegressionRegression analysis aims to summarise the relationship between a ‘dependent’ variable and one or more ‘independent’ variables. It shows how well we can estimate a respondent’s score on the dependent variable from knowledge of their scores on the independent variables. It is often undertaken to support a claim that the phenomena measured by the independent variables cause the phenomenon measured by the dependent variable. However, the causal ordering, if any, between the variables cannot be verified or falsified by the technique. Causality can only be inferred through special experimental designs or through assumptions made by the analyst.
All regression analysis assumes that the relationship between the dependent and each of the independent variables takes a particular form. In linear regression, it is assumed that the relationship can be adequately summarised by a straight line. This means that a one percentage point increase in the value of an independent variable is assumed to have the same impact on the value of the dependent variable on average, irrespective of the previous values of those variables.
Strictly speaking the technique assumes that both the dependent and the independent variables are measured on an interval-level scale, although it may sometimes still be applied even where this is not the case. For example, one can use an ordinal variable (e.g. a Likert scale) as a dependent variable if one is willing to assume that there is an underlying interval-level scale and the difference between the observed ordinal scale and the underlying interval scale is due to random measurement error. Often the answers to a number of Likert-type questions are averaged to give a dependent variable that is more like a continuous variable. Categorical or nominal data can be used as independent variables by converting them into dummy or binary variables; these are variables where the only valid scores are 0 and 1, with 1 signifying membership of a particular category and 0 otherwise.
The assumptions of linear regression cause particular difficulties where the dependent variable is binary. The assumption that the relationship between the dependent and the independent variables is a straight line means that it can produce estimated values for the dependent variable of less than 0 or greater than 1. In this case it may be more appropriate to assume that the relationship between the dependent and the independent variables takes the form of an S-curve, where the impact on the dependent variable of a one-point increase in an independent variable becomes progressively less the closer the value of the dependent variable approaches 0 or 1. Logistic regression is an alternative form of regression which fits such an S-curve rather than a straight line. The technique can also be adapted to analyse multinomial non-interval-level dependent variables, that is, variables which classify respondents into more than two categories.
The two statistical scores most commonly reported from the results of regression analyses are:
A measure of variance explained: This summarises how well all the independent variables combined can account for the variation in respondents’ scores in the dependent variable. The higher the measure, the more accurately we are able in general to estimate the correct value of each respondent’s score on the dependent variable from knowledge of their scores on the independent variables.

British Social Attitudes 31 | Technical details
NatCen Social Research
136
A parameter estimate: This shows how much the dependent variable will change on average, given a one-unit change in the independent variable (while holding all other independent variables in the model constant). The parameter estimate has a positive sign if an increase in the value of the independent variable results in an increase in the value of the dependent variable. It has a negative sign if an increase in the value of the independent variable results in a decrease in the value of the dependent variable. If the parameter estimates are standardised, it is possible to compare the relative impact of different independent variables; those variables with the largest standardised estimates can be said to have the biggest impact on the value of the dependent variable.
Regression also tests for the statistical significance of parameter estimates. A parameter estimate is said to be significant at the five per cent level if the range of the values encompassed by its 95 per cent confidence interval (see also section on sampling errors) are either all positive or all negative. This means that there is less than a five per cent chance that the association we have found between the dependent variable and the independent variable is simply the result of sampling error and does not reflect a relationship that actually exists in the general population.
Factor analysisFactor analysis is a statistical technique which aims to identify whether there are one or more apparent sources of commonality to the answers given by respondents to a set of questions. It ascertains the smallest number of factors (or dimensions) which can most economically summarise all of the variation found in the set of questions being analysed. Factors are established where respondents who gave a particular answer to one question in the set tended to give the same answer as each other to one or more of the other questions in the set. The technique is most useful when a relatively small number of factors are able to account for a relatively large proportion of the variance in all of the questions in the set.
The technique produces a factor loading for each question (or variable) on each factor. Where questions have a high loading on the same factor, then it will be the case that respondents who gave a particular answer to one of these questions tended to give a similar answer to each other at the other questions. The technique is most commonly used in attitudinal research to try to identify the underlying ideological dimensions which apparently structure attitudes towards the subject in question.
International Social Survey Programme
The International Social Survey Programme (ISSP) is run by a group of research organisations in different countries, each of which undertakes to field annually an agreed module of questions on a chosen topic area. Since 1985, an International Social Survey Programme module has been included in one of the British Social Attitudes self-completion questionnaires. Each module is chosen for repetition at intervals to allow comparisons both between countries (membership is currently standing at 48) and over time. In 2013, the chosen subject was National identity, and the module was carried on the A version of the self-completion questionnaire.

British Social Attitudes 31 | Technical details
NatCen Social Research
137
Notes1. Until 1991 all British Social Attitudes samples were drawn from the Electoral Register
(ER). However, following concern that this sampling frame might be deficient in its coverage of certain population subgroups, a ‘splicing’ experiment was conducted in 1991. We are grateful to the Market Research Development Fund for contributing towards the costs of this experiment. Its purpose was to investigate whether a switch to PAF would disrupt the time-series – for instance, by lowering response rates or affecting the distribution of responses to particular questions. In the event, it was concluded that the change from ER to PAF was unlikely to affect time trends in any noticeable way, and that no adjustment factors were necessary. Since significant differences in efficiency exist between PAF and ER, and because we considered it untenable to continue to use a frame that is known to be biased, we decided to adopt PAF as the sampling frame for future British Social Attitudes surveys. For details of the PAF/ER ‘splicing’ experiment, see Lynn and Taylor (1995).
2. This includes households not containing any adults aged 18 or over, vacant dwelling units, derelict dwelling units, non-resident addresses and other deadwood.
3. In 1993 it was decided to mount a split-sample experiment designed to test the applicability of Computer-Assisted Personal Interviewing (CAPI) to the British Social Attitudes survey series. CAPI has been used increasingly over the past decade as an alternative to traditional interviewing techniques. As the name implies, CAPI involves the use of a laptop computer during the interview, with the interviewer entering responses directly into the computer. One of the advantages of CAPI is that it significantly reduces both the amount of time spent on data processing and the number of coding and editing errors. There was, however, concern that a different interviewing technique might alter the distribution of responses and so affect the year-on-year consistency of British Social Attitudes data.
Following the experiment, it was decided to change over to CAPI completely in 1994 (the self-completion questionnaire still being administered in the conventional way). The results of the experiment are discussed in the British Social Attitudes 11th Report (Lynn and Purdon, 1994).
4. Interview times recorded as less than 20 minutes were excluded, as these timings were likely to be errors.
5. An experiment was conducted on the 1991 British Social Attitudes survey (Jowell et al., 1992) which showed that sending advance letters to sampled addresses before fieldwork begins has very little impact on response rates. However, interviewers do find that an advance letter helps them to introduce the survey on the doorstep, and a majority of respondents have said that they preferred some advance notice. For these reasons, advance letters have been used on British Social Attitudes surveys since 1991.
6. Because of methodological experiments on scale development, the exact items detailed in this section have not been asked on all versions of the questionnaire each year.
7. In 1994 only, this item was replaced by: Ordinary people get their fair share of the nation’s wealth. [Wealth1]
8. In constructing the scale, a decision had to be taken on how to treat missing values (“Don’t know” and “Not answered”). Respondents who had more than two missing values on the left–right scale and more than three missing values on the libertarian–authoritarian and welfarism scales were excluded from that scale. For respondents with fewer missing values, “Don’t know” was recoded to the mid-point of the scale and “Not answered” was recoded to the scale mean for that respondent on their valid items.

British Social Attitudes 31 | Technical details
NatCen Social Research
138
ReferencesDeVellis, R.F. (2003), Scale Development: Theory and Applications, 2nd edition, Applied Social Research Methods Series, 26, Thousand Oaks, Calif.: Sage
Jowell, R., Brook, L., Prior, G. and Taylor, B. (1992), British Social Attitudes: the 9th Report, Aldershot: Dartmouth
Lynn, P. and Purdon, S. (1994), ‘Time-series and lap-tops: the change to computer- assisted interviewing’, in Jowell, R., Curtice, J., Brook, L. and Ahrendt, D. (eds.), British Social Attitudes: the 11th Report, Aldershot: Dartmouth
Lynn, P. and Taylor, B. (1995), ‘On the bias and variance of samples of individuals: a comparison of the Electoral Registers and Postcode Address File as sampling frames’, The Statistician, 44: 173–194
Spector, P.E. (1992), Summated Rating Scale Construction: An Introduction, Quantitative Applications in the Social Sciences, 82, Newbury Park, Calif.: Sage
Stafford, R. and Thomson, K. (2006), British Social Attitudes and Young People’s Social Attitudes surveys 2003: Technical Report, London: NatCen Social Research