brno university of technology faculty of electrical
TRANSCRIPT

BRNO UNIVERSITY OF TECHNOLOGY
Faculty of Electrical Engineeringand Communication
BACHELOR'S THESIS
Brno, 2019 Mahulena Krišková

BRNO UNIVERSITY OF TECHNOLOGYVYSOKÉ UČENÍ TECHNICKÉ V BRNĚ
FACULTY OF ELECTRICAL ENGINEERING ANDCOMMUNICATIONFAKULTA ELEKTROTECHNIKYA KOMUNIKAČNÍCH TECHNOLOGIÍ
DEPARTMENT OF FOREIGN LANGUAGESÚSTAV JAZYKŮ
RENEWABLE ENERGY SOURCES FROM OCEANSOBNOVITELNÉ ZDROJE ENERGIE Z OCEÁNŮ
BACHELOR'S THESISBAKALÁŘSKÁ PRÁCE
AUTHORAUTOR PRÁCE
Mahulena Krišková
SUPERVISORVEDOUCÍ PRÁCE
Mgr. Pavel Sedláček
BRNO 2019

Fakulta elektrotechniky a komunikačních technologií, Vysoké učení technické v Brně / Technická 3058/10 / 616 00 / Brno
Bakalářská prácebakalářský studijní obor Angličtina v elektrotechnice a informatice
Ústav jazykůStudentka: Mahulena Krišková ID: 195237Ročník: 3 Akademický rok: 2018/19
NÁZEV TÉMATU:
Obnovitelné zdroje energie z oceánů
POKYNY PRO VYPRACOVÁNÍ:
Proveďte rešerši dostupné literatury, identifikujte obnovitelné zdroje energie z oceánů. Prezentujte výsledkyrešerše vč. kladů a záporů jednotlivých zdrojů a úrovně jejich využití v současnosti. Přidejte výhled do budoucnaa zhodnoťte výsledky v závěru.
DOPORUČENÁ LITERATURA:
Multon B. 2013, Marine Renewable Energy Handbook, John Wiley & Sons, Inc., Print ISBN:9781848213326|Online ISBN:9781118603185
Greaves D., Iglesian G., 2018, Wave and Tidal Energy, Wiley & Sons Ltd., Print ISBN:9781119014447, OnlineISBN:9781119014492, DOI:10.1002/9781119014492
Termín zadání: 7.2.2019 Termín odevzdání: 28.5.2019
Vedoucí práce: Mgr. Pavel SedláčekKonzultant:
doc. PhDr. Milena Krhutová, Ph.D.předseda oborové rady
UPOZORNĚNÍ:Autor bakalářské práce nesmí při vytváření bakalářské práce porušit autorská práva třetích osob, zejména nesmí zasahovat nedovolenýmzpůsobem do cizích autorských práv osobnostních a musí si být plně vědom následků porušení ustanovení § 11 a následujících autorskéhozákona č. 121/2000 Sb., včetně možných trestněprávních důsledků vyplývajících z ustanovení části druhé, hlavy VI. díl 4 Trestního zákoníkuč.40/2009 Sb.

Abstrakt
Obnovitelné zdroje jsou v dnešní době velmi diskutované téma především kvůli
vyvstávajícím problémům v rámci ekologie a úspory energií. I přes nejvíce zastoupenou část
v této oblasti vodními, větrnými a solárními elektrárnami, se tato práce zabývá méně
vyvinutou formou čerpání energie pomocí obnovitelných zdrojů, a tím jsou energie
z oceánů. Příbojové a přílivové technologie jsou dvěma základními možnostmi, jak
efektivně získat určité množství energie. V úvodu jsou popsány jednotlivé možnosti
obnovitelných zdrojů a jejich zastoupení v rámci produkce elektřiny. Především jsem se však
zabývala jednotlivými typy elektráren a na jakých principech fungují. Dále jsou zde sepsány
hlavní dopady na životní prostředí a projekty, které se zabývají inovací oceánských
technologií. Cílem práce bylo sestavit rešerši týkající se obnovitelných zdrojů z oceánů tak,
aby obsahovala základní dostupné poznatky. Výsledkem je shromáždění informací o
využívaných metodách v oblasti oceánské energie, spolu s nejvýznamnějšími elektrárnami
světa.
Klíčová slova
Obnovitelné zdroje, energie z oceánů, elektrárny, přílivová energie, energie z příbojových
vln, životní prostředí, rešerše obnovitelných zdrojů z oceánů
Abstract
Renewable resources are nowadays a serious topic in terms of ecology and energy savings.
The dominant producers of clean energy are hydro, wind and solar power plants, however,
this paper deals with a less covered type and that is the ocean energy. The efficient harness
of energy using ocean power can be distinguished into a wave and tidal technologies.
However, this paper covers the background of renewable resources and their worldwide
production of electricity, as well as the function of wave and tidal power plants. Moreover,
the attention is given the impacts on environment and future innovations in ocean
technologies. The aim of this paper was to conduct a research and describe the basis of the
renewable sources from oceans. The result is a summarization of information about wave
and tidal converters in order to increase the awareness of this form of utilization of ocean
energy.

Keywords
Renewable resources, wave technologies, wave converters, tidal technologies, tidal power
plants, environmental impacts, research into renewable energy resources from ocean

KRIŠKOVÁ, Mahulena. Obnovitelné zdroje energie z oceánů. Brno, 2019. Dostupné také
z: https://www.vutbr.cz/studenti/zav-prace/detail/119355. Bakalářská práce. Vysoké učení
technické v Brně, Fakulta elektrotechniky a komunikačních technologií, Ústav jazyků.
Vedoucí práce Pavel Sedláček.

Prohlášení autora o původnosti díla
„Prohlašuji, že svou bakalářskou práci na téma Obnovitelné zdroje energie z oceánů jsem
vypracoval samostatně pod vedením vedoucí/ho bakalářské práce s použitím odborné
literatury a dalších informačních zdrojů, které jsou všechny citovány v práci a uvedeny v
seznamu literatury na konci práce.
Jako autor uvedené bakalářské práce dále prohlašuji, že v souvislosti s vytvořením této
bakalářské práce jsem neporušil autorská práva třetích osob, zejména jsem nezasáhl
nedovoleným způsobem do cizích autorských práv osobnostních a jsem si plně vědom
následků porušení ustanovení § 11 a následujících autorského zákona č. 121/2000 Sb.,
včetně možných trestněprávních důsledků vyplývajících z ustanovení části druhé, hlavy VI.
díl 4 Trestního zákoníku č. 40/2009 Sb. “
.V Brně dne: …………………………
Mahulena Krišková, podpis

Acknowledgment
I would like to sincerely thank Mgr. Pavel Sedláček for supervising my project and I
would like to thank him for the help and advice he gave me when I was writing this
Bachelor’s thesis.

Contents
1. Introduction ...................................................................................................................... 8
2. Characteristics of renewable resources ....................................................................... 10
3. Wave energy technology ................................................................................................ 13
3.1. Wave energy converters and power plants ................................................................ 14
3.1.2. OWC technology ................................................................................................ 16
3.1.3. Overtopping devices ........................................................................................... 18
3.1.4. Oscillating bodies ............................................................................................... 20
3.1.4.a. Attenuator (Pelamis) .................................................................................... 21
3.2. Conclusion................................................................................................................. 22
4. Tidal energy .................................................................................................................... 23
4.1. History of tidal energy .............................................................................................. 24
4.1.1. Tidal range technologies ..................................................................................... 25
4.1.1.a. Tidal barrages ............................................................................................... 25
4.1.1.b. Tidal lagoons ................................................................................................ 27
4.1.2. Tidal stream technologies ................................................................................... 28
4.1.3. Tidal power plants .............................................................................................. 30
4.1.3.a. The Rance Tidal Power Plant (France) ........................................................ 30
4.1.3.b. Lake Sihwa Tidal Power Plant (South Korea) ............................................. 31
4.1.3.c. Annapolis (Canada) ...................................................................................... 33
4.1.3.d. MeyGen Tidal Energy Project (the UK) ...................................................... 33
4.2. Conclusion................................................................................................................. 34
5. Ocean Thermal Energy ................................................................................................. 35
5.1. The thermodynamic cycles and energy conversion systems of thermal energy ....... 38
5.1.1. Open cycle energy conversion system ............................................................... 39
5.1.2. Closed cycle energy conversion system ............................................................. 39
5.1.2.a. Rankine cycle ............................................................................................... 40
5.1.3. Hybrid cycle conversion system ......................................................................... 41
5.2. OTEC Okinawa, Japan .............................................................................................. 41
5.3. OTEC Makai, Hawaii................................................................................................ 42
5.4. Conclusion................................................................................................................. 43
6. Environmental impacts ................................................................................................. 44
7. Visions of the future ....................................................................................................... 47
8. Conclusion ...................................................................................................................... 49

9. List of references ............................................................................................................ 51
10. List of figures ................................................................................................................ 57

8
1. Introduction
Impacts of climate changes, the increase in reliance on fossil fuels and the increase in the
price of energies are some of the reasons why the demand for renewable energies is growing
rapidly. In order to fully understand the sources of energy, it has to be defined what qualifies
as sustainable energy to codify and distinguish between renewable and sustainable resources.
This paper will review the research conducted on the fundamentals of ocean energies, such
as wave, tidal and thermal energy, together with the technologies that are essential in the
whole process of energy harnessing. Then, the focus was given to the primary environmental
impacts, because it necessary to be acknowledged with the advantages as well as
disadvantages of renewable sources, and possible future projects, innovations in this field.
Renewable resources are able to naturally replenished partially or completely with time, or
even by recycling of materials and they are widely available. Renewables can be considered
as harmless to the environment with a minimal impact on the surroundings – they are
inexhaustible and clean. However, the term sustainable is wider and contains “the
effectiveness of providing energy in a way that it could become a significant energy resource
without compromising the ability of future generations to meet their needs” (Lemaire, 2010).
The global consumption of non-renewable resources results in ecologically unsustainable
consumption. To properly understand this meaning, it is necessary to define what the term
ecological sustainability means: “Ecological sustainability means that, based on a long-term
perspective, we conserve the productivity of the waters, the soil and the ecosystem, and
reduce our impact on the natural environment and people’s health to a level that the natural
environment and humanity can handle” (Löf, 2018).
Ocean energy is one of the renewables that plays a less significant role in global resources.
Most of the projects are still in the process of demonstration, yet it does not mean that it has
no potential at all. Around 70% of the Earth’s surface is covered by oceans that provide a
vast amount of ocean power in the form of waves and tides. Only some of the seashores are
eligible to convert ocean energy into electricity.
According to a World Energy Resources Marine Energy 2016 report published by World
Energy Council (Network of leaders and practitioners promoting an affordable, stable and
environmentally sensitive energy system for the greatest benefit of all), it was estimated that

9
around 0.5 GW of ocean energy is provided to the public, and most of its production stems
from tidal range (“Marine World Energy Resources 2016”, 2016).

10
2. Characteristics of renewable resources
Generating power from nature’s sources has been always an attractive research for many
centuries. The idea of converting energy from the Sun, rivers, or wind, is not new, however,
as there is the increase of negative effects of fossil fuels and the possibility of its extinction,
people are becoming/have become more interested in renewables. Gradually, human
civilization developed and improved its knowledge of how to use solar, wind, water energy
and other renewable resources, which are additionally described below.
Solar energy is a source that exploits energy from the Sun. Light and heat might be harnessed
using technologies such as photovoltaics, solar heating or concentrated solar power.
According to the first sources, solar energy was originally used to heat water as early as in
the 18th century. However, producing electricity from solar energy remained undiscovered
until Albert Einstein proposed an explanation for the photoelectric effect in the early 1900s.
Two types of solar power exist – photovoltaic (further PV), which concentrates sunlight and
converts it into heat, thermal that produces electricity directly without moving parts (“Solar
Energy”, 2016).
According to statistics published in a 2017 REN21’s (Renewable Energy Policy Network
for the 21st Century is a global renewable energy policy multi-stakeholder network that
connects a wide range of key actors, whose goal is to facilitate knowledge exchange, policy
development and joint action towards a rapid global transition to renewable energy) report,
the investments in solar PV (photovoltaic) energy were the highest than from any other
generation of energy, especially in China, India, Japan, and the United States. The number
of installed solar PV in 2017 exceeded the net capacity additions in fossil fuel and nuclear
power combined. As stated by the researchers of REN21, the worldwide capacity (power
that can be potentially used) of this energy in 2017 was approximately 402 GW (Aberg,
Adib, et al., 2018).
Traditionally, it is known that the usage of wind energy has been there for thousands of years
– people employed the sail to navigate their ships or operated windmills in order to pump
water and grind grain (Rinkesh, 2018). With improved technologies, current wind farms
could be constructed out of many individual turbines, mostly located onshore.
Further, the total wind power capacity grew in 2017 up to a total number of 539 GW
(including offshore and onshore wind power) (Aberg, Adib, at el., 2018, p. 23). The largest

11
onshore wind farm called Gansu is situated in China with the current capacity of 8 GW
(“Gansu Wind Farm (China)”, 2015) and expected capacity of 20 000 MW by 2020. In
contrast, the largest offshore farm called Walney is located in the Irish Sea with a total
capacity of 1026 MW (Vaughan, 2018).
Other type of renewable source, geothermal energy is, in general, the heat from the center of
the Earth. This energy may be used for example for district heating in the form of hot springs,
but mostly serves as a source for electricity generation. Although the ability to be sustainable
and renewable, it requires the necessity to be monitored in case of local depletion of wells
or air pollution with carbon dioxide, hydrogen sulfide, and methane, since they can
contribute to global warming (“Geothermal Energy”, 2018). The Geyser, in California, is
the largest group of geothermal power plants (22) in the world with installed capacity of
1517 MW (“The Geysers Geothermal Field, California”, 2012). Substantially, the location
of geothermal power plants depends on plate tectonics boundaries (Figure 1) that create a
great option to build them for instance in Japan, Italy, Philippines, the United States, New
Zealand, and Mexico.
The total number of the global production of geothermal energy was reported to be 12.8 GW
in 2017 (Aberg, Adib, et al., 2018 p. 22).
Another renewable resource, water energy, or hydroelectric power, includes power from
rivers, lakes and ocean energy. It was the Romans or Chinese during the Han Dynasty, who
Figure 1. Tectonics plates.
(Retrieved from: http://egyptcareers.info/ )

12
started to exploit the tide energy and, subsequently, they began to build tide mills, which are
very similar to today’s tide power stations.
However, the changes in new technologies were not as recognizable until the Industrial
Revolution. Due to the Industrial Revolution in the eighteenth century, people started to be
more dependent on oil and coal, but with time, the reserves of these resources are limited.
Sørensen (1991) showed that in the 1950s people realized that the question of renewable
resources has become more serious and that it is necessary to find solutions regarding
sustainable energy system. In the twenty-first century, the topic of renewable energies is
debatable as never. Renewables persist to gain global progress, although it depends on a
specific region.
Based on the data REN21 from 2016, renewables accounted for approximately 18.2% of
total final energy consumption (TFEC), which is about 2.195 GW. Hydropower leads the
generation with 3.7%, followed by thermal energy and biofuels (Figure 2).
Figure 2. Estimated renewable share of total final energy consumption, 2016. (Retrieved from:
http://www.ren21.net/ )

13
3. Wave energy technology
There could be two possible definitions of waves – theoretical and technical.
“All waves begin as disturbances, and ocean waves form as the result of a disturbing force.
A rock thrown into a still pond, for example, creates a disturbance that generates waves
radiating out in all directions. Ocean waves are caused by a similar transfer of energy to the
surface of the ocean” (Trujillo & Thurman, 2017, p. 245).
"Wave power is defined by the flow of energy through a vertical surface perpendicular to
the direction of its propagation. It could, therefore, be expressed in W.m-1” (Multon, 2012,
p. 338).
Waves could be created by blowing of the wind across the ocean, movement of fluids with
different density, movement of the large area of seafloor, or they can be even induced by
humans (waves created by ships). The size of the waves depends on the wind speed, its
duration, and the distance of water over which it blows. The physical parameters of waves
are height and length, thus, the waves carrier kinetic energy which can be harnessed by wave
energy devices. However, the harness efficiency of ocean waves is the main problem in
further development due to the unpredictability of waves contrary to tides, and on frequent
Figure 3. The most frequent occurrence of wave power plants. (Retrieved from: https://slideplayer.com)

14
occasions, they can be very powerful and excite damage to machines. As the actual power
of a given wave cannot be predicted, the system is unable to guarantee a stable supply of
power. Moreover, the impact on the environment might be the key problem regarding ocean
energy. Survey such as conducted by EU project Aqua-RET (“Wave”, 2012) have shown
that with increasing latitudes greater than 40° north or south increases wave energy and thus,
the best areas for wave resources occur where strong winds have traveled over long distances
with almost no energy loss (wave energy near shores decreases due to friction with the
seabed and places far from shores will have the greatest energy). Such places are for example
in Western Australia (Perth, Portland), in the United States (Oregon, Hawaii), Portugal
(north of Porto), or the United Kingdom (north coast of Cornwall) (Figure 3). In general, out
of all renewable resources, ocean energy offers the highest energy density.
The benefits of wave energy in comparison with other renewables might be characterized by
highest energy density, predictability, and ability to satisfy electricity demand changes.
3.1. Wave energy converters and power plants
Efficient wave capturing has impacts on the design of converters because they have to be
able to withstand wave energy. This leads to high expenses and poses difficult engineering
challenges. Additionally, up to 95% of the energy in a wave is located between the water
surface and one-quarter of a wavelength below it.
WECs (Wave Energy Converter) characterize devices capturing the power of waves and
transforming it into electricity. WECs may be categorized according to directional
characteristics, working principle, and location (Figure 4).
Figure 4. Possible operating principles for the location and directional characteristics. (Retrieved from:
http://www.renewablegreenenergypower.com)
15
Drawing on an extensive range of sources, the authors Drew, Plummer and Sahinkay (2016)
set out the ways in which there are three distinct zones:
1. Offshore – considered as the most profitable location since the energy of waves here
is the largest. However, the distance from land is associated with the large costs of
the maintenance and construction difficulties. Converters built offshore need to be
designed to survive extreme conditions.
2. Nearshore – devices installed a few hundred meters from the shore in a depth of 10
to 25 meters. They are often attached to the seabed.
3. Onshore – these devices have the advantage of being fixed to the land. They can be
easily maintained due to an accessible position, but the energy of waves is lower and
also the available free land can be a problem (environmental problem). The
disadvantage is the high possibility of being damaged by wave power. In the end, a
small-scale study by Goldman (2018) reaches conclusion that choosing the position
depends on the budget availability and the requirements or restriction set by project
owners.
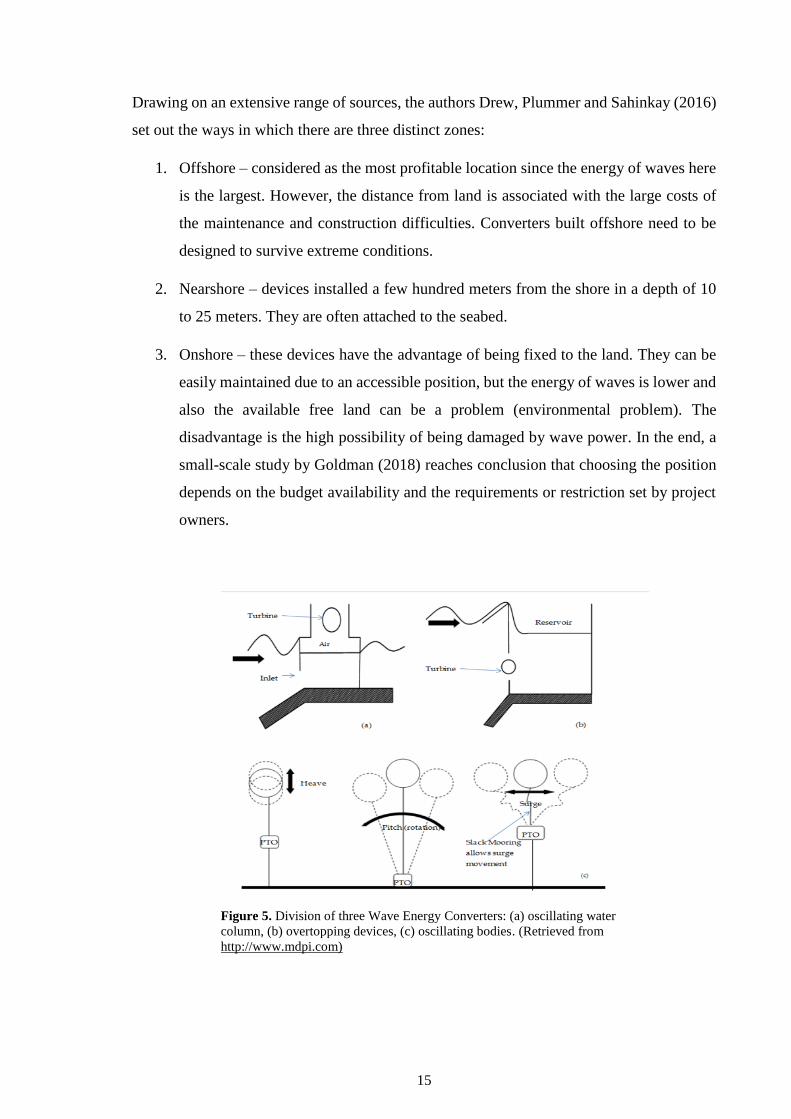
Figure 5. Division of three Wave Energy Converters: (a) oscillating water
column, (b) overtopping devices, (c) oscillating bodies. (Retrieved from
http://www.mdpi.com)

16
Moreover, designs of WECs are in permanent development, but they can be divided into
three main groups: Point absorber, terminator, and attenuator. Attenuators, e. g. Pelamis, lie
parallel to the direction of incoming waves. Their motion can be described as ‘riding’ the
waves because they float on the surface and capture energy as the waves move. Point
absorbers (e. g. WaveBob) are devices symmetrical about the vertical axis. Drew, Plummer,
and Sahinkaya, (2016) identified that they are smaller in terms of the incoming wavelength
(wave direction is not important), and currently, they are able to heave up and down on the
surface, or even submerged under the surface. Terminators are perpendicular to the direction
of wave and they reflect the wave power. These devices have one part greater than the rest
of the device and greater than the incoming wavelength.
Lastly, working principles of the WECs could be divided into three areas: oscillating water
column (OWC), overtopping devices (OTD) and oscillating bodies (Figure 5).
3.1.2. OWC technology
This system is thought to be one of the most popular wave energy technologies for converters
and presents two main advantages – a simple working principle and low maintenance cost
(relative to other WECs). Although, Multon (2012, p. 349) highlights that the disadvantage
could be that the waves possess less power due to wave breaking.
Figure 6. A simple scheme of working principle of Oscillating Water Column
converter. (Retrieved from: http://www.earthsci.org)

17
In a review of wave energy converter technology, Drew, Plummer, and Sahinkaya, (2016)
identify characteristics of oscillating water column (OWC). This device consists of a
partially submerged chamber with an opening exposed to the wave action and turbine. As
waves approach the device it causes the water column inside the chamber to oscillate, which
enables the water column to act as a piston - the air is firstly pressed within the chamber and
then escapes through air turbine. These turbines are designed so that their direction of
rotation is independent of the direction of the air flow. The alternating air flows are then
converted into electricity. Air is primarily utilized as the working fluid because of the
advantage of increasing the slow velocities of waves to the high air flow rate (Figure 6).
OWC may be situated offshore or onshore. Offshore OWC (e. g. Oceanlinx) is a floating
device located in deep water, where the power of waves is higher than near the coast - spar
buoy is a great example of offshore OWC (it is not sensitive to wave direction) discussed in
a paper of Aderinto & Li (2018, p. 5). Wave motions combine the water column motion to
determine the output of the device.
On the other hand, onshore OWC stays fixed to the coast in shallow water, and their
performance is affected by tidal friction, and most of the wave energy is lost through bottom
friction as the depth decreases. One of the advantages of onshore converters compared to the
offshore would be that mooring lines are not required since they operate in a safer sea
environment. This increases their survivability, maintenance and with electricity generation
and coastal protection, they have a dual purpose. These advantages are mentioned in a
research of Greaves & Iglesias (2018, p. 99)
The first commercial OWC wave power plant, LIMPET 500 (Figure 7), was built in 2000
and is situated on a small island of Islay on the west coast of Scotland. LIMPET is built of
bi-steel, a high resistance material of steel and concrete, and operates with two Wells turbines
according to Multon (2012, p. 351).

18
Design of turbines could be related to the wave frequency and amplitude. Most popular air
turbines are Wells turbines (Figure 8) that possess the ability to rotate in the same direction
independently on the airflow direction yet their operation has low efficiency (approximately
60%), and they produce high noise.
3.1.3. Overtopping devices
Overtopping device captures and concentrates incoming waves in a reservoir above the
surface and then lets the waves break on a slope to fill a basin. Their working principle is
examined in a study of Multon (2012, p. 347) as well as in a study of Aderinto et al. (2018,
p. 7). The water is later released back to the ocean through low-head turbines connected to
electrical generators. The reservoir of energy that can be used to ensure the smoothing of the
produced power is the advantage of OTD. On the other hand, the system includes a startup
Figure 7. Picture of OWC power plant LIMPET 500. (Retrieved from:
https://www.researchgate.net/ )
Figure 8. Wells turbine. (Retrieved from:
https://www.researchgate.net/ )

19
threshold – when the incoming waves do not possess enough power to break over the ramp,
no energy is produced. This is the main disadvantage of OTD.
Overtopping devices are designed for both onshore and offshore locations. An example of
an overtopping device based on the coast is TAPCHAN (TAPered CHANnel) built in 1985
in Norway (Figure 9). Tapchan allowed the incoming wave to increase its height as the
channel narrowed towards the reservoir end (place of concentration of propagating waves).
However, Multon (2012, p. 347) pints out that this device stopped functioning and was
damaged due to a powerful storm in 1991.
Under the most developed OTD device counts offshore Wave Dragon (WD) in Denmark
(Figure 10). Its structure is described by Aderinto & Li (2018, p. 7) as it proceeds with ideas
from Tapchan and creates a floating device with two wave curved reflectors on concentrator
arms, which enables to concentrate the incoming waves towards the reservoir. Inside the
basin are located low-headed turbines (more turbines increase the output energy depending
on the available flow rate), which convert the hydraulic head in the reservoir into electricity.
WD is unique due to its one-step conversion system – conversion of wave energy directly
through the water turbines.
Figure 9. Overtopping device TAPCHAN. (Retrieved from:
https://www.researchgate.net)

20
Unlike other WEC technologies, overtopping devices may be constructed very largely due
to independence on resonance with the waves. Greaves & Iglesias (2018, p. 105) claim that
they only need to focus on controlling and stabilizing the floating structure to optimize power
output.
3.1.4. Oscillating bodies
In Multon’s (2012, p.354) review, these devices are working on a principle of oscillating
body move according to the motion of ocean waves that can be mainly heaved or mainly
pitched. In contrast to the other types of technologies, oscillating bodies divides into
submerged or floating devices that can be further categorized according to system that
involves single or multiple oscillators, system using pitch (floating or anchored), system
combining heave and pitch or system combining heave and yaw.
Heaving system can be fully submerged with an oscillating upper part, and the bottom part
fixed to the seabed. Under the simplest example of the oscillating body comes oscillator
attached to the seabed – heaving buoy – where the buoy moves relatively to a fixed frame of
reference. The motion between moving and fixed part drives the turbine. PowerBuoy (Figure
11) (Greaves & Iglesias, 2018, p. 106) comes under a categorization of two-body self-
referencing WECs with oscillating parts that move relative to one another. These parts might
be powered by the hydraulic circuit with PTO (power take-off = transfers the mechanical
power of the engine over to another part of the equipment), which is situated between the
reaction and float plate. AquaBuoy (Greaves & Iglesias, 2018, p. 106) is an example of
floating multibody that heavens devices. In these multibody oscillating bodies, the energy is
produced from the motion of two connected parts that oscillates unsynchronized.
Figure 10. Scheme of Wave Dragon (WD). (Retrieved
from: www.researchgate.net)

21
Size of body plays an important role in deciding whether a single heaving body and
submerged system are able to be installed onshore. However, due to a capturing of lower
energy in the heaving mode, they are more suitable to be placed offshore.
3.1.4.a. Attenuator (Pelamis)
A typical example of the oscillating body was a Pelamis power plant (Figure 12). Pelamis
worked on a principle of attenuator converters and was located a few kilometers off the
northwest Agucadoura coast in Portugal (opened in 2008). It was able to generate 2.25 MW.
However, two months after the opening of the farm had to be closed down because of
financial difficulties. The second project was held in Orkney, Scotland, for Scottish Power
Renewables, with the production of 750 kW (shut down in 2014 due to financial difficulties)
(Blum, 2009). Moreover, the third wave station with 5 MW was constructed for the Cornwall
Wave Hub in the UK (“Pelamis Wave Power”, 2015).
In addition, attenuators are considered as a series of long floating structures linked together
in a cylindrical shape that are parallel to the wave direction. They are flexible and can last
the differing heights of waves on the open sea and adapt to them. The average depth for
attenuators is 50-60 meters, where is the highest potential for large swell waves. The semi-
Figure 11. PowerBuoy. (Retrieved from:
https://www.researchgate.net/ )

22
immersed floating segments are connected with hinged joints to generate power as the waves
are moving across.
3.2. Conclusion
In this chapter there have been described the basis of wave energy – how are the waves
formed, what are possible ways of harnessing energy from this type of renewable source, as
well as the primary energy converters used at present in various number power plants. From
the available data is known that the most promising location for wave power plants is
between 40°- 60° latitude, whereas the position offshore, onshore, or nearshore should not
have any significant effect. Europe represents one of the suitable options for various types
of wave power plant thanks to a large number of sea areas (mostly the eastern Atlantic),
other location could be Japan or India. There have been presented three types of wave
converters (WECs): OWC, OTD and oscillating bodies.
Most of the projects are in a development phase, however, only a few of them are
commercially used due to a necessary funding for technological progress. Further
development is highly requested mostly because the potential for this type of energy
conversion shows its advantages, such as reliability, predictability, being environmentally
friendly (harnessing does not produce harmful forms of gases, or pollution).
Figure 12. Pelamis Wave Energy Converter. (Retrieved from:
http://potomacstewards.com)

23
4. Tidal energy
Tidal energy is considered as another form of ocean energy that converts its potential into
electricity. The base of power harnessing depends on a proper understanding of tides and
their working principle. In general, tides are generated by forces imposed on Earth, which
are caused by both gravity and motion among Earth, the Sun and the Moon. Multon (2012,
p. 188) describes tides by their period (the height between consecutive high and low tides)
and range (time between two high and low tides) and provide kinetic (tidal current) and
potential energy (tidal range).
However, shapes, sizes, and depths of ocean basins differs, which establishes three tidal
patterns: diurnal, semidiurnal and mixed pattern (Figure 13). In their study, Trujillo &
Thurman (2017, p. 292) identified both of them. Diurnal tidal pattern (typical for shallow
Figure 13. Tidal patterns: diurnal,
semidiurnal and mixed pattern.
(Retrieved from: http://oceanmotion.org)

24
islands, e. g. the Gulf of Mexico) is characterized by one high tide and one low tide each
lunar day (The rotation period of the moon on its axis equal to the sidereal month of about
27¹/₃ days). Semidiurnal tides are defined by two high and low tides on each lunar day in the
period of 12 hours and 25 minutes, where the heights of both tides are approximately the
same. The highest frequency of semidiurnal tides occurs along the Atlantic coast of the
United States. The third pattern, mixed tides, combines both diurnal and semidiurnal tides.
The heights of successive high/low tides are significantly dissimilar, and these kinds of tides
are commonly found along the Pacific coast of North America.
As the major advantage of tidal energy, stated by Aqua-RET (“Tidal Energy: Technology
Brief”, 2014, p. 22), can be considered the capability of being highly predictable in cycles.
Although its operation is not expensive, the further innovations in technologies regarding
tidal power suffered from relatively high cost.
4.1. History of tidal energy
In history, people were using tides as a source of power. They were able to use it for driving
machines and in the 12th century, the water-energy was used for spinning of water wheels in
mills in Europe. In the eighteenth century these two parts of the world started to use
hydropower as a source, but since the tidal power was rather expensive, the availability was
limited. The first patent for wave energy conversion, developed by Messrs Girard in 1799,
was not the right stimulation for using this kind of resource power since the oil and coal were
the most affordable and available ones.
The milestone in ocean energy was induced by the first tidal power station the La Rance
Tidal Power Station in France. As noted by EDF Group (“Tidal Power: EDF a Precursor”,
2018), this power station was built in 1966 and is still operating (producing 240 MW, which
estimates around 500 GWh/year). Before Sihwa Lake Tidal Power Station in South Korea,
La Rance was the most significant one as regards the output power. A small tidal barrage
was put in service in 1984 in Canada’s Bay of Fundy, which supposed to demonstrate a
turbine invented by Escher-Wyss of Switzerland. It is the only significant barrage on the
continent.
In the 1980s, the interest in ocean energy decreased because of low oil cost, and in the 1990s,
the price of oil increased again and, subsequently, the demand for alternative sources of
energy emerged. Most of the projects regarding ocean energy are not widely developed as

25
yet, but it has the potential to be one of the main sources of renewable energy. Ocean energy
is a sustainable resource and can efficiently operate under difficult conditions.
In a total of 12 TW produced from alternative resources, wave energy can go from 1 to 10
TW (Trujillo & Thurman, 2017, p. 273).
4.1.1. Tidal range technologies
This power generation can be described as following: “A difference in vertical height of the
water level between its highest and lowest point, and tidal range generation extracts energy
by harnessing the potential energy which is available through the difference in water height”
(Greaves & Iglesias, 2018, p. 129). In other words, this process harnesses the potential
energy created by the vertical difference between ebb tide and flood tide. The working
principle is always the same – filling the basin, holding the water and producing of the power.
Two types of range system are used: barrage and lagoon.
4.1.1.a. Tidal barrages
Waters and Aggidis (2016, p. 6) summarize that the barrage (dam) is a structure built across
the bay or estuary (the wide part of a river at the place where it joins the sea) together with
installed turbines along its length, sluice gates, breakwater, and ship locks. With incoming
and outcoming tides, the barrage creates a head difference on one side, and as soon as the
head difference reaches the turbines, sluice gates are able to open which enables the water
to pass through the turbines (Figure 14).
Figure 14. The simple working principle of Tidal Barrage.
(Retrieved from: https://www.researchgate.net/ )

26
There are two systems on which can the barrage operate, which are presented by Etemadi at
al. (2011, p. 4). The first is a single-basin system that consists of one basin and the dam.
Moreover, they can operate on three principles: flood generation, ebb generation, and dual
generation.
- Flood generation’s method captures the energy on the flood tide. The sluice gates
and turbines are closed during the flood tide until the head difference between the
basin and sea reaches the minimum of hydrostatic head of the turbines and moves
across the dam. After that, the turbine gates are opened, and the water is able to flow
through them to the basin. Tidal power plant working on the flood generation system
is, for instance, Sihwa Tidal Power Plant in South Korea. However, the capacity and
electric production are limited, and as regards the ecological disadvantage, the water
level inside is kept at a low level for a long time.
- Ebb generation operates as the opposite principle of the flood generation. The basin
is filled during the flood through the sluice gates, and once the tide reaches its
maximum, the sluice gates are closed with trapped water inside of the basin. The
gates are opened again when the sea level outside falls enough for the turbines to
operate. The Annapolis Royal Generating Station in Canada is an example.
- Dual generation, or two-way generation, employs both flow and ebb techniques and
considers as the most complicated one. The turbines need to be optimized in both
directions which results in their complexity. At first, the sluice gates are closed until
the adequate head difference between the basin and sea. When this condition is
fulfilled, the gates are opened, and the water is able to flow through the turbines
creating power. The gates are closed again when the minimum head difference is
achieved and opened once more allowing the water to flow back through turbines
generating energy.
Similarly, Waters and Aggidis’s study (2016, p. 6) note that the second type deals with
double-basin barrages that are standard single-basin barrages with the installed second basin.
In fact, the delivering of electricity is adjustable due to the same working principle of the
main basin as in the case of the usual ebb generation basin. As the tide flows back to the sea,
the water is pumped and stored in the second basin. Double-basin barrage usage allows
delaying the tidal movement at the peak of energy periods. However, installed low-head

27
turbines are considered inefficient and also the construction costs of the extra length of
barrages restrict the further development.
4.1.1.b. Tidal lagoons
Unlike the typical barrage, lagoon system (Figure 15) encloses to the coastline with a high
tidal range behind a breakwater and does not block the river or estuary. The onshore lagoons
consist of a dam-like wall that forms a horseshoe shape, and the land finishes the circle,
whereas the offshore lagoon’s dam forms a complete circle. Conversely, Waters and Aggidis
(2016, p. 6) reported no significant difference in the working principle between the tidal
barrages and lagoons – he lagoon captures a large amount of water behind the structure
which is subsequently released to drive turbines (turbines are bi-directional – they can
generate power from incoming or outcoming tides) and produce electricity.
Although the size of lagoons is relatively smaller than barrages, the resulting production of
output power increases (the Severn Estuary lagoons offer more than 40% available energy
compared to the barrages) (“Severn Estuary Tidal Energy from Non-barrage Options”,
2007).
Figure 15 Holding period at high or low water (a). Generating on the ebb tide (b). Generating on the flood
tide (c). (Retrieved from: http://www.tidallagoonpower.com/)
(a)
(b) (c)

28
4.1.2. Tidal stream technologies
Tidal stream, or tidal current, converts the kinetic energy into the resulting generated power
and works as the wind turbines beneath the surface, where are fixed to the seabed. The only
difference, highlighted by research of Greaves & Iglesias (2018, p. 132-133), consists in
flowing of the water currents across the turbines motor – it does not require the storage of
water. Although the tidal stream turbines produce more structural loading when compared
to the air driven turbines, the blades require a high degree of robustness since they are fully
submerged under the water. There might be high design criteria due to possible material
corrosion from salt or possible blade cavitation.
The turbines can be distinguished into two main parts (“Tidal Energy: Technology Brief”,
2014):
- Horizontal/vertical-axis and enclosed turbines – in case of these turbines, the blades
are positioned perpendicular or parallel to the direction of the flow of the water. The
conversion of power involves a turbine rotor (converts the energy of the current),
gearbox (converts the low rotational speed to the wanted speed of the generator shaft)
and generator (converts the shaft energy to electric power). As regards the enclosed
turbines, the stream is here concentrated so that the flow and power from the turbines
increases (Figure 16, 17).
- Reciprocating devices – turbines used in these devices are called hydrofoils (from
the shape of airplane wings) which allow the up and down motion as the tidal stream
flows on one of the sides of the blade. This leads to the movement conversion into
the rotation to drive the rotating shaft (Figure 17).
Figure 16. Horizontal turbines. (left), vertical turbines (right). (Retrieved from:
http://www.emec.org.uk)

29
All tidal stream structures need support to keep them in place and withstand the conditions
at sea. There exist three possibilities of installation based on data of Aqua-RET (“Tidal
Stream: Construction and Installation (Level 2)”, 2012): gravity structure, piled structure
and floating structure (Figure 18). Gravity structures are made of massive steel on concrete
and attached to the bed. Other options that enable the structures to be pinned to the seabed
are piled structures. The connection can be made either by one or more steel/concrete piles.
Floating structures allow the installation in deep water locations due to the turbine is
mounted to the barge (anchored to the seabed using ropes or chains).
Figure 18 Enclosed turbines (left), reciprocating devices (right). (Retrieved from: http://www.emec.org.uk )
Figure 17 Support structure concepts. (Retrieved from: http://www.aquaret.com)

30
4.1.3. Tidal power plants
International Renewable Energy Agency (IREN) (“Tidal Energy: Technology Brief”, 2014,
p. 19) conducted research and defined that most of the tidal energy devices are located
onshore, but there is a possibility to build them in various depths and distances from the
coastline. The Bay of Fundy in Canada is the most protentional place for the highest tides in
the world – up to 17 meters in amplitude. Other places with maximum amplitudes from 10
to 13 meters can be found on the coast of Argentina, the UK, Brazil, north-western Australia,
France, South Korea or Alaska (Figure 19). For the construction of any tidal power plant,
there exist criteria that must be followed: the possibility of building of a large reservoir, the
minimum average amplitude of 5 meters, and sufficient water depth for installation of the
turbines.
4.1.3.a. The Rance Tidal Power Plant (France)
Multon (2012) points out the most significant tidal power plants. The first tidal power plant
that took advantage of tides and their power was built at the Rance River in France (Figure
20). After five years of construction, the Rance power plant was opened in 1966 and for
many years remained the largest one until Sihwa power plant (2011).
The situation was chosen due to the highest and largest tidal range in France – the average
tidal range can reach 8 meters between high and low tide (spring tide is able to reach almost
14 meters). With the total length of 750 meters, the reservoir can hold 184 million m3. The
barrage consists of 24 individual bulb electricity turbines (nominal power 10MW) that give
Figure 19. Global Tidal Range. (Retrieved from: https://wegc203116.uni-
graz.at/)

31
the total installed capacity of 240MW (the annual generation of 500GWh/year) (“Tidal
giants – the world’s five biggest tidal power plants”, 2014).
The working principle is based on a bidirectional cycle, and the bulbs are also used as pumps
for the increase of head difference.
4.1.3.b. Lake Sihwa Tidal Power Plant (South Korea)
Kwater, South Korean governmental agency for comprehensive water resources,
participated in designing multiple hydro power plants, one of them is Lake Sihwa Tidal
Power Plant (“Sihwa Lake Tidal Power Plant”, 2018). Its construction was started in 2004
and completed in 2011, since when the Sihwa Lake Tidal Power Station (Figure 22) is
considered to be the largest operating tidal power station. The power station is built on the
artificial lake, which was first projected to provide land for the metropolitan area and to hold
irrigation water for agriculture means. However, the water quality deteriorated due to nearby
industries and was no longer useful. In order to reduce the pollution by adding fresh water
into the lake with each tidal cycle, a tidal barrage was constructed.
In general, Multon (2012) claims that the western coast of South Korea (Figure 21) offers a
great condition for tidal power generation (the tidal ranges reach up to 9 meters). As regards
the Sihwa power plant, the average tidal range reaches 7 meters and is located in the
Gyeonggi Bay. Sihwa operates only on water flowing from the sea towards the reservoir
through 8 sluice gates and ten bulb groups (installed capacity of 245MW) and produces
approximately 552GWh annually. In a case study of Sihwa Lake Tidal Power Plant, Kim Y.
H. declares: „The 552.7 GWh of electricity generated from Sihwa tidal power plant is
Figure 20. The Rance Tidal Power Plant in France. (Retrieved
from: https://www.renewableenergyworld.com/)

32
equivalent to 862,000 barrels of oil, or 315,000 tons of CO2 – the amount produced by
100,000 cars produce annually. “(Kim, 2018).
The effort to further development is a key factor for Korea government, followed by the
Korea Water Resources Corporation (Kwater) vision to include integrated field surveys,
plant optimization processes, modelling works, and enhance the water quality via seawater
circulation. The Sihwa power plant is known for environmentally friendly approach towards
being opened to the public that includes building of a tidal power culture center in the tidal
lake area.
Figure 21. Picture of the most significant tidal
power plants on the western coast of South Korea.
(Retrieved from: Greaves, D., & Iglesias, G.
(2018). Wave and tidal energy )
Figure 22. Sihwa Power Plant in South Korea. (Retrieved from: https://cdn.powermag.com)
33
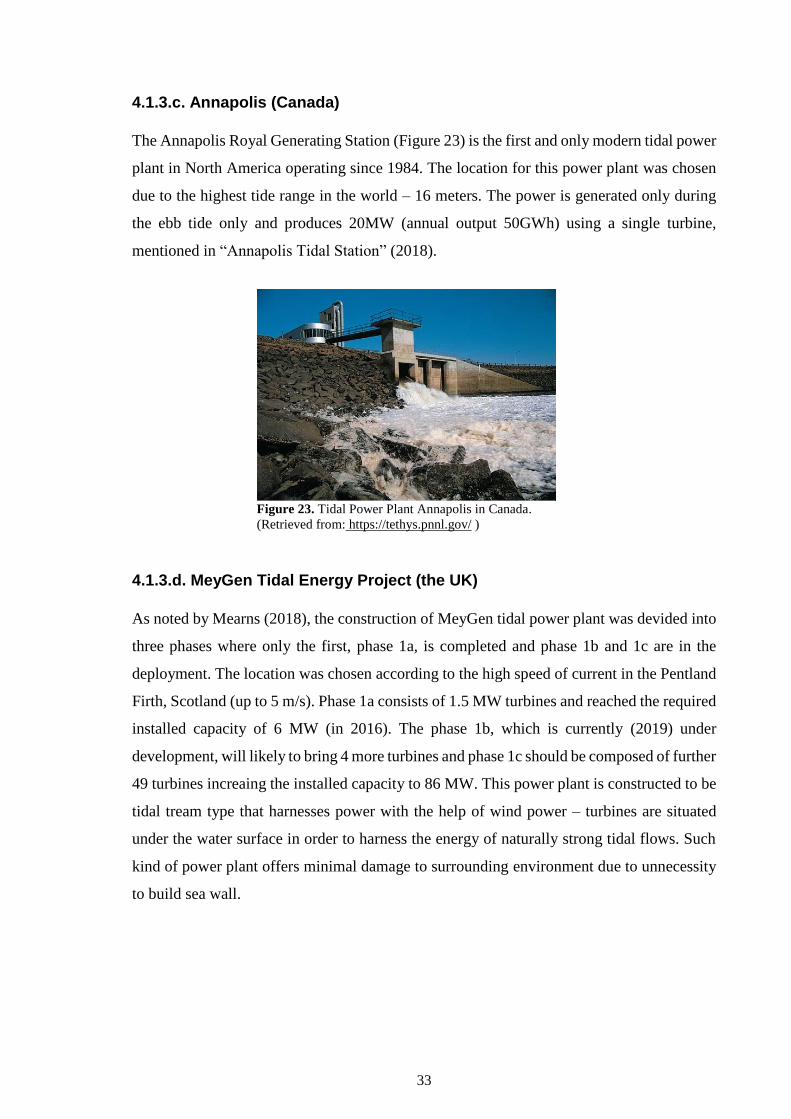
4.1.3.c. Annapolis (Canada)
The Annapolis Royal Generating Station (Figure 23) is the first and only modern tidal power
plant in North America operating since 1984. The location for this power plant was chosen
due to the highest tide range in the world – 16 meters. The power is generated only during
the ebb tide only and produces 20MW (annual output 50GWh) using a single turbine,
mentioned in “Annapolis Tidal Station” (2018).
4.1.3.d. MeyGen Tidal Energy Project (the UK)
As noted by Mearns (2018), the construction of MeyGen tidal power plant was devided into
three phases where only the first, phase 1a, is completed and phase 1b and 1c are in the
deployment. The location was chosen according to the high speed of current in the Pentland
Firth, Scotland (up to 5 m/s). Phase 1a consists of 1.5 MW turbines and reached the required
installed capacity of 6 MW (in 2016). The phase 1b, which is currently (2019) under
development, will likely to bring 4 more turbines and phase 1c should be composed of further
49 turbines increaing the installed capacity to 86 MW. This power plant is constructed to be
tidal tream type that harnesses power with the help of wind power – turbines are situated
under the water surface in order to harness the energy of naturally strong tidal flows. Such
kind of power plant offers minimal damage to surrounding environment due to unnecessity
to build sea wall.
Figure 23. Tidal Power Plant Annapolis in Canada.
(Retrieved from: https://tethys.pnnl.gov/ )

34
4.2. Conclusion
In reviewing the literature, tidal energy is assumed to be a significant part in ocean energy,
especially in certatin locations (for example The Bay of Fundy in Canada). The chapter
dedicated to tidal energy includes not only the general summary of technological possibilites,
but also the decription of tidal power plants. In particular, the Sihwa Lake Tidal Power
Station in South Korea that is at present the largest of its kind (with installed capacity of 245
MW).
There were mentioned two primary systems of tidal technolgies – tidal stream and tidal
rannge, which are additionally divided into tidal barrages and lagoons. Although the tidal
range system requires the storage of water, stream devices are most of the time deteched to
the ocean/sea bottom as the water flows across the turbine motors. The main challenge for
technological development was stated to be the increase of turbine efficiency as they are
predetermined to withstand in a harsh evironment.
35
5. Ocean Thermal Energy
Ocean Thermal Energy Conversion (OTEC) technology operates on a principle that can
produce electricity by harnessing the distinctive temperature between cold deep ocean water
and warm tropical surface waters (thermal gradients). For the OTEC to function properly,
the temperature difference is required to range from at least 20°C to ideally 30-40°C
(Hossain et al., 2013). Apart from the heat from the core of the Earth, moreover, the solar
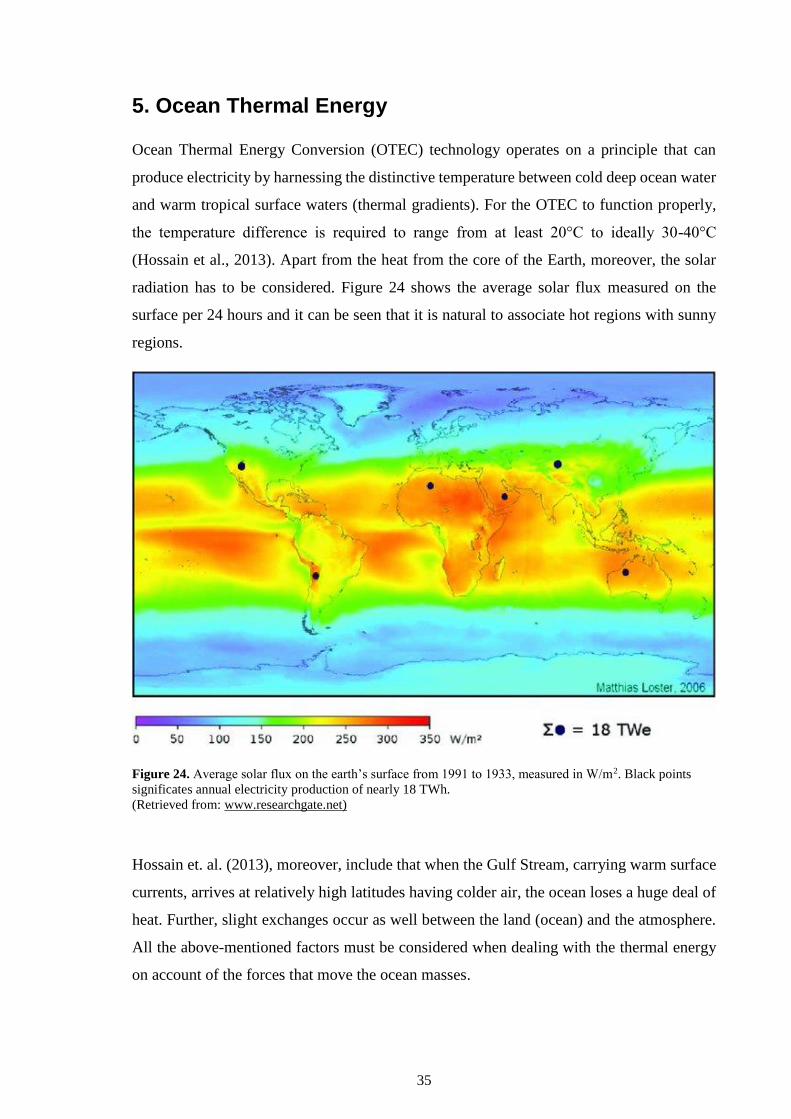
radiation has to be considered. Figure 24 shows the average solar flux measured on the
surface per 24 hours and it can be seen that it is natural to associate hot regions with sunny
regions.
Figure 24. Average solar flux on the earth’s surface from 1991 to 1933, measured in W/m2. Black points
significates annual electricity production of nearly 18 TWh.
(Retrieved from: www.researchgate.net)
Hossain et. al. (2013), moreover, include that when the Gulf Stream, carrying warm surface
currents, arrives at relatively high latitudes having colder air, the ocean loses a huge deal of
heat. Further, slight exchanges occur as well between the land (ocean) and the atmosphere.
All the above-mentioned factors must be considered when dealing with the thermal energy
on account of the forces that move the ocean masses.

36
Ocean masses are generally identifiable bodies of water created in the deep ocean including
a thermocline (the transition layer between warmer mixed water at the ocean’s surface and
cooler deep water below) (“What is a thermocline?”, 2018). As a result of rapid decrease of
temperature from the mixed upper layer of the ocean to significantly colder deep water in
thermocline, the depth and strength of thermocline in the ocean may change depending on
the season and year.
In survey of Bralower and Bice (2011) the primary masses of deep ocean are:
- North Atlantic Deep Water (NADW) mass originates in the seas of Norway and
Greenland, where the surface is cooled and carries a temperature of 2-3°C. NADW
travels down the west side of the North Atlantic Ocean and through the west side of
the South Atlantic at an average depth of 2 500 meters (see Figure 25).
- Antarctic Deep Water (AADW) runs beneath the NADW with a temperature of
approximately 0°C and at an average depth of 4 000 meters. Considering it the
densest and coldest mass of them all, AADW is produced in the Southern Ocean
(exactly around the coast of Antarctica and under the Ross sea) (Figure 26).
Figure 25. Map showing formation of North Atlantic Deep Water in the
northen part of the North Atlantic. (Retrieved from: https://www.e-
education.psu.edu)

37
Nonetheless, Cenedese and Gordon (2019) are concerned with what moves masses,
currents and the overall oceanic circulation is the thermohaline circulation (THC) (Figure
27) that is controlled by the horizontal temperature differences and salinity and is defined
by a flow rate. This very slow process takes the vast amounts of seawater from the bottom
of the ocean and replaces it with the water from the surface and consecutively replaces
the surface water elsewhere with water from deeper parts.
Figure 26. The formation of Antarctic Deep Water in the Southern Ocean. (Retrieved
from: http://www.wikiwand.com)
Figure 27. Thermohaline circulation. (Retrieved from: https://www.britannica.com)

38
Acknowledging all the information about masses and currents is crucial in terms of
understanding the OTEC functional principle. As a part of renewable resources, most of the
electricity that is used comes from heat engines, a system which cycles between two various
temperatures – cold deep parts beneath the surface and hot surface of the ocean. Thermal
power plants constructed on land might work on a similar principle with only one exception.
The heat engine, particularly steam engine or steam turbine, is powered by heating the engine
with coal. However, in OTEC no fuel is burned, since the thermal gradient derives itself
naturally. The potential consists of providing large quantities of base load energy.
In addition, most of the OTEC systems are, as well as the wave systems, a part of several
experimental projects (Hossain et al., 2013) despite the already developed technology. This
is due to the lack of operational records required to be eventually commercialized, the lack
of consistent funding from government, or the necessity of permission from Environmental
Impact Statements (EIS).
The main parts of OTEC are evaporator, condenser, turbine, pump and power generator,
and all of them are connected with pipes (including working fluids, for example ammonia).
5.1. The thermodynamic cycles and energy conversion systems
of thermal energy
Multon (2012) identifies several advantages and disadvantages of the cycles. So far, the main
advantage regarding open cycle, as well as hybrid cycle, involves the production of
electricity equal to the production of drinking water. In contrast, large amounts of air must
be pumped in order to obtain a high vacuum (dissolving gases in the seawater), in addition,
the open cycle construction requires a very large turbine, because of the low pressure.
Closed cycle deals primarily with the usage of working fluid; therefore, the initial
construction costs are lower due to small turbogenerators (reduced amount of work in terms
of volume). However, notable disadvantage is the greater degree of biofouling (the gradual
accumulation of waterborne organisms, such as bacteria, on the surfaces of engineering
structures in water that contributes to corrosion of the structures and to a decrease in the
efficiency of moving parts) (“Definition of biofouling”, 2019) due to double-walled
exchangers.
Furthermore, there could be a certain drawback associated with the hybrid cycle – the initial
costs are the highest out of all three types.
39
In general, the OTEC power plants might be considered valuable in biomass due to a
production of biofuels, and because of the cold seawater, the OTEC can be possibly used to
cool down buildings, according to Multon (2012). However, OTECs could be exploited only
in the tropics, since the temperature difference between the bottom and surface is not great
enough. The most efficient energy conversion would be 8% for 26°C warm and 4°C cold
seawater.
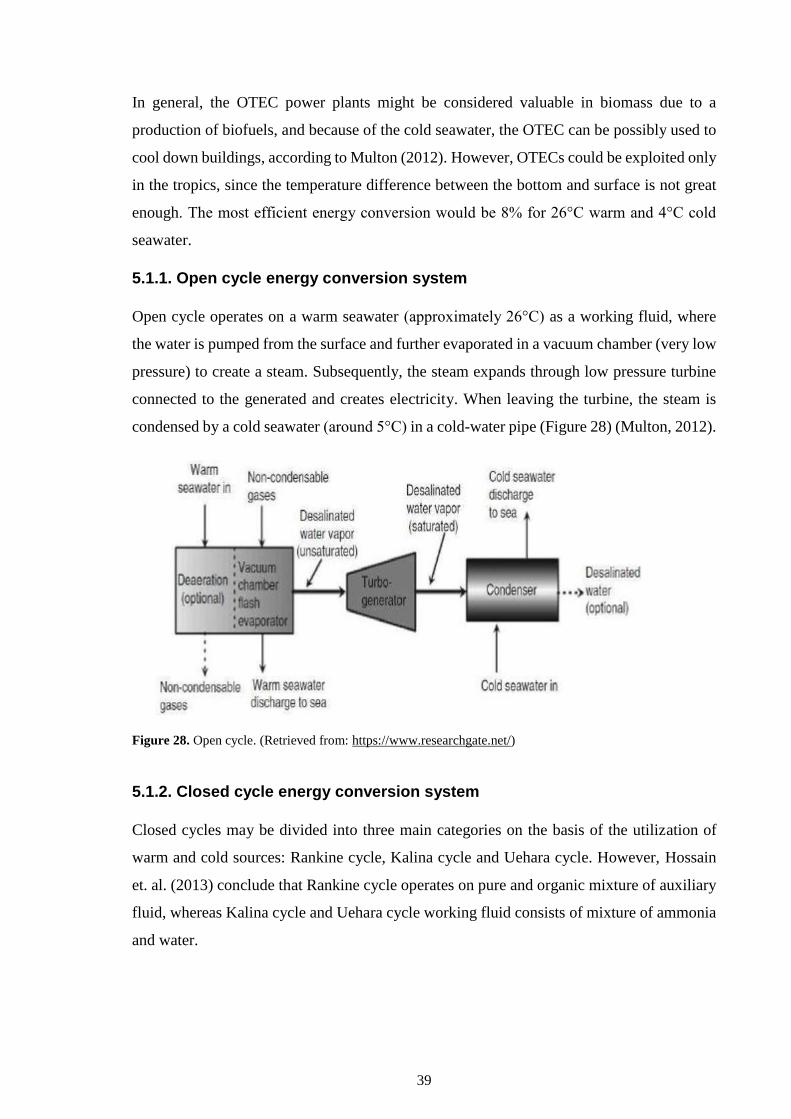
5.1.1. Open cycle energy conversion system
Open cycle operates on a warm seawater (approximately 26°C) as a working fluid, where
the water is pumped from the surface and further evaporated in a vacuum chamber (very low
pressure) to create a steam. Subsequently, the steam expands through low pressure turbine
connected to the generated and creates electricity. When leaving the turbine, the steam is
condensed by a cold seawater (around 5°C) in a cold-water pipe (Figure 28) (Multon, 2012).
5.1.2. Closed cycle energy conversion system
Closed cycles may be divided into three main categories on the basis of the utilization of
warm and cold sources: Rankine cycle, Kalina cycle and Uehara cycle. However, Hossain
et. al. (2013) conclude that Rankine cycle operates on pure and organic mixture of auxiliary
fluid, whereas Kalina cycle and Uehara cycle working fluid consists of mixture of ammonia
and water.
Figure 28. Open cycle. (Retrieved from: https://www.researchgate.net/)

40
The selection of the working fluid is crucial, however not all of the criteria can be satisfied,
such as its thermal conductivity, the toxicity or explosiveness, impacts on the environment,
or its vaporization enthalpy that should be high, and much more.
Multon (2012) lists three types of fluids:
1. Inorganic refrigerants – water, carbon dioxide, ammonia (this fluid has been
extensively used for over then century, yet is highly toxic)
2. Hydrocarbons – compounds of hydrogen and carbon only (propane, butane,
propylene).
3. Hydrofluorocarbons - chlorofluorocarbons (CFSs) and hydrochlorofluorocarbons
(HCFs) are prohibited due to the proven harmfulness to the ozone layer.
Hydrofluorocarbons (HFCs), which are currently used, are considered not harmful
to the ozone layer, although there has been found an evidence of contribution to the
greenhouse effect.
5.1.2.a. Rankine cycle
Rankine cycle is described in an university textbook (Mastný, Morávek, Pitron, & Vrána,
2015, 19) as a thermodynamic cycle used not only in thermal power plants, or solar power
devices, but found in OTEC as well. The working principle corresponds with the basic closed
cycle operation – it needs the fluid to be capable of boiling at ambient temperature when
receiving heat form surface warm water in the evaporator. The auxiliary fluid (for example
ammonium) is pumped into the evaporator, then vaporized and eventually it rotates the
turbine activating power generator, which results in creating electricity. The already
processed vapor leaves the turbine and is then condensed by cold deep seawater inside
condenser (Figure 29). The process repeats itself continuously in order to produce electricity.

41
Nevertheless, in Rankine cycle the working fluid does not have to be only ammonium.
Having said that, in Organic Rankine Cycle the fluid contains carbon and hydrogen, the
opposite one, Rankine cycle without any other indicators uses inorganic fluids (H2O, CO2,
ammonia).
5.1.3. Hybrid cycle conversion system
Hybrid cycle combines the best features of the closed and the open cycle and its purpose is
to produce electricity as well as fresh water, therefore the result offers greater potential. The
warm seawater flows to a vacuum chamber where it is evaporated into steam (like in open
cycle). The steam vaporizes the auxiliary fluid of a closed cycle and the vaporized fluid
rotates the turbine to create electricity. Finally, the steam condensates providing desalinated
water.
5.2. OTEC Okinawa, Japan
The Okinawa Thermal Power Plant (Figure 30) (“Post-OTEC Seawater Utilization
Demonstration Project”, 2019) is currently the only continuously operating OTEC since
2013; the maximum capacity can reach up to 100kW a year with coal as the working fuel.
In 2017, a project of Post-OTEC Seawater Project – Kumejima Model (1.25 MW) – was
constructed in order to integrate larger scale OTEC (power production) and deep seawater
use in a system that efficiently utilizes the ocean resources. The installation of pipelines
Figure 29. Closed cycle; Rankine cycle. (Retrieved from: https://www.researchgate.net/)

42
allows deep and surface water to be employed by nearby industries, which results in more
fresh water for power generation.
Regarding the future of OTEC Okinawa, based on project conducted by Okinawa company
(“Into the Future”, 2019) there are being realized several other projects, such as the Power
Generation Demonstration Test for measuring the amount of power generation during
weather and temperature changes, or the establishment of offshore OTEC in order to reduce
the cost of power generation.
5.3. OTEC Makai, Hawaii
In their report, the Natural Energy Laboratory of Hawaii Authority (NELHA) reported how
OTEC Makai works together with the construction history (“Natural Energy Laboratory of
Hawaii Authority 2017 ANNUAL REPORT”, 2017). NELHA administrates the Hawaii
Ocean Science and Technology Park (HOST Park) in order to provide the islands with green
economic development and ocean-based energy since 1974. The OTECs could supply a high
degree energy security with minimal gas emissions, and, moreover, support land
transportation. The total output may be abundant enough to provide the additional electricity
demand.
To effectively use the potential of Hawaii islands, NELHA decided to launch a project with
the support of the State of the Hawaii government - the Mini-OTEC Project (1977). This
offshore closed-cycle power plant operated on ammonia as a working fluid. Deep seawater
was pumped under pressure towards the condenser through a flexible tube. Nevertheless, the
Figure 30. The Okinawa Thermal Power Plant pipes (left), The current temperature of seawater in Okinawa,
Japan on 4th of February, 2019 (rigt). (Retrieved from: http://otecokinawa.com/en)

43
possible output of 50 kW was not achieved due to a low turbogenerators and low pumps
efficiency. In the end, it was able to reach a production of net power of nearly 20 kW.
Another Hawaii’s project, the OTEC-1, was conducted in 1980 with 1 MW of nominal
power, however, the design lacked a turbine which led to the usage of this OTEC as a test
of the heat exchangers. The operation was withdrawn after a few months of functioning as a
result of severe maintenance costs and the necessity of generators to be constantly operated
on diesel fuel.
Currently, the first closed-cycle OTEC connected to the US grid since 2015, Makai Ocean
Thermal Power Plant is located at the Natural Energy Laboratory of Hawaii Authority in
Kailua-Kuna with annual power generation capacity of 100kW a year. The cost of energy
supply greatly differs from Okinawa due to the usage of ammonia as the primary working
fluid.
5.4. Conclusion
OTECs are considered rather new type of possible ocean energy, in comparison to wave or
tidal. In this part of the Bachelor’s thesis, the main goal was to describe working principle
of OTEC technology - in order to function correctly, the difference between deep sea water
and the surface is stated not to be less than 20°C, which complies to the location in tropics.
The operation could be compared to thermal power plants, however, OTECs heat engine
does not burn fuel, instead it uses seawater as a working fluid. In general, conversion system
can be divided into three categories – open cycle, hybrid cycle, and closed cycle, which is
believed to be the most used one. In particular, Rankin cycle, part of the closed cycle. The
significant power plants are enlisted additionally (OTEC Makai in Hawaii or Okinawa in
Japan).

44
6. Environmental impacts
The main concern regarding environmental issues such as global warming and climate
change increases the demand for more clear sources of energy in many countries. Their
interest focuses on the usage of less environmentally damaging resources in order to decrease
the level of greenhouse gas emissions that is one of the great challenges of the 21st century.
The climate change is defined as “periodic modification of Earth’s climate brought about as
a result of changes in the atmosphere as well as interactions between the atmosphere and
various other geologic, chemical, biological, and geographic factors within the Earth
system” (Jackson, 2019), and followed by the question whether the climate change is
attributed only to human activity or seen as a natural process. It is known that the situation
has changed rapidly after the Second World War as there was a huge increase in fossil fuel
consumption. Nevertheless, there are other potential environmental changes caused by ocean
energy sources.
Several research on environment and its impacts were conducted. In paper Environmental
Impact Assessments for wave energy developments by Leeney et. al (2014) mention that the
environmental effects created by wave and tidal devices are bound to have impact on
physical as well as on the biological level – location, construction and maintenance, coastal
erosion, fish, noise and visual appearances. The larger-scale commercial array the static
device is the higher the risk. Concerning dynamic devices, tidal power plants are likely to
have, in general, higher level of risk then wave dynamic power plants. Typically, dynamic
devices are rotating, oscillating parts of the power plant that may have further effects on the
environment in terms of animals colliding with these moving parts.
Some studies, for example study of Copping et. al. (2016), are concerned with the generation
of noise by the vessel traffic in constructions and maintenance, and by the operation of ocean
power plants – the most noticeable noise level is derived from pile driving, but it still does
not reach the level of noise generation of offshore wind power plants and their full-sized
pilings installation. The reason is that most of the ocean devices are attached to the seafloor.
Moreover, not only this but the impact on the sound communication and navigation of
marine animals might be one of the concerns, since this could affect their behavior for
hunting, migration, or avoiding threats. Research about other significant evidences and
conclusion is needed in order to avoid present uncertainties.

45
Additionally, an installation of an ocean power plant may contribute to changes in water
flow and circulation as the kinetic energy is extracted from the natural movement causing
sediment transport or changing the benthic habitats, which might result in flushing
(systematic replacement of water in a bay or estuary as a result of tidal flow) (Cook,
1982). Besides this, data show that the various individual devices are unlikely to have any
significant effect on flow change thus far. In the future, the attention should be given to
larger devices consisting of more than 100 turbines.
Another potential risk to the ocean environment, mentioned by Copping et. al. (2016), might
pose the presence of artificial chemicals. These chemicals are used for coating the exterior
parts of devices to prevent them from corroding, and they can eventually become toxic and
leak into the water (biocides, anticorrosion materials). Although the effects of chemical are
known and studied, the number of ocean power plants is not as high as the number of cargo
ships, personal ships, yachts etc. that are producing greater water pollution and might be
more harmful to the environment. As a result, the greater risk is associated with oil, fuel and
other hazardous substance leakage during installation or maintenance, but these risks are
already taken into consideration and are highly researched and understood.
Concerning wave devices, the positive aspect could be its ability to protect coastal stretches
from the risk of erosion or flooding due to the prediction of sea level rising; it provides the
adaptability to sea level rise. Other aspects might be taking into consideration the location
of installation in order to reduce the final effect on fishing or other uses of the sea. On the
other side, the installation could have a negative effect in a form of underwater sound from
the WECs, which may further harm the marine animals. Additionally, harnessing devices
contain power cables, anchors and other non-moving parts, which may also lead to
interaction with marine animals and potentially disturb their natural predation. Nevertheless,
point absorbers in WECs are not considered to be the risk for marine animals as stated in
research of Akar and Akdoğan, (2016).
In terms of tidal power plants, there can occur risks regarding possible changes in the estuary
basin (local scouring) or contamination due to the reduced flushing rates leading to increased
water quality. Although most of the potential impacts could be considered the same as in the
wave devices, tidal devices are more associated with the possible loss of some habitats, such
as salt marshes, and damage of the benthic habitats due to change of ocean bottom. There
appears to be higher chance in device or turbine collision with marine animals as tidal

46
devices are more frequently designed as static constructions attached directly to the bottom
of the ocean then wave devices.
According to a case study of the potential of the Severn Estuary analyzed in Environmental
impacts of tidal power schemes (Wolf, Walkington, Holt, & Burrows, 2009), which is a place
with the highest tidal range in the United Kingdom, the essential impact is the higher chance
of flooding due to the increase of tidal amplitude, however, the increase is still not that
significant to be seen as harmful. Another data shows that due to the disruption of the bottom
by water being less turbid there happens to be a raise in penetration. The solution to this is
to use turbines for pumping to enhance head differences prior to electricity generation.
In addition, an example of a positive impact on the surrounding environment might be the
Sihwa Tidal Power Plant as it was built mainly with the intention to increase the water quality
in the lake. Since its opening, there are data showing improved water quality, reduction of
floods, and, subsequently, the increase in the species diversity and in the tidal flat area due
to a regular exchange of seawater.
However, there are no definite evidences of how much these devices could harm the
surrounding environment, the concentration of available information is limited due to the
often very costly research (examples of projects dealing with this research are SOWFIA
(“Streamlining of Ocean Wave Farm Impacts Assessment”, 2019), ORECCA (“Final Report
Summary - ORECCA”, 2012)). Other studies of the behavior of marine animals were
focused on better understanding of interaction with ocean power plants and the final
conclusion suggested that these collisions are rather rare. There is still little evidence
regarding significant effects and for that reason further monitoring and collecting of proofs
of animal behavior will be required. The final impacts could be compared with offshore wind
power plants that are equal, or possibly even higher.

47
7. Visions of the future
As far as the future development is concerned, the key issue lies in project funding and
investments to support the emerging technologies, which would introduce more efficient and
compatible ocean harnessing devices. The European Commission is one of the main
participants in promoting the potential usage of oceans as a significant part of electricity
production not only for individual households, but for wider range. The reason is the high
concentration of possible locations in Europe for power plants constructions as well as the
necessity towards decarbonization. The UK, France and Ireland are currently the leaders in
deployment of ocean technologies in the coming years.
Besides this, in comparison with other renewables the cost of ocean devices is higher mainly
due to greater technology costs (wave/tidal production €0.25-37/kWh, wind €0.18/kWh)
(“Ocean Energy: Action needed to deliver on the potential of ocean energy by 2020 and
beyond”, 2014, 12), which eventually leads to uncertainties in technical field and lack of
experience. The intention is to reduce these costs via Research and Development programs.
Horizon 2020 (H2020) could be one of the solutions. This project of the European Union
research and innovation program is included in the Europe 2020 (research area concentrating
on investments in future jobs and growth, safety and environment, strengthening the EU’s
global position in technology and research). With funding of nearly €80 for 7 years (2014-
2020) (“What is Horizon 2020?”, 2014), the primary purpose was to give an opportunity to
the private investment, and to ensure the growth in science in order to improve the public
and private cooperation in delivering innovations. Renewable energy solutions are inevitably
part of H2020 project, especially, the aim is to focus on reducing initial and operational
costs, and increase reliability of the ocean devices, since these are the main reasons why so
little has been developed so far. The ocean energy projects are associated with new integrated
designs of tidal and wave devices so as to increase their lifetime and resistance. According
to a data from Horizon 2020 (“Horizon 2020”, 2018, 120), in 2019, there should be a
complete plan of pre-commercial procurement program for wave energy research and
development. At the first stage of preparations, it was stated that it is expected to come up
with clearly identified technologies, which would further be tested as prototypes.
With the continuous innovations in ocean technologies, more and more projects receive the
attention of public or private companies. In terms of H2020, the EU is trying to meet 10%
of the total Europe power demand by 2050. DTOceanPlus (2018-2021) project might be one

48
of the most promising ones with the specialization in designing tools for wave and tidal
arrays in the upcoming years. (“About DTOceanplus”, 2018)
Moreover, The Ocean of Tomorrow was a 2011 EU’s proposal for several projects
concentrating on ocean-wind energy, rather than the conversion itself, and bringing up three
projects: H2OCEAN, MERMAID, TROPOS. For example, H2OCEAN project dealt with
electricity generation from wind-wave power on the open sea for hydrogen generation. The
aim was to create economically sustainable multi-use platform. Nevertheless, demonstrated
in Ocean Energy: Action needed to deliver on the potential of ocean energy by 2020 and
beyond (2014), all three projects were postponed due to a lack of investments.
Regarding the current projects under H2020, there are currently many including the Italian
project IMAGINE that develops the Electromechanical Generator. This device is said to “be
able to convert slow speed alternating linear motion into electricity on the basis of
continuous magnet generator.” (“UmbraGroup takes lead in €3.8M wave energy project”,
2018) Another funding was given for the development of the MegaRoller project (designed
in conjunction with OWCS) (“MegaRoller Project Reaches New Milestone”, 2019), which
might include 1 MW power take-off under the cooperation of 10 partner companies. The
aim of this project is to reduce cost of energy and to produce commercially available wave
device.
Figure 31. MegaRoller. (Retrieved from: https://marineenergy.biz)

49
8. Conclusion
This Bachelor’s thesis was intended to focus on the main principles of wave and tidal energy
processes. The terms regarding renewable and sustainable were defined and there was
provided basic knowledge about the further topic. The aim of this thesis was to acquaint
readers with the possibilities of energy converters in terms of wave, tidal energy, and other
possible ways of ocean energy harnessing, such as ocean thermal energy or salinity gradient
energy. In particular, I searched the literature and described the particular methods since
each working principle differs and individual devices can be structured and situated
variously – onshore, offshore or nearshore. Further, the maintenance also varies, and thus,
every project is created according to specific conditions. The ocean power plants are situated
mostly in locations of the highest waves or tides. In this thesis, I selected and listed the most
significant of them and demonstrated the locations on enclosed maps.
Wave and tidal energy can provide a sufficient source of energy as well as other alternative
sources, although the development of the ocean technologies is still at its beginning. There
must be done more research and made more efforts to be able to ensure that renewable
energies will provide us with a large amount of accessible and environmentally safe power
in the future. The problem with achieving the increase of alternative power plants is the cost-
effectiveness, simplicity, and requirement of minimal maintenance. Nevertheless, other
important topic is dealt with the environmental impact. The fossil fuel plants might be one
of the causes of the global pollution of water, air, soil and subsequently the global warming.
Even though the statements about human contribution to global warming are at present
widely questioned, so far, there are no confirmed definite data. However, ocean energy also
deals with the environmental impacts and is not always environmentally-friendly. The key
lies in understanding the necessity of choosing the right development technologies without
harming the ocean life.
Although harnessing energy from natural sources has existed longer than the production of
energy by using non-renewable sources, the reliance on fossil fuels is still higher in general.
The developments of ocean devices started in 1960s (La Rance power plant) and since then
the importance of looking for alternative sources of energy has grown rapidly. Not only
private companies, but the governments in countries all around the world are focusing on
the future potential in renewables. Ocean energy is inevitably a significant part of this wide
area and deserves greater attention. So far, not many information is available regarding ocean

50
technology, however, it is only due to a lack of investments into these projects. As soon as
the development receives sufficient attention and funding, the hidden potential will be
revealed.
In conclusion, it should be stated that the ocean energy is sustainable and able to reduce
dependence on fossil fuels as well as the solid and air pollution. Moreover, the predictability
and reliability give it the advantage over other types of renewables – solar and wind energy.
Tidal and wave energy will be able to fulfill the future potential under these conditions –
lowering the initial and installation costs in order to build ocean power plants on larger scale
and improving present technologies (e.g. turbines) to increase final efficiency.

51
9. List of references
Greaves, D., & Iglesias, G. (2018). Wave and tidal energy. Hoboken, NJ: Wiley. ISBN: 978-
111-9014-447
Mastný, P., Morávek, J., Pitron, J., & Vrána, M. (2015). Fundamentals of Energy Processes
and Electricity Generation. FACULTY OF ELECTRICAL ENGINEERING AND
COMMUNICATION BRNO UNIVERSITY OF TECHNOLOGY.
Multon, Bernard (2012). Marine renewable energy handbook. Hoboken, NJ: John Wiley,
2012. ISBN 978-1848213326.
Trujillo, A. P., & Thurman, H. V. (2017). Essentials of Oceanography (Twelfth edition).
Boston: Pearson.
Electronic references
Aberg, E., Adib, R., et al. (2018). ADVANCING THE GLOBAL RENEWABLE
ENERGY TRANSITION: Renewables 2018 Global Status Report [Online], 51. Retrieved
from http://www.ren21.net/wp-content/uploads/2018/06/GSR_2018_Highlights_final.pdf
About DTOceanplus [Online]. (2018). Retrieved May 19, 2019, from
https://www.dtoceanplus.eu/About-DTOceanPlus/Description
Aderinto, T., & Li, H. (2018). Ocean Wave Energy Converters: Status and Challenges.
Energies, 11(5). https://www.mdpi.com/1996-1073/11/5/1250
Akar, S., & Akdoğan, D. A. (2016). Environmental and Economic Impacts of Wave
Energy [Online]. In Handbook of Research on Green Economic Development Initiatives
and Strategies (pp. 285-309). IGI Global. https://doi.org/10.4018/978-1-5225-0440-
5.ch013
Annapolis Tidal Station [Online]. (2018). In Tethys. Retrieved from
https://tethys.pnnl.gov/annex-iv-sites/annapolis-tidal-station
Bevilacqua, G., & Zanuttigh, B. (2011). Overtopping Wave Energy Converters: general
aspects and stage of development [Online]. Retrieved from
https://www.researchgate.net/publication/265630995_Overtopping_Wave_Energy_Conver
ters_general_aspects_and_stage_of_development

52
Blum, P. (2009). A Setback for Wave Power Technology [Online]. In The New York
Times. Retrieved from https://www.nytimes.com/2009/03/16/business/global/16iht-
renport.html
Bralower, T., & Bice, D. (2011). Major Deep Water Masses [Online]. Retrieved May 19,
2019, from https://www.e-education.psu.edu/earth103/node/847
Cenedese, C., & Gordon, A. L. (2019). Thermohaline circulation [Online]. Retrieved May
19, 2019, from https://www.britannica.com/science/ocean-current#ref1121214
Cook, D. O. (1982). Tidal flushing [Online]. In Beaches and Coastal Geology (pp. 819-
820). Dordrecht: Kluwer Academic Publishers.
https://link.springer.com/referenceworkentry/10.1007%2F0-387-30843-1_463
Copping, A., Sather, N., & , L. (2016). Annex IV 2016 State of the Science Report:
Environmental Effects of Marine Renewable Energy Development Around the World
[Online]. Retrieved May 19, 2019, from https://tethys.pnnl.gov/publications/state-of-the-
science-2016, pp 224
Definition of biofouling [Online]. (2019). Retrieved May 19, 2019, from
https://www.merriam-webster.com/dictionary/biofouling
Drew, B., Plummer, A. R., & Sahinkaya, M. N. (2016). A review of wave energy converter
technology [Online]. Proceedings Of The Institution Of Mechanical Engineers, Part A:
Journal Of Power And Energy, 223(8), 887-902.
https://journals.sagepub.com/doi/10.1243/09576509JPE782
Etemadi, A., Emami, Y., AsefAfshar, O., & Emdadi, A. (2011). Electricity Generation by
the Tidal Barrages [Online]. Energy Procedia, 12, 928-935.
https://www.sciencedirect.com/science/article/pii/S1876610211019485?via%3Dihub
Final Report Summary - ORECCA [Online]. (2012). Retrieved May 19, 2019, from
https://cordis.europa.eu/project/rcn/94058/reporting/en
Gansu Wind Farm (China) [Online]. (2015). In . Retrieved from
https://www.thewindpower.net/windfarm_en_17492_gansu-wind-farm.php
Geothermal Energy [Online]. (2018). In Renewable Energy News & Information.
Retrieved from https://www.renewableenergyworld.com/geothermal-energy/tech.html

53
Goldman, A. (2018). Introduction to Wave Energy Converters, WECs [Online]. Renewable
Green Energy Power. Retrieved from
http://www.renewablegreenenergypower.com/introduction-to-wave-energy-converters-
wecs/
Horizon 2020, Work Programme 2018-2020: 10. Secure, clean and efficient energy
[Online]. (2018). Retrieved May 19, 2019, from
http://ec.europa.eu/research/participants/data/ref/h2020/wp/2018-2020/main/h2020-
wp1820-energy_en.pdf
Hossain, A., Azhim, A., Jaafar, A. B., Musa, M. N., Zaki, S. A., & Fazreen, D. N. (2013).
Ocean thermal energy conversion: The promise of a clean future [Online]. In 2013 IEEE
Conference on Clean Energy and Technology (CEAT) (pp. 23-26). IEEE.
https://www.researchgate.net/publication/259484486_Ocean_Thermal_Energy_Conversio
n_The_Promise_of_a_Clean_Future
Into the Future [Online]. (2019). Retrieved May 19, 2019, from
http://otecokinawa.com/en/Project/Future.html
Jackson, S. T. (2019). Climate change [Online]. Retrieved May 19, 2019, from
https://www.britannica.com/science/climate-change
Kim, Y. H. Technology case study: Sihwa Lake tidal power station [Online]. In the
International Hydropower Association. Retrieved December 08, 2018, from
https://www.hydropower.org/blog/technology-case-study-sihwa-lake-tidal-power-station
Leeney, R. H., Greaves, D., Conley, D., & O'Hagan, A. M. (2014). Environmental Impact
Assessments for wave energy developments – Learning from existing activities and
informing future research priorities [Online]. In (Vol. 99, pp. 14-22).
https://www.sciencedirect.com/science/article/pii/S0964569114001732
Lemaire, X. (2010). Glossary of Terms in Sustainable Energy Regulation [Online], 11.
Retrieved from
https://www.reeep.org/sites/default/files/Glossary%20of%20Terms%20in%20Sustainable
%20Energy%20Regulation.pdf
Löf, R. -M. (2018). Ecological sustainability [Online]. In the University of Gävle.
Retrieved from https://www.hig.se/Ext/En/University-of-Gavle/About-the-

54
University/Environmental-Work/What-is-sustainable-development-at-HiG/Ecological-
sustainability.html
Marine_World Energy Resources 2016 [Online]. (2016). Retrieved from
https://www.worldenergy.org/wp-
content/uploads/2017/03/WEResources_Marine_2016.pdf
Mearns, E. (2018). The MeyGen Tidal Stream Power Station: Pentland Firth, Scotland
[Online]. Retrieved May 19, 2019, from http://euanmearns.com/the-meygen-tidal-stream-
power-station-pentland-firth-scotland/
MegaRoller Project Reaches New Milestone [Online]. (2019). Retrieved May 19, 2019,
from https://marineenergy.biz/2019/03/20/megaroller-project-reaches-new-milestone/
Natural Energy Laboratory of Hawaii Authority 2017 ANNUAL REPORT [Online].
(2017). Retrieved May 19, 2019, from https://nelha.hawaii.gov/wp-
content/uploads/2018/03/Annual.Report.2017.Final_.Final_.Final_.pdf
Ocean Energy: Action needed to deliver on the potential of ocean energy by 2020 and
beyond, 2014 § (2014). Brussels: European Commission. Retrieved from
https://ec.europa.eu/maritimeaffairs/sites/maritimeaffairs/files/docs/body/swd_2014_13_en
.pdf, 64.
Pelamis Wave Power [Online]. (2015). In The European Marine Energy Centre LTD.
Retrieved from http://www.emec.org.uk/about-us/wave-clients/pelamis-wave-power/
Post-OTEC Seawater Utilization Demonstration Project [Online]. (2019). Retrieved May
19, 2019, from http://otecokinawa.com/en/Project/PostOTECSeawater.html
Rinkesh. (2018). What is Sustainable Energy? [Online]. In Conserve Energy Future.
Retrieved from https://www.conserve-energy-future.com/sustainableenergy.php
Sihwa Lake Tidal Power Plant [Online]. (2018). In K-Water. Retrieved from
http://english.kwater.or.kr/eng/tech/sub01/sub02/patentPage.do?s_mid=1207
Solar Energy [Online]. (2016). In Alternative Energy Solutions for the 21st Century.
Retrieved from http://www.altenergy.org/renewables/solar.html
Sørensen, B. (1991). A history of renewable energy technology [Online]. Energy
Policy, 19(1), 8-12.
https://www.sciencedirect.com/science/article/pii/030142159190072V?via%3Dihub
55
Streamlining of Ocean Wave Farm Impacts Assessment [Online]. (2019). Retrieved May
19, 2019, from https://ec.europa.eu/energy/intelligent/projects/en/projects/sowfia
The Geysers Geothermal Field, California [Online]. (2012). In . Retrieved from
https://www.power-technology.com/projects/the-geysers-geothermal-california/
Tidal Energy: Technology Brief [Online]. (2014). In . Retrieved from
http://www.irena.org/documentdownloads/publications/tidal_energy_v4_web.pdf
Tidal giants – the world’s five biggest tidal power plants [Online]. (2014). In Power
Technology. Retrieved from https://www.power-technology.com/features/featuretidal-
giants-the-worlds-five-biggest-tidal-power-plants-4211218/
Tidal Power: EDF a Precursor [Online]. (2018). In EDF. Retrieved from
https://www.edf.fr/en/the-edf-group/industrial-provider/renewable-energies/marine-
energy/tidal-power
Tidal Stream: Construction and Installation (Level 2) [Online]. (2012). In Aquaret.
Retrieved from
http://www.aquaret.com/index4961.html?option=com_content&view=article&id=119&Ite
mid=262&lang=en
UmbraGroup takes lead in €3.8M wave energy project [Online]. (2018). Retrieved May 19,
2019, from https://marineenergy.biz/2018/05/31/umbragroup-takes-lead-in-e3-8m-wave-
energy-project/

56
Vaughan, A. (2018). World's largest offshore wind farm opens off Cumbrian coast
[Online]. In . Retrieved from
https://www.theguardian.com/environment/2018/sep/06/worlds-largest-offshore-windfarm-
opens-cumbrian-coast-walney-extension-brexit
Waters, S., & Aggidis, G. (2016). Tidal range technologies and state of the art in review
[Online]. Renewable And Sustainable Energy Reviews, 59, 514-529.
https://www.sciencedirect.com/science/article/pii/S136403211501730X?via%3Dihub
Wave [Online]. (2012). In Aquaret. Retrieved from
http://www.aquaret.com/images/stories/aquaret/pdf/chapter4.pdf
What is a thermocline? [Online]. (2018). Retrieved May 19, 2019, from
https://oceanservice.noaa.gov/facts/thermocline.html
What is Horizon 2020? [Online]. (2014). Retrieved May 19, 2019, from
https://ec.europa.eu/programmes/horizon2020/en/what-horizon-2020
Wolf, J., Walkington, I. A., Holt, J., & Burrows, R. (2009). Environmental impacts of tidal
power schemes [Online]. In Proceedings of the Institution of Civil Engineers - Maritime
Engineering (Vol. 162, pp. 165-177).
https://www.icevirtuallibrary.com/doi/10.1680/maen.2009.162.4.165

57
10. List of figures
Figure 1. Tectonics plates. ................................................................................................. 11
Figure 2. Estimated renewable share of total final energy consumption, 2016. ................. 12
Figure 3. The most frequent occurrence of wave power plants. ......................................... 13
Figure 4. Possible operating principles for the location and directional characteristics. .... 14
Figure 5. Division of three Wave Energy Converters: (a) oscillating water column, (b)
overtopping devices, (c) oscillating bodies. ......................................................................... 15
Figure 6. A simple scheme of working principle of Oscillating Water Column converter.16
Figure 7. Picture of OWC power plant LIMPET 500. ........................................................ 18
Figure 8. Wells turbine. ...................................................................................................... 18
Figure 9. Overtopping device TAPCHAN. ......................................................................... 19
Figure 10. Scheme of Wave Dragon (WD). ....................................................................... 20
Figure 11. PowerBuoy. ....................................................................................................... 21
Figure 12. Pelamis Wave Energy Converter. ...................................................................... 22
Figure 13. Tidal patterns: diurnal, semidiurnal and mixed pattern. .................................... 23
Figure 14. The simple working principle of Tidal Barrage. ............................................... 25
Figure 15 Holding period at high or low water (a). Generating on the ebb tide (b).
Generating on the flood tide (c). .......................................................................................... 27
Figure 16. Horizontal turbines. (left), vertical turbines (right). .......................................... 28
Figure 17 Support structure concepts. ................................................................................ 29
Figure 18 Enclosed turbines (left), reciprocating devices (right). ..................................... 29
Figure 19. Global Tidal Range. ........................................................................................... 30
Figure 20. The Rance Tidal Power Plant in France. .......................................................... 31
Figure 21. Picture of the most significant tidal power plants on the western coast of South
Korea. ................................................................................................................................... 32
Figure 22. Sihwa Power Plant in South Korea. .................................................................. 32
Figure 23. Tidal Power Plant Annapolis in Canada. .......................................................... 33
Figure 24. Average solar flux on the earth’s surface from 1991 to 1933, measured in
W/m2. Black points significates annual electricity production of nearly 18 TWh. ............ 35
Figure 25. Map showing formation of North Atlantic Deep Water in the northen part of the
North Atlantic. ..................................................................................................................... 36
Figure 26. The formation of Antarctic Deep Water in the Southern Ocean. ..................... 37
Figure 27. Thermohaline circulation. ................................................................................. 37
Figure 28. Open cycle. ....................................................................................................... 39
Figure 29. Closed cycle; Rankine cycle. ............................................................................ 41
Figure 30. The Okinawa Thermal Power Plant pipes (left), The current temperature of
seawater in Okinawa, Japan on 4th of February, 2019 (rigt). ............................................. 42
Figure 31. MegaRoller. ....................................................................................................... 48