broadband 4g costings bohlin 2005
TRANSCRIPT
8/12/2019 Broadband 4G Costings Bohlin 2005
http://slidepdf.com/reader/full/broadband-4g-costings-bohlin-2005 1/26
Business Models and Financial Impacts
of Future Mobile Broadband Networks
Presentation for the CTIF workshop, Aalborg, 7 May, 2005
byErik Bohlin & Erik Andersson,
Chalmers University of Technology&
Simon Forge, SCF Associates
Contact: Erik Bohlin ( [email protected] )Tel: +46-31-772-1205
Paper based upon results developed in the EC/DG JRC/IPTS ProjectFuture Mobile Services (see http://fms.jrc.es )
The usual disclaimer apply - this contribution is of the authors, and does not necessarilyreflect the view of the European Commission.
8/12/2019 Broadband 4G Costings Bohlin 2005
http://slidepdf.com/reader/full/broadband-4g-costings-bohlin-2005 2/26
1 Introduction
1.1 Background
This paper has been developed in the context of a study commissioned by IPTS/JRC/EC
at the behest of DG Information Society, aiming to provide a foresight study exercise toaddress future wireless electronic communication services that will be used in the EUhighlighting potential user patterns, service characteristics, supporting technologies andtraffic volume.1 As part of that exercise, it was deemed necessary to give a dimension offinancial constraints and opportunities for next generation mobile communicationsbeyond 3G. This is important in the context of an emerging race to leadership in fourthgeneration (4G) technologies, in which the stakes have been raised by both Asian andUS actors. Building credible scenarios for mobile futures as well as building, simulatingand evaluating possible business models are small parts of the puzzle for Europeanpolicy makers and industry to acquire an understanding of the challenges that lie ahead.
The paper makes a contribution in several respects:
• Provides an interrelated set of technology, geography, costing and demandlevels, based on original scenarios
• The simulations provide indications about the economic viability of 4Gcommunications networks
• Contributes an early (first?) comprehensive financial analysis of 4G networks
The paper is structured as follows:
• Discussion of the 4Gconcept and related technologies• Methodology of the business model• Results and sensitivity analysis
An Appendix provides a brief overview of the scenarios mentioned in this paper.
2. What is 4G?
2.1 Introduction
Generations of mobile communications infrastructures have in the past been introducedin a sequential manner, beginning with first generation (1G) analogue solutions (e.g.NMT and AMPS) in the early 1980s. In the 1990s, the first digital solutions (e.g. PDC,GSM and D-AMPS) replaced the analogue, later called 2G solutions, and then 3Gsolutions followed suit. Although the implementation of 3G telecommunicationsinfrastructure systems is well underway, work on developing a fourth generation has
1 The authors would like to thank the considerable number of people who have commented onand given their inputs to this work via the web-based questionnaire or through several workshopsheld in Brussels and Seville during the course of the project. The guidance of the EC officialsinvolved - Ruprecht Niepold and Andreas Geiss of the Information Society Directorate General inBrussels, and Bernard Clements and Carlos Rodríguez of the Joint Research Centre DirectorateGeneral at IPTS in Seville - is particularly appreciated. In the final analysis, however, the authorsare solely responsible for the report's findings, which do not necessarily represent those of theEuropean Commission. See Forge et al (2005) for final report of the project.
8/12/2019 Broadband 4G Costings Bohlin 2005
http://slidepdf.com/reader/full/broadband-4g-costings-bohlin-2005 3/26
begun. Still, neither industry nor academia have reached consensus regarding the futurecharacteristics of 4G systems, much less reached any agreements on technologicalspecifications. Many disparate views of 4G futures have emerged (see e.g. Forge, 2004and Bohlin et al. 2004), ranging from a complete successive technology generation(comparable with 1G, 2G and 3G), to solutions built on seamless integration of existingand coming communications technologies (e.g. 3G, WLAN, etc.). The European
Commission IST programmes have used the term “Beyond 3G” to denote the plentifulsystems and standards likely to interact with 3G. Slowly, a view on 4G solutions as“umbrella technologies” connecting and interworking with a wide array of radiocommunications protocols and technologies has emerged as a common future vision. Inaddition, the adding of new capabilities, e.g. ad-hoc networking in mesh networkstructures has been suggested to become a probable way forward to solve the needs forincreased bit rates at lower costs.
Still, many questions about future developments remain unanswered. It is, howeverpossible to make some general hypotheses about the characteristics of future mobilecommunications systems. In the following section, these hypotheses will be presented inmore detail. Many of the characteristics presented below are closely connected,
sometimes even proportionate to each other, and some of the characteristics may seemobvious to the reader. We still choose to present them individually in order to sketch thefuture as detailed as we believe is possible.
Important characteristics of a 4G network used in our models include: Licensed AND unlicensed spectrum Increased data usage Multi technology usage Decreased cell sizes Introduction of ad-hoc (mesh) network capabilities Leading to reduced density of radio equipment Increased bit rates Increased importance of software (e.g. SDR) New pricing schemes
In our models we have used two radio access points: APs and UAPs, which will bediscussed more below:
• UAPs are defined to function as ordinary base stations with backhaulconnections
• APs are defined to function as repeaters and signal amplifiers, relaying radiosignals to allow extensions of hops.
2.2 Unlicensed spectrum
New spread spectrum technologies (e.g. OFDM) provide new ways of sharing thespectrum without dividing it in chunks of frequencies allocated to each operator. Usingspread spectrum technologies, far higher spectrum efficiency can be reached, withoutthe need to licence the frequencies in advance. A factor contributing to unlicensedspectrum is the convergence between telecommunications and computercommunications. The rapid diffusion of data communications products using theunlicensed 2.4 GHz band, including WLAN (Wi-Fi) is suggesting how standardizationand increasing returns affect technology adoption and usage. The computer industry hasa longer history of using standardized technology solutions, competing with technology
8/12/2019 Broadband 4G Costings Bohlin 2005
http://slidepdf.com/reader/full/broadband-4g-costings-bohlin-2005 4/26
integration, standard-based innovation and product development, and innovativemarketing. Interesting examples for comparison are the Ethernet, IP, Wi-Fi, etc.
2.3 Increased data usage
Mobile communications is continuously substituting for fixed communications, be itmobile telephony or cordless usage of data networks (WLANs) in office settings. Thistrend is likely to continue, and even accelerate as mobile data transfer costs are drivendown by technological improvements and increasing scale economies. With mobilevoice over IP (VoIP) solutions close to or even below the costs of fixed voicecommunications, the need for fixed telecom subscriptions will all but disappear, in bothhome and office settings. Thus, the combined amount of traffic today transferred viamobile and fixed connections, will likely be transferred over merely mobile systems in anot so distant future.
To recoup the enormous investments made in 3G systems, involved actors haveincreasingly put their hope to increased usage of data services to counterbalance thegradual slump in voice revenues. Although still in early phases, service experimentationis gaining pace. Picture and video services have been introduced, and m-commerceservices are increasingly advertised in all sorts of media. Mobile data services will mostcertainly be the strongest drivers for a new fourth generation infrastructure. Just asincreased computing power and storage size have gone hand in hand with increasingdata communication bandwidth in recent years, it seems reasonable to expect thatincreased handset capabilities will drive the need for higher mobile bandwidth solutions.Even in a 4G setting, it seems unlikely that all conversations will be held in anaudiovisual setting, but if only, say, 30% of all conversations would be held over videotelephony, the impact on data traffic would be enormous.2
Considering the mobile telephony penetration levels in the EU today, in many countriesover or around 80% and growing, and the ongoing transition from fixed to mobile, itseems reasonable to assume between 80% and 90% penetration in a 4G setting (the
youngest and oldest will probably not use the technologies).
2.4 Multi technology usage
At the introduction of first generation analogue mobile communications solutions, theinstalled base of mobile communication equipment was very small. Today, the installedbase of e.g. WiFi base stations is large and rapidly growing. Bluetooth radio capabilitiesare included in a vast amount of electronic gadgetry. WiMax solutions are expected tobe rolled out in a near future, as are UWB technologies. In addition, at the time of a 4Grollout the 3G infrastructure will offer a comprehensive network of high bit rate capacitybase stations. Although the costs of integrating these existing technologies with a 4Gnetwork may be high (both development costs and costs for reduced 4G capabilities) it islikely that the costs for developing a completely new infrastructure will be even higher.Thus, there is a high probability that 4G telecommunications will make use of themultiple technologies already implemented on a wider scale.
This development is already taking place today. A IEEE 802 Handoff Study Group isaddressing roaming and hand-offs between heterogeneous 802 networks, allowing
2 For sure, this would spur innovation in data compression solutions. It is however unlikely thatsuch technological improvements would completely offset the increased traffic
8/12/2019 Broadband 4G Costings Bohlin 2005
http://slidepdf.com/reader/full/broadband-4g-costings-bohlin-2005 5/26
mobile devices to switch the connection from one base station to another, from one 802network type to another (e.g. from 802.11b to 802.16). The aim is to reach standardizedsolutions for hand-off, making devices interoperable as they move from one networktype to another (Johnston & LaBrecques).
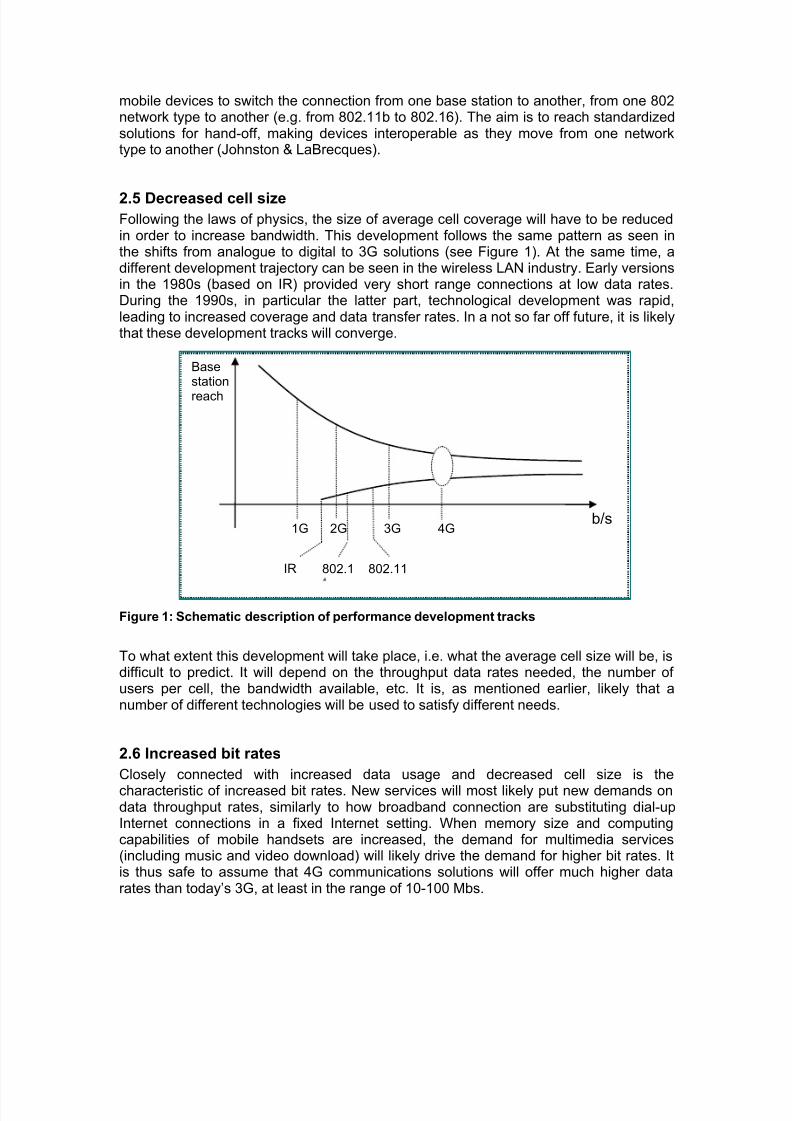
2.5 Decreased cell sizeFollowing the laws of physics, the size of average cell coverage will have to be reducedin order to increase bandwidth. This development follows the same pattern as seen inthe shifts from analogue to digital to 3G solutions (see Figure 1). At the same time, adifferent development trajectory can be seen in the wireless LAN industry. Early versionsin the 1980s (based on IR) provided very short range connections at low data rates.During the 1990s, in particular the latter part, technological development was rapid,leading to increased coverage and data transfer rates. In a not so far off future, it is likelythat these development tracks will converge.
Figure 1: Schematic description of performance development tracks
To what extent this development will take place, i.e. what the average cell size will be, isdifficult to predict. It will depend on the throughput data rates needed, the number ofusers per cell, the bandwidth available, etc. It is, as mentioned earlier, likely that anumber of different technologies will be used to satisfy different needs.
2.6 Increased bit rates
Closely connected with increased data usage and decreased cell size is the
characteristic of increased bit rates. New services will most likely put new demands ondata throughput rates, similarly to how broadband connection are substituting dial-upInternet connections in a fixed Internet setting. When memory size and computingcapabilities of mobile handsets are increased, the demand for multimedia services(including music and video download) will likely drive the demand for higher bit rates. Itis thus safe to assume that 4G communications solutions will offer much higher datarates than today’s 3G, at least in the range of 10-100 Mbs.
b/s
Basestation
reach
1G 2G 3G 4G
IR 802.11802.1
8/12/2019 Broadband 4G Costings Bohlin 2005
http://slidepdf.com/reader/full/broadband-4g-costings-bohlin-2005 6/26
2.7 Introduction of ad-hoc network capabilities
Although most people would say that today’s telecommunications solutions are efficient,at least in comparison with yesterdays, much development work remains in order tomake full use of the physical capabilities. Ad hoc mesh connections, creating multi-hoppaths enhance the cost efficiency of 4G over previous generations as less need to bespent on (SCF Associates Ltd., 2004):
Real estate and site leasing for base stations Obtaining planning permission costs due to delays in planning , getting sites’ permission, building and testing Costs for procuring, building, testing and integrating masts, network equipmentradiation shielding, and the backhaul network
The introduction of mesh networks, where network components function as routers, canbe compared with how the Internet replaced proprietary data communications solutionsin the 1970s and 1980s (see e.g. Lindmark et al. 2004). And just as fixed monthlypayment schemes have emerged as standard ways of charging for Internet access in afixed data communication setting, it is not unlikely that the mobile counterpart willexperience a similar development. Thus, again comparing with the fixed Internet, APs(and, depending on battery developments, perhaps even terminals) functioning asInternet routers is a probable development track in the next generation of mobilecommunications solutions.
Today, the IEEE has started work on projects for fast roaming and mesh applications inwireless local area networks (WLAN). The fast roaming project, IEEE 802.11r, will makeit easier to use real time interactive applications as wireless voice over IP (VoIP). Themesh project, IEEE 802.11s, will extend WLAN range by allowing data to pass throughwireless nodes in mesh networks in a router-like fashion (Kerry et al., 2004). As in thefixed Internet, adding nodes will become a scalable and redundant task (Wexler, 2004).
Although work on mesh networks have been carried out in university and company
research laboratories all over the world for a number of years, no single standard has.Even if the IEEE standardization is successful, further standardization efforts will beneeded if mesh networks across technology boundaries are to become realities.
2.8 Increased importance of software
In traditional telecommunications solutions, the frequencies and the protocols to usehave been integrated into the hardware. This means that the transceiver units cannot beadjusted to use multiple protocols and frequencies. The software defined radio (SDR)technology emerging puts more intelligence in the transceiver unit, making them able toswitch frequencies as required to reduce cost or avoid congestions (Forge, 2004). SDRtechnologies could have an important role in a 4G world, where multiple technologiesare believed to communicate and interact.
2.9 New pricing schemes
In the fixed Internet access market, attempts to charge consumers for their actual datausage have been largely unsuccessful. Instead, the dominant pricing scheme hasbecome charging for available bit rates, with low capacity fixed connections available ata low cost. In a European mobile telecom setting, pricing schemes are today migratingfrom per-minute charges based on time of the day (with business hours minute chargesbeing much higher than at night) to flat minute charges, independent of time of the day.
8/12/2019 Broadband 4G Costings Bohlin 2005
http://slidepdf.com/reader/full/broadband-4g-costings-bohlin-2005 7/26
If (or, rather, when) mobile data services become the predominant means for mobilehandset usage, the logical next step would be to introduce pricing plans similar to thoseseen in the fixed broadband Internet.
3 Business Models
3.1 Methodology
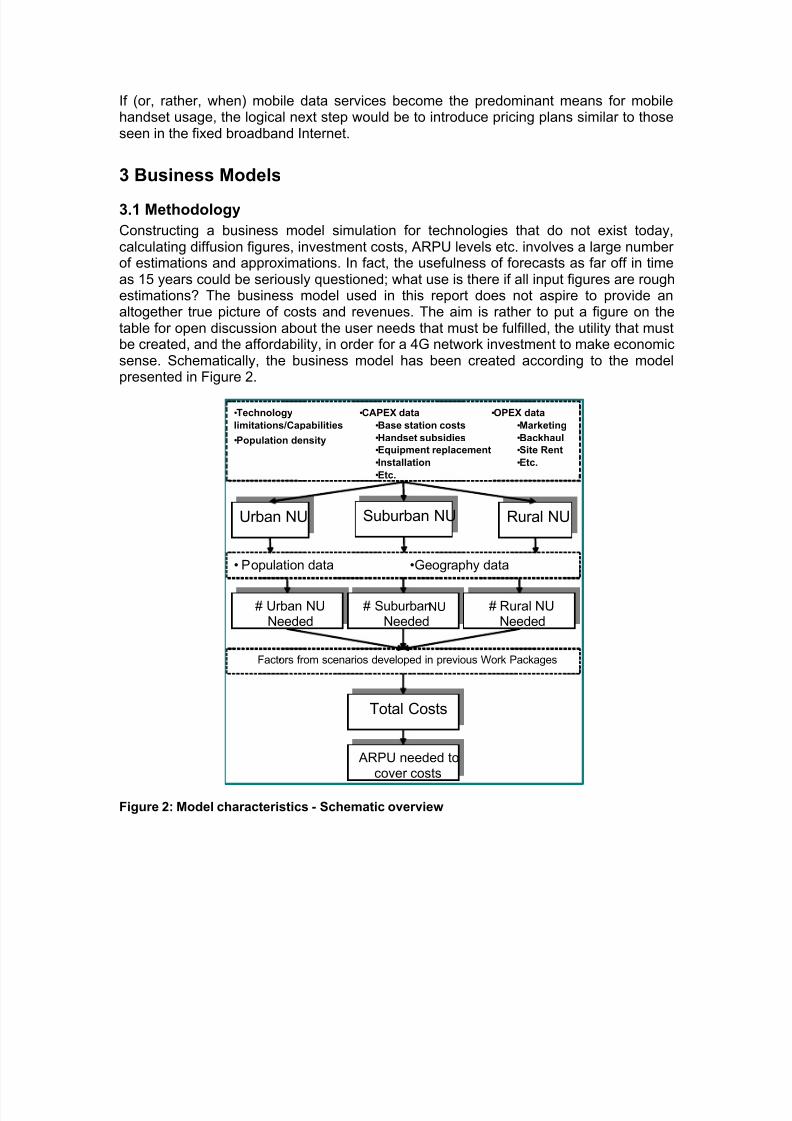
Constructing a business model simulation for technologies that do not exist today,calculating diffusion figures, investment costs, ARPU levels etc. involves a large numberof estimations and approximations. In fact, the usefulness of forecasts as far off in timeas 15 years could be seriously questioned; what use is there if all input figures are roughestimations? The business model used in this report does not aspire to provide analtogether true picture of costs and revenues. The aim is rather to put a figure on thetable for open discussion about the user needs that must be fulfilled, the utility that mustbe created, and the affordability, in order for a 4G network investment to make economicsense. Schematically, the business model has been created according to the modelpresented in Figure 2.
Figure 2: Model characteristics - Schematic overview
Urban NU Suburban NU Rural NU
# Urban NUNeeded
# SuburbanNU
Needed# Rural NU
Needed
Total Costs
• Population data •Geography data
ARPU needed tocover costs
•Factors from scenarios developed in previous Work Packages
•Technology
limitations/Capabilities
•Population density
•OPEX data
•Marketing
•Backhaul
•Site Rent
•Etc.
•CAPEX data
•Base station costs
•Handset subsidies
•Equipment replacement
•Installation
•Etc.
8/12/2019 Broadband 4G Costings Bohlin 2005
http://slidepdf.com/reader/full/broadband-4g-costings-bohlin-2005 8/26
In order to generate useful results from financial simulations, a number of conditionsmust be fulfilled. Firstly, proper definitions of the technological world must beestablished, including a basic notion of the network structure to be implemented.Secondly, cost elements of future technologies and components must be analyticallyestimated. Thirdly, estimations of revenue levels, far off in the future, must be made.
And, finally, a geographically defined market, virtual or real, must be constructed. All
these elements will be introduced below.
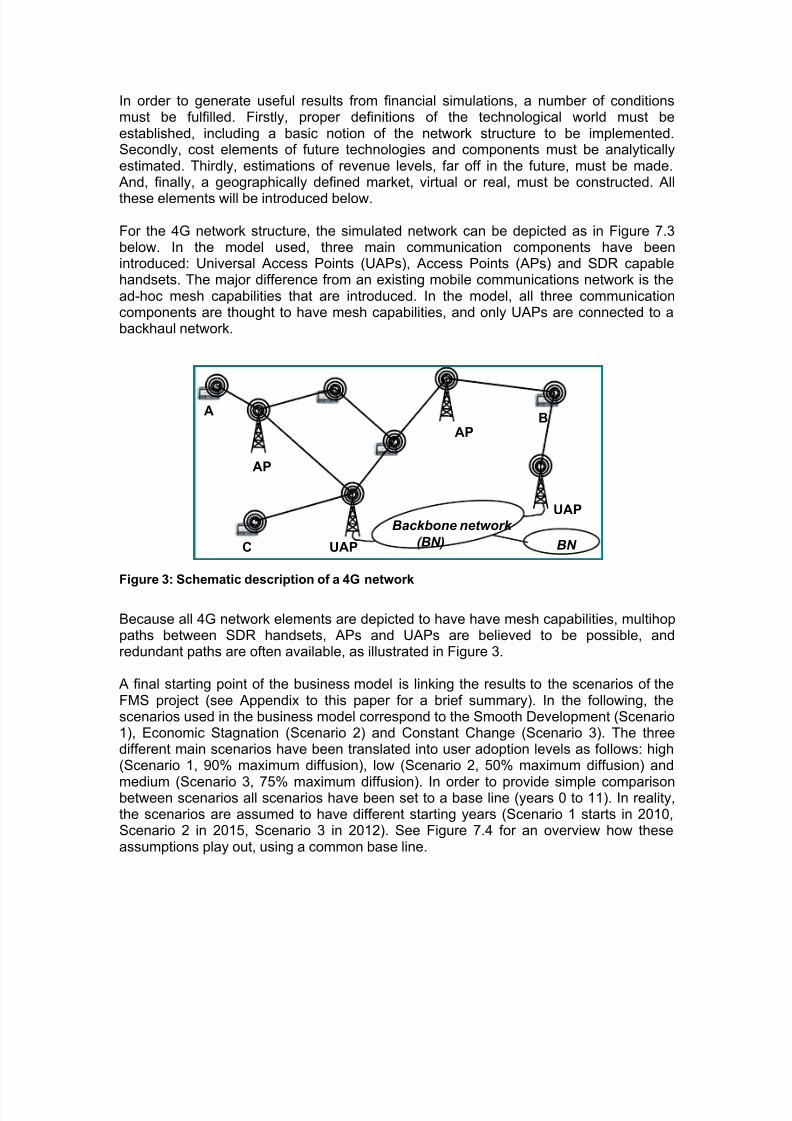
For the 4G network structure, the simulated network can be depicted as in Figure 7.3below. In the model used, three main communication components have beenintroduced: Universal Access Points (UAPs), Access Points (APs) and SDR capablehandsets. The major difference from an existing mobile communications network is thead-hoc mesh capabilities that are introduced. In the model, all three communicationcomponents are thought to have mesh capabilities, and only UAPs are connected to abackhaul network.
Figure 3: Schematic description of a 4G network
Because all 4G network elements are depicted to have have mesh capabilities, multihoppaths between SDR handsets, APs and UAPs are believed to be possible, andredundant paths are often available, as illustrated in Figure 3.
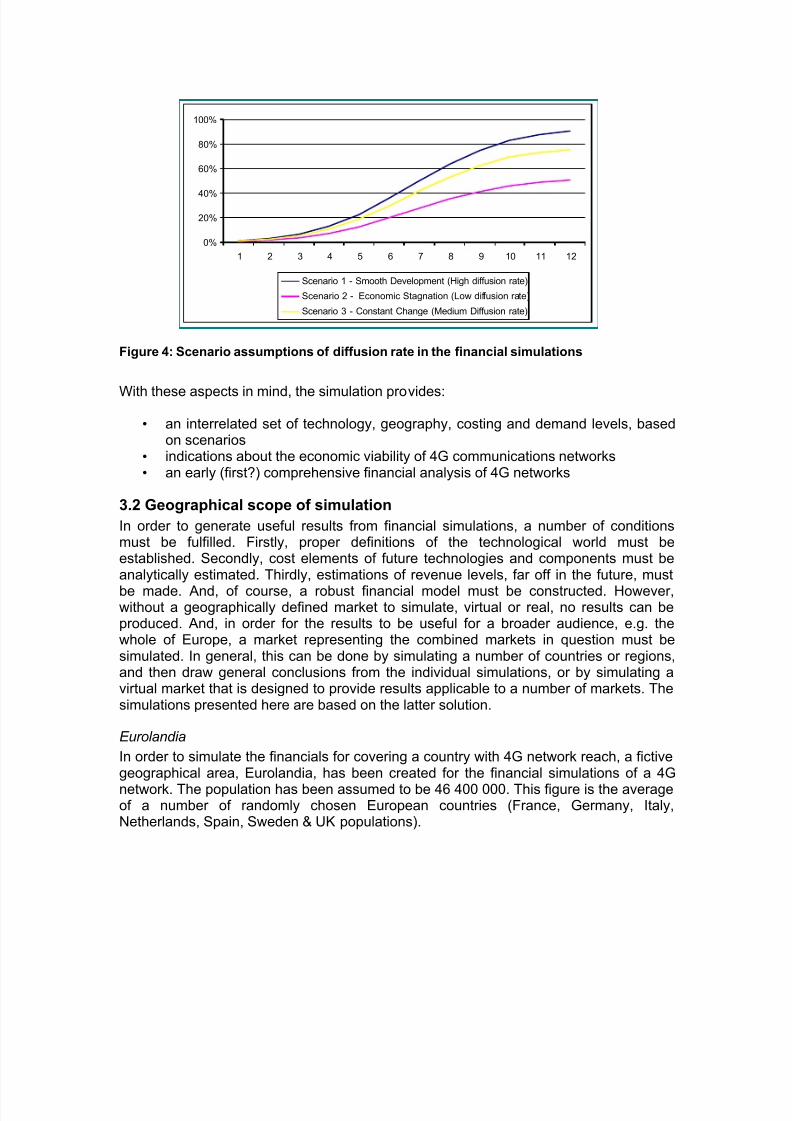
A final starting point of the business model is linking the results to the scenarios of theFMS project (see Appendix to this paper for a brief summary). In the following, thescenarios used in the business model correspond to the Smooth Development (Scenario1), Economic Stagnation (Scenario 2) and Constant Change (Scenario 3). The threedifferent main scenarios have been translated into user adoption levels as follows: high(Scenario 1, 90% maximum diffusion), low (Scenario 2, 50% maximum diffusion) and
medium (Scenario 3, 75% maximum diffusion). In order to provide simple comparisonbetween scenarios all scenarios have been set to a base line (years 0 to 11). In reality,the scenarios are assumed to have different starting years (Scenario 1 starts in 2010,Scenario 2 in 2015, Scenario 3 in 2012). See Figure 7.4 for an overview how theseassumptions play out, using a common base line.
AB
C
AP
AP
UAP
UAP
Backbone network
(BN) BN
8/12/2019 Broadband 4G Costings Bohlin 2005
http://slidepdf.com/reader/full/broadband-4g-costings-bohlin-2005 9/26
Figure 4: Scenario assumptions of diffusion rate in the financial simulations
With these aspects in mind, the simulation provides:
• an interrelated set of technology, geography, costing and demand levels, basedon scenarios
• indications about the economic viability of 4G communications networks• an early (first?) comprehensive financial analysis of 4G networks
3.2 Geographical scope of simulation
In order to generate useful results from financial simulations, a number of conditionsmust be fulfilled. Firstly, proper definitions of the technological world must beestablished. Secondly, cost elements of future technologies and components must beanalytically estimated. Thirdly, estimations of revenue levels, far off in the future, must
be made. And, of course, a robust financial model must be constructed. However,without a geographically defined market to simulate, virtual or real, no results can beproduced. And, in order for the results to be useful for a broader audience, e.g. thewhole of Europe, a market representing the combined markets in question must besimulated. In general, this can be done by simulating a number of countries or regions,and then draw general conclusions from the individual simulations, or by simulating avirtual market that is designed to provide results applicable to a number of markets. Thesimulations presented here are based on the latter solution.
Eurolandia
In order to simulate the financials for covering a country with 4G network reach, a fictivegeographical area, Eurolandia, has been created for the financial simulations of a 4G
network. The population has been assumed to be 46 400 000. This figure is the averageof a number of randomly chosen European countries (France, Germany, Italy,Netherlands, Spain, Sweden & UK populations).
0%
20%
40%
60%
80%
100%
1 2 3 4 5 6 7 8 9 10 11 12
Scenario 1 - Smooth Development (High diffusion rate)
Scenario 2 - Economic Stagnation (Low diffusion rate)
Scenario 3 - Constant Change (Medium Diffusion rate)
8/12/2019 Broadband 4G Costings Bohlin 2005
http://slidepdf.com/reader/full/broadband-4g-costings-bohlin-2005 10/26
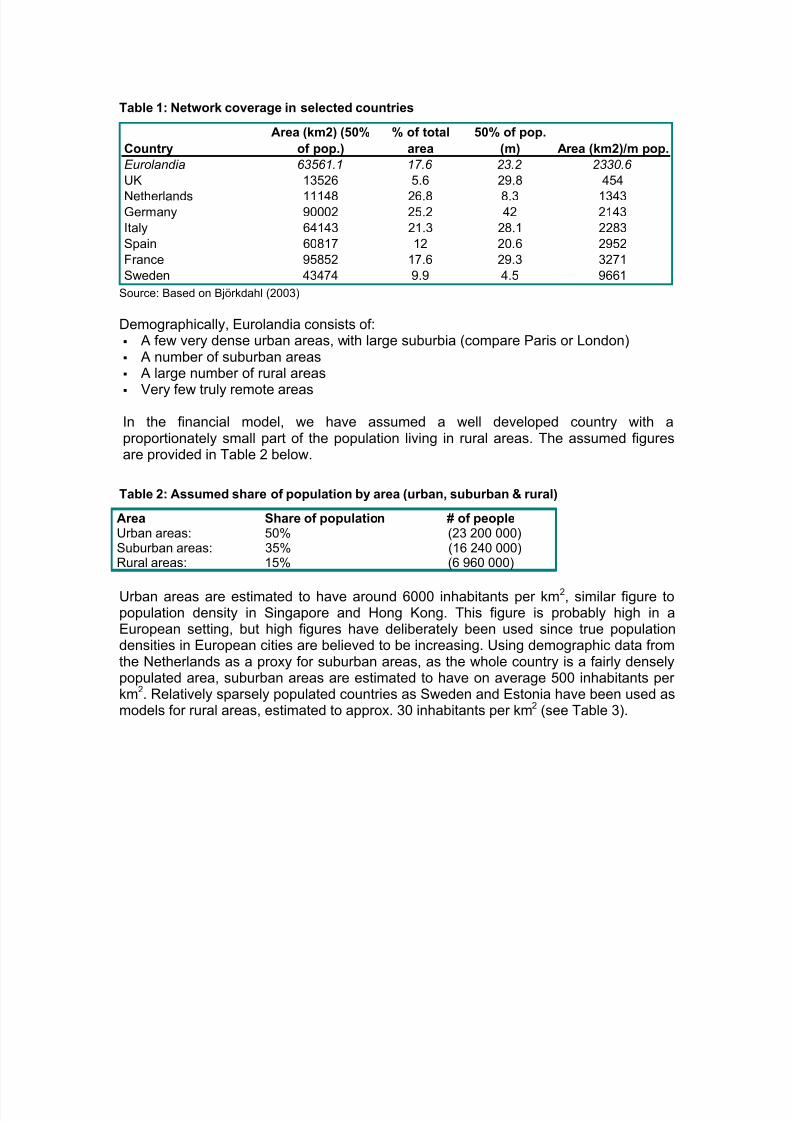
Table 1: Network coverage in selected countries
Country
Area (km2) (50%
of pop.)
% of total
area
50% of pop.
(m) Area (km2)/m pop.
Eurolandia 63561.1 17.6 23.2 2330.6
UK 13526 5.6 29.8 454
Netherlands 11148 26.8 8.3 1343Germany 90002 25.2 42 2143
Italy 64143 21.3 28.1 2283
Spain 60817 12 20.6 2952
France 95852 17.6 29.3 3271
Sweden 43474 9.9 4.5 9661 Source: Based on Björkdahl (2003)
Demographically, Eurolandia consists of: A few very dense urban areas, with large suburbia (compare Paris or London) A number of suburban areas A large number of rural areas
Very few truly remote areas
In the financial model, we have assumed a well developed country with aproportionately small part of the population living in rural areas. The assumed figuresare provided in Table 2 below.
Table 2: Assumed share of population by area (urban, suburban & rural)
Area Share of population # of peopleUrban areas: 50% (23 200 000)Suburban areas: 35% (16 240 000)Rural areas: 15% (6 960 000)
Urban areas are estimated to have around 6000 inhabitants per km2, similar figure topopulation density in Singapore and Hong Kong. This figure is probably high in aEuropean setting, but high figures have deliberately been used since true populationdensities in European cities are believed to be increasing. Using demographic data fromthe Netherlands as a proxy for suburban areas, as the whole country is a fairly denselypopulated area, suburban areas are estimated to have on average 500 inhabitants perkm2. Relatively sparsely populated countries as Sweden and Estonia have been used asmodels for rural areas, estimated to approx. 30 inhabitants per km2 (see Table 3).
8/12/2019 Broadband 4G Costings Bohlin 2005
http://slidepdf.com/reader/full/broadband-4g-costings-bohlin-2005 11/26
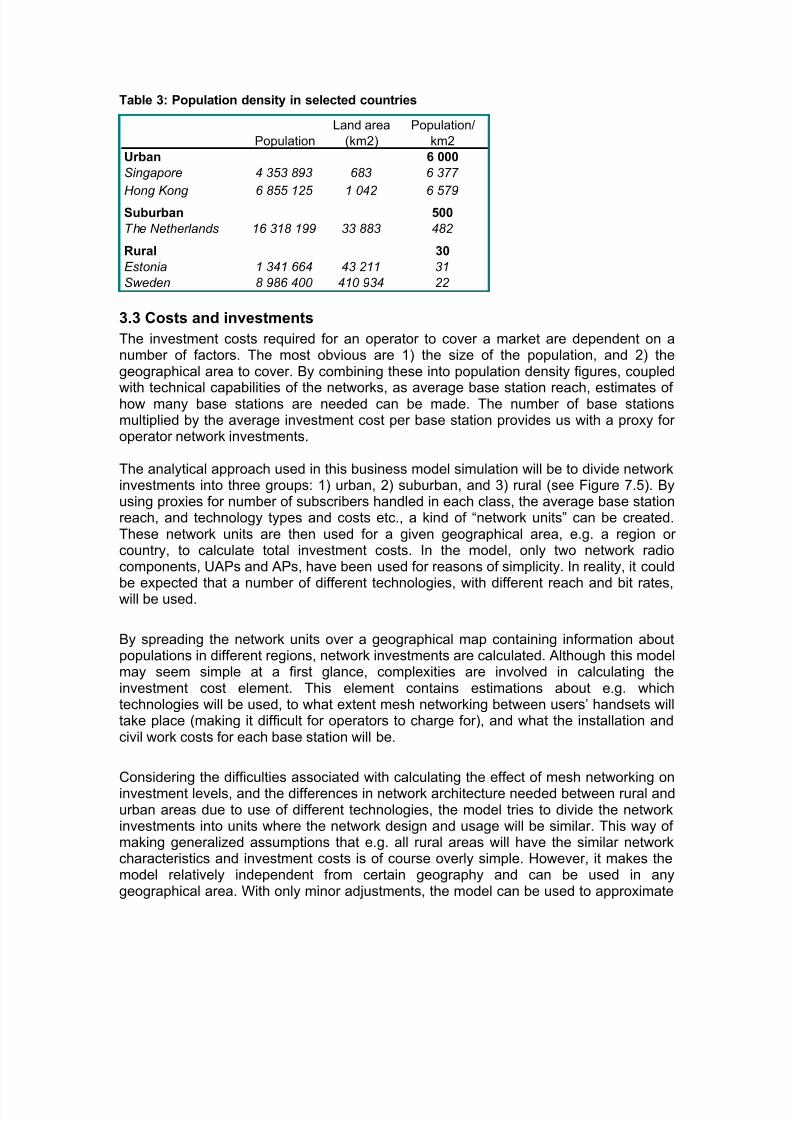
Table 3: Population density in selected countries
Population
Land area
(km2)
Population/
km2
Urban 6 000
Singapore 4 353 893 683 6 377
Hong Kong 6 855 125 1 042 6 579Suburban 500
The Netherlands 16 318 199 33 883 482
Rural 30
Estonia 1 341 664 43 211 31
Sweden 8 986 400 410 934 22
3.3 Costs and investments
The investment costs required for an operator to cover a market are dependent on anumber of factors. The most obvious are 1) the size of the population, and 2) thegeographical area to cover. By combining these into population density figures, coupled
with technical capabilities of the networks, as average base station reach, estimates ofhow many base stations are needed can be made. The number of base stationsmultiplied by the average investment cost per base station provides us with a proxy foroperator network investments.
The analytical approach used in this business model simulation will be to divide networkinvestments into three groups: 1) urban, 2) suburban, and 3) rural (see Figure 7.5). Byusing proxies for number of subscribers handled in each class, the average base stationreach, and technology types and costs etc., a kind of “network units” can be created.These network units are then used for a given geographical area, e.g. a region orcountry, to calculate total investment costs. In the model, only two network radiocomponents, UAPs and APs, have been used for reasons of simplicity. In reality, it could
be expected that a number of different technologies, with different reach and bit rates,will be used.
By spreading the network units over a geographical map containing information aboutpopulations in different regions, network investments are calculated. Although this modelmay seem simple at a first glance, complexities are involved in calculating theinvestment cost element. This element contains estimations about e.g. whichtechnologies will be used, to what extent mesh networking between users’ handsets willtake place (making it difficult for operators to charge for), and what the installation andcivil work costs for each base station will be.
Considering the difficulties associated with calculating the effect of mesh networking oninvestment levels, and the differences in network architecture needed between rural andurban areas due to use of different technologies, the model tries to divide the networkinvestments into units where the network design and usage will be similar. This way ofmaking generalized assumptions that e.g. all rural areas will have the similar networkcharacteristics and investment costs is of course overly simple. However, it makes themodel relatively independent from certain geography and can be used in anygeographical area. With only minor adjustments, the model can be used to approximate
8/12/2019 Broadband 4G Costings Bohlin 2005
http://slidepdf.com/reader/full/broadband-4g-costings-bohlin-2005 12/26
network investments costs for e.g. any European national network by placing networkunits like a puzzle over the geography until the whole area is covered.
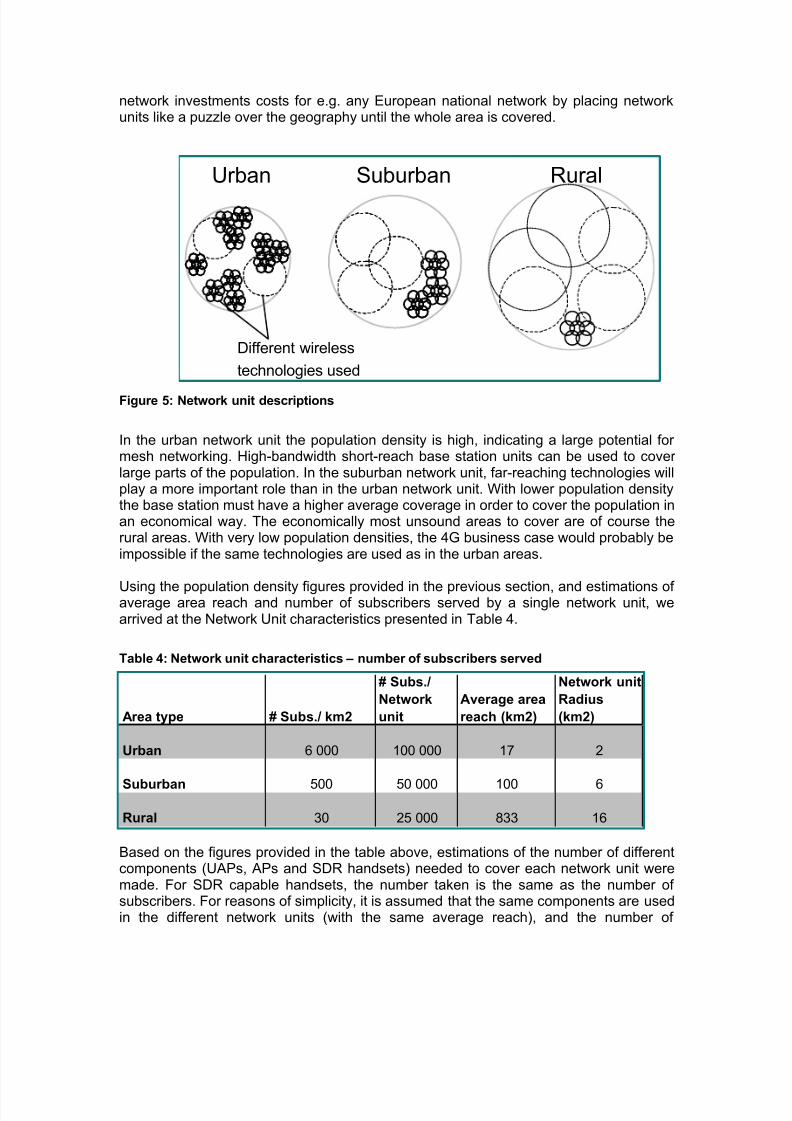
Figure 5: Network unit descriptions
In the urban network unit the population density is high, indicating a large potential formesh networking. High-bandwidth short-reach base station units can be used to coverlarge parts of the population. In the suburban network unit, far-reaching technologies willplay a more important role than in the urban network unit. With lower population densitythe base station must have a higher average coverage in order to cover the population inan economical way. The economically most unsound areas to cover are of course therural areas. With very low population densities, the 4G business case would probably beimpossible if the same technologies are used as in the urban areas.
Using the population density figures provided in the previous section, and estimations ofaverage area reach and number of subscribers served by a single network unit, wearrived at the Network Unit characteristics presented in Table 4.
Table 4: Network unit characteristics – number of subscribers served
Based on the figures provided in the table above, estimations of the number of differentcomponents (UAPs, APs and SDR handsets) needed to cover each network unit weremade. For SDR capable handsets, the number taken is the same as the number ofsubscribers. For reasons of simplicity, it is assumed that the same components are usedin the different network units (with the same average reach), and the number of
Area type # Subs./ km2
# Subs./
Network
unit
Average area
reach (km2)
Network unit
Radius
(km2)
Urban 6 000 100 000 17 2
Suburban 500 50 000 100 6
Rural 30 25 000 833 16
Urban Suburban Rural
Different wireless
technologies used
8/12/2019 Broadband 4G Costings Bohlin 2005
http://slidepdf.com/reader/full/broadband-4g-costings-bohlin-2005 13/26
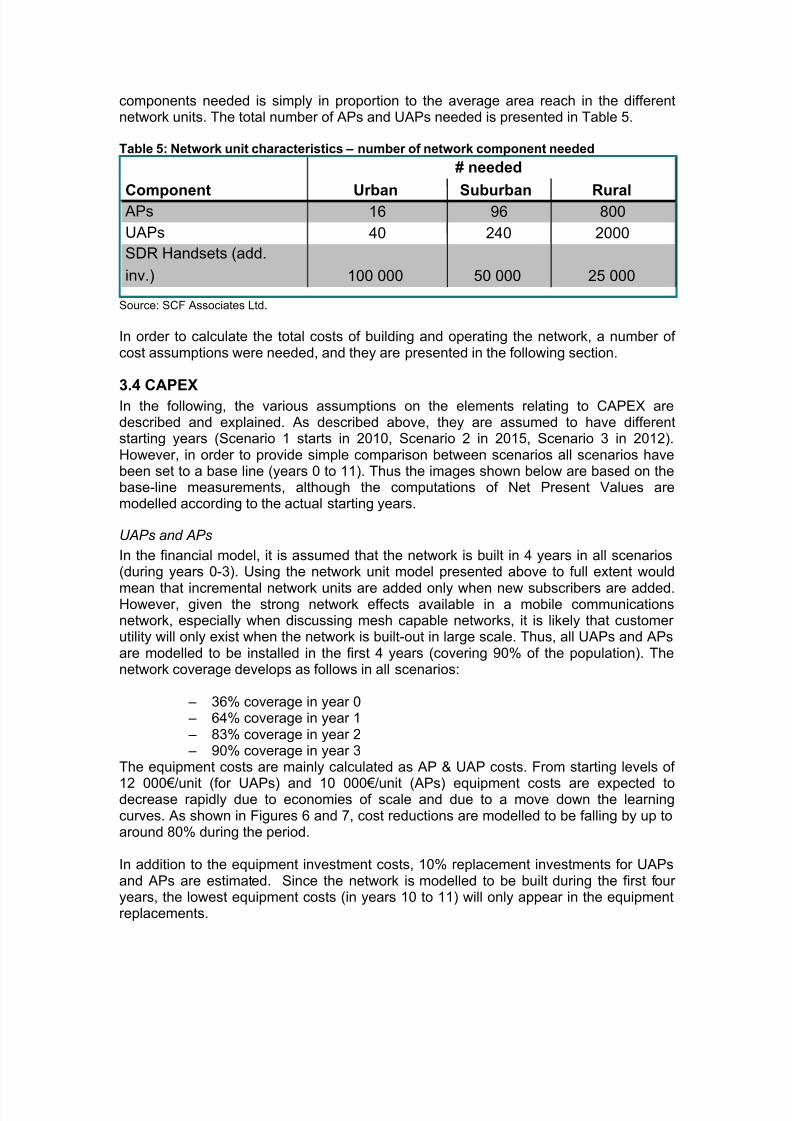
components needed is simply in proportion to the average area reach in the differentnetwork units. The total number of APs and UAPs needed is presented in Table 5.
Table 5: Network unit characteristics – number of network component needed
Source: SCF Associates Ltd.
In order to calculate the total costs of building and operating the network, a number ofcost assumptions were needed, and they are presented in the following section.
3.4 CAPEXIn the following, the various assumptions on the elements relating to CAPEX aredescribed and explained. As described above, they are assumed to have differentstarting years (Scenario 1 starts in 2010, Scenario 2 in 2015, Scenario 3 in 2012).However, in order to provide simple comparison between scenarios all scenarios havebeen set to a base line (years 0 to 11). Thus the images shown below are based on thebase-line measurements, although the computations of Net Present Values aremodelled according to the actual starting years.
UAPs and APs
In the financial model, it is assumed that the network is built in 4 years in all scenarios(during years 0-3). Using the network unit model presented above to full extent would
mean that incremental network units are added only when new subscribers are added.However, given the strong network effects available in a mobile communicationsnetwork, especially when discussing mesh capable networks, it is likely that customerutility will only exist when the network is built-out in large scale. Thus, all UAPs and APsare modelled to be installed in the first 4 years (covering 90% of the population). Thenetwork coverage develops as follows in all scenarios:
– 36% coverage in year 0 – 64% coverage in year 1 – 83% coverage in year 2 – 90% coverage in year 3
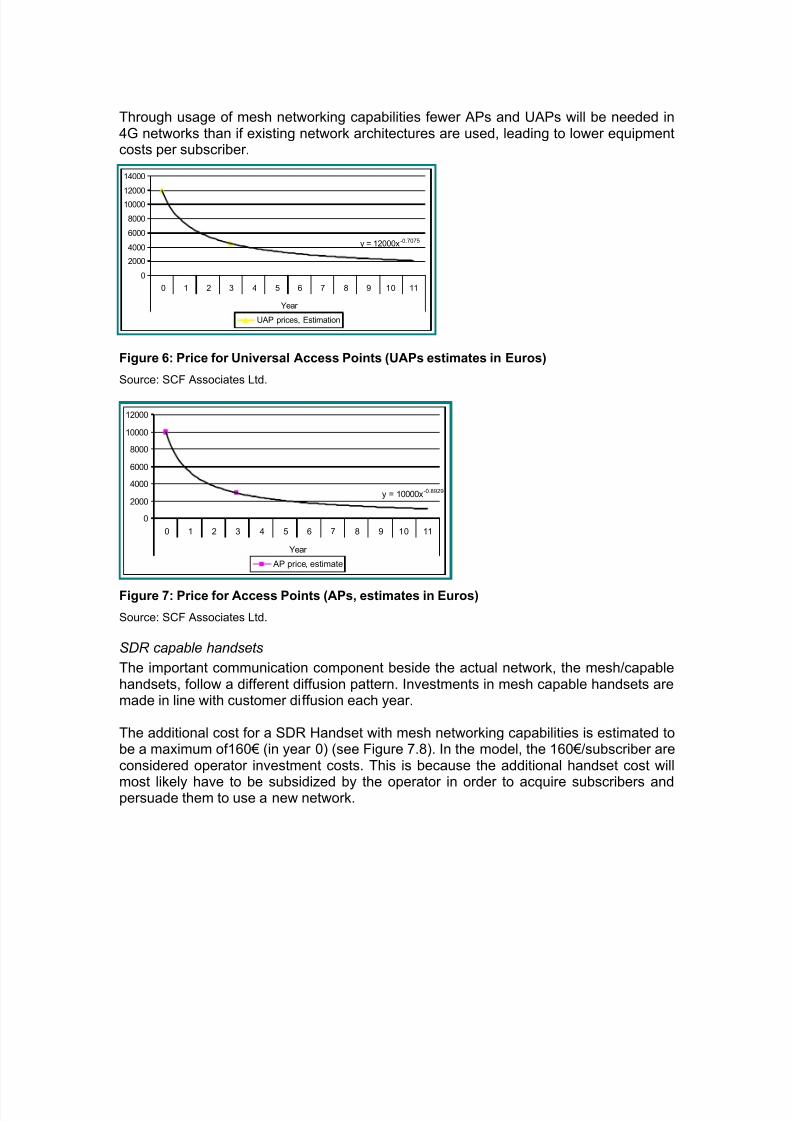
The equipment costs are mainly calculated as AP & UAP costs. From starting levels of
12 000€/unit (for UAPs) and 10 000€/unit (APs) equipment costs are expected todecrease rapidly due to economies of scale and due to a move down the learningcurves. As shown in Figures 6 and 7, cost reductions are modelled to be falling by up toaround 80% during the period.
In addition to the equipment investment costs, 10% replacement investments for UAPsand APs are estimated. Since the network is modelled to be built during the first fouryears, the lowest equipment costs (in years 10 to 11) will only appear in the equipmentreplacements.
Component Urban Suburban Rural APs 16 96 800
UAPs 40 240 2000
SDR Handsets (add.
inv.) 100 000 50 000 25 000
# needed
8/12/2019 Broadband 4G Costings Bohlin 2005
http://slidepdf.com/reader/full/broadband-4g-costings-bohlin-2005 14/26
Through usage of mesh networking capabilities fewer APs and UAPs will be needed in4G networks than if existing network architectures are used, leading to lower equipmentcosts per subscriber.
Figure 6: Price for Universal Access Points (UAPs estimates in Euros)
Source: SCF Associates Ltd.
y = 10000x-0.8929
0
2000
4000
6000
8000
10000
12000
0 1 2 3 4 5 6 7 8 9 10 11
Year
AP price, estimate
Figure 7: Price for Access Points (APs, estimates in Euros)
Source: SCF Associates Ltd.
SDR capable handsets
The important communication component beside the actual network, the mesh/capablehandsets, follow a different diffusion pattern. Investments in mesh capable handsets aremade in line with customer diffusion each year.
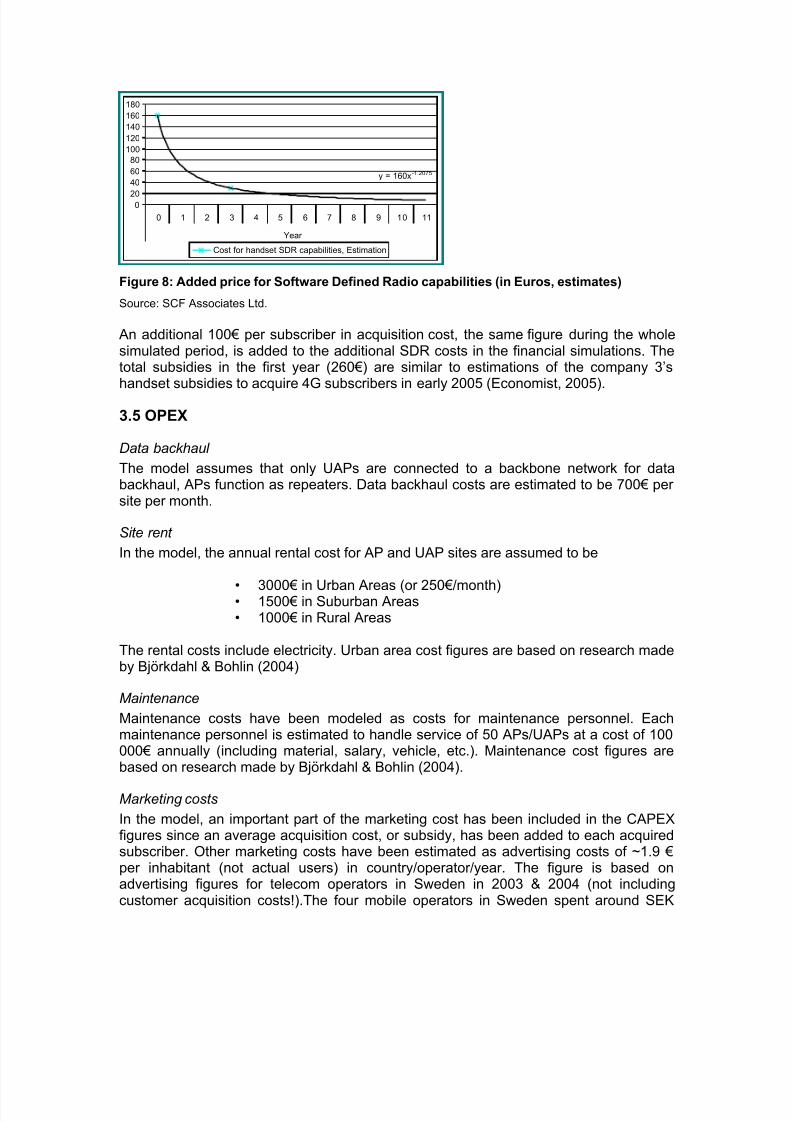
The additional cost for a SDR Handset with mesh networking capabilities is estimated tobe a maximum of160€ (in year 0) (see Figure 7.8). In the model, the 160€/subscriber areconsidered operator investment costs. This is because the additional handset cost will
most likely have to be subsidized by the operator in order to acquire subscribers andpersuade them to use a new network.
y = 12000x-0.7075
0
2000
4000
6000
8000
10000
12000
14000
0 1 2 3 4 5 6 7 8 9 10 11
Year
UAP prices, Estimation
8/12/2019 Broadband 4G Costings Bohlin 2005
http://slidepdf.com/reader/full/broadband-4g-costings-bohlin-2005 15/26
y = 160x-1.2075
020
40
60
80
100
120
140
160
180
0 1 2 3 4 5 6 7 8 9 10 11
Year
Cost for handset SDR capabilities, Estimation
Figure 8: Added price for Software Defined Radio capabilities (in Euros, estimates)
Source: SCF Associates Ltd.
An additional 100€ per subscriber in acquisition cost, the same figure during the wholesimulated period, is added to the additional SDR costs in the financial simulations. Thetotal subsidies in the first year (260€) are similar to estimations of the company 3’shandset subsidies to acquire 4G subscribers in early 2005 (Economist, 2005).
3.5 OPEX
Data backhaul
The model assumes that only UAPs are connected to a backbone network for databackhaul, APs function as repeaters. Data backhaul costs are estimated to be 700€ persite per month.
Site rent
In the model, the annual rental cost for AP and UAP sites are assumed to be
• 3000€ in Urban Areas (or 250€/month)• 1500€ in Suburban Areas• 1000€ in Rural Areas
The rental costs include electricity. Urban area cost figures are based on research madeby Björkdahl & Bohlin (2004)
Maintenance
Maintenance costs have been modeled as costs for maintenance personnel. Eachmaintenance personnel is estimated to handle service of 50 APs/UAPs at a cost of 100000€ annually (including material, salary, vehicle, etc.). Maintenance cost figures arebased on research made by Björkdahl & Bohlin (2004).
Marketing costs
In the model, an important part of the marketing cost has been included in the CAPEXfigures since an average acquisition cost, or subsidy, has been added to each acquiredsubscriber. Other marketing costs have been estimated as advertising costs of ~1.9 €per inhabitant (not actual users) in country/operator/year. The figure is based onadvertising figures for telecom operators in Sweden in 2003 & 2004 (not includingcustomer acquisition costs!).The four mobile operators in Sweden spent around SEK
8/12/2019 Broadband 4G Costings Bohlin 2005
http://slidepdf.com/reader/full/broadband-4g-costings-bohlin-2005 16/26
300 million (~33.5 M€) on marketing the first 6 months 2004.3 Since 3G telephony waslaunched by most operators during this period, we use this figure as a proxy formarketing costs during service launch. We calculate that SEK 600 million (~67 M€) willbe invested in marketing during 12 months (300*2) to cover a population of 9 millionpeople, equivalent to SEK 67 / person and year (~€ 7.4). With four operators, this wouldtranslate into 7.4/4 = 1.85 € / person / operator.
Administrative costs
The administrative costs have been estimated as an addition of 10% on otheroperational costs. The low-cost telecom company Tele2 is used as a benchmark. Tele2had administrative expenses equivalent to 10% of other costs in 2003 and 9% in 2002(according to annual income statements).3.6 Minimum ARPU levels needed
The output of the business modelling activity is minimum ARPU levels needed recoupinvestments (CAPEX) and cover operational costs (OPEX). ARPU levels needed arethus defined as CAPEX+OPEX in each year, discounted to year 0 and the annualizedover the whole period. The formulas used are:
4 ResultsThree different main scenarios have been simulated, as mentioned in previous sections.
In this section the results are presented, followed by a sensitivity analysis.
4.1 CAPEX
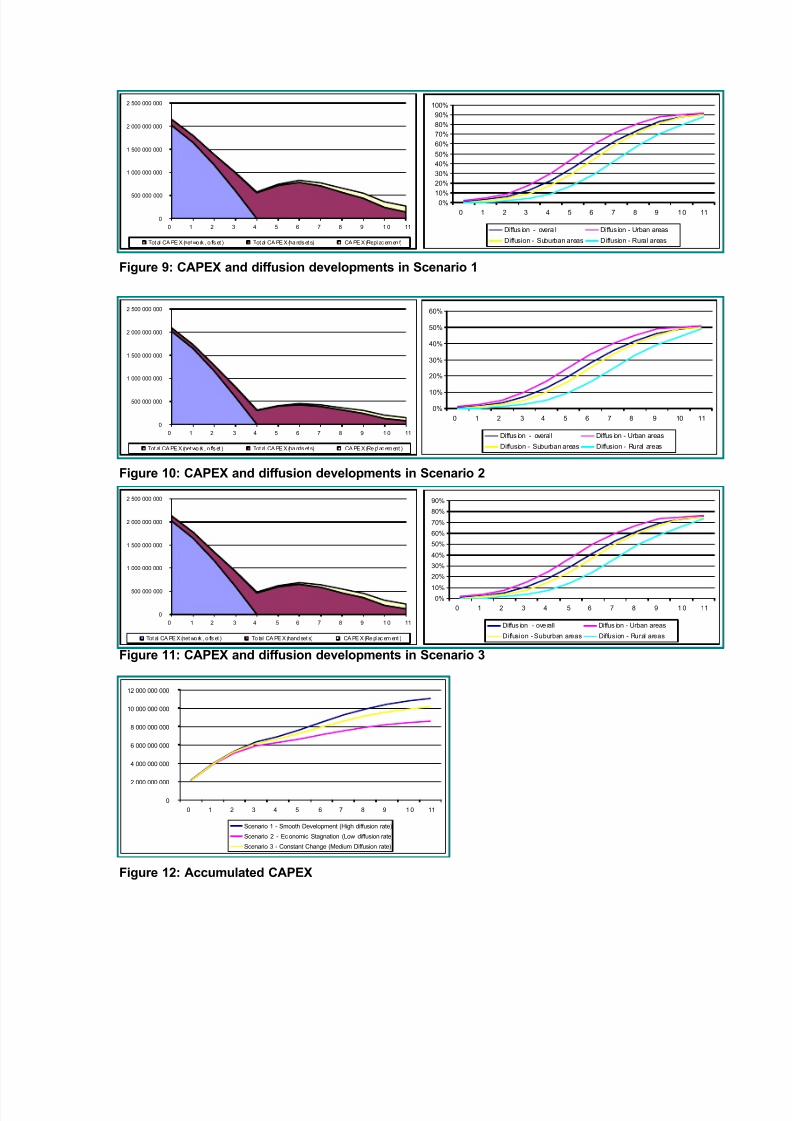
In each scenario, the diffusion in urban areas has been modelled to be a bit more rapidthan in suburban or rural areas. The maximum overall diffusion levels are reached inyears 10 to 11 in each scenario. The highest numbers of users are added in the middleof the period (years 5 to 7). The CAPEX curves are very similar in the three scenarios,as seen in Figure 9 to Figure 11. The early years are dominated by CAPEX for UAPsand APs. In the middle of the period SDR handset CAPEX is most significant, andreplacement costs are only significant late in periods. The accumulated CAPEX figuresare similar for the three scenarios in the early years due to same network build-outpaces. From year 4, when SDR handset costs are increasing in importance, the total
CAPEX curves start to differ somewhat, as seen in Figure 12. The total CAPEX isnaturally highest in Scenario 1 and lowest in Scenario 2 due to the total diffusion levels.
3 Leijonhufvud, Jonas (2004) ”Att synas allt viktigare”, Svenska Dagbladet 2004-08-04
Annuity (A). Yearly instalment on aloan c, paid during t years by equalamounts, at rate of interest p
Net Present Value (NPV). The capitalc falls due in t years at rate of interest
11
1001001
−
+
⋅
+
⋅=t
t
p
p p
c A
t p
c NPV
+
=
1001
8/12/2019 Broadband 4G Costings Bohlin 2005
http://slidepdf.com/reader/full/broadband-4g-costings-bohlin-2005 17/26
Figure 9: CAPEX and diffusion developments in Scenario 1
Figure 10: CAPEX and diffusion developments in Scenario 2
Figure 11: CAPEX and diffusion developments in Scenario 3
Figure 12: Accumulated CAPEX
0
500 000 000
1 000 000 000
1 500 000 000
2 000 000 000
2 500 000 000
0 1 2 3 4 5 6 7 8 9 1 0 11
Tot al CA PE X (net wo rk , o ffs et ) Tot al CA PE X (ha nds et s) CA PE X (Re pl ac ement )
0%
10%
20%
30%
40%
50%
60%
0 1 2 3 4 5 6 7 8 9 10 11
Diffus ion - overall Diffus ion - Urban areas
Diffusion - Suburban areas Diffusion - Rural areas
0
2 000 000 000
4 000 000 000
6 000 000 000
8 000 000 000
10 000 000 000
12 000 000 000
0 1 2 3 4 5 6 7 8 9 1 0 11
Scenario 1 - Smooth Development (High diffusion rate)
Scenario 2 - Economic Stagnation (Low diffusion rate)
Scenario 3 - Constant Change (Medium Diffusion rate)
0
500 000 000
1 000 000 000
1 500 000 000
2 000 000 000
2 500 000 000
0 1 2 3 4 5 6 7 8 9 1 0 11
Tot al CA PE X (net wo rk , o ffs et ) Tot al CA PE X (ha nds et s) CA PE X (Repl ac emen t)
0%10%
20%
30%
40%
50%
60%
70%
80%
90%
100%
0 1 2 3 4 5 6 7 8 9 10 11
Diffus ion - overall Diffus ion - Urban areas
Diffusion - Suburban areas Diffusion - Rural areas
0
500 000 000
1 000 000 000
1 500 000 000
2 000 000 000
2 500 000 000
0 1 2 3 4 5 6 7 8 9 1 0 11
Tot al CA PE X (net wo rk , o ffs et ) To tal CA PE X (hand set s) CA PE X (Re pl ac ement )
0%10%
20%
30%
40%
50%
60%
70%
80%
90%
0 1 2 3 4 5 6 7 8 9 1 0 11
Diffus ion - ove rall Diffus ion - Urban areas
Diffusion - Suburban areas Diffusion - Rural areas
8/12/2019 Broadband 4G Costings Bohlin 2005
http://slidepdf.com/reader/full/broadband-4g-costings-bohlin-2005 18/26
8/12/2019 Broadband 4G Costings Bohlin 2005
http://slidepdf.com/reader/full/broadband-4g-costings-bohlin-2005 19/26
4.4 Sensitivity analysis
In order to evaluate the impact of the assumptions made, some parameters have beenchanged in sensitivity analyses conducted on the three base scenarios. In the firstanalysis, the equipment cost curves have been altered. In the second analysis theimpact of an added licence fee has been evaluated
Changed equipment costs
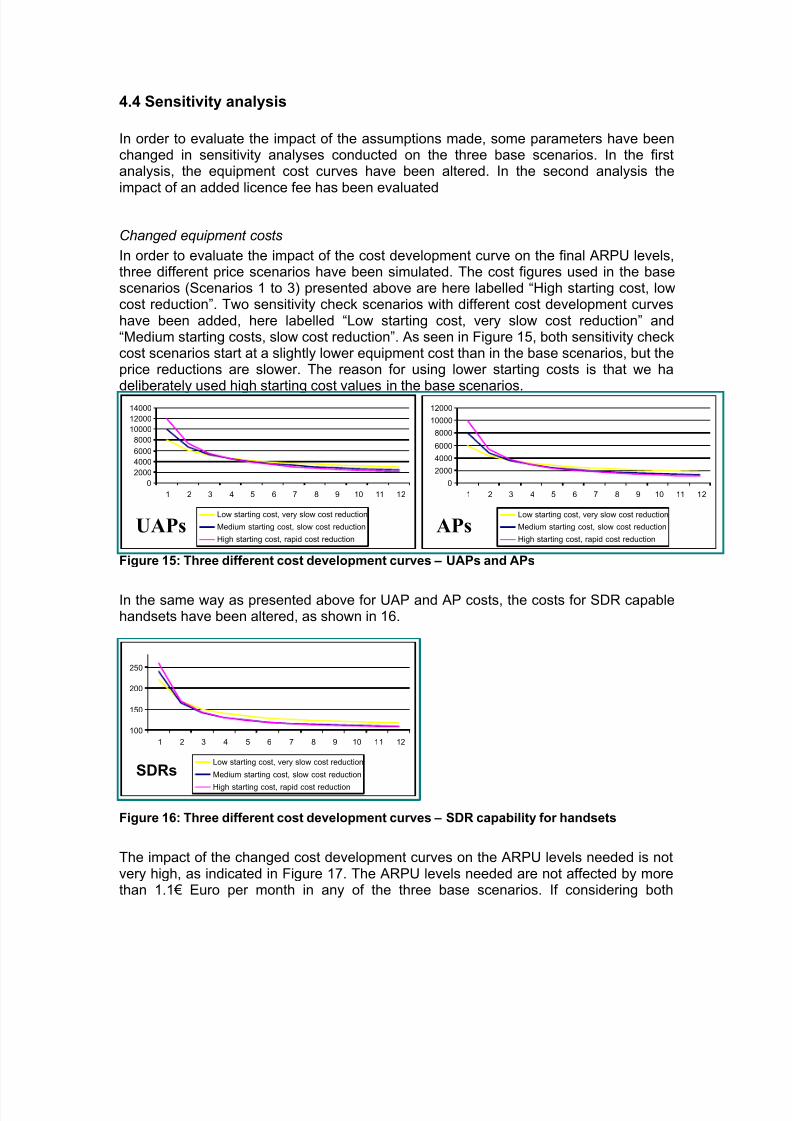
In order to evaluate the impact of the cost development curve on the final ARPU levels,three different price scenarios have been simulated. The cost figures used in the basescenarios (Scenarios 1 to 3) presented above are here labelled “High starting cost, lowcost reduction”. Two sensitivity check scenarios with different cost development curveshave been added, here labelled “Low starting cost, very slow cost reduction” and“Medium starting costs, slow cost reduction”. As seen in Figure 15, both sensitivity checkcost scenarios start at a slightly lower equipment cost than in the base scenarios, but theprice reductions are slower. The reason for using lower starting costs is that we ha
deliberately used high starting cost values in the base scenarios.
Figure 15: Three different cost development curves – UAPs and APs
In the same way as presented above for UAP and AP costs, the costs for SDR capablehandsets have been altered, as shown in 16.
Figure 16: Three different cost development curves – SDR capability for handsets
The impact of the changed cost development curves on the ARPU levels needed is notvery high, as indicated in Figure 17. The ARPU levels needed are not affected by morethan 1.1€ Euro per month in any of the three base scenarios. If considering both
0
2000
4000
6000
8000
10000
12000
14000
1 2 3 4 5 6 7 8 9 10 11 12
Low starting cost, very slow cost reduction
Medium starting cost, slow cost reduction
High starting cost, rapid cost reduction
0
2000
4000
6000
8000
10000
12000
1 2 3 4 5 6 7 8 9 10 11 12
Low starting cost, very slow cost reduction
Medium starting cost, slow cost reduction
High starting cost, rapid cost reduction
APsUAPs
100
150
200
250
1 2 3 4 5 6 7 8 9 10 11 12
Low starting cost, very slow cost reduction
Medium starting cost, slow cost reduction
High starting cost, rapid cost reduction
SDRs
8/12/2019 Broadband 4G Costings Bohlin 2005
http://slidepdf.com/reader/full/broadband-4g-costings-bohlin-2005 20/26
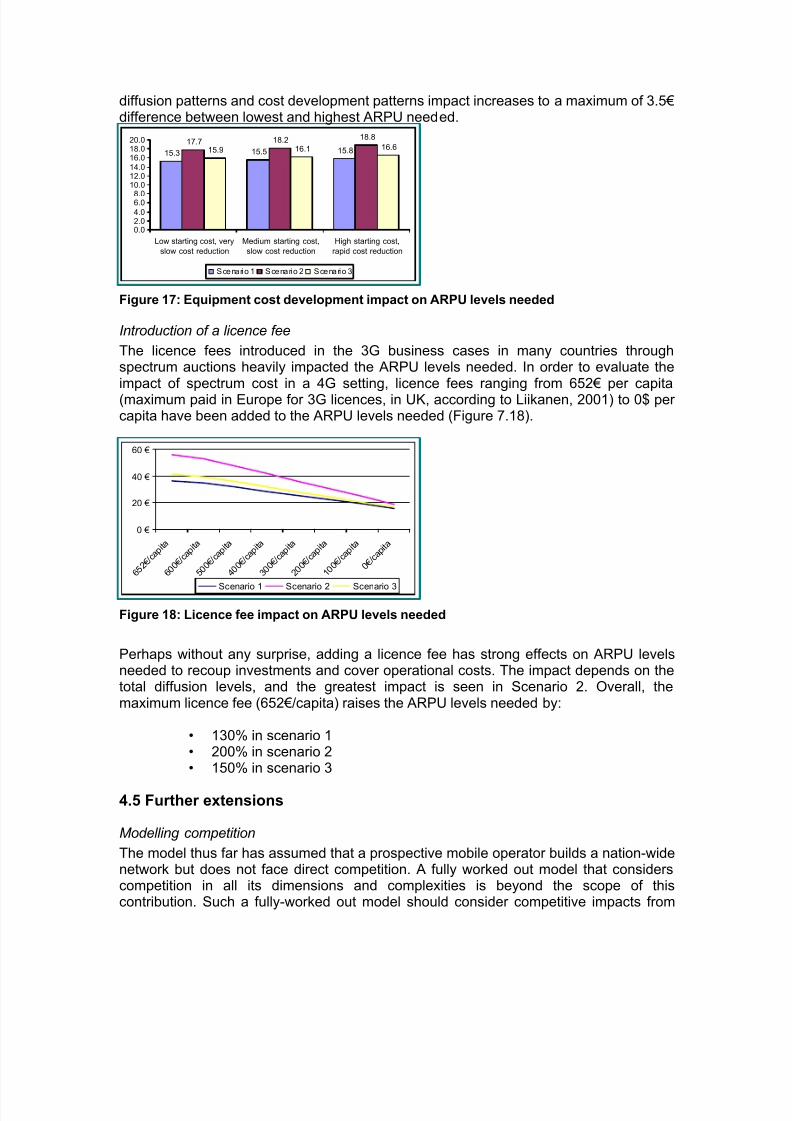
diffusion patterns and cost development patterns impact increases to a maximum of 3.5€difference between lowest and highest ARPU needed.
Figure 17: Equipment cost development impact on ARPU levels needed
Introduction of a licence fee
The licence fees introduced in the 3G business cases in many countries throughspectrum auctions heavily impacted the ARPU levels needed. In order to evaluate theimpact of spectrum cost in a 4G setting, licence fees ranging from 652€ per capita(maximum paid in Europe for 3G licences, in UK, according to Liikanen, 2001) to 0$ percapita have been added to the ARPU levels needed (Figure 7.18).
Figure 18: Licence fee impact on ARPU levels needed
Perhaps without any surprise, adding a licence fee has strong effects on ARPU levelsneeded to recoup investments and cover operational costs. The impact depends on thetotal diffusion levels, and the greatest impact is seen in Scenario 2. Overall, themaximum licence fee (652€/capita) raises the ARPU levels needed by:
• 130% in scenario 1• 200% in scenario 2• 150% in scenario 3
4.5 Further extensions
Modelling competition
The model thus far has assumed that a prospective mobile operator builds a nation-widenetwork but does not face direct competition. A fully worked out model that considerscompetition in all its dimensions and complexities is beyond the scope of thiscontribution. Such a fully-worked out model should consider competitive impacts from
15.3 15.5 15.817.7 18.2 18.8
15.9 16.1 16.6
0.02.04.0
6.08.0
10.012.014.0
16.018.020.0
Low starting cost, very
slow cost reduction
Medium starting cost,
slow cost reduction
High starting cost,
rapid cost reduction
Scenario 1 Scenario 2 Scenario 3
0 €
20 €
40 €
60 €
6 5 2 €
/ c a p i t a
6 0 0 €
/ c a p i t a
5 0 0 €
/ c a p i t a
4 0 0 €
/ c a p i t a
3 0 0 €
/ c a p i t a
2 0 0 €
/ c a p i t a
1 0 0 €
/ c a p i t a
0 € / c a p i t a
Scenario 1 Scenario 2 Scenario 3

8/12/2019 Broadband 4G Costings Bohlin 2005
http://slidepdf.com/reader/full/broadband-4g-costings-bohlin-2005 21/26
various substituting networks, have a view on pricing strategies, consumer demand andelasticises, and other strategic variables. A fully worked out model in such a vein shouldbuild on foundations of economics and game theory. However, a rudimentary way tomodel competitive impacts is to provide a sensitivity analysis with the followingassumptions:
• the prospective operators constructs a nation-wide network• due to competition, the market share is varied according to rough estimates such
as 25%, 50% and 75%, for all three scenarios.
With such a basic competition analysis, results will be obtained for the required ARPUlevels. It is likely that such market share development will have significant impact on therequired ARPU levels for the assumed network. This conclusion is already apparent inthe results from the basic three scenarios above. Note that the three scenariosthemselves can be considered variation in market share development, since the networkroll-out schemes are similar for the three scenarios. For instance, Scenario 2 has a 50%market penetration, corresponding to a 50% market share for a 100% uptake marketpotential, while Scenario 1 and 3 translates into 90% and 75% market share
respectively. Results in Figure 14 suggest that such market shares will in fact haveconsiderable impact on the minimum required ARPU. Reducing the market share furtherwill for each scenario have correspondingly larger impact on the break-even ARPU. Forinstance, assuming a 25% market share within the parameters of Scenario 2 unchangedwill raise the required ARPU considerably. Certainly, competition will also put adownward pressure on prices but on the other hand stimulate demand (depending onprice elasticity). Evaluating possible break-even ARPU scenarios with such a more finelycalibrated model is an interesting further extension of this contribution.
Modelling interconnect charges
A further extension is to explicitly model interconnection and roaming regimes and theirimpact on the required ARPU levels. Again, having a view of the impact of interconnect
and roaming impacts on ARPU requires a model of higher complexity. On the one hand,there is the possibility that regulatory regimes will change, including introduction of newcost calculation schemes for interconnect charges. On the other hand, the impacts of thecharges depend on the market share of the typical operator, and how the typicaloperator interfaces with the fixed network providers. If the operator in question has asignificant market share, the inflow of revenues relating to interconnect charges within itsmobile network is likely to be greater than the outflow of charges. Thus, interconnect canbecome a net gain. For the smaller players, the situation is reversed. Moreover, the gainvs. loss consequences will be impacted by the relationship between projected wirelessand fixed traffic. If the wireless network is highly dependent on the fixed networkoperator, or the opposite is obtained, the benefit/loss of interconnection charges to thetypical mobile operator will look correspondingly different. For the roaming, the net inflow
or outflow will depend on the attractiveness of the country in question with respect toroaming subscribers. It is well known that major business and policy meeting hubs, andmajor vacation regions will have a relatively higher positive inflow of roaming revenues.
Again, the estimation of roaming impacts will also have to reflect some perspective onregulatory or market developments. The roaming charges will be influenced by changedregulatory regimes and costing methods. The impact of roaming for a given player willalso be impacted by its size in a given country, but also whether the player in questionwill have operations in other countries. The possibility of multinational mobile operators
8/12/2019 Broadband 4G Costings Bohlin 2005
http://slidepdf.com/reader/full/broadband-4g-costings-bohlin-2005 22/26
to optimise their roaming obligations and benefits would be an additional complexity insuch a model.
If one should go ahead with the most basic and simple sensitivity analysis forinterconnect and roaming charges, it would be to provide a percentage surcharge orreduction of the required ARPU levels considered in Figure 14. The impact of could vary
considerably depending on the type of actor and the type of country. It has beenreported that surcharge could be in the range of 25% of net ARPU for certain players,suggesting that such charges could have significant impact on break-even ARPU incertain circumstances. Evaluating impacts on break-even ARPU with a more finelycalibrated model is an interesting further extension of this contribution.
5 Conclusions
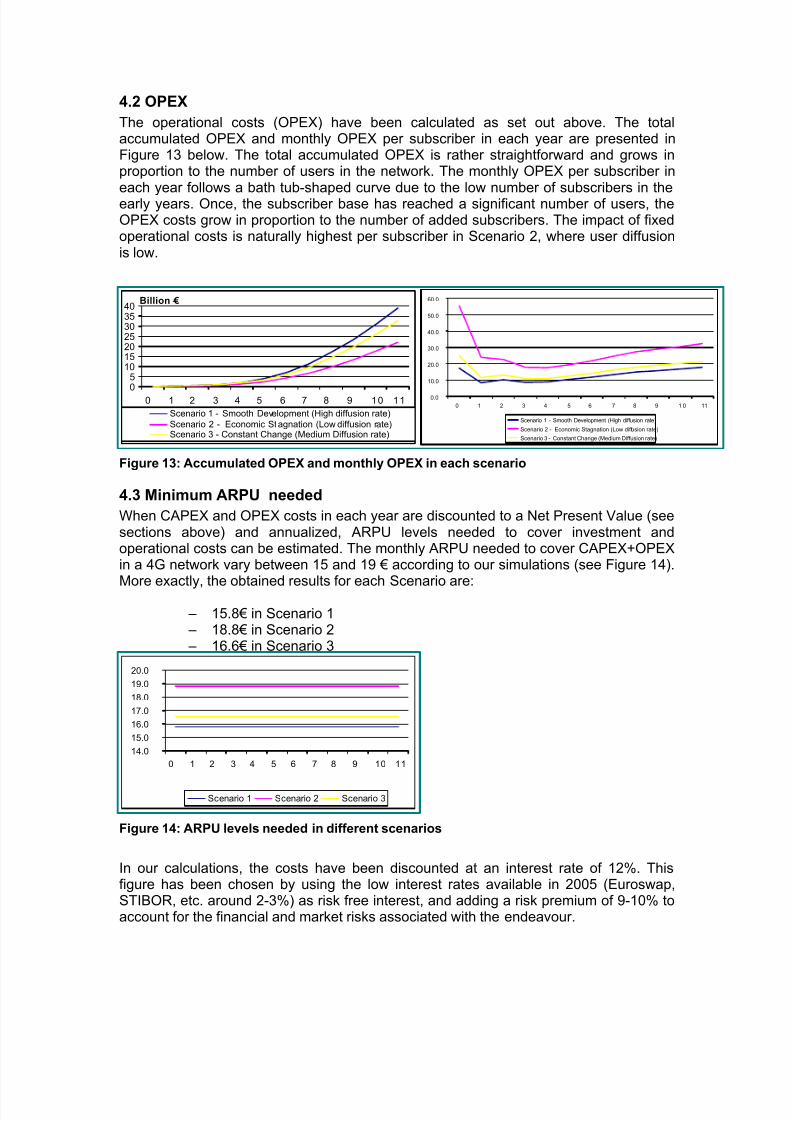
Our simulation indicates minimum ARPU levels of 15-19 € monthly will be needed for 4Gbusiness cases to become viable, under our assumptions. However, this figure shouldbe considered with great caution. A more precise estimate depends on a wide array of
factors. Some of these factors have been evaluated above, including varying diffusionlevels, equipment cost developments, licence costs, competitive impacts, andinterconnect charges. Many more factors could be added, but this model provides a firstcomprehensive analysis of a future 4G network.
The impact analyses regarding certain factors’ impact on 4G business cases indicate thefollowing degree of importance for ARPU levels needed:
– The cost of spectrum licences High – The 4G diffusion levels Medium – Equipment cost development curves Low – Competitive impacts Medium to high
– Interconnect charges Possibly significantIn terms of the overall purpose of this report, the business model provides a viabilityvalidation of the costs of the new technology but it is not a supply side equivalent to thedemand study. Its usefulness is in verifying that the new technologies could offerinfrastructure cost and pricing advantages, and thus be a viable business propositionshould demand be there. However, the required ARPU levels should be taken with thecaveats that interconnect charges and licence costs could intervene to make it morecostly and thus the break-even ARPU cost much higher.
8/12/2019 Broadband 4G Costings Bohlin 2005
http://slidepdf.com/reader/full/broadband-4g-costings-bohlin-2005 23/26
References
Björkdahl, J., Bohlin, E., (2003), “Competition Policy and Scenarios for European 3G Markets”, Communications & Strategies, No. 51, 3rd Quarter, pp. 21-34, 2003.
Björkdahl, J., Bohlin, E., Lindmark, S., (2004), “Financial Assessment of Fourth GenerationMobile Technologies”, paper presented to the EURO CPR 2004 Conference, 29-30 March 2004,Barcelona, Spain, published in Communications & Strategies, No. 54, 2nd Quarter, pp. 71-96.
Björkdahl, Joakim (2003) “Financial Prospects”, in Bohlin, E et al (2003) “Prospects for the ThirdGeneration Mobile Systems”, European Commission, Directorate General, Joint ResearchCenter, report no. EUR 20772 EN
Bohlin, E., Ballon, P., Björkdahl, J., Lindmark, S., Weber, A., Wingert, B., (edited by C. RodriguezCasal, J-C. Burgelman, G. Carat) (2004), “The Future of Mobile Technologies in EU: Assessing4G Developments,” IPTS Technical Report prepared for the European Commission – JointResearch Center, EUR 21192.
Bohlin, E., Burgelman, J-C. (2004) “Mobile Futures Beyond 3G: Special Issue”, info, Vol. 6, No. 6,pp. 345-398.
Economist (2005) “Face value - Hong Kong's high roller”, The Economist, January 6 2005
Forge, Simon (2004) “Is fourth generation mobile nirvana or… nothing?” Info, volume 6, number1, 2004, pp. 12-23
Forge, S., Blackman, C., Bohlin, E., (2005), Future Mobile Communications Markets and Services(FMS) in Europe, Final Report, submitted to DG JRC-IPTS, European Commission(http://fms.jrc.es).
ITU (2004) ITU Radio Communications Study Groups, Document 8F/176-E, Germany, Inclusion
of Cost Aspects into the Methodology for Spectrum Estimation
Johnston, D.J. & LaBrecques, M. “IEEE 802.16 Wireless MAN Specification Accelerates WirelessBroadband Access”, available at http://www.intel.com/update/contents/st08031.htm
Kerry, Stuart J., Mathews, Brian & McCabe, Karen (2004) “IEEE approves two wireless LANprojects that address fast roaming and mesh standards”, available athttp://standards.ieee.org/announcements/pr_80211rs.html
Lindmark, Sven, Andersson, E., Johansson, M. & Bohlin, E. (2004) “Telecom Dynamics – Historyand State of the Swedish Telecom Sector and its Innovation System 1970-2003”, VINNOVAanalysis, VA 2004:04
Liikanen, E (2001) in “eMobility – Report of the Conference on Mobility in the KnowledgeEconomy, Göteborg, June 2001” , Directorate General Information Society, EuropeanCommission
Multi-Hop Mesh Networks — A New Kind Of Wi-Fi* Network, available athttp://www.intel.com/labs/features/cn02032.htm
Wexler, Joanie (2004) “802.11s tackles mesh networks”, Network World , 2004-06-22, available athttp://www.computerworld.com.au/index.php/id;130750794;fp;16;fpid;0
8/12/2019 Broadband 4G Costings Bohlin 2005
http://slidepdf.com/reader/full/broadband-4g-costings-bohlin-2005 24/26
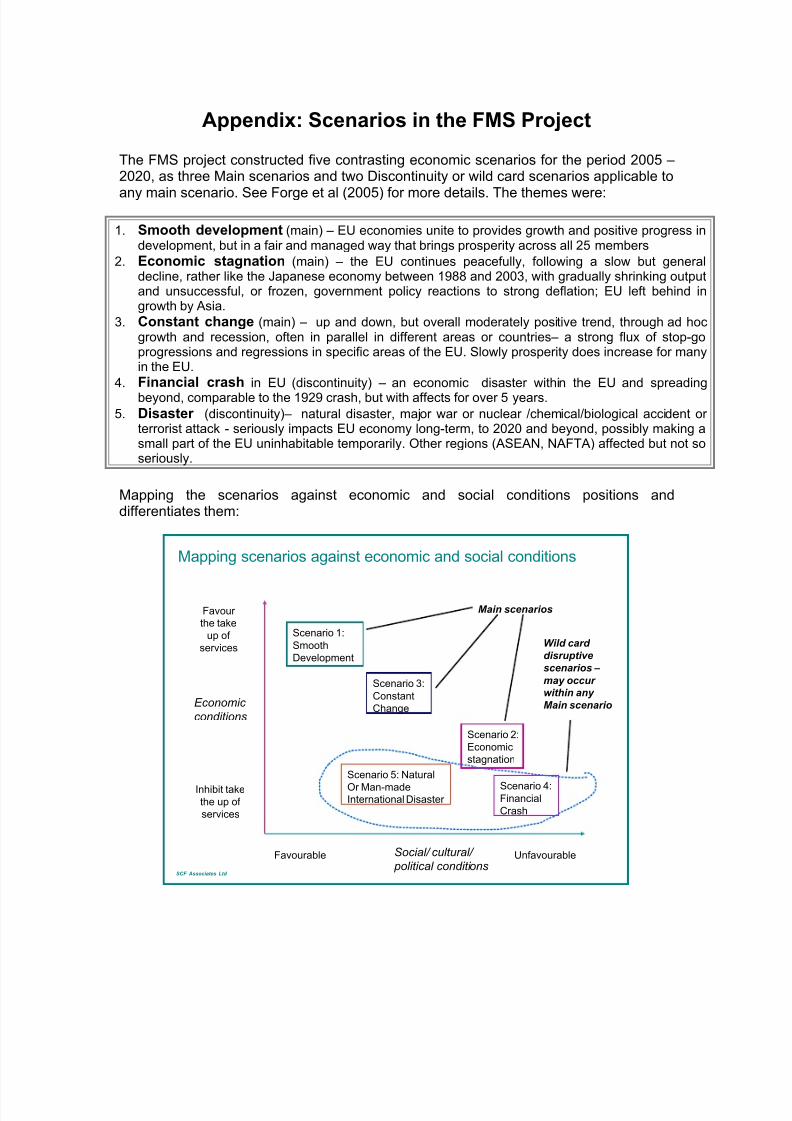
Appendix: Scenarios in the FMS Project
The FMS project constructed five contrasting economic scenarios for the period 2005 –2020, as three Main scenarios and two Discontinuity or wild card scenarios applicable to
any main scenario. See Forge et al (2005) for more details. The themes were:
1. Smooth development (main) – EU economies unite to provides growth and positive progress indevelopment, but in a fair and managed way that brings prosperity across all 25 members
2. Economic stagnation (main) – the EU continues peacefully, following a slow but generaldecline, rather like the Japanese economy between 1988 and 2003, with gradually shrinking outputand unsuccessful, or frozen, government policy reactions to strong deflation; EU left behind ingrowth by Asia.
3. Constant change (main) – up and down, but overall moderately positive trend, through ad hocgrowth and recession, often in parallel in different areas or countries– a strong flux of stop-goprogressions and regressions in specific areas of the EU. Slowly prosperity does increase for manyin the EU.
4. Financial crash in EU (discontinuity) – an economic disaster within the EU and spreadingbeyond, comparable to the 1929 crash, but with affects for over 5 years.
5. Disaster (discontinuity)– natural disaster, major war or nuclear /chemical/biological accident orterrorist attack - seriously impacts EU economy long-term, to 2020 and beyond, possibly making asmall part of the EU uninhabitable temporarily. Other regions (ASEAN, NAFTA) affected but not soseriously.
Mapping the scenarios against economic and social conditions positions anddifferentiates them:
SCF Associates Ltd
Favour
the take
up of
services
UnfavourableFavourable
Inhibit takethe up of
services
Economic
conditions
Social/ cultural/
political conditions
Mapping scenarios against economic and social conditions
Scenario 1:
Smooth
Development
Scenario 5: Natural
Or Man-madeInternational Disaster
Scenario 2:
Economic
stagnation
Scenario 3:
Constant
Change
Scenario 4:Financial
Crash
Main scenarios
Wild card
disruptive
scenarios –
may occur
within any
Main scenario
8/12/2019 Broadband 4G Costings Bohlin 2005
http://slidepdf.com/reader/full/broadband-4g-costings-bohlin-2005 25/26
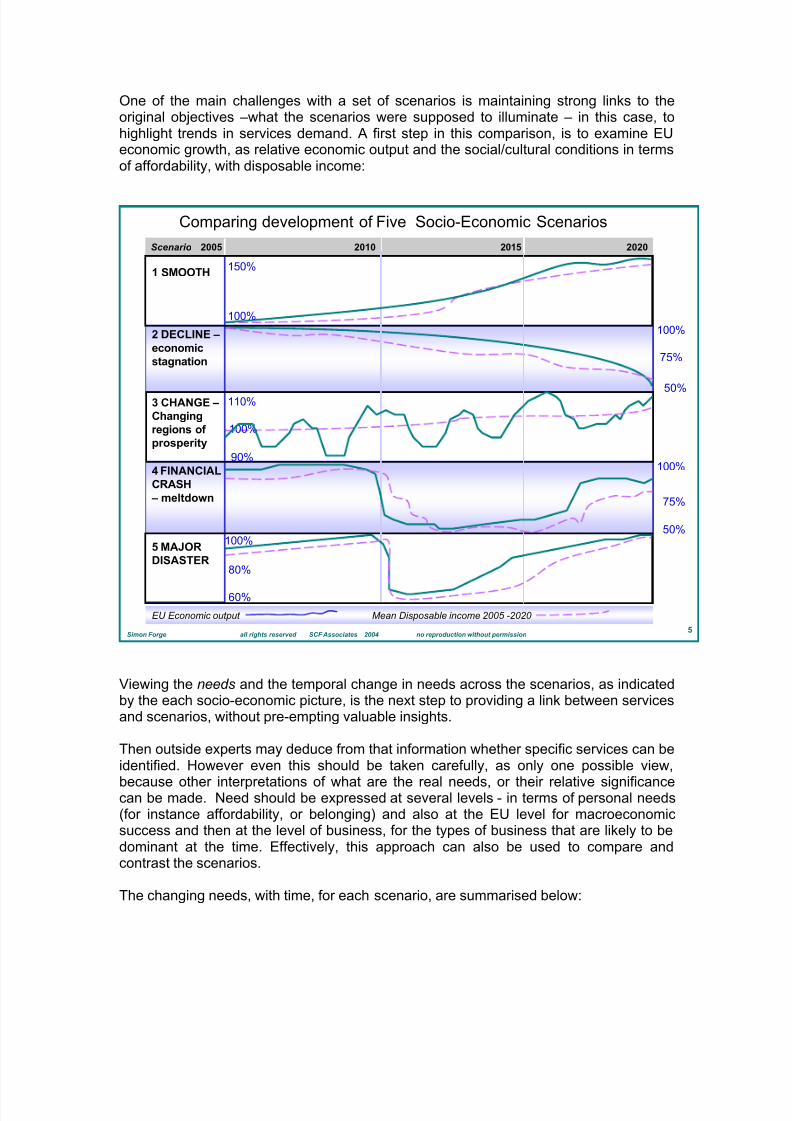
One of the main challenges with a set of scenarios is maintaining strong links to theoriginal objectives –what the scenarios were supposed to illuminate – in this case, tohighlight trends in services demand. A first step in this comparison, is to examine EUeconomic growth, as relative economic output and the social/cultural conditions in termsof affordability, with disposable income:
5Simon Forge all rights reserved SCF Associates 2004 no reproduction without permission
Comparing development of Five Socio-Economic Scenarios
2020201520102005Scenario
5 MAJOR
DISASTER
4 FINANCIAL
CRASH
– meltdown
3 CHANGE –
Changing
regions of
prosperity
2 DECLINE –
economic
stagnation
1 SMOOTH
EU Economic output Mean Disposable income 2005 -2020
100%
75%
50%
75%
100%
50%
150%
100%
100%
110%
90%
100%
80%
60%
Viewing the needs and the temporal change in needs across the scenarios, as indicatedby the each socio-economic picture, is the next step to providing a link between servicesand scenarios, without pre-empting valuable insights.
Then outside experts may deduce from that information whether specific services can beidentified. However even this should be taken carefully, as only one possible view,
because other interpretations of what are the real needs, or their relative significancecan be made. Need should be expressed at several levels - in terms of personal needs(for instance affordability, or belonging) and also at the EU level for macroeconomicsuccess and then at the level of business, for the types of business that are likely to bedominant at the time. Effectively, this approach can also be used to compare andcontrast the scenarios.
The changing needs, with time, for each scenario, are summarised below:
8/12/2019 Broadband 4G Costings Bohlin 2005
http://slidepdf.com/reader/full/broadband-4g-costings-bohlin-2005 26/26
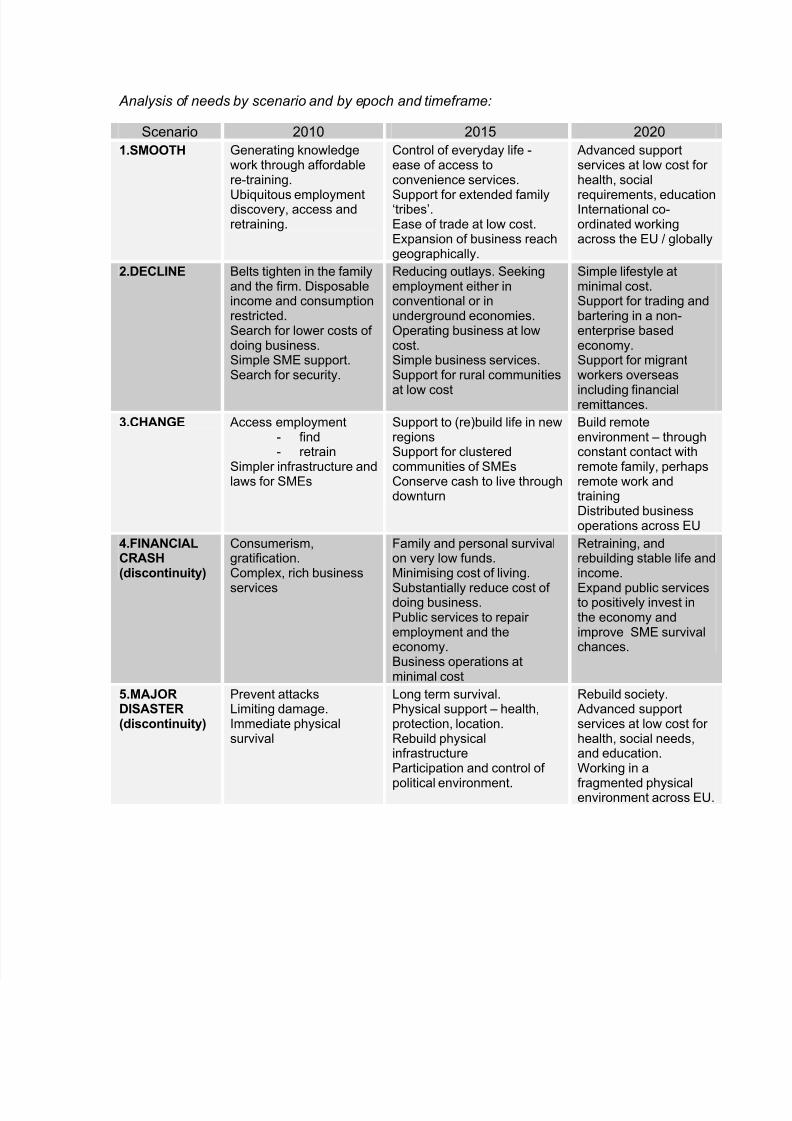
Analysis of needs by scenario and by epoch and timeframe:
Scenario 2010 2015 2020
1.SMOOTH Generating knowledgework through affordablere-training.
Ubiquitous employmentdiscovery, access andretraining.
Control of everyday life -ease of access toconvenience services.
Support for extended family‘tribes’.Ease of trade at low cost.Expansion of business reachgeographically.
Advanced supportservices at low cost forhealth, social
requirements, educationInternational co-ordinated workingacross the EU / globally
2.DECLINE Belts tighten in the familyand the firm. Disposableincome and consumptionrestricted.Search for lower costs ofdoing business.Simple SME support.Search for security.
Reducing outlays. Seekingemployment either inconventional or inunderground economies.Operating business at lowcost.Simple business services.Support for rural communities
at low cost
Simple lifestyle atminimal cost.Support for trading andbartering in a non-enterprise basedeconomy.Support for migrantworkers overseas
including financialremittances.
3.CHANGE Access employment- find- retrain
Simpler infrastructure andlaws for SMEs
Support to (re)build life in newregionsSupport for clusteredcommunities of SMEsConserve cash to live throughdownturn
Build remoteenvironment – throughconstant contact withremote family, perhapsremote work andtrainingDistributed businessoperations across EU
4.FINANCIALCRASH(discontinuity)
Consumerism,gratification.Complex, rich business
services
Family and personal survivalon very low funds.Minimising cost of living.
Substantially reduce cost ofdoing business.Public services to repairemployment and theeconomy.Business operations atminimal cost
Retraining, andrebuilding stable life andincome.
Expand public servicesto positively invest inthe economy andimprove SME survivalchances.
5.MAJORDISASTER(discontinuity)
Prevent attacksLimiting damage.Immediate physicalsurvival
Long term survival.Physical support – health,protection, location.Rebuild physicalinfrastructureParticipation and control of
political environment.
Rebuild society. Advanced supportservices at low cost forhealth, social needs,and education.Working in a
fragmented physicalenvironment across EU.