broadband demand final report v1.3 -...
TRANSCRIPT
Telecommunications Research Group University of Colorado
Broadband Demand Study
Final Report
Michele Jackson Tom Lookabaugh
Scott Savage Douglas C. Sicker Donald Waldman
University of Colorado at Boulder
November 15, 2002

Table of Contents
Introduction ........................................................................................................3
Findings Relative to Research Questions..........................................................4
Background on Broadband ..............................................................................12
Estimating Consumer Preferences for Internet Access Service ......................28
Small Business and Home Office Demand for Internet Access Service ..........52
US Government use of Broadband..................................................................62
Telework and the Demand for Broadband Services ........................................73
Appendix A – Survey Respondent Comments.................................................92

Broadband Demand Study – Final Report 3
Introduction Broadband penetration exceeds 10% of the U S population and continues to grow. But the rate of growth is itself particularly important to several constituencies. A general debate continues over the status of broadband adoption, the criticality of intervention, and which intervention policies would be effective. While much attention has historically been paid to the supply side of broadband, understanding and influencing the demand side of broadband is a key to understanding both status and appropriate policy. This report examines a number of key attributes of demand for broadband. From a grounding in the definition and received knowledge on broadband demand, the report goes on to report research in consumer demand for broadband, small business and small office / home office demand, government use of broadband, telework, and international experience with broadband adoption. The research includes a new consumer survey including conjoint analysis of demand attributes and original interview based research on telework and its relation to broadband. Key findings of the research include affirmation of the criticality of price in promoting the next stage of broadband adoption, the unexpected salience of reliability as a valued attribute, the importance of access speed, and the relatively lesser importance of ease of installation and security. The question of content and applications is complicated, with no killer application emerging but also no clear mandate to discover one. While the U. S. government could play a leadership role in adopting
broadband, it does not appear to be in this role yet and may be most effectively involved by including broadband in its broader effort to incorporate information and communication technologies. Telework is a valid beneficiary of broadband, but, importantly, teleworkers are increasingly not technophiles and value broadband indirectly through the specific benefits it can bring to their productivity without being required to pay attention to the technology itself. The report is organized into several sections. The next section of the report summarizes findings relative to the original research questions of the project. Following is a summary of the current state of the public debated on broadband demand and policy. We then report our consumer survey on broadband demand, followed by analysis of survey data on small business and small office / home office use of broadband. We next analyze government use of broadband, then report our analysis of a set of semi-structured interviews with teleworkers.

Broadband Demand Study – Final Report 4
Findings Relative to Research Questions In this section, we address the original research questions of the project. 1. Why do residences and small businesses (less than
50 employees) that currently subscribe to
narrowband Internet access services, and that are
located in areas where broadband service is currently
available, not subscribe? To what extent do the
following inhibit subscription rates:
- and -
2. For each of the items above, what are possible
actions that would remove or ameliorate the barrier
or concern?
a. Awareness of service availability.
We had mixed results on awareness. In our consumer survey, awareness of high-speed service availability is relatively high for cable modem and DSL technology. When asked “which ways of getting high-speed access are available in your neighbourhood,” 15.3 percent of respondents replied “not sure” for cable modem, 30 percent for DSL, 64.7 percent for fixed wireless, and 68.2 percent for satellite. 80.6 percent of respondents with dial-up Internet access (i.e., latent high-speed users) have high-speed service available in their neighbourhood. Our telework survey suggested some confusion about availability of broadband (or even more fundamentally, exactly what broadband
is). This confusion is also seen in some of our secondary research (various proponents of broadband don’t agree on the definition and surveys suggest various user communities have a diffuse understanding of the concept). These findings suggest that promoting awareness of service availability has some benefit, but it should be accompanied by substantial effort to clarify what broadband is and what it should mean to users (the benefits).
b. Price of the service.
Price is consistently a very important issue. In our consumer survey, the monthly cost of Internet access is very important for all survey respondents, but respondents with dial-up access place more importance on price than other attributes. Econometric estimates of marginal utilities show that dial-up users, and latent high-speed users, weight cost more heavily in their indirect utility functions than high-speed users. Our small business / SOHO analysis shows price to be the single largest perceived barrier to purchase of broadband service. Our telework research suggests that many teleworkers are responsible for part of their technology costs; price becomes an issue both for the teleworker and for the organization bearing the remainder of the costs. And our secondary research consistently

Broadband Demand Study – Final Report 5
suggests price is a critical issue and that significant price elasticity exists. These findings suggest (1) that actions intended to increase the perceived benefits of broadband can help (by justifying the price paid) and (2) it is not really feasible to ignore supply side issues to the extent they influence price.
c. Price differential between broadband and
narrowband services and perceived value
differential.
Our consumer survey suggests the price differential between dial-up and high-speed access, ($17.51 and $40.76 per month, respectively) is relatively high given many dial-up users place relatively low value on the “always on” attribute. Consumer surplus (i.e., willingness to pay, or WTP, less actual price paid) provides some understanding of perceived value. Econometric estimates of WTP suggest that latent high-speed users are willing to pay $26.35 to $35.19 for a very reliable high-speed service.1 High-speed users, who tend to be “younger”, more educated, and with higher income, are willing to pay $68.95 to $138.22 for a very reliable high-speed service. Assuming dial-up users currently have a reliable service, and given the mean price of high-speed access of $40.76, high-speed users clearly perceive greater value in high-speed access than
1 These figures are calculated by taking the monthly cost ($17.51) for low speed, very reliable, dial-up service that is not always on, and where installation is not important. Estimates of latent high-speed user’s WTP are then incrementally added to this benchmark service to reflect a move from not always on to always on, and slow speed to fast, and fast to very fast.
latent high-speed users. Several strategies are available to attract the next wave of adopters: publicise and promote the benefits of broadband to the public; targeted education and promotion towards latent high-speed users (for instance, through one-stop shops that trial access, subsidized/free trials of broadband in the home, etc.; given that high speed users tend to be highly satisfied with their service once purchased, opportunities to trial the service at low or no cost should be particularly powerful); increase actual and/or perceived service reliability (this would place latent high-speed user’s value closer to the range of actual monthly prices); and “version” Internet access by the reliability (or speed) attribute by identifying high-speed and latent high-speed groups (according to age, income, education, etc). For instance, provision of a “high-price”, very reliable, high-speed service will satisfy high-value (high-WTP) customers, while a “low-price”, less reliable, high-speed service will be a more attractive value proposition to latent high-speed users. Once latent high speed users experience high-speed service, and become more skilful in using speed and always on functionality, then some users within this group may self-select into the high-price/high-value service according to their revised WTP.2
2 Versioning sells different quality services to different market segments at different prices. By creating low-quality (low-value) and high-quality (high-value) versions the firm can sell a good, which effectively costs the same to produce, at a higher price to consumers with significantly higher WTP. Whilst there is a social cost to reducing quality to satisfy the self-selection constraint, in many cases, the output effect appears to outweigh the quality reduction effect. Effectively, versioning can raise both firm profitability and societal welfare when new (low-

Broadband Demand Study – Final Report 6
d. Concern about technical difficulty of installation.
Our consumer survey suggests that while many respondents state that installation is an important attribute of Internet access, they generally do not value it when trading-off other attributes in the utility maximization decision; similar our analysis of Small Business/SOHO data rates installation cost (a proxy for difficulty of installation) low as a barrier to purchase or as a reason for selecting a particular broadband provider. It appears that users are relatively willing to accept a “one time cost” in terms of installation difficulty – while there may be problems with installation, these do not appear This suggests that no particular action is required regarding ease of installation, but, ease of installation may nonetheless be subsumed in critical initiatives to increase ease-of-use and reliability discussed next.
e. Concern about technical difficulty of maintaining
the service
f. Concern about delivered service meeting the
advertised speeds and functionality (including
availability, reliability, performance, ability to
support multiple PCs, etc.)
g. Concern about service longevity based on recent
industry bankruptcies, consolidations etc.
value) markets are served that would not be served in the absence of this pricing strategy.
In our consumer survey, e., f., and g. all refer to the same attribute – reliability of service. Both survey data and marginal utility estimates indicate that reliability of service is the most important
attribute of Internet access. Consumers are WTP between $13.25 (Latent high-speed) and $39.12 (With high-speed) for more reliable service. Our analysis of small business/SOHO data found that “low service reliability” is second only to price as a barrier to purchase of broadband. Further, our telework research suggests that teleworkers are increasingly not technophiles; they receive relatively little technical support from their organizations, and yet they are critically dependent on their technology (including their network connection). There appears to be an important potential to increase demand by using technical means to increase reliability, changing users’ perceptions about reliability through advertising and education, service level agreements, and tiered access plans that differ according to service reliability (see d. above), and by structuring access to broadband services so as to increase reliability (for example, packaging technical support with broadband access to provide an integrated “high reliability” service to teleworkers).
h. Concern that the “always connected” nature of
broadband services may introduce additional
security concerns, or added complexity in
implementing security measures
In our consumer survey, security aspects were eliminated from the questionnaire during pre-testing, so this question is not directly addressed. There were no comments about security in the 100

Broadband Demand Study – Final Report 7
or so answers to the open ended question “please add any comments that would help us understand your answers to this survey?” Similarly, security was infrequently an issue in our semi-structured teleworker interviews. This is consistent with our secondary research, which suggests that consumers do not see increased security issues with “always on” as a substantial concern for them beyond their already existing concerns with, say, virus protection – the real cost is borne by businesses subject to distributed denial-of-service attacks. Similarly, security concerns rated low in our small business/SOHO analysis (well below monthly cost, service reliability, and equipment cost) as a barrier to broadband purchase, though concerns increase somewhat with the size of business. This finding does not support any strong initiatives to change perceived security risks in order to stimulate demand. Separately, we note that “always on” is the third most important attribute in our consumer survey with WTP ranging from $0.91 (With dial-up) to $17.29 (With high speed). The low WTP for latent users is interesting; it suggests little appreciation for the impact of “always on” on lifestyle. By contrast, teleworkers have a clearer understanding of the benefit of “always on.” Some of us speculate that “always on” may be a key but unperceived driver for the “stickiness” of broadband – the tendency for users to be satisfied and less likely to give up broadband once they have it. If this is true, it suggests the value of efforts to increase awareness of the benefits of “always on” and the potency of free or low cost trial
use (in which users experience “always on” and develop an appreciation).
i. Perceived, or real, absence of interesting content
or applications that need broadband access
speeds
From our consumer survey, some insight into the relationship between high-speed demand and the provision of entertainment content in particular is gleaned from the survey question “what would need to change for you to use the Internet to view entertainment video such as a full-length movie or TV show?” There appears to be some resistance to using the Internet to view entertainment video, but this resistance declines from no access, to dial-up, to high-speed users. Excluding respondents who “would not use their PC and the Internet to view entertainment content”, the most important reason is the “ability to view in convenient location (for instance, your TV in your living room).” “More awareness of how to find interesting content”, and “access to a wider range of content” are less important reasons for “change” across the whole sample, but are relatively more important to high-speed users. Clearly, more research is required on this issue. Given content is currently being designed for high-speed access on a user-pay basis, future research should consider conjoint panels that focus on content attributes and prices (similar to that used in cable TV markets) rather than access attributes. Our telework research suggests that as fewer and fewer teleworkers can be classified as technophiles, attraction to applications becomes secondary to reliable provision of basic work

Broadband Demand Study – Final Report 8
functionality. Our secondary research shows that while proponents of broadband consistently tout a variety of interesting applications, consumer usage continues to be dominated by email and web browsing (just as with dial-up access). There are encouraging trends among broadband users towards more time on line and some more time using applications that benefit from broadband (particularly games), but there is no evidence of a “killer app” emerging nor is the search for such an application necessarily the best strategy. Instead, we would recommend an emphasis on promoting the generic benefits of broadband (especially, for example, through trial exposure) and broad support for the evolution of multiple applications that can differentiate broadband.
j. Limitations in the actual speed of existing services
(i.e., are existing services really “broadband
enough”?); what upstream and downstream
speeds would make a difference in subscription
rates, and at what pricing?
In our consumer survey, after reliability, speed is the next most important attribute. Consumers are WTP between $8.22 (Lower income) to $32.15 (With high-speed) to increase speed from dial-up (slow) to fast for downloads but relatively slower for uploads (fast), and from fast to very fast for uploads and downloads (very fast). Our teleworker survey suggests that while speed is not in itself a salient issue, it is important through its manifestation in file download times; we would expect that the ratio of typical file size to bandwidth will strongly influence teleworker sensitivity to speed. Our small business/SOHO analysis shows
speed, always on, and email and instant messaging applications as all being cited as critical (and quite similar in criticality) whereas e-commerce, streaming media, integrated services, remote access, and videoconferencing were all perceived as substantially less critical. Our secondary research also suggests an interesting trend towards broadband users increasingly becoming sources of content; ultimately this could reflect itself in more sensitivity to upstream speeds. Overall, these findings suggest sensitivity to speed; it should be possible to tier the market on speed and expect some migration over time towards higher speed services, although our tools were not sufficient to distinguish particular speed/price points beyond the slow, fast, and very
fast characterizations (we need to limit the number of choices in each attribute in order to get statistically reliable conjoint analysis across multiple attributes).
k. Inability to access the Internet via broadband
speeds at other than the primary home or office
location
In managing the scope of our consumer questionnaire, we needed to eliminate this from the questionnaire during pre-testing, so this question is not directly addressed. Regarding the relationship between home and office broadband access, our secondary research is in conflict; some authors suggest that broadband access at work may serve as a substitute for broadband access at home (for example, noting that most streaming media is actually consumed in the work place), while others suggest that broadband

Broadband Demand Study – Final Report 9
access at work can serve to familiarize consumers with the advantages of broadband (we have recommended in several instances above the value of trial exposure for users). We did not uncover any particular information on the relationship between broadband access in home or office and access in other locations (e.g., mobile access or access while traveling); a general observation, though, would be that the tendency of users to become adapted to broadband once they use it should make them more desirous of broadband in locations other than home or office (in other words, while it might be hard to get a current dial-up user to value mobile and remote broadband access, it should be disproportionately easier to get a home or office broadband user to value mobile and remote broadband access.)
3. To what extent is the U.S. Government currently a
subscriber of broadband services, and could
increased Government use of broadband motivate
higher subscription rates among residences and
businesses?
Initial results at ascertaining Government connectivity are moderate, creating only a general view. We believe follow up surveys could shed some more light on this topic. However, based on conversations with officials within US agencies, it is not clear that the government understands the relevant concepts. We found a great deal of information indicating that the government is indeed looking at ways of improving efficiency and reduced costs through the use of Information and Communication Technology (ICT). However, these efforts do not focus
specifically on broadband services per se. We did find the terms “broadband”, “high speed” and “high rate” in numerous federal reports concerning such things as telework, work process, ecommerce and egovernment. We also found a number of reports and proposed legislation that mentioned the role of broadband as a general driver of economic growth. While we do believe that government should look at the role of broadband, we also believe that this is just one part of a much bigger effort; that of understanding how all of ICT can help government be more efficient and cut costs. Nonetheless, it may be worthwhile for industry to demonstrate to government why they should look more closely at the role of broadband. For example, the conclusions reached in this document could be used as a launching point for more in depth investigation by a government agency, such as GAO. As for Government driving broadband internally and externally, they are moving in the right direction. Instead of finding the killer app, they are slowly developing accessible, reliable and user-friendly services and applications to better serve their own and their citizen’s needs. We recommend to developers focus on current ICT projects that will most likely evolve into useful bundled applications and services, rather than attempt to identify the next best thing. We also recommend that government continue to focus on telecommuting, improved online business process, and accessible portals.
4. What are the potentials for broadband to support
telecommuting/telework practices? What are the

Broadband Demand Study – Final Report 10
major indicators of broadband adoption for
telecommuting/telework?
Our key findings from our telework research are: Finding 1: “Telework” is just “work.” Respondents do not distinguish telework from “normal work.” They do not segment their work into “office” work and “home” work. Nor do they consider themselves unusual or experimental in terms of their work practices. Finding 2: Teleworkers divide their work into “tasks”
and “relationships.” Both of these need support. Task work involves things an individual does alone, including writing, research, data analysis, and so forth. Relationship work involves those things that must be done with others, including meeting with team members and with clients, mentoring, and supervising. Finding 3: Telework is a continuum. The traditional view that juxtaposes office work to telework is outdated. The extension of the workday beyond “office hours” means that it is more realistic to think of teleworking as a continuum ranging from workers who perform all or most of their work in the office to those that perform all or most of their work at other locations (at home, on the road, at clients’ sites). Finding 4: Teleworkers in “non-tech” companies
largely are responsible for creating their work
environments, including acquiring technological
equipment and support. Most respondents were given no additional support in terms of equipment or technical assistance, as compared to traditional office workers. Technology companies tended to provide
more resources; employees of these companies noted they were given laptops and even software to use to telecommute more efficiently (such as instant messaging). Finding 5: Formal telecommuting policies and
statements of expectations are largely nonexistent. Even when policies exist (usually in tech companies), they may not be effective in guiding action. Finding 6: Most organizations provide little to no
support for their teleworkers. Teleworkers indicated that they learned “on the job” how to telework. Organizations sometimes supplemented the experience with literature or short training seminars, but not at the outset of the job. The idea of “economic” or “organizational” support—in which the organization helps the employee by shouldering some of the burden of working away from the office—did not resonate with the respondents. They had not considered that possibility. Finding 7: Technology is a core attribute of telework. Results confirmed our expectation that technology is an essential component of telework. Respondents consistently indicated that without the ability to access documents, databases, intranets, etc. they could not do their job. Finding 8: Teleworkers use established technologies,
but will adopt innovative technologies if they meet
communication and information needs.
Finding 9: Dial-up connections dominate. With only a few exceptions, our respondents connected through traditional dial-up phone lines rather than through

Broadband Demand Study – Final Report 11
broadband. Several connected though toll free lines, several through an extra business line, and one through satellite (we do not know if this connection was broadband). Not all had broadband service available in their area. For those who did, the decision not to subscribe was the result of a cost-benefit analysis, with benefit having to be measured in terms of increased work productivity. While they acknowledged that slower connections meant wasted time or lower productivity, they would argue they were getting by on what was available. Finding 10: Few respondents knew what “broadband”
was. Many had no broadband service. Most referred to it or understood it as high speed internet access. “DSL” was sometimes used as a replacement. Employees of technology companies were somewhat more confident in their definitions. Finding 11: Requirements of teleworking practices
potentially can drive broadband adoption. Respondents are committed to making their arrangements work. These commitments are consistent with the opportunities afforded by broadband, either because broadband can solve current inefficiencies, or because it can meet perceived requirements. These led to several specific recommendations: 1. Make broadband affordable to teleworkers
specifically.
2. Emphasize improved productivity and efficiency, rather than increased content.
3. Further investigate technology for supporting relationships.
4. Package excellent technical support with broadband access.
5. Work with access providers or organizational consultants to develop a “turn-key” telework package.
6. Emphasize the reliability and stability of broadband access, rather than its ability to support new and innovative work practices.
7. Finally, make broadband easier to understand.

Broadband Demand Study – Final Report 12
Background on Broadband A large community of interested parties – in industry, government, and academia – is debating the current status of broadband, its direction, and appropriate policies. While in this report we offer some original primary research on drivers of broadband demand, in this section we will examine the broader context of the current broadband debate.
The Definition of Broadband
Broadband is usually thought of as related to data rate, but, in fact, there is both disagreement on what data rate might define broadband and on whether data rate is the defining characteristic at all. The United States Federal Communications Commission (FCC) generates substantial statistical data on broadband as well as advocating policy initiatives, so its definition is particularly important. Even here, though, we find variations. The FCC originally defined broadband to mean greater than 200 kbps information carrying capacity in both directions3 but then added other descriptive terms such as ‘high-speed services’ (at least 200 kbps in at least one direction), ‘advanced services’ (at least 200 kbps in
3 U. S. Federal Communications Commission, First Advanced Telecommunications Report, CC Docket No. 98-146, Released February 2, 1999, <http://www.fcc.gov/Bureaus/Common_Carrier/Orders/1999/fcc99005.txt>, p. 20)
both directions and thus a proper subset of high-speed services) and ‘broadband services’ (a larger subset of services that end users can access with asymmetric capabilities and speeds that are less than 200 Kbps, but are generally also considered high-speed, such as greater than 128 Kbps in a wireless environment or 144 Kbps in a wireline environment)4. But note how FCC Chairman Michael Powell addresses the definition of broadband in a late 2001 speech:
Oddly enough a clear, uniformly accepted definition evades us. It is accepted that whatever broadband is, it is fast (the Commission has defined it as 200kbs). We have very forceful debates about how fast is fast enough. I submit, however, that broadband is not a speed. It is a medium that offers a wide potential set of applications and uses. With the telephone, we knew what the “killer app” was. It was voice. The “broad” in broadband should be recognized as meaning more than the “fat, fast pipe.” It should represent the nearly infinite possible uses and applications that might be developed and that a consumer might use. I think broadband should be viewed holistically as a technical capability that can be matched to consumers’ broad communication, entertainment, information, and commercial desires.
4 U. S. Federal Communications Commission, Notice of Inquiry Concerning Advanced Telecommunications Capability, CC Docket No. 98-146, Released February 18, 2000. <http://hraunfoss.fcc.gov/edocs_public/attachmatch/FCC-00-57A1.pdf >, p. 2

Broadband Demand Study – Final Report 13
I start by trying to come together on what are the indispensable components of broadband functionality. It is, to my mind, (1) a digital architecture, (2) capable of carrying IP or other multi-layered protocols, (3) that has an “always on” functionality, and (4) that is capable of scaling to greater capacity and functionality as uses evolve and bandwidth hungry applications emerge. I also believe that we should conceptualize broadband capability as a function that can ride on many different electronic platforms. Broadband is not a copper wire. It is not a coaxial cable. It is not a wireless channel. It is all of these things. The capability can ride on many platforms (and should) in order to tailor solutions to consumer patterns and
interests.5 Returning to bit rate based definitions, the OECD (a collector of statistics and commentator on international broadband policy) uses a slightly higher rate for downstream, 256 kbps, but allows as low as a 64 kbps upstream rate6. The Canadian National Broadband Task Force suggests that the minimal bit rate for broadband should be substantially above 200 kbps, relying on tables such as the following7:
5 Powell, Michael K. “Remarks of Michael K. Powell, Chairman Federal Communications Commission at the National Summit on Broadband Deployment,” Washington, D.C., October 25, 2001. <http://www.fcc.gov/Speeches/Powell/2001/spmkp110.html.>, pp. 2-3) 6 Organization for Economic Co-operation and Development, The Development of Broadband Access in OECD Countries, October 29, 2001. <http://www.oecd.org/pdf/M00020000/M00020255.pdf>, p. 6 7 Canadian National Broadband Task Force, The New National Dream: Networking the Nation for Broadband Access, Submitted to Canadian Minister Tobin on June
Application Minimum Bit Rate
Desirable Bit Rate
Tele-working 110 kbps 7000 kbps Video Conferencing 110 kbps 800 kbps Tele or E-Learning 110 kbps 7000 kbps Tele-medicine 110 kbps 7000 kbps Video Telephony 70 kbps 200 kbps Near Video-on-Demand 1000 kbps 7000 kbps Movies-on-Demand 1000 kbps 7000 kbps Audio-on-Demand 110 kbps 700 kbps Telegames 40 kbps 600 kbps Home Shopping 40 kbps 7000 kbps Electronic Banking 40 kbps 400 kbps Electronic Newspaper 40 kbps 2000 kbps Digital TV 1000 kbps 7000 kbps From this they conclude that some important applications require a rate higher than 200 kbps and that most benefit from a rate higher than 200 kbps. More ambitiously, others note that High Definition Television requires yet higher bit rates (19 Mbps) and that emulation of workplace networking would require the same 10 or 100 Mbps access that workers typically enjoy through a direct Ethernet connection in the office – so claim a better definition of broadband would be 100 Mbps8. Chairman Powell calls out a particular technical characteristic other than bit-rate, “always on” connectivity. Another technical characteristic that is occasionally required of broadband is low latency – this is important in two-way human communication and in online interactive gaming. And others have also adopted application
18, 2001. <http://broadband.gc.ca/Broadband-document/english/table_content.htm>, p. 32 8 TechNet. A National Imperative: Universal Availability of Broadband by 2010. January 15 ,2002. <http://www.technet.org/news/newsreleases/2002-01-15.64.pdf>, p. 6
Broadband Demand Study – Final Report 14
oriented definitions of broadband similar to Chairman Powell’s9. Notwithstanding this profusion of definitions, we will for the most part consider broadband in the sense of the FCC’s “high speed lines” (at least 200 kbps in at least one direction), the definition most consistent with calling DSL and cable modem deployments broadband. But this is not a trivial choice; not all applications will run at these rates and so not everything that we can imagine doing with broadband will be achievable under this definition.
The Current Status of Broadband
Broadband is built on top of the phenomenon of internet access, so it is worthwhile to first review basic internet usage. Most Americans use the internet: the Department of Commerce reports 143 million Americans (54% of the population) as users as of September, 2001, while the UCLA Center for Communication Policy in their 2001 survey estimates a higher percentage: 72.3%.10
9 See, for example, the application based definition in National Research Council, Broadband: Bringing Home the Bits. Washington, D.C.: National Academy Press, 2002, <http://books.nap.edu/books/0309082730/html/index.html>, pp. 78-80, and the commentary regarding business definition of broadband in Kneko Burney, “The Big Comeback: Excerpts from ‘Business Broadband in a Changed Economy’,” In-Stat MDR, May 2002, that U S business decision makers don’t seem to associate broadband with a particular bit rate definition but rather as encompassing high-speed networks of many varieties and concludes that businesses no longer see a natural separation between local area and wide area networks. 10 See United States Department of Commerce. A Nation Online: How Americans are Expanding Their Use of the Internet. February 2002. <http://www.ntia.doc.gov/opadhome/digitalnation/index.html> and The UCLA Center for Communication Policy, The UCLA Internet Report 2001: Surveying the Digital Future: Year Two, November, 2001.
Moreover, the use has expanded from affluent and technology savvy segments to slower to adopt segments such as rural and minority populations (as measured by a decrease in the Gini coefficient of disparity used by economists).11 And we can expect a number of the remaining non-users to start using the internet in the next twelve months, indeed, if we extrapolate from current rates of adoption by non-users and the current user base, 96% of the population would be using the internet by 2006 – a penetration comparable to that of basic telephone service.12 While the majority of the population already experiences the internet, a much smaller fraction has broadband access. There is variation in estimates of current broadband penetration, but two salient sources include the Department of Commerce’s estimate that 20% of internet users (and hence about 11% of the population) were broadband users as of September, 2001 and the FCC’s own semi-yearly statistics collection on number of high speed lines:13
<http://www.ccp.ucla.edu/pdf/UCLA-Internet-Report-2001.pdf>, p. 17 11 ibid, Department of Commerce, p. 85. 12 Ibid, UCLA, noting that 44.4% of non-users in their 2001 survey plan to go online in the next year, up from 40% in their 2000 survey (p. 28). 13 See U. S. Federal Communications Commission, High Speed Services for Internet Access: Status as of December 31, 2001, July 2002, < http://www.fcc.gov/Bureaus/Common_Carrier/Reports/FCC-State_Link/IAD/hspd0702.pdf>, p. 2, and its predecesors.

Broadband Demand Study – Final Report 15
0
2,000,000
4,000,000
6,000,0008,000,000
10,000,000
12,000,000
14,000,000
2H99 1H00 2H00 1H01 2H01
High
Spe
ed L
ines
TotalCoaxial CableADSLOther WirelineFiberSatellite or Fixed Wireless
A somewhat larger fraction – better than 40% – of small business internet users have broadband access and an even larger fraction – 85% – of medium and larger businesses have connectivity at their main offices.14 Is the adoption of broadband unusually slow? In the first half of 2002, both the technology industry and various government organizations identified a problem with the rate of broadband adoption. These themes have now become much more muted. Key points regarding the “abnormality” of adoption are:
14 For small businesses, 38% of 250 small businesses surveyed at the beginning of May, 2002 for Women Impacting Public Policy subscribe to high speed internet access (the sample size is sufficient for an accuracy of +/- 6% at the 95% confidence level (KRC Research, Small Business Solutions: Utilizing the Internet and High Speed Access, prepared for Woman Impacting Public Policy, May, 2002). Cahners In-Stat notes that 87% of larger enterprises have broadband connectivity at their main office versus 86% for middle size companies and 56% for smaller companies (Cahners In-Stat Group, “Moving Towards Broadband Ubiquity in U.S. Business Markets,” Report No: BB0101UB, April, 2001, <http://www.instat.com/catalog/downloads/whitepaper_bbubiquity.asp >, p. 14).
- Changes in the rate of increase of adoption.
- Availability of broadband relative to demand.
- Rate of adoption of broadband relative to other examples of adoption.
Changes in Rate of Increase of Adoption A useful set of figures on broadband adoption comes from the FCC15:
First Half 2000 57% growth
Second Half 2000 62% growth
First Half 2002 36% growth
Second Half 2002 33% growth
The substantial decline in growth rates between 2002 and 2001 has been a cause for alarm.
What expectation should we have on fractional growth rates for a diffusion process? Fractional growth rates are the most commonly cited growth statistics (the change in the last period divided by the amount at the beginning of the period; usually these are stated in percentage terms as in the FCC statistics above; a constant fractional growth rate implies exponential growth). If diffusion is occurring in a finite population, saturation will ultimately occur and certainly by that point growth rates will have declined precipitously. More interestingly, though, take the simplest mathematical model for diffusion, the famous “logistic curve” or “S-shaped diffusion curve” given by
)exp(1)(
*
tNtN
φη −−+=
15 See note 11.

Broadband Demand Study – Final Report 16
where N(t) is the number of adopters at time t, N* is the ultimate number of adopters at saturation, η locates the
curve in time and φ gives the rate of adoption.16 The
fractional growth rate for this curve is given by
)exp(1)exp()(
)(1
tt
dttdN
tN φηφηφ−−+−−
= ,
a function that declines continuously: note the limits:
φ=−∞→ dttdN
tNt)(
)(1lim
and
0)()(
1lim =∞→ dttdN
tNt
In other words, a diffusion process following the classic S-shaped curve exhibits continuously declining fractional growth rates. (A more intuitive statement might be that an S-shaped curve appears to exhibit classic exponential
growth at its very beginning with fractional growth rateφ ,
but is in fact continually falling in growth rate as it moves on towards zero fractional growth rate at saturation.) This doesn’t tell us, for example, whether the amount of decrease in growth rates observed should have been expected (in fact the decline in growth rates is substantially higher than is experienced by the best fit logistic curve), but it does suggest that the fact of declining growth rates alone is not sufficient to suggest an abnormal diffusion process.
In the second half of 2002, the whole issue of declining growth rates has become muted. For example,
16 Stoneman, Paul. The Economics of Technological Diffusion. Oxford, UK: Blackwell Publishers, 2002, p.12
promotion for a recent (and frequently cited) marketing study includes the quote17:
"But I don't know why commentators constantly
complain about the lack of broadband adoption in the
US. The residential sector grew over 80% between
2000 and 2001," says Mr. Macklin [an eMarketer
analyst]. "I'd characterize that as significant."
An October, 2002 Wall Street Journal article on Comcast’s cable modem business states18:
After a disappointingly slow start that staggered an
expectant Internet industry salivating to serve
customers with high-speed connections, broadband
usage has been accelerating to the point where it is
reaching critical mass.
The FCC has opined that the rate of adoption of advances services is satisfactory19 and the Office of Technology Policy in the Department of Commerce describes demand in its September report as “robust” (see quote in following section).
Availability of Broadband Relative to Demand A second point of concern emphasized in the first half of 2002 is the discrepancy between availability of broadband (cited as being available to almost all the population) and
17 eMarketer, “Broadband Demand and Dial-Up Access,” August 2002, <http://www.emarketer.com/products/report.php?2000121&PHPSESSID=8c7dcd92dac8aa833d2f36a46b2a6724> 18 ibid, Wall Street Journal. 19 FCC, “Third Report on the Availability of High Speed and Advanced Telecommunications Capacity,” February 7, 2002.

Broadband Demand Study – Final Report 17
actual subscription rates (in the 10% range). Evidence of widespread availability undermined explanations that there are few adopters simply because broadband is not available, and turned the focus to understanding whether demand drivers are abnormally low (the subject of much of this report). However, the sense that low demand relative to availability is a cause for concern has also declined throughout 2002. Compare, for example, the following quote (from a speech by Bruce Mehlman, Assistant Secretary for Technology Policy, U S Department of Commerce, in March of 2002)20:
THE CHALLENGE for those of us who see broadband
as critical to U.S. competitiveness is that, despite
availability to a majority of American homes, and
notwithstanding fast subscribership growth, only a
fraction of American consumers have chosen to
subscribe so far - just 10% by some estimates,
although a few leading markets have seen up to 30%
take rates.
with the following quote from the report “Understanding Broadband Demand” issued by Assistant Secretary Mehlman’s office in September of 200221:
We have found that demand for broadband is robust,
although as with most new technologies, broadband
20 Mehlman, Bruce. BROADBAND: The Sky’s The Limit and It’s Not Falling (Yet). Before the Nortel Public Polcymakers Luncheon. 4 March 2002. <http://www.ta.doc.gov/Speeches/BPM_020304_Sky+Limit.htm>). 21 Office of Technology Policy, U.S. Department of Commerce, “Understanding Broadband Demand: A Review of Critical Issues,” September 23, 2002.
supply currently exceeds demand (in all but the most
rural markets).
The first quote suggests that the discrepancy between supply and demand is a cause for concern while the second suggests it is to be expected. (Indeed, there are many historic diffusion processes in which simple availability of an innovation has not been the limiting factor in adoption rate.) Throughout 2002, there has been a tendency to imply that low subscription rates relative to availability indicate that only demand side issues are salient. Simply put, widespread availability of broadband is not the same as widespread availability at prices that stimulate demand, so that it is incorrect to assume that low subscription rates relative to availability imply there are no supply side issues or opportunities.
Rate of adoption of broadband relative to other examples of adoption More and more commentators (particularly in the U S government administration) are comparing the rate of adoption of broadband relative to other consumer oriented technological innovations. The FCC was early in emphasizing this point; the following figure is typical and is drawn from data collected by FCC staff22.
22 Greg Guice, FCC, private communication, September 10, 2002.

Broadband Demand Study – Final Report 18
0%10%20%30%40%50%60%70%80%90%
100%
18761886
18961906
19161926
19361946
19561966
19761986
1996Years
Perc
ent
Telephone (1)
B/W Television (3)
Color television (4)
Cable (5)
VCR (6)
Cellular (7)
CD Players (8)
DBS (9)
Electricity (2)
1
2
3
4
5
6
8
7
9
The observation that the penetration of broadband is “faster than that of any other consumer technology” is now a standard part of FCC discussions of the matter.23 The obvious implication of these statements is that there is nothing “abnormal” about broadband adoption rates; if anything, things are going rather well and it is therefore unclear how much intervention is required to fix a problem. These analogies do suffer from weaknesses. Senator Lieberman’s staff point out several24:
- It seems very liberal to compare adoption processes as diverse as the original adoption of telephony, the adoption of cellular telephony, and so on, with broadband; surely there could be many factors that distinguish the circumstances of adoption and would preclude us from concluding by comparison whether broadband adoption is fast or slow.
- But if one is going to use such comparisons, we
should note that the rate of adoption for
23 Ibid, Office of Technology Policy. 24 Office of Senator Joseph I. Lieberman, “Broadband: A 21st Century Technology and Productivity Strategy,” May 28, 2002.
technologies has apparently been accelerating over time (at least in most cases); wouldn’t this suggest that a normal adoption for broadband should be quite fast by historical standards? Further, since broadband is enhancing an activity which has already largely been adopted (internet access), one would expect faster penetration than would apply in completely new applications such as the telephone or VCR.
In addition, broadband penetration is still low; somewhere between 10% and 15% of the population, so that it is hard to meaningfully compare the elapsed time so far in broadband with the entire adoption curves of other innovations. In summary, growth in broadband use continues. Growth clearly slowed in 2001, and although the fact of slowing growth is not in itself evidence of abnormality, the amount of decline was surprising. Nonetheless, the tone of the debate has moved from being alarmed over declining growth rates towards calling growth in broadband “robust” and comparing it favorably to previous innovations.
Is the Rate of Broadband Adoption Optimal?
If broadband has some attractive characteristics, then “problems” with the adoption process might be sufficient alone to motivate aggressive intervention by stakeholders. However, if the adoption process is thought to be normal (apparently an increasingly common perception as discussed above), then more scrutiny falls on the potential benefits of adoption and whether they are sufficient to motivate attempts to drive the process “faster than normal.”

Broadband Demand Study – Final Report 19
Purported benefits of broadband generally consist of:
- National economic benefit and international competitiveness
- Specific applications - Industry-specific benefits
National economic benefit and international competitiveness Economic benefit arguments revolve around identifying applications enabled or enhanced by broadband and estimating their impact on economic growth. The most frequently cited study (by Crandall and Jackson25) uses estimates of consumer price elasticity for broadband to determine economic surplus benefit to consumers and to producers, and then cross check this by attempting to estimate the specific economic benefit of enabling particular classes of applications. The authors then calculate the net present value of accelerating broadband benefits from a leisurely 25 year adoption of broadband to a duration more on the order of 5-10 years, finally arriving at a net present value of $420 billion of consumer benefit and $80 billion of producer benefit from acceleration. In helping to explain this, they note the importance of network externalities:
A skeptic, on reading this, will necessarily have doubts – how could speeding up the adoption of a technology have such massive benefits? The key lies in the substantial
25 Crandall, Robert W. and Charles L. Jackson. The $500 Billion Opportunity: The Potential Economic Benefit of Widespread Diffusion of Broadband Internet Access. July 2001, Criterion Economics, LLC. <http://www.criterioneconomics.com/documents/Crandall_Jackson_500_Billion_Opportunity_July_2001.pdf>, p. 54
benefits that ubiquitous broadband can convey to consumers. Once virtually everyone has the service, the network effects from developing new services become very large. Moving these benefits forward a few years can create very large benefits – even when evaluated from today’s perspective.
An alternative approach is taken by Pociask; he focuses on jobs created directly and indirectly by investment in broadband infrastructure: he estimates 166,000 jobs created in broadband service providers, 71,700 jobs created in equipment providers, and 974,000 indirect jobs created elsewhere in the economy using the notion of a “multiplier” between direct jobs created and indirect jobs created.26 Most references to economic studies on the benefit of broadband are to these two reports; there do not appear to have been substantive additional attempts to quantify numerically the economic benefit of broadband adoption. International competitiveness is a theme in many countries’ discussions of broadband. In the United States, the observation is often made that in spite of its leadership in developing the internet and broadband technology, the U S is not the fastest adopter of broadband and other countries who currently have higher penetration or may achieve higher penetration in the future may acquire substantial and persistent economic advantages.
26 Pociask, Stephen. Building a Nationwide Broadband Network: Speeding Job Growth. TeleNomic Research, LLC, Herndon, VA. February 25, 2002. <http://www.newmillenniumresearch.org/event-02-25-2002/jobspaper.pdf>
Broadband Demand Study – Final Report 20
Specific applications Another common approach by proponents of broadband is to list a set of appealing applications and suggest that increased access to these applications should motivate efforts to accelerate broadband deployment. Application Taxonomy Typical emphasized broadband applications are:
• Entertainment Video and Audio
• Games
• Education
• National Security and Digital Government
• Teleworking
• Telehealth as well as other miscellaneous applications. We review each here. Entertainment Video and Audio Since streaming audio and video at better than novelty quality are simply not feasible over narrowband, it is not surprising that broadband users are much more prolific in their consumption of streaming media (for example in a September 2001 study by McKinsey, 57% of broadband users compared to 33% of narrowband users streamed audio and 37% of broadband versus 11% of narrowband users had streamed video at least once in the prior month27). But after experimenting, many broadband users do not become habitual consumers of streaming
27 McKinsey & Co., The Broadband Opportunity, September 2001, p. 10.
audio and video.28 Video is worse than audio: although audio quality over broadband is comparable with other high quality audio sources available to consumers, current typical broadband rates of ADSL and cable modems and the ability of PC’s to process video without interfering with other tasks are impediments to the consumption of streaming video.29 Other issues with widespread adoption of consumer streaming media include:
• the fact that the typical decoding device (a PC) is often not located where consumers want to enjoy streamed content (necessitating adoption of appropriate home networking and distributed devices by consumers)
• well publicized issues over copyright, fair use, piracy, and availability of highly desirable (“Hollywood”) content to users, requiring political, legal, commercial, and technical issues to be addressed.
Downloaded audio (as opposed to streaming audio) continues to be a very popular in spite of the suspension of access via Napster – access has moved to other peer-to-peer applications and most downloaders report
28 According to a 2001 study by Arbitron and Coleman “Online media are not yet generating habitual use. The challenge of converting streaming audio trial into habitual use is not unique. It is also true for other Internet media, as 37% of [broadband users] have ever used downloaded audio, 24% have ever watched streaming video, and 46% have ever used downloaded video. The “used in last week” levels for each of these media are 12%, 5% and 3%, respectively.” (Rose, Bill and Warren Kurtzman, Broadband Revolution 2 – The Media World of Speedies. Arbitron Webcast Services and Coleman Insights. <http://www.arbitron.com/downloads/broadband_2.pdf>, p. 18) 29 ibid, p. 28.

Broadband Demand Study – Final Report 21
increasing download activity – and downloaded video has been increasing in popularity. Broadband should be attractive to heavy downloaders since it reduces the download time substantially, but this trend will likely be strongly affected by the outcome of commercial and legal struggles that could substantially reduce downloading as a motivator for broadband usage, especially in the near term. Although streaming media entertainment content is frequently touted as the necessary ingredient for increased adoption of broadband, it is not clear how quickly the problems above can be resolved nor whether it can be as strong a driver for broadband demand if content owners are able to charge profit maximizing prices. On the other hand, it appears there will likely be continued experimentation with streaming media content and business models, particularly as broadband penetration increases (and hence so does the market for content uniquely created or packaged for broadband). A salient example in this direction is Real Networks subscription service targeting broadband users with an assortment of games, music, sports, and news clips; the service had signed up nearly a million users by September, 2002 at $9.95 each.30 Games Games are a success story for broadband usage: online time spent on entertainment grows from 14% of total time for narrowband to 32% for broadband, with 59% of broadband entertainment in the form of games.31
30 Peter Grant, “Comcast Posts Strong Growth In Cable-Modem Subscribers,” The Wall Street Journal, October 29, 2002. 31 McKinsey & Company, ibid, p. 45.
Broadband enables more convenient download of games and, importantly, low latency connections that allow networked game play of so called “twitch games.” Current generation of game consoles are intended to permit connection to broadband, allowing networked games to be played on home video game consoles in addition to PC’s.32 Education Increasing the availability and effectiveness of education is an attractive societal and governmental policy goal. A key and unresolved challenge, though, will be whether sources of educational content and business models can be found which produce effective education at a price that broadband consumers are willing to pay (a similar problem to finding a successful business model for providing entertainment content other than the “for free” Napster model). Currently, willingness to pay for online education is substantially below what traditional creators of such content expect to charge based on their normal distribution channels.33 Moreover, traditional avenues for education (particularly colleges) have other value to students than efficiency of education; the “brand name” of the institution may also be quite valuable. Current college
32 “Console Wars,” The Economist, June 20, 2002. 33 Sage Research reports that 14.3% of consumers expressed a willingness to pay for continuing school education online but “…the most common amount of money consumers are willing to pay per college credit is $50 – far less than what they would be charged by online universities today. So how will universities develop sustainable business models? Most likely they will need sheer numbers of students in order to achieve profitability” (Sage Research, Customers at the gate: Mounting Demand for Broadband-enabled Services, February 2002.)
Broadband Demand Study – Final Report 22
students, while avaricious broadband users, do not seem attracted to a cyberspace only education.34 National Security and Digital Government The national security motivation for broadband relies on the implication that a broadly deployed broadband network would increase bandwidth available to communicate between government agencies and with the public in times of crisis and could lead to a more robust network infrastructure overall (itself less vulnerable to attack due to the diversity of high bandwidth connections between information sources and sinks), as well as implicitly supporting training of security oriented employees and communication between security functions.35 A democratic society that benefits from a high flow of information between the government and the citizenry can exploit broadband both to improve the flow of information to the public (already a success story) and to involve the public in government (where less progress has been made).36 These applications, as a rule, are not uniquely enabled by broadband versus narrowband, but broadband is helpful to the extent it increases individuals’ use of the internet (and hence their likelihood and effectiveness in dealing with political and government issues) and also its facilitation of any corresponding multimedia content.
34 Pew Internet and American Life Project, The Internet Goes to College, September 15, 2002 35 ibid, Mehlman, Bruce. 36 UCLA Center for Communication Policy, ibid, p. 18.
Teleworking Teleworking is often advocated as a way to improve quality of life for employees (although there is some debate over whether the advantage to the employee of flexibility offsets the intrusion of work into location and times previously reserved for other activities) and as a way to reduce traffic congestion and time wasted in commuting to workplaces. The simplest way that broadband can support teleworking is by making the worker’s network performance independent of whether they are located at home or at an office. However, this requires a bandwidth substantially higher than typical current broadband connections as the actual performance typically lies between a narrowband connection (56 kbps) and what a user might experience at work (10,000 kbps). A second and critical distinction relative to narrowband is the “always on” character of a broadband connection, which promotes the kind of multi-tasking between online activities, phone, and other tasks that a worker would be used to in an office environment. Indeed, a substantial fraction of broadband users do telecommute at least part of the time, broadband seems to have been helpful in their integrating work, home, and community life, and they tend to see broadband as beneficial to their work.37 Elsewhere in this report we describe new primary research in understanding how teleworkers relate to broadband technology. Telehealth The role of broadband in health care revolves around two main applications:
37 Ibid, Pew Internet Life Project, pp. 18-19.

Broadband Demand Study – Final Report 23
• facilitating remote diagnosis and treatment and collaboration between physically separated health specialists
• high quality in-home monitoring of and interaction with patients.
Consumers themselves are unlikely to drive investments in telehealth and, with increasing cost pressure within the health provider industry, we should expect the success of broadband applications of telehealth to depend primarily on whether they reduce operating costs of hospitals and clinics. Miscellaneous Ecommerce is an important application in both narrowband and broadband, but broadband users are more active shoppers and tend to be happier with online shopping.38 Internet telephony to date has largely emerged in three applications: in the core of newer long distance networks (largely invisible to voice customers of these networks), as a desktop telephone solution in new buildings in which a single local area network serves both telephones and computers, and as a PC application in which low voice quality is offset by the opportunity to avoid high international tolls. Telephony could be more universally integrated into broadband links, but the pace of this will be limited both by the fact that a functioning installed network already satisfies most telephony requirements (which are only slowly growing), by the business interests of current
38 Ibid, McKinsey & Company, p. 10.
telephony providers, and by the pace of evolution of the regulatory framework for voice services. An extension of telephony that would strongly benefit from broadband is video telephony – of interest since first demonstrated in the 1960’s. However, substantial uncertainty remains about how and when this will emerge as an important application and the extent to which broadband will enable it.39 E-appliances can be thought of as internet enabling many more devices to be attached to the internet – for example refrigerators, lights, security systems, etc. To the extent such networked devices need to communicate beyond the local environment, the “always on” characteristic of a broadband connection will be very helpful. Higher bit rates will usually be much less important since much of the information exchanged between such appliances will not require large bit rates (with the potentially important exception of streaming media such as a monitoring camera within a security system being viewed from a remote location). Even a potentially compelling application can end up having little actual effect on broadband demand if it is not available over the “flavor” of broadband that most subscribers purchase. One reason is differences in bandwidth already discussed, but another is active choices by service providers to restrict access to certain
39 See Kraut, Robert E. and Robert S. Fish, “Prospects for Videotelephony,” in Finn, Kathleen et al., eds., Video-Mediated Communication, Mahwah, NJ: Lawrence Erlbaum Assoc., 1997, for a balanced discussion of the potential for videophones.

Broadband Demand Study – Final Report 24
applications.40 This may be for reasons of meeting traffic engineering expectations (and the related economic expectations) when resources are shared – a cable based operator may be sharing bandwidth among multiple subscribers – or may related to a desire by the service provider to control revenue generation associated with a particular application. An example of the latter would be cable companies’ restrictions on the delivery of streaming video via cable modems; we might anticipate similar concerns by phone companies regarding offering of multiple additional phone lines by an ISP over a DSL connection. Beyond the Killer Application Part of the angst over broadband deployment rests on the lack of an identified killer application, and indeed part of the justification for creating taxonomies of potential applications of broadband is the search for such an application. A killer application is one so compelling and so dependent on a particular infrastructure that the application by itself can motivate the necessary infrastructure investment. But killer applications are easier to determine in hindsight than to predict. To the extent a killer application exhibits substantial network externalities this will be even more true – the adoption rate can be expected to be quite low for some period (during which time the role as a killer application will not be validated by evidence) until a critical mass is reached, at which point adoption proceeds much more rapidly than a similar application without network externalities.
40 Jonathan Kim, “Cable Firms Faulted for Restrictions on Internet Service,” Washington Post, June 28, 2002, Page E03.
Although it simplifies (and may accelerate) adoption dynamics for broadband to have a single clear killer application, it may not be necessary. The current dominant driver for broadband adoption is simply accessing the web and performing mostly current applications more quickly and with the convenience of “always on.”41 And user satisfaction with broadband after adopting it for these reasons is quite high.42 A pragmatic approach to the question of a killer application might be to support broad innovation in applications and rely on “natural selection” to find applications that ultimately end up playing a substantial role in infrastructure investments, in the meantime relying on “better web access” as a motivator. Indeed, it is not clear that the most important applications will be in the area of high value “content,” an assumption frequently made and captured in the phrase “content is king.” While it is true that most users view the internet primarily as a source of content and information – the most popular metaphor for the internet is “library”43 – the highest popularity application is actually a communication application – email – for both narrowband and broadband users.44 Communication applications tend to exhibit high network externalities and could end up driving most broadband bit traffic.45 Examples include various types of messaging, a shift to carrying voice traffic on broadband
41 Ibid, Pew Internet Life Project, pp. 2-3. 42 Arbitron and Coleman note that 86% of home broadband users were “extremely” or “very satisfied” in 2001, remaining consistent with 85% in 2000 (ibid, Arbitron & Coleman, p. 8). 43 Ibid, Pew Internet Life Project, p. 17. 44 Ibid, Department of Commerce, p. 31 and UCLA, p. 17. 45 Odlyzko, Andrew. “Content is not King,” January 3, 2001, <http://www.dtc.umn.edu/~odlyzko/doc/history.communications2.pdf>

Broadband Demand Study – Final Report 25
connections, and the sourcing by individuals of content such as pictures and video (the manifestation of individuals’ interest in “publishing” on line can already be seen in the rising popularity of online diaries known as web logs or “blogs” and indeed, broadband users are already showing a greater propensity to create and manage their own content than do narrowband users).46 Rather than viewing a dichotomy between content and communication, another perspective would be to consider content as a pyramid with a low volume of content that is valuable to a very large population at the top (“Hollywood” content and mass media) and with a potentially very large amount of content that is valuable to a few at the bottom (person-to-person communication). In between lay various intermediate combinations, such as specialized training material, local government information, and multi-person collaborative work. The societal impact of each layer of content in the pyramid is the product of the amount of content times the average number of individuals for whom each instance of content is valuable. It is not clear whether this product will be higher at the top of the pyramid, at the bottom of the pyramid, in between, or indeed whether it is necessarily true that any particular layer of the pyramid will dominate the others. Again, a pragmatic approach would be to encourage the formation of content at all layers of the pyramid, and in particular content that is enhanced or enabled by broadband connectivity (content that includes large file sizes, various types of streaming media, or relies on always on connectivity).
46 ibid, Pew Internet Life Project, p. 3.
A particular implication of content creation by a large number of users is the question of symmetry versus asymmetry in broadband. To the extent users create substantial amounts of content and embrace streaming, email, and peer-to-peer distributed storage networking to share content, the need for symmetric high speed access will increase. This can be an issue both with particular choices of technology (e.g., the asymmetry implicit in ADSL) and the network traffic engineering and business models of service providers.
Industry-specific benefits
The technology and telecommunications industry have seen precipitous reversals of fortune since peaking at the turn of the century. A more rapid rate of adoption of broadband would benefit many participants in these industries. To the extent aggressive developments in these industries are thought to have played a substantial role in productivity gains for the economy as a whole in the 90’s, a case can be made for minimizing disruption during the current downturn so that continued productivity gains will be achievable via technology and communications industries in the future.
← Number of Messages →
Mass media
Group communication
Person-to-person communication

Broadband Demand Study – Final Report 26
So, Then, What Really Mediates Broadband Adoption Rates
From the preceding discussion, there seem to be a number of potential drivers for broadband demand. Here, we summarize and comment on the salient drivers.
Availability
This is largely assumed to have receded as an issue except in rural and economically disadvantaged populations (fostering an extension to the “digital divide” discussion). Nonetheless, availability plays a role in supply side dynamics, particularly competition, though we will not discuss this further here.
Price
Price is critical, though complicated by intense interactions between essentially all supply and demand side issues in setting price and price elasticity. An example is consideration of whether an aggressive effort by technology suppliers to reduce the cost of broadband infrastructure would increase the rate of adoption; if service providers set prices to maximize profitability in a monopolistic or oligopolistic framework, cost reduction will be reflected as increased supplier profit levels rather than decreased service prices and increased rate of adoption.
Applications and Content
Explanations of applications’ and content’s roles in driving adoption are very diverse, leading to a possibility of substantial divergence in proposals to affect demand through application and content creation. Positions include:
- Hollywood content is the key; efforts to reduce content owner reluctance to make such content available are critical. Or the opposite position – Hollywood content will only be marginally significant and the key driver for adoption will be communication between individuals (person-person, person-machine, machine-machine).
- Content is not a key driver; adopters of broadband value the improved experience of broadband by itself as evidenced by very low churn rates among broadband subscribers.
- There is a smorgasbord of promising applications, and with so many important possibilities, a killer application will surely emerge. A slightly different approach is to state that, whether they are economically potent enough to drive broadband adoption or not, there are many applications of broadband that society would and should value.
Many observers point out the critical role of externalities in adoption. In communication based technologies in particular we typically see two different types of externalities playing a role: network externalities, in which the value to a particular adopter increases as others adopt based on the connections created, and complementary product externalities, in which the value of adoption increases as complementary products are introduced (and

Broadband Demand Study – Final Report 27
conversely, the value of the complementary products increases as adoption of the original service or product increases). Indeed, such externalities can be sufficient as an explanation of why adoption takes a substantial time after availability (that is, externalities can form an alternative simple explanation to that of price and price-elasticity). A characteristic of adoption curves in the presence of externalities is slow initial adoption followed by very rapid adoption after “critical mass” is reached. Externalities also suggest policies of “priming the pump” to decrease the time to critical mass.
The Overall Sense of the Discourse
The discourse on broadband appears to have cooled since early in 2002 as many participants start to describe the broadband adoption process as proceeding at a reasonable pace. This is by no means universal, and those parties most strongly affected continue to express substantial concern (for example, the technology industry). Regardless, the belief that rapid adoption is beneficial is broadly held. The result is a general sense of the value of pursuing some initiatives designed to spur adoption but without the level of support and priority of a national initiative akin to putting a man on the moon.

Broadband Demand Study – Final Report 28
Estimating Consumer Preferences for Internet Access Service
Abstract. Data obtained from a nationwide mail survey during September and October 2002 are used to construct a profile of residential Internet access, and estimate consumer preferences for bundled attributes, “always on” connection, cost, speed, installation and reliability. Preliminary analysis suggests about 19 percent of the population have a high-speed connection, and the mean price paid per month for dial-up and high-speed access is $17.51 and $40.76, respectively. Econometric estimates show that consumers are willing to pay $13.25 to $39.12 for more reliable service, $8.22 to $32.15 for faster service, and $0.91 to $17.29 for always on connectivity. High-speed users value all attributes higher than other users, while higher income users value attributes more highly than lower income users.
November 12, 2002
I. Introduction Information technology (IT) and advanced communications are playing an increasing role in national productivity growth, the creation of new network-based activities, and improving education and living standards.47 From 1997 to 2001 the percentage of the US population that use computers increased from 53.5 percent to 65.6 percent, and Internet use increased from 22.2 percent to 53.9 percent (NTIA 2000 & 2002, Bureau of Labor Statistics (BLS) 2001). The importance of access to advanced communications for continuing socioeconomic progress is reflected in recent remarks by President Bush (2002) who states that the US “must be aggressive about the expansion of broadband technology.” Accordingly, both industry and government are debating possible initiatives that would increase the deployment of broadband infrastructure. Many of the proposals discuss the technological virtues of the infrastructure, and concentrate on measures to stimulate the supply of broadband. These proposals include universal service provision, providing tax incentives to service providers to build out broadband networks, and liberalization of telecommunications markets.48
On the demand-side, broadband subscription rates during the “early adopter” period from 1998 to 2001 have outpaced color television, cellular telephone, pagers and VCRs (NTIA 2002). Recent estimates from the BLS (2001) and Grant (2002) indicate about 13 percent of households subscribe to broadband Internet, and J.P. Morgan (2001) forecast strong growth in residential broadband subscribers to 48 percent of households in 2005. However, while these estimates provide some optimism to a telecom industry slowed by the economic downturn and financial uncertainty, they provide very little specific information about consumer behavior toward broadband Internet subscription. Besides econometric studies of Internet access choice by Goolsbee (2000) and Varian (2002), which consider the trade-off between access speed and subscription
47 See National Telecommunications and Information Administration (NTIA; 2000), Bakos (2001), Borenstein and Saloner (2001), Jorgenson (2001), Litan and Rivlin (2001), and Röller and Waverman (2001). 48 Federal Communications Commission (FCC; 2001 & 2002) data indicate that about 70 percent of US households have access to cable modem service, and 45 percent have access to DSL at 2001.

Broadband Demand Study – Final Report 29
price, there is limited research examining the service attributes preferred by consumers, their demographics, and their willingness to pay (WTP).
This study uses stated preference (SP) data, obtained from a nationwide mail survey of 386 residences during September and October 2002, to examine US residential demand for Internet access. Survey data are used to construct a profile of representative Internet access and use, and estimate consumer preferences for bundled Internet access attributes, “always on” connection, cost, speed, installation and reliability. By estimating the trade-offs consumers face in their decision, analysis of survey data provides information for the design, pricing and marketing of more effective Internet access services. Empirical results may also prove useful for policy makers debating the “digital divide” and policies that promote access to the Internet, e-commerce and educational opportunities.49 Section II reviews previous studies of residential Internet demand, and a theory of demand is proposed in Section III. Section IV discusses data collection and econometric methods. A profile of residential Internet access and use is presented in Section V. Section VI estimates consumer preferences for alternative types of Internet access, and Section VII presents conclusions.
II. Previous Studies of Internet Demand From 1990 to 1999 additional residential telephone lines from US households increased from 3.9 to 23.7 million (FCC 2002). The purchase of a second telephone line allowed many dial-up Internet users to simulate one aspect of the always on feature of broadband by using the Internet and placing telephone calls at the same time. Since such users are likely early adopters of broadband, studies of the demand for telephone lines dedicated to Internet access provide a useful starting point for analyzing the demand for broadband.
A. Additional Lines Dedicated to Internet Access
Cassel (1999) uses survey data for about 30,000 respondents in 1997 to ascertain the characteristics of individuals with additional lines. She finds additional line ownership is positively associated with household size and income, households with teenagers, and access to the Internet with a PC and dial-up telephone modem. Cassal explores whether respondents with additional lines would be interested in 56 kbps Internet access for the monthly price of $10 to $30, or high-speed use access for $30 to $75. Interest is low across all consumer types, perhaps due to the higher cost. Results suggest that users require more speed and other attributes (such as always on functionality) before they are willing to pay up to $70 per month.
When examining data for 11,458 households, Duffy-Deno (2001) finds about 22 percent of the sample have two or more telephone lines, and the most frequently cited reason is for use with a PC and modem. By combining survey data with FCC (1998) prices, Duffy-Deno estimates a logit model of residential demand for additional access lines in the US. The 49 “Digital divide” refers to the perceived gap in computer and Internet use between high and low income households, educated and less educated populations, white and minority populations, and urban and rural areas (NTIA 2000, Compaine 2001).
Broadband Demand Study – Final Report 30
average household price elasticity of demand is -0.59, which is reasonably elastic compared to received estimates for primary telephone line demand. He concludes that moderately high sensitivity to the price of additional lines has implications for the digital divide debate. Since second line prices often exceed primary line prices because of different Federal charges, such charges may unintentionally dissuade households from obtaining “broadband like” access via a second line.
Eisner and Waldon (2001) argue that latent residential demand for broadband is reflected in the simultaneous growth of additional telephone lines and online service subscriptions. The decision to subscribe to a second line and an online service is modeled using bivariate probit and survey data for 7,539 households in 1995. Model estimates show a positive correlation between the probability’s of subscribing to a second line and an online service, respectively. They conclude that the strong tie between the decision to purchase an additional line and subscribe to an online service is evidence of increasing consumer demand for broadband.
B. Broadband Internet Access
Addition of transport lines from the home partly simulate the always on attribute of broadband but provide no increase in speed. As more high-speed access services and bandwidth-intensive applications are introduced consumers are less likely to accept narrowband communications, and have greater reason to purchase a single broadband line from the home. Accordingly, more recent analyses of Internet demand consider the different speeds provided by dial-up, cable-modem, and DSL, and how budget and time constraints, and demographics affect household’s choice of access.
Goolsbee (2000) examines demand for broadband Internet access using SP data from a 1999 survey of about 100,000 consumers. A probit model is estimated relating the probability of choosing cable modem Internet access to price and demographics such as years online, age, income, and education. After controlling for individual demographics, model results show an increase in the likelihood of cable modem access for people with lower prices. The elasticity of demand for cable Internet with respect to price ranges from -2.8 to -3.5.
Hausman et al (2001) argue a small cross-price elasticity of demand between broadband and dial-up is evidence that dial-up does not constrain broadband prices. They test this hypothesis by estimating a reduced-form demand-supply model that relates the price of broadband to dial-up price, presence of RoadRunner service, and demand and cost variables. Model results can not reject the hypothesis that dial-up prices do not constrain broadband prices, and Hausman et al conclude that broadband Internet is a separate relevant market for competitive analysis. However, the finding of zero cross-price elasticity should be qualified to some extent as they do not control for variation in quality-adjusted prices of Internet access. A more precise measure of cross-price elasticity requires explicit consideration of how household’s trade off prices and other attributes when choosing their Internet access.
Using a sample of 5,255 households in 2000, Rappoport et al (2002) estimate a nested logit model where the first branch considers the choice between dial-up and broadband, and the second branch considers the choice between cable and DSL (given broadband). Model estimates provide own price elasticity’s for cable and DSL of –0.587 and –1.462, respectively,

Broadband Demand Study – Final Report 31
and also suggest that dial-up access is not a substitute for broadband users. However, cross-price elasticity’s of 0.618 and 0.766, respectively, indicate that cable and DSL are strong substitutes for one another.
Varian (2002) uses data from the “Internet Demand Experiment” project to estimate how much people are willing to pay for different levels of Internet speed. During 1998 and 1999, 70 users at UC Berkeley were able to choose various bandwidths from 8 to 128 kbps through a degraded ISDN line. Varian estimates reduced-form demand for bandwidth with own-price elasticities ranging from -1.3 to -3.1. Cross-price elasticities are generally positive and indicate that one-step lower bandwidths are perceived as substitutes for chosen bandwidth. A regression of time costs on demographics shows that users in technical and administrative jobs place significantly higher value on their time, and people are not willing to pay very much for bandwidth. Unless new applications and content are forthcoming, or broadband prices fall, Varian suggests there may not be a large surge in broadband demand in the near future.
C. Summary
Choice model estimates indicate the demand for dial-up access is sensitive to both dial-up and broadband prices, but early broadband adopter’s demand is sensitive to broadband prices only. Generalization of these findings to the wider population is somewhat problematic given that “late adopters” are likely to emphasize other attributes than price and speed. Future studies must consider not only the opportunity cost of online activity, but how variation in attributes such as always on connectivity, service reliability, and ease of installation, affect the household’s choice of access. Finally, a household’s ability to combine different attributes with time online to save time and income from Internet activity also warrants attention.
III. Theory Theory and received evidence suggest households use the Internet for enjoyment, to save money, and to save time. Accordingly, the labor-leisure utility maximization model is extended by assuming households desire income (y), leisure hours (l), and online activity.
A. Model of Internet access choice Online activity is a function of the type of Internet access i = 1, 2, … , n, and hours online (t). Money is saved from online activity according to the function F(a, x, t), where a is household ability when using the Internet, x = [f, s, r] is a vector of access attributes, f is (always on) functionality, s is speed, and r is reliability of service. Similarly, time is saved according to G(a, x, t).50 The general-form optimization problem is:
50 Installation costs can be amortized over the life of the service plan and included in pi.

Broadband Demand Study – Final Report 32
tily ,,,
max U(y, l, i, t) (1)
subject to y = yo + wh – pi + F(a, x, t) h = T – l – t + G(a, x, t) where yo is non-wage income, w is the hourly wage, h is hours worked, pi is the flat-rate price of Internet access i, and T is total number of hours available. (1) shows that online activity saves money (or generates income), but costs pi and uses t. Similarly, online activity saves time, but uses t. Insight into how prices, household ability, and Internet functionality and speed affect the household’s choice of Internet access is gained from a closed-form solution to (1). A tractable solution is obtained by conditioning the household’s choice of
y, l, and t upon Internet access i. Given Internet access i, and assuming CES utility, Fi = txa i21 αα and Gi = txa i
21 δδ , the
household optimization problem is:
tly ,,
max ρρρρ φφφ /1321 )( tlyUi ++= (2)
subject to
iiiiiiio
i txaptxatlTwyy 2121 )( ααδδ +−+−−+=
Assuming second-order conditions are met, demand functions are obtained by combining any two first-order
conditions to eliminate U and λ, and substituting into the budget constraint (See Appendix A). Substituting optimal demand
functions for y, l, and t into (2) provides the conditional indirect utility function for Internet access i:
σσσσσσ φφφ −−− ++
−+=
1/113
121
*
)( i
io
i cwpwTyU (3)
where ci = 2121 ααδδii xaxwaw −− is the opportunity cost of time online, and σ = 1/(1 - ρ) is the constant elasticity of
substitution.

Broadband Demand Study – Final Report 33
B. Summary
Equation (3) allows conditional indirect utility functions to be obtained for each alternative type of access i, and the household
chooses Internet access i when *iU > *
jU for j ≠ i. Terms that vary over i (i.e., pi, fi, si, and ri) explain the trade-offs faced
by households when choosing their optimal Internet access service. As such, (3) gives rise to several propositions which suggest a priori signs for economic relationships in the conjoint analysis:
• an increase in the price of access i lowers utility and reduces the likelihood of the household choosing Internet access i;
• always on functionality, speed, and reliability lower the opportunity cost of time online, increase utility, and the likelihood of the household choosing Internet access i; and
• the more skillful the household is in using increased functionality and speed with time online, the greater the price they are WTP for access.
IV. Data and Econometric Method
A. Survey Data for estimating consumer preferences for bundled Internet access attributes are obtained from a nationwide mail survey during September and October 2002. The survey questionnaire comprised of three sections: cognitive buildup; choice task; and demographics. Cognitive buildup asks respondent’s 15 questions about their access and use of IT and the Internet, and provides them with information to form preferences about Internet access service. Respondents are then required to evaluate eight choice questions, and provide answers to nine demographic questions. Prior to implementation, the survey questionnaire was pre-tested on ten respondents during May and July 2002, and refined accordingly.
PA Consulting Group administered the survey. Advance postcards describing the survey to residents were mailed on September 3, and an initial survey package (with the questionnaire and incentive) was mailed on September 6. Thank you/reminder postcards were sent on September 13, and follow up surveys on October 3. When the survey was closed on October 25, 378 completed questionnaires were obtained for a response rate of 32 percent, which is about average for surveys of similar length and complexity (Louviere et al 2000). The mean completion time for each questionnaire was 26 minutes (n = 322).

Broadband Demand Study – Final Report 34
B. Econometric method Conjoint analysis is the primary tool used to estimate the demand for Internet access service. Survey respondents answered a series of eight choice questions. Each choice occasion presented a pair of Internet access options, A and B, that differed by five attributes. Respondents indicated their preferred choice. In addition, respondents indicated whether they would switch to the service they had selected if they were already online, or if they would adopt the service selected if they were not (See Figure B1 in Appendix B for a choice question example). The parameters of the representative individual’s utility function (the marginal utilities of the five attributes) are estimated from observed choices.
Internet access service is described by five attributes.51 Access is always on when no dialup is required for Internet connection, and respondents can use the Internet and place telephone calls at the same time. Cost is the fixed monthly price for unlimited usage, ranging from $10 to $85. Speed describes the time it takes to receive and send information to and from the home computer. Speed is either very fast for uploads and downloads (very fast), or fast for downloads but relatively slower for uploads (fast), or same as dial-up (slow). Installation of Internet access service can be immediate, within one week, and within several weeks. Finally, very reliable Internet access is never disrupted (i.e., there are no service outages); however, with less reliable Internet access users may occasionally experience outages that require customer support. Table 1 summarizes the levels of the five attributes.
Table 1. Internet access service attributes
Attribute Levels Always on (AO) 1 Always on
2 Not always on
Cost per month (COST) $10 to $85
Access speed (SPEED) 1 Very fast (download is 20 × dial-up; upload is 20 × dial-up) 2 Fast (download is 10 × dial-up; upload is 5 × dial-up) 3 Slow (same as dial-up)
Installation (INSTALL) 1 Immediately 2 Within one week 3 Within several weeks
Reliability (RELIABLE) 1 Very reliable 2 Less reliable
Theory indicates that respondents maximize their (household’s) utility of the service option conditional on all other
consumption and time allocation decisions. A linear approximation to the household conditional utility function is:
51 Theory, received evidence, and industry discussion provided feedback on service descriptions, the definition of attributes, and their levels.

Broadband Demand Study – Final Report 35
U* = β1AO + β2SPEED + β3COST + β4INSTALL + β5RELIABLE + ε (4)
where the β’s are parameters to be estimated, and ε is a random disturbance. Note that the alternative attributes have been
coded for econometric estimation so that the expected signs for β1 through β5 are negative. For instance, utility is expected to
be less when cost increases so β3 < 0, but we also expect β4 < 0, as higher values for INSTALL imply less desirable
outcomes. The hypothetical utility of each service option, U*, is of course not revealed. Instead, what is known is which option has the highest utility. For example, when a respondent chooses A over B and then the status quo (SQ) over A, it is assumed that U*A > U*B and U*SQ > U*A. Therefore, for this kind of dichotomous choice data, the method of estimation is not linear regression, but rather a form of maximum likelihood analysis called bivariate probit. Essentially, the probability of the outcome
for each respondent-choice occasion is written as a function of the data and the parameters (β’s). The probability of the entire
set of outcomes (all individuals, all choice occasions) is called the likelihood, and this is maximized for choice of the parameters (See Appendix C for further description of the estimation method). Interpretation of the parameters as marginal utilities is the same as a partial derivative: the increase in utility for a one unit increase in the variable. For example, when a less reliable service (RELIABLE = 2) can be made more reliable
(RELIABLE =1), utility would increase by β5 units. Since utility does not have an understandable metric, it is convenient to put
this change in dollar terms. This is done by employing the economic construct called willingness to pay. The WTP for a one unit decrease in RELIABLE (the discrete improvement from less to very reliable) can be interpreted as how much more the service would have to be priced to make a consumer just indifferent between the old (cheaper but less reliable) service and
new (very reliable) service. The required change in cost to offset an increase of β5 in utility is, from equation (4), β5/β3. This is
true for any attribute. The WTP for a one unit improvement in that attribute is the ratio of its marginal utility to the marginal utility of COST. Individuals may not have identical preferences. An individual’s preference toward speed, for example, may differ because of observable demographic characteristics, or may be idiosyncratic. This issue can be examined by estimating (4) on sub-samples of the data. This has the effect of allowing all parameters to be different for individuals in different socioeconomic groups. It is also possible to observe differences in the marginal utility of specific service attributes by interacting those characteristics with demographic variables. For instance, suppose individuals with different levels of education value speed differently. A model that captures this difference is:
U* = β1AO + (β2 + ηEDUC)×SPEED + β3COST + β4INSTALL + β5RELIABLE + ε (5)

Broadband Demand Study – Final Report 36
where η is an additional parameter to be estimated, and EDUC is education.52 Here, the WTP for a one-unit improvement in
speed is β2/β3 when education is not important. When education is important, the WTP for a one-unit improvement in speed is
now:
3
2 )(βηβ EDUC+
(6)
and is evaluated at different levels of education. Finally, an individual's preference toward speed may differ because of unobservable characteristics. One parameterization of this is the random parameters model. For a random speed parameter, for example, the model is:
U* = β1AO + (β2 + ν)SPEED + β3COST + β4INSTALL + β5RELIABLE + ε (7)
where ν is a zero-mean, white noise disturbance uncorrelated with the attributes or ε. The additional parameter now estimated
is the variance of ν. It is possible to estimate this variance with survey data because there are multiple observations (i.e.,
choice occasions) for each individual. Mean WTP for an improvement in speed is β2/β3, as in the fixed parameter case.
V. Internet Access, Attributes, and Demographics Before reporting econometric estimates of marginal utilities and WTP from conjoint analysis, survey data are used to examine respondent’s access to, and use of, IT and the Internet, their attitude towards various Internet attributes, and demographics.
A. IT, Internet Access and Use
Computers and telephones. 78 percent of respondents have at least one PC or laptop in the home, while 32.6
percent have two or more PCs or laptops in the home. 88.7 percent of respondents have at least one telephone line from the home, and 24.1 percent have a second line. The most frequently sited reason for a second line is “for dial-up Internet access – to free up the primary telephone line for voice calls” (48 percent of homes provide this reason), followed by “work-at-home/home business” (21.4 percent of homes provide this reason). The average price paid per month for a second telephone line is $25.38, which is somewhat higher than estimates of $7.62 per month from Crandall and Jackson (2001), but in the range of $7.70 to $47.62 provided by Hausman et al (2001a).
52 As shown in equation (3), individual household demographics cannot be included in the utility function (4) as separate arguments since they do not vary across all Internet access alternatives.
Broadband Demand Study – Final Report 37
Awareness of service availability. Awareness of high-speed service availability is relatively high for cable modem and DSL technology. When asked “which ways of getting high-speed access are available in your neighbourhood,” 15.3 percent of respondents replied “not sure” for cable modem, 30 percent for DSL, 64.7 percent for fixed wireless, and 68.2 percent for satellite. 51.3 percent of respondents with no Internet access have high-speed service available in their neighbourhood, as do 80.6 percent of respondents with dial-up access. Internet access. 71.7 percent of homes connect to the Internet. 71.8 percent of these homes access the Internet with a dial-up connection, two percent use WebTV, and 26.2 percent use a high-speed connection. Survey data suggest that 18.8 percent of the population have a high-speed connection at home.53 The most frequently sited reason for high-speed Internet access is “speed is appropriate” (34 percent of homes), followed by “I like the always on connection” (24.5 percent of homes), and “to free up my telephone line for voice calls” (24.3 percent of homes). The mean price per month for dial-up and high-speed access, respectively, is $17.51 and $40.76. These prices are similar to estimates by Glasner (2001), and Ames (2002) at December 2001 of $15 to $25 per month for dial-up, $39.40 for DSL, and $51.67 for cable Internet. Interestingly, survey respondents that have dial-up access and a second telephone line dedicated primarily to dial-up access pay an average price of $45.03 per month to simulate the broadband experience – i.e., $23.75 for dial-up and $21.78 for a second telephone line. Internet activity and experience. On average, 2.28 household members go online from home for a total of 14.35 hours per week. High-speed users are more active with 19.44 hours of online activity per week compared to dial-up users with 12.55 hours of online activity. Including home, school, work and other locations, high-speed users have been going online for 3.48 years compared to 3.22 years for dial-up users. Further, 63.3 percent of high-speed users have more than five years of online experience, while only 48.2 percent of dial-up users have the same experience. When asked whether they use a high-speed Internet connection at any location outside of the home, 94.6 percent of all respondents (i.e., those with and without Internet access at the home) indicate they have used high-speed Internet at either a cyber café, library, place of employment, school, friend/relative’s house, or other location. This suggests a large segment of the population have experienced high-speed Internet access service. Internet activity data are obtained by asking respondents “how often do you and other household members do each of the following activities: email and instant messaging (IM); use search engines or purchase products; play games or gamble; share music files or photos; banking, trading stocks, or bill payment; and download movies to view on the PC.” Table 2 and Table 3 show Internet activity for the most extremes responses, “many time a week”, and “never”, respectively. Email and IM, and search engines and product purchases are frequent activities for both dial-up and high-speed users, which is consistent 53 Estimates of PC ownership and Internet access are slightly higher than the BLS (2001) at September 2001 which indicate that 64.4 percent of the population have a computer or laptop in the home, and 51.8 percent connect to the Internet from home.

Broadband Demand Study – Final Report 38
with findings from the BLS (2001). As suggested above by the number of hours online per week, high-speed users are more active than dial-up users. The percentage of high-speed users answering “many time a week” (“never”) is higher (lower) for all Internet activities. High-speed users are two times more likely to share music files and photos, bank, trade stocks, and pay bills many times a week than dial-up users.
Table 2. Frequency of Internet activity – “many times a week” Activity All Dial-up High-speed Email & instant messaging 71.4 68.5 79.7 Search engines & purchase products 37.8 29.5 60.8 Play games & gamble 21.0 17.7 30.8 Share music file or photos 10.1 6.8 19.5 Banking, trading stocks, or bill payment 9.8 7.4 16.5 Download movies to view on PC 1.0 0.9 1.3
Note. Cells are percent of respondents using the activity “many times a week.”
Table 3. Frequency of Internet activity – “never” Activity All Dial-up High-speed Email & instant messaging 2.7 2.7 2.5 Search engines & purchase products 6.4 8.2 1.3 Play games & gamble 51.3 53.2 46.2 Share music file or photos 38.4 42.3 27.3 Banking, trading stocks, or bill payment 52.7 56.7 41.8 Download movies to view on PC 95.3 97.7 88.5
Note. Cells are percent of respondents who “never” use the activity. Content. Content providers, such as ABC, Cartoon Network, CNN, ESPN, and RealNetworks Inc. are currently working on entertainment packages with games, music, sports and news clips for high-speed Internet users (Grant 2002). Network economics suggests a critical mass of users is required to leverage the complementarity (i.e., positive network effects) between high-speed demand and the provision of entertainment content. Some insight into this relationship is gleamed from the survey question “what would need to change for you to use the Internet to view entertainment video such as a full-length movie or TV show?” Excluding respondents who “would not use their PC and the Internet to view entertainment content”, Table 4 shows the most important reason is the “ability to view in convenient location (for instance, your TV in your living room).” “More awareness of how to find interesting content”, and “access to a wider range of content” are more important to high-speed users.

Broadband Demand Study – Final Report 39
Table 4. Change needed to use Internet to view entertainment content
Answer All No access Dial-up High-speed Nothing, I would not 46.4 62.5 48.5 30.9 Nothing, I already do 2.3 0.0 1.5 5.9 Ability to view in a convenient location 29.5 20.0 30.5 32.4 Access to a wider range of interesting content 2.6 2.5 2.0 4.4 Better quality picture 4.5 2.5 3.5 8.8 Awareness of how to find interesting content 4.9 5.0 3.0 10.3 Other 9.7 7.5 11.0 7.4
Note. Cells are percent of respondents providing a single answer only.
B. Internet Access Attributes
The “Internet Access Attributes” section of the questionnaire describes and informs respondents about Internet access attributes. Respondents consider their preferences for different attributes when answering the question “how important is (or would be) the attribute of Internet access to you.” A single answer is selected for each question from the following choices, “not important”, slightly important”, “somewhat important”, “very important”, and “extremely important.” Table 5 shows the percent of respondents who indicate the attribute is either a very important or extremely important part of their Internet access. Speed, reliability, and always on functionality are clearly important to high-speed users. Interestingly, reliability of service is important for respondents with no access, dial-up access, and high-speed access. This latter finding supports anecdotal evidence that consumers desire a service they can count on being available whenever they want to use it, with consistent speed (that is as fast as advertised), and any problems that do arise are immediately handled by good customer service.54
Table 5. Importance of Internet access attributes Attribute All No access Dial-up High-speed Always on 49.1 40.3 39.0 87.3 Cost 59.6 48.6 64.6 58.3 Speed 53.6 38.1 46.2 92.4 Installation 33.6 34.2 26.0 54.4 Reliability 66.3 52.0 64.1 89.9
Note. Cells are percent of respondents who indicate attribute is “extremely important” or “very important.”
C. Demographics
Survey data provide a profile of the representative household respondent. The average respondent is a white, 50 year old male, with a two year degree at a college or technical school, who resides in a household with 1.7 other members. He was
54 There may also be concerns about the sustainability of firms in an industry with many recent bankruptcies and company consolidations.

Broadband Demand Study – Final Report 40
employed last month at a location outside of the home, and has annual household income of $71,934. A description of how Internet access varies by income, race, household size, age, education and employment status is provided below. Household income. Table 6 shows that Internet access is positively associated with income. 70.6 percent of respondents with household income below $20,000 have no Internet access. Dial-up access is more prevalent for respondents with income ranging from $40,000 to $80,000, and the income group with the most high-speed access is $80,000 or more. Household size and race. Table 7 indicates that Internet access is more likely in households with two or more occupants, and high-speed access is relatively low for one person households. In Table 8, data provide prima facie evidence that Internet access is consumed by at least 50 percent of the population across all racial groups. High-speed access is extremely low for Native Americans and Hispanics. However, any conclusions here should be qualified because of the relatively low number of Native American and Hispanic respondents.
Table 6. Internet access by income Household income No access
(n=57) Dial-up (n=172)
High-speed (n=66)
Less than $20,000 (n=17) 70.6 29.4 0.0 $20,000 - $39,999 (n=53) 32.1 58.5 9.4 $40,000 - $59,999 (n=62) 17.7 59.7 22.6 $60,000 - $79,000 (n=54) 14.8 74.1 11.1 $80,000 or more (n=109) 8.3 54.1 37.6 Correlation coefficient for linear association between variables ρ = 0.375*
Note. Cells are percent of respondents in the access category. * is significant at the five percent level.
Table 7. Internet access by household size Household size No access
(n=74) Dial-up (n=210)
High-speed (n=75)
1 (n=51) 39.2 54.9 5.9 2 (n=148) 23.6 56.1 20.3 3 (n=67) 10.4 58.2 31.3 4 (n=57) 8.8 68.4 22.8 5 or more (n=36) 19.4 58.3 22.2 Chi-square test for independence of the variables χ2 (8) = 26.87* Correlation coefficient for linear association between variables ρ = 0.179*
Note. Cells are percent of respondents in the access category. * is significant at the five percent level.

Broadband Demand Study – Final Report 41
Table 8. Internet access by race Race No access
(n=75) Dial-up (n=209)
High-speed (n=75)
Asia (n=3) 0.0 66.7 33.3 Native American (n=2) 50.0 50.0 0.0 Black (n=16) 25.0 56.3 18.8 White (n=332) 20.8 57.8 21.4 Hispanic (n=6) 16.7 83.3 0.0
Note. Cells are percent of respondents in the access category. Household age. Internet access is negatively associated with household age, with Table 9 showing “younger households” are more likely to have Internet access. Further, 42.9 percent of households where the respondent is less than 25 years of age, 24.5 percent of respondents aged from 25 to 34, and 26.4 percent of respondents aged 35 to 44, have high-speed access. This finding is consistent with Carey (1991) and Savage et al (1997) who find that younger persons are more open to learning about new technologies such as VCRs, PCs, and broadband.
Table 9. Internet access by age Age No access
(n=78) Dial-up (n=217)
High-speed (n=79)
Less than 25 (n=14) 21.4 35.7 42.9 25 to 34 (n=53) 15.1 60.4 24.5 35 to 44 (n=68) 7.4 69.1 23.5 45 to 54 (n=87) 11.5 62.1 26.4 55 to 64 (n=76) 23.7 63.2 13.2 65 or more (n=76) 44.7 40.8 14.5 Chi-square test for independence of the variables χ2 (10) = 47.34* Correlation coefficient for linear association between variables ρ = -0.239*
Note. Cells are percent of respondents in the access category. * is significant at the five percent level.
Household education and employment status. Table 10 presents Internet access by level of education, and shows a positive association between access and education. A large percentage of respondents with high school education or less do not have Internet access. High-speed access is relatively higher among respondents with college and graduate degrees, perhaps reflecting familiarity with technology, and also a strong recognition of the income and time benefits that can be derived from
broadband delivered education and information services. An insignificant χ2 statistic in Table 11 indicates that employment
status is not related to the type of Internet access.
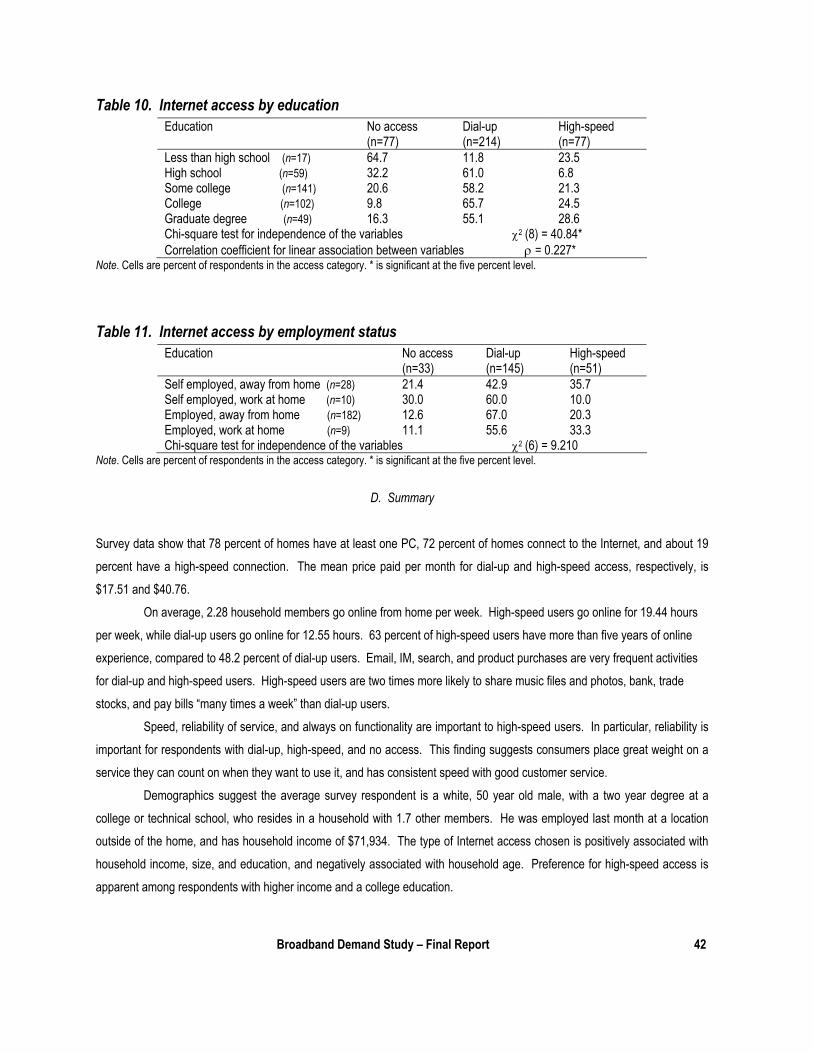
Broadband Demand Study – Final Report 42
Table 10. Internet access by education Education No access
(n=77) Dial-up (n=214)
High-speed (n=77)
Less than high school (n=17) 64.7 11.8 23.5 High school (n=59) 32.2 61.0 6.8 Some college (n=141) 20.6 58.2 21.3 College (n=102) 9.8 65.7 24.5 Graduate degree (n=49) 16.3 55.1 28.6 Chi-square test for independence of the variables χ2 (8) = 40.84* Correlation coefficient for linear association between variables ρ = 0.227*
Note. Cells are percent of respondents in the access category. * is significant at the five percent level.
Table 11. Internet access by employment status Education No access
(n=33) Dial-up (n=145)
High-speed (n=51)
Self employed, away from home (n=28) 21.4 42.9 35.7 Self employed, work at home (n=10) 30.0 60.0 10.0 Employed, away from home (n=182) 12.6 67.0 20.3 Employed, work at home (n=9) 11.1 55.6 33.3 Chi-square test for independence of the variables χ2 (6) = 9.210
Note. Cells are percent of respondents in the access category. * is significant at the five percent level.
D. Summary
Survey data show that 78 percent of homes have at least one PC, 72 percent of homes connect to the Internet, and about 19 percent have a high-speed connection. The mean price paid per month for dial-up and high-speed access, respectively, is $17.51 and $40.76. On average, 2.28 household members go online from home per week. High-speed users go online for 19.44 hours per week, while dial-up users go online for 12.55 hours. 63 percent of high-speed users have more than five years of online experience, compared to 48.2 percent of dial-up users. Email, IM, search, and product purchases are very frequent activities for dial-up and high-speed users. High-speed users are two times more likely to share music files and photos, bank, trade stocks, and pay bills “many times a week” than dial-up users. Speed, reliability of service, and always on functionality are important to high-speed users. In particular, reliability is important for respondents with dial-up, high-speed, and no access. This finding suggests consumers place great weight on a service they can count on when they want to use it, and has consistent speed with good customer service. Demographics suggest the average survey respondent is a white, 50 year old male, with a two year degree at a college or technical school, who resides in a household with 1.7 other members. He was employed last month at a location outside of the home, and has household income of $71,934. The type of Internet access chosen is positively associated with household income, size, and education, and negatively associated with household age. Preference for high-speed access is apparent among respondents with higher income and a college education.

Broadband Demand Study – Final Report 43
VI. Econometric Estimation and Interpretation Section V provides prima facie evidence that speed, reliability of service, and always on are important attributes to consumers when considering Internet access. Econometric estimation of utility functions (4), (5), and (7) will provide more precise information on consumer preferences for Internet attributes, and their WTP. There are 361 usable observations with complete information on the eight choices and the follow-up WTP question . Since each pair of binary choices (A vs. B, and A or B vs. SQ) for each choice occasion represents information on preferences, the starting sample size for econometric estimation is effectively n = 361 x 8 = 2,888. In models where respondent demographic data are used, such as age, education, and income, the sample size is reduced as made necessary by missing values for those variables. Parameter estimates, asymptotic t-statistics, and WTP calculations for the basic model without respondent heterogeneity for specific attributes are presented in Table 12 and Table 13, respectively. Estimates are reported for the full sample (All) and several sub-samples of the data. Sub-samples include:
• respondents with traditional dial-up access through a telephone modem (With dial-up); • respondents with high-speed access (With high-speed); • respondents who are located in areas served by high-speed providers but continue with traditional dial-up access
(Latent high-speed); • respondents with college degrees (College); • respondents without college degrees (Not college); • higher income households, i.e., with annual income greater than $60,000; (Higher income); and • lower income households (Lower income).
t-statistics are obtained by dividing the mean (marginal effect) parameter by its standard error. A t-statistic of about 2
or more in absolute value indicates with 95 percent or greater confidence that the mean parameter is significantly different from zero. A t-statistic between 2 and 1.6 in absolute value indicates with 90 to 95 percent confidence that the mean parameter is significantly different from zero. For example, in the complete sample (n = 361) the marginal effect of AO (always on) is estimated to be -0.148 with asymptotic t-ratio of -3.93. The t-ratio of –0.148/-0.0376 = -3.93 is greater then two, and indicates
that β1 = -0.148 is statistically significantly different from zero at the five percent level. The estimated WTP to go from not
always on to always on service is $5.07, obtained by dividing -1.48 by the estimated parameter on COST of -.029. The data fit all models well, as judged by the statistical significance of most parameter estimates.55 In fact, at conventional significance levels of five percent only the coefficient on INSTALL (installation) is not accurately estimated. This parameter is statistically significant only in the not college sub-sample, and has the theoretically wrong sign in the with dial-up, latent high-speed, and college sub-samples. As such, SP data provide no evidence that consumers place any importance on the difficulty of installing Internet access. Marginal utility parameters for AO, SPEED (access speed), RELIABLE (reliability of service), and COST (cost per month) have signs that are predicted by theory, and are statistically significant. The negative signs imply that individual’s
55 There is no concept of “R2” for these kinds of models.
Broadband Demand Study – Final Report 44
relative utility increases when Internet access service is changed from not always on to always on, when access speed is increased, when cost is decreased, and when access is improved from less reliable to very reliable service. In all samples, the most important attribute of Internet access is reliability of service. Consumers are WTP between $13.25 (Latent high-speed) and $39.12 (With high-speed) for more reliable service. Speed is the next most important attribute ranging from $8.22 (Lower income) to $32.15 (With high-speed). Always on is the third most important attribute ranging from $0.91 (With dial-up) to $17.29 (With high speed). Users with high-speed access value all service attributes higher than any others.56 Those with higher incomes value attributes more highly than those with lower incomes. Those with a college degree value speed more, always on less, and reliability about the same as those without a college degree. The situation is similar when observed heterogeneity is allowed for by interacting demographic variables with certain
attributes. Two models were estimated with interaction variables. One allows EDUC×SPEED and AGE×SPEED interactions.
The other model allows an INCOME×COST interaction. Parameter estimates, asymptotic t-statistics, and WTP calculations for
the model with respondent heterogeneity for the SPEED and COST attributes are presented in Table 14. WTP for speed increases with education and income, and decreases with age. WTP for the latent high-speed sample (i.e., dial-up users located in areas served by high-speed providers) is less than the WTP for the all household types. For all types, WTP for all attributes increases with income. .
56 Since high-speed users already have fast or very fast speed, the WTP estimate can be loosely interpreted as a “willingness to accept” concept. That is, $32.15 is the amount high-speed users would be willing to accept as compensation for a downgrade in speed.

Broadband Demand Study – Final Report 45
Table 12. Parameter estimates, t-statistics, and WTP – by access group
Attribute All With dial-up With high-speed Latent high-speed
β t-stat WTP β t-stat WTP β t-stat WTP β t-stat WTP
AO -0.148 -3.93 $5.07 -0.035 -0.71 $0.91 -0.313 -4.27 $17.29 -0.076 -1.42 $1.87
SPEED -0.332 -8.17 $11.37 -0.322 -5.89 $8.34 -0.582 -8.00 $32.15 -0.359 -6.06 $8.84
COST -0.029 -9.03 - -0.039 -8.76 - -0.018 -4.39 - -0.041 -8.51 -
INSTALL -0.030 -1.31 $1.04 0.035 1.11 -$0.90 -0.014 -0.35 $0.76 0.030 0.89 -$0.73
RELIABLE -0.483 -12.4 $16.54 -0.546 -9.89 $14.15 -0.708 -8.49 $39.12 -0.538 -9.22 $13.25
n 361 x 8 = 2888 189 x 8 = 1512 75 x 8 = 600 167 x 8 = 1336
Table 13. Parameter estimates, t-statistics, and WTP – by demographic group
Attribute College Not college Higher income Lower income
β t-stat WTP β t-stat WTP β t-stat WTP β t-stat WTP
AO -0.098 -1.88 $3.67 -0.185 -3.49 $6.13 -0.200 -4.04 $8.16 -0.120 -2.09 $3.45
SPEED -0.384 -6.61 $14.44 -0.278 -4.92 $9.21 -0.384 -7.27 $15.67 -0.286 -4.56 $8.22
COST -0.027 -6.10 - -0.030 -6.56 - -0.025 -6.19 - -0.035 -6.73 -
INSTALL 0.041 1.31 -$1.54 -0.077 -2.41 $2.53 -0.048 -1.53 $1.94 -0.007 -0.20 $0.20
RELIABLE -0.464 -7.58 $17.44 -0.494 -9.68 $16.36 -0.468 -8.66 $19.10 -0.490 -8.68 $14.08
n 149 x 8 = 1192 212 x 8 = 1696 181 x 8 = 1448 180 x 8 = 1440

Broadband Demand Study – Final Report 46
Table 14. Parameter estimates, t-statistics, and WTP – interactions
Attribute All All Latent high-speed Latent high-speed
β t-stat WTP β t-stat WTP β t-stat WTP β t-stat WTP
AO -0.141 -3.58 $4.75 -0.160 -3.67 $4.32 -0.072 -1.33 $1.78 -0.082 -1.53 $1.75
SPEED -0.460 -5.26 see
below -0.392 -8.29 $10.58 -0.019 -0.12 see
below -0.363 -6.10 $7.74
COST -0.030 -8.85 - -0.053 -9.41 - -0.041 -8.45 - -0.059 -8.64 -
INSTALL -0.034 -1.45 $1.15 -0.018 -0.69 $0.48 0.0259 0.78 -$0.64 0.032 0.95 -$0.67
RELIABLE -0.498 -12.4 $16.77 -0.490 -11.00 $13.23 -0.541 -9.21 $13.36 -0.539 -9.20 $11.49
SPEED×EDUC -0.034 -3.33 - - - - -0.035 -2.50 - - - -
SPEED×AGE 0.006 4.87 - - - - -0.0001 -1.15 - - - -
COST×INCOME - - - 0.003 5.72 - - - - 0.002 4.29 -
n 347 x 8 = 2776 347 x 8 = 2776 167 x 8=1336 167 x 8=1336
WTP for speed WTP for speed WTP for speed WTP for speed
EDUC AGE WTP INCOME WTP EDUC AGE WTP INCOME WTP
G8 25 $11.72 < $10K $7.87 G8 25 $1.39 < $10K $6.44
HS 25 $14.04 $20K - $30K $9.03 HS 25 $3.10 $20K - $30K $7.03
COL 25 $17.51 $40K - $50K $10.58 COL 25 $5.66 $40K - $50K $7.74
G8 50 $6.80 $60K - $80K $12.78 G8 50 $1.45 $60K - $80K $8.61
HS 50 $9.11 $100K - $150K $16.14 HS 50 $3.16 $100K - $150K $9.69
COL 50 $12.59 > $150K $18.58 COL 50 $5.73 > $150K $10.34
Note. G8 is eighth grade education, HS is high school education, and COL is four year college education.

Broadband Demand 47
VII. Conclusions
Data obtained from a nationwide mail survey during September and October 2002 are used to construct a profile of residential Internet access, and estimate consumer preferences for bundled attributes. Preliminary analysis of survey data suggests about 19 percent of the population has a high-speed connection, and the mean price paid per month for dial-up and high-speed access is $17.51 and $40.76, respectively. On average, 2.28 household members go online from home per week – 19.44 hours for high-speed users and 12.55 hours for dial-up users. 63 percent of high-speed users have more than five years of online experience, compared to 48.2 percent of dial-up users. Email and IM, and search and product purchases are very frequent activities for dial-up and high-speed users. High-speed users are two times more likely to share music files and photos, bank, trade stocks and pay bills “many times a week” than dial-up users.
Conjoint analysis is the primary tool used to estimate the demand for Internet access service. Internet access was described by a list of attributes, always on connection, cost, speed, installation and reliability. Consumers maximize utility by choosing the service with the best set of attributes. Econometric estimates are used to estimate the willingness to pay for improvements in service attributes. Estimates are obtained for the representative user, as well as users with high and low income, high and low levels of education, by age, and by existing Internet service.
Consumers are willing to pay $13.25 to $39.12 for more reliable service, $8.22 to $32.15 for faster service, and $0.91 to $17.29 for always on connectivity. Generally, consumers do not value ease of installation. High-speed users value all attributes higher than other users, while higher income users value attributes more highly than lower income users. Those with a college degree value speed more, always on less, and reliability about the same as those without a college degree. WTP for speed increases with education and income, and decreases with age. WTP for the latent high-speed sample (i.e., dial-up users located in areas served by high-speed providers) is less than the WTP for the all household types. For all types, WTP for all attributes increases with income.
References Ames, S. (2002), ‘Study: Broadband Fees Climbed in 2001’, CNET News.com, January 17, http://news.com.com/2100-1033-
818013.html, accessed May 8 2002 8.42 AM MW. Bakos, J.Y. (2001), ‘The Emerging Landscape for Retail E-commerce’, Journal of Economics Perspectives, 15, 69-80. BLS (2001), Current Population Survey: Computer and Internet Use Supplement, September 2001, www.bls.gov/cps/. Borenstein, S., and Saloner, G. (2001), ‘Economic and Electronic Commerce’, Journal of Economics Perspectives, 15(1), 3-
12. Bush, G.W. (2002), ‘President Discusses the Future Technology at White House Forum’, Remarks by the President at the 21st
Century High Tech Forum, Presidential Hall Dwight David Eisenhower Executive Office Building, June 2002. Carey, J. (1991), ‘The Market for New Residential Services, in M. Elton (ed.) Integrated Broadband Networks: The Public
Policy Issues, Elsevier Science, New York. Cassel, C. (1999), ‘Demand for and Use of Additional Lines by Residential Customers’, in Loomis, D. and Taylor, L. (eds.) The
Future of the Telecommunications Industry: Forecasting and Demand Analysis, Kluwer Academic Publishers, Boston.

Broadband Demand 48
Compaine, B. (2001), The Digital Divide: Facing a Crisis or Creating a Myth, MIT Press, Cambridge, MA. Crandall, R., and Jackson, C. (2001), The $500 Billion Opportunity: The Potential Economic Benefit of Widespread Diffusion of
Broadband Internet Access, Criterion Economics, L.L.C. Washington, D.C. Duffy-Deno, K.T. (2001), ‘Demand for Additional Telephone Lines: An Empirical Note’, Information Economics and Policy, 13,
283-299. Eisner, J., and Waldon, T. (2001), ‘The Demand for Bandwidth: Second Telephone Lines and On-line Services’, Information
Economics and Policy, 13, 301-309. FCC (2002), Trends in Telephone Service, Industry Analysis and Technology Division, Wireline Competition Bureau,
Washington, D.C. FCC (2001), High Speed Services for Internet Access: Subscribership as of December 31 2001, Industry Analysis Division,
Common Carrier Bureau, FCC, Washington, D.C. FCC (1998), The Industry Analysis Division’s Reference Book of Rates, Price Indices, and Expenditure for Telephone Service,
Industry Analysis Division, Common Carrier Bureau, FCC, Washington, D.C. Glasner, J. (2001), ‘High Price Just for Speed’, Wired News, April 19,
www.wired.com/news/business/0,1367,43497,00.html,accessed, April 19 2002 8:35 AM MW. Grant, P. (2002), ‘Comcast Posts Strong Growth in Cable-Modem Subscribers’, The Wall Street Journal Online, WSJ.com. Goolsbee, A. (2000), ‘The Value of Broadband and the Deadweight Loss of Taxing New Technology’, Mimeo, University of
Chicago. Hausman, J., Sidak, G., and Singer, H. (2001), ‘Cable Modems and DSL: Broadband Internet Access for Residential
Customers’, American Economic Review AEA Papers and Proceedings, 91, May, 302-307. Jorgenson, D. (2001), ‘Information Technology and the US Economy’, American Economic Review, 91, March, 1-32. J.P. Morgan (2001), Telecom Services 2001, J.P. Morgan Securities Inc., New York. Litan, R., and Rivlin, A. (2001), ‘Projecting the Economic Impact of the Internet’, American Economic Review AEA Papers and
Proceedings, 91, May, 313-317. Louviere, J., Hensher, D., and Swait, J. (2000), Stated Choice Methods: Analysis and Applications, Cambridge University
Press, Cambridge, UK. NTIA (2002), A Nation Online: How Americans are Expanding Their Use of the Internet, Department of Commerce,
Washington, D.C. NTIA (2000), Falling Through the Net: Toward Digital Inclusion, Department of Commerce, Washington, D.C. Rappoport, P., Kridel, D., Taylor, L., Duffy-Deno, K., and Alleman, J. (2002), ‘Residential Demand for Access to the Internet’, in
Madden, G. (ed.) The International Handbook of Telecommunications Economics: Volume II, Edward Elgar Publishers, Cheltenham.
Röller, L., and Waverman, L. (2001), ‘Telecommunications and Economic Development’, American Economic Review, 91, September, 909-923.
Savage, S.J., Madden, G., and Simpson, M. (1997), ‘Broadband Delivery of Education Services: A Study of Subscription Intentions in Australian Provincial Centers’, Journal of Media Economics, 10, 3-16.
Varian, H. (2002), ‘The Demand for Bandwidth: Evidence from the INDEX Project’, Mimeo, University of California, Berkeley.

Broadband Demand 49
Estimating Consumer Demand - Appendix A
Given Internet access i, and assuming CES utility, Fi = txa i21 αα and Gi = txa i
21 δδ , the household optimization problem is:
tly ,,
max ρρρρ ααα /1321 )( tlyUi ++= (A1)
subject to iiiiiiio
i txaptxatlTwyy 2121 )( ααδδ +−+−−+=
The first-order conditions for (A1) are:
0/)1(1
1
=−−−
λα ρρρ
ii Uy (A2)
0/)1(12 =−−− wUli λα ρρρ (A3)
0/)1(13 =−−−
ii cUt λα ρρρ (A4)
0=−−− iiii tcwlyM (A5)
where ci = 2121 ααδδii xaxwaw −− is the opportunity cost of time online, and Mi = yo + wT - pi.
Assuming second-order conditions are met, demand functions are obtained by combining any two equations (A2)
through (A4) to eliminate U and λ, and substituting into (A5):
σσσσσ
σ
αααα
−− ++= 1
31
21
1*
i
ii cw
My (A6)
σσσσσ
σ
αααα
−− ++= 1
31
21
2* )/(
i
ii cw
Mwl (A7)
σσσσσ
σ
αααα
−− ++= 1
31
21
3* )/(
i
iii cw
Mct (A8)
where σ = 1/(1 - ρ) is the constant elasticity of substitution.
Substituting (A6) through (A8) into (A1) provides the conditional indirect utility function for Internet access i:

Broadband Demand 50
σσσσσσ ααα −−− ++
−+=
1/113
121
*
)( i
io
i cwpwTy
U (A9)
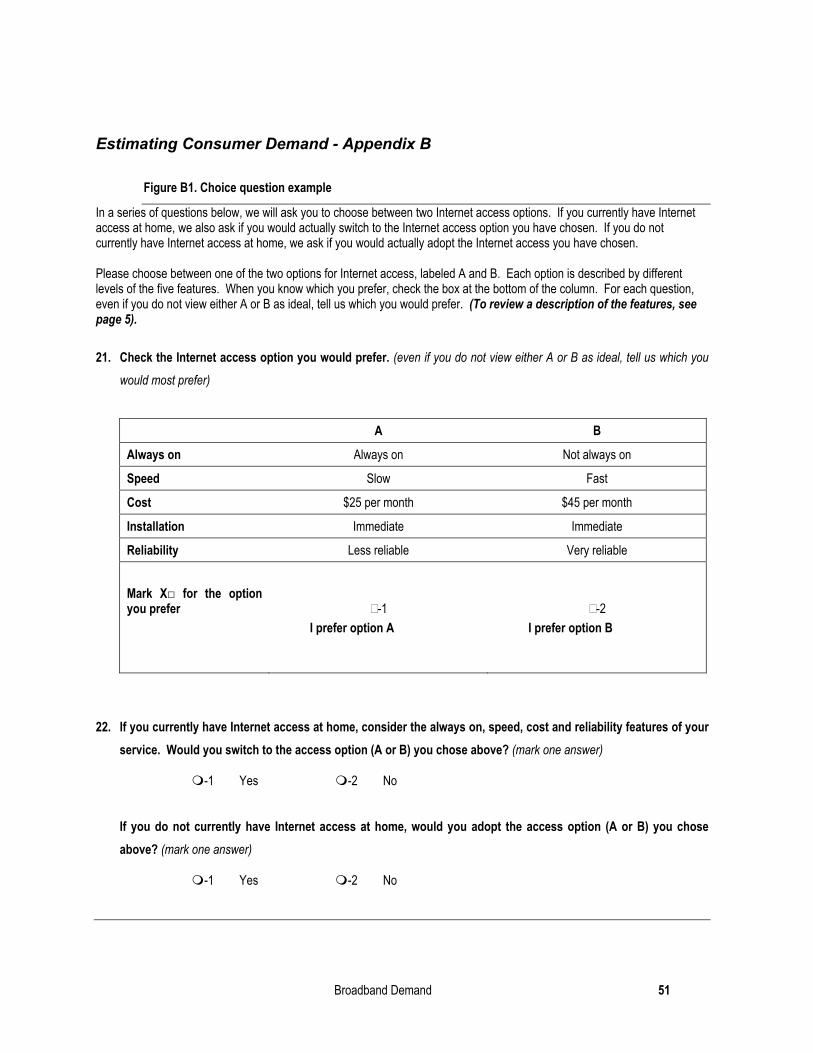
Broadband Demand 51
Estimating Consumer Demand - Appendix B Figure B1. Choice question example
In a series of questions below, we will ask you to choose between two Internet access options. If you currently have Internet access at home, we also ask if you would actually switch to the Internet access option you have chosen. If you do not currently have Internet access at home, we ask if you would actually adopt the Internet access you have chosen. Please choose between one of the two options for Internet access, labeled A and B. Each option is described by different levels of the five features. When you know which you prefer, check the box at the bottom of the column. For each question, even if you do not view either A or B as ideal, tell us which you would prefer. (To review a description of the features, see page 5). 21. Check the Internet access option you would prefer. (even if you do not view either A or B as ideal, tell us which you
would most prefer)
A B
Always on Always on Not always on
Speed Slow Fast
Cost $25 per month $45 per month
Installation Immediate Immediate
Reliability Less reliable Very reliable
Mark X□ for the option you prefer -1
I prefer option A -2
I prefer option B
22. If you currently have Internet access at home, consider the always on, speed, cost and reliability features of your
service. Would you switch to the access option (A or B) you chose above? (mark one answer)
-1 Yes -2 No
If you do not currently have Internet access at home, would you adopt the access option (A or B) you chose above? (mark one answer)
-1 Yes -2 No

Broadband Demand 52
Small Business and Home Office Demand for Internet Access Service
I. Introduction The standard theoretical approach to modeling business demand is to employ a production function where broadband is included as an input with capital, labor, land and materials. Cost minimization conditions can be used to derive a conditional input demand function for broadband. However, this aggregated approach is somewhat restrictive when applied to heterogeneous businesses. Like all telecommunication services, high-speed Internet will serve a wide range of internal and external business needs, some are complementary to their inputs while other are substitutes, and some are related to productions while others are related to marketing. Viewing high-speed access as a single input may not capture the real structure of business telecom demand (Taylor 1994). Given such difficulties, less rigorous empirical methods are useful for examining business demand for high-speed access. Here, some understanding of small business attitudes and demand for broadband are gleamed from existing studies in Section II, and analysis of survey data and firm demographics (or “firmographics”) in Section III. Conclusions are provided in Section IV.
II. Previous Studies of Business Demand Madden et al (2000) survey 65 small business respondents in rural Western Australia in November 1998 to obtain estimates of latent demand for broadband. Survey data is collected from 18 farmers, 37 small businesses, and 10 home offices in small towns (less than 500 persons) during the period October 1 through November 5 1998. Almost 90 percent of respondents are aware of the availability and potential benefits from high-speed delivered communication and information services. On average, business respondents are prepared to spend $63 per month for broadband, and this expenditure increases with monthly sales revenue. An OLS regression of broadband expenditure on geographical, information and technology variables shows businesses with a least one computer are willing to spend 18 percent more for high-speed access, and spend increases by $0.56 for every 100 km distance between business location and a provincial centre. Madden et al conclude that distant business populations have strong information needs and latent demand for high-speed services. They suggest carrier aversion to providing high-speed access and services to small business and farms in rural regions may not be justified on commercial grounds.
J.P. Morgan (2001) track public telecom service companies by quarter and forecast US Internet traffic growth to fall from 128 percent in 2000 to 51 percent in 2006. They expect the mix of traffic to change substantially during this period. In particular, there will be a decline in web page generated traffic and increases in streaming media. The share of peer-to-peer traffic should remain steady driven by larger email attachments and longer ‘to’ lists. Business demand for high-speed lines is forecast to increase from 579,000 lines in 2000 to 4,696,000 lines in 2006. In terms of market share, cable should make up about 2.4 percent of business high-speed lines, DSL will have 94.7 percent, and fixed wireless and satellite the remainder.

Broadband Demand 53
The business share of total high-speed lines will remain steady over the period at about 10 percent, but their share of high-speed revenue generated by business subscribers will increase from 13.8 percent in 2000 to 17.1 percent in 2006. Dun and Brandstreet (2002) examine computer and Internet use for businesses with 25 or fewer employees. A survey of 543 respondents during March/April 2002 obtains small business firmographics, and asks questions about the perceived benefits from employee access to the Internet and their activities. 85 percent of respondents indicate ownership of at least one computer, and 71 percent have at least one employee with Internet access. Of those small businesses with computer and Internet access, 52 percent provide Internet access to all employees, with home-businesses, real estate and businesses who primarily serve commercial accounts more likely to report Internet access for all employees.57 Most Internet connections are made through dial-up telephone modems (51 percent), followed by DSL (19 percent) and cable modems (11 percent). Dial-up was most prevalent among manufacturers and wholesalers with relatively low sales revenues of fewer than $50,000 per month. DSL connections are popular among the business service and transport sectors, and small businesses with monthly revenue greater than $50,000. The most prevalent Internet activities for small business are e-mail, business research and online purchases, and personal research. Video-conferencing through the Internet increased substantially to five percent of businesses in 2002, albeit from a very low base of one percent of business respondents in 2000.
III. Business Survey Data A profile of small office-home office (SOHO) and small business (SBUS) access and use of the Internet is developed from In-Stat/MDR (2002) survey data. Associated firmographics describe the type of firms surveyed, their size, and the job descriptions of persons completing the survey questionnaire. In-Stat/MDR surveyed 326 business Internet end-users in March 2001. Survey respondents do not provide high-speed services to residences or other businesses, and have no plans to do so in the near future. Further, respondents have plans to purchase high-speed services during the period April 1 2001 to March 31 2002. About 94 percent of surveyed businesses are located in the US representing 38 states and the District of Columbia.
Business users are divided into three categories by number of employees. SOHOs employ 1 to 4 persons, SBUSs employ 5 to 99 persons, and middle market and enterprise (MME) businesses employ 100 or more persons. Inclusion of MMEs in the sample provides a natural benchmark for comparing SOHO and SBUS use of the Internet and their attitudes toward broadband. 16.7 percent of the sample population is SOHOs, 44.6 percent are SBUSs, and 38.6 percent are MMEs. For the sub sample of SBUS end-users, 46.1 percent employ 5 to 19 persons, 25.5 percent employ 20 to 49 persons, and 28.4 percent employ 50 to 99 persons. Communications and services are the primary industry for SOHOs, communications, services, and manufacturing are the primary industry for SBUSs, and communications, manufacturing, services, finance, insurance and real estate are the primary industry for MMEs. Job descriptions for employees responding to the survey vary across business categories. Survey questionnaires are typically completed by the president (CEO, chairperson, owner, etc.) of SOHOs, the president or vice-president of SBUSs, and the vice-president, information technology (IT) executive, or IT staff
57 When asked whether the company would benefit when all employees have Internet access only 11 percent said yes. Reasons given are “no need for it,” “employees that need it, have it,” “would not help business,” “do not want employees to have it,” and “employees are in the field.”

Broadband Demand 54
member for MMEs. All 326 SOHO, SBUS, and MME respondents are directly involved in broadband purchase decisions for their respective businesses.
A. Internet Awareness and Availability
Table 1 shows that business’s interpretations of “what is broadband” are similar across all business categories for most types of Internet access. A noticeable difference is fixed wireless. Only 26.42 percent of SOHO respondents consider fixed wireless to be broadband compared to 51.77 percent and 44.26 percent for SBUS and MME, respectively.
Table 1. Interpretation of broadband access by business Access SOHO
(n=53) SBUS (n=141)
MME (n=122)
3G wireless 28.30 39.72 33.61 56kbps dial-up 0 1.42 1.64 ATM 39.62 49.65 49.18 Cable modem 79.25 83.69 83.61 DSL 86.79 90.78 86.07 Fixed wireless 26.42 51.77 44.26 Frame relay 26.42 31.91 40.98 ISDN 33.96 24.11 31.15 T1 67.92 72.34 73.77 Note. Cells are percent of respondents who interpret the method of access as broadband.
As indicated in Table 2, DSL is the most preferred method of broadband Internet access for all businesses, followed by T1 lines, and cable modem access. SBUSs and MMEs have no preference for dial-up access, and dial-up is preferred by only 1.89 percent of SOHOs. Table 3 suggests that all business types are reasonably well aware of the alternative Internet access options available in their area. Relatively low awareness of 3G wireless options (3.77 percent of SOHOs, five percent of SBUSs, and 4.92 percent of MMES) could reflect either lack of awareness and/or lack of availability. Given the high level of marketing and promotion directed towards dial-up, cable modem, DSL and T1 technologies, a high awareness of these options is encouraging. However, a high awareness of cable modem access for SBUS (75.71 percent) and MMEs (79.51 percent) is surprising given relatively low levels of broadband cable deployment in business and commercial areas.
Table 2. Preferred method of Internet access by business Access SOHO
(n=53) SBUS (n=140)
MME (n=121)
3G wireless 1.89 2.86 4.96 56kbps dial-up 1.89 0 0 ATM 3.77 7.14 5.79 Cable modem 13.21 11.43 12.40 DSL 43.40 32.86 26.45 Fixed wireless 5.66 6.43 7.44 Frame relay 1.89 2.14 2.48 ISDN 1.89 1.43 0.83 T1 18.87 23.57 25.62 Other 7.55 12.14 14.05 Note. Cells are the percent of respondents who prefer the listed method of Internet access.
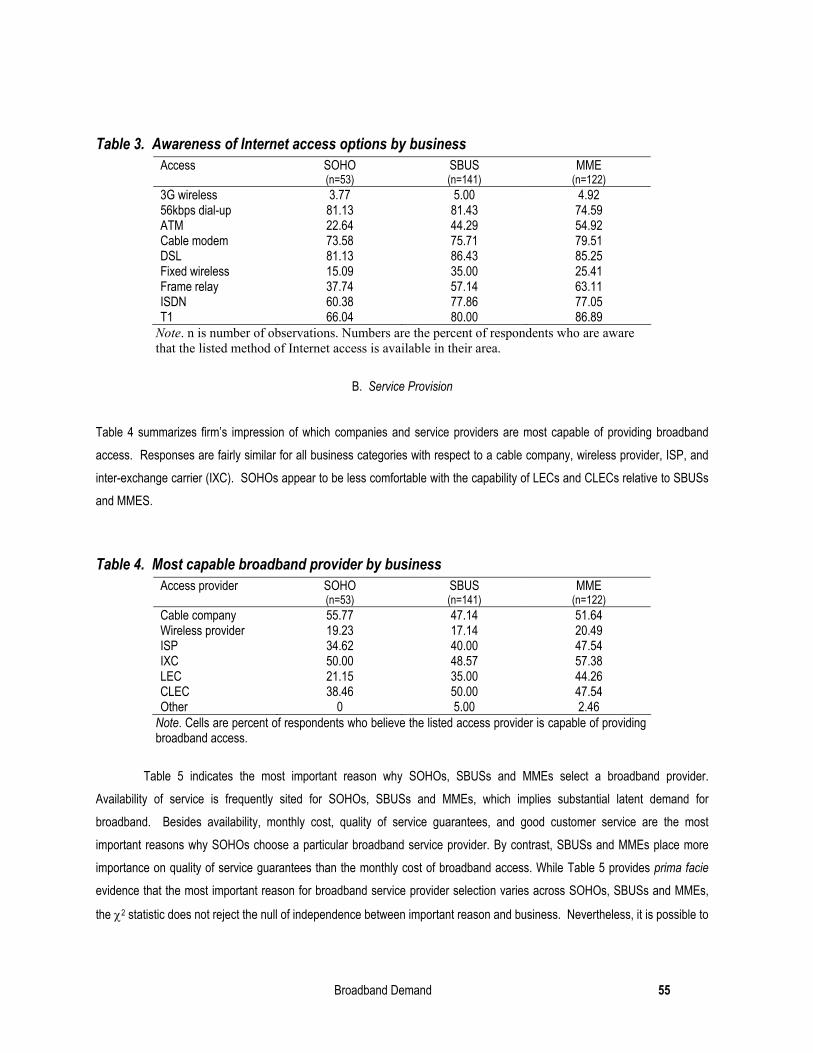
Broadband Demand 55
Table 3. Awareness of Internet access options by business Access SOHO
(n=53) SBUS (n=141)
MME (n=122)
3G wireless 3.77 5.00 4.92 56kbps dial-up 81.13 81.43 74.59 ATM 22.64 44.29 54.92 Cable modem 73.58 75.71 79.51 DSL 81.13 86.43 85.25 Fixed wireless 15.09 35.00 25.41 Frame relay 37.74 57.14 63.11 ISDN 60.38 77.86 77.05 T1 66.04 80.00 86.89 Note. n is number of observations. Numbers are the percent of respondents who are aware that the listed method of Internet access is available in their area.
B. Service Provision
Table 4 summarizes firm’s impression of which companies and service providers are most capable of providing broadband access. Responses are fairly similar for all business categories with respect to a cable company, wireless provider, ISP, and inter-exchange carrier (IXC). SOHOs appear to be less comfortable with the capability of LECs and CLECs relative to SBUSs and MMES.
Table 4. Most capable broadband provider by business Access provider SOHO
(n=53) SBUS (n=141)
MME (n=122)
Cable company 55.77 47.14 51.64 Wireless provider 19.23 17.14 20.49 ISP 34.62 40.00 47.54 IXC 50.00 48.57 57.38 LEC 21.15 35.00 44.26 CLEC 38.46 50.00 47.54 Other 0 5.00 2.46
Note. Cells are percent of respondents who believe the listed access provider is capable of providing broadband access.
Table 5 indicates the most important reason why SOHOs, SBUSs and MMEs select a broadband provider. Availability of service is frequently sited for SOHOs, SBUSs and MMEs, which implies substantial latent demand for broadband. Besides availability, monthly cost, quality of service guarantees, and good customer service are the most important reasons why SOHOs choose a particular broadband service provider. By contrast, SBUSs and MMEs place more importance on quality of service guarantees than the monthly cost of broadband access. While Table 5 provides prima facie evidence that the most important reason for broadband service provider selection varies across SOHOs, SBUSs and MMEs,
the χ2 statistic does not reject the null of independence between important reason and business. Nevertheless, it is possible to

Broadband Demand 56
conclude that cost, customer service and quality of service guarantees together are important features to all business when choosing a broadband access option and provider.
Table 5. Reason for broadband provider selection by business Most important reason SOHO
(n=52) SBUS (n=141)
MME (n=122)
Provider reputation 1.89 3.55 4.10 Breadth of services 1.89 6.38 6.56 Availability 20.75 26.95 27.05 Availability of bundled services 7.55 7.09 7.38 Monthly cost 22.64 16.31 10.66 Affordable installation cost 1.89 1.42 0.82 Good customer service 15.09 10.64 9.84 Quality of service 18.87 24.82 28.69 Other 9.43 2.84 4.92 χ2(16) = 12.688, Probability value = 0.6955
Note. Cells are percent of respondents for whom the listed reason is most important in their broadband purchase decision. χ2 tests the null hypothesis of independence of the two variables. Probability value ≤ 0.05 rejects the null at the five percent level.
Table 6 lists potential barriers to the purchase of broadband by business category. There are a large number of responses in the “other category” which suggests further research is required to uncover important barriers to broadband uptake other than those listed. Besides other, the most frequently cited response is that no barriers exist. Further, very few respondents state they are not interested, or have no need, for broadband. Perceived value is very important to businesses with monthly costs and low service reliability the greatest barriers to purchasing broadband for SOHOs, SBUSs and MMEs. Examination of Table 5 and Table 6 responses together indicates that all businesses are both interested and willing to purchase broadband when service packages emphasize cost and reliability of service.
Table 6. Barriers to broadband purchase by business Most important barrier SOHO
(n=53)
SBUS (n=139)
MME (n=120)
Equipment cost 7.55 2.88 5.00 Installation cost 1.89 2.88 1.67 Low service reliability 11.32 15.11 14.17 Monthly cost 24.53 28.06 20.83 Need to install network 3.77 1.44 4.17 Security concerns 3.77 3.60 6.67 Training users 0 0.72 1.67 Not interested, no need 0 0 1.67 Other 16.98 13.67 22.50 No barriers exist 28.30 30.94 21.67 Don't know 1.89 0.72 0
Note. Cells are percent of respondents for whom the listed barrier is their greatest barrier to purchasing broadband.

Broadband Demand 57
C. Important Activities, Applications and Functions
Table 7 describes the importance of broadband access to business success in 2002. More than 90 percent of respondents for all three business categories believe broadband is critical or important to their business success. Awareness of the emerging digital economy is reflected to some extent in number of ‘not at all important’ responses. No SOHO, SBUS, or MME respondents indicate that broadband is not at all important to their success.
Table 7 Broadband and success by business Importance to success in 2002 SOHO
(n=53) SBUS (n=138)
MME (n=117)
Critical 67.31 63.04 58.12 Important, but not critical 25.00 32.61 37.61 Somewhat important 3.85 3.62 4.27 Not very important 3.85 0.72 0 Not at all important 0 0 0
Note. n is number of observations. Numbers in table are percentage of respondents who believe broadband is critical, important, … , etc., to their firm’s success in 2002.
Table 8 through Table 11 focus on how important features such as always on, access speed, delivery of integrated service, and remote access are in driving broadband demand. Table 8 shows that over 80 percent of respondents for all business categories consider always on to be critical or important in driving their decision to subscribe to broadband. Only
3.77 percent of SOHOs, 0.71 percent of SBUSs and 1.67 percent of MMEs indicate always on is not at all important. A χ2
statistic rejects the null of independence between always on and business, and suggests the importance of always on to broadband uptake varies across business categories.
Table 8 Always on functionality as a broadband driver by business Importance of always on SOHO
(n=53) SBUS
(n=140) MME
(n=120) Critical 54.72 73.57 47.50 Important, but not critical 26.42 21.43 30.00 Somewhat important 11.32 3.57 17.50 Not very important 3.77 0.71 3.33 Not at all important 3.77 0.71 1.67 χ2(8) = 26.739, Probability value = 0.0008
Note. Cells are percent of respondents who believe always on is a critical, important, … , etc., driver of broadband uptake. χ2 tests the null hypothesis of independence of the two variables. Probability value ≤ 0.05 rejects the null at the five percent level.
As indicated in Table 9, over 85 percent of business respondents consider access speed to be a critical or important feature that will drive their decision to take up broadband. No respondents in any business category site speed as being not at all important.
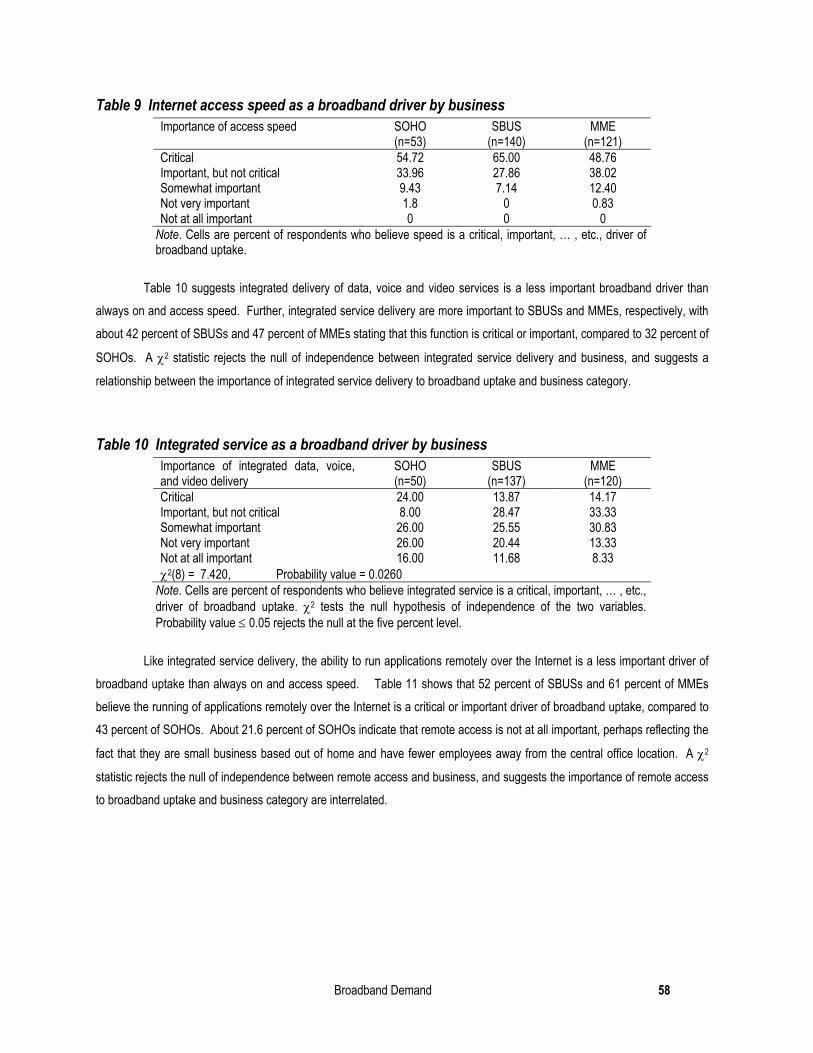
Broadband Demand 58
Table 9 Internet access speed as a broadband driver by business Importance of access speed SOHO
(n=53) SBUS
(n=140) MME
(n=121) Critical 54.72 65.00 48.76 Important, but not critical 33.96 27.86 38.02 Somewhat important 9.43 7.14 12.40 Not very important 1.8 0 0.83 Not at all important 0 0 0
Note. Cells are percent of respondents who believe speed is a critical, important, … , etc., driver of broadband uptake.
Table 10 suggests integrated delivery of data, voice and video services is a less important broadband driver than always on and access speed. Further, integrated service delivery are more important to SBUSs and MMEs, respectively, with about 42 percent of SBUSs and 47 percent of MMEs stating that this function is critical or important, compared to 32 percent of
SOHOs. A χ2 statistic rejects the null of independence between integrated service delivery and business, and suggests a
relationship between the importance of integrated service delivery to broadband uptake and business category.
Table 10 Integrated service as a broadband driver by business Importance of integrated data, voice, and video delivery
SOHO (n=50)
SBUS (n=137)
MME (n=120)
Critical 24.00 13.87 14.17 Important, but not critical 8.00 28.47 33.33 Somewhat important 26.00 25.55 30.83 Not very important 26.00 20.44 13.33 Not at all important 16.00 11.68 8.33 χ2(8) = 7.420, Probability value = 0.0260
Note. Cells are percent of respondents who believe integrated service is a critical, important, … , etc., driver of broadband uptake. χ2 tests the null hypothesis of independence of the two variables. Probability value ≤ 0.05 rejects the null at the five percent level.
Like integrated service delivery, the ability to run applications remotely over the Internet is a less important driver of broadband uptake than always on and access speed. Table 11 shows that 52 percent of SBUSs and 61 percent of MMEs believe the running of applications remotely over the Internet is a critical or important driver of broadband uptake, compared to 43 percent of SOHOs. About 21.6 percent of SOHOs indicate that remote access is not at all important, perhaps reflecting the
fact that they are small business based out of home and have fewer employees away from the central office location. A χ2
statistic rejects the null of independence between remote access and business, and suggests the importance of remote access to broadband uptake and business category are interrelated.

Broadband Demand 59
Table 11 Remote access as a broadband driver by business Importance of remote access SOHO
(n=51) SBUS
(n=139) MME
(n=120) Critical 21.57 25.90 35.00 Important, but not critical 21.57 26.62 25.83 Somewhat important 15.69 26.62 24.17 Not very important 19.61 12.23 10.00 Not at all important 21.57 8.63 5.00 χ2(8) = 18.494, Probability value = 0.0260
Note. Cells are percent of respondents who believe remote access is a critical, important, … , etc., driver of broadband uptake. χ2 tests the null hypothesis of independence of the two variables. Probability value ≤ 0.05 rejects the null at the five percent level.
Table 12 through Table 15 provide insight into the importance placed on individual Internet activities and applications in driving broadband uptake. As shown in Table 12, email, IM and other messaging applications are important drivers of broadband across all business categories. 83.02 percent of SOHOs, 82.98 percent of SBUSs and 77.5 percent of MMEs indicate that messaging activities are critical or important in driving their business’s need for broadband.
Table 12 Email and IM as a broadband driver by business Importance of email and IM SOHO
(n=53) SBUS
(n=141) MME
(n=120) Critical 54.72 60.28 49.17 Important, but not critical 28.30 22.70 28.33 Somewhat important 9.43 9.93 20.00 Not very important 5.66 4.96 1.67 Not at all important 1.89 2.13 0.83 χ2(8) = 11.182, Probability value = 0.1916
Note. Cells are percent of respondents who believe email and IM are critical, important, … , etc., drivers of broadband uptake. χ2 tests the null hypothesis of independence of the two variables. Probability value ≤ 0.05 rejects the null at the five percent level.
Both Table 13 and Table 14 indicate that e-commerce and streaming media are important to driving broadband uptake. 53.06 percent of SOHOs, 48.92 percent of SBUSs and 49.14 percent of MMEs indicate that e-commerce is critical or important in driving their business’s need for broadband. 42.31 percent of SOHOs, 45.34 percent of SBUSs and 38.66 percent of MMEs state that streaming media is a critical or important factor in driving their demand for broadband.
Table 13 E-commerce as a broadband driver by business e-commerce SOHO
(n=49) SBUS
(n=139) MME
(n=122) Critical 22.45 23.02 18.03 Important, but not critical 30.61 25.90 31.15 Somewhat important 26.53 23.02 30.33 Not very important 12.24 18.71 12.30 Not at all important 8.16 9.35 8.20 χ2(8) = 5.0471, Probability value = 0.7525
Note. Cells are percent of respondents who believe streaming media is a critical, important, … , etc., driver of broadband uptake. χ2 test the null hypothesis of independence of the two variables. Probability value ≤ 0.05 rejects the null at the five percent level.

Broadband Demand 60
Table 14 Importance of streaming media as a broadband driver by business Streaming audio and video SOHO
(n=52) SBUS
(n=139) MME
(n=119) Critical 23.08 14.39 13.45 Important, but not critical 19.23 30.94 25.21 Somewhat important 26.92 27.34 31.93 Not very important 19.23 17.99 19.33 Not at all important 11.54 9.35 10.08 χ2(8) = 5.2910, Probability value = 0.7261
Note. Cells are percent of respondents who believe streaming media is a critical, important, … , etc., driver of broadband uptake. χ2 test the null hypothesis of independence of the two variables. Probability value ≤ 0.05 rejects the null at the five percent level.
Finally, Table 15 shows how businesses view video-conferencing as a driver of broadband demand. Video-conferencing appears to be less important than messaging, e-commerce and streaming media. About 44.5 percent of SBUSs and 43 percent of MMEs believe video-conferencing through the Internet is a critical or important driver of broadband uptake,
compared to 30 percent of SOHOs. 20.9 percent of SBUSs indicate that video-conferencing is not at all important. A χ2
statistic rejects the null of independence between video-conferencing and business, and suggests the importance of video-conferencing to broadband uptake and business category are interrelated.
Table 15 Video-conferencing as a broadband driver by business Video-conferencing SOHO
(n=50) SBUS
(n=139) MME
(n=121) Critical 18.00 12.23 11.57 Important, but not critical 12.00 22.30 31.40 Somewhat important 34.00 27.34 29.75 Not very important 28.00 17.27 16.53 Not at all important 8.00 20.86 10.74 χ2(8) = 16.780, Probability value = 0.0325
Note. Cells are percent of respondents who believe video-conferencing is a critical, important, … , etc., driver of broadband uptake. χ2 tests the null hypothesis of independence of the two variables. Probability value ≤ 0.05 rejects the null at the five percent level.
IV. Conclusions A profile of small office-home office and small business access and use of the Internet is developed from In-Stat/MDR (2002) survey data and associated firmographics. Data suggest that always on connectivity and speed are critical or important in driving business toward broadband subscription. Integrated delivery of data, voice and video services is a relatively less important broadband driver to SOHOs than always on and speed. Like integrated service delivery, the ability to run applications remotely over the Internet is a less important driver of broadband uptake than always on and access speed. A relatively large percent of SOHO respondents

Broadband Demand 61
(about 22 percent) indicate that remote access is not at all important, perhaps reflecting the fact that they are small business based out of home and have fewer employees away from the central office location. Further analysis provides insight into the importance placed on individual Internet activities and applications in driving broadband demand. E-mail, IM and other messaging applications, e-commerce, and streaming media are important drivers of broadband across all business categories. However, the degree of importance is not related to the type of business. Video-conferencing appears to be less important than messaging, e-commerce and streaming media, and less important o SOHOs and SBUSs compared to MMEs.
References Dun and Brandstreet (2000), D&B 21st Annual Small Business Survey Summary Report,
http://sbs.dnb.com/Default.asp?referrer=sbsnavcenter&bhcd2=1026313941. In-Stat/MDR (2002), Survey Data for US Business Markets, www.instat.com. J.P. Morgan (2001), Telecom Services 2001, J.P. Morgan Securities Inc., New York. Madden, G., Savage, S.J., Coble-Neal, G., and Bloxham, P. (2000), ‘Advanced Communications Policy and Adoption in Rural
Western Australia’, Telecommunications Policy, 24, 291-304. Taylor, L. (1994), Telecommunications Demand in Theory and Practice, 2nd edition, Kluwer Academic Publishers, Boston.

Broadband Demand 62
US Government use of Broadband
3. What extent the U.S. Government is currently a subscriber of broadband services, and if increased Government use of broadband can motivate higher subscription rates among residences and businesses?
SUMMARY
Initial results at ascertaining Government connectivity are moderate, creating only a general view. We believe follow up surveys could shed some more light on this topic. However, based on conversations with officials within US agencies, it is not clear that the government understands the relevant concepts. We found a great deal of information indicating that the government is indeed looking at ways of improving efficiency and reduced costs through the use of Information and Communication Technology (ICT). However, these efforts do not focus specifically on broadband services per se. We did find the terms “broadband”, “high speed” and “high rate” in numerous federal reports concerning such things as telework, work process, ecommerce and egovernment. We also found a number of reports and proposed legislation that mentioned the role of broadband as a general driver of economic growth. While we do believe that government should look at the role of broadband, we also believe that this is just one part of a much bigger effort; that of understanding how all of ICT can help government be more efficient and cut costs. Nonetheless, it may be worthwhile for industry to demonstrate to government why they should look more closely at the role of broadband. For example, the conclusions
reached in this document could be used as a launching point for more in depth investigation by a government agency, such as GAO. As for Government driving broadband internally and externally, they are moving in the right direction. Instead of finding the killer app, they are slowly developing accessible, reliable and user-friendly services and applications to better serve their own and their citizen’s needs. We recommend to developers focus on current ICT projects that will most likely evolve into useful bundled applications and services, rather than attempt to identify the next best thing. We also recommend that government continue to focus on telecommuting, improved online business process, and accessible portals.

Page 63
In this section, we address to what extent the U.S. Government is currently a subscriber of broadband services, and if increased Government use of broadband can motivate higher subscription rates among residences and businesses. To facilitate this research, we investigated the following: 1. How many broadband connections do U.S.
Government agencies and departments subscribe to? How are these geographically distributed?
2. What internal Government applications could be
implemented to stimulate the Government’s need for and use of broadband services?
3. Has the government effectively evaluated broadband services and applications as tools for increasing efficiency and reducing costs?
4. What online services and applications could be
implemented to improve or add value to Government service to citizens and businesses via broadband access, and thus motivate them to subscribe to broadband?
The following is the findings of our work in this space. How many broadband connections do U.S. Government
agencies and departments subscribe to? How are these
geographically distributed?
Specific numbers on Government connectivity are elusive. We researched reports and studies from Government agencies and departments, but none had the level of detail we required. In communication with the Office of Management and Budget, we learned that to perform this level of analysis, the OMB would require agencies to report their use of broadband as a business case, which
was not the case for FY2003 reporting requirements.58 Inquiries to other agencies and departments, including the General Services Administration and the General Accounting Office, produced similar responses. While no report or study has been completed at this time on Government connectivity, this information can be extrapolated from existing government sources. The problem we found was the contradictions among the sources. We made attempts at contacting the Chief Information Officers of the Federal Agencies as listed by the Chief Information Office Council to solicit further information. There responses were not helpful. A sampling technique may turn out to be the only way to gather this information. We tried making use of online databases that indicate where (and in what number) federal employees are located.59 However, we found contractions within the numbers, suggesting that the information may be less than valid. We were able to ascertain that nearly all federal agencies have their desktop computers wired to a LAN to share files. These networks connect to the Internet, using a T-1, T-3 or higher connection, so that computer users have direct access to the Internet and all of its resources.60 We believe investigating the Government’s method of telecommunications procurement may prove beneficial in ascertaining connectivity information. It is worth noting that for the past several years, agencies have bought long-distance, local and data services from a multitude of companies, but through very few contracts.
58 Electronic communications with William McVay, US office of Management and Budget 59 http://www.opm.gov/feddata/index.htm 60 Carney, Untitled, Federal Computer Week, http://www.fwc.com
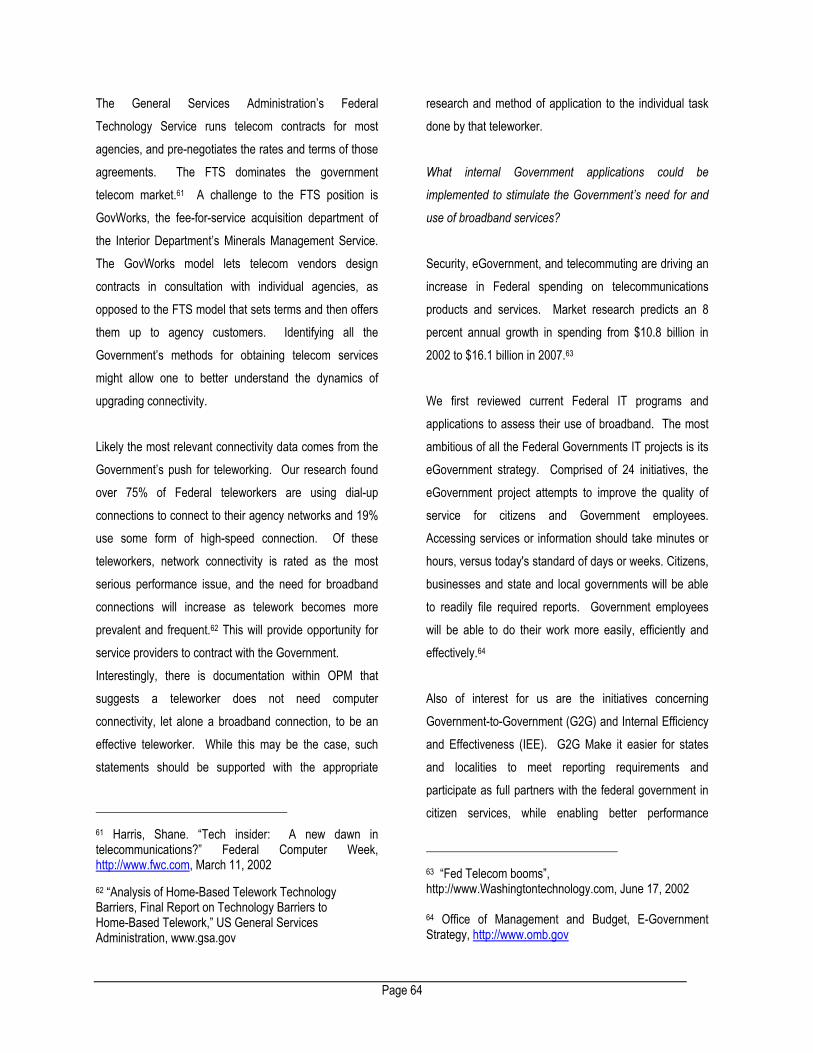
Page 64
The General Services Administration’s Federal Technology Service runs telecom contracts for most agencies, and pre-negotiates the rates and terms of those agreements. The FTS dominates the government telecom market.61 A challenge to the FTS position is GovWorks, the fee-for-service acquisition department of the Interior Department’s Minerals Management Service. The GovWorks model lets telecom vendors design contracts in consultation with individual agencies, as opposed to the FTS model that sets terms and then offers them up to agency customers. Identifying all the Government’s methods for obtaining telecom services might allow one to better understand the dynamics of upgrading connectivity. Likely the most relevant connectivity data comes from the Government’s push for teleworking. Our research found over 75% of Federal teleworkers are using dial-up connections to connect to their agency networks and 19% use some form of high-speed connection. Of these teleworkers, network connectivity is rated as the most serious performance issue, and the need for broadband connections will increase as telework becomes more prevalent and frequent.62 This will provide opportunity for service providers to contract with the Government. Interestingly, there is documentation within OPM that suggests a teleworker does not need computer connectivity, let alone a broadband connection, to be an effective teleworker. While this may be the case, such statements should be supported with the appropriate
61 Harris, Shane. “Tech insider: A new dawn in telecommunications?” Federal Computer Week, http://www.fwc.com, March 11, 2002
62 “Analysis of Home-Based Telework Technology Barriers, Final Report on Technology Barriers to Home-Based Telework,” US General Services Administration, www.gsa.gov
research and method of application to the individual task done by that teleworker. What internal Government applications could be
implemented to stimulate the Government’s need for and
use of broadband services?
Security, eGovernment, and telecommuting are driving an increase in Federal spending on telecommunications products and services. Market research predicts an 8 percent annual growth in spending from $10.8 billion in 2002 to $16.1 billion in 2007.63 We first reviewed current Federal IT programs and applications to assess their use of broadband. The most ambitious of all the Federal Governments IT projects is its eGovernment strategy. Comprised of 24 initiatives, the eGovernment project attempts to improve the quality of service for citizens and Government employees. Accessing services or information should take minutes or hours, versus today's standard of days or weeks. Citizens, businesses and state and local governments will be able to readily file required reports. Government employees will be able to do their work more easily, efficiently and effectively.64 Also of interest for us are the initiatives concerning Government-to-Government (G2G) and Internal Efficiency and Effectiveness (IEE). G2G Make it easier for states and localities to meet reporting requirements and participate as full partners with the federal government in citizen services, while enabling better performance
63 “Fed Telecom booms”, http://www.Washingtontechnology.com, June 17, 2002 64 Office of Management and Budget, E-Government Strategy, http://www.omb.gov
Page 65
measurement, especially for grants. Other levels of government will see significant administrative savings and will be able to improve program delivery because more accurate data is available in a timely fashion. The IEE initiatives make better use of modern technology to reduce costs and improve quality of federal government agency administration, by using industry best practices in areas such as supply-chain management, financial management and knowledge management. Agencies will be able to improve effectiveness and efficiency, eliminating delays in processing and improving employee satisfaction and retention. While these initiatives are a good start, they do not require substantial bandwidth to operate. This is not to say these are irrelevant to the goal of improving broadband deployment, as these initiatives lay a foundation and provide certain functionality required of other broadband applications. Once functional, new applications can be added that may require more bandwidth. Two projects closely associated with the eGovernment initiative, GovNet and the XML initiative, are important to address for their potential as broadband starters. GovNet is being developed as a highly secure and reliable internal network for the Government to share information between agencies. This private intranet will have VOIP and video capability requiring high bandwidth.65 If developed, it is likely that this high bandwidth backbone will eventually build out to all agencies nationwide. The XML initiative is aiming to improve internal efficiency by standardizing data across all agencies. This will allow
65 Delio, Michelle, “GovNet: What is it good for?” http://www.wired.com, January 21, 2002
for faster and easier data retrieval across Government.66 What makes it so attractive is its ability to be read across dissimilar computer systems – heterogeneity is the case for most of the Federal Government. XML will interconnect agencies in new ways and foster new cross agency applications that, as IT spending increases, will drive broadband demand. We believe the lesson here is that if interagency communication improves by creating more interoperable content, there will be a demand for higher rate interconnectivity. As noted earlier, we have found a tremendous amount of information on telecommuting. A study performed by the United States Office of Personal Management found agencies reported 74,487 federal teleworkers as of October 1, 2001.67 Since the majority of these workers use dial-up, this represents an opportunity for increasing broadband penetration. The need is for the Federal government to find broadband a useful requirement for its teleworkers. We see the use of telecenters, remote office locations equipped with PCs, tech support, and communications links, will be a steppingstone for the development of telework and broadband. Telecenters act like training wheels for individuals not used to or ready to work remotely. The confidence and ease of use gained from using these broadband capable telecenters will drive teleworkers to demand broadband to their homes. The use of telecenters also serves as a means of promoting awareness of broadband, a key ingredient to adoption. The use of telecenters has been lukewarm at best, but the 66 Matthews, William, “Is XML too prolific?” Federal Computer Week, http://www.fcw.com, July 01, 2002 67 “The Status of Telework in the Federal Government,” Produced by the United States Office of Personal Management, http://www.telework.gov/status-toc.htm

Page 66
OPM and GSA are developing programs to encourage the use of these locations.68 While all of these initiatives are a step in the right direction, many are not explicitly bandwidth drivers. But, they are important as a platform in which broadband can be built from at a later time. To drive broadband internally in the near future, we believe the adoption of videoconferencing, the online work process, e training, and VoIP is necessary. Has the government effectively evaluated broadband
services and applications as tools for increasing efficiency
and reducing costs?
We found a great deal of information indicating that the government is indeed looking at ways of improving efficiency and reduced costs through the use of information and communication technology (ICT). However, these efforts do not focus specifically on broadband services per se. In fact, we could not find any government study that looked specifically at broadband as a tool to increase efficiency or reduce costs. We did find the term “broadband” and “broadband applications” in numerous federal reports concerning such things as telework, work process, ecommerce and egovernment. We also found a number of reports and proposed legislation concerning the role of broadband as a general driver of economic growth. Much of the general ICT work is focused within a few (although important) agencies including, Office of Personal Management (OPM), Office of Management and Budget (OMB), General Accounting Office (GAO) and 68 Caterinicchia, Dan, “Telecenters – Down but not out,” Federal Computer Week, http://www.fcw.com, August 6, 2001
Government Services Administration (GSA). Another key player in this area is Congress through its legislative efforts. Therefore, to assess the degree to which the government is looking into the use of broadband, we consider both government sponsored initiatives (such as that of GAO, GSA, OMB, and OMP) and congressional legislation (such as the e-government Bill S.803). Among the government efforts that did consider the role of broadband we found the following:
• Telecommuting/Telework • Paperwork Elimination Act • OMD’s 24 egovernment initiative • Presidential statements • Senate Bill 803 on egovernment • Other agency and legislative efforts
We are continuing to look for other studies that may have been done by (or for) government concerning the role of broadband as a means of increasing efficiency. We now consider each of the initiatives identified above. TELECOMMUTING/TELEWORK One area where we did find consideration of broadband was within the federal government efforts to encourage telecommuting/teleworking. While government does not believe that telecommuting explicitly requires broadband, we did find reference to broadband as a platform for improving the telework experience.69 We will not consider the role of telecommuting any further within this section in that it is covered is great detail elsewhere in this report. 69 We have found some statements that raise concern that the government does not necessarily think that broadband is necessary for teleworkers, even those who would make use of remote network connections to government facilities. As previously mentioned, the telework recommendations indicate that worker need not necessarily even have of computer. This may be a budgetary reaction than a choice away from IT, whatever the case this should be further investigated.
Page 67
PAPERWORK ELIMINATION ACT Another promising area to consider is that of the Paperwork Elimination Act. Again, studies surrounding this Act did not explicitly recommend broadband, however much of the underlying requirements could be aided by its use.
EGOVERNMENT INITIATIVE In July of this year, President Bush gave the following statement concerning e-government initiatives (emphasis added).
My Administration's vision for Government reform is guided by three principles. Government should be citizen-centered, results-oriented, and market-based. These principles have been woven into the five Government-wide reform goals outlined in my Administration's Management Agenda: strategic management of human capital, budget and performance integration, competitive sourcing, expanded use of the internet and computer resources to provide Government services (Electronic-Government or E-Government), and improved financial management. Effective implementation of E-Government is important in making Government more responsive and cost-effective. Our success depends on agencies working as a team across traditional boundaries to better serve the American people, focusing on citizens rather than individual agency needs. I thank agencies who have actively engaged in cross-agency teamwork, using E-Government to create more cost-effective and efficient ways to serve citizens, and I urge others to follow their lead.
OMB’s agenda is well developed within the OMB 24 e-government initiatives. This effort developed out of an OMB Task Force established to identify priority actions that could best improve government use of communications technology and “set in motion a transformation of government around citizen needs” [OMB E-Gov]. The long term focus of this work was to simplify the delivery of government services to US citizens. This initiative breaks down into five major areas:
Government to Citizen: This consists of five initiatives including online access to recreation information, employment benefits, loans, Government Services Administration (GSA) services and tax filing.
Government to Business: This consists of six initiatives including online dockets, business tax product, GSA assets, trade process streamlining, business compliance info, and health record management.
Government to Government: This consists of five initiatives including online geospatial information, grant streamlining, disaster assistance, wireless public safety, and vital records.
Internal Efficiency and Effectiveness: This consists of seven initiatives including training, recruitment, human resource management, payroll processing, travel, acquisitions, and record management. As this area relates directly to our question, we expand the analysis below.

Page 68
Initiatives that Address Barriers to E-
Government Success: This consists of two initiatives including authentication and federal information standards.
Together these initiatives provide a solid basis for driving government’s ability to use ICT. We believe that this initiative should be viewed as critical to the success of preparing government for broadband services and applications. Without the proper logical infrastructure, broadband might be an unnecessary convenience. SENATE BILL 803 On the legislative side, there is a Bill underway to promote E-government. This bill, S.803, is intended to create a systematic approach for the management of federal government information technology. It focuses directly on the issue of making government more efficient both internally and outside. Contained within S.803 are a number of enactments directed at promoting various aspects of E-government including:
• Development of an E-government office • Delegation of authority • Requirements for federal courts • Accessibility and usability of government
information • Privacy • Federal IT training • Community technology centers • Funding studies
In terms of stimulating broadband, this Bill may be viewed as resolving a number of underlying problems that stand in the way of broadband demand, but it does not in and of itself position itself as a broadband demand Bill. The various issues that this Bill addresses are critical to the laying the foundation for broadband. For example, this Bill focuses on the notion of making government records
readily accessible to citizens. It provides funds for training Federal employees in the area of IT. It provides funds for studies where disparities that exist within society and ways to resolve these disparities. It provides funding for a digital certificate authority within the government (this may well have the biggest impact by jump-starting PKI. It also creates a budget and an office assigned to examine these issues on an ongoing basis. Individually, these items may not spur broadband demand, but together they will provide the collective inputs required for spurring such demand. A strong emphasis placed on the correct use of the proposed information and communications technology is necessary to usher in the use of broadband intensive service. For example, within the areas of federal portals and accessibility and usability of government information, the proper emphasis being placed on the creation and distribution (particularly DRM) of content; content that will demand high bandwidth infrastructure to use. OTHER AGENCY AND LEGISLATIVE EFFORTS As stated, we could not find public documentation suggesting that the Federal government has explicitly evaluated broadband services as a tool to increase efficiency. However, the Federal Government has spent significant effort in trying to understand how to better use information, computer and network technologies to improve efficiency in both internal and external effort (within government and with the public). Further, the federal government is spending a significant amount of funding and effort in promoting ICT outside of government, also as a means of “increasing efficiency and
reducing costs.” Together these initiatives represent what would amount to a significant increase in the available services to the public, which should drive broadband demand.

Page 69
A variety of supply side opportunities exist within the Federal and state government. For example a number of federally funded grants exist to support innovative or otherwise worthwhile network develops projects. The states have similar programs to assist in the funding of network deployment. Prime examples of recipients of such funding include hospitals for telemedicine and schools for remote learning and distance education. Some funding has been used to rewire public and private facilities with fiber optic cabling. The Office of Technology Policy within the Department of Commerce plays a role in promoting the use of technology to improve US economic strength; in fact this is their mission. While much of their focus is on the public side of technology adoption, they also provide guidance on the use of technology within government and between government and the public. Several efforts within this office have loosely looked at the role of broadband as a means to improving US economics. We discussed these efforts in previous sections of this report. The Rural Utilities Service, an arm of the Department of Agriculture, provides grants and loans to rural independent carriers for the development of their networks. This effort clearly could be used to address some of the underserved areas, but may require closer scrutiny by government officials to ensure that it is being used in a manner focusing on the underserved. A list of other efforts follows:
• HUD’s neighborhood networks program funds the development of computing facilities for public use.
• Department of Education funds schools and communities through the Communities Technology Center grants.
• Department of Commerce provides grants to supply low income urban areas with broadband networks.
• Various state governments have passed legislation directed at promoting shared public/private network facilities. They have also created tax incentive programs to invest in underserved areas.
• Numerous conferences have been held at the municipal level to consider how small cities and towns might operate more efficiently by employing technology. This effort has made many recommendations regarding the value of broadband and broadband services to improve the ability to serve the public. Some municipalities are building their own broadband networks to serve both public and private users. Whether good or bad
• The Library of Congress operates a number of useful and well maintained portals, but only a select crowd makes use of this resource. For example, they maintain “Thomas,” which provides up to date resources concerning all legislation within Congress. Other portal includes such things as American history, and an “international gateway.”
Other legislation is pending within Congress that may have an influence on promoting awareness and use of ICT and more specifically broadband. For example, Senate Bill 2582 sponsored by Senator Lieberman was introduced 6/5/2002. It is entitled, “A bill to require a report to Congress on a national strategy for the deployment of high speed broadband Internet telecommunications services, and for other purposes”. It has been referred to the Committee on Commerce, Science, and Transportation. This bill is in agreement with our proposal regarding government initiatives. Further, it makes requirements of the government to look
Page 70
at how it uses ICT. This creates an opportunity to lobby Congress to focus on broadband specifically. Again, while these efforts might not “increasing efficiency
and reducing costs” for government itself, there may be efficiencies gains for commerce and the general public. The question that remains is whether a specific study of the efficiencies broadband could bring to government is warranted. Clearly, the government is making efforts to consider how technology can make them more efficient. Although, while we do believe that government should investigate the use of broadband as a means of improving efficiency, we also believe that this is just one part of a much bigger effort, which appears to be underway. It may be worthwhile for industry to demonstrate/lobby to government why they should be focused more on broadband. This could be in the form of a Congressional request to GAO for analysis of this issue. What online services and applications could be
implemented to improve or add value to Government
service to citizens and businesses via broadband access,
and thus motivate them to subscribe to broadband?
The drivers we see in the short term include; useful and well promoted federal government portals, government to business online service functions, digital library content and local government portals (and online communities). We could speculate on other services and applications, but we view these as not being near term relevant. As mentioned earlier, the Federal Government’s eGov strategy includes initiatives to improve service for consumers and businesses. For this question, we reviewed the eGov initiatives pertaining to Government-to-consumer (G2C) and Government-to-Business (G2B).
G2C initiatives attempt to build easy to find, easy to use, one-stop points-of-service that make it easy for citizens to access high-quality government services. G2B initiatives are aimed at reducing government's burden on businesses by eliminating redundant collections of data and better leveraging E-business technologies for communication.70 Like the G2G and IEE initiatives, these projects are important to improving Government efficiency, but may not explicitly be broadband drivers. One Government service we believe is valuable to stimulating citizen’s use of broadband is www.FirstGov.gov. FirstGov is a Federal Government Portal providing citizens with access to forms, files, reports and endless bits of esoteric Government data. Its ease of use and quality of service has provided FirstGov with a position among Yahoo Internet Life magazine's "50 Most Incredibly Useful Web Sites."71 Currently, FirstGov is accessible and convenient even for users of dial-up connections, but we believe this site is extremely important in generating citizens’ interest in using Government services online. As citizen confidence grows – as well as FirstGov IT staff – new services and applications will develop requiring more bandwidth. GSA and OMB are considering ways to make the existing FirstGov a more comprehensive site.72 This effort extends beyond federal to include state and local resources and focuses on new functionality. They are considering how to employ single sign-on mechanisms to provide this service, dubbed E-Authentication. GSA (with the help of
70 Office of Management and Budget, E-Government Strategy, http://www.omb.gov 71 Matthews, William, “First Gov among 50 most useful,” http://www.FWC.com, 72 FirstGov is the present government gateway portal, see http://www.firstgov.gov

Page 71
Mitretek Systems, a non-profit government research group) is expected to release a Request For Information (RFI) this summer. This effort is viewed as a means of meeting the Government Paperwork Elimination Act requirements, which mandates all agencies to make information and services available online by 2003.73 One vendor with whom the government has considered is Microsoft, which has raised the concerns of a numbers of parties. Most of this concern regards the privacy of information, but others have reservations about the monopoly control that this together with Microsoft .NET might create. A pilot study is presently underway. A second Government initiative we believe is fast becoming a broadband driver is the Library of Congress’ National Digital Library Program (NDLP).74 To date, users can access, via the Internet, video and audio pieces. As popularity grows, we believe this program will build out to all library services. From its kids section, America’s Library, where children will soon be able to play interactive games to its Legislative information site, Thomas, where citizens may one day watch live debates or interact with Government representatives, the Library of Congress will drive consumer broadband demand.75 Obviously, we see the broadband application as library content, including a wide range of specific content, all of which is improved with higher rate connectivity. Citizen demand of broadband via Government services may take hold first at the local level. The 2001 National Technology Readiness Survey (NTRS) found that over half the Internet users surveyed visited a Government
73 “OMB Procedures and Guidance on Implementing the Government Paperwork Elimination Act., M-00-01, 2000. 74 Periodic reports from the Library of Congress’ National Digital Library, http://lcweb.loc.gov/ndl/per.html 75 http://www.loc.gov
website. More interesting, was that only 33 percent of the respondents visited a federal site while 50 percent visited a state or local Government website. Local Government portals can provide voting information on candidates, referendums, digital video of past and live debates, and virtual town halls, where citizens can debate issues with others from the convenience of their own home. It would be advantageous for companies developing broadband infrastructure to address local government as part of its penetration strategy.
Conclusion
Initial results at ascertaining Government connectivity are moderate, creating only a general view. We believe follow up surveys could shed some light on this topic. However, based on conversations with senior officials within US agencies, it is not clear that the government has a clear understanding of this information. Whether the government has “effectively evaluated broadband services and applications as tools for increasing efficiency and reducing costs’, we believe that it has not. A question that remains is if it should. We believe that it may be worthwhile for industry to demonstrate/lobby to government why it should be focused more on broadband. As for Government driving broadband internally and externally, it is moving in the right direction. Instead of finding the killer app, it is slowly developing reliable and user-friendly services and applications to better serve their and their citizen’s needs. Developers should focus on integrating and improving these needs, rather than attempt to identify the next best thing. Targeting services outside of the Federal Governments traditional sphere of

Page 72
influence, like telecommuting and local Portals will provide faster return on investment.

Page 73
Telework and the Demand for Broadband Services76
Introduction: Broadband and Telework
For modern professionals and mobile service providers, working in a traditional "office" environment physically surrounded by coworkers is often neither required nor desired. Modern work arrangements are increasingly fluid and negotiable, as organizations become more decentralized and team-based. Alternative work arrangements allow employees to work "anywhere" with co-workers who may be in remote locations. The move to what we will call "telework" is typically driven by business and economic considerations: organizational efficiency and effectiveness in meeting business objectives, and employee productivity and satisfaction. These drivers have increased in recent years and that trend is likely to continue. Historically, communication and networking technologies are a significant enabler of these work arrangements. In other words, technologies provide the means for teleworkers to remain connected to the office, to information, and to their coworkers. However, it is not clear what level of technological support is needed. Are broadband services needed in teleworking, or if not, are they desired? Are there opportunities in teleworking for increasing demand for broadband services? At least one recent report suggests there is a strong correlation between broadband subscription and teleworking--in a survey of broadband subscribers, 80% of
76 The Telework research team consisted of Michele H. Jackson, Research Driector, Paul Leonardi, and Natalie Nelson.
the households had a teleworker.77 Our study investigates this correlation more closely to determine what technology-related factors are significant to the practice of telework. We reviewed current research on telework, and conducted a set of interviews with teleworkers from several industries. The results are reported here. Organization of this report: This report begins with a review and definition of teleworking, its reach within the U.S. workforce, and various drivers for its adoption at governmental, organizational, and individual levels. Next, we briefly describe the methodology of the study and report major findings. Finally, we offer some key suggestions and recommendations for increasing demand for broadband services among teleworkers.
History of Telework
Organizations and their employees have turned to some form of “working at a distance” for over three decades, for a number of reasons. Originally, organizations turned to telework to reduce costs of travel in reaction to government regulation of non-renewable resources. The possibilities for telework were originally fairly limited, given the state of communication and networking technologies. Over the past decade, the advances in these technologies as well as a rise in the number of organizations that are distributed and global and the emergence of a highly mobile workforce across a number of industries, have helped to transform telework from a novelty into a serious work arrangement considered seriously by government and industry. Employees, through the use of
77 ITIA study

Page 74
communication and networking technologies in their daily work activities, are no longer tied to physical locations or to face-to-face interaction with co-workers and clients. Given current trends, it is reasonable to anticipate that these capabilities may transform our traditional expectations of how people work. Below, we outline a brief history of telework since the term telecommuting was first coined in the mid 1970s.
• The 1970s. “Telecommuting” was first coined in the mid 1970s. In response to the Arab oil embargo, the U.S. government issued a mandate to businesses to help employees reduce consumption of fossil fuels. Employers made telephone and teletype machines available to employees so they could work from home occasionally, reducing overall employee commute to the office. Academic and popular literature predicted that work via telephone would revolutionize the working world.78
• The 1980s. The early part of this decade saw the dawn of the mobile work force in which employees worked from client sites and remote locations. Advances in voice and video technologies supported ‘rich’ meetings with offices in distant locations (at least as compared to what had previously been possible), enabling geographically distributed work teams to function more smoothly. In addition to the telephone, workers began using networked computers and e-mail to communicate with colleagues with whom they were not co-present.
• The 1990s. With the passage of the Clean Air Act of 1990, many companies turned to remote work in order to comply with that mandate. By November
78 e.g., Turoff, M. & Hiltz, R. Network Nation, 1978.
of 1994, the U.S. government required thousands of businesses employing more than 100 people “[to] submit detailed proposals outlining a program deemed by the employer as a way to reduce their employees commute time by 25 percent through car pooling, public transportation incentives, condensed workweeks, or the most practical, cost-effective and popular option, telecommuting.” 79The governments of Massachusetts and Oregon responded with official telework policies,80 and the National Environmental Policy Institute implemented trial telecommuting programs in Washington D.C., Denver, Houston, Los Angeles, and Philadelphia81 Digital communications technologies such as cell phones, pagers, modems, and laptops ensure access to work resources regardless of time and place, thus prompting work to occur away from the office.
• The new millennium. As communication and networking technologies proliferate, researchers and practitioners predict a dramatic change in the way professional work is organized.82 Teams are expected to become global and wireless internet and satellite connections ensure that employees will have constant access to important work materials regardless of their location.
79 (Zelinsky, 1994). 80 http://www.state.ma.us/doer/programs/trans/telecomm. htm 81 http://www.energy.state.or.us/telework/telehm.htm 82 Bailey, D. E., & Kurland, N. B. (2002). A review of telework research: Findings, new directions, and lessons for the study of modern work. Journal of Organizational Behavior, 23(4), 383-400. ; International Telework Association and council, “Telework bosted in 1998 by Internet and economy." http://www.telecommute.org.
Page 75
Telework Today
Conceptions of Telework
Telework today is more than just the idea of working at home. Decentralized organizations, teams and project work, and mobile technologies have simply changed the belief in work as tied to a specific location. The terms used to describe telework over its history show the range of commitment to this belief. Each of these terms possesses a slightly different meaning, yet these configurations possess common core concepts. For example: The term telework is most often used to mean the actual arrangements made and the work done in the alternate work location. Telecommute is often the term used to emphasize the business or management strategy providing the opportunity and choice for employees to work in an alternative location and in turn provide value for the organization. Virtual Office is a related term that extends telework from the individual to the team, or the "operational domain" of work that exists due to communication and networking technologies. E-Work is a recent term, emphasizing the view of work as fluid, continuing beyond the traditional work day. Finally remote
employment typically refers to a specific arrangement in which the worker performs either all or a portion of his or her work at a location other than the employer's central office. The work is fairly well defined (such as a product support) and can be done at the worker's own home or in a teleworking center. Each of these terms highlights a slightly different aspect of working at a distance. For our purposes, a key distinction is the role of technology: if technology supports the work it
is telework, otherwise it is simply remote work. It is important to not conflate all remote work as telework:
"[C]ommentators who fail to separate the two tend to overestimate the frequency of telecommuting and mischaracterize the effects that digital telecommunications may have on the content and context of work.”83 This point emphasizes the need to not focus on a defining word, but instead to accentuate the core attributes of this phenomenon. The following are the core attributes we use in this study:
• The ability to work at a location not specific to the work being done
• Utilizing technologies that provide interconnection with the organization
• Decrease in amount of physical commuting In this framework, communication and network technologies are central. Appropriate technological support allows the teleworker to remain connected to information and to co-workers, minimizing the extent to which the work itself needs to be modified.
Reach
Estimates of teleworking fluctuate greatly. In 1988, roughly 15 million part- and full-time telecommuters were estimated to exist, with 4.9 million having formal telecommuting employment relations. Additionally, 35 percent of home workers owned personal computers, more than twice the national average.84
83 O'Mahony, S., & Barley, S. R. (1999, p. 128). Do telecommunications technologies affect work and organizations? The state of our knowledge. In B. Staw & R. Sutton (Eds.), Research in organizational behavior (Vol. 21, pp. 125-161). Greenwich, CT: JAI Press.) 84 SUNY study

Page 76
Since then, the number of teleworkers has grown immensely. As of 2000, over 28 million Americans were teleworkers located either at home, at a telework center or satellite office, on the road, or, more commonly, in some combination of these85. Most studies of teleworkers typically focus on employees who work solely out of the home, but this classification does not accurately represent the vast majority of teleworkers who alternate between office and remote locations.86 In this broader definition, about one-fifth of the adult workforce 18 years of age and
older do some type of telework.87 Professional specialty occupations telework the most, followed by executive, administrative and managerial occupations and sales occupations.88 Compared to non-teleworkers, teleworkers are significantly more likely to be from the Northeast and West, and to have higher education and income. Women have been shown to have a higher desire to telecommute than men. Age also seems to plays an important role in the predisposition of an employee to telecommute. Younger workers (18-44) are more apt to take up an option to telecommute; however, the option to work remotely is most often given to upper level management.89 Jobs demanding co-presence or other physical types of interaction or contact, or the use of particular facilities, are not conducive to teleworking. Most teleworkers perform information related tasks, such as clerical work, programming, writing, and data analysis. This indicates that mostly professional, white collar workers are prime candidates for teleworking. Work that requires frequent communication and that revolves primarily around data
85 http://www.telecommute.org/twa/index.htm 86 Bailey and Kurland, 2002 87 http://www.telecommute.org/twa/index.htm 88 http://www.mnwfc.org/lmi/trends/mar00/fact.htm 89 (Positively Broadband).
and document manipulation is particularly well suited for telework. However, if a worker relies heavily on co-workers (to accomplish physical tasks, for inspiration, for group brainstorming, or to answer very specific, critical factual questions), working at home can be both slow and frustrating because the teleworker must wait for return phone calls or e-mail messages. Novice teleworkers and their organizations must be careful not to underestimate the benefits of immediate, informal communication for completing work projects, especially complex or ambiguous tasks.
Increasing Opportunities for Teleworking
Government Initiatives Opportunities for telework are growing due to policies implemented by the Federal Government. The following policies specifically aid in the adoption and growth of teleworking positions in the public sector.
• Section 630(a) of Public Law 105-277 or the Flexiplace Work Telecommuting Program authorized government agencies to spend a minimum of $50,000 for fiscal year 1999 and each fiscal year following to create and support a telecommuting program.
• Section 638 of Public Law 107-67 titled the Treasury and General Government Appropriations Act, 2002, requires federal agencies to explain their efforts to promote and utilize telecenters as a portion of their telecommuting program.
• In 2001 a hearing was held to examine telecommuting policies in the federal government the use of telecenters operated by the General

Page 77
Services Administration (GSA). The hearing found that telecommuting “not only alleviates traffic congestion and lowers pollution, but if used strategically, it may be an effective recruitment and retention tool in the federal workplace.”90
The U.S. federal government has described teleworking as beneficial for the following reasons:
• Improves the quality of work and increases productivity due to reduced commute time, decreased stress, and improved morale.
• Focusing on output rather than tracking the hours worked within an office promotes quality of work over time spent at work.
• Providing the opportunity to telework is a tool for recruitment and retention of employees.
• Reducing traffic congestion aids in preserving the environment and lessens the usage of petroleum.
• Teleworking may be useful in reducing the bureaucratic reputation of unavailability by providing services (from a teleworker) when a “duty station” is closed.
• Telework provides employment opportunities for people with disabilities and can also accommodate employees who have temporary or continuing health problems.91
The Federal Government has also advised agencies to write job-specific policies that outline supervisor/employee relationship, responsibilities, proposed schedule, and so forth. This is a prime time to take advantage and advertise the technologies that enable teleworking to be successful.92
90 http://www.house.gov/reform/tapps/hearings/9-6-01/Briefing.htm 91 http://www.opm.gov/wrkfam/telecomm/reasons.htm 92 http://www.opm.gov/wrkfam/telecomm/telecomm.htm
• Although the government has demonstrated support of telework, implementation of telework is not consistent across agencies and security remains a prime concern.
State Initiatives
Many states are either implementing teleworking positions for their governmental employees or they are providing evidence and initiatives for the private sector to implement. States including Arizona, Massachusetts, and Oregon support the promotion and adoption of teleworking, which offers a number of advantages specific to state government concerns:
• Decreasing stress and pollution. Traffic congestion and air pollution due to commutes have been of primary concern. In densely populated areas, commutes are a source of stress for employees that can result in decreased productivity. The Arizona Department of Health Services reported an 18-25% increase in employee productivity as a result of decreasing or eliminating commuting.
• Decreasing energy consumption. Energy consumption is a related factor to traffic congestion and air pollution. Reducing the usage of the non-renewable resource petroleum benefits society.
• Decreasing overhead costs. The State of Arizona for example spends $33 million a year to lease office space for state agencies. They found organizations could utilize telework as an innovative business strategy to reduce leasing costs.

Page 78
Organizational Drivers
Generally, the organizations that adopt telework are those organizations that see it as a solution to their problems of finding and retaining scarce skills, and of cutting costs. Four of the primary organizational drivers for incorporating telework into traditional work practices are:
• Continual escalation of office space rent/ownership costs and the related expenses of security, heat, furnishings, parking, and maintenance.
• The nature of work itself is changing and becoming more "mobile" with workers not using assigned office space nearly as intensively as in the past.
• Highly valued workers with unique skills may demand alternative work arrangements as a condition of their employment; also such arrangements can be used to attract quality employees.93
• Time saved from physically commuting from home to office alone can enhance productivity or efficiency.
Individual Drivers
Individual drivers for telework are centralized around the issue of time. Saving time and having the ability to control one’s time or maintain a more flexible schedule are consistently noted as important drivers for the desire to telework:
• Reducing the time and aggravation of the “daily commute”
• Accommodating health problems
• Alternatives to parental leave, providing time to be with children
93 (Ohio study)
• The ability to minimize work interruptions so as to heighten their ability to concentrate on complex problems
• The ability to control one's own time and schedule, and to avoid micromanagement.
• Desire to increase family time.94
Summary
Based on our review of research, we suggest that the potential market for broadband services among teleworkers will be increased to the extent that broadband (1) improves the ability of organizations to feel connected with their workers, and (2) improves the ability of individuals to control their time and schedule. Only recently have policymakers recognized telework for its potential as a market for broadband services. In September, 2002, the U.S. Office of Technology Policy released on broadband demand,95 with the Assistant Secretary for Technology Policy announcing the day after the report’s release that “already the most significant driver for consumer broadband adoption.” Broadband is predicted to “transform” telework:
“Today's remote employees are teleworking in the same way the Wright Brothers were flying in 1903. Pervasive, high-bandwidth computing will transform work from home or remote locations as thoroughly as it is transforming office-based business processes. “96
94 (SUNY study) 95 OTP, 2002. Understanding Broadband Demand: A Review of Critical Issues. http://www.ta.doc.gov/reports/TechPolicy/Broadband_020921.htm 96 Bruce Mehlman, 2002. “Telework and the Future of American Competitiveness” http://www.ta.doc.gov/speeches/BPM_020923_Telework.htm

Page 79
However, historically, the presence or absence of broadband services in-and-of itself does not appear to act as a driver for either organizations or individuals to choose a teleworking arrangement. And neither does it appear that teleworking drives consumers to broadband, given some current estimates that identify 80% of full time Americans as either teleworking in some capacity, or working with those that do. In this study, we conduct a careful examination of the relationship between work and technology use, with the aim of providing some more concrete understanding of the nature of the relationship, and recommending ways to capitalize on it effectively.
Central Issues in Telework and Technology Use
Our aim in this study was to investigate in more depth the issues surrounding telework and technology. We interviewed teleworkers to understand the nature of their work and the potentials for broadband demand. The initial sample was populated with (1) an open call to students studying in the Interdisciplinary Telecommunications Department at the University of Colorado, and (2) “cold calls” made to leading companies in targeted industry sectors. As a result, we obtained access to companies in several industries, including public relations, computer manufacturing, paper processing, and telecommunications. Using the snowball method of sampling, in which respondents recommend other persons for us to contact, we have conducted a total of 46 interviews with employees representing 10 industries and 20 companies, working in seven states (and one in the
U.K.). Respondents generally shared the following characteristics:
• Professional positions
• High communication needs (working with teams and with clients)
• High information needs (researching, working with documents)
Respondent characteristics are detailed in Appendix A. A standard protocol was used for all interviews (see Appendix B), yielding data points of rough equivalence and therefore allowing systematic comparison across respondents. Interviews ranged from 20-45 minutes, averaging approximately 30 minutes in length.
We sought to have respondents describe not only their use of technology, but also the nature of their work, and their relationship to their organization, their managers, and their coworkers. We identified aspects they were satisfied with, as well as what they wished to see changed or improved. Our strategy was to gather information that would allow us not only to describe the current role of technology, but also to use our understanding of teleworking to uncover potentials and strategies for increasing broadband demand. Our findings fall into four categories:
• Work Issues
• Organizational Issues
• Technology Use Issues
• Broadband-Specific Issues

Page 80
Work issues Surprisingly, past research has rarely examined the work that teleworkers actually do.97 Yet understanding how telework affects work processes is critical to predicting both the potential reach of teleworking across professions, as well as the possibilities for broadband services to support that work. In this study, we were interested in whether respondents saw their ‘telework’ as something unique or distinct from their ‘normal’ work. How did their work practices change for teleworking? We also investigated how they integrated telework with their non-distance work.
Finding 1: “Telework” is just “work.” Respondents do not distinguish telework from “normal work.” They do not segment their work into “office” work and “home” work. Nor do they consider themselves unusual or experimental in terms of their work practices.
• The term used is not considered important. Common terms included remote work, telecommuting, virtual teaming, and virtual office. In fact, many respondents needed to be prodded in order to come up with a special name for what they did. Most simply referred to it as work while some would add that it was work done from home. Respondents did not differentiate work at home from work in the office.
“It’s just that, I don’t know, it’s just funny, like I don’t really think of myself as a telecommuter, but I suppose I sort of am in a way.”
• Teleworkers perceived that they were able to eliminate nonproductive elements of their day,
97 O'Mahony, S., & Barley, S. R. (1999)
particularly travel. Respondents mentioned how working from home was a duplication of the office experience minus the travel and ‘water cooler talk.’ Respondents observed that they were much more productive at home.
“[The reason my company] finally they agreed to have me telecommute was that those two hours [driving] each way, those four hours on average, were essentially dead time.”
• In terms of drivers for adopting telework, our findings support previous research. Respondents consistently offered 3 reasons for starting (1) nature of job (sales, distributed teams); (2) geographic constraints (living far from the office and therefore being unable to work for the company if they had to move/commute); (3) personal issues (wanted to be home with children, physical maladies made travel difficult).
Finding 2: Teleworkers divide their work into “tasks” and “relationships.” Both of these need support. Task
work involves things an individual does alone, including writing, research, data analysis, and so forth. Relationship work involves those things that must be done with others, including meeting with team members and with clients, mentoring, and supervising.
• Telecommuting task work is more efficient and productive, as long as the technology supporting the
work is sufficient. Respondents described needing to go into the office when they had connection issues such as a large file to download and no access to high speed internet at home.

Page 81
• Telecommuting makes relationship work more difficult. Most respondents resisted conducting relationship work over a distance.
“The mentoring part is difficult – you can do it, but it is very difficult, and I don’t think it comes off as genuine. It’s like, this person has never met me, how can they actually care about my personal and professional development.”
The concept of “meeting” someone, of being “face to face” was often identified as critical. Most respondents felt they could not establish or sustain strong relationships through only email or telephone contact. Few offered videoconferencing as an alternative, and some resisted it as an alternative. Given our other findings (e.g., Finding 8, below), however, it is possible that this attitude could change if the technology was reliable and simple to use.
Finding 3: Telework is a continuum. The traditional view that juxtaposes office work to telework is outdated. The extension of the workday beyond “office hours” means that it is more realistic to think of teleworking as a continuum ranging from workers who perform all or most of their work in the office to those that perform all or most of their work at other locations (at home, on the road, at clients’ sites).
Implications Because teleworking often is seen as an “innovative” work arrangement, there is a temptation to identify teleworkers as more innovative also in their use of technology. However, our findings show that teleworkers value feelings of doing “normal” work. Thus, we are discouraged from identifying teleworkers necessarily as
innovators and “early adopters” of new technology.98 Instead, technology must fit into existing work practices seamlessly and transparently. We recommend that the largest opportunity is to meet existing demands of tasks (notably transfers of large files) and relationship building.
Organizational Issues While it is true that there are a growing number of entrepreneurs or self-employed workers,99 most teleworkers are employed by traditional organizations. For many organizations, teleworking is outside what is considered routine work practices. Consequently, issues that must be addressed include negotiation of telework policies, how to set up the worker’s home office, and what kind of training and support to provide. We were interested in how active and supportive organizations were to their teleworking employees. Finding 4: Teleworkers in “non-tech” companies largely are responsible for creating their work environments, including acquiring technological equipment and support. Most respondents were given no additional support in terms of equipment or technical assistance, as compared to traditional office workers. Technology companies tended to provide more resources; employees of these companies noted they were given laptops and even software to use to telecommute more efficiently (such as instant messaging).
• Certain positions are better supported than others. Upper level managers and IT personnel tend to be given laptops that could be taken from the office.
98 Rogers, E. The diffusion of innovations, 1995. 99 Pink, D. 2001. Free Agent Nation : How America's New Independent Workers Are Transforming The Way We Live
Page 82
Junior employees and new hires often were not ‘permitted’ to telework.
• For most workers, technical problems caused them to rely on inefficient processes for solutions. Workers adopt “creative” strategies to solve technological problems. When faced with technology problems, teleworkers stay focused on their task. As a consequence, they adopt whatever strategy “works” rather than a strategy that is the most reasonable from a technical point of view. For example, one respondent described running between her “upstairs home computer” and “downstairs work computer” because the first had a DSL connection and the other did not.
“We have to change our passwords to log into the server every 45 days or so. If you don’t change it, it locks you out. Sometimes I forget or something else will happen and I won’t have access to all of the files I need. When that happens I just take my computer into the…office and hook it up directly to the network. It downloads all of the right settings and my computers work fine. Some of the people in my division don’t have offices they can just go to, so I know it is more difficult for them. I am not sure what they actually do to solve that.”
• Technical support is difficult to provide over a distance. Telework setups differ with each employee, and therefore can challenge IT support units.
“For the most part, it [was difficult to get support] because our St. Louis support teams didn’t really know how to, if you were sitting at home trying to dial and didn’t get access, you’d have to dial and even
though I’m here in California, I have to dial in through the network through St. Louis.”
Finding 5: Formal telecommuting policies and statements of expectations are largely nonexistent. Even when policies exist (usually in tech companies), they may not be effective in guiding action,
“They actually have a telecommuting policy, but I had to clear it with quite a few people. So, even though they had the policy, it wasn’t an immediate action… Which, again, is very interesting because they had it as a policy, but it obviously was not bought into throughout the organization.”
• Organizational expectations that employees would telework were split into two categories: Routine and negotiated. Some organizations expected members to telework – it was a clear job expectation from the beginning. Respondents noted the requirement to telecommute was never discussed explicitly, but that they understood they would work remotely if they took the job. In contrast, other respondents had to negotiate telework into their job, whether for family reasons, sickness, or to avoid relocation.
• Teleworkers are expected to control their own schedule. Some organizations had methods for tracking productivity – such as checking a worker’s Outlook calendar. Generally, however, respondents believed that it was obvious to others whether or not a teleworker was actually doing the expected amount of work (both in terms of productivity and in terms of actual time on the job).
Finding 6: Most organizations provide little to no support for their teleworkers. Teleworkers indicated that they learned “on the job” how to telework. Organizations

Page 83
sometimes supplemented the experience with literature or short training seminars, but not at the outset of the job. The idea of “economic” or “organizational” support—in which the organization helps the employee by shouldering some of the burden of working away from the office—did not resonate with the respondents. They had not considered that possibility.
• There are best practices or lessons to be learned that could be used to support new teleworkers. Although respondents largely felt they did not need training, they were forthcoming with advice. The advice was consistent across respondents, including schedule your work, be able to put it away, and have a separate room from which to work.
Implications
Reports in the popular press offer several “success stories” of organizations that have used telework to transform their businesses. Our research suggests, however, that for the most part, these stories do not represent typical experience. Organizations expect individuals to learn how to telework in the same way that we might expect children to learn to swim by jumping in the deep end of the pool. Organizational policies are ad hoc and fragmented and workers are not given support they need. Yet the trend clearly points to increased numbers of teleworkers in the near future. An opportunity exists for the formation of “telework service providers,” who offer packaged, standardized, “turn key” solutions for organizations or individuals interested in teleworking. These solutions could include not only technical set up and continuing technical support, but also training in how to develop and sustain effective teleworking practices.
Technology Use Issues Technology is the core enabler of telework. It is what makes telework possible. Technology connects workers with their organizations and with each other in real time. Given advances in communications and information technologies – including not only computer-based technologies but also mobile and wireless technologies – many more options are available to today’s teleworkers than to those of the past. Our interest was in gathering a more specific and concrete picture of what technology teleworkers use, and how it is integrated into their work practices. Finding 7: Technology is a core attribute of telework. Results confirmed our expectation that technology is an essential component of telework. Respondents consistently indicated that without the ability to access documents, databases, intranets, etc. they could not do their job.
• Teleworkers consider technology to support their work, but not to drive their work. Technology is the backdrop, a necessary requirement for work; many commented “I don’t even think about using technology in my work, it is just work.” Surprisingly, respondents often had difficulty thinking of how they used technology. They would comment that they used the phone “if that counted as technology” and the computer. Respondents often were ambivalent about technology in general, indicating uncertainty about whether new technologies would really improve their jobs – most did not care about alternate technologies.
• In terms of computer technology, software applications are more salient than hardware configurations. In discussing how they used technology, respondents would often list first the

Page 84
software they used and then finish with a list of hardware. Most respondents used word processing and also email software to communicate messages and share files. Hardware uses were of computers, telephone, fax, cell phone, and occasionally a copier. When asked what technology was the most essential for her job, one respondent commented, “I hate to say it, but email. I don’t know, I can’t, I mean I worked before we had email, but I can’t even imagine how it was.”
Finding 8: Teleworkers use established technologies, but will adopt innovative technologies if they meet communication and information needs.
• Technologies were used primarily for information transfer and for communication with clients and co-workers. Respondents suggested they used computers and the Internet to stay in touch with other members of their teams more than they used the same technologies to create documents.
“[I use technology to keep in touch with people. And to make sure that on the days that I’m not in the office I can keep things moving.”
• Established technologies are seen as most critical. Email and telephone calls are the most critical tools for the teleworker. Email includes attaching reports and other documents. Perhaps because of their reliance on technology, teleworkers were not closed to the idea of using technologies in novel ways. For example, several respondents in a technology company used instant messaging to keep in touch informally with co-workers. One respondent recounted a conference call presentation she was giving when a coworker “IMed” her and pointed out a
mistake which she was able to correct right away. Other respondents described “IMing” as a social outlet. Many respondents noted they did not have videoconferencing; however, no one was really sure they needed it. When discussing video conferencing as a possibility, respondents noted that everyone using it would need high-speed access in order for its implementation to be successful.
• Teleworkers generally did not perceive a need for more technologies or applications. In response to an open ended question concerning whether they felt they needed additional technologies or capabilities that could be provided by technologies, few respondents had any unmet needs. When probed as to whether they would welcome additional capabilities, teleworkers were not resistant, as long as the technology did not interfere with their work.
Implications Teleworkers are not technological innovators. However, teleworkers accept that they depend centrally on technology for accomplishing their work. If a technological capability is made available to them, and once it is integrated into their work routines, teleworkers are likely to come to depend on it.
Broadband-Specific Issues Teleworkers seem prime candidates for residential broadband service. Yet previous studies, as well as this one, support that fact that the availability of a technology is not a sufficient reason for teleworkers to adopt it. Telework does not by itself drive broadband adoption. Given this, we were interested in comparing broadband and non-broadband users in terms of their satisfaction with their technology. The aim of this analysis

Page 85
was to understand more deeply the factors that make teleworkers committed to certain technologies over others. Finding 9: Dial-up connections dominate. With only a few exceptions, our respondents connected through traditional dial-up phone lines rather than through broadband. Several connected though 800 lines, several through an extra business line, and one through satellite (we do not know if this connection was broadband). Not all had broadband service available in their area. For those who did, the decision not to subscribe was the result of a cost-benefit analysis, with benefit having to be measured in terms of increased work productivity. While they acknowledged that slower connections meant wasted time or lower productivity, they would argue they were getting by on what was available.
“I don’t think it [broadband service] is that important. I mean, I don’t have it now and everything gets done fine. I suppose it would be nice if things were faster, but I am not sure that it would make me more productive.”
• High download time is a problem. Many respondents complained of long download times. For those without broadband access, the problem was seen as something that was unavoidable.
• A perceived lack of organizational support was a factor against broadband adoption. Several respondents expressed concern that there was no way to hook up to their network with broadband, and that their company would not pay for broadband.
“If you could find a way to bill it back to the client, which I doubt [they would pay for it]. Because it’s my request that I’m working from home, so, it would be hard to bill to the client.”
Finding 10: Few respondents knew what “broadband” was. Many had no broadband service. Most referred to it or understood it as high speed internet access. “DSL” was sometimes used as a replacement. Employees of technology companies were somewhat more confident in their definitions.
• Respondents with broadband access view it as indispensable. Those who have broadband access swear by it. Without it, they say, they could not do such things as download large files, or use the phone and stay connected simultaneously. They argue that without it, they could not do their job: broadband enables them to be teleworkers.
“Two weeks ago, finally, Hazelnut Creek put in high-speed Internet access through the cable company, absolutely was not available before that time. Drove me crazy. Almost broke up my whole family. We were always fighting over the telephone lines, seriously.”
Finding 11: Requirements of teleworking practices potentially can drive broadband adoption. Respondents are committed to making their arrangements work. These commitments are consistent with the opportunities afforded by broadband, either because broadband can solve current inefficiencies, or because it can meet perceived requirements.
• Downloading is a source of inefficiency. We heard several stories of people doing ridiculous things in order to download files. For example, one respondent who was connected via modem in her downstairs office would run upstairs to her family computer connected through the broadband she personally paid for in order to download a file. She

Page 86
would then save the file to disk and run back downstairs to work.
• “Always on” connection is highly valued. Everyone stressed the importance of sharing files and being constantly connected to the Internet – in many cases the Internet was their sole form of formal communication with the outside world. Respondents described it as their means of communicating with clients, their teams, managers, and so forth. Many respondents saw their cell phone as making them continuously available to others. Dial-up users generally acknowledged they did not have ‘always on’ connection.
• The need to send faxes is a source of inefficiency. Email is used to replace fax but the files are large. Respondents constantly mentioned the waste of time waiting for downloads or being knocked of the connection.
• Multiple and independent means of connection are highly valued. Every respondent mentioned needing an extra phone line. They expanded on this by describing the necessity to separate home life from work life. The extra phone line generally tied into a conversation about the necessity of having a separate environment for work and home.
• High speed, high bandwidth connections are highly valued for relationship building. There is a connection between those respondents who mentioned the face to face connection missing from their telework experience and those who felt the need for a team to all be connected to high speed internet. This points to the importance of connection to relationships. Examples of connection could be through video or audio conferencing, or instant messaging.
Implications As noted above, the key to unlocking telework as a driver for broadband adoption is “getting a foot in the door.”
There is an opportunity for improved branding and product recognition. Further, the primary drivers for broadband adoption among teleworkers seem to be (1) increasing efficiency of specific tasks that require transmission of information, (2) allowing continuous and reliable connection to the organization and to each other.
Conclusions and Recommendations We began by asking two questions: Are broadband services needed in teleworking, or if not, are they desired? Are their opportunities in teleworking for increasing demand for broadband services? Our results suggest that the first question should be asked in reverse. First, are broadband services desired? Teleworkers who have broadband access are strongly committed to it. Broadband has changed their perception of the minimum amount of technology required for them to be productive. However, aside from a few instances, it has not generally changed the substance of their work: the actual work remains much the same. What does change is the ability of the teleworkers to manage time and manage relationships – both of which are core challenges to working at a distance. Teleworkers who don’t have broadband services don’t necessarily desire it. In fact, they might not even know what it is. They would not phrase it as “wanting broadband” (or the services or content that broadband could deliver); instead, they are motivated to remove the problems created by dial-up access. Second, are broadband services needed in teleworking? Broadband services will be needed to the extent that teleworkers must exchange large amounts of information and must communicate frequently with others. Adapting

Page 87
and capitalizing on the trends in this area are critical for capturing a “teleworker market.” Teleworkers deal mainly in documents and conversations. The size of documents is steadily increasing, and can be expected soon to overload dial-up configurations. If technologies for communication become mainstream—such as instant messaging—teleworkers are likely to turn to always-on connections to meet these core needs. Third, are there opportunities in teleworking for increasing demand for broadband services? Our results suggest the following strategies might increase demand: 8. Make broadband affordable to teleworkers
specifically. For example, negotiate with organizations for reduced cost broadband access for their workers. Teleworkers are accustomed to paying for components of their technological support. Reducing the cost of entry while specifically supporting telework may drive adoption with an added effect of increasing the number of teleworkers.
9. Emphasize improved productivity and efficiency,
rather than increased content. Although teleworkers do use the Internet for research, none perceived that they could not get desired content. Many teleworkers were upwardly mobile: appeals to improving their individual performance could be effective.
10. Further investigate technology for supporting
relationships. Building and maintaining relationships was perceived as the biggest challenge in telework. However, we do not have enough evidence to conclude what technologies or work practices would help teleworkers to address this challenge. Continued study in this area is recommended.
11. Package excellent technical support with broadband access. Teleworkers are not technological innovators, in part because they must have a low tolerance for error. If their technology fails, they cannot be productive. Relying on company IT units is risky because they are not on site. Teleworkers may be willing to purchase broadband if the service can be highly reliable and backed by fast, premium service that extends to application support (email, web, FTP, VPN).
12. Work with access providers or organizational
consultants to develop a “turn-key” telework package. Given the steady rise in teleworkers, and the continuing ad hoc nature of telework arrangements, this could be a significant opportunity.
13. Emphasize the reliability and stability of broadband
access, rather than its ability to support new and innovative work practices. Teleworkers are more likely to adopt technologies that are established. They are also more likely to adopt them if they seem similar to what they already have—but just better at it. Our respondents saw broadband simply as a ‘faster’ dial-up.
14. Finally, make broadband easier to understand.
Though there may still be debate over what broadband can be, or should be, the fact is that many respondents did not know what “broadband” was.

Page 88
APPENDIX A Respondent Characteristics
The sample for this study was 47 individuals working at a distance with others and supported by technology. 21 different companies, entrepreneurial ventures, or governmental agencies were represented. Size and scope of companies ranged from individual start-ups to state level (governments) to international. Respondent locations:
• California
• Colorado
• Florida
• Idaho
• London
• Ohio
• Utah Industries/Sectors:
• Computer manufacturing
• Telecommunications
• Paper manufacturing
• Organizational consulting
• Publishing
• Marketing
• Public relations
• Stockbrokering
• Engineering design
• State government
• Public affairs
• Banking
Positions held: Entry Level through Vice President Level (assistants, managers, managing supervisors, district managers, partners, executives, vice presidents) Professions/Job Titles:
• Account Management
• Author
• Consultant
• Engineering design/product manager
• Government Affairs Officer
• IT application specialist
• IT System Architecture and Design Operator
• Market Analyst
• Marketer
• Product Manager
• Relationship Manager
• Sales Professional
• Stocktrader

Page 89
Appendix B Interview Protocol
Teleworking Research Project University of Colorado.
Michele Jackson, Research Director. June 11, 2002
[If consent given, begin interview] [Stylistic note 1: Replace (1) name of specific company they work for where schedule calls for ‘organization’ and (2) term they use for telework, given in answer to first question.] [Stylistic note 2: These are in-depth interviews; therefore, the subject may answer them out of order. Be aware of this and skip over questions that have already been answered, transitioning to the question following. Always prompt for specific examples when you can.]
I. Arrangement
We’re interested in people who work at a distance – telecommuting, or teleworking. What do you call it? How long have you been teleworking? How did you get started? Listen/prompt for:
Did you have to negotiation with your boss? How supportive were they?
Were there barriers or problems What made you decide to telework? Do you enjoy it? Why or why not? What kind of support do you get from your company? Listen and prompt specifically for:
Economic support
Technical support Social support Training Has that support changed over time? Is it enough? What did it take to set it up? How much did the company set up for you, and how much have you had to do (gotten to do) on your own? Do you have all you need? What technology has turned out to be essential or most valuable? Why?
Is this a surprise? Any support/capabilities you don’t have, but wish you did? Have you ever had any problems with your set up? How were the problems solved?
II. Work
What kind of work do you do? Listen for: Formal Responsibilities, Job description, etc. as well as informal description Has your work changed since you started teleworking? Describe a typical day in your job. Describe a typical week. How much control do you have over your time or your schedule? [If they have a lot] - Do you do anything special to control your own work? What do you enjoy about your job? How do you use technology to do your work?

Page 90
Prompt for: and so, what are the
specific ways you need to use different technologies?
Listen for: software used, hardware
used, connections used, databases, etc. especially uses
that require (1) big pipes or (2)always on connection.
How important is networking technology to doing your job? How much of your work depends on technology? Has the way that you work with technology changed because of teleworking? Has you job been made easier, or more difficult because of TW? Look and prompt for lots of e.g.s in these areas: Social Economic Technical Does teleworking help you to do your job better (than if you couldn’t telework)? Any part of your job you can’t do at a distance? Why? What do you do to get that part of your job done? Could you do it if you had the appropriate technology (e.g., broadband, wireless)
III. Relation to the organization
What’s your position in the organization? Is this is a standard position in the org? (or more entrepreneurial?) Do others in positions similar to this telework?
Do you feel your organization generally is supportive of telework? In what ways? Why do you think they are/aren’t. How important is teleworking to the way your company works? Who gets to telework in your org? What is it like not to have to go into an office everyday? Listen for: Control, time, scheduling, etc. How would you describe your relation to the organization? (Possible follow-ups: Do you fit well? Feel loyal? Needed? Etc. ) How connected do you feel to the organization? Has this changed over time? YES: In what ways? Why? NO: Why not? Does having network technology help you feel connected to the org at all?
YES: How? Can you give an example?
NO: Why not? What does it take for a person in this organization to feel connected? To feel a part of the organization? Does the organization do anything to help you feel more connected to it? (events, programs, policies, etc.) Do you want to feel connected/more connected to the organization? YES: In what ways? How would you do that? (through tech or not?) e.g., information exchange, FTF visits, visuals, always on, “presence”

Page 91
NO: Why not? [may have answered this above]
IV. Relation to others
How often do you work with others? Who are they? Do they telework? Describe your relationship with these others [If not included above, then prompt as appropriate]
What about with your manager? With your subordinates With your team members?
How do you keep in touch with them? Do you feel connected to them? [try to distinguish from organization connection] Do you think they feel connected to you? Are there any times that your work requires meeting face to face with others?
Describe
V. Relation to self
What do you see yourself doing in 5 years? What are your career goals? Do you see teleworking now as having any affect on that? Within the organization? Overall? What is the effect? Why / why not? Do you have any advice for other people who are thinking about teleworking? Benefits / drawbacks Anything you would do differently a second time around? VI. That’s all for my questions. Is there anything you’d like to add? Or to ask me?

Page 92
Appendix A – Survey Respondent Comments
Caseid Q48 Comment 10020 Q46 - Retired w/only Social Security Income and a few hundred dollars in interest from savings account. (WEB TV is my only
internet access. If this is classified as a computer. 10037 Many of your ISP options don't exist. I work for an ISP & they pay for my access. This affected my answers. 10042 Search engines, are great tools to gather information when doing any research for any school work e-mail is important so you
can keep in touch with others who live far away. 10045 I don't know much about satellite connections. I would strongly consider switching to cable access, I live in the boonies and its
not available. Also, the 2 dollars was a nice touch, it made me feel more obligated to fill this out. Glad I could help. 10051 Cost is important to me as far as internet access - Because I use it at work most of the time - so I rarely need it at home - so
hwy pay a lot. 10061 Your survey missed a crucial reason I do not have high-speed access - amount of hassle with the provider over installation,
customer support. I once ordered high speed access. After 3 bungled attempts at coordinating installation, I gave up because I didn't want the hassle. (If they can't install it, why should I believe they can maintain service?) In contrast, the dial-up has NEVER had an interrupting in service (yes, really!) and doesn't even send bills. I don't care if the connection is slow - it is hassle-free. this is the most important reason I stay with dial-up, and it was not part of your survey considerations.
10063 I am not willing to pay a lot for internet service for no more than my family has time to use it. I will be getting service this week though.
10076 We are about to retire (in 3-5years). 10078 I have access to free high speed reliable internet at work - therefore I won't pay a lot for it at home - cost is most feature. 10096 Will probably get a computer sometime in future. 10102 I just happened to be a poor choice for this survey as I am elderly. It was fun though! Thanks. 10110 All the answers he gave would be what I would choose or not choose in a internet service. I still think internet access is
outrageous to afford. 10133 Very fast is better but not worth over $50 a month. 10144 I had DSL (SBC -Ameritech) - low reliability and speed; high cost 50/mo - I now went back to dial up (17/mo -reliable Earthlink). 10149 Paying for internet access sucks! RIP OFF! 10153 My answers will show that I valve speed, reliability and an always on connection. Something you did not mention at all that is
very important to me is the ability to connect multiple computers to the internet, this is a mush-have. 20176 Although I answered to the best of my ability…frankly I don't really understand computers much less the internet. I did
however understand the $$ as the 2 things that keep us from getting a computer: 1. Initial cost + 2. Ongoing cost! Thank you!
20181 My 2nd phone line $20 plus my ISP $122.95 totals $32.95. I would pay up to $35 per month for always on fast service. 20189 I enjoy using the internet but monthly expenses are a great concern to me. I do use it to find information and stay in touch.
Speed is a secondary concern. 20203 I or we don't use the net much but don't like being frustrated when we do., If we did use it more I wouldn't pay is more. But
why pay for something you don't use. 20205 See front. I teach elementary school. Computer is always on at school. Use home computer mostly for e-mail and letter
writing. 20216 Looking for a cheaper monthly fee faster connection and not get kicked off so much. 20226 I am moving from dial up to cable access. I think it's too expensive. In 10 years fro internet and broad band to be viable,
homes will be pre connected. Needs to be immediate, reliable, a part of everyday life. 20247 Always on, fast or very fast, no more than $60, very reliable. Not much preference on install time. 20251 When answering, would I switch to various options, many were "maybe" and I answered those "yes".

Page 93
20267 Always on is a good idea but I think it is also a waste of energy. 20290 DSL, cable are charging to much for small business and home. 20291 Cost & availability. 20294 Would enjoy higher speed access but currently the cost is prohibited. 20297 At this particular time in my life, I am not willing to pay more for convenience b/c I am a college student and I have access to
high speed connection, when necessary. 20300 Currently have a reliable high speed cable system installed, works good no complaints 20310 Make it fast, make it cheap, make it reliable! 20314 #43 Did not answer, has no categories that describes me! I am an AMERICAN, born an raised in this U.S. of AMERICA! 30356 I would be willing to go DSL is the mo. Rate were around $25.00 for most of what I use the internet for I just don't need high
speed (mostly email, news, some audio). 30368 I pay $40 for always on, very fast reliable service. It's too much, but I pay. Any drop in service or rise in cost, and I'd find
another hobby. Sorry for the delay - I lost the original thanks for the two. 30380 My wife is the prime user of the internet in general. I will use it on occasion for other than work purposes but keep a separate
e-mail address that I give out. The junk mail and ads go to this address, and allows me more efficient use of e-mail for business purposes.
30383 Price plays a big part in picking an internet provider. 30398 Since we only use internet 10-15 hrs a week, cost is a main factor for us. I wouldn't switch to another service (we're currently
on MSN) unless it was faster than our dial-up, but no more than $35 a month. Our current service is very reliable and not much slower than our DSL at work.
30420 My boyfriend who lives with me makes most of the decisions discussed in your survey, so I relied on him for some of the answers.
30431 none 30455 I work from home w/high speed access wife/kids use phone modem and AOL 30466 I would use a High Speed internet connection every day for 15-30 min to obtain information. This service would be worth
approx $35- since more and more internet accounts are charging money to obtain information. 30468 I have MSN and it's pretty fast, but I don't like getting ton's of e-mail from advertisers and you can only block 240 or so. 30481 I welcome high speed internet - however I do think it is a bit pricey and would have contemplate the pros and cons. 30486 We mostly use our computers and internet at work. 30488 I don’t use computer much. So with Juno on line, its free. Don't use computer much. Only play games. 30490 Computers are frustrating to use and understand. Each time I turn it on, I hate it more. I would not mind paying for a good
internet service if I could pay only for the time on line, I will not pay a monthly fee for something I use as little as possible. 40526 Single parent family work pays for my internet. 40531 Currently, my internet cost is more expensive due to a dial-up contract I do not use. Next March it is finished so my monthly
cost will be reduced by $25.00 month. 40541 Because we don't use the internet often, we need it to be low-cost, but reliable, so that when we do want to go on, we can. 40547 Don't have a computer, would like to have one. 40552 My office is very close to home (10 minutes) so it is easy to access the internet via a T1 connection there. If that were not the
case, I would have already installed direct high-speed access at home, and in the next few months, we do plan to that anyway. 40593 I'm not into the internet. Just sometimes, for fun thank you for the money. Happy in Vegas. 40600 We used to have a computer and had the internet but we sold it when we had a baby the extra $$ - no time to use the
computer. 40602 I would not really want to switch to any of the examples you gave because I currently have cable modem which is always on
very fast very reliable and only $45/month. 40622 My current financial situation dictates cost as the stand - out primary consideration. Improvements are certain to alter my
answers. 40623 I cancelled my land line phone because I saw no need to pay for two phones. My cell phone comes with software & a cable
that allows it to emulate a modem. I am a computer professional who surfs at work & emails at home.

Page 94
40637 Use only email and have vtech companion. 40647 I work for fun part time in the office at an Animal Hospital. We have four computers. Do all the balancing & reconciling at the
end of each day. The computer is wonderful. I give all my earnings to church and my grandchildren. I work for fun (part-time). 40653 President, S-Corp Accounting Firm. No degree after 4 1/2 years college due to car crash and subsequent decline in health. 40668 New person. Don't know much yet! 40676 I only use the computer when I need to loop up something in classifieds or a movie time. I don't really care about the internet. 50708 Reliable, very fast always on week - $17.00 per month - have use of phone while surfing. 50711 Have had a computer for two years, always get kicked off by AOL, must stay on it for 3 years or pay AOL (composure) for
computer (get in free for going on line with them for 3 years) Will change access company when contract mass out. 50724 I personally do not use the internet but have my secretaries or technicians use it as search for many materials, etc. 50735 Price means a lot!!! 50741 I choose not to utilize new technology, even after attending and passing basic computer technique. 50767 A need very fast, very reliable, reasonable cost internet access. A do not need always on.- 50769 I don’t' think I am much help in this survey seeing I am too old to have need of this. But it is very useful to others thank you. 50776 Our internet service is through our TV cable Co. 50830 I am too old to start. 50831 Price is important - I would probably contact my children more often but I still enjoy learning their voices when we call each
other. 50833 Cost and reliability would be the two most important factors since I am a homemaker. I have not yet learned how to really use
the internet. 50847 I would like something to hook up to that is fast, reliable, not too expensive - and could hook up wireless on my laptop. 60877 price of internet access is the most important factor since I don't use it at home very often. 60883 Don't have computer or on line not interested in any of them. Not interested in internet. 60905 Only use the Internet occasionally. 60920 I have a full computer set up which has never been plugged in. I do not know how to use it - yet! 60962 As a retiree, cost is most important to me. I do work part - time for extra income and will not work full time. 60975 Very satisfied with our foresat service - it nearly duplicate that which & experienced during my work at the university. This is a
service of a municipal utilities. 60987 My name is Sharma White. William White Jar is deceased. So I filled out the survey I was his daughter. Thanks for the 2
bucks. I hope this helps. 60998 My wife pays the phone bills internet bills, so I'm not sure what the amounts are - sorry. 60999 My 4 children with college degrees use the internet extensively for information and access to newspapers - I have taken 3
courses at Community Colleges but do not feel friendly with a computer. Tried several free internet offers but felt it was too complicated.
61013 Time of day of "not always on" would be useful. I have but don't subscribe to high speed cable service for cost and other reasons.
61015 Right now for me cheaper is better. 61021 I am completely satisfied with my current internet service and would not switch for any reason 61023 AOL on my computer is very slow since computer is older model - I don't use it much, find very little items of interest. 71052 Cost is a primary factor in switching from dial-up for me. 71057 Cost of the service is very important but so is speed and reliability. 71064 Sorry couldn't be of more help. 71071 The two dollars surprised me. Thank you. I hope to have a computer/internet access by next year. Our local cable TV
company just started offering cable internet access. 71080 Cost is important, but I would pay more for FAST, RELIABLE access. Always on doesn't matter to me because I'm limited on-
line use.

Page 95
71093 Reliable access #1, speed 2, cost 3. Your questionnaire on Internet leaves out the most important issue, the provider! My first provider was not reliable: often service was interrupted for hours due to problems. When I changed providers the first provider took all my emails saying the emails were their property! The second provider was great until they came up with a new program which you were, forced to switch to with Yahoo. It took out my Internet Explorer; mail came in to the mail sorter as if you had lost your connection and was hard to read! I requested the SBC get this program off my computer and with help I was able to get rid of most of it. Thank heavens I had an update for Internet Explorer which I was able to install. My current provider did not provide a disk to get a connection as they first two providers did, which these programs still "haunt" me. I only had to change my phone number access; it is painfully slow but hasn't messed up my computer to date, didn't add clutter on my hard disk, costs about the same. DSL or cable is not available at this time.
71104 I am on the internet at work for most of the day, for home use, price is the most important aspect. 71136 I currently have cable access which is fast enough for me and is in the price range that I like. 71137 Cost is an important factor followed by reliability. 71148 My son complete the survey. 71171 My experience with free internet services is that they are unreliable and annoying (advertising). $10/month for dial-up is a
reasonable cost to acceptable speed for my home use. I also don't have cable TV - why pay for something that you can get for free.
71183 I am 65 years old and do not know too much about the internet and probably will not use it. Therefore did not answer the "options" because didn't think it would be of any use to you.
71189 I want: always on, very fast, very reliable and $20/month. (installation time is not important) 71201 We will be getting a laptop soon. 81246 Cost of internet access is ridiculous. As long as I have internet access at work, I will not pay more than $30/month for a fast
connection. 81265 Always on very fast $30. Very reliable. 81289 I use Netzero - free internet. 81292 I have high-speed internet access at work, so I'm not willing to pay much to have it at home. 81298 The internet is very important to me because I have a daughter with special needs. 81301 While we value internet access, our current usage pattern does not justify ( to us, at least) spending more than $10/month, no
matter how desirable the access features may be. We currently use Juno, which offers free internet access. 81312 Live in a apt., alone don't need computer. 81327 I am employed by a telecommunications CO and get phone and internet at a discounted rate. 81330 High-speed access should be a standard and available in all areas. The price to have high-speed access is too high. 81345 We're happy with what we have for the amount we use it. 81366 Have a hands cape and mother live with. Take are of mother. I do not have a computer, but my daughter has. I do use her &
my sister has one I use. 81374 I seldom use the internet and have perhaps a dozen or so people I exchange e-mail with. 99999 Living on "fixed" income. Prices keep going up - can't keep up with cost of living! Thanks for the $2.00.