broadband, site selective and time resolved photoluminescence
TRANSCRIPT

lable at ScienceDirect
Current Applied Physics 14 (2014) 72e81
Contents lists avai
Current Applied Physics
journal homepage: www.elsevier .com/locate/cap
Broadband, site selective and time resolved photoluminescencespectroscopic studies of finely size-modulated Y2O3:Eu3þ phosphorssynthesized by a complex based precursor solution method
Sudeshna Ray a, b, *, Sergio Fabián León-Luis c, Francisco Javier Manjón a,Miguel Alfonso Mollar a, Óscar Gomis d, Ulises Ruymán Rodríguez-Mendoza c,Said Agouram e, Alfonso Muñoz f, Victor Lavín c
a Instituto de Diseño para la Fabricación y Producción Automatizada and MALTA Consolider Team, Universitat Politècnica de València, 46022 València, Spainb Department of Applied Chemistry, National Chiao Tung University, Hsinchu 300, Taiwan, ROCc Departamento de Física Fundamental y Experimental, Electrónica y Sistemas and MALTA Consolider Team, Universidad de La Laguna, 38200 San Cristóbalde La Laguna, Santa Cruz de Tenerife, Spaind Centro de Tecnologías Físicas and MALTA Consolider Team, Universitat Politècnica de València, 46022 València, Spaine Departamento de Física Aplicada y Electromagnetismo, Universitat de València, 46100 Burjassot, València, Spainf Departamento de Física Fundamental II, Instituto de Materiales y Nanotecnología and MALTA Consolider Team, Universidad de La Laguna, 38200 SanCristóbal de La Laguna, Santa Cruz de Tenerife, Spain
a r t i c l e i n f o
Article history:Received 22 May 2013Received in revised form30 July 2013Accepted 31 July 2013Available online 7 September 2013
Keywords:NanophosphorSize-modulated synthesisStructureRamanPhotoluminescenceEu3þ
* Corresponding author. Department of Applied ChUniversity, Hsinchu 300, Taiwan. Tel.: þ886 3 573169
E-mail addresses: [email protected], sudes
1567-1739/$ e see front matter � 2013 Published byhttp://dx.doi.org/10.1016/j.cap.2013.07.027
a b s t r a c t
Undoped and Eu3þ-doped cubic yttria (Y2O3) nanophosphors of good crystallinity, with selective particlesizes ranging between 6 and 37 nm and showing narrow size distributions, have been synthesized by acomplex-based precursor solution method. The systematic size tuning has been evidenced by trans-mission electron microscopy, X-ray diffraction, and Raman scattering measurements. Furthermore, size-modulated properties of Eu3þ ions have been correlated with the local structure of Eu3þ ion in differentsized Y2O3:Eu3þ nanophosphors by means of steady-state and time-resolved site-selective laser spec-troscopies. Time-resolved site-selective excitation measurements performed in the 7F0 / 5D0 peaks ofthe Eu3þ ions at C2 sites have allowed us to conclude that Eu3þ ions close to the nanocrystal surfaceexperience a larger crystal field than those in the nanocrystal core. Under the site-selective excitation inthe 7F0 / 5D0 peaks, energy transfer between the sites has also been observed.
� 2013 Published by Elsevier B.V.
1. Introduction
Luminescence nanomaterials have gathered enormous techno-logical importance in the newmillennium because theymay have anumber of potential advantages over conventional micron-sizedones. In particular, the image resolution on a cathode ray tubedisplay is closely related to the particle size of the phosphors and ithas been established that smaller particles are favorable for higherresolution [1]. Besides, nanophosphors offer the possibility ofsmoother films with higher packing densities thanmicrophosphorsand a larger percentage of cathodoluminescent active materials atlow-excitation voltages due to reduced electron penetration depth
emistry, National Chiao Tung5; fax: þ886 3 57 [email protected] (S. Ray).
Elsevier B.V.
[2]. On the other hand, the unique electronic structure and thenumerous well defined optical transitions involving the electronsof the 4f shell in trivalent rare earth (RE3þ) ions embedded ininorganic hosts make them potential candidates for many appli-cations, including lamp phosphors, fiber amplifiers, high densityoptical storage materials, and electroluminescent display devices[3e7]. Consequently, extensive research efforts have been under-taken on RE3þ-doped nanophosphors during the last two decadesdue to their novel size-dependent optical properties for their po-tential applications in the photonic and biophotonic fields ofresearch [8].
Yttria (Y2O3), with cubic bixbyite structure at ambient condi-tions, is a transparent material from the UV (230 nm) well into theinfrared (w8 mm), is optically isotropic and hard, and accepts RE3þ
ions in the trivalent state without charge compensating problemsor ion-size limitations. Besides, Y2O3 has one of the smallest

S. Ray et al. / Current Applied Physics 14 (2014) 72e81 73
frequencies of the dominant phonon (380 cm�1) among the knownoxides [9], thus favoring high quantum efficiencies of the RE3þ
emitting levels. Therefore, the optical properties of bulk RE3þ-doped Y2O3 have been extensively studied and have shown that it isan excellent laser host material, with high brightness as a red colorphosphor, acceptable atmospheric stability, reduced degradationunder applied voltage and lack of hazardous constituents asopposed to sulfide phosphors [10e12]. It has a lumen equivalentbrightness of 70% relative to 611 nm light and radiant efficiency ofapproximately 8.7% with better saturationwithout any detrimentaleffects [13] and laser action has been observed at 611.3 nm [14].Owing to the fascinating perspectives of the industrial applicationof nanophosphors and RE3þ-doped yttria, a considerable effort hasbeen made in the last years in the synthesis of Y2O3:Eu3þ nano-particles to control and improve the luminescence properties ofthese nanophosphors [1,15e22]. It is well known that the opticalproperties of the RE3þ ions are governed by JuddeOfelt (JeO) feftransitions, which depend on the environment of these ions in ahost matrix, and due to the static electric field produced by thesurrounding charge distribution corresponding to the anionneighbors. The inter-electronic interaction between the electrons ofthe inner 4f shell of the RE3þ ions and the charge of the host ligands,all distributed in a particular local point symmetry, is known as thecrystal-field (CF) interaction and it rules the fine structure splittingof the free-ionmultiplets and the forced intra-configurational 4fe4felectric-dipole transition probabilities [23]. Consequently, theluminescence dynamics of the RE3þ ions incorporated in nano-particles, including the spontaneous emission and the energytransfer probabilities, depends on the environment; i.e., the hostlattice, the nanoparticle size and shape, the RE3þ ion concentration,and the symmetry of the site occupied by RE3þ ions [24e30].
In order to analyze the influence of the RE3þ environment on theoptical properties of RE3þ-doped hosts, Eu3þ has usually beenemployed as a structural probe because of the large sensitivity of itsluminescence on the local environment, which takes place mainlyin the visible range between themultiplets of the low energy terms,5D0 and 7FJ (J ¼ 1e4) [31,32]. However, the most important andunique feature of Eu3þ ions is the existence of allowed 7F0 4 5D0crystal-field transitions, i.e., transitions between singlet (non-degenerate) levels [31,32]. Consequently, it is possible to selectivelyexcite the Eu3þ ions in a particular environment in which absorp-tion energy is resonant with a laser light, provided that the laserspectral line-width is much narrower than the inhomogeneousbroadening. This technique, known as fluorescence line narrowing(FLN), allows obtaining valuable information about the energy levelstructure, crystal-field parameters, lifetimes, homogeneous line-widths or energy transfer processes between ions in different en-vironments in the solid [31e35].
In the present work, we report the synthesis of undoped Y2O3and Eu3þ-doped Y2O3 nanoparticles, with selective sizes rangingfrom 6 to 37 nm, by a complex-based precursor solution method.Crystalline structure, morphology, and vibrational properties of theas-synthesized nanopowders have been studied by means of X-raydiffraction (XRD), transmission electron microscopy (TEM), high-resolution transmission electron microscopy (HRTEM), selectivearea electron diffraction (SAED), and Raman scattering measure-ments. Structural characterization witnesses the growth of high-quality nanophosphors. With the help of lattice dynamics ab initiocalculations we have analyzed Raman scattering measurements inboth doped and undoped nanocrystals and have found evidence ofelectronic Raman scattering of Eu3þ ions in cubic Y2O3 nano-phosphors, which may substitute Y3þ ions in either of two sites C2or S6 (also noted C3i). The photoluminescence properties ofY2O3:Eu3þ nanoparticles have also been characterized and the finesize-tuning of such properties in nanocrystals is discussed with the
help of broadband and time-resolved site-selective optical spec-troscopies. In this context, the most interesting point, and one ofthe novel outcomes of this research, is that the luminescencemeasurements suggest a continuous variation of the crystal field onEu3þ ions at the C2 sites in the cubic nanocrystals. Therefore, wepropose the existence of different kinds of sites in Y2O3 nano-crystals, whose proportion depends on the nanophosphor size: i)undistorted C2 and S6 sites, similar to those of bulk Y2O3, in the coreof the nanocrystals; and ii) continuously-distorted C2 and S6 sites atthe vicinity of the nanocrystal surface. Moreover, we report thepresence of a band at 582.4 nm in all the nanophosphors related tothe occupancy of Eu3þ in a third site completely different to the‘true’ C2 or S6 sites, which cannot be associated to other symmetriesfound in other Y2O3 nanophosphors.
In summary, although the synthesis of Y2O3 nanoparticles withsizes below 10 nm is not novel, herein, we report a methodology forthe fine size-tuning of well-crystallized cubic nanophosphorssubstantiated by XRD, Raman and Photoluminescence spectros-copies and, to the best of our knowledge, this is the first report ofsite selective broadband excitation on 6-nm-sized high-qualitycubic Y2O3:Eu3þ nanocrystals, evidencing the occupancy of Eu3þ
in different sites in small nanophosphors.
2. Experimental procedure
2.1. Synthesis
Undoped and Eu3þ-doped (1 at. wt%) Y2O3 nanoparticles wereprepared by a complex-based precursor solution method, in whichtriethanolamine (TEA) was used as a complexing agent [18,36]. Inthe synthesis, an aqueous Y(NO3)3 solution, along with stoichio-metric amount of an aqueous Eu(NO3)3 solution for doped samples,was mixed with the requisite amount of TEA by maintaining metalion to TEA mole ratio at 1:4. At the beginning, TEA formed a pre-cipitate with metal ions likely due to the formation of metal hy-droxides, like yttrium hydroxide [Y(OH)3]. To get a clear solution,this precipitate was dissolved by adding concentrated HNO3 to thesolution. For this purpose the pH must be kept between 3 and 4because for smaller pH, Y(OH)3 decomposes and a homogenoussolution is formed where TEA can make metal-coordinate com-plexes. The clear solution of TEA-complexed metal nitrate wasevaporated on a hot plate by continuous heating at 180e200 �Cwith constant stirring that led to foaming and puffing. Duringevaporation, the nitrate ions provide an in situ oxidizing environ-ment for TEA, which partially converts the hydroxyl groups of TEAinto carboxylic acids. Upon complete dehydration, the nitratesthemselves decomposed with the evolution of brown fumes ofnitrogen dioxide, leaving behind a voluminous, organic-based,black, fluffy powder, i.e., the precursor powder. Complete evapo-ration of the precursor solution resulted in a highly branchedpolymeric structure, with the metal ions homogeneously lodged inits matrix and thus preventing the segregation of nanoparticles.The precursor mass was then divided into four parts and subse-quently calcined and annealed at different temperatures like500 �C, 600 �C, 800 �C and 1000 �C for 2 h in order to obtain theundoped and Eu3þ doped Y2O3 nanoparticles of different sizes.
2.2. Morphological, structural, vibrational and opticalcharacterization
Morphology, size, size dispersion, and structure of the nano-crystals at ambient conditions were analyzed by high-resolutiontransmission electron microscopy (HRTEM), and selected areaelectron diffraction (SAED) with a Tecnai G2 F20 field emission gunTEM under an acceleration voltage of 200 kV. Samples for HRTEM

Fig. 1. Cubic bixbyite structure of Y2O3. O correspond to small (red) atoms while Ycorrespond to large (blue) atoms. Dark blue atoms are those located at C2 sites whilelight blue atoms are those located at S6 sites. (For interpretation of the references tocolor in this figure legend, the reader is referred to the web version of this article.)
S. Ray et al. / Current Applied Physics 14 (2014) 72e8174
measurements were deposited onto 300 mesh copper TEM gridscoated with 50 nm carbon films. Nanocrystals dispersed in acetonewere placed on the grid dropwise. The excess liquid was allowed toevaporate in air.
Structural characterization and phase identification of thenanopowders was carried out by powder XRD measurements witha Rigaku Ultima IV diffractometer equipped with a vertical goni-ometer and the Cu Ka (1.5406 �A) as the incident radiation source.
Vibrational properties of the Y2O3 nanophosphors were studiedby means of Raman scattering measurements performed with aHORIBA-Jobin Yvon LabRam HR UV microspectrometer with athermoelectrically-cooled CCD camera using the 632.81 nm line ofan HeeNe laser with a resolution better than 2 cm�1.
Luminescence properties of Eu3þ-doped Y2O3 nanopowders inthe visible range were measured after a broadband excitation at395 nm with a 450 W Xe arc lamp. Emissions were focused with aconvergent lens onto a 0.75 m single-grating monochromator(Jobin Yvon Spex 750M) with a resolution of 0.1 nm coupled to aphotomultiplier tube (Hamamatsu R928). Time-resolved site-se-lective excitation and emission spectra were measured by excitingEu3þ ions with a 10 ns pulsed optical parametric oscillator OPO(EKSPLA/NT342/3/UVE) using a digital storage oscilloscope (LeCroyWS424) coupled to the detection system.
2.3. Calculation details
First principles lattice dynamics calculations were developed tohelp in the interpretation of Raman scattering measurements inyttria nanoparticles. It is well known that the phase stability andthe electronic and dynamical properties of semiconductors are welldescribed by DFT-based total-energy calculations [37]. Therefore,we performed ab initio total-energy calculations in bulk Y2O3 withthe Vienna ab initio simulation package (VASP) [38] using theplane-wave method and the pseudopotential theory within thedensity functional theory (DFT) [39]. The projector-augmentedwave scheme (PAW) [40] was implemented in this package totake into account the full nodal character of the all-electron chargedensity in the core region. Basis set including plane waves up to anenergy cutoff of 520 eV were used in order to achieve accurate,highly converged results and an accurate description of the elec-tronic properties. The description of the exchangeecorrelationenergy was performed with the generalized gradient approxima-tion (GGA) with the PBEsol [41] prescription. A dense special k-point sampling for the Brillouin Zone (BZ) integration was per-formed in order to obtain very well converged energies and forces.The structure was fully relaxed to their equilibrium configurationthrough the calculation of the forces and the stress tensor. In therelaxed equilibrium configuration, the forces on the atoms are lessthan 0.004 eV/�A and the deviation of the stress tensor from a di-agonal hydrostatic form is less than 0.1 GPa.
Lattice dynamics calculations of phononmodes were performedat the zone centre (G point) of the Brillouin zone. For the calculationof the dynamical matrix at the G point we used the direct method[42] that involves a separate calculation of the forces in which afixed displacement from the equilibrium configuration of the atomswithin the primitive unit cell is considered.
3. Results and discussion
3.1. Structural and morphological properties
As already commented, bulk Y2O3 usually crystallizes in thecubic bixbyite phase (space group Th7, Ia-3), which is one of thetypical structures of RE3þ sesquioxides (C-type). In this structure, Yions are surrounded by six O ions generating an assembly of two
types of distorted YO6 octahedra since there are two possible po-sitions for the Y ion: i) a site with inversion symmetry of S6 (or C3i)local point symmetry and, ii) a site with no inversion symmetry ofC2 local point symmetry, both highlighted in Fig. 1. Since there are24 C2 (24d) sites and 8 S6 (8b) sites in the unit cell, there are threetimesmore Y3þ ions at C2 sites than at S6 sites, whereas O atoms arelocated at 48e sites with C1 point symmetry. On the other side, ametastable monoclinic structure can be obtained after quenchingfrom high pressures and temperatures in micron-sized Y2O3 par-ticles [43], despite the stable structure at ambient conditions is thecubic bixbyite structure.
The morphology and sizes of Eu3þ-doped and undoped yttriananoparticles have been analyzed by means of HRTEM measure-ments. All nanoparticles have mainly spherical shape as shown inFig. 2(a). The average sizes of samples annealed at 500, 600, 800,and 1000 �C for 2 h have been estimated by measuring over 100particles to be 6, 13, 21, and 37 nm, respectively. It is worth notingthat the size dispersion obtained from the full width at halfmaximum (FWHM) of the size distribution peak of each batch isfound to be less than �15% of the average size [as shown inFig. 2(b)]. Thus quite sharp and narrow distributions of nano-particles are synthesized by the proposed method. From theHRTEM image shown in Fig. 2(c) the lattice spacing betweendifferent layers of doped yttria nanoparticles of 6 nm was calcu-lated to be 3.2 �A, which likely corresponds to the (222) plane ofcubic phase Y2O3. The distance between the planes correspondingto (222) plane in bulk Y2O3 is 3.05 �A, which is smaller than thedistance obtained for the nanocrystal annealed at 500 �C. Thus,from HRTEM pictures of undoped and doped yttria nanoparticles,we can conclude that for both cases the distance between latticeplanes is larger for the nanoparticles, indicating an increase in thelattice parameter of the nanoparticles accompanied by the decreasein their sizes. HRTEM pictures indicate the good quality of the 6 nmsized Y2O3:Eu3þ samples annealed at the rather low temperature of500 �C. This is further confirmed by the rather narrow rings ob-tained by SAED (Fig. 2(d)).
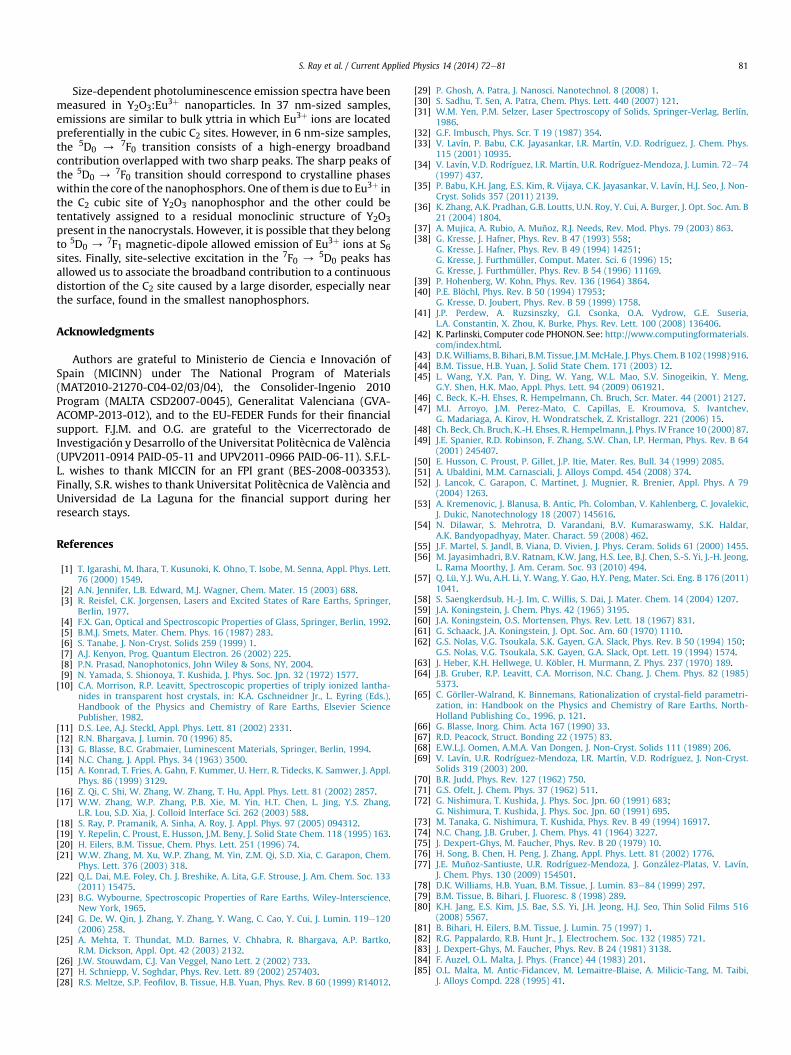
Fig. 3 shows the XRD patterns of Eu3þ-doped yttria nano-particles obtained after different annealing temperatures. Theyexhibit only peaks consistent with cubic phase (JCPDS 43-1036) andno additional peaks of other phases, like monoclinic Y2O3 andEu2O3 [44], or broadband contributions from an amorphous phasehave been observed even in the smallest nanoparticles synthesized.
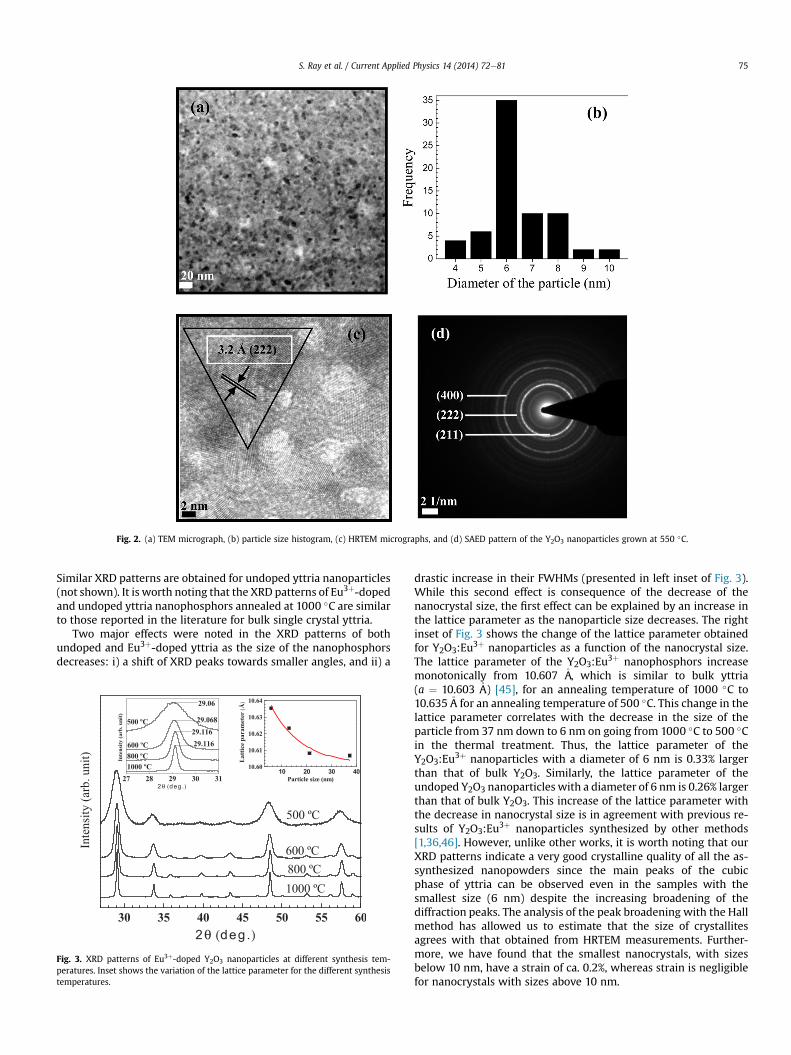
Fig. 2. (a) TEM micrograph, (b) particle size histogram, (c) HRTEM micrographs, and (d) SAED pattern of the Y2O3 nanoparticles grown at 550 �C.
S. Ray et al. / Current Applied Physics 14 (2014) 72e81 75
Similar XRD patterns are obtained for undoped yttria nanoparticles(not shown). It is worth noting that the XRD patterns of Eu3þ-dopedand undoped yttria nanophosphors annealed at 1000 �C are similarto those reported in the literature for bulk single crystal yttria.
Two major effects were noted in the XRD patterns of bothundoped and Eu3þ-doped yttria as the size of the nanophosphorsdecreases: i) a shift of XRD peaks towards smaller angles, and ii) a
Fig. 3. XRD patterns of Eu3þ-doped Y2O3 nanoparticles at different synthesis tem-peratures. Inset shows the variation of the lattice parameter for the different synthesistemperatures.
drastic increase in their FWHMs (presented in left inset of Fig. 3).While this second effect is consequence of the decrease of thenanocrystal size, the first effect can be explained by an increase inthe lattice parameter as the nanoparticle size decreases. The rightinset of Fig. 3 shows the change of the lattice parameter obtainedfor Y2O3:Eu3þ nanoparticles as a function of the nanocrystal size.The lattice parameter of the Y2O3:Eu3þ nanophosphors increasemonotonically from 10.607 �A, which is similar to bulk yttria(a ¼ 10.603 �A) [45], for an annealing temperature of 1000 �C to10.635�A for an annealing temperature of 500 �C. This change in thelattice parameter correlates with the decrease in the size of theparticle from 37 nm down to 6 nm on going from 1000 �C to 500 �Cin the thermal treatment. Thus, the lattice parameter of theY2O3:Eu3þ nanoparticles with a diameter of 6 nm is 0.33% largerthan that of bulk Y2O3. Similarly, the lattice parameter of theundoped Y2O3 nanoparticles with a diameter of 6 nm is 0.26% largerthan that of bulk Y2O3. This increase of the lattice parameter withthe decrease in nanocrystal size is in agreement with previous re-sults of Y2O3:Eu3þ nanoparticles synthesized by other methods[1,36,46]. However, unlike other works, it is worth noting that ourXRD patterns indicate a very good crystalline quality of all the as-synthesized nanopowders since the main peaks of the cubicphase of yttria can be observed even in the samples with thesmallest size (6 nm) despite the increasing broadening of thediffraction peaks. The analysis of the peak broadening with the Hallmethod has allowed us to estimate that the size of crystallitesagrees with that obtained from HRTEM measurements. Further-more, we have found that the smallest nanocrystals, with sizesbelow 10 nm, have a strain of ca. 0.2%, whereas strain is negligiblefor nanocrystals with sizes above 10 nm.

Table 1Ab initio theoretical (theo.) and experimental (exp.) frequencies of Raman modes inY2O3. Experimental Raman modes frequencies for bulk Y2O3 of Ref. [19] have beenadded for comparison.
Peak/mode u (theo.) cm�1 u (exp.) cm�1 u (exp.)a cm�1
Fg 125.7 116Fg 133.4 129Ag 156.0 161Fg 178.5 179Eg 191.2 193Fg 230.5Fg 238.2Fg 313.8 318 318Fg 320.0Eg 326.8 329 329Fg 348.8Ag 356.3Fg 378.7 376 376Eg 382.3Fg 392.6 399Ag 419.6Fg 430.0 429 429Fg 460.2 469 469Fg 521.3 526Ag 554.5 564 564Eg 559.9 564 564Fg 583.3 591 591
a Data from Ref. [19].
S. Ray et al. / Current Applied Physics 14 (2014) 72e8176
3.2. Vibrational properties
According to group theory [47], the irreducible representationof the optical Raman active modes in cubic Y2O3 is:Gop ¼ 4Ag þ 4Eg þ 14Tg. Thus, there are twenty-two Raman-activemodes, where Eg and Tg (or Fg) modes are doubly and triplydegenerated, respectively. The Raman-active modes of cubic Y2O3can be divided into fifteen modes (3Ag þ 3Eg þ 9Tg) coming fromthe vibration of O ions in the 48e Wyckoff positions and sevenmodes (Ag þ Eg þ 5Tg) coming from the vibration of Y ions in the24d Wyckoff positions. Curiously, Y ions located at 8b (S6) sites donot contribute with any Raman-active mode and, therefore, con-ventional Raman scattering cannot provide information on theoccupancy of these sites.
Fig. 4 shows the room temperature Raman spectra of Y2O3 andY2O3:Eu3þ nanoparticles obtained by annealing at different tem-peratures. Raman spectra of Y2O3 nanocrystals are dominated by the376 cm�1 mode with Ag þ Tg symmetry. All the observed Ramanmodes at around 318, 329, 376, 429, 469, 564 and 591 cm�1, sum-ming a total of 7 Raman-active modes, are consistent with thosealready reported in the literature for the cubic phase [19]. Therefore,our Raman scatteringmeasurements confirm that all undoped Y2O3nanoparticles crystallize in the cubic bixbyite structure irrespectiveof the nanocrystal size and that there is no trace of Ramanmodes ofother phases even in the smallest nanoparticles. On the other hand,Raman spectra of Y2O3:Eu3þ nanoparticles show some extra modesalongwith the Raman-activemodes of the cubic phase. In particular,the intensity of the 429 cm�1 mode seems to be greatly enhancedand some peaks at around 452, 491, and 604 cm�1 appear in theRaman spectrum of Y2O3:Eu3þ nanocrystals. These features havebeen previously reported in Y2O3:Eu3þ nanoparticles [36] and wereattributed to the Eu3þ doping effect without further explanation. Allthese results suggest that the lattice vibrations of Y2O3 are verysensitive to the presence of Eu3þ ions in the sites of the Y3þ ions,although XRD patterns could not find differences in the crystalstructure between Y2O3 and Y2O3:Eu3þ nanoparticles.
Interestingly, two major effects were noticed in the Ramanspectra of both undoped and Eu3þ-doped yttria as the size of thenanophosphors decreases: i) a shift of Raman peaks towardssmaller frequencies, and ii) an increase in their FWHMs; inparticular, many Raman bands become more asymmetric at thelow-frequency side. These effects can be observed in the inset ofFig. 4(a) and right inset of Fig. 4(b) for the main Raman peak of Y2O3near 376 cm�1. The change in linewidth of the Ramanmodes can beexplained by the inhomogeneous strain broadening associatedwith the small dispersion in particle size and by phonon
Fig. 4. Raman spectra of undoped Y2O3 (a) and Eu3þ-doped Y2O3 (b) nanophosphors obtainpeak in undoped nano-crystals.
confinement [48,49]. On the other hand, Husson et al. has reportedan increase of many Raman-active mode frequencies in cubic Y2O3as a result of application of pressure [50]. Since this effect can beascribed to the contraction of YeO bonds with increasing pressure,the decrease in the Raman frequencies we have measured atambient conditions with the decrease in the nanocrystal size iscontrary to the effect of pressure and can be ascribed to the elon-gation of YeO bonds [45,50]. In fact, a similar low-frequency shift ofthe main Raman peaks of sesquioxides has been found onincreasing lattice constant [51]. Therefore, this result is indicative ofthe increase of the lattice parameter of the cubic unit cell withdecreasing nanoparticle size and confirms the result observed byXRD as well as HRTEM measurements previously commented.
In order to explore the nature of the extra modes appearing inthe Raman spectra of Eu3þ-doped Y2O3 nanoparticles we havecompared the frequencies of the Raman-active modes measured inY2O3 nanocrystals with 37 nm size (those with the lattice param-eter most similar to bulk material) with the ab initio calculatedfrequencies for bulk Y2O3 at ambient conditions. Our experimentaland theoretical frequencies and those of other experimental data
ed at different synthesis temperatures. Inset shows a zoom of the most intense Raman

575 600 625 650 675 700
580 590 600
(x25)7F
4
7F3
7F2
7F1
Inte
nsit
y (a
rb. u
nits
)
Wavelength (nm)
5D0
7F0
(x25)
7F17F0
6 nm
13 nm21 nm37 nm
Fig. 5. 5D0 /7FJ (J ¼ 0e4) emission spectra of Y2O3 nano-phosphors doped with 1 at.
wt% of Eu3þ ions annealed at 500 �C (red) and 1000 �C (black) for 2 h under broadbandexcitation of the 7F0 / 5L6 transition at 395 nm at RT. Blue vertical marks at thebottom of the figure represent the positions of the emissions of Eu3þ ions in bulk Y2O3.Inset shows the 5D0 / 7F0,1 emission spectra of the nano-phosphors annealed at 500,600, 800 and 1000 �C for 2 h corresponding to sizes of 6, 13, 21, and 37 nm, respec-tively. (For interpretation of the references to color in this figure legend, the reader isreferred to the web version of this article.)
S. Ray et al. / Current Applied Physics 14 (2014) 72e81 77
reported in the literature are compared in Table 1. It is clear that thenew bands observed in Eu3þ-doped Y2O3 nanoparticles do notcorrespond to any of the first-order Raman-active modes of cubicY2O3. Furthermore, they seem not to correspond to any of the first-order Raman-active modes of monoclinic Y2O3 or of Eu2O3 clusters[52e54]; otherwise, peaks at other frequencies would be observed.Moreover, they cannot be attributed to photoluminescence fromEu3þ ions since our laser line (632.8 nm or 15,798 cm�1) cannotexcite the Eu3þ ions from the 7F0 ground state above the 5D0 level at17,215 cm�1, as will be discussed in the next section. Our ab initiocalculations, which provide the frequencies of the 16 Tu infraredactive modes and the Au and Eu silent modes, seem to indicate thatthey do not correspond neither to infrared-active modes nor tosilent modes allowed by the loss of the translational symmetry innanocrystals. Finally, it is rather curious that these extra modes arenot observed in Raman spectra of Y2O3 nanoparticles doped witheither Sm3þ, Dy3þ, Yb3þ, or Er3þ [55e57]. Therefore, we are led tothink that they are due to the activation of new vibrational modesrelated to Eu3þ ions. They can be related to a resonance effectoccurring only for Eu3þ ions excited with the red laser, since suchan effect seems not to be present even in Y2O3:Eu3þ nanoparticlesexcited with blue or green light [17,58].
In this respect, many papers have reported the occurrence ofelectronic Raman scattering of rare earths in different hosts whenexcited with the HeNe laser. In most cases, the frequencies of themodes measured in electronic Raman scattering match with thefrequencies of the closest levels of the RE3þ ion to the ground stateobtained by luminescence measurements, as occurs for the elec-tronic Raman scattering of Eu3þ ions in YGG, YVO4, and Y2O3 [59e61]. In other cases, electronic Raman scattering can provide infor-mation on RE3þ ions at sites showing no luminescence. This is thecase of Ce3þ ions in Y2O3 which shows resonant effects that allowobtaining the energy levels of Ce3þ ions located in C2 or C3i (S6) sitesdepending on the excitation laser energy [62]. Since our Ramanmeasurements do not show the characteristic peaks of the 7F1 levelsof the Eu3þ ion in C2 sites in Y2O3 [62] the new modes observed inEu3þ-doped samples could be due to levels of the Eu3þ ion occu-pying S6 sites in Y2O3. In particular, the strong mode at 429 cm�1 inY2O3:Eu3þ nanocrystals can be ascribed to electronic Raman scat-tering due to the transition between the 7F0 ground state and thehighest Stark level of the 7F1 multiplet of the Eu3þ ions located in C3i(S6) sites [63,64]. Furthermore, the 429 cm�1 mode shows a fre-quency shift and broadening as nanocrystal size decreases similar tothat of themain Raman peak of Y2O3 as presented in the left inset ofFig. 4(b). Unfortunately, we have not been able to obtain more in-formation regarding the nature of the extra peaks located at 452,491 and 604 cm�1 whose changes of frequency, intensity, andwidthare more difficult to analyze for the different nanocrystal sizes.Further work is needed to clarify the nature of these bands.
In summary, the presence of Eu3þ ions in S6 sites is confirmed byour Raman spectroscopy measurements. The frequency shift andFWHM increase of the Raman bands of both undoped and dopednanocrystals as nanocrystal size decreases substantiates the finesize tuning of the nanophosphor as evidenced by XRD. Moreover,using structural arguments for the isomorphic substitution of theY3þ ions by Eu3þ ions, it is expected that Eu3þ ions in the Y2O3 hostoccupy the C2 and the S6 types of sites with approximately equalprobability. Consequently, since there are about three times moreC2 sites than S6 sites it is expected that there are 3 times more Eu3þ
ions at C2 sites than at S6 sites, as already commented.
3.3. Photoluminescence properties
Optical spectroscopy, and especially the time-resolved site-se-lective fluorescence line narrowing (FLN) technique, also allows
studying the distribution and the structure of the environments ofRE3þ ions in solids [31,32]. For that purpose, it must be taken intoaccount that the optical transitions between any two states of theoptically active ion are governed by different selection rules forthese two sites. The CF interaction can be expanded in odd and eventerms allowed by group theory applied to a particular local sym-metry site. The odd CF Hamiltonian is responsible for the mixing ofthe wavefunctions of the 4fN ground configuration with those ofopposite-parity excited configurations and it gives rise to forcedelectric-dipole optical transitions within the ground configuration,forbidden for the free-RE3þ ion. On the other side, the even parityCF Hamiltonian breaks the free-RE3þ ion multiplets and gives riseto the hyperfine crystal-field, or Stark, energy levels structure of theRE3þ ion [65] Consequently, the CF acting on the Eu3þ ions at C2sites of cubic Y2O3 contains both odd and even CF terms and,therefore, magnetic- and electric-dipole transitions are bothallowed. However, for Eu3þ ions at S6 sites, which have a center ofinversion, the CF Hamiltonian contains only even terms and,consequently, only magnetic- and vibronic-coupled electric dipoletransitions can be expected [66]. These considerations suggest thatnearly all the Eu3þ emission transitions are originated in only one ofthe two sites available for the Eu3þ ion; i.e., the C2 site.
3.3.1. Broadband excitationThe electronic energy level scheme of the Eu3þ ions in solids
consists of seven 7FJ (J ¼ 0e6) multiplets well separated (around12,000 cm�1) from the 5DJ (J ¼ 0e4) ones and other stronglyoverlapped excited multiplets above the 5D3 state at around25,000 cm�1 [31e33] The luminescence takes place mainly in thevisible range between the multiplets of the low-energy terms, 7Fand 5D. Fig. 5 shows the room temperature emission spectra of theEu3þ-doped Y2O3 nanophosphors with sizes of 6 and 37 nm ob-tained under broadband excitation of the 7F0 / 5L6 transition ataround 395 nm (25,316 cm�1). Note that when Eu3þ ions areexcited to levels above the 5D0 state there is a fast non-radiativemultiphonon relaxation to this level because of the small energydifference between all the involved levels. However, Eu3þ ionsdecay radiatively from the 5D0 level because the large energy dif-ference to the closest 7F6 level prevents the possibility of

577 578 579 580 581 582 583 584
98
76
543
21
0.5 0.250.1
5D0 excitation wavelength (nm)
0.030Delay (ms)
7F0
5D0
Fig. 6. Inhomogeneous excitation profile of the 7F0 / 5D0 transition in an Y2O3 nano-phosphor doped with 1 at. wt% of Eu3þ at 13 K.
S. Ray et al. / Current Applied Physics 14 (2014) 72e8178
multiphonon relaxation. Therefore, the quantum emission effi-ciency of 5D0 / 7FJ transitions is close to the unity.
Different peaks corresponding to the 5D0 / 7FJ (J ¼ 0e4) tran-sitions can be observed in Fig. 5. The 5D0 / 7F1 (585e605 nm)transition shows magnetic-dipole character and is allowed by allthe selection rules independently on the composition of the hostmatrix [67e69]. The 5D0/
7F2 (608e635 nm) and 5D0/7F4 (685e
720 nm) transitions are electric-dipole in nature and are forced bythe odd CF Hamiltonian. The 5D0 / 7FJ (J ¼ 0,3,5) emission tran-sitions are strictly forbidden in the frame of the intermediatescheme of the JuddeOfelt theory [70,71]; i.e., they do not obey theselection rules for the forced electric-dipole transitions: if the initialor final state is a singlet (J ¼ 0) then jDJj ¼ 2,4,6. Therefore, the lowintensities of the 5D0 /
7F0 (around 580 nm) and 5D0 /7F3 (640e
675 nm) transitions of Eu3þ in cubic Y2O3 can be explained by the J-mixing effect; i.e., the mixing of wavefunctions of a given J-Starkstate with those of the closer J multiplet states through the B2q, B4qand B6q even CF parameters. This process induces an effectiveborrowing of intensity from the other electric-dipole transitions[69,72,73], especially from the high intense 5D0 / 7F2 hypersen-sitive transition.
According to group theory, the degeneracy of all the levels ofEu3þ ions at the low-symmetry C2 site is completely lifted, givingrise to a number of Stark levels equal to 2J þ 1 ¼ 1,3,5,7,9 withangular momentum J ¼ 0,1,2,3,4, respectively. Since the 5D0 initialemitting level is non-degenerate, the emission bands show astructure due CF splitting of the 7FJ (J ¼ 1e4) levels. Thus, a com-plete identification of the number and energy positions of the 7FJStark components have been obtained from the peak energies,which completely fit the energy levels observed at the C2 site inY2O3:Eu3þ cubic single crystal [10,74,75]. For comparison, the peakenergy positions of the Eu3þ ions in bulk Y2O3 single crystal havebeen indicated by vertical blue lines at the bottom of Fig. 5 [75]. It isworth noting that this identification is valid independently of thesize of the nanophosphor, since no additional peaks, which couldbe related to other phases, have been observed in any of thenanophosphors, except for the weak peak at around 582.4 nm thatwill be discussed later. Thus, it can be concluded from lumines-cence measurements that, with the present method of synthesis, acubic structure has been obtained for all the Y2O3 nanophosphors,independently of the annealing temperature. This conclusion is inagreement with the XRD and Raman scattering measurementspreviously discussed.
Important differences in the linewidths of the emission peaksare observed for nanocrystals with different sizes (see Fig. 5 and theinset). All emission peaks show a large broadening for the smallestnanophosphors (6 nm), which is especially evident whencomparing the 5D0 / 7F3,4 emissions. With the increase of theannealing temperature and the size of the nanoparticles, theemission bands become more defined and sharper, resulting in aspectrum quite similar to that measured in bulk Y2O3. These resultsindicate that: i) all Eu3þ ions occupy the same crystallographicposition (C2 site) in the core of the nanophosphors, which is thesame as in the bulk material, and named hereafter as the ‘true’ C2site and, ii) in the smallest nanophosphors there is an inhomoge-neous broadening of the emission profiles due to the existence of acontinuous distribution of C2 environments for the Eu3þ ionsrelated to distortions, or relaxations, of the yttria structure closer tothe surface of the nanoparticles in which a higher segregation ofEu3þ ions to the surface occurs. It is evident that higher annealingtemperatures favor the generation of a nanomaterial with cubicstructure of larger size and better crystallinity and with homoge-neous location of Eu3þ ions in ‘true’ C2 sites. A similar behavior canbe assumed for those Eu3þ ions located at the S6 sites (observed inelectronic Raman scattering) as the nanocrystal size increases.
3.3.2. Time-resolved site-selective spectroscopyTo obtain more information about the inhomogeneous broad-
ening of the emission bands in the smallest nanocrystals, the7F04 5D0 transitions between singlet (non-degenerate) levels havebeen analysed in detail. These transitions give single peaks thatcannot be splitted by any local point-symmetry crystal field aroundthe Eu3þ ion. Consequently, any additional peak observed for thesetransitions should be directly related to other available Eu3þ sites inthe nanophosphors of the cubic phase or another one, eithercrystalline or amorphous.
The 5D0 / 7F0 and 5D0 / 7F1 transitions for four differentnanophosphors are shown in the inset of Fig. 5. It can be clearlyobserved that there is a broadband contribution to the short-wavelength side of the 7F0 / 5D0 transition for the smallestnanophosphors (those annealed at 500 and 600 �C). This broad-band overlaps with the single peak associated to Eu3þ ions in the‘true’ C2 site at 581.2 nm and also with the peak associated to Eu3þ
ions in a second phase at around 582.4 nm, which is present in allEu3þ-doped nanophosphors.
We have performed time-resolved excitation spectra associatedto the 7F0/ 5D0 transition in the smallest Eu3þ-dopednanoparticles(6 nm) and obtained by detecting the 5D0 / 7F1 transition at 13 Kunder a pulsed laser excitation (Fig. 6). A broadband detection at593.0 nm has been chosen since a contribution from all the envi-ronments and sites of the Eu3þ ions to this emission is expected. Thespectra are presented normalized to the emission of the Eu3þ ions inthe ‘true’ C2 site at 581.2 nm. The spectrum taken 30 ms after the laserpulse resembles that of the steady state emission spectrum of Fig. 5except that the peak at 582.4 nm is completely masked by theemission of the Eu3þ ions in the ‘true’ C2 site. The large broadbandcontribution to the short-wavelength side of this single peak is dueto the overlapping of homogeneous 5D0 /
7F0 spectra of Eu3þ ionslocated at different environments or sites in the nanophosphor.Therefore, many emissions have slightly different energies thanthose of Eu3þ ions in the ‘true’ C2 site. Increasing the time delay afterthe laser pulse results in a faster decay of the emissions from theseenvironments compared to the emission of Eu3þ ions in the ‘true’ C2site. Furthermore, both emissions decay much faster than theemission of the second phase, which can be seenwith an increasingintensity with the time delay respect to the ‘true’ C2 site.
To interpret these results it must be recalled that XAS mea-surements of Qi et al. observed an increase of structural disorder inY2O3:Eu3þ nanophosphors on decreasing size from 40 to 9 nm [16].They concluded that Eu3þ and Y3þ ions located near the surface of

Fig. 7. FLN emission spectra to the 7FJ (J ¼ 1, 2) levels exciting selectively the 5D0 levelin the 6 nm size Y2O3 nanophosphor doped with 1 at. wt% of Eu3þ at 13 K. Spectra arenormalized to the maximum of the high-energy peak of the 5D0 / 7F1 transition.Excitation wavelength is indicated for each spectrum in nm. The upper spectrum hasbeen obtained exciting selectively the 5D1 level at 527 nm in an Y2O3 nano-phosphordoped with 1 at. wt% of Eu3þ at 13 K.
S. Ray et al. / Current Applied Physics 14 (2014) 72e81 79
the nanoparticles had a higher coordination than those far from thesurface and this result was observed for the two phases coexistingin the nanoparticles: one crystalline Y2O3:Eu3þ and one amorphousunknown phase. In this context, Song et al. [76], suggested that theproportion of surface atoms in Y2O3:Eu3þ nanocrystals is quite high(about 80% for w5 nm particles) compared to bulk sample (lessthan 1% forw3mm sample), thus enhancing the proportion of localdisplacement andmaking the near surface of the nanosized particleparticularly unstable. Moreover, an amorphous phase has been alsoobserved in several works reporting monoclinic and cubic Y2O3nanophosphors, where it has been suggested that they could be dueto faceting between nanoparticles, necks between particles, thepresence of adsorbates or particularities in the chemistry of theparticle’s surface [20,43,44].
On the basis of the above arguments, we tentatively attribute thebroadband contribution in the smallest nanoparticles to Eu3þ ions inadistributionof environmentswith an increasingfluctuationof theirlocal structures due to differences in the Eu3þ-ligand bond distancesand angles when reaching the surface of the nanoparticle. In fact,since the broad shoulder appears at the short-wavelength side of the7F0 / 5D0 excitation we can assume that this broadband is associ-ated to Eu3þ ions located in environments that feel stronger CF in-teractions with their ligands. Thus, in 6-nm-size nanophosphors,there would be a large dispersion of environments for the nano-structures with distorted cubic structure leading to stronger CF thanthose present in the ‘true’ C2 cubic sites (observed in the nano-structures with larger sizes) of the bulkmaterial. In otherwords, the‘true’ cubic C2 sitewould act as a ‘parent structure’ that, after suitabledistortions, would give rise to all the distribution of environmentsfor the Eu3þ ions present in the smallest nanophosphors. This hy-pothesis is supported by the strain and the large increase of thelattice parameter that we have measured in the smallest nano-crystals. These two facts allow a large proportion of Eu3þ ions toreside in distorted environments of the ‘true’ C2 and S6 sites of thecubic structure, a hypothesis coherent with the large segregation ofEu3þ ions to the surface in the smallest nanophosphor. Note that inthe largest nanocrystals studied (37 nm size) there is a negligiblestrain and the lattice parameter is similar to that of the bulk Y2O3single crystal; thus, all Eu3þ ions reside in ‘true’ C2 and S6 sites.
The existence of a variety of local structures in our smallestnanophosphors becomes evident after exciting selectively withlaser light within the 7F0/ 5D0 excitation profile. Fig. 7 presents thetime-resolved site-selective spectroscopy (FLN) emission spectra ofthe 5D0 /
7F1 transition exciting selectively the high-energy side ofthe 7F0 / 5D0 band. Differences in the local sites of the Eu3þ ions inthe nanophosphor are clearly reflected in the number of peaks andthe emission wavelengths of the transitions to the three 7F1 Starklevels, especially for the emission to the 7F1 lowest energy Starkcomponent that shows a large sensitivity with the laser excitation[33e35]. As shown in Fig. 7, three peaks are observed for the5D0 / 7F1 transition after the excitation of Eu3þ ions at 581.2 nm.They confirm the existence of a low symmetry and weak CF actingon Eu3þ ions in the ‘true’ C2 site. However, when exciting at lowerwavelengths in the range from 578.0 to 580.4 nm within theinhomogeneous broadband contribution, some extra peaks areobserved at around 587.4 and 596 nm. These extra peaks could beascribed to emissions of the Eu3þ ions both at the C2 sites, for thepeak at 587.4 nm, and at the second site, for the peak at 596.0 nm,after a simultaneous laser excitation or due to energy transferprocesses between Eu3þ ions at different sites or environments [77].
In order to selectively excite the second site, the FLN techniquehas been applied within the 7F0 / 5D1 transition exciting at527.0 nm at 13 K and its emission spectrum is shown in Fig. 7. Apartfrom the emission peak at 582.4 nm, there is a structured emissionin the 592e597 nm range that can be correlatedwith the extra peakat around 596.0 nm observed in the emission under selectiveexcitation at the short-wavelength side of the 5D0 band. In thisrespect, Tissue and Yuan [44] have identified different contribu-tions in the excitation spectrum of Eu3þ in 5-nm-size Y2O3:Eu3þ
nanophosphors due to the coexistence of phases: the cubic Y2O3structure, the monoclinic Eu3þ:Y2O3, and the monoclinic Eu2O3.Since Eu3þ ions in the monoclinic nanostructures may occupy threedifferent sites (A, B, C) [44,78], three relatively broad emissionpeaks should be observed for the 5D0 / 7F0 transition at around578.5e579, 582.2 and 582.4 nm in the smallest nanoparticles [79].After annealing, those peaks should become narrow at around578.5, 582.2 and 582.4 nm formonoclinic Eu2O3 and slightly shiftedat 579.2, 582.6 and 582.9 nm for monoclinic Y2O3:Eu3þ [44].Similarly, Jang et al. have shown by site-selective spectroscopy thatnew peaks appear in the excitation spectra of the 7F0 / 5D0 tran-sition in cubic Y2�xGdxO3:Eu3þ when a monoclinic structure isdeveloped on increasing Gd content [80], being the most promi-nent peaks due to Eu3þ emission those of the B and C sites whichare located around 582.0 nm, while the peak corresponding to the Asite (located around 578.7 nm) is of smaller intensity. It is note-worthy that only the broadband around 582.4 nm is observed in thesteady state luminescence of our nanophosphors (Fig. 5). This resultcould be consistent with the residual presence of the monoclinicphase in our samples (not observed by XRD and Raman measure-ments) despite the lifetimes of this secondary phase (9 ms) arelarger than those in monoclinic Eu2O3 nanophosphors (a fewhundreds of microseconds) and than those in monoclinicY2O3:Eu3þ (1e2ms) according to Ref. [81]. In this respect, the largerlifetime measured in our nanophosphors could be related to thepresence of trap centers in the monoclinic phase. However, thepossibility that emissions different from those of the Eu3þ ions at C2sites could belong to the 5D0 / 7F1 magnetic dipole-allowedemissions of Eu3þ ions at S6 sites cannot be disregarded [82].
3.3.3. Crystal-field analysisSince the CF strength experienced by the Eu3þ ions is a measure
of their electrostatic interaction with the surrounding O2�, thehigher CF strength present in the surface of the nanophosphorsmust be due to the larger charge density and/or to a smaller EueO

S. Ray et al. / Current Applied Physics 14 (2014) 72e8180
distance near the surface. The higher coordination of the Eu3þ ionsin the smallest nanophosphors found by XAS measurements [16]lead us to think that the cause of the larger CF near the surface ofthe smallest nanocrystals must be due to a larger charge densityaround Eu ions near the nanocrystal surface. The higher coordi-nation of Eu3þ ions near the nanocrystal surface is usually related tolarger EueO distances, what in fact is in agreement with the in-crease of the lattice parameter as the nanocrystal size decreases.
The average strength of the CF acting on the Eu3þ ions inY2O3:Eu3þ nanophosphors can be estimated from the splitting ofthe 7F1 multiplets into three Stark levels. From the FLN measure-ments, the positions of the 7F1 Stark levels with respect to 7F0ground level are collected and plotted as a function of excitationwavelength in the inset of Fig. 8. In a first approximation, if the J-mixing is neglected, only the second rank real CF parameters, B20and B22, of the even CF Hamiltonian will affect significantly to thebreakdown of the degeneracy of the 7F1 term into three Stark levels[65,69,77]. Due to the almost symmetrical splitting observed for thethree 7F1 Stark levels with the CF increase, the B22 parameter shouldexhibit a large variation in magnitude, while the B20 axial param-eter should be rather low and will not affect significantly to thesplitting [65,83]. Auzel and Malta [84] have tried to simplify the CFdescription defining a scalar, rotational invariant parameter calledthe CF strength that, for the C2 local symmetry, takes the form,
NV�B2q
� ¼ffiffiffiffiffiffiffiffiffiffiffiffiffiffiffiffiffiffiffiffiffiffiffiffiffiffiffiffiffiffiffiffiffiffiffiffiffiffiffiffiffiffiffiffiffiffiffiffiffiffiffiffiffiffiffiffiffiffiffiffi�
4p2kþ 1
��jB20j2 þ 2jB22j2
�s; (1)
that can be also easily related to the maximum splitting of the 7F1level [85],
NV�B2q
� ¼
ffiffiffiffiffiffiffiffiffiffiffiffiffiffiffiffiffiffiffiffiffiffiffiffiffiffiffiffiffiffiffi2þ
�Eb�EC
DEMAX=2
�20:3=p
vuutDEMAXð7F1Þ; (2)
where Eb is the barycentre of energy of the 7F1 level, calculated asthe mean energy of the corresponding three Stark levels, whereasEC is the energy of the central Stark level.
The second rank CF strength parameter NV(B2q) is shown in Fig. 8as a function of the experimental maximum splitting of the 7F1manifold, DEMAx(7F1), obtained from the 7F1 splitting shown in theinset. Its value is larger than those usually found in glasses
350 400 450 500
1600
1800
2000
2200
2400
578 579 580 581100200300400500600
Strong CF
Nv
(cm
-1)
7F1 maximum splitting DE(7F1) (cm-1)
Medium CF
Ene
rgy
(cm
-1)
Wavelength (nm)
7F1
Fig. 8. Scalar crystal-field strength parameter NV as a function of the 7F1 maximumsplitting DE(7F1). The solid line indicates the fit to the theoretical expression of Maltaet al. (see text). Inset shows the 7F1 splitting as a function of the 5D0 excitationwavelength. Open squares indicate those values associated to the Eu3þ ions at the ‘true’C2 site.
[33,35,69,77,82]. Furthermore, the almost symmetrical splitting ofthe 7F1 Stark levels observed in Y2O3:Eu3þ gives rise to an almostconstant factor between the CF strength and themaximum splittingof the 7F1 level of 0.218 for all the environments, giving rise to thelinear dependence shown in Fig. 8, as predicted by Malta et al. [85].
A different perspective is obtained if the J-mixing is taken intoaccount. Görller-Walrand and Binnemans [65] have re-defined the‘weak CF’ (J-mixing negligible) and ‘strong CF’ (J-mixing unnegli-gible) for the RE3þ-doped systems. According to this definition, adistribution of environments under weak-medium (300 <
DEMAx(7F1) < 450 cm�1) and strong (DEMAx(7F1) > 450 cm�1) CFscan be obtained for our nanophosphors. If a structural model daresto explain the inhomogeneous distribution of Eu3þ environments ithas to take into account that: i) the weakest CF environment for theEu3þ ion is that at the ‘true’ C2 cubic site, and ii) there are no sharpchanges in both the emission intensities and the 7F1 splitting whenmoving the excitation to stronger CF environments to the high-energy side of the 5D0 band profile. Under this viewpoint, it ispossible to understand the continuous distribution of environ-ments for the Eu3þ ions in the smallest nanophosphors as acontinuous distortion of the ‘true’ C2 site of the cubic Y2O3 structureas Eu3þ ions get closer to the nanocrystal surface. In this sense,stronger CF environments are obtained by successive distortion ofthe C2 site parallel to the increase of the CF strength, which give riseto larger splitting of the multiplets as the nanocrystal size de-creases. We can speculate that in the smallest nanophosphors, asthose with 6 nm size, the presence of dangling bonds at the surfacecan contribute significantly to the local distortion of the largeproportion of Eu3þ ions near the surface.
To finish we would like to stress that our hypothesis of thecontinuous distortion of the C2 sites suggested by site-selectiveexcitation is supported by the absence of extra peaks associatedto secondary phases in the XRD pattern, in the Raman spectrum,and in the steady-state Eu3þ luminescence of our smallest nano-phosphors. Furthermore, it is consistent with XAS measurementsthat evidence a larger structural disorder, leading to drastic changesin the local structure, as Y2O3 nanoparticles become smaller [16]. Inthis way, Eu3þ ions closer to the surface of the cubic Y2O3 nano-particles would have a coordination closer to 9 (in the distorted C2sites) than to 6 (in the ‘true’ C2 sites), and the increase in coordi-nation would explain the stronger CF felt by Eu3þ ions near thesurface than in the core. Note that the above explanation is differentto that Qi et al. [16] who related the disorder to the existence of anamorphous phase coexisting with the ‘true’ C2 site, instead ofconsider this site as the ‘parent structure’ for the Eu3þ environ-ments in the small nanophosphors.
4. Conclusions
Undoped and Eu3þ-doped cubic yttria nanoparticles withconsiderable good crystallinity have been synthesized by means ofa complex-based precursor solution method. Depending upon thetemperature of the annealing treatment, nanophosphors with sizesbetween 6 and 37 nm, all showing narrow size distributions, havebeen obtained. No amorphous or secondary phases, like monoclinicY2O3 or Eu2O3, have been detected in the nanocrystals. Whilenanoparticles of 37 nm have similar lattice parameters than bulkcubic yttria, the lattice parameter in the nanoparticles increases upto 0.26% (in undoped Y2O3) and 0.33% (in Eu3þ-doped Y2O3) as theparticle size decreases from 37 to 6 nm. Raman scattering spectra ofEu3þ-doped nanoparticles have shown four more bands thanundoped nanoparticles. The origin of three of them is unknown, butone clearly corresponds to electronic Raman scattering originatedfrom Eu3þ ions in S6 sites, which confirms that Eu3þ ions substituteY3þ ions in both C2 and S6 sites of the cubic structure.
S. Ray et al. / Current Applied Physics 14 (2014) 72e81 81
Size-dependent photoluminescence emission spectra have beenmeasured in Y2O3:Eu3þ nanoparticles. In 37 nm-sized samples,emissions are similar to bulk yttria in which Eu3þ ions are locatedpreferentially in the cubic C2 sites. However, in 6 nm-size samples,the 5D0 / 7F0 transition consists of a high-energy broadbandcontribution overlapped with two sharp peaks. The sharp peaks ofthe 5D0 / 7F0 transition should correspond to crystalline phaseswithin the core of the nanophosphors. One of them is due to Eu3þ inthe C2 cubic site of Y2O3 nanophosphor and the other could betentatively assigned to a residual monoclinic structure of Y2O3present in the nanocrystals. However, it is possible that they belongto 5D0 / 7F1 magnetic-dipole allowed emission of Eu3þ ions at S6sites. Finally, site-selective excitation in the 7F0 / 5D0 peaks hasallowed us to associate the broadband contribution to a continuousdistortion of the C2 site caused by a large disorder, especially nearthe surface, found in the smallest nanophosphors.
Acknowledgments
Authors are grateful to Ministerio de Ciencia e Innovación ofSpain (MICINN) under The National Program of Materials(MAT2010-21270-C04-02/03/04), the Consolider-Ingenio 2010Program (MALTA CSD2007-0045), Generalitat Valenciana (GVA-ACOMP-2013-012), and to the EU-FEDER Funds for their financialsupport. F.J.M. and O.G. are grateful to the Vicerrectorado deInvestigación y Desarrollo of the Universitat Politècnica de València(UPV2011-0914 PAID-05-11 and UPV2011-0966 PAID-06-11). S.F.L-L. wishes to thank MICCIN for an FPI grant (BES-2008-003353).Finally, S.R. wishes to thank Universitat Politècnica de València andUniversidad de La Laguna for the financial support during herresearch stays.
References
[1] T. Igarashi, M. Ihara, T. Kusunoki, K. Ohno, T. Isobe, M. Senna, Appl. Phys. Lett.76 (2000) 1549.
[2] A.N. Jennifer, L.B. Edward, M.J. Wagner, Chem. Mater. 15 (2003) 688.[3] R. Reisfel, C.K. Jorgensen, Lasers and Excited States of Rare Earths, Springer,
Berlin, 1977.[4] F.X. Gan, Optical and Spectroscopic Properties of Glass, Springer, Berlin, 1992.[5] B.M.J. Smets, Mater. Chem. Phys. 16 (1987) 283.[6] S. Tanabe, J. Non-Cryst. Solids 259 (1999) 1.[7] A.J. Kenyon, Prog. Quantum Electron. 26 (2002) 225.[8] P.N. Prasad, Nanophotonics, John Wiley & Sons, NY, 2004.[9] N. Yamada, S. Shionoya, T. Kushida, J. Phys. Soc. Jpn. 32 (1972) 1577.
[10] C.A. Morrison, R.P. Leavitt, Spectroscopic properties of triply ionized lantha-nides in transparent host crystals, in: K.A. Gschneidner Jr., L. Eyring (Eds.),Handbook of the Physics and Chemistry of Rare Earths, Elsevier SciencePublisher, 1982.
[11] D.S. Lee, A.J. Steckl, Appl. Phys. Lett. 81 (2002) 2331.[12] R.N. Bhargava, J. Lumin. 70 (1996) 85.[13] G. Blasse, B.C. Grabmaier, Luminescent Materials, Springer, Berlin, 1994.[14] N.C. Chang, J. Appl. Phys. 34 (1963) 3500.[15] A. Konrad, T. Fries, A. Gahn, F. Kummer, U. Herr, R. Tidecks, K. Samwer, J. Appl.
Phys. 86 (1999) 3129.[16] Z. Qi, C. Shi, W. Zhang, W. Zhang, T. Hu, Appl. Phys. Lett. 81 (2002) 2857.[17] W.W. Zhang, W.P. Zhang, P.B. Xie, M. Yin, H.T. Chen, L. Jing, Y.S. Zhang,
L.R. Lou, S.D. Xia, J. Colloid Interface Sci. 262 (2003) 588.[18] S. Ray, P. Pramanik, A. Sinha, A. Roy, J. Appl. Phys. 97 (2005) 094312.[19] Y. Repelin, C. Proust, E. Husson, J.M. Beny, J. Solid State Chem. 118 (1995) 163.[20] H. Eilers, B.M. Tissue, Chem. Phys. Lett. 251 (1996) 74.[21] W.W. Zhang, M. Xu, W.P. Zhang, M. Yin, Z.M. Qi, S.D. Xia, C. Garapon, Chem.
Phys. Lett. 376 (2003) 318.[22] Q.L. Dai, M.E. Foley, Ch. J. Breshike, A. Lita, G.F. Strouse, J. Am. Chem. Soc. 133
(2011) 15475.[23] B.G. Wybourne, Spectroscopic Properties of Rare Earths, Wiley-Interscience,
New York, 1965.[24] G. De, W. Qin, J. Zhang, Y. Zhang, Y. Wang, C. Cao, Y. Cui, J. Lumin. 119e120
(2006) 258.[25] A. Mehta, T. Thundat, M.D. Barnes, V. Chhabra, R. Bhargava, A.P. Bartko,
R.M. Dickson, Appl. Opt. 42 (2003) 2132.[26] J.W. Stouwdam, C.J. Van Veggel, Nano Lett. 2 (2002) 733.[27] H. Schniepp, V. Soghdar, Phys. Rev. Lett. 89 (2002) 257403.[28] R.S. Meltze, S.P. Feofilov, B. Tissue, H.B. Yuan, Phys. Rev. B 60 (1999) R14012.
[29] P. Ghosh, A. Patra, J. Nanosci. Nanotechnol. 8 (2008) 1.[30] S. Sadhu, T. Sen, A. Patra, Chem. Phys. Lett. 440 (2007) 121.[31] W.M. Yen, P.M. Selzer, Laser Spectroscopy of Solids, Springer-Verlag, Berlín,
1986.[32] G.F. Imbusch, Phys. Scr. T 19 (1987) 354.[33] V. Lavín, P. Babu, C.K. Jayasankar, I.R. Martín, V.D. Rodríguez, J. Chem. Phys.
115 (2001) 10935.[34] V. Lavín, V.D. Rodríguez, I.R. Martín, U.R. Rodríguez-Mendoza, J. Lumin. 72e74
(1997) 437.[35] P. Babu, K.H. Jang, E.S. Kim, R. Vijaya, C.K. Jayasankar, V. Lavín, H.J. Seo, J. Non-
Cryst. Solids 357 (2011) 2139.[36] K. Zhang, A.K. Pradhan, G.B. Loutts, U.N. Roy, Y. Cui, A. Burger, J. Opt. Soc. Am. B
21 (2004) 1804.[37] A. Mujica, A. Rubio, A. Muñoz, R.J. Needs, Rev. Mod. Phys. 79 (2003) 863.[38] G. Kresse, J. Hafner, Phys. Rev. B 47 (1993) 558;
G. Kresse, J. Hafner, Phys. Rev. B 49 (1994) 14251;G. Kresse, J. Furthmüller, Comput. Mater. Sci. 6 (1996) 15;G. Kresse, J. Furthmüller, Phys. Rev. B 54 (1996) 11169.
[39] P. Hohenberg, W. Kohn, Phys. Rev. 136 (1964) 3864.[40] P.E. Blöchl, Phys. Rev. B 50 (1994) 17953;
G. Kresse, D. Joubert, Phys. Rev. B 59 (1999) 1758.[41] J.P. Perdew, A. Ruzsinszky, G.I. Csonka, O.A. Vydrow, G.E. Suseria,
L.A. Constantin, X. Zhou, K. Burke, Phys. Rev. Lett. 100 (2008) 136406.[42] K. Parlinski, Computer code PHONON. See: http://www.computingformaterials.
com/index.html.[43] D.K.Williams, B. Bihari, B.M. Tissue, J.M.McHale, J. Phys. Chem. B 102 (1998) 916.[44] B.M. Tissue, H.B. Yuan, J. Solid State Chem. 171 (2003) 12.[45] L. Wang, Y.X. Pan, Y. Ding, W. Yang, W.L. Mao, S.V. Sinogeikin, Y. Meng,
G.Y. Shen, H.K. Mao, Appl. Phys. Lett. 94 (2009) 061921.[46] C. Beck, K.-H. Ehses, R. Hempelmann, Ch. Bruch, Scr. Mater. 44 (2001) 2127.[47] M.I. Arroyo, J.M. Perez-Mato, C. Capillas, E. Kroumova, S. Ivantchev,
G. Madariaga, A. Kirov, H. Wondratschek, Z. Kristallogr. 221 (2006) 15.[48] Ch. Beck, Ch. Bruch, K.-H. Ehses, R. Hempelmann, J. Phys. IV France 10 (2000) 87.[49] J.E. Spanier, R.D. Robinson, F. Zhang, S.W. Chan, I.P. Herman, Phys. Rev. B 64
(2001) 245407.[50] E. Husson, C. Proust, P. Gillet, J.P. Itie, Mater. Res. Bull. 34 (1999) 2085.[51] A. Ubaldini, M.M. Carnasciali, J. Alloys Compd. 454 (2008) 374.[52] J. Lancok, C. Garapon, C. Martinet, J. Mugnier, R. Brenier, Appl. Phys. A 79
(2004) 1263.[53] A. Kremenovic, J. Blanusa, B. Antic, Ph. Colomban, V. Kahlenberg, C. Jovalekic,
J. Dukic, Nanotechnology 18 (2007) 145616.[54] N. Dilawar, S. Mehrotra, D. Varandani, B.V. Kumaraswamy, S.K. Haldar,
A.K. Bandyopadhyay, Mater. Charact. 59 (2008) 462.[55] J.F. Martel, S. Jandl, B. Viana, D. Vivien, J. Phys. Ceram. Solids 61 (2000) 1455.[56] M. Jayasimhadri, B.V. Ratnam, K.W. Jang, H.S. Lee, B.J. Chen, S.-S. Yi, J.-H. Jeong,
L. Rama Moorthy, J. Am. Ceram. Soc. 93 (2010) 494.[57] Q. Lü, Y.J. Wu, A.H. Li, Y. Wang, Y. Gao, H.Y. Peng, Mater. Sci. Eng. B 176 (2011)
1041.[58] S. Saengkerdsub, H.-J. Im, C. Willis, S. Dai, J. Mater. Chem. 14 (2004) 1207.[59] J.A. Koningstein, J. Chem. Phys. 42 (1965) 3195.[60] J.A. Koningstein, O.S. Mortensen, Phys. Rev. Lett. 18 (1967) 831.[61] G. Schaack, J.A. Koningstein, J. Opt. Soc. Am. 60 (1970) 1110.[62] G.S. Nolas, V.G. Tsoukala, S.K. Gayen, G.A. Slack, Phys. Rev. B 50 (1994) 150;
G.S. Nolas, V.G. Tsoukala, S.K. Gayen, G.A. Slack, Opt. Lett. 19 (1994) 1574.[63] J. Heber, K.H. Hellwege, U. Köbler, H. Murmann, Z. Phys. 237 (1970) 189.[64] J.B. Gruber, R.P. Leavitt, C.A. Morrison, N.C. Chang, J. Chem. Phys. 82 (1985)
5373.[65] C. Görller-Walrand, K. Binnemans, Rationalization of crystal-field parametri-
zation, in: Handbook on the Physics and Chemistry of Rare Earths, North-Holland Publishing Co., 1996, p. 121.
[66] G. Blasse, Inorg. Chim. Acta 167 (1990) 33.[67] R.D. Peacock, Struct. Bonding 22 (1975) 83.[68] E.W.L.J. Oomen, A.M.A. Van Dongen, J. Non-Cryst. Solids 111 (1989) 206.[69] V. Lavín, U.R. Rodríguez-Mendoza, I.R. Martín, V.D. Rodríguez, J. Non-Cryst.
Solids 319 (2003) 200.[70] B.R. Judd, Phys. Rev. 127 (1962) 750.[71] G.S. Ofelt, J. Chem. Phys. 37 (1962) 511.[72] G. Nishimura, T. Kushida, J. Phys. Soc. Jpn. 60 (1991) 683;
G. Nishimura, T. Kushida, J. Phys. Soc. Jpn. 60 (1991) 695.[73] M. Tanaka, G. Nishimura, T. Kushida, Phys. Rev. B 49 (1994) 16917.[74] N.C. Chang, J.B. Gruber, J. Chem. Phys. 41 (1964) 3227.[75] J. Dexpert-Ghys, M. Faucher, Phys. Rev. B 20 (1979) 10.[76] H. Song, B. Chen, H. Peng, J. Zhang, Appl. Phys. Lett. 81 (2002) 1776.[77] J.E. Muñoz-Santiuste, U.R. Rodríguez-Mendoza, J. González-Platas, V. Lavín,
J. Chem. Phys. 130 (2009) 154501.[78] D.K. Williams, H.B. Yuan, B.M. Tissue, J. Lumin. 83e84 (1999) 297.[79] B.M. Tissue, B. Bihari, J. Fluoresc. 8 (1998) 289.[80] K.H. Jang, E.S. Kim, J.S. Bae, S.S. Yi, J.H. Jeong, H.J. Seo, Thin Solid Films 516
(2008) 5567.[81] B. Bihari, H. Eilers, B.M. Tissue, J. Lumin. 75 (1997) 1.[82] R.G. Pappalardo, R.B. Hunt Jr., J. Electrochem. Soc. 132 (1985) 721.[83] J. Dexpert-Ghys, M. Faucher, Phys. Rev. B 24 (1981) 3138.[84] F. Auzel, O.L. Malta, J. Phys. (France) 44 (1983) 201.[85] O.L. Malta, M. Antic-Fidancev, M. Lemaitre-Blaise, A. Milicic-Tang, M. Taibi,
J. Alloys Compd. 228 (1995) 41.