broadcasting transmission services: a market susceptible ... · g.fast/docsis3.1/ twdm-pon/5g ......
TRANSCRIPT

0 0
Public Workshop Regulatory, in particular access, regimes for
network investment models in Europe
(SMART 2015/0002)
Ilsa Godlovitch, WIK-Consult
Wolter Lemstra, TUDelft/Industry-Insights
Christoph Pennings, IDATE
Alexandre de Streel, Université de Namur
6 April 2016

1
• Background to the study
• Future trends in high speed broadband
• Business and regulatory models
• Implications for the review of the EU framework for electronic communications
• Next steps
Agenda

2
Aims of the study
• Provide evidence and analytical insights in support
of the EC Review of the Regulatory Framework for
Electronic Communications with focus on NGA
• Attention to
- NRA objectives (competition, efficient investment)
- Market analysis process, imposition of SMP remedies
- Symmetric obligations (Article 12 FWD, 4-5 AID)
- Mechanisms to foster consistent application
(Recommendations, article 7 process, BEREC)
• Input to evaluation of the current framework; and
• Impact of alternative options

3
Study elements
• Task 1: Future developments
- Scenarios for supply and demand of fast broadband
- Organisational change
- Will access bottlenecks persist?
• Task 2: Evaluate current models through KPIs
- NGA business models in urban and ‘challenge’ areas
- Regulatory models and their effects
• Task 3: Identify future EU regulatory models for access
- Identify key models at EU level based on challenges, objectives
- Preliminary Impact Assessment
• Tasks 4/5: Implications for evaluation and review of RF

4
Methodology
• Data gathering
- KPI data (inputs, intermediate, outputs) from EC, IDATE, OECD
- Analysis of Commission online consultation
- ~30 Interviews (End-users, industry, investors, BEREC, NRAs)
- Desk research
• Analytical tools
- Modelling of supply and demand scenarios
- Econometrics: which factors are linked to positive outcomes?
- Case studies: more granular assessment of impact of different
business and regulatory models on structures and outcomes
• Presentation of conclusions
- Follow ‘better regulation’ guidelines on evaluation, IA

5
Timetable
Date Activity
Nov-15 Kick-off
Dec 2015-Mar 2016 Data gathering/interviews
Mar-16 Interim report (tasks 1-3)
6-Apr-16 Public workshop
Apr-May 2016 Implications for framework
Jun-16 Finalise report
6
• Background to the study
• Future trends in high speed broadband
• Business and regulatory models
• Implications for the review of the EU framework for electronic communications
• Next steps
Agenda
Theoretical perspective

7
What will customers need in 2025?
What will operators provide in 2025?
• Broadband market outcomes:
Result of Interaction between
Supply and Demand
• Supply side factors:
Type of legacy network: PSTN/CATV/FttH/3-4G
Availability tech. upgrades and capacity increases:
G.Fast/DOCSIS3.1/ TWDM-PON/5G
Cost, ease of upgrade + Willingness to pay + Competition
=> Technology mix in the field
=> Start of end-user adoption

8
What will customers need in 2025?
What will operators provide in 2025?
• Broadband market outcomes:
Result of Interaction between Supply and Demand
• Demand side factors:
Availability of applications: HDTV/Cloud/Gaming/M2M/
Social Networking/…
For each application: Adoption rate – Age/Education/GDP
For each application: Data volumes/Data rates/Latency
Aggregation: Fixed = Home => Family
Fixed = Business => Professional SME
Mobile = Individual/Professional

9
What will customers need in 2025?
Modelled three demand scenarios
1. Bandwidth demand Status Quo Extrapolation of current growth trends
Data volume/Data rates/Ratios
2. Bandwidth demand – Case HDTV/UHDTV NextGen TV: HDTV/4k/8k
NextGen data compression
Aggregation of simultaneous use – Up market family
3. Bandwidth demand All-NGA – Case Germany Various applications and usage environments
Aggregation of simultaneous use

10
What will customers need in 2025:
Bandwidth demand Status Quo
11
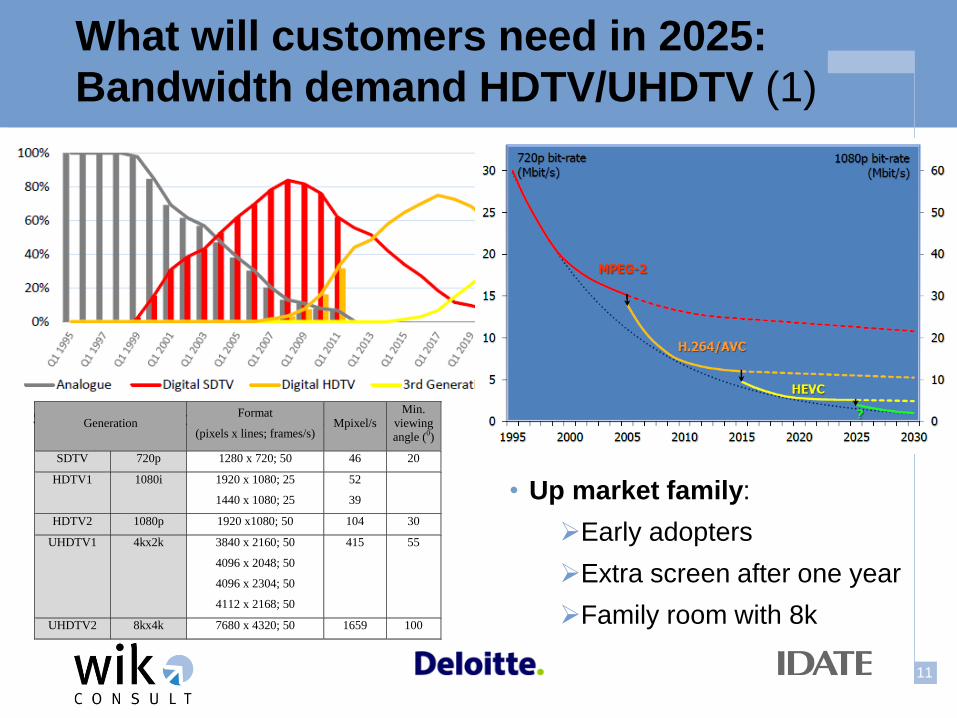
What will customers need in 2025:
Bandwidth demand HDTV/UHDTV (1)
• Up market family:
Early adopters
Extra screen after one year
Family room with 8k
Source: EITOZetacast for Ofcom (2012) Generation Format
(pixels x lines; frames/s) Mpixel/s
Min.
viewing
angle (0)
SDTV 720p 1280 x 720; 50 46 20
HDTV1 1080i 1920 x 1080; 25
1440 x 1080; 25
52
39
HDTV2 1080p 1920 x1080; 50 104 30
UHDTV1 4kx2k 3840 x 2160; 50
4096 x 2048; 50
4096 x 2304; 50
4112 x 2168; 50
415 55
UHDTV2 8kx4k 7680 x 4320; 50 1659 100
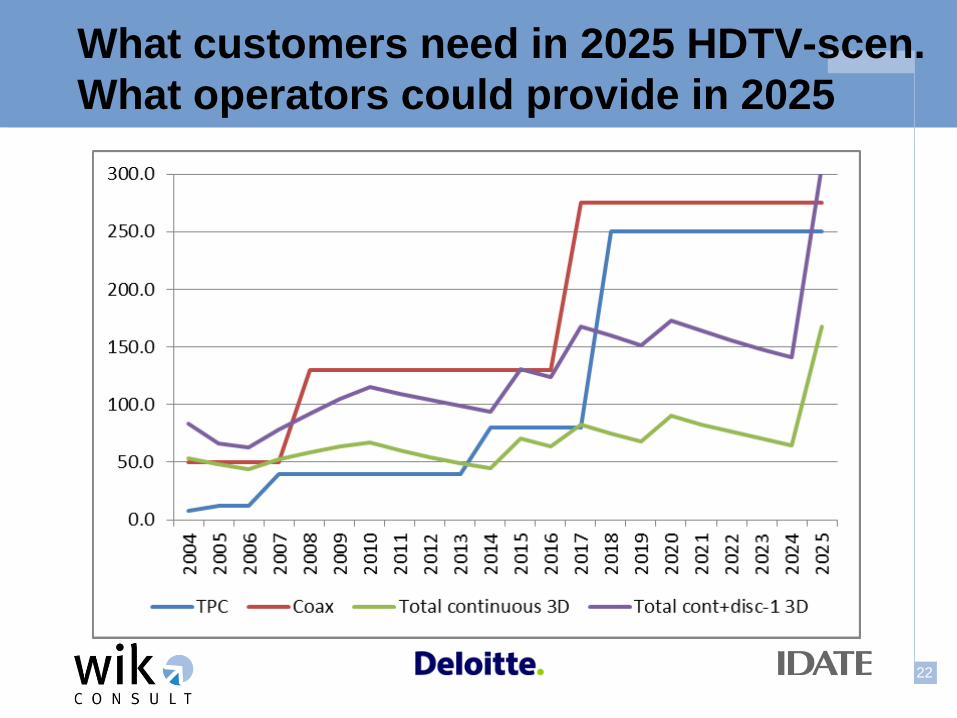
12
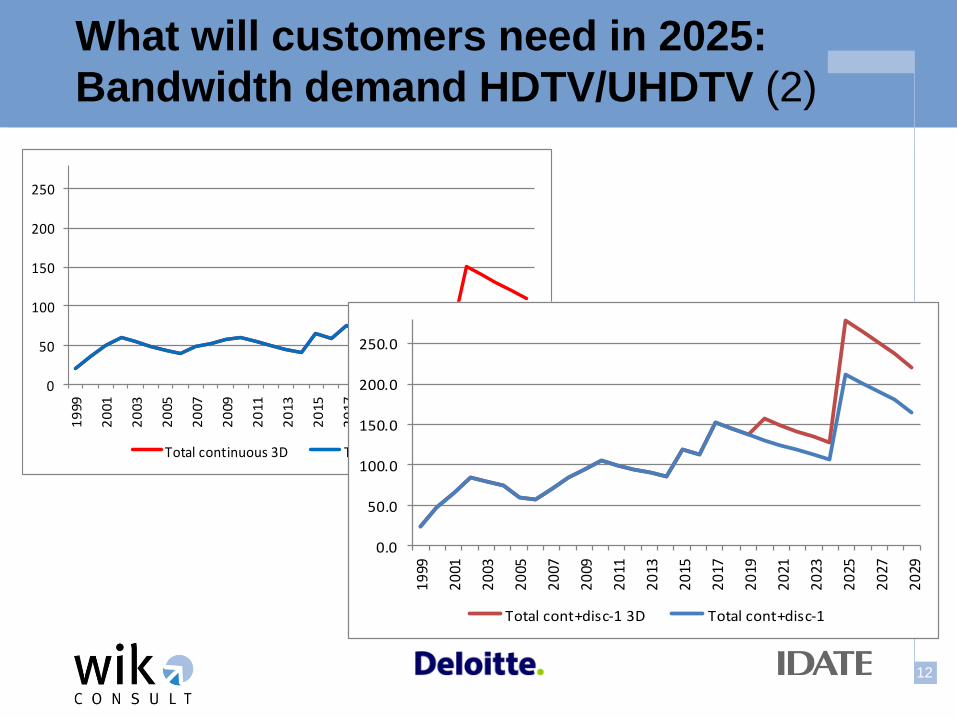
What will customers need in 2025:
Bandwidth demand HDTV/UHDTV (2)
0
50
100
150
200
250
19
99
20
01
20
03
20
05
20
07
20
09
20
11
20
13
20
15
20
17
20
19
20
21
20
23
20
25
20
27
20
29
Total continuous 3D Total continuous
0.0
50.0
100.0
150.0
200.0
250.0
19
99
20
01
20
03
20
05
20
07
20
09
20
11
20
13
20
15
20
17
20
19
20
21
20
23
20
25
20
27
20
29
Total cont+disc-1 3D Total cont+disc-1
13
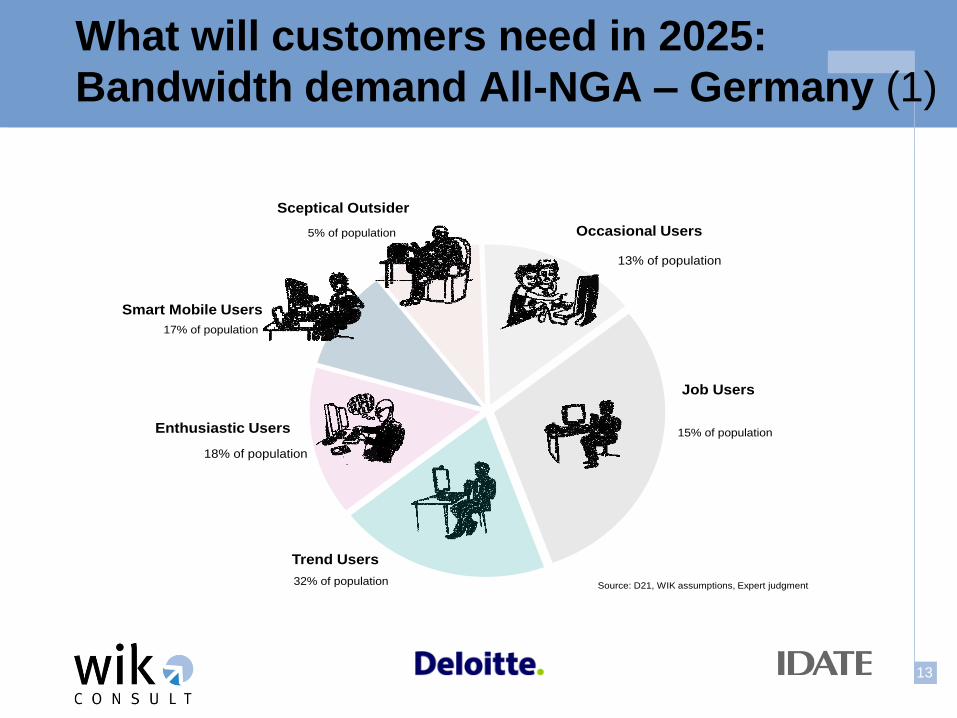
What will customers need in 2025:
Bandwidth demand All-NGA – Germany (1)
17% of population
5% of population
13% of population
15% of population
32% of population
18% of population
Sceptical Outsider
Occasional Users
Job Users
Trend Users
Enthusiastic Users
Smart Mobile Users
Source: D21, WIK assumptions, Expert judgment

14
What will customers need in 2025:
Bandwidth demand All-NGA – Germany (2)
SME segment Usage Number
Micro(Up to 9 employees and up to
2 mn Euro annual sales volume)
Standard User* ca. 590.000
Heavy User** ca. 2,7 Mio.
Small(Up to 49 employees and up to
10 mn Euro annual sales volume)
Standard User ca. 80.000
Heavy User ca. 165.000
Medium
(Up to 249 employees and up to 50 mn
Euro annual sales volume)
Standard User ca. 20.000
Heavy User ca. 35.000
Assumed number of companies
There is no structural change within
company and SME segments for the
future in Germany.
The vast majority of companies
operates within the micro segment of
up to 9 employees.
Medium-sized companies constitute
only a small fraction of the company
structure.
Assumption: One site per company.
Assumptions

15
What will customers need in 2025:
Bandwidth demand All-NGA – Germany (3)
16
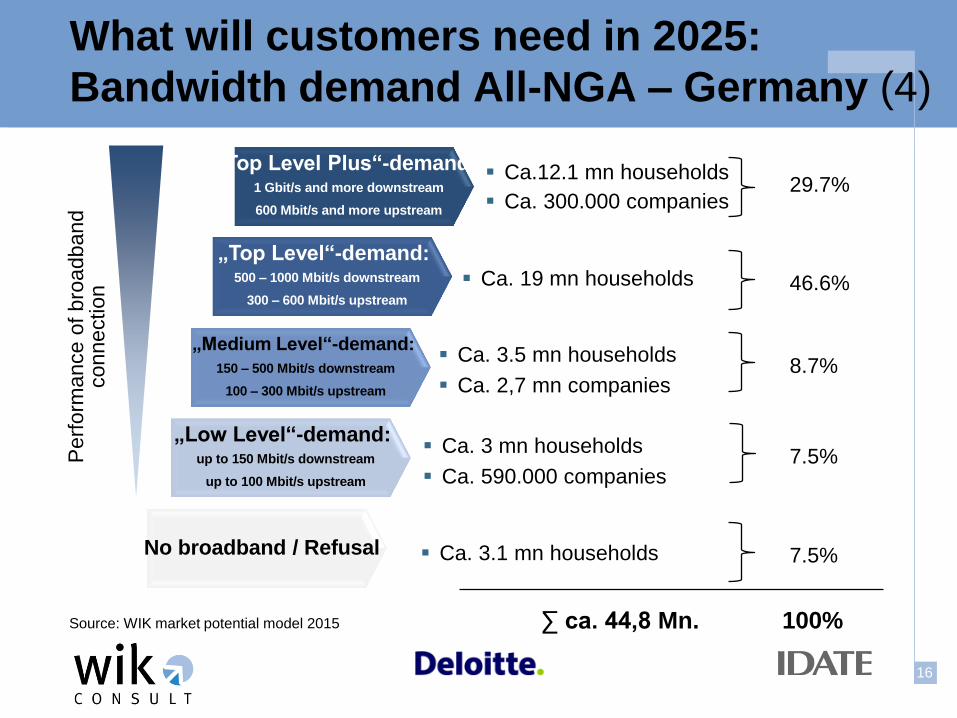
What will customers need in 2025:
Bandwidth demand All-NGA – Germany (4)
„Top Level“-demand: 500 – 1000 Mbit/s downstream
300 – 600 Mbit/s upstream
„Medium Level“-demand:
150 – 500 Mbit/s downstream
100 – 300 Mbit/s upstream
„Top Level Plus“-demand: 1 Gbit/s and more downstream
600 Mbit/s and more upstream
Ca.12.1 mn households
Ca. 300.000 companies
Ca. 19 mn households
Ca. 3.5 mn households
Ca. 2,7 mn companies
Ca. 3.1 mn households
Perf
orm
ance o
f bro
adband
co
nn
ectio
n
„Low Level“-demand: up to 150 Mbit/s downstream
up to 100 Mbit/s upstream
Ca. 3 mn households
Ca. 590.000 companies
No broadband / Refusal
100% ∑ ca. 44,8 Mn.
29.7%
46.6%
8.7%
7.5%
7.5%
Source: WIK market potential model 2015

17
What operators may provide in 2025?
Modelled three supply scenarios
1. TWP copper-based
VDSL2 => G.Fast => => G.fast v2 => XG.Fast + bonding
2. Coax-based
DOCSIS3.0 => DOSCSIS 3.1 => => DOCSIS3.1 v2
3. Optical fibre-based
FttH => TWDM-PON/NG-PON2

18
What operators may provide in 2025:
TWP copper based
• Legacy PSTN networks:
Western Europe: ~100% of Households
Central Europe: ~60% of Households => Mobile broadband
Distance to local exchange
G.Fast @ 100 m:
Symmetrical – 250/250 Mbit/s
Availability: From 2017-2018
19
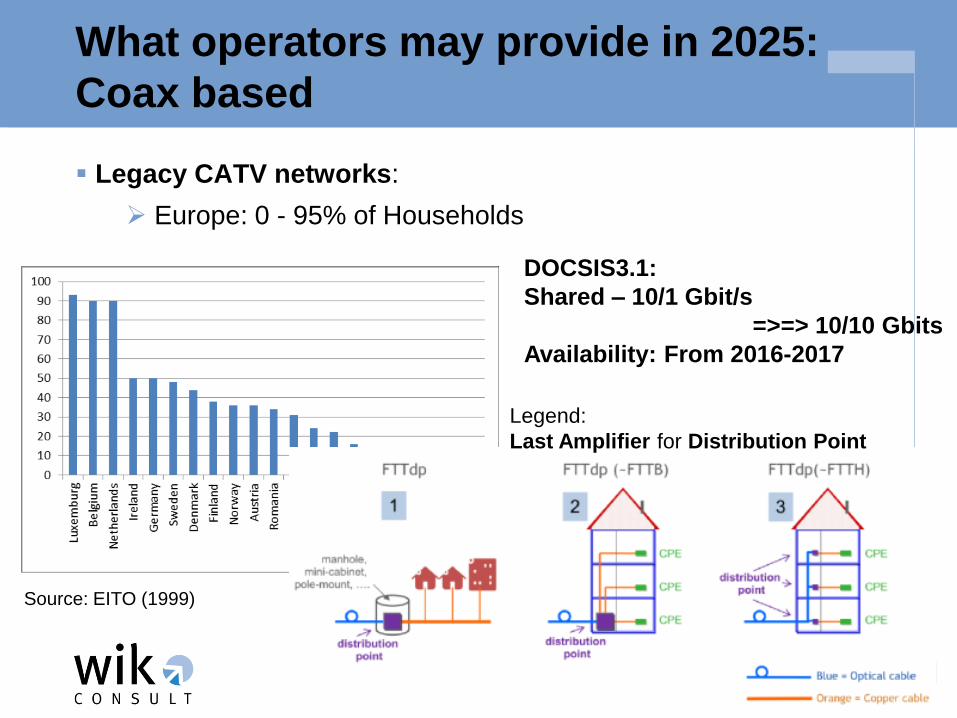
What operators may provide in 2025:
Coax based
Legacy CATV networks:
Europe: 0 - 95% of Households
Legend:
Last Amplifier for Distribution Point
Source: EITO (1999)
DOCSIS3.1:
Shared – 10/1 Gbit/s
=>=> 10/10 Gbits
Availability: From 2016-2017
20
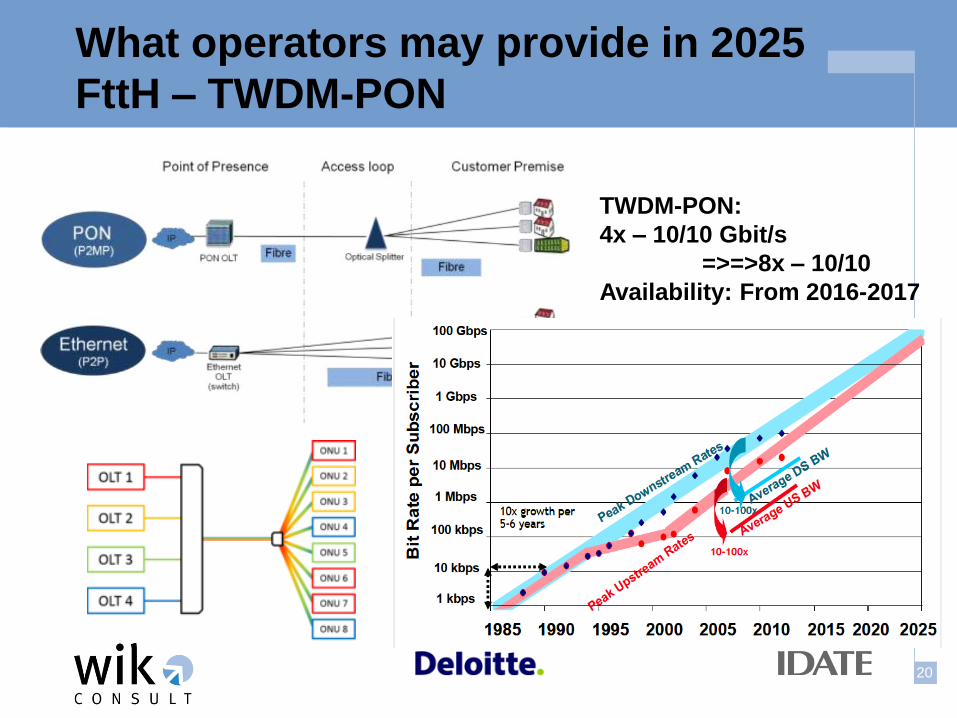
What operators may provide in 2025
FttH – TWDM-PON
TWDM-PON:
4x – 10/10 Gbit/s
=>=>8x – 10/10
Availability: From 2016-2017
21
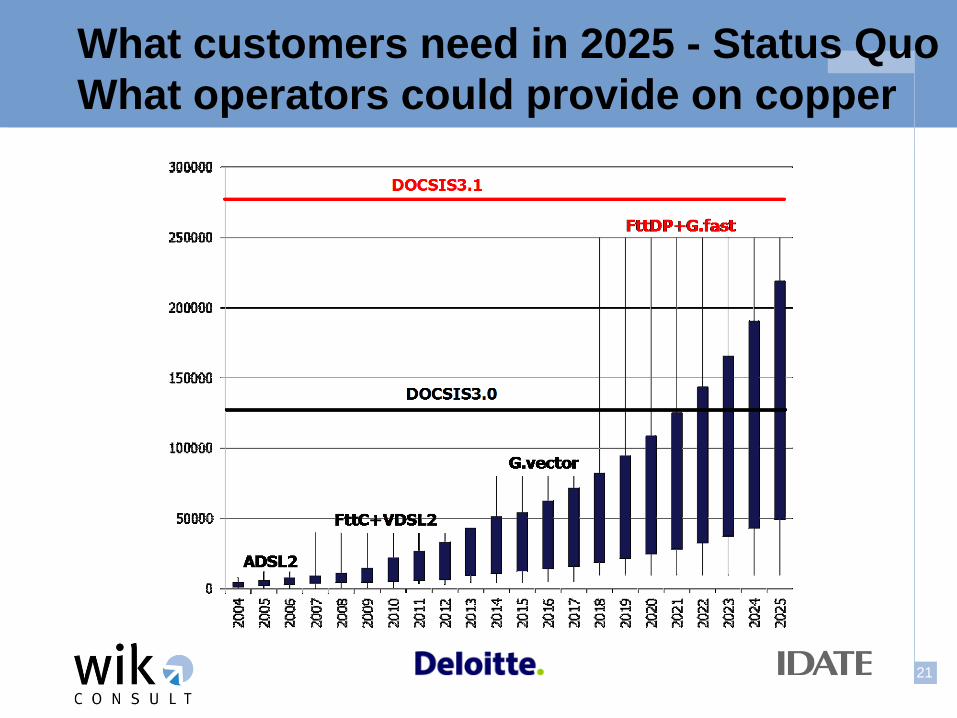
What customers need in 2025 - Status Quo
What operators could provide on copper
22
What customers need in 2025 HDTV-scen.
What operators could provide in 2025

23
What customers need in 2025 ALL-NGA
What operators could provide in 2025
„Top Level“-demand:
500 – 1000 Mbit/s downstream
300 – 600 Mbit/s upstream
„Medium Level“-demand:
15o – 500 Mbit/s downstream
100 – 300 Mbit/s upstream
„Top Level Plus“-demand:
1 Gbit/s and more downstream
600 Mbit/s and more upstream
Ca.12.1 mn households
Ca. 300.000 companies
Ca. 19 mn households
Ca. 3.5 mn households
Ca. 2,7 mn companies
Ca. 3.1 mn households(refusing Broadband/Internet)
Perf
orm
ance o
f bro
adband
connection
„Low Level“-demand:
up to 150 Mbit/s downstream
up to 100 Mbit/s upstream
Ca. 3 mn households
Ca. 590.000 companies
No broadband / Refusal
100%∑ ca. 44,8 Mn.
29.7%
46.6%
8.7%
7.5%
7.5%
Source: WIK market potential model 2015
FttDP/
FttLA
FttH

24
Could mobile technologies meet users needs?
-------5G 50 Mbps

25
• Background to the study
• Future trends in high speed broadband
• Business and regulatory models
• Implications for the review of the EU framework for electronic communications
• Next steps
Agenda
Modelling NGA developments
26
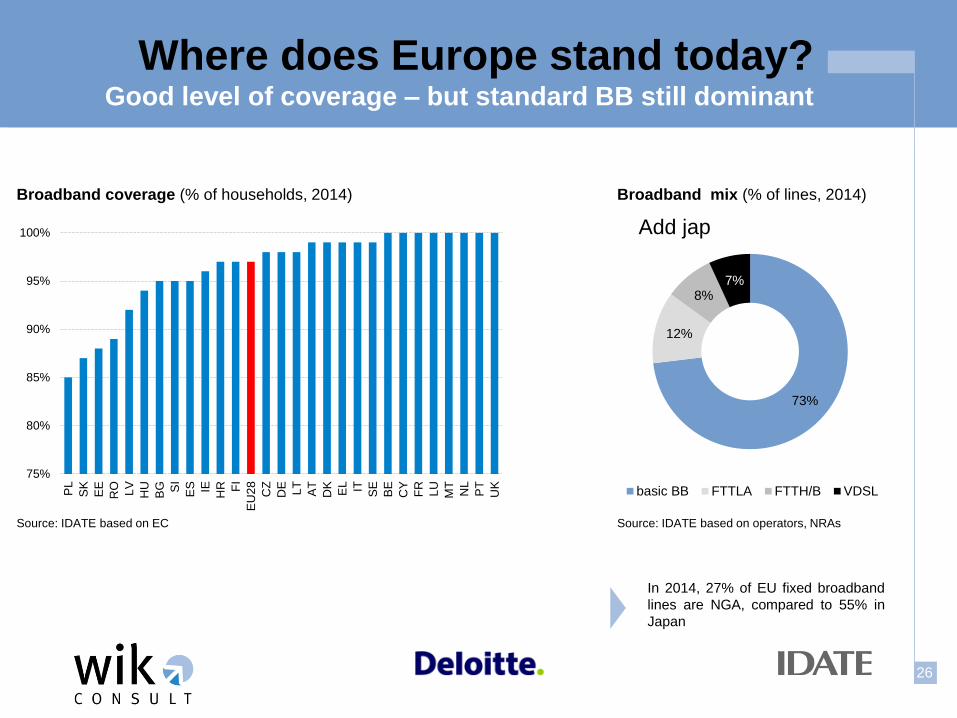
Where does Europe stand today? Good level of coverage – but standard BB still dominant
75%
80%
85%
90%
95%
100%
PL
SK
EE
RO LV
HU
BG SI
ES IE
HR FI
EU
28
CZ
DE
LT
AT
DK
EL IT SE
BE
CY
FR
LU
MT
NL
PT
UK
73%
12%
8% 7%
basic BB FTTLA FTTH/B VDSL
Broadband coverage (% of households, 2014) Broadband mix (% of lines, 2014)
Source: IDATE based on EC Source: IDATE based on operators, NRAs
Add jap
In 2014, 27% of EU fixed broadband
lines are NGA, compared to 55% in
Japan

27
8,79
53,96
63,49
0 20 40 60 80
xDSL
FTTx
cable
0,86
25,43
7,65
0 5 10 15 20 25 30
Average bandwidth (Mbps)
Source: IDATE based on EC
downstream upstream
Where does Europe stand today? Average speeds of NGA technologies progressing rapidly
Ftth/c

28
Where does Europe stand today? Bandwidth consumption largely driven by video
Source: IDATE, Cisco
53% 51%
Fixed (downstream traffic, 2015) Mobile (downstream traffic, 2015)
100%= 8111 PB/month 100%= 186 PB/month
29
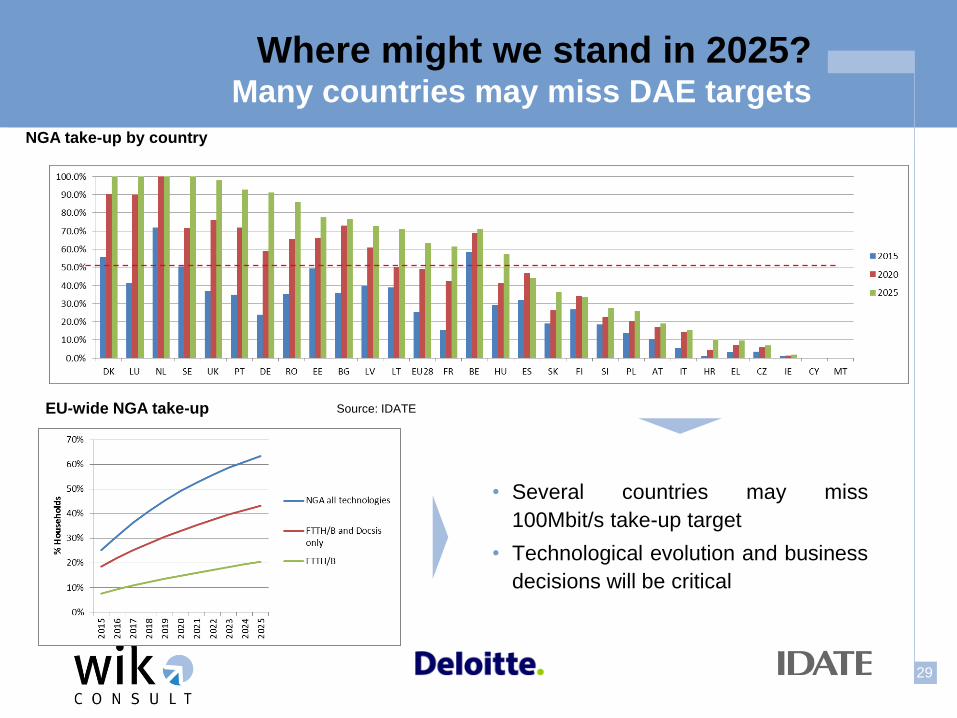
Where might we stand in 2025? Many countries may miss DAE targets
• Several countries may miss
100Mbit/s take-up target
• Technological evolution and business
decisions will be critical
NGA take-up by country
EU-wide NGA take-up Source: IDATE

30
What can we expect in practice? 2025 horizon
Modelling future data consumption
• EU28 and reference countries: JP,US, CA, AU
• Bottom-up approach built around 4 major service types:
- Video
- Cloud
- M2M/IoT
- P2P
• 5th category: other (web browsing…)
• Different network deployment scenarios for the EU28
• Built on Cisco VNI, IDATE databases (World Internet Markets, World OTT Markets,
Future TV 2025, World FTTX Markets…) and other inputs (Ofcom, FTTH Council,
Sandvine, Nielsen..)

31
Where might we stand in 2025? Europe likely to lag in Internet usage in ‘status quo’ scenario
Evolution of fixed downstream traffic per geography
(fixed broadband traffic / line/month, EU28 2015 = 100)
2015 2016 2017 2018 2019 2020 2021 2022 2023 2024 2025
EU28
100,0
119,0
141,9
169,5
202,4
232,3
268,7
311,7
361,7
420,2
488,4
US
185,8
224,3
271,4
329,3
398,6
464,2
542,6
628,4
723,4
828,3
945,8
CA
129,4
158,9
198,7
247,7
313,3
376,1
446,0
529,0
620,6
721,5
892,7
JP
65,8
87,9
117,4
156,5
208,3
255,4
316,1
386,6
477,7
584,0
721,2
AUS
83,4
100,4
117,0
144,6
180,1
212,1
232,1
271,3
310,2
355,0
406,5
Source: IDATE, based on proprietary research, Cisco VNI and other research
(GB/ line/month)
2015 2020 2025
EU28
62,0
144,1
303,0
US
115,2
288,0
586,8
CA
80,3
233,3
553,8
JP
40,8
158,4
447,5
AUS
51,8
131,6
252,2

32
Alternative scenarios Estimating the impact of technology
We modelled three scenarios for the future
“Status Quo”
NGA mixed technology
All-FTTH/B
0%
25%
50%
75%
100%
2015 2020 2025
FTTH/B FTTLA VDSL ADSL
0%
25%
50%
75%
100%
2015 2020 2025
FTTH/B
0%
25%
50%
75%
100%
2015 2020 2025
FTTH/B FTTLA VDSL
Source: IDATE
share of fixed BB connections

33
Alternative scenarios
• Examined alternative scenarios
- NGA technology mix (FTTx and Docsis, xDSL phased out)
- All-FTTH/B
• Evidence for speed projections
- Samknows provides evidence of speed differential between technologies
and pace of speed increases
- Annual speed increases of 15-20% in line with Akamai data
- ADSL speed growth low to flat
• Evidence for consumption projections
- Ofcom, Palaiseau provide evidence of impact of FTTx technologies on
consumption
- Further insights from Japanese experience

34
Scenarios
further assumptions
• For status quo, all-NGA and FTTH assuming speed growth patterns
per technology from Samknows continue
• Speed growth may be fastest in FTTH/B
• Users of FTTH/B will tend to consume significantly more data than
users of constrained networks, once they have become used to the
quality of service
• Assumptions apply to technologies across the scenarios, outcomes
are driven by different technology mix

35
Alternative scenarios historic evolution of connection speeds
Source: Akamai
• Akamai data show
connection speeds tend to
grow at ~16% p.a. across
geographies
• SamKnows broadband
quality reports for the EC
show similar trend for FTTx
in “FTTC countries” and
“FTTH countries” alike”
between 2012 and 2014
• But: speed growth
accelerating for FTTH only
in the last year, other
technologies’ speeds grow
at slower speeds
Different sources showing similar growth pattern

36
Alternative scenarios further evidence behind FTTH/B scenario
Source: IDA Singapore Source: PTS
Source: Ovum
• Experience in FTTH countries show
• Speed packages from 100Mbit/s to
1Gbit/s (Singapore, Japan, SK)
• FTTH/B replacing cable
• Delayed bandwidth consumption
increases (Japan)

37
some evidence some evidence
Average connection speed per scenario (Mbps, EU28)
Alternative scenarios Impact on connection speeds to 2025
Outcomes
• Even in status quo scenario, bandwidth multiplied by 6.6 downstream, by factor 10 upstream
• FTTH/B downstream bandwidth in 2025 1.9 times ‘status quo’ ; 1.7 times ‘mixed NGA’
• NGA bandwidth estimates very much on the conservative side
• DAE goals could be met
28 51
77 77 99
163 185
203
345
8 14
54 29 34
113 84 88
236
0
70
140
210
280
350
SQ mixed NGA FTTH/B SQ mixed NGA FTTH/B SQ mixed NGA FTTH/B
2015 2020 2025
down up

38
some evidence some evidence
0
100
200
300
400
500
600
700
2015 2016 2017 2018 2019 2020 2021 2022 2023 2024 20250
10
20
30
40
50
60
70
2015 2016 2017 2018 2019 2020 2021 2022 2023 2024 2025
Fixed traffic per scenario (GB/ line/month, EU28)
downstream upstream
Alternative scenarios Impact on traffic levels

39
Where might we stand in 2025? EU to leapfrog other geographies in all-FTTH/B scenario (only)
Evolution of fixed downstream traffic per geography (GB/ line/month)
Source: IDATE, based on proprietary research, Cisco VNI and other research
611 587
554
448
382
303 252
-
100
200
300
400
500
600
700
EU
28
-FT
TH
/B
US
CA
JP
EU
28
-NG
A m
ix
EU
28
-SQ
AU
S
2 015 2 020 2 025
‘Ranking’ unchanged for mixed NGA scenario
40
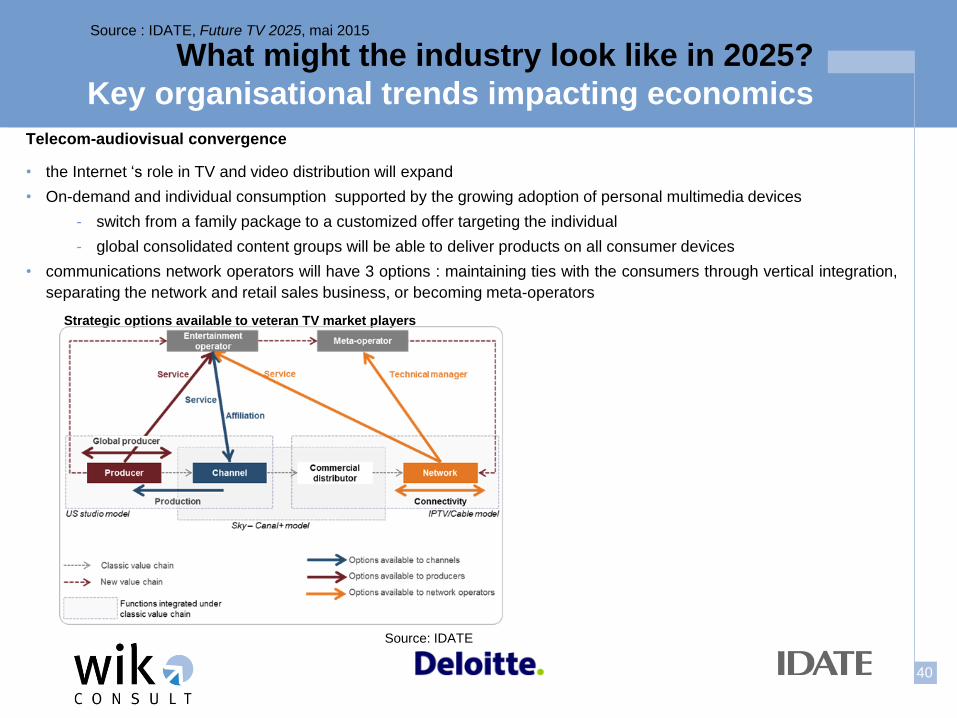
What might the industry look like in 2025?
Key organisational trends impacting economics
Telecom-audiovisual convergence
• the Internet ‘s role in TV and video distribution will expand
• On-demand and individual consumption supported by the growing adoption of personal multimedia devices
- switch from a family package to a customized offer targeting the individual
- global consolidated content groups will be able to deliver products on all consumer devices
• communications network operators will have 3 options : maintaining ties with the consumers through vertical integration,
separating the network and retail sales business, or becoming meta-operators
Strategic options available to veteran TV market players
Source : IDATE, Future TV 2025, mai 2015
Source: IDATE
41
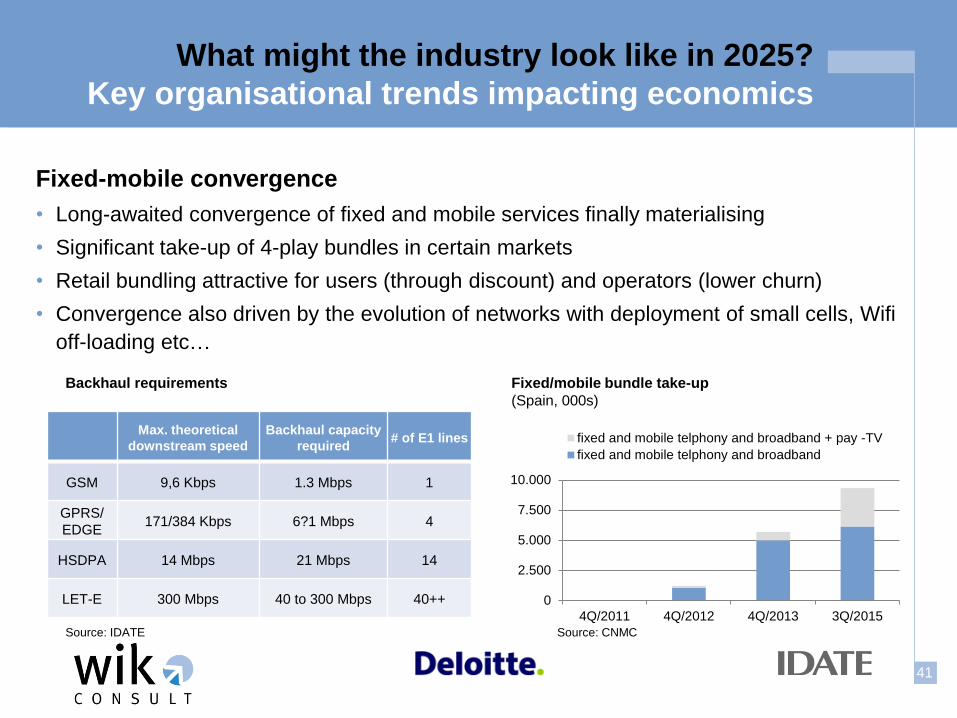
What might the industry look like in 2025?
Key organisational trends impacting economics
Fixed-mobile convergence
• Long-awaited convergence of fixed and mobile services finally materialising
• Significant take-up of 4-play bundles in certain markets
• Retail bundling attractive for users (through discount) and operators (lower churn)
• Convergence also driven by the evolution of networks with deployment of small cells, Wifi
off-loading etc…
Fixed/mobile bundle take-up
(Spain, 000s)
Source: CNMC
Max. theoretical
downstream speed
Backhaul capacity
required # of E1 lines
GSM 9,6 Kbps 1.3 Mbps 1
GPRS/
EDGE 171/384 Kbps 6?1 Mbps 4
HSDPA 14 Mbps 21 Mbps 14
LET-E 300 Mbps 40 to 300 Mbps 40++
Backhaul requirements
Source: IDATE
0
2.500
5.000
7.500
10.000
4Q/2011 4Q/2012 4Q/2013 3Q/2015
fixed and mobile telphony and broadband + pay -TV
fixed and mobile telphony and broadband

42
• Background to the study
• Future trends in high speed broadband
• Business and regulatory models
• Implications for the review of the EU framework for electronic communications
• Next steps
Agenda
Prospects for bottlenecks
43
Will access bottlenecks remain? Fixed mobile substitution
• Some demand-side substitution amongst lighter users
(see eg Austria)… but otherwise complementary
- Mobile functionality will not support more demanding
residential (eg multi-screen HDTV) or business applications
- Pricing unlikely to support substitution for higher usage
- Trend towards converged bundled retail offers
• On supply-side potential threats and opportunities
- Next generation mobile relying increasingly on fibre backhaul
- Greater reliance by mobile operators on fixed assets? OR
- Potential for mobile operators to enter fixed markets as
infrastructure competitors?
Can fixed backhaul and fibre access be replicated?

44
Will access bottlenecks remain? Prospects for replicability vary by geography
Cost per customer and month at 70% penetration (FTTH/P2P without
inhouse cabling)
• Replicability more likely in dense urban clusters
• Some areas are clearly natural monopolies
• In rural areas (cross)-subsidies would be needed for viability

45
Will access bottlenecks remain? Replicability improved by facility sharing
• 2008 WIK study noted how replicability increased with facility sharing
• HCA duct costs and depreciation would likely improve picture
• ITU (2014) notes cost savings from network sharing could reach 40%
Mark
et
share
of
passed h
om
es r
equired f
or
pro
fita
bili
ty
Impact of passive access on the critical market shares of alternative operators in the
urban cluster – prices based on CCA-LRIC+ estimate
0%
10%
20%
30%
40%
50%
60%
70%
80%
90%
100%
FR DE IT ES
PON own infrastructure using 80% infrastructure sharing (duct access)
Fibre SLU with limited (20%) dark fibre and duct access
Fibre SLU with 80% dark fibre and duct access
46
Replicability in practice
• Case studies allow us to see how far
replicability is possible in practice for FTTH
- France: ~17% households are in ‘very dense areas’
where replicating FTTB is considered viable
• The NRA designated ‘very dense’ areas through an ex ante mapping
exercise, and later made adjustments (to reduce the area) as it learned
through experience
- Spain: 35% households are now in areas deemed
to be ‘NGA prospectively competitive’
• The NRA identified areas for prospective competition on the basis of
actual deployments and projections following a 6 year observation period
in which access to the incumbent NGA network was capped at 30Mbit/s
47
Conclusions from market trends
• Supply and demand of fast broadband are interlinked
• In the status quo, DAE targets unlikely to be met in many EU
member states, and Internet usage may lag other regions
• More widespread NGA or FTTH/B may increase speeds and usage,
although supply is not the only factor – demand-side also important
• Fixed access bottlenecks are likely to remain at least outside dense
urban areas
• Low cost duct access can improve the prospects for replication
• Fixed mobile convergence might provide scope for more stable
facilities-based entry and competition in fixed access based on own
infrastructure and network sharing
48
• Background to the study
• Future trends in high speed broadband
• Business and regulatory models
• Implications for the review of the EU framework for electronic communications
• Next steps
Agenda
Business models
49
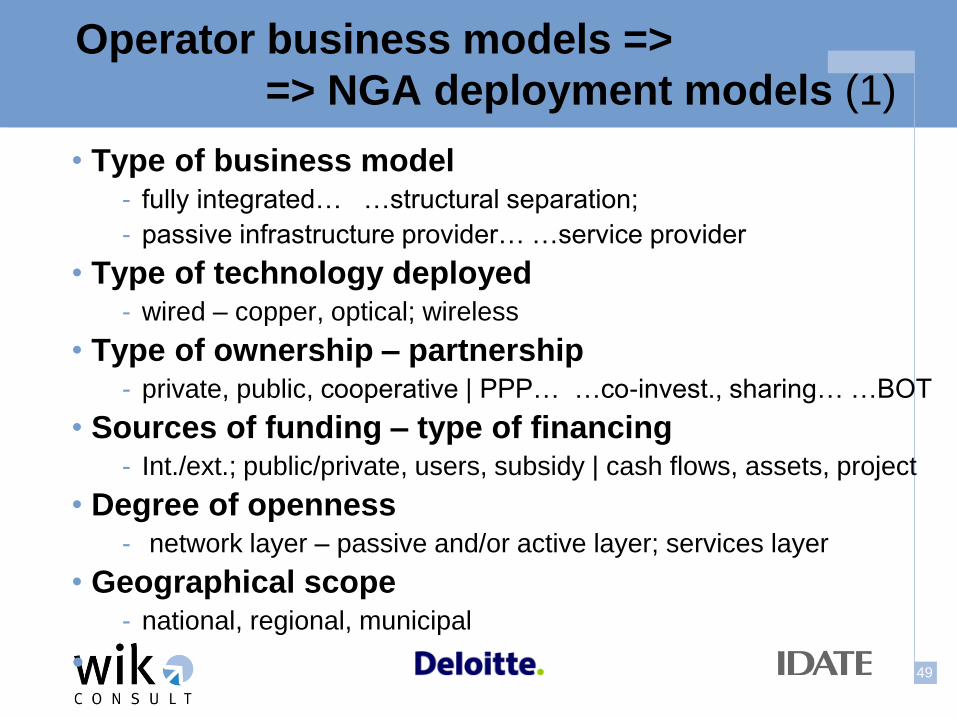
Operator business models =>
=> NGA deployment models (1)
• Type of business model - fully integrated… …structural separation;
- passive infrastructure provider… …service provider
• Type of technology deployed - wired – copper, optical; wireless
• Type of ownership – partnership - private, public, cooperative | PPP… …co-invest., sharing… …BOT
• Sources of funding – type of financing - Int./ext.; public/private, users, subsidy | cash flows, assets, project
• Degree of openness - network layer – passive and/or active layer; services layer
• Geographical scope - national, regional, municipal
•
50
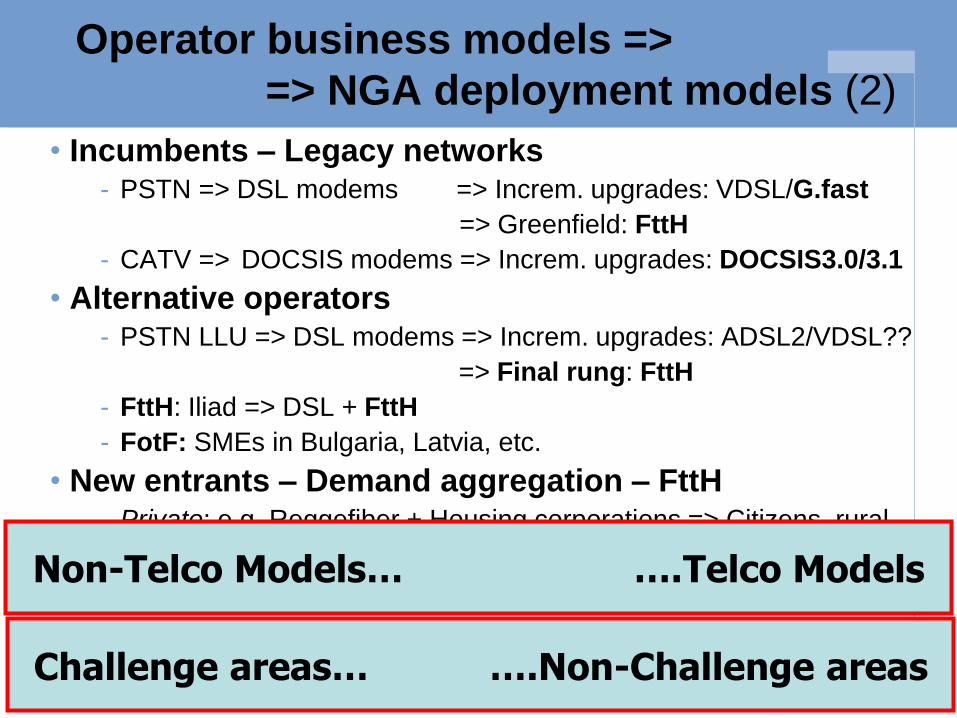
• Incumbents – Legacy networks - PSTN => DSL modems => Increm. upgrades: VDSL/G.fast
=> Greenfield: FttH
- CATV => DOCSIS modems => Increm. upgrades: DOCSIS3.0/3.1
• Alternative operators - PSTN LLU => DSL modems => Increm. upgrades: ADSL2/VDSL??
=> Final rung: FttH
- FttH: Iliad => DSL + FttH
- FotF: SMEs in Bulgaria, Latvia, etc.
• New entrants – Demand aggregation – FttH - Private: e.g. Reggefiber + Housing corporations => Citizens, rural
- Public: Municipalities + Internal use => Citizens, rural
- Citizens: Cooperatives, rural
Challenge areas… ….Non-Challenge areas
Operator business models =>
=> NGA deployment models (2)
Non-Telco Models… ….Telco Models

51
Non-telco NGA deployment - NL:
Major cities… …Challenge areas
• Early case:
Amsterdam
• Demand bundling
• Non-telco actor
• Recent cases:
Cooperatives Bladelglas
MoergestelGlas
OirschotGlas
Reusel-DeMierdenGlas
KempenGlas
Etc.
52
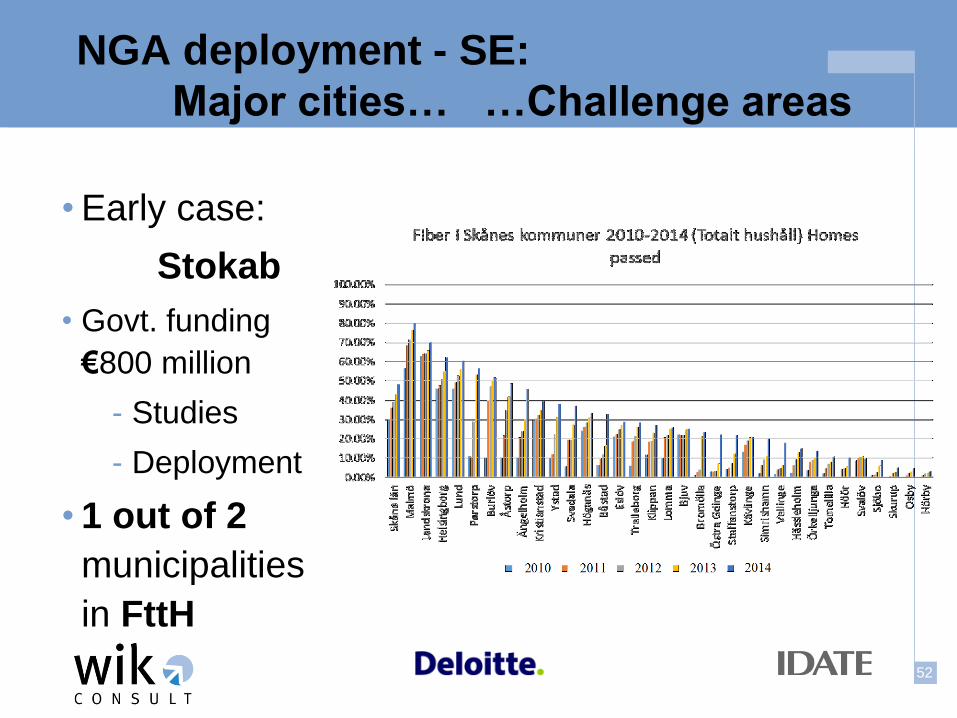
NGA deployment - SE:
Major cities… …Challenge areas
• Early case:
Stokab
• Govt. funding
€800 million
- Studies
- Deployment
• 1 out of 2
municipalities
in FttH

53
Operator business models =>
=> NGA deployment models
Source: Forzati & Mattson In Lemstra & Melody (2015)
54
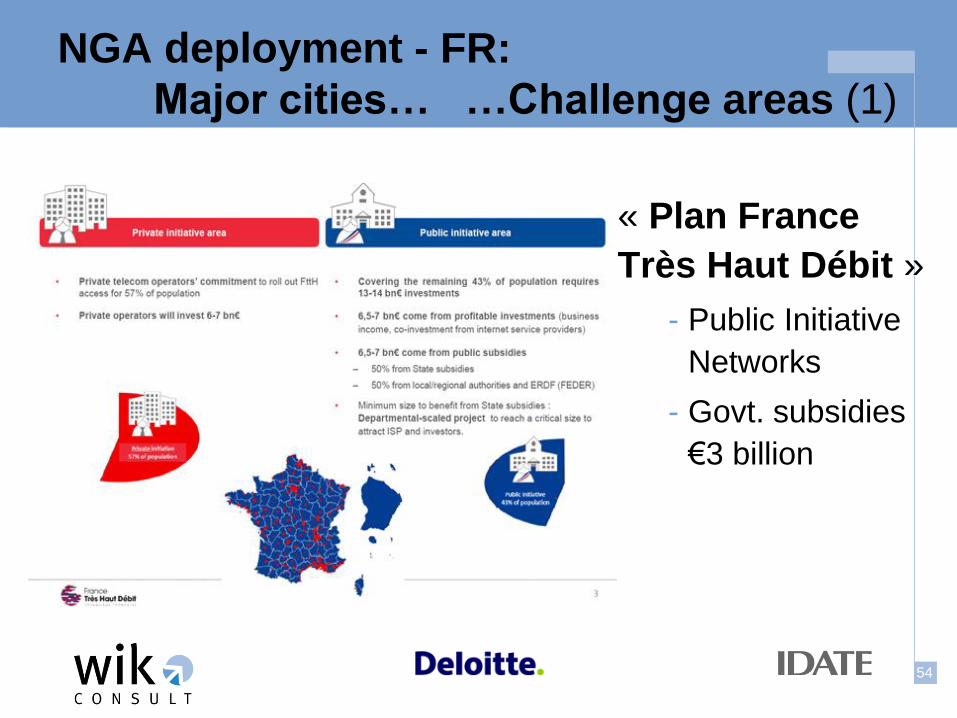
NGA deployment - FR:
Major cities… …Challenge areas (1)
« Plan France
Très Haut Débit »
- Public Initiative
Networks
- Govt. subsidies
€3 billion

55
NGA deployment - FR:
Major cities… …Challenge areas (2)
First Generation PIN -
DSL
Second Generation PIN -
FttH
56
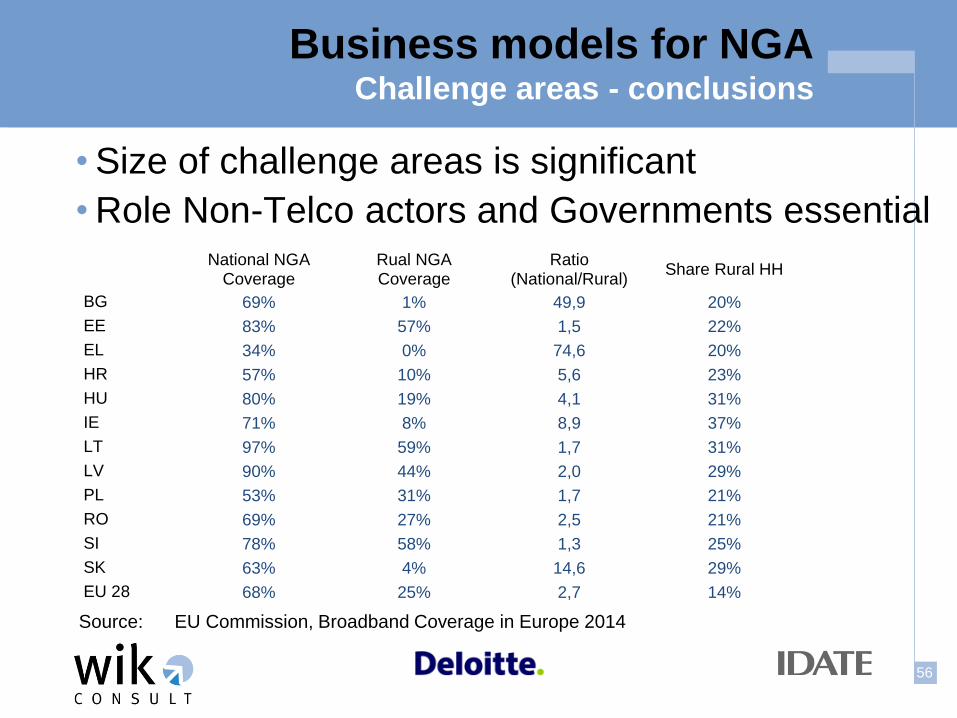
Business models for NGA Challenge areas - conclusions
• Size of challenge areas is significant
• Role Non-Telco actors and Governments essential National NGA
Coverage Rual NGA Coverage
Ratio (National/Rural)
Share Rural HH
BG 69% 1% 49,9 20%
EE 83% 57% 1,5 22%
EL 34% 0% 74,6 20%
HR 57% 10% 5,6 23%
HU 80% 19% 4,1 31%
IE 71% 8% 8,9 37%
LT 97% 59% 1,7 31%
LV 90% 44% 2,0 29%
PL 53% 31% 1,7 21%
RO 69% 27% 2,5 21%
SI 78% 58% 1,3 25%
SK 63% 4% 14,6 29%
EU 28 68% 25% 2,7 14%
Source: EU Commission, Broadband Coverage in Europe 2014
57
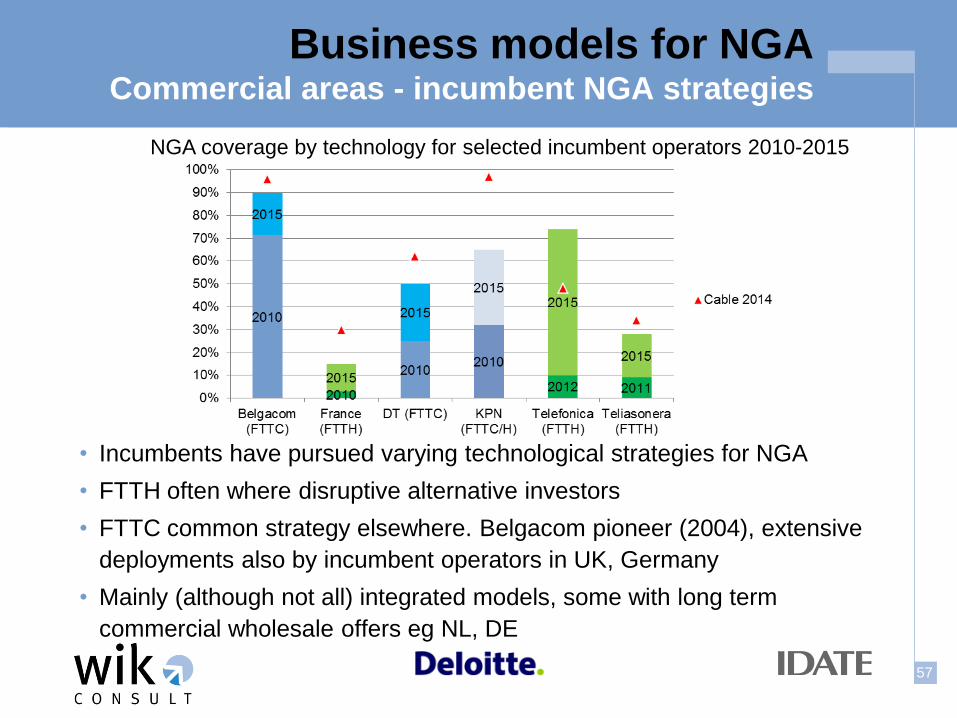
Business models for NGA Commercial areas - incumbent NGA strategies
• Incumbents have pursued varying technological strategies for NGA
• FTTH often where disruptive alternative investors
• FTTC common strategy elsewhere. Belgacom pioneer (2004), extensive
deployments also by incumbent operators in UK, Germany
• Mainly (although not all) integrated models, some with long term
commercial wholesale offers eg NL, DE
NGA coverage by technology for selected incumbent operators 2010-2015

58
Business models for NGA Incumbent separation models
• BT agreed to implement functional separation in 2005
- Undertakings in lieu of reference to Competition Commission
- BT Group makes strategic investment decisions, but assets
deemed under control of Openreach – supplies mainly on basis
of EoI, Governance mechanisms to ensure equivalence
• O2 CZ applied voluntary structural separation in 2015
- Cited business streamlining, easing of regulation and
addressing financial needs
- Company facing significant infrastructure competition
• Both companies (for the moment) focus on FTTC
• Positive initial shareholder reaction
• FS may have supported BT market position vs cable
59
Business models for NGA Entrant NGA investment strategies
• In countries with intensive duct access focus – entrants
have ‘climbed the ladder’ to FTTH in dense areas
• Swaps and co-investment have been pursued by
operators to extend fast broadband coverage
- In Portugal VF concluded commercial FTTH co-investment with
PT on basis of long term IRU and passive access
- In Spain VF has concluded a co-investment arrangement with
Orange on FTTH and access to VF cable network
- France (less dense areas) characterised by regulated FTTH co-
investment amongst main operators on basis of IRU
• Joint ventures by alternative operators and energy
companies in Ireland (SIRO), announcements Italy (Enel)
60
Business models for NGA Commercial areas – conclusions
• Incumbent technological choice (FTTC vs FTTH) may be
influenced by initial competitive impetus
• Examples of incumbents offering wholesale access to
support position (long-term agreements or separation) –
especially where facing challenge of competing platforms
• Entrants have invested in FTTH in some countries
- A key enabler has been access to ducts – either regulated or
from utility partnerships
- Co-investment arrangements have helped to expand coverage
beyond dense urban areas
- Key question: what might foster participation of incumbent?
61
• Background to the study
• Future trends in high speed broadband
• Business and regulatory models
• Implications for the review of the EU framework for electronic communications
• Next steps
Agenda
Regulatory models

62
• Business models for NGA can affect the regulatory regime and vice versa
• A strategy of network sharing or co-investment might lead an NRA to conclude that the
market is competitive. Equally an NRA’s actions can influence the development of co-
investment agreements
• Structural or functional separation may be encouraged by NRAs to promote service
competition, or voluntary separation may lead to greater service competition to which
the regulator responds
• An approach of regulatory forbearance may be associated with the view that
infrastructure competition is already present or might emerge in the absence of
regulation
Assessing regulatory models for NGA How do business models relate to regulation?
Relationship between business and regulatory models
Source: WIK-Consult

63
• Strategies range from forbearance (US) to service competition (Australia)
• European models differ by whether they focus on a ‘climb up ladder’ or ‘stay on
the ladder’ or a combination. Romania example of infrastructure competition
Assessing regulatory models for NGA Which types of regulatory model are pursued?
Initial approaches on the ladder of investment
Standard broadband
(EU)
ForbearanceCl imbing up the
ladder
Remaining on the
ladderFul l ladder Service competition
Own
infrastructure
US,
Rom
ania,
Korea,
Canada
(FTTH)
Duct access
Subloop/termina
ting segment
Local access Nearly universa l
UK, N
L,
Belgium
,
Au
stria,
Sweden
Regional
(bi tstream)
access
In process of ful l or
geographic
deregulation
Au
stralia,
Canada
(FTTC)
Resa le Deregulated
Next generation approaches
Portugal, Spain,
France
Italy, Germ
any
Bro
adba
nd la
dder
of
inve
stm
ent
Source: WIK-Consult

64
Country NGA coverage % HH
NGA take-up % homes passed
Average download speed Mbit/s
Price telephony, TV Internet 30-100Mbit/s Mean rating
Average ranking
Austria 7 14 10 13 11 13
Belgium 1 4 8 12 6 4
Czech 12 16 4 6 10 9
France 14 10 14 2 10 11
Germany 8 13 11 10 11 12
Italy 15 15 16 7 13 15
NL 2 5 3 14 6 3
Poland 13 12 11 11 12 14
Romania 11 7 5 3 7 5
Spain 10 8 13 9 10 11
Sweden 9 2 2 4 4 2
UK 6 9 7 8 8 7
Australia 16 11 15 14 16
Canada 4 1 9 16 8 7
Japan 3 3 1 5 3 1
US 4 6 6 15 8 8
Source EC IDATE Akamai EC/Van dijk
Assessing regulatory models for NGA How do countries perform?
• On a range of measures, leading NGA countries are Japan, Sweden,
Netherlands and Belgium
• US and Canada perform well on coverage and have relatively high NGA take-up,
but prices are high and speeds are not exceptional

65
What drives NGA coverage? Role of infrastructure competition
Impact of cable on NGA coverage
• Cable is a key driver of NGA coverage. It can be readily upgraded to NGA
and has been seen to stimulate competitive NGA provision
• Cable explains most of the NGA coverage advantage in the US, Canada,
Belgium and Netherlands
• FTTH triggered by independent investors in several cases

66
What drives NGA outcomes?
• A wider view highlights that many factors (often non-regulatory)
influence NGA outcomes
67
What drives NGA outcomes? Insights from econometrics
• Negative correlation between infrastructure and access
competition
- Link may be causal or circumstantial
• NGA coverage
- Driven by cable coverage – no other factors are clearly
correlated
- No clear indicators explaining FTTH coverage
• NGA take-up (% HH >30M)
- Associated with lower NGA retail prices – which in turn are
linked to more access-based competition and LLU
- Linked to higher GDP and lower rural populations
68
• Actual average speeds
- Negatively linked to access-based competition (LLU and
generally) – may reflect fact that most access is based on
standard BB. It is also possible that LLU may improve standard
broadband quality and therefore make NGA relatively less
attractive
• Fixed capex
- Linked to higher capex in previous period and higher GDP – not
clearly linked to access competition or regulatory measures.
No clear link between fixed capex and NGA coverage
What drives NGA outcomes? Insights from econometrics (2)

69
• Limited
infrastructure
competition
• High prices for high
speeds (and
therefore low take-
up at high speeds)
• NB Canada has
service competition
on FTTC and cable
(but not widely
used), forbearance
on FTTH before
2015
What drives NGA outcomes? Forbearance - insights from US and Canada

70
• Duct access fostering
infrastructure-based
FTTH competition in
dense urban areas
• Competition elsewhere
through commercial
(Spain), or regulated
(France) co-investment
• Tendency towards
consolidation to 3 large
fixed/mobile players in
these markets
What drives NGA outcomes? Deep passive - insights from France and Spain
km of Telefonica subduct occupied – monthly
cumulative – all operators
Actual and planned FTTH coverage by operator
(m premises)

71
• The UK, Austria and Germany pursued flexible pricing for FTTC
NGA bitstream/VULA since 2010
• FTTH also covered by regime in UK and Germany (in theory) while
in Austria FTTH was not included in market analysis initially
• Technological outcomes have been FTTC in these cases
(some scaling back of initial FTTH ambitions)
• Incumbent commercial deployment appears to have extended
beyond cable areas – pricing regime may have played a role in
supporting additional reach
• What would have been/would be impact of applying only to FTTH?
• Limited infrastructure competition in these countries. Some service
competition on basis of NGA (less than for standard broadband) –
may be tied to incumbent speed/price offers
What drives NGA outcomes? Pricing flexibility - insights from UK, Austria and Germany

72
• There are a few examples of incumbent separation, but drivers and
context are different – affecting outcomes in each case
• Outcomes in Australia to date have been poor – delays and
uncertainty from changed Govt strategy as well as the planned
phase-out of infrastructure competition may have had impact
• In the UK functional separation:
- Seems not to have undermined NGA investment incentives (widespread FTTC
coverage, increasing take-up); and
- May have supported NGA wholesale access (greater take-up compared with
other countries); BUT
- It has not of itself incentivised further upgrades to legacy network – Ofcom 2016
DCR aims to foster FTTH through infrastructure competition
• Too soon to judge outcome from Czech separation
What drives NGA outcomes? Separation - insights from UK, Czech and Australia

73
• The influence of NGA regulation on outcomes is subtle. Regulation
may not be the most significant factor affecting NGA outcomes today
• Cable plays a strong role in influencing NGA coverage. GDP and
population density provides an important driver for take-up
• Case studies on specific NGA regulation approaches provide further
insights on the role of regulation:
- Forbearance may lead to high prices and limited take-up of high speed offers
- ‘Deep passive approaches’ (FR, ES, PT) have fostered FTTH infrastructure-
based competition in dense urban areas, but tend to more consolidated markets
- Pricing flexibility (UK, AT, DE) may have contributed to extending FTTC beyond
cable areas – what would be effect of applying only to high speed technologies?
- Structural separation could in theory undermine ‘buy build’ decisions and does
not seem of itself to incentivise upgrades of legacy network, but it could be
efficient in areas where only one network is viable
What drives NGA outcomes? Conclusions from regulatory analysis
74
• Regulation which supports fast broadband deployments may also
benefit business customers, but there are important differences (see
eg SMART 2014/0024):
- Business customers may require multi-site or multi-national provision
- Customers may demand consistent quality and service levels across multiple sites
- Business suppliers serving multi-national clients may not have sufficient scale in
every country to engage in co-investment, and therefore may rely on wholesale
access outside dense business districts
- Infrastructure-based operators focused on residential markets may not be willing or
able to offer wholesale products to meet business needs
• Regulation aimed at fostering competition and investment in residential
broadband may not completely address business market challenges
• Current national approaches to business access regulation do not tend
to reflect cross-border aspect
• Product characteristics (business bitstream) and SLAs can vary widely
Serving multi-national corporations Challenges for customers and suppliers

75
• Background to the study
• Future trends in high speed broadband
• Business and regulatory models
• Implications for the review of the EU framework for electronic communications
• Next steps
Agenda

76
Implications for the framework? Is there a problem?
Deployment and uptake trends suggest that Europe
may fail to meet the DAE targets and may fall behind
on Internet usage. Moreover there are significant gaps
between countries and between urban and rural areas
- Question 1: Do you agree with this analysis? If so, is it a
problem? How much of a problem? How might it evolve?

77
Implications for the framework? What should be objectives for the future?
There is evidence that fibre technologies are linked with
higher speeds, and potentially higher usage over time
- Question 2: Should it made clearer that the end-goal of the
framework is to achieve widespread availability and usage of
high performance broadband networks by citizens and
businesses?
There is evidence that disruption from infrastructure
competition stimulates NGA investment
Question 3: Should the framework set an objective to
foster infrastructure competition wherever feasible?

78
Implications for the framework? Are changes needed to the market analysis process?
• Many EU regulatory strategies described have been
implemented within the bounds of today’s framework,
but they are not required or central to the framework
- Infrastructure mapping pursued in Spain, France and increasingly
other MS, but not universal
- The regimes in France, Spain, Portugal rely more on symmetric
measures (eg in-building wiring) and forbearance on SMP
remedies than envisaged in the framework
- Co-investment and commercial arrangements are not specifically
discussed in the Framework
- The separation models in Europe have not been implemented
through the current framework
- The framework does not specifically address the promotion of
investment in challenge areas

79
Implications for the framework? Are changes needed to the market analysis process?
• Question 4: Should NRAs be required to undertake infrastructure
mapping in the context of market analyses?
• Question 5: Should symmetric obligations be considered within the
context of the market analysis process?
• Question 6: Should co-investment and/or commercial arrangements
be encouraged? If so how?
• Question 7: Are wholesale only business models a relevant tool to
promote the diffusion of NGA – generally or in less dense areas? If
so, should this model be incentivised under the framework?
• Question 8: What more could be done in the scope of the framework
to support NGA deployment in rural areas?

80
• In the context of reform to the access regime, it is also relevant to
consider where there is a need for consistent application of the
access rules and what are the implications for the institutional set-up
(Task 4 in the study)
- Question 9: What is the appropriate balance between flexibility for
NRAs and harmonisation at EU level in access rules?
- Question 10: What should be the role of the NRAs, Commission and
BEREC in a reformed framework?
Implications for the framework? Are changes needed to the institutional process?

81
WIK-Consult GmbH
Postfach 2000
53588 Bad Honnef
Deutschland
Tel.:+32 2 830 0380
Fax: +32 497 505641
www.wik-consult.com