broadening base / base resources / annual report 2018 chairman’s letter dear shareholders this was...
TRANSCRIPT

BroadeningBase
Annual Report 2018

ii / BASE RESOURCES / ANNUAL REPORT 2018
Forward Looking Statements
Certain statements made in or in connection with this Annual Report contain or comprise forward-looking statements, including but not limited to statements regarding capital cost, capacity, future production and grades, sales projections and financial performance of the Kwale Operations, estimated mineral resources and ore reserves, trends in commodity prices and currency exchange rates, demand for commodities (in particular mineral sands), plans, strategies and objectives of management, operating costs, anticipated production life of the Kwale Project, provisions and contingent liabilities and tax and regulatory developments.
Forward-looking statements involve known and unknown risks, uncertainties, assumptions and other factors that are beyond Base Resources’ control.
No representation, warranty, assurance or guarantee can be given that such forward-looking statements will in fact be achieved or prove to be correct. Results or outcomes could differ materially from those expressed or implied by the forward-looking statements as a result of, among other
factors, changes in economic and market conditions, success of business and operating initiatives and strategies, changes in the regulatory environment and other government actions, fluctuations in product prices and exchange rates and business and operational risk management. To the maximum extent permitted by law, Base Resources and its related bodies corporate and affiliates, and their respective directors, officers, employees, agents and advisers, disclaim any liability (including, without limitation, any liability arising from fault, negligence or negligent misstatement) for any direct or indirect loss or damage arising from any use or reliance on this Annual Report or its contents, including any error or omission from, or otherwise in connection with it.
Except as required by applicable regulations or by law, Base Resources does not undertake to publicly update, review or release any revisions to these forward-looking statements to reflect new information or future events or circumstances.
Contents
Highlights and Achievements 3 Chairman’s letter 4
Operating & financial review 6Operation summary 8 Market, sales and outlook 18
Sustainability in practice 11 Corporate finance 20
Business development 16 Resources and reserves 22
Directors’ report 26Remuneration report 35 Lead auditor’s independence deceleration 63
Corporate governance statement 51
Financial statements and notes 62Consolidated statement of profit or loss and other comprehensive income
64 Directors’ declaration 94
Consolidated statement of financial position 65 Independent auditor’s report 95
Consolidated statement of changes in equity 66 Additional shareholder information 100
Consolidated statement of cash flows 67 Glossary 102
Notes to the consolidated financial statements 68 Corporate directory 103

BASE RESOURCES / / 1
Base Resources (ASX and AIM: BSE) is an Australian
based, African focused mineral sands producer and
developer with a track record of project delivery
and operational performance.
The Company’s Kwale Operation is a consistent,
high margin operation, with an optimised life of mine
production profile following the recent enhancement
project. Near-mine exploration is underway,
presenting a significant opportunity for mine life
extension and further value creation.
The recently acquired Toliara Project, underpinned by
the large, long life and high grade Ranobe deposit, is
considered by Base Resources to be one of the best
mineral sands development projects in the world.
The project is currently progressing through accelerated
study phases, building on work previously completed,
towards an anticipated decision to proceed to
construction in late 2019 which would see production
in late 2021.
Benefiting from improving prices and consistent
production and costs at Kwale Operations, the
Company has achieved record profits during the
reporting period. This enabled a rapid reduction in net
debt, providing Base Resources with a strong financial
platform from which to grow the business and create
a unique “mid cap” mineral sands company.

2 / BASE RESOURCES / ANNUAL REPORT 2018

BASE RESOURCES / HIGHLIGHTS AND ACHIEVEMENTS / 3
Highlights and Achievements
0Total Recordable Injury
Frequency Rate of zero -
no lost time due to injury
since 2014
19%
Kwale South Dune Measured
and Indicated resources
increased by 19%
3.8M
Invested in community and
environment programs
Average price improvements
for all products
Acquisition of the
World-Class Toliara
Project in Madagascar
Kwale Phase 2 mine
optimisation project
successfully completed
22%
Revenue increased
22% to US$198.8m
and EBITDA increased
32% to US$109.3m
50%
Net debt reduced by
US$65.3m to US$33.2m
2.8:1Revenue to cost of sales ratio
of 2.8:1

4 / BASE RESOURCES / ANNUAL REPORT 2018
Chairman’s letter
Dear Shareholders
This was a pivotal year for Base Resources with improving markets driving
record financial performance, continued high cash flow, further optimisation
of the Kwale operation and the acquisition of the World-Class Toliara Project.
Our Company is in excellent shape to capitalise on short, medium and long term
opportunities in a sector with sound fundamentals.
Demand for our products continued to improve in the year
and this, along with low inventory levels and restricted supply,
supported strong price improvement. Those dynamics have
continued for rutile and zircon post year end.
This improved pricing environment, combined with consistent
production over the period, saw the Company achieve record
revenue of US$198.8m, a 22% increase on the prior period.
This result, along with our low operating costs and focus on
efficiency, led to a 32% increase in EBITDA to US$109.3m
and a 114% increase in profit after tax. Strong cashflow
allowed the Company to reduce net debt by US$65.3m
over the period. Net debt now stands at US$33.2m and
is expected to be retired in the coming year.
To counter declining ore grades expected from late 2018
onwards, and to fully exploit the availability of mineral
separation plant (MSP) capacity, the Board approved,
in May 2017, the implementation of the Kwale Phase 2 (KP2)
Project. This significant capital project was executed during
the financial year, on schedule and on budget, and is achieving
the intended outcomes. The objective of the KP2 Project was
to maximise feed to the MSP for the remaining life of mine,
by increasing mining rates as ore grade declines. This has been
achieved through increasing the hydraulic mining capacity to
three 800tph Hydraulic Mining Units, while gradually phasing
out the existing Dozer Mining Unit. The Wet Concentrator
Plant and water supply infrastructure have also been
upgraded in parallel to accommodate the higher mining rates.
The seamless execution of the project without impact on the
performance of the operations, and its management in-house,
is testament to the capability of the Group’s operational
and project teams.
With the Kwale operation running smoothly and with greater
flexibility post-KP2, the focus has been squarely on extending
the mine life. As a result of the South Dune drilling program
completed in 2017, a 19% increase in Measured and Indicated
resource for the Kwale Operation was announced in
October 2017. This will be incorporated into an updated Ore
Reserve once the requisite extension to the Special Mining
Lease is granted, which is expected in the near future.
The focus of drilling activity has now shifted to the north east
sector of the Kwale operations, on the North Dune and Kwale
East zones with encouraging indications to date. We are
optimistic that further mine life extension will result.
Most importantly the above performances, results and
progress were achieved with an uncompromising focus on
the safety, health and wellbeing of our staff, contractors and
communities. One of Company’s most significant highlights
was the Total Recordable Injury Frequency Rate at zero at
the end of the financial year, with no medical treatments
across the year. The Kwale Operation has not had a lost
time injury since February 2014 and our employees and
contractors have now worked 13.2 million man-hours LTI free.
This is a remarkable achievement for any mining operation
anywhere in the world.
This year’s outcomes were only made possible by a highly
capable, engaged and dedicated team at all levels of our
organisation. Our approach of actively prioritising those
closest to our operations for employment opportunities has
enabled us to build a workforce with 67% of employees being
from the local Kwale County and 97% from Kenya. Coupled
with extensive and effective training (60,000 hours of training
being delivered in the year) and apprenticeship and graduate
programs, this workforce is highly effective and delivering

BASE RESOURCES / CHAIRMAN'S LETTER / 5
some inspiring personal development stories as individuals
are progressing up through the organisation.
Beyond employment opportunities, the Company is
focused on creating a balanced flow of mutual benefit
with our communities via various livelihood, health, social
infrastructure and education programs. One such program,
the Kwale Cotton Project, was honoured to receive the New
Vison for Development award from the World Economic
Forum in February this year.
Base Resources is committed to undertaking its
operations in a way that minimises impacts on the
environment and maximises opportunities for positive
environmental outcomes. The Company has a comprehensive
environmental management program and recorded no
environmental incidents during the year. In Kenya, the
Company achieved these good results through partnerships
with communities, environmental authorities, local and
international conservation groups and expert organisations
to realise the objective of sustaining and improving the
regions rich biodiversity.
In order to fully capitalise on the organisational capability,
business model and financial platform honed on the Kwale
development, we have been seeking the right growth
opportunity from which to drive shareholder value.
During the year, we were delighted to have been able to
secure the Toliara Project in Madagascar. We have spent
considerable effort in recent years evaluating such acquisition
opportunities and consider the Toliara Project to be one of the
best development opportunities in the world due to the size
of the deposit, the consequent long mine life, it’s expansion
potential, scope for operational scale up, technical simplicity
and expected competitive positioning in the sector. We are
confident that this is a project Base Resources can execute well.
Since completing the acquisition earlier in the year, a concept
study has been completed and a suite of additional test
work, to build on the sound work already completed, is well
advanced. Mineral Technologies and Lycopodium have been
engaged to complete the pre-feasibility study which is heading
towards completion in the March quarter of 2019. The aim is
to bring the Toliara Project into production in late 2021.
I believe Base Resources is now very well positioned to
create further shareholder value. We have an outstanding
operating asset in our Kwale Operation with strong
cash generation and extensional potential, an exciting
development opportunity with the World-Class Toliara
Project and an outstanding team with a recognised
reputation for successful mineral development.
I’d like to thank the Board, our people, suppliers, local
communities and host governments for their steadfast
support and commitment. I’d also like to welcome
Diane Radley to the Board as a Non-Executive Director,
with her extensive leadership experience in Africa she
has already added considerable value.
Finally, thank you to you, our shareholders, for your
confidence and ongoing support as we continue to create
a truly unique mineral sands company.
Keith Spence
Chairman

OPERATING & FINANCIAL REVIEW
TOLIARA PROJECT, MADAGASCAR

BASE RESOURCES / OPERATING & FINANCIAL REVIEW / 7
KWALE OPERATIONS, KENYA
BASE RESOURCES HEADQUARTERS, PERTH

8 / BASE RESOURCES / ANNUAL REPORT 2018
Operation summary
Base Resources operates the 100% owned Kwale Operation in Kenya, which
commenced production in late 2013. The Kwale Operation is located
50 kilometres south of Mombasa, the principal port facility for East Africa.
The Kwale Operation is designed to process ore to recover
three main products: rutile, ilmenite and zircon. Mining
operations have recently completed the transition from dozer
to hydraulic mining, which has proved to be cost effective and
well suited to the Kwale deposit. Ore is received at the wet
concentrator plant from the mining units via a slurry pipeline.
The wet concentrator plant removes slimes (sub 45-micron
particles), concentrates the valuable heavy minerals with a
number of gravity separation steps and rejects most of the
non-valuable, lighter gangue minerals to produce a heavy
mineral concentrate. The heavy mineral concentrate is
then processed in the mineral separation plant. The mineral
separation plant cleans and separates the rutile, ilmenite
and zircon minerals into finished products for sale.
MiningMining volume increased by 3% in the reporting period
(the year ended 30 June 2018) compared to the comparative
period (the year ended 30 June 2017), despite a month-long
mining and wet concentrator plant shutdown in March 2018
to complete final equipment installation for the Kwale Phase
2 mine optimisation project. As part of the Kwale Phase 2
Project, the Company successfully commissioned a second
hydraulic mining unit, to complement the existing hydraulic
mining unit and dozer trap mining unit. With these three
mining units operating for the final quarter of the reporting
period, mining and wet concentrator plant volumes increased
37% over the prior three quarters. A third hydraulic mining
unit was commissioned in July 2018 and the dozer trap mining
unit is now on standby. Mined ore grade remained consistent
with the comparative period (7.1%) as mining proceeded
around the north-western fringes of the Central Dune orebody.
Mining and Wet Concentrator Plant (WCP) Performance 2018 2017
Ore mined (tonnes) 11,332,668 11,014,939
Heavy mineral (HM) % 7.12 7.09
WCP heavy mineral concentrate production (tonnes)
748,081 708,404
The increase in mining volume resulted in production of heavy
mineral concentrate increasing to 748,081 tonnes, higher
than the comparative period’s 708,404 tonnes. The heavy
mineral concentrate stockpile decreased to 77,912 tonnes at
30 June 2018 (comparative period: 83,632 tonnes), following
the draw down of stocks during the one-month shut down for
Kwale Phase 2 commissioning.
Processing
Mineral Separation Plant (MSP) Performance 2018 2017
MSP feed (tonnes of heavy mineral concentrate)
753,801 764,171
MSP feed rate (tph) 91 91
MSP recovery %
Ilmenite 100 100
Rutile 100 97
Zircon 77 73
Production (tonnes)
Ilmenite 464,988 467,359
Rutile 91,672 90,625
Zircon 37,157 34,228
Zircon low grade 1,425 10,210
The mineral separation plant has continued to maintain
high throughput rates with an average of 91tph achieved
for the reporting period (comparative period: 91tph) and
total heavy mineral concentrate feed to 753,801 tonnes
(comparative period: 764,171 tonnes), lower due to
marginally reduced utilisation.
Ilmenite production continued at above design capacity,
achieving production of 464,988 tonnes (comparative
period: 467,359 tonnes), with the reduced volume of mineral
separation plant feed accounting for the difference.
Rutile production increased to 91,672 tonnes in the reporting
period (comparative period: 90,625 tonnes) due to higher
product recoveries, partially offset by slightly lower contained
rutile in the mineral separation plant feed.
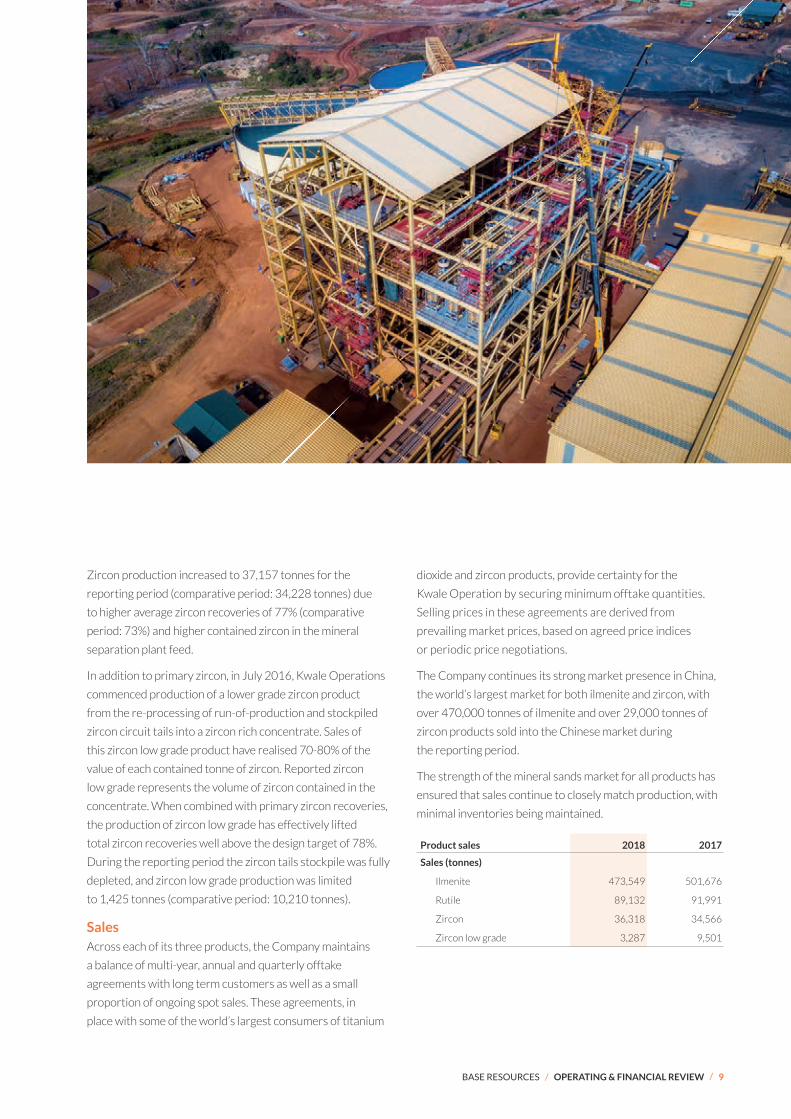
BASE RESOURCES / OPERATING & FINANCIAL REVIEW / 9
Zircon production increased to 37,157 tonnes for the
reporting period (comparative period: 34,228 tonnes) due
to higher average zircon recoveries of 77% (comparative
period: 73%) and higher contained zircon in the mineral
separation plant feed.
In addition to primary zircon, in July 2016, Kwale Operations
commenced production of a lower grade zircon product
from the re-processing of run-of-production and stockpiled
zircon circuit tails into a zircon rich concentrate. Sales of
this zircon low grade product have realised 70-80% of the
value of each contained tonne of zircon. Reported zircon
low grade represents the volume of zircon contained in the
concentrate. When combined with primary zircon recoveries,
the production of zircon low grade has effectively lifted
total zircon recoveries well above the design target of 78%.
During the reporting period the zircon tails stockpile was fully
depleted, and zircon low grade production was limited
to 1,425 tonnes (comparative period: 10,210 tonnes).
SalesAcross each of its three products, the Company maintains
a balance of multi-year, annual and quarterly offtake
agreements with long term customers as well as a small
proportion of ongoing spot sales. These agreements, in
place with some of the world’s largest consumers of titanium
dioxide and zircon products, provide certainty for the
Kwale Operation by securing minimum offtake quantities.
Selling prices in these agreements are derived from
prevailing market prices, based on agreed price indices
or periodic price negotiations.
The Company continues its strong market presence in China,
the world’s largest market for both ilmenite and zircon, with
over 470,000 tonnes of ilmenite and over 29,000 tonnes of
zircon products sold into the Chinese market during
the reporting period.
The strength of the mineral sands market for all products has
ensured that sales continue to closely match production, with
minimal inventories being maintained.
Product sales 2018 2017
Sales (tonnes)
Ilmenite 473,549 501,676
Rutile 89,132 91,991
Zircon 36,318 34,566
Zircon low grade 3,287 9,501

10 / BASE RESOURCES / ANNUAL REPORT 2018

BASE RESOURCES / OPERATING & FINANCIAL REVIEW / 11
Sustainability in practice
From project conception through to full-scale production, Base Resources
has adopted world-class, sustainable business practices seeking to minimise
any negative impacts and maximise positive outcomes of its operations for its
employees, its host community and more broadly, its host nations.
Base Resources is committed to complying with national
legislation and international best practice, specifically the
International Finance Corporation’s Performance Standards,
the Equator Principles, World Bank Group’s Environmental,
Health and Safety Guidelines, International Labour
Organisation’s core labour standards and the United
Nations Voluntary Principles on Security and Human Rights.
With this approach, Base Resources is helping to set sound
benchmarks for effective and responsible development in
Kenya’s emerging mining sector and beyond. In recognition
of the Company’s demonstrated commitment to sustainability
in practice the World Wildlife Fund Kenya recently
partnered with Base Resources to deliver the second annual
Understanding Environmental and Social Standards and
International Best Practices in Large-Scale Developments
Training. The Kwale Operation was also the proud recipient
of an award from the Kenyan National Environmental
Management Authority for outcomes in environmental
management and biodiversity conservation.
Local EmploymentBase Resources is committed to prioritising employment for
local communities. In Kenya, the Company’s employment
system is specifically designed to maximise employment
opportunities and project benefits to local communities
by giving preference to those residing in the immediate
environs of the mine. Through a ‘fencing system’, established
in consultation with the Kenyan government and local
communities, progressively lower priority is given to those
living further away from the mine. This system has proved
highly effective and, of the 1,072 people directly employed
in Kenya (768 by Base Resources and 304 by Kenyan service
providers), 97% are Kenyan with 67% drawn from Kwale
County. High local workforce participation, in conjunction
with operational and safety performance, are considered key
success factors for the Company.
While expatriates represent just 3% of employees in
Kenya, Base Resources is committed to further reducing
its expatriate workforce over the coming years, with an
employee succession program in place to ensure the transfer
of specialist skills to Kenyan nationals.
At the Company’s Toliara Project In Madagascar a labour
recruitment system and influx management plan, mirroring
that used successfully at Kwale Operations, is being
implemented in consultation with the Malagasy government
and local communities.

12 / BASE RESOURCES / ANNUAL REPORT 2018
Skills TransferBase Resources has structured training and skills transfer
programs covering on-the-job training for permanent
employees, and also extending to tailored programs for
graduates, interns, apprentices and high school students,
providing a platform for systematic and rapid transfer of
knowledge and skills.
The programs focus not only on employees, but also
on building skills capacity in the broader community.
To complement classroom learning, Base Resources partners
with local universities to provide opportunities for technical
trades apprentices to gain the necessary practical experience
in the workplace.
At Kwale Operations, skills transfer has been supported
through sustained graduate, internship and apprentices’
programs where a total of 101 students have benefited from
these programs run by the Company during the reporting
period. In the same period, four foreign expatriates who left
the company had their positions filled by Kenyan, locally
promoted, staff, including two at manager level.
Base Resources has committed an annual budget of
US$0.6 million for training and development at its
Kwale operation. This reflects the Company’s continued
commitment to skills transfer to its Kenyan workforce
which extends to capacity building for the mining industry
was a whole.
Training plans are underway in Madagascar with systems
being established for community training programs to
commence in late 2018, aimed at developing the necessary
skills for the construction of the Toliara Project.
Employee EngagementBase Resources places significant emphasis on establishing and
developing a highly engaged, satisfied and motivated workforce,
with the operational performance achieved to date, across
production, safety and cost management, reflective of the
Company’s success in developing human capital.
An integral component of this focus is an independently
conducted biennial employee survey. The objective of the survey
is to measure the workplace culture represented by current
worker behaviours and perceptions. It also identifies key areas
for improvement and action towards the Company’s desired
workplace culture, described as the ’Base Way’. Regular surveys
have been conducted since the commencement of operations
and have seen high response rates.
In addition to productivity and safety performance,
absenteeism, staff turnover and industrial action are key
indicators of employee satisfaction and motivation as well as
sources of competitive cost advantage. An absenteeism rate
of 2.3% was recorded in Kenya for the reporting period.
The voluntary staff turnover rate for the year was also very
low at 1.9%, up from the prior year’s 1.4%. The Kwale
Operations have not recorded any industrial action since
commencement of operations.
SafetyThroughout the construction, commissioning and operation
of the Kwale mine, Base Resources has entrenched a first-
world, best-practice safety culture. In this regard, Base
Resources is very pleased to complete another year with no
serious injuries occurring and Kwale Operations’ Lost Time
Injury Frequency Rate has remained at zero. Base Resources
employees and contractors have now worked close to
14 million man-hours Lost Time Injury free, with the last
Lost Time Injury recorded in February 2014.
After successful implementation of several initiatives to
reverse a rising trend in minor medical treatment injuries,
the Company recorded no medical treatment injuries in the
reporting period which resulted in a Total Recordable Injury
Frequency rate of zero for the year.
The Kwale Operations’ safety performance continues to be
an outstanding achievement by first-world mining operation
standards, let alone for an emerging mining jurisdiction.
Community Engagement and Development
Base Resources understands that achieving its long-term
goals is reliant on building beneficial relationships with the
communities in which it operates and establishing a balanced
flow of mutual benefit.
As communities affected by mining operations play an
integral role in the Company’s overall success, Base
Resources engages with its local communities in a structured
and inclusive manner. In this way, the community benefits

BASE RESOURCES / OPERATING & FINANCIAL REVIEW / 13
from a series of sustainable development and livelihood
improvement programs in exchange for a social license,
practically manifested in the provision of proud, motivated
employees, security, support and a positive reference
for future projects.
In accordance with Base Resources’ Stakeholder
Engagement Plan at its Kwale Operation, the Company has
established a number of committees to act as an interface
between the Company and local communities. This is an
important tool for managing expectations, addressing
grievances or concerns, and establishes a mechanism
for achieving more participatory and inclusive solutions.
These committees also play a major role in identifying
community development priorities. A similar Stakeholder
Engagement Plan is being developed for the Toliara Project.
The committees are made up of affected stakeholders,
community leaders representing women, youth and the
disabled, Members of the County Assembly, religious
leaders, government and county level lead agencies and
administrators. These forums are further supported by
special interest sub-committees where appropriate.
Through close collaboration with the liaison committees,
community priorities have been identified as capacity
building, meeting basic needs such as health and education,
and establishing physical infrastructure to improve
standards of living.
In targeting these priorities, Base Resources continues
to engage in constructing social infrastructure, improving
community health, providing educational opportunities,
and an increasing emphasis on leading livelihood
improvement programs through the introduction
of commercial agriculture.
Agricultural livelihood programs in Kwale, run in conjunction
with partners Business for Development, DEG, FMO
and Australia’s Department of Foreign Affairs and Trade
continue to develop with encouraging support from both
national and county Kenyan governments. These programs,
covering cotton, sorghum, potato and poultry, now involve
around 3,000 smallholder farmers and community groups
with the ultimate aim being to establish new agricultural
opportunities that will provide economic growth well beyond
the life of mining activities.
The Kwale Cotton project has proved particularly successful
to date, with the number of participating farmers growing
exponentially each year since its commencement and
resulted in this year’s production exceeding 75 tonnes
of Kenyan cotton lint which was exported to Bangladesh
for further processing. After achieving a critical mass in
the reporting period , a cotton farmers’ cooperative was
established to assist in the administration of all facets of
production and sale.
Reflecting the quality, scope and potential of these
agricultural programs to drive regional socio-economic
development, additional financial support has been secured
with a number of organisations, including the Australian
Government and FMO.

14 / BASE RESOURCES / ANNUAL REPORT 2018
In addition to the agricultural livelihood programs, to date,
over 150 individual projects have been completed, including:
• Schools: 30 educational infrastructure projects have been
undertaken, including construction of new institutions and
refurbishment or upgrading of existing facilities including
two new laboratory facilities for leading boys and girls
secondary schools in Kwale County.
• Scholarships: During the year, Base Resources continued
its own scholarship program with 1,500 secondary school
awards given and 1,072 tertiary placements supported
to date. In addition, partnerships with educational NGO’s
continue to provide support for a further 850 students at
both secondary and tertiary levels.
• Medical Facilities: Constructed and equipped the Bwiti
Dispensary, Magaoni Health Centre and a local hospital-
based blood bank facility in Kwale County. Base Resources
also worked with the Mombasa County Government and
other organisations to complete a maternity wing at the
Likoni Sub-County Hospital. In addition, Base Resources
provided a four-wheel-drive ambulance to Kwale County
health authorities to service hard to reach communities.
• Community Health: Providing training for community
health workers, equipping medical facilities and supporting
vaccination and general health campaigns. Six locations are
currently supported in Kwale County and Likoni.
• Water Supply: 14 boreholes have been sunk and fully
equipped including the recently completed borehole at
Kilole in Kwale County.
• Drought Relief: During the past year, Kenya has
experienced significant drought conditions. Base
Resources has assisted the local community by providing
29 tonnes of relief food in collaboration with the Kwale
County Government, local civil society organisations and
Kenya Red Cross.

BASE RESOURCES / OPERATING & FINANCIAL REVIEW / 15
• Community Groups Training: Together with the Dzarino
Community Based Training Organisation, Base Resources
runs economic empowerment training programs for
community groups to equip them with basic economic
skills to assist in initiating business start-ups and
entrepreneurial activities.
With the Company’s recent commencement of activity in
Madagascar, the primary focus of community programs have
been in the continued support of the Australian Doctors
For Africa surgical missions in the Toliara region. Wider
community development programs are being developed
and a Memorandum of Understanding has been executed to
set out the protocols for collaboration between the City of
Toliara and Base Resources in development initiatives.
EnvironmentBase Resources is committed to operating in a sustainable
and environmentally responsible manner. The Company
operates a comprehensive environmental management
system, and had no environmental incidents during the year.
At the Kwale Operation, work progressed on several
programs aimed at rehabilitating impacted areas, improving
local biodiversity, and promoting conservation and
sustainability, with some notable examples being:
Rehabilitation of the Tailings Storage Facility walls
The Tailings Storage Facility sand walls reached their
full height towards the end of the reporting period.
Rehabilitation and stabilisation of the external walls
continued throughout the period with approximately
25% now classified as fully rehabilitated. Seeds and top soil
erosion control materials are sourced from local women’s
groups, thereby providing additional incomes for villages
surrounding the mine site.
Rare and Endangered Flora Propagation Research Program
Targeting species of conservation interest, the program
identifies indigenous plant species for propagation in the
Kwale Operations nursery. With 276 indigenous species
represented, and almost 88,000 trees grown to date, the
nursery represents one of the largest of its kind in Africa,
with a number of propagated rare species considered to be
of conservation significance. More than 90 of these appear
in the IUCN Red List of Threatened Species, as either
Critically Endangered, Endangered or Vulnerable. The
nursery together with the arboretum established alongside
it, function as a training and educational facility for local
community projects and visitors.
Establishment of a Biodiversity Corridor
Being located alongside forest reserves that form part of the
Coastal Forests of Eastern Africa Biodiversity Hotspot has
enabled Base Resources to capitalise on the opportunity to
achieve a net positive biodiversity outcome by establishing
a biodiversity corridor that links remnant patches of
indigenous forest to the Gongoni Forest Reserve. During the
year, work continued on the development of the biodiversity
corridor with over 65,000 trees planted in the corridor to
date, including over 11,000 classified as species being of
conservation significance and more than 6,500 classified as
either Critically Endangered or Endangered.
Wetland Restoration
An ephemeral wetland that had remained dry for a number
of years prior to the commencement of operations has been
successfully restored. After locating project infrastructure
so as to avoid encroachment into the area, clean drainage
from the tailings storage facility was directed to flow into
the former wetland and indigenous sedges and other
aquatic vegetation planted. The wetland now provides an
ideal habitat for both floral and faunal species of significant
conservation importance. Amphibian and reptile monitoring
found that the restored wetlands now support permanent
populations of the endangered Shimba Hills Reed Frog
(Hyperolius rubrovermiculatus) and other fauna and flora of
conservation importance. Furthermore, monitoring shows
that a number of key insect populations continue to thrive
in various wetland areas around the mine site. These insects
are a key indicator of healthy aquatic environments.
Recycling Program
Base Resource’s commitment to caring for the environment
by preventing pollution, maximising resource efficiency and
encouraging responsible behaviour in others, drives the
Kwale Operations Waste Recycling Program. Founded on the
principal of Reduce-Reuse-Recycle, waste material is used by
Base Resources recycling team to construct furniture, water
tanks, bee hives and children’s school knapsacks. These have
been donated to nearby schools, community organisations,
orphanages and institutions for the disabled.

16 / BASE RESOURCES / ANNUAL REPORT 2018
Business development
This was a pivotal year for business development with the acquisition of the
World-Class Toliara Project and mine life extension at Kwale Operations.
Toliara ProjectIn January 2018, the Company completed the
US$75.0 million acquisition of an initial 85% interest in
the Toliara Project in Madagascar. Base Resources will
acquire the remaining 15% interest, with a further
US$17.0 million payable on achievement of key milestones,
as the project advances towards mine development.
The Toliara Project is considered by Base Resources to
be one of the best mineral sands development projects in
the world. It is underpinned by the Ranobe deposit which
has Mineral Resources of 857Mt at 6.2% heavy mineral,
including 612Mt at 6.7% heavy mineral in the Measured
and Indicated categories.
During the reporting period, the Company appointed
Mineral Technologies and Lycopodium to deliver the Pre-
Feasibility Study for the Toliara Project. The Company
anticipates Pre-Feasibility Study completion in the March
quarter of 2019. The Pre-Feasibility Study will build on the
considerable body of work completed by previous owners of
the Toliara Project and together form the foundations of an
accelerated feasibility study program that aims to advance
the project toward a decision to proceed to construction in
late 2019.
Kwale Operations Extensional ExplorationDuring the reporting period, an updated Mineral Resource
estimate for the Kwale South Dune (the 2017 Kwale
South Dune Mineral Resource) was completed, resulting
in a 19% increase in contained heavy mineral tonnes in
the Measured and Indicated categories. Completion of an
updated Ore Reserve based on the 2017 Kwale South Dune
Mineral Resource is subject to finalisation of mining tenure
arrangements, which are currently being progressed with
the Kenyan Ministry of Petroleum and Mining.
The next phase of extensional exploration drilling at Kwale
Operations commenced in April in the north east of the
Company’s Kwale Special Prospecting License (SPL) 173 at
Kwale East, adjacent to the Kwale Operation’s Central Dune.
Completion of the remaining drilling program (4,200 metres)

BASE RESOURCES / OPERATING & FINANCIAL REVIEW / 17
in this area is currently suspended whilst community access
issues are being resolved. Drill assay results from work
completed to date are expected to be available later in 2018.
During the reporting period, the Company commenced
a re-evaluation, including infill drilling, of the higher-grade
areas of the North Dune, motivated by an improved economic
environment, refined resource definition methodology and
insights from five years of operations on the Central Dune.
At year end, 36 holes for 2,450 metres had been drilled
and a further 14,000 metres in progress. The North Dune
is currently not included in the Kwale Mineral Resources.
Tanzania explorationDuring the reporting period, the Company completed a
stratigraphic drilling program across five licences in Tanzania.
The results did not indicate an economically viable deposit
and therefore it is unlikely the Company will pursue further
exploration on these licences.

18 / BASE RESOURCES / ANNUAL REPORT 2018
Market, sales and outlook
Price improvement for all three products continued throughout the year,
supported by strong demand and limited supply.
Mineral sands end products are widely used in everyday
life and historical demand can be tightly tied to growth
in global GDP.
Ilmenite and rutileRutile and ilmenite are different grades of titanium dioxide
(Ti02) minerals and are used predominantly to produce
pigments for paint, paper, plastics, textiles and inks. Ti02
pigment is prized for its opacity, brightness and whiteness
and its ability to absorb and reflect ultraviolet radiation. It is
also non-toxic and inert to most chemical reagents.
High grade Ti02 minerals (which includes rutile) can also be
used to produce titanium metal, which is corrosion resistant
and has the highest strength to weight ratio of any metal.
Titanium metal is used across the aerospace and defence
industries as well as in medical devices, sporting equipment
and jewellery.
Overall, the global TiO2 pigment industry remained buoyant
throughout the reporting period. Ongoing robust pigment
demand combined with low inventory levels among the major
western pigment producers has continued to support a strong
pigment pricing environment in most regions. Pigment prices
in China have remained strong but, unlike other regions, have
been subject to some fluctuation on the back of volatility
in supply and demand. This volatility is mostly linked to the
impact of periodic environmental inspections on production
throughout the supply chain and, towards the end of the
reporting period, concerns over the potential impact of
US trade tariffs on the wider Chinese economy.
Chinese domestic ilmenite production increased through the
reporting period but has also been subject to the volatility
associated with environmental inspections. The increased
domestic output has been offset by a decrease in foreign
ilmenite supply into China from Vietnam, limited by high cost
of production, and ongoing production and export bans from
Tamil Nadu in India.
Following significant ilmenite price appreciation throughout
the comparative period, the realised price of Chinese
ilmenite sales has followed the volatility seen in Chinese
pigment prices through the reporting period. The price of
the Company’s ilmenite experienced swings throughout the
reporting period, but the average achieved was 28% higher
than the comparative period.
Ilmenite prices are expected to continue fluctuating around
the average levels experienced during the reporting period.
A supply deficit in the high-grade feedstock sector, in
particular rutile, driven mostly by demand strength from the
western chloride pigment sector, has seen market conditions
continue to tighten. Most recently, a major producer
announced that it has applied a 14% price increase for
contracted rutile sales in the first half of financial year 2019.
This has been exacerbated by supply interruptions resulting
from incidents at two major chloride slag facilities during the
second half of the reporting period. The Company’s average
achieved rutile price for the reporting period increased by
17% over the comparative period. Further price gains for
bulk rutile sales from major suppliers to large mainstream
customers are likely to be secured as and when pricing
periods in offtake arrangements come up for renewal.
In the absence of substantial new feedstock supply coming
online, the titanium dioxide feedstock market is expected to
remain in structural supply deficit, providing an opportunity
for continued price strength in both ilmenite and rutile over
the coming years.

BASE RESOURCES / OPERATING & FINANCIAL REVIEW / 19
ZirconZircon has a range of end-uses, including in the production
of ceramic tiles, which accounts for more than 50% of global
zircon consumption. Milled zircon enables ceramic tile
manufacturers to achieve brilliant opacity, whiteness and
brightness in their products. Zircon’s unique properties
include heat and wear resistance, stability, opacity, hardness
and strength, making it sought after for other applications
such as refractories, foundries and specialty chemicals.
Demand for zircon is closely linked to growth in global
construction and increasing urbanisation in the developing
world. These factors have improved in line with the
acceleration of global economic growth over the past
few years resulting in steady demand growth for zircon.
A significant draw down of inventories of zircon throughout
the supply chain, along with constraints on global production,
have resulted in a rapidly tightening market and sharp
increases in zircon prices since the end of calendar year
2016. Throughout the reporting period, demand from the
Company’s core group of long term zircon customers has
continued to exceed the Company’s ability to supply.
The average achieved price of the Company’s zircon products
for the reporting period increased by more than 46% over the
comparative period. A further increase of approximately 11%
has been secured for the first quarter of financial year 2019.
Ongoing firm demand and restricted supply may lead to
further price improvement in zircon through financial year
2019. However, concerns from zircon producers in relation
to the potential for substitution or thrifting of zircon by
customers may begin to restrain the extent and/or frequency
of price increases going forward.

20 / BASE RESOURCES / ANNUAL REPORT 2018
Corporate and Finance
Base Resources achieved a record profit after tax of US$34.0 million for the
reporting period, compared with US$15.8 million in the comparative period,
driven by higher sales revenues.
2018 2017
Kwale Operation
US$000s
Toliara Project
US$000sOther
US$000s
Total
US$000s
Kwale Operation
US$000s
Other
US$000s
Total
US$000s
Sales Revenue 198,810 - - 198,810 162,417 - 162,417
Cost of goods sold excluding depreciation and amortisation:
Operating costs (56,658) - - (56,658) (51,816) - (51,816)
Inventory movement (2,114) - - (2,114) (3,794) - (3,794)
Royalties expense (13,678) - - (13,678) (11,141) - (11,141)
Total cost of goods sold(i) (72,450) - - (72,450) (66,751) - (66,751)
Corporate & external affairs (4,312) (87) (4,855) (9,254) (3,983) (4,205) (8,188)
Community development (3,000) - - (3,000) (2,699) - (2,699)
Selling & distribution costs (4,056) - - (4,056) (2,030) - (2,030)
Other income / (expenses) 28 (704) (89) (765) 352 (444) (92)
EBITDA(i) 115,020 (791) (4,944) 109,285 87,306 (4,649) 82,657
Depreciation & amortisation (47,349) - (84) (47,433) (37,355) (48) (37,403)
EBIT(i) 67,671 (791) (5,028) 61,852 49,951 (4,697) 45,254
Net financing expenses (15,929) - (2,560) (18,489) (19,264) (4,247) (23,511)
Income tax expense (9,389) - - (9,389) (5,895) - (5,895)
NPAT(i) 42,353 (791) (7,588) 33,974 24,792 (8,944) 15,848
(i) �Base�Resources’�financial�results�are�reported�under�International�Financial�Reporting�Standards�(IFRS).�These�Financial�Statements�include�certain�non-IFRS�measures�including�EBITDA,�EBIT�and�NPAT.�These�measures�are�presented�to�enable�understanding�of�the�underlying�performance�of�the�Group�and�have�not�been�audited.
Sales revenue was US$198.8 million for the reporting
period (comparative period: US$162.4 million), achieving
an average price of product sold (rutile, ilmenite, zircon and
zircon low grade) of US$330 per tonne (comparative period:
US$255 per tonne), with averaged realised prices higher for
all products. Total cost of goods sold, excluding depreciation
and amortisation, was US$72.5 million for the reporting
period (comparative period: US$66.8 million) at an average
cost of US$120 per tonne of product sold (comparative
period: US$105 per tonne). Operating cost per tonne
produced was higher at US$94 per tonne for the reporting
period (comparative period: US$86 per tonne), due to higher
electricity usage following the Kwale Phase 2 upgrade,
which increased volumes mined by hydraulic mining unit
and installed pumping capacity in the wet concentrator plant.
In addition, higher fuel costs, electricity prices and mobile
equipment maintenance as the fleet ages contributed to the
increase in operating costs.
With an operating margin of US$210 per tonne produced for
the reporting period (comparative period: US$150 per tonne
produced) and an achieved revenue to cost of sales ratio of
2.8 (comparative period: 2.4), the Company remains well
positioned in the upper quartile of mineral sands producers.
Improved commodity prices and a continued focus on
cost management has delivered a Kwale Operations

BASE RESOURCES / OPERATING & FINANCIAL REVIEW / 21
EBITDA for the reporting period of US$115.0 million
(comparative period: US$87.3 million) and a Group EBITDA
of US$109.3 million (comparative period: US$82.7 million).
Depreciation and amortisation has increased for the
reporting period to US$47.3 million (comparative period:
US$37.4 million), due to the KP2 Project implementation,
which will significantly increase future mining rates and
thus reduce remaining mine life, on the basis of current
ore reserves. The majority of Kwale Operation assets are
depreciated on a straight-line basis over the remaining mine
life. Should the extensional exploration currently underway
at Kwale Operations be successful, there is the potential to
further increase ore reserves and extend mine life, thereby
reducing future annual depreciation and amortisation charges.
A net profit after tax of US$42.4 million was recorded by
Kwale Operations (comparative period: US$24.8 million)
and US$34.0 million for the Group (comparative period:
US$15.8 million). Basic earnings per share for the Group was
3.66 cents per share (comparative period: 2.14 cents).
Cash flow from operations was US$117.1 million for the
reporting period (US$76.6 million in the comparative
period), higher than Group EBITDA due to working capital
movements. The operating cashflows were used to fund
capital expenditure at Kwale Operations and on Toliara
Project progression, as well as debt servicing and repayment.
Total capital expenditure for the Group was US$32.9 million
in the reporting period (comparison period: US$6.5 million)
comprised of US$31.2 million at Kwale Operations, primarily
for the KP2 Project, and US$1.6 million on the progression
of the Toliara Project.
Net Debt Reduction
During the reporting period, the remaining US$11.8 million
of the Taurus Debt Facility was repaid in full and a further
US$61.2 million of the Kwale Operations Debt Facility repaid,
reducing its outstanding balance to US$80.0 million.
The Group established a US$30.0 million Revolving
Credit Facility to provide additional funding flexibility and
US$12.5 million was utilised during the reporting period for
corporate working capital and the progression of the Toliara
Project. Total debt outstanding at 30 June 2018 was
US$92.5 million, reduced from US$153.0 million at 30 June
2017. The Company’s net debt position at 30 June 2018
reduced to US$33.2 million, from US$98.5 million at
30 June 2017.
Subsequent to the end of the reporting period, the
US$80.0 million outstanding balance of the Kwale Project
Debt Facility was repaid from a combination of cash reserves
and utilisation of the Revolving Credit Facility following a
concurrent facility increase to US$75.0 million.
Early retirement of the Project Debt Facility demonstrates
the continued strong performance of Kwale Operations
and, together with the increased Revolving Credit Facility,
provides the group with additional funding flexibility and
reduced debt servicing costs.
Toliara Project AcquisitionIn January 2018, the Company completed the acquisition
the Toliara Project from World Titane Holdings Ltd,
whereby Base Resources acquired an initial 85% interest
in the wholly owned Mauritian subsidiaries of World Titane
Holdings Ltd, which between them hold a 100% interest
in the Toliara Project in Madagascar (held through wholly
owned subsidiaries in Madagascar) for US$75.0 million. Base
Resources will acquire the remaining 15% interest, with
a further US$17.0 million payable on achievement of key
milestones, as the project advances to mine development.
The project acquisition was funded by a share placement
to institutional investors and a 1 for 3 accelerated pro rata
renounceable entitlements offer (Offer). The institutional
placement and the institutional component of the Offer were
successfully completed on 5 January 2018, raising gross
proceeds of approximately US$67.8 million (A$89.3 million)
from the issue of 350,074,625 new fully paid new shares at
A$0.255 per share. The retail component of the Offer was
completed on 22 January 2018, raising gross proceeds of
approximately US$5.8 million (A$7.7 million) from the issue of
30,306,450 new fully paid new shares at A$0.255 per share.
Kenyan VAT ReceivableBase Resources has refund claims for VAT paid in Kenya,
relating to both the construction of the Kwale Project
and the period since operations commenced, totalling
approximately US$21.3 million at 30 June 2018. These
claims are proceeding through the Kenya Revenue Authority
process, with a number of operational period claims, totalling
approximately US$5.9 million, settled during the reporting
period. Base Resources is continuing to engage with the
Kenyan Treasury and the Kenya Revenue Authority, seeking
to expedite the remainder of the refunds.

22 / BASE RESOURCES / ANNUAL REPORT 2018
Resources and Reserves
The 2018 Mineral Resources and Ore Reserves for Base Resources are summarised in the table below together with the
2017 Ore Reserves and Mineral Resources for comparison.
2018 2017
as at 30 June 2018 as at 30 June 2017
Project Tonnes HM HM SL OS HM Assemblage Tonnes HM HM SL OS HM Assemblage
ILM RUT ZIR ILM RUT ZIR
(Mt) (Mt) (%) (%) (%) (%) (%) (%) (Mt) (Mt) (%) (%) (%) (%) (%) (%)
Mineral Resources (Measured + Indicated + Inferred, inclusive of Reserves)
Kwale 134 4.2 3.1 25 2 57 13 6 147 5.2 3.5 25 2 57 13 6
Ranobe 857 53.0 6.2 4 0 72 2 6 n/a n/a n/a n/a n/a n/a n/a n/a
Ore Reserves (Proven + Probable)
Kwale 80 3.1 3.9 26 2 56 13 6 91 3.9 4.3 26 2 57 13 6
Table�subject�to�rounding�differences
Mineral Resources and Ore Reserves estimates in this statement are reported in accordance with the JORC Code
(2012 edition). Accordingly, this statement should be read in conjunction with the respective explanatory Mineral Resources
and Ore Reserves information included in the following announcements1 for the relevant deposits:
Deposit Announcement Title Estimate date Release date
Ranobe Acquiring the Toliara Project – investor presentation 19 December 2017 19 December 2017
2017 Comparatives 2017 Kwale Mineral Resources and Ore Reserves Statement 30 June 2017 9 October 2017
Kwale South Dune Mineral Resources Increase for Kwale South Dune 30 June 2017 4 October 2017
Kwale Central Dune 2016 Kwale Mineral Resources and Ore Reserves Statement 30 June 2016 9 October 2017
Kwale DepositsThe Company’s Kwale Operation contains the Kwale Central Dune and South Dune deposits, located approximately
50 kilometres south of Mombasa and approximately 10 kilometres inland from the Kenyan coast.
Mineral Resources
The 2018 Kwale Mineral Resources, as at 30 June 2018, are estimated to be 134Mt at an average HM grade of 3.1% for 4.2Mt
of contained HM, at a 1% HM cut-off grade. The 2018 Kwale Mineral Resource estimate has decreased by 9% for material
tonnes and by 18% for contained HM tonnes when compared with the previous 2017 Kwale Mineral Resource estimate due
to mining depletion.
The Kwale Central Dune Mineral Resources at 30 June 2018 are estimated to be 20Mt at an average HM grade of 3.9% for 0.8Mt
of contained HM, decreased by 13Mt containing 0.9Mt of HM compared to the 2017 estimate due to mining depletion during the
year. The South Dune Mineral Resources at 30 June 2018 are unchanged from the 2017 estimate as the increase announced on
4 October 2017, was incorporated into the 2017 estimate and mining has not yet commenced on this deposit.
1. Refer to ASX announcements available at http://www.baseresources.com.au/investor-centre/asx-releases/.

BASE RESOURCES / OPERATING & FINANCIAL REVIEW / 23
Table 2: 2018 Kwale Mineral Resources estimate compared with the 2017 Kwale Mineral Resources estimate.
2018 2017
as at 30 June 2018 as at 30 June 2017
Project Tonnes HM HM SL OS HM Assemblage Tonnes HM HM SL OS HM Assemblage
ILM RUT ZIR ILM RUT ZIR
(Mt) (Mt) (%) (%) (%) (%) (%) (%) (Mt) (Mt) (%) (%) (%) (%) (%) (%)
Kwale Central Dune
Measured 13 0.6 4.1 24 1 57 14 6 25 1.4 5.5 24 0 58 13 6
Indicated 7 0.2 3.4 25 2 57 14 6 8 0.3 3.9 26 2 58 14 6
Total 20 0.8 3.9 24 1 57 14 6 33 1.7 5.1 25 1 58 14 6
Kwale South Dune
Measured 81 2.6 3.2 25 1 59 14 6 81 2.6 3.2 25 1 59 14 6
Indicated 33 0.8 2.5 26 7 52 12 6 33 0.8 2.5 26 7 52 12 6
Inferred 0.2 0.003 1.5 27 7 48 13 7 0.2 0.003 1.5 27 7 48 13 7
Total 114 3.5 3.0 25 3 56 13 6 114 3.5 3.0 25 3 56 13 6
Total Kwale Mineral Resources
Measured 94 3.2 3.4 25 1 59 14 6 106 4.0 3.8 25 1 59 13 6
Indicated 40 1.1 2.7 26 6 53 13 6 41 1.2 2.8 26 6 54 13 6
Inferred 0.2 0.003 1.3 27 7 54 15 7 0.2 0.003 1.3 27 7 54 15 7
Total 134 4.2 3.1 25 2 57 13 6 147 5.2 3.5 25 2 57 13 6
Table�subject�to�rounding�differences,�Mineral�Resources�estimated�at�a�1%�HM�cut-off�grade.
Ore Reserves
Contained within the Kwale Mineral Resources are the Kwale Ore Reserves, estimated as at 30 June 2018 to be 80Mt at an
average HM grade of 3.9% for 3.1Mt of contained HM. The 2018 Kwale Ore Reserves estimate represents a decrease of 13%
in total ore tonnes and 22% in contained HM tonnes over the previously reported 2017 Kwale Ore Reserves estimate.
The Kwale Central Dune Ore Reserves at 30 June 2018 are estimated to be 18Mt of ore at an average HM grade of 4.0% for
0.7Mt of contained HM, decreased by 11Mt containing 0.8Mt of HM compared to the 2017 estimate due to mining depletion
during the year.
Mining has not yet commenced on the South Dune and its Ore Reserves estimate is therefore unchanged from the 2017 estimate.
Table 3: The 2018 Kwale Ore Reserves estimate compared with the 2017 Kwale Ore Reserves estimate.
2018 2017
as at 30 June 2018 as at 30 June 2017
Project Tonnes HM HM SL OS HM Assemblage Tonnes HM HM SL OS HM Assemblage
ILM RUT ZIR ILM RUT ZIR
(Mt) (Mt) (%) (%) (%) (%) (%) (%) (Mt) (Mt) (%) (%) (%) (%) (%) (%)
Kwale Central Dune
Proved 13 0.6 4.3 23 0 57 14 6 23 1.3 5.7 24 0 59 13 6
Probable 5 0.2 3.5 25 1 57 14 6 7 0.3 3.4 26 1 49 11 5
Total 18 0.7 4.0 24 1 57 14 6 30 1.6 5.1 24 1 57 13 6
Kwale South Dune
Proved 39 1.6 4.0 27 1 59 14 6 39 1.6 4.0 27 1 59 14 6
Probable 23 0.8 3.3 26 5 53 13 6 23 0.8 3.3 26 5 53 13 6
Total 62 2.3 3.8 27 3 57 13 6 62 2.3 3.8 27 3 57 13 6
Total Kwale Ore Reserves
Proved 52 1.8 3.5 26 1 68 16 7 62 2.9 4.7 26 1 58 13 6
Probable 28 1.3 4.6 26 4 39 10 4 30 1.0 3.3 26 4 54 13 6
Total 80 3.1 3.9 26 2 56 13 6 91 3.9 4.3 26 2 57 13 6
Table�subject�to�rounding�differences.

24 / BASE RESOURCES / ANNUAL REPORT 2018
As announced on 4th October 20172, an updated Mineral Resources estimate for the Kwale South Dune (the 2017 Kwale
South Dune Mineral Resource) was completed, resulting in a 19% increase in contained HM tonnes in the Measured and
Indicated categories. Completion of an updated Kwale South Dune Ore Reserves estimate based on the 2017 Kwale South
Dune Mineral Resource is subject to finalisation of mining tenure arrangements, which are currently being progressed with
the Kenyan Ministry of Petroleum and Mining.
Ranobe Deposit The Company completed the acquisition of the Toliara Project on the 23rd January 2018 and is currently progressing the
project through a full study phase. The Toliara Project is founded on the Ranobe deposit, located approximately 40 kilometres
north of the town of Toliara in south west Madagascar and approximately 15 kilometres inland from the coast.
Mineral Resources
The 2018 Ranobe Mineral Resources as at 30 June 2018, are estimated to be 857Mt at an average HM grade of 6.2% and
4% slimes containing 53Mt HM, based on a 3% HM cut-off grade.
Table 3: The 2018 Kwale Ore Reserves estimate compared with the 2017 Kwale Ore Reserves estimate.
2018 2017
as at 30 June 2018 as at 30 June 2017
Project Tonnes HM HM SL OS HM Assemblage Tonnes HM HM SL OS HM Assemblage
ILM RUT ZIR ILM RUT ZIR
(Mt) (Mt) (%) (%) (%) (%) (%) (%) (Mt) (Mt) (%) (%) (%) (%) (%) (%)
Toliara Mineral Resources
Measured 282 20 7.2 4 0 72 2 6
not�applicable�–�prior�to�Base�Resources’�acquisitionIndicated 330 21 6.2 4 0 72 2 6
Inferred 245 12 5.0 5 1 71 1 5
Total 857 53 6.2 4 0 72 2 6
Table�subject�to�rounding�differences,�Mineral�Resources�estimated�at�a�3%�HM�cut-off�grade.
Ore Reserves
No Ore Reserves estimate has been completed for the Ranobe deposit. The drilling program currently underway on the
Ranobe deposit aims to define the boundaries of the Mineral Resources, upgrade the existing Inferred Resource to Indicated
status, and complete an Ore Reserves estimation for incorporation into the planned definitive feasibility study.
Mineral Resources & Ore Reserves GovernanceA summary of the governance and internal controls applicable to Base Resources’ Mineral Resources and Ore Reserves
estimates are as follows:
Mineral Resources
• Review and validation of drilling and sampling methodology and data spacing, geological logging, data collection and storage,
sampling and analytical quality control;
• Geological interpretation – review of known and interpreted structure, lithology and weathering controls;
• Estimation methodology – relevant to mineralisation style and proposed mining methodology;
• Comparison of estimation results with previous mineral resource models, and with results using alternate
modelling methodologies;
• Visual validation of block model against raw composite data; and
• Use of external Competent Persons to assist in the preparation of JORC Mineral Resources updates.
2. Refer to Base Resources market announcement “Mineral Resource Increase for Kwale South Dune” released on 4 October 2017, which is available at http://www.baseresources.com.au/investor-centre/asx-releases.

BASE RESOURCES / OPERATING & FINANCIAL REVIEW / 25
Ore Reserves
• Review of potential mining methodology to suit deposit and mineralisation characteristics;
• Review of potential Modifying Factors, including cost assumptions and commodity prices to be utilised in mining evaluation;
• Ore Reserve updates intimated with material changes in the above assumptions;
• Optimisation using appropriate software packages for open pit evaluation;
• Design based on optimisation results; and
• Use of external Competent Persons to assist in the preparation of JORC Ore Reserves updates.
Competent Persons StatementsThe 2018 Mineral Resources and Ore Reserves Statement has been approved by the following competent persons,
as detailed below.
Mineral Resources – Kwale Central and South Dune Deposits
The information in this report that relates to Kwale Central and South Dune Deposit Mineral Resources is based on, and
fairly represents, information and supporting documentation prepared by Mr. Richard Stockwell (for South Dune deposit)
and Mr. Scott Carruthers (for Central Dune deposit). Mr. Stockwell is a member of the Australian Institute of Geoscientists
and Mr. Carruthers is a Member of The Australasian Institute of Mining and Metallurgy. Mr. Stockwell acts as Consultant
Geologist for Base Resources. Mr. Carruthers is employed by Base Resources, he holds equity securities in Base Resources
and is entitled to participate in Base Resources’ equity long term incentive plan, details of which is included in the 2018
Remuneration Report. Both Mr. Stockwell and Mr. Carruthers have sufficient experience that is relevant to the style of
mineralisation and type of deposits under consideration and to the activity which he is undertaking to qualify as a Competent
Person as defined in the 2012 Edition of the Australasian Code for Reporting of Exploration Results, Mineral Resources and
Ore Reserves (JORC Code) and both are considered Qualified Persons for the purposes of the AIM Rules for Companies.
Mr. Stockwell consents to the inclusion in this report of Kwale South Dune Deposit Mineral Resource estimates and supporting
information in the form and context in which it appears. Mr. Carruthers consents to the inclusion in this report of Kwale
Central Dune Deposit Mineral Resource estimates and supporting information in the form and context in which it appears.
Ore Reserves – Kwale Central and South Dune Deposits
The information in this report that relates to Kwale Central and South Dune Deposit Ore Reserves is based on, and fairly
represents, information and supporting documentation prepared by Mr. Per Scrimshaw (for South Dune deposit) and Mr. Scott
Carruthers (for Central and South Dune deposits). Mr. Scrimshaw and Mr. Carruthers are both Members of The Australasian
Institute of Mining and Metallurgy. Mr. Scrimshaw is employed by Entech, a mining consultancy engaged by Base Resources
to prepare Ore Reserves estimation for the Kwale Operations. Mr. Carruthers is employed by Base Resources, he holds equity
securities in Base Resources and is entitled to participate in Base Resources’ equity long term incentive plan, details of which
is included in the 2018 Remuneration Report. Mr. Scrimshaw and Mr. Carruthers have sufficient experience that is relevant
to the style of mineralisation and type of deposits under consideration and to the activity which they are undertaking to qualify
as Competent Persons as defined in the 2012 Edition of the Australasian Code for Reporting of Exploration Results, Mineral
Resources and Ore Reserves (JORC Code) and both are considered Qualified Persons for the purposes of the AIM Rules for
Companies. Mr. Scrimshaw and Mr. Carruthers each consent to the inclusion in this report of Kwale Central and South Dune
Deposit Ore Reserve estimates in the form and context in which it appears.
Mineral Resources – Ranobe Deposit
The information in this report that relates to the Ranobe Deposit Mineral Resources is based on, and fairly represents,
information and supporting documentation prepared by Mr. Scott Carruthers. Mr. Carruthers is a Member of The Australasian
Institute of Mining and Metallurgy. Mr. Carruthers is employed by Base Resources, he holds equity securities in Base Resources
and is entitled to participate in Base Resources’ equity long term incentive plan, details of which is included in the 2018
Remuneration Report. Mr. Carruthers has sufficient experience that is relevant to the style of mineralisation and type of deposits
under consideration and to the activity which he is undertaking to qualify as a Competent Person as defined in the 2012 Edition
of the Australasian Code for Reporting of Exploration Results, Mineral Resources and Ore Reserves (JORC Code) and both are
considered Qualified Persons for the purposes of the AIM Rules for Companies. Mr. Carruthers consents to the inclusion in this
report of the Ranobe Deposit Mineral Resource estimates in the form and context in which it appears.

26 / BASE RESOURCES / ANNUAL REPORT 2018
DIRECTORS’ REPORT

BASE RESOURCES / OPERATING & FINANCIAL REVIEW / 27

28 / BASE RESOURCES / ANNUAL REPORT 2018
Directors’ Report
Your directors present their report, together with the financial statements of the Group, being the Company, Base Resources
Limited, and its controlled entities for the financial year ended 30 June 2018 (the reporting period) compared with the year
ended 30 June 2017 (the comparative period).
Directors
The names of the directors in office at any time during or since the end of the year are:
Mr Keith Spence Mr Malcolm Macpherson
Mr Tim Carstens Mr Mike Stirzaker
Mr Colin Bwye Mr Michael Anderson – retired 31 August 2017
Mr Samuel Willis Ms Diane Radley – appointed 1 February 2018
Directors have been in office since the start of the financial year to the date of this report, with the exception of
Mr Michael Anderson who retired on 31 August 2017, and Ms Diane Radley who was appointed 1 February 2018.
Company Secretary
The following person held the position of company secretary at the end of the financial year: Mr Chadwick Poletti
Principal activities and significant changes in nature of activities
The principal activity of the Group is the operation of the 100% owned Kwale Mineral Sands Operation (Kwale Operation) in
Kenya. Further, in January 2018, the Group completed the acquisition of the Toliara Mineral Sands Project (Toliara Project) in
Madagascar and is progressing the project through an accelerated feasibility study program, that aims to advance toward a
decision to proceed to construction in the second half of 2019.
Change in Presentation Currency
The Directors have elected to change the Group’s presentation currency from Australian dollars (AUD) to United States
dollars (USD) effective from 1 July 2017. The change in presentation currency is accounted for retrospectively and will
present more relevant information on the Group. All figures included in this report are in USD, unless otherwise stated.
Operating results
The Group recorded a profit after tax of US$33,974,000 for the reporting period (2017: US$15,848,000).
Dividends paid or recommended
There were no dividends paid or declared for payment during the reporting period.
Significant changes in state of affairs
Other than the acquisition of the Toliara Project, there were no other significant changes in the state of affairs of the Group
during the reporting period.
After balance date events
Subsequent to year end, in July 2018, in accordance with the terms of the Kwale Facility, a cash sweep of US$14.9 million
was distributed from Kwale Operations. Half of the cash sweep (US$7.45 million) went towards mandatory repayment of the
Kwale Facility, with the other half distributed to the parent entity, Base Resources. The outstanding Kwale Facility debt after
this repayment was US$72.6 million. The repayment of debt from the cash sweep has no impact on net debt.
There have been no other significant after balance date events at the date of this report.
Future developments, prospects and business strategies
Base Resources strategy is to continue to pursue mine life extension at the Kwale Operation through exploration
and develop the Toliara Project ahead of a decision to proceed with construction in the second half of 2019.

BASE RESOURCES / DIRECTORS' REPORT / 29
Information on Directors
Mr Keith Spence Non-Executive Chairman
Qualifications: BSc (Geophysics) (Hons), FAIM
Appointed: 20 February 2015 (Appointed as Non-Executive Chairman on 19 May 2015)
Experience: Mr Spence has over 40 years’ experience in managing and governing oil and gas operations in
Australia, Papua New Guinea, the Netherlands and Africa.
A geologist and geophysicist by training, Mr Spence commenced his career as an exploration
geologist with Woodside in 1977. He subsequently joined Shell (Development) Australia,
where he worked for 18 years. In 1994 he was seconded to Woodside to lead the North
West Shelf Exploration team. In 1998, he left Shell to join Woodside. He retired from
Woodside in 2008 after a 14-year tenure in top executive positions in the company, including
Chief Operating Officer and Acting Chief Executive Officer. Upon his retirement he took up
several board positions, including Clough Limited, where he served as Chairman from 2010 to
2013, Geodynamics Limited where he served as a non-executive Director from 2008 to 2016
(including as Chairman from 2010 to 2016) and Oil Search Limited, where he served as
a non-executive Director from 2012 to 2017.
Special Responsibilities: Chairman of the Board; Chairman of the Remuneration & Nomination Committee;
member of the Risk Committee; member of the Audit Committee.
Other current public
company directorships:
Independence Group NL (since 2014); Murray and Roberts Holdings Ltd (since 2015);
Santos Limited (Chair, since 2018).
Past public company
directorships held over
the last three years:
Geodynamics Limited (now ReNu Energy Limited) (resigned 2016);
Oil Search Limited (resigned 2017).
Mr Tim Carstens Managing Director
Qualifications: BCom, ACA
Appointed: 5 May 2008
Experience: Mr Carstens is an experienced mining executive, with a career spanning more than 20 years
in senior resources-sector roles, both in Australia and overseas, with Perilya Limited,
North Limited, Robe River Iron Associates, Iron Ore Company of Canada and St Barbara
Mines Limited. A chartered accountant by profession, he has strong experience in all aspects
of business strategy development and implementation, acquisitions and divestments, debt
and equity financing, organisational development and operational performance. He has been
Managing Director of Base Resources Limited since the Company’s inception in May 2008.
Mr Carstens is also the Chairman of the Australia-Africa Minerals and Energy Group (AAMEG),
the peak body representing Australian companies engaged in the development of Africa’s
resource industry.
Special Responsibilities: Managing Director.
Past public company
directorships held over
the last three years:
None.

30 / BASE RESOURCES / ANNUAL REPORT 2018
Directors’ Report (cont.)
Mr Colin Bwye Executive Director – Operations & Development
Qualifications: BEng (Hons)
Appointed: 12 July 2010
Experience: Mr Bwye has over 25 years’ experience in the mineral sands sector, having commenced his
professional career with RGC Mineral Sands (since consolidated into Iluka Resources) as
a plant metallurgist in 1988. He undertook a number of technical, production and mining
roles within RGC and then, after a period of time consulting to the industry, joined Doral
Mineral Industries, a subsidiary of Iwatani Corporation of Japan. Here he was a leader in the
development and operation of the Dardanup mineral sands mine in Western Australia before
taking on the role of Managing Director and becoming accountable for the fused materials
(zirconia and alumina) processing facilities as well as the mineral sands operation. In 2010
Mr Bwye joined Base Resources as Executive Director – Operations and Development. Mr
Bwye has an extensive knowledge of all aspects of the mineral sands industry, including
downstream processing and marketing of mineral sands products. He was born in Kenya and
lived there prior to migrating to Australia in 1987 and so brings a deep understanding of the
country and its culture.
Special Responsibilities: Executive Director.
Past public company
directorships held over
the last three years:
None.
Mr Samuel Willis Non-Executive Director
Qualifications: BCom
Appointed: 23 May 2007
Experience: Mr Willis is an experienced company director in the resources and energy sectors and
is currently a director of Checkside (a consulting firm that specialises in Strategic HR,
Recruitment and Leadership). Mr Willis provides Base Resources with in excess of 15
years’ experience and expertise in capital markets, corporate finance and executive board
involvement with emerging small and mid-cap companies. Mr Willis was previously a non-
executive director of oil and gas explorer Elixir Petroleum Limited.
Special Responsibilities: Chairman of the Audit Committee; member of the Remuneration & Nomination Committee;
member of the Risk Committee.
Other current public
company directorships:
None.
Past public company
directorships held over
the last three years:
New Standard Energy Limited (retired 2016);
Elixir Petroleum Limited (resigned 2017).

BASE RESOURCES / DIRECTORS' REPORT / 31
Mr Michael Anderson Non-Executive Director
Qualifications: BSc (Hons), PhD
Appointed: 28 November 2011 (retired 31 August 2017)
Experience: Mr Anderson has over 20 years’ industry experience, largely in southern Africa and Australia.
His career commenced as a geologist with Anglo American, followed by roles in the
metallurgical and engineering industries with Mintek, Bateman and Kellogg Brown & Root. He
subsequently held senior management positions including Corporate Development Manager
at Gallery Gold Limited, and Managing Director at Exco Resources Limited, where he oversaw
the successful development of the White Dam Gold Project, and the sale of the company’s
Cloncurry Copper Project to Xstrata. He joined Taurus Funds Management as a Director in
August 2011.
Mr Anderson resigned as non-executive director of Base Resources on 31 August 2017.
Special Responsibilities: Member of the Audit Committee.
Other current public
company directorships:
Hot Chili Limited (since 2011);
Finders Resources Limited (alternate, since 2016).
Mr Michael Stirzaker Non-Executive Director
Qualifications: BCom, ACA
Appointed: 19 November 2014 (previously acting as an alternate since November 2011)
Experience: Mr Stirzaker has over 30 years’ commercial experience, mainly in mining finance and mining
investment. He began his career in Sydney as a Chartered Accountant with KPMG, having
obtained a Bachelor of Commerce from the University of Cape Town. He moved into
investment banking with Wardley James Capel (part of the HSBC Group) and then Kleinwort
Benson Limited in London. From 1993 to 2007 he was part of the natural resource advisory
and investment firm, RFC Group Limited, where he became Joint Managing Director. He
has also been a shareholder and Director of Tennant Metals Pty. Limited, a privately owned
physical metal trader and investor, and was the Finance Director of Finders Resources Limited,
an ASX listed company producing copper in Indonesia. In 2010, Mr Stirzaker joined the private
equity mining fund manager, Pacific Road Capital Management as a partner. The Pacific Road
Resources Fund II is a major shareholder of Base Resources, with Mr Stirzaker appointed as
its nominee on the Base Resources Board.
Special Responsibilities: Member of the Remuneration & Nomination Committee; member of the Risk Committee.
Other current public
company directorships:
None.
Past public company
directorships held over
the last three years:
None.

32 / BASE RESOURCES / ANNUAL REPORT 2018
Directors’ Report (cont.)
Mr Malcolm Macpherson Non-Executive Director
Qualifications: B.Sc. FAusIMM, FTSE
Appointed: 25 July 2013
Experience: Mr Macpherson is an accomplished business leader, with decades of experience in the global
mining industry at executive management and board level. Mr Macpherson spent 25 years from
1974 at Iluka Resources Limited, the world’s largest mineral sands company, rising from mine
manager to Managing Director and Chief Executive Officer. He has previously held the position of
Chairman with Azumah Resources Limited and Western Power Corporation and been a director
of Portman Mining Limited and Minara Resources Limited. Mr Macpherson has also been the
Senior Vice President of the Minerals Council of Australia, President of the Western Australian
Chamber of Minerals & Energy, and a member of the Senate at Murdoch University.
Special Responsibilities: Chairman of the Risk Committee; member of the Remuneration & Nomination Committee;
member of the Audit Committee.
Other current public
company directorships:
None.
Past public company
directorships held over the
last three years:
Bathurst Resources (New Zealand) Limited (resigned 2015).
Ms Diane Radley Non-Executive Director
Qualifications: BComm BCompt (Hons), CA(SA), MBA, AMP (Harvard)
Appointed: 1 February 2018
Experience: Ms Radley has over 25 years’ experience in senior leadership roles across multiple industries,
most recently in financial services and investments. She served as CFO at Allied Electronics
Corporation (JSE), Group Finance Director at Old Mutual South Africa, and CEO of Old
Mutual Investment Group. Prior to this, she advised on a variety of transactions, listings and
due diligences for large corporate acquirers and private equity funds in her role as Partner-
in-charge of Transaction Services at PricewaterhouseCoopers in South Africa. Ms Radley
is currently a non-executive director of Murray & Roberts Holdings Ltd (JSE), Transaction
Capital Ltd (JSE) and a trustee of the DG Murray Trust.
Special Responsibilities: Member of the Risk Committee; member of the Audit Committee.
Other current public
company directorships:
Murray & Roberts Holdings Ltd (since 2017); Transaction Capital Ltd (since 2018)
Past public company
directorships held over the
last three years:
None.

BASE RESOURCES / DIRECTORS' REPORT / 33
Mr Chadwick Poletti Company Secretary
Qualifications: LLB (Hons), BCom
Appointed: 19 May 2015
Experience: Mr Poletti is a practising lawyer and holds a Bachelor of Commerce majoring in Finance and
Accounting. Mr Poletti has broad experience in advising directors of listed and unlisted public
companies in relation to directors’ duties, the Corporations Act, the ASX Listing Rules,
the AIM Rules for Companies and corporate governance.
Prior to joining Base Resources, Mr Poletti was a senior associate at international law firm,
Ashurst, where he specialised in both domestic and cross-border regulated and unregulated
mergers and acquisitions, including takeovers and schemes of arrangement, capital raisings
and corporate advisory and governance
Meetings of Directors
The number of meetings of Directors (including meetings of committees of Directors) held during the year and the number
of meetings attended by each Director was as shown in the table below:
Directors’ Meetings
Audit committee
Remuneration & Nominations Committee
Risk Committee
Meetings held while a
directorMeetings attended
Meetings held while a committee
memberMeetings attended
Meetings held while a committee
memberMeetings attended
Meetings held while a committee
memberMeetings attended
Keith Spence 15 15 4 4 4 4 3 3
Tim Carstens 15 15 - - - - - -
Colin Bwye 15 14 - - - - - -
Samuel Willis 15 15 4 4 4 4 3 3
Michael Anderson(i) 3 3 1 1 - - - -
Malcolm Macpherson 15 15 4 4 4 4 3 3
Michael Stirzaker 15 15 - - 4 4 2 2
Diane Radley(ii) 5 5 1 1 - - 1 1
(i) Retired�31�August�2017(ii) Appointed�1�February�2018
Indemnifying officers
During or since the end of the financial year, Base Resources has given an indemnity or entered into an agreement to
indemnify, or paid or agreed to pay insurance premiums to insure its directors and officers against certain liabilities incurred
while acting in that capacity. The contracts of insurance prohibit disclosure of details of the policies or the premiums paid.
The Company’s Constitution provides that, subject to and so far as permitted by applicable law, the Company must
indemnify every officer of the Company and its wholly owned subsidiaries against a liability incurred as such an officer to
a person (other than the Company or a related body corporate) including a liability incurred as a result of appointment or
nomination by the Company or subsidiary as a trustee or as an officer of another corporation, unless the liability arises out
of conduct involving a lack of good faith.
Consistent with the rules of the Company’s Constitution, the Company or its subsidiary companies (as applicable) has also
granted indemnities under the terms of deeds of indemnity with current and former Directors and current officers of the
Company and its subsidiaries. Each deed provides that the relevant Director or officer is to the maximum extent permitted
by law, indemnified out of the property of the Company or the subsidiary, as applicable, against any liability (other than a

34 / BASE RESOURCES / ANNUAL REPORT 2018
liability for costs and expenses) the Director or officer incurs to another person (other than the Company or a related body
corporate of the Company) as a Director or officer of Company or a related body corporate, unless the liability arises out of
conduct involving a lack of good faith by the Director or officer.
No indemnity has been granted to an auditor of the Group in their capacity as auditors of the Group.
Options
At the date of this report, the unissued ordinary shares of Base Resources Limited under option are as follows:
Grant date Date of expiry Exercise price A$ Number under option
23 December 2014 31 December 2018 0.40 30,712,531
19 June 2015 31 December 2018 0.40 30,712,530
61,425,061
In accordance with the terms of the Taurus Facility, 61,425,061 options were issued to Taurus Funds Management,
with half issued on execution and half on facility drawdown in June 2015. Refer to “Note 17: Share-based payments” for
further details. Option holders do not have any rights to participate in any issues of shares or other interests in the Group
or any other entity.
Shares issued since the end of the financial year
No shares in Base Resources Limited have been issued since year end and no amounts are unpaid on any of the issued shares.
Proceedings on behalf of Group
No person has applied for leave of a Court to bring proceedings on behalf of the Group or intervene in any proceedings
to which the Group is a party for the purpose of taking responsibility on behalf of the Group for all or any part of those
proceedings. The Group was not a party to any such proceedings during the year.
Non-audit services
The Board of Directors is satisfied that the provision of non-audit services during the year is compatible with the general
standard of independence for auditors imposed by the Corporations�Act�2001. The Directors are satisfied that the services
disclosed below did not compromise the external auditor’s independence for the following reasons:
• The nature of the services provided do not compromise the general principles relating to auditor independence in
accordance with APES 110: Code of Ethics for Professional Accountants set by the Accounting Professional and
Ethical Standards Board.
The following fees were paid or payable to external auditors for non-audit services provided during the year ended 30 June 2018:
2018 US$
2017 US$
KPMG�Australia
Taxation services 59,491 74,401
Other services 8,727 8,296
Overseas�KPMG�firms
Taxation services 68,728 82,122
Auditor’s independence declaration
The lead auditor’s independence declaration for the year ended 30 June 2018 has been received and can be found on
page 63 of the Annual Report.
Rounding
The Group is of a kind referred to in ASIC Class Instrument 2016/191 and in accordance with that Class Order, amounts
in the financial report and directors’ report have been rounded to the nearest thousand dollars, unless otherwise stated.
Directors’ Report (cont.)

BASE RESOURCES / REMUNERATION REPORT / 35
This remuneration report sets out the remuneration arrangements for Base Resources Limited for year ended
30 June 2018. This Remuneration Report forms part of the Directors’ Report and has been audited in accordance
with the Corporations�Act�2001.
Details of key management personnel
The remuneration report details the remuneration arrangements for key management personnel (KMP) who are defined
as those persons having authority and responsibility for planning, directing and controlling the major activities of the Group,
and comprise the Directors (whether executive or otherwise) of the Group and other executive management, as detailed in
the table below. Following the acquisition of the Toliara Project and the resultant diversification of Group activities,
the Senior Executives included as KMP’s have been redefined as those who are members of the Group’s strategic planning
team. The Executive Directors and executive management listed in the table below are collectively defined as the Senior
Executives for the purposes of this report.
Name Position
Senior�Executives
T Carstens Managing Director
C Bwye Executive Director - Operations & Development
K Balloch Chief Financial Officer
A Greyling General Manager – Project Development
S Hay General Manager - Marketing
C Poletti General Counsel and Company Secretary Appointed KMP 1 July 2017 following promotion and subsequent appointment to the Group’s strategic planning team
Non-Executive�Directors
K Spence Chairman
S Willis Director
M Anderson Director Retired 31 August 2017
M Macpherson Director
M Stirzaker Director
D Radley Director Appointed 1 February 2018
Role of the Remuneration & Nomination Committee
The Remuneration & Nomination Committee is responsible for oversight of the remuneration system and policies.
It is also responsible for evaluating the performance of the Executive Directors and monitoring performance of the
executive management team. The Board, upon recommendation of the Remuneration & Nomination Committee, determines
the remuneration of the Executive Directors and approves the remuneration of the executive management team.
The objective of the Remuneration & Nomination Committee is to ensure that remuneration system and policies attract
and retain executives and directors who will create sustained value for shareholders.
Services from remuneration consultants
The Remuneration & Nomination Committee engaged BDO to (i) review the Group’s current incentive arrangements and to
make broad recommendations for the Committee’s consideration; and (ii) provide market data relating to the remuneration
packages of the Group’s Senior Executives to assist the Committee in assessing the competitiveness of current
remuneration packages.
BDO were engaged by the Remuneration & Nomination Committee Chairman, and reported directly to the Committee and
the Board. Further, BDO has processes and procedures in place to minimise potential opportunities for undue influence of
Senior Executives. The Board is satisfied that the interaction between BDO and Senior Executives is minimal, principally
Remuneration Report - audited

36 / BASE RESOURCES / ANNUAL REPORT 2018
Remuneration Report - audited (cont.)
relating to provision of relevant Group information for consideration by the respective consultants. The Board is therefore
satisfied that the advice received from BDO is free from undue influence from the Senior Executives to whom the
remuneration recommendations apply.
The information provided by BDO was provided to the Remuneration & Nomination Committee as inputs into decision
making only. The Committee and the Board considered the information, along with other factors, in making its ultimate
remuneration decisions.
Total fees paid to BDO for services during the year ended 30 June 2018 were A$21,010.
Remuneration policy
Base Resources is committed to the close alignment of remuneration to shareholder return, particularly that of the Senior
Executives. To this end, the Group’s remuneration system is designed to attract, motivate and retain people by identifying
and rewarding high performers and recognising their contribution to the continued growth and success of the Group.
Key objectives of the Group’s remuneration policy are to ensure that remuneration practices:
• Facilitate the achievement of the Group’s objectives;
• Provide strong linkage between executive incentive rewards and creation of value for shareholders;
• Are simple to understand and implement, openly communicated and are equitable across the Group;
• Attract, retain and motivate employees of the required capabilities; and
• Comply with applicable legal requirements and appropriate standards of governance.
Key principles of Senior Executive remuneration
Remuneration comprises fixed remuneration, and variable (or at-risk) remuneration, which is determined by individual
and Group performance. The Group targets total fixed remuneration (TFR) at the 50th market percentile and total
remuneration package (TRP), including at-target variable remuneration, at the 75th market percentile, for Senior Executives.
As a consequence, the Group’s Senior Executives have a higher proportion of remuneration at-risk than industry averages.
Questions and answers about Senior Executive remuneration:
Remuneration mix
What is the balance between fixed and at-risk remuneration?
The mix of fixed and at-risk remuneration varies depending on the organisational level of executives, and also depends
on the performance of the Group and individual executives. More senior positions have a greater proportion of their
remuneration at-risk.
If overall Group performance fails to meet a minimum standard, no executives will be entitled to receive any at-risk
remuneration. For all executives, it is therefore possible that no at-risk remuneration will be earned and that fixed
remuneration will represent 100 per cent of total remuneration.
If target at-risk remuneration is earned, the proportion of total remuneration represented by fixed and at-risk remuneration
would be:
• Executive Directors (includes Managing Director): 36% fixed and 64% at-risk.
• Other Senior Executives: 53% fixed and 47% at-risk.
Fixed remuneration
What is included in fixed remuneration?
TFR includes a base salary, inclusive of superannuation. Allowances and other benefits may be provided and are as agreed,
including leased motor vehicles and additional superannuation, provided that no extra cost is incurred by the Group.

BASE RESOURCES / REMUNERATION REPORT / 37
When and how is fixed remuneration reviewed?
TFR is reviewed annually. Any adjustments to the TFR for the Executive Directors must be approved by the Board after
recommendation by the Remuneration & Nomination Committee. The Executive Directors determine the TFR of other
Senior Executives within specified guidelines approved by the Board, subject to final approval by the Remuneration
Committee. The Group seeks to position fixed remuneration at the 50th market percentile of salaries for comparable
companies within the mining industry with which the Group competes for talent and equity investment, utilising datasets
and specific advice provided by independent remuneration consultants.
Short Term Incentive Plan (STIP)
What is the STIP?
The STIP is the cash component of at-risk remuneration, payable based on a mix of Group and individual annual
performance standards.
Why does the Board consider the STIP is appropriate?
At-risk remuneration strengthens the link between pay and performance. The purpose of these programs is to reward
executives for annual performance relative to expectations of their role accountabilities, required behaviours and KPI’s
as well as delivery of annual business plans and priorities. A reward structure that provides at-risk remuneration is also
necessary as a competitive remuneration package in the Australian and global marketplace for executives.
Does the STIP take into account different levels of performance compared to objectives?
The size of any STIP payment is linked to the extent of achievement. Levels of performance required for target levels of
STIP are set such that they are challenging but achievable.
Required performance levels for each performance criteria are set at three levels being:
• Threshold - A performance level that is below optimal but nevertheless acceptable. It is the minimum for which a small
STIP award would be payable. The STIP is designed such that there is an 80% probability the executive will achieve or
exceed this level of achievement.
• Target - A performance level that represents a challenging but achievable level of performance. The STIP is designed such
that there is a 50% to 60% probability the executive will achieve or exceed this level of achievement.
• Stretch - A performance level that is clearly at the upper limit of what may be achievable. The STIP is designed such that
there is a 10% to 20% probability the executive will achieve or exceed this level of achievement.
The probabilities of achievement are set at these levels such that, over time, awards approximately equal to the target level
would become payable, assuming performance to role. The achievement of this target level of award would support the
75th market percentile TRP policy objective for executives.
What are the performance criteria?
Performance criteria are assigned for both individual and Group performance. Performance criteria may change from
year to year.
For Executive Directors, 75% of the STIP is attached to individual performance criteria and 25% to corporate performance
criteria. For other Senior Executives, 50% of the STIP is attached to individual performance criteria and 50% to corporate
performance criteria.
Reflecting the importance attached to role clarity within Base Resources, individual performance criteria are drawn directly
from the role accountabilities in the participant’s role description. Each performance criteria is allocated a weighting that
reflects the relative importance of that performance criteria for the year.

38 / BASE RESOURCES / ANNUAL REPORT 2018
Remuneration Report - audited (cont.)
Corporate performance criteria are set at the commencement of each financial year and are usually derived from the
annual operating plan and may vary from time to time to include other aspects of performance for which there is shared
accountability and which the Group wishes to emphasise.
The target corporate performance criteria for the 2018 financial year were:
• Budgeted group EBITDA, assuming fixed AUD:USD exchange rate and the inclusion of only 25% of variances in actual
sales prices against budgeted prices, reflecting a limited measure of management control over product pricing outcomes;
• Budgeted Kwale Phase 2 capital expenditure, assuming a fixed exchange rate as defined in the Definitive Feasibility Study;
• Delivery of Kwale Phase 2 on time in accordance with the approved schedule.
Where budgeted group EBITDA is used as the basis for the target corporate performance, the Remuneration & Nomination
Committee will set the performance criteria for the year (i.e. the “Threshold”, “Target” and “Stretch” performance ranges)
on the basis of an assessment of the degree of challenge represented by the particular year’s budget. Consequently, these
ranges may change from year to year. This approach is designed to ensure the appropriate degree of challenge in both
budgets committed to and STIP.
Is there an overriding financial performance or other conditions?
For each year, a gate or gates may be determined by the Board. The gate may be a minimum level of earnings for the Group
or a safety performance threshold that must be achieved for any awards to become payable under the STIP.
Irrespective of whether a gate is achieved, the Board retains discretion to increase or decrease awards in its absolute
discretion. It is intended that the exercise of this discretion is used sparingly to take account of significant events and/or
factors that were not anticipated when the year commenced and the performance criteria were set.
The following gates were in place for the 2018 financial year:
• No workplace fatalities.
• No major reputational or environmental events.
What is the value of the STIP award opportunity?
Executive Directors have a target STIP opportunity of 60% of TFR, with a minimum opportunity (if only threshold level is met)
of 20% and a maximum opportunity (if the stretch targets are achieved) of 100% of TFR.
Other Senior Executives have a target STIP opportunity of 30% of TFR, with a minimum opportunity (if only threshold level is met)
of 15% and a maximum opportunity (if the stretch targets are achieved) of 60% of TFR. These percentages are set based
on external advice to achieve the remuneration policy intent of 75th market percentile TRP market positioning.
How is the STIP assessed?
Individual performance criteria - are assessed using a performance rating scale. In making the assessment in respect of a
particular area of accountability, consideration is given to the extent to which the behaviours and performance indicators
identified in the role description have been modelled and observed. This assessment is undertaken by the participant’s
manager and then signed-off by the manager-once-removed. In the case of the Executive Directors, the assessment is
undertaken by the Remuneration & Nomination Committee and approved by the Board. Specific outcomes during the
2018 financial year relevant to STIP awards have included:
• The continued consistent performance of operations which has seen design (and beyond) throughputs, availabilities
and recoveries consistently achieved;
• Tight control of operating costs, achieving a challenging budget;
• Another year without a Lost Time Injury (the last was in February 2014) and no medical treatment injuries;

BASE RESOURCES / REMUNERATION REPORT / 39
• Successful completion of the KP2 project ahead of target schedule, within 3% of budget and with no impact
on production performance;
• Securing of market share and sales for all production, with only working inventory held throughout the year;
• Progression of Kwale Operations mine life extension opportunities;
• The smooth establishment of strong working relationships with a new mining administration following a fractious
and extended election season in Kenya;
• Completion of the transformational acquisition of the Toliara Project, a central step in the execution of the
Company’s strategic plan; and
• The smooth integration and initiation of the Toliara Project PFS.
Corporate performance criteria – the Board determines the extent to which each corporate performance criteria
has been achieved.
Long Term Incentive Plan (LTIP)
What is the LTIP?
The LTIP is the equity component of at-risk remuneration and is linked to the Group’s Total Shareholder Return (TSR)
performance over a 3 year period. The LTIP aims to reward participants for Base Resources’ TSR performance, both relative
to its peer group and in absolute terms.
How often are LTIP awards made?
The LTIP operates on the basis of a series of cycles. Each cycle commences on 1 October and is followed by a 3 year
performance period, with a test date on the 3rd anniversary of commencement of the cycle. The first cycle of the LTIP
began on 1 October 2011.
Why does the Board consider a LTIP is appropriate?
The Group believes that a well designed LTIP can:
• Attract executives with the required capability;
• Retain key talent;
• Maintain a stable leadership team; and
• Explicitly align and link the interests of the Base Resources leadership team and shareholders.
What types of equity may be granted under the LTIP?
Performance rights are granted under the Base Resources LTIP. Performance rights are a right granted to acquire one share
in Base Resources, subject to satisfying the specified performance criteria (outlined below).
A participant is not entitled to participate in or receive any dividends or other shareholder benefits until the performance
right has vested and a share has been allocated and transferred to the participant.
What is the value of the LTIP award opportunity?
Executive Directors are awarded performance rights worth 120% of TFR. Other Senior Executives are awarded
performance rights worth 60% of TFR. The LTIP performance criteria are designed to target 50% vesting of awarded
performance rights over time.
These award opportunities and target vesting outcome are set based on external advice to achieve the remuneration policy
intent of 75% market percentile TRP market positioning.

40 / BASE RESOURCES / ANNUAL REPORT 2018
Remuneration Report - audited (cont.)
What are the LTIP performance criteria?
The Group uses two LTIP performance criteria to determine the proportion of performance rights which vest, as follows:
• Half of the performance rights are subject to a relative TSR criteria (the relative TSR performance rights); and
• Half of the performance rights are subject to an absolute TSR criteria (the absolute TSR performance rights).
The Board considers that TSR is an appropriate performance hurdle because it ensures that a proportion of each
participant’s remuneration is explicitly linked to shareholder value and ensures that participants only receive a benefit where
there is a corresponding direct benefit to shareholders. The blend of absolute and relative performance rights is considered
to mitigate the weaknesses of those measures in isolation.
Relative TSR performance rights
The proportion of relative TSR performance rights which vest will be determined on the basis of Base Resources’ TSR relative
to the TSR of the comparator group over the performance period, as set out below:
Base Resources relative 3-year TSR performance(i) Percentage of relative TSR performance rights that vest
Less than 40th percentile Nil
40th percentile 25%
Between 40th and 50th percentile Pro rata between 25% and 50%
Between 50th and 75th percentile Pro rata between 50% and 100%
75th percentile and above 100%
Notwithstanding the above, the Board has the absolute discretion to determine that no relative TSR performance rights vest
if Base Resources’ TSR is negative (despite its relative placing within the TSR comparator group).
LTIP performance criteria are designed to target 50% vesting over time to achieve the Company’s policy intent for
remuneration market positioning, whilst providing incentive for outperformance. A threshold level of TSR performance at
the 40th percentile of the peer group, being a result that is below target, results in only 25% vesting and represents a 25%
loss of this component of at-risk remuneration relative to target positioning and is considered appropriate in the context of
the LTIP as a whole. TSR performance below the 40th percentile of the peer group results in nil vesting and represents a
50% loss of this component of at-risk remuneration.
Absolute TSR performance rights
The proportion of absolute TSR performance rights which vest will be determined on the basis of Base Resources’ TSR on
the following scale:
Base Resources 3-year TSR(i) Percentage of absolute TSR performance rights that vest
Less than 40th percentile Nil
40th percentile 25%
Between 40th and 50th percentile Pro rata between 25% and 50%
Between 50th and 75th percentile Pro rata between 50% and 100%
75th percentile and above 100%
(i) The�performance�scale�was�revised�for�the�cycle�commencing�1�October�2016.�For�previous�cycles�refer�to�prior�annual�reports.
The number of performance rights granted for the cycle commencing 1 October 2017 is by reference to the 20-day volume
weighted average price (“VWAP”) of A$0.2891 per share (A$0.1529 for cycle commencing 1 October 2016 and A$0.0575 for
cycle commencing 1 October 2015). In order to achieve 100% vesting for the cycle commencing 1 October 2017, a 30-day
VWAP of A$0.5001 or greater would be required (A$0.2645 for cycle commencing 1 October 2016 and A$0.1150 for cycle
commencing 1 October 2015) at the conclusion of the 3-year performance period.
What is the comparator group?
The TSR comparator group is comprised of the 26th to 75th ranked companies, from the top 150 ASX listed resource
companies (excluding oil and gas) by market capitalisation, at the time of the offer. The comparator group for each of the
performance rights cycles is comprised of the following companies:

BASE RESOURCES / REMUNERATION REPORT / 41
LTIP Cycle LTIP Cycle
Commencing 1 October Commencing 1 October
Companies 2017 2016 2015 Companies 2017 2016 2015
ABM Resources NL b Kingsrose Mining Limited b
Alacer Group Corp. b Lucapa Diamond Company Limited b b
Alderan Resources Limited b Lynas Corporation Limited b b
Alkane Resources Limited b b b Magnis Resources Limited b b
Altura Mining Limited b b Medusa Mining Limited b b
Aquarius Platinum Limited b Metals X Limited b b
Argosy Minerals Limited b Metro Mining Limited b
Arrium Limited b Millennium Minerals Limited b
Artemis Resources Limited b Mineral Deposits Limited b
Atlas Iron Limited b b Mirabela Nickel Limited b
Atrum Coal NL b b Mount Gibson Iron Limited b b b
Austral Gold Limited b Neometals Limited b b
Avanco Resources Limited b b b New Century Resources Limited b
AVZ Minerals Limited b Newfield Resources Limited b
Axiom Mining Limited b Nkwe Platinum Limited b
Bathurst Resources Limited b Northern Minerals Limited b
Beadell Resources Limited b b b OM Holdings Limited b b
Berkeley Energia Limited b b Orocobre Limited b b
Blackham Resources Limited b Paladin Energy Limited b
Blue Energy Limited b Panoramic Resources Limited b
Bougainville Copper Limited b Pantoro Limited b b
Brockman Mining Limited b Perseus Mining Limited b b b
Cardinal Resources Limited b b Pilbara Minerals Limited b b
Champion Iron Limited b Ramelius Resources Limited b b b
CI Resources Limited b b b Rand Mining Limited b b b
CuDeco Limited b b Range International Limited b
Dacian Gold Limited b b Realm Resources Limited b
Danakali Limited b Resolute Mining Limited b b
Dome Gold Mines Limited b Reward Minerals Limited b
Doray Minerals Limited b b Sandfire Resources NL b b
Eastern Goldfields Limited b Silver Lake Resources Ltd b b b
Elemental Minerals Limited b Stanmore Coal Limited b
Endeavour Mining Corporation b Tanami Gold NL b
Energy Resources of Australia Limited b b Teranga Gold Corporation b b
Finders Resources Limited b b b Terramin Australia Limited b b b
Flinders Mines Limited b TNG Limited b
Galaxy Resources Limited b Tribune Resources Limited b b b
Gascoyne Resources Limited b b Triton Minerals Limited b
Global Geoscience Limited b Troy Resources Limited b b
Gold Road Resources Limited b b b West African Resources Limited b b
Grange Resources Limited b b b West Gold Resources Limited b
Havilah Resources Limited b Western Areas Limited b b
Heron Resources Limited b Wolf Minerals Limited b
Highfield Resources Limited b b Wollongong Coal Limited b
Highlands Pacific Limited b Yancoal Australia Limited b
Kidman Resources Limited b b Zimplats Holdings Limited b b
Kingsgate Consolidated Ltd b

42 / BASE RESOURCES / ANNUAL REPORT 2018
Remuneration Report - audited (cont.)
Was a grant made in 2018?
Performance rights were granted to eligible participants in the LTIP for the cycle commencing 1 October 2017. The number
of performance rights granted for each executive was calculated by reference to the VWAP on the twenty trading days up
to the start of the cycle, being A$0.2891 per share, and the LTIP award opportunity.
What happens to performance rights granted under the LTIP when a participant ceases employment?
Where a participant ceases to be employed by a Group member (and is not immediately employed by another Group member)
for any reason other than a qualifying reason, all unvested performance rights of that participant are automatically forfeited.
Where a participant ceases to be employed by a Group member because of a qualifying reason, then the Board must
determine, in its absolute discretion, the number of unvested performance rights of a participant (if any) that will remain on
foot and become capable of vesting in accordance with LTIP rules.
The Board will generally exercise its discretion in the following manner:
• Performance rights granted in the cycle beginning on the 1 October immediately prior to the participant ceasing to be
employed by a Group member are automatically forfeited; and
• All other performance rights will continue to be held by the participant and will be tested for vesting on the test date
for the relevant performance right.
Qualifying reasons include but are not limited to death, total and permanent disablement, retirement or redundancy.
What happens in the event of a change of control?
Subject to the Board determining otherwise, if a change of control event occurs then a test date arises on the date that
the change of control event occurs with the Board to test the extent to which the performance criteria have been satisfied:
• On the basis of the offer price of the relevant transaction; and
• In the case of absolute TSR performance rights, reducing the percentage TSR performance hurdle pro rata to the
unexpired portion of the performance period as at the date the change in control event occurs.
Do shares granted upon vesting of performance rights dilute existing shareholders’ equity?
Shares allocated to the participants in the LTIP upon vesting of performance rights may be satisfied by the Group issuing
shares to the plan trustee or purchases by the plan trustee on market. In the event the Group issues shares to the plan
trustee to satisfy the vesting of performance rights then shareholders’ pre-existing equity will be diluted.
Does the Group have a policy in relation to hedging at-risk remuneration?
A participant in the LTIP must not enter into an arrangement if the arrangement would have the effect of limiting the exposure
of the participant to risk relating to performance rights that have not vested.
Did any performance rights vest in 2018?
4,961,983 of the 10,030,672 performance rights granted under the LTIP for the cycle commencing 1 October 2014 vested.
These rights completed the three-year performance period on 30 September 2017, with vesting as follows:
• Relative TSR performance rights
Base Resources TSR over the performance period placed it in the 74th percentile, resulting in 4,961,983 of the
5,015,336 relative performance rights vesting.
• Absolute TSR performance rights
Base Resources TSR over the performance period, by reference to a final VWAP of A$0.273, equated to a TSR of 6%,
resulting in none of the 5,015,336 absolute performance rights vesting.
Shares issued to the participants in the LTIP upon the vesting of the above performance rights were satisfied through the
Company issuing shares.

BASE RESOURCES / REMUNERATION REPORT / 43
Group performance and its link to shareholder return
The following graph compares the change in the cumulative TSR of Base Resources’ shares during the period 1 July 2013
to 30 June 2018, against the cumulative total return of the ASX 200 Resources Index over the same period. The graph
illustrates the cumulative return from Base Resources over the past five years, assuming A$100 was invested. No dividends
have been declared during this period.
1 July 2013 through 30 June 2018
A$0
A$50
A$100
A$150
30-Jun
-13
30-Sep
-13
31-D
ec-13
31-M
ar-14
30-Jun
-14
30-Sep
-14
31-D
ec-14
31-M
ar-15
30-Jun
-15
30-Sep
-15
31-D
ec-15
31-M
ar-16
30-Jun
-16
30-Sep
-16
31-D
ec-16
31-M
ar-17
30-Jun
-17
30-Jun
-18
30-Sep
-17
31-D
ec-17
31-M
ar-18
A$118
A$89
A$37 A$37
A$75 A$78
A$98A$86
A$106
A$141
Base Resources LimitedASX200 Resources Index
Culmative Total Shareholder Returns
Executive remuneration outcomes for 2018
Short Term Incentives (STI)
At the end of the 2018 financial year, a review of the performance of each Senior Executive was undertaken against each of
their 2018 individual performance measures as explained above. The 2018 financial year corporate performance achieved
was between target and stretch performance levels, and incentives are payable in relation to this component commensurate
with the performance level achieved. STIP entitlements earned for 2018 performance are paid in the 2019 financial year.
The following table outlines the STI that was earned in comparison with the target STI for the 2018 financial year:
Target STI STI Awarded
Name Individual performance % Corporate performance % Individual performance % Corporate performance %
T Carstens 45 15 65 19
C Bwye 45 15 60 19
K Balloch 15 15 21 21
A Greyling 15 15 20 21
S Hay 15 15 21 21
C Poletti 15 15 23 21

44 / BASE RESOURCES / ANNUAL REPORT 2018
LTIP Performance Rights
The LTIP operates on the basis of a series of 3-year performance cycles commencing on 1 October each year.
Accordingly, LTIP performance rights issued in the year ending 30 June 2018 are subject to a 3-year performance period
ending on 30 September 2020. Performance rights issued under the plan in the 2015 financial year, totalling 10,030,672,
completed their 3-year performance period on 30 September 2017, with 4,961,983 performance rights vesting. The table
below outlines the vesting outcomes of performance rights for the last three LTIP cycles completed:
Relative Performance Rights Absolute Performance Rights
Grant date Vesting dateNo. performance
rights granted No. vested % No. vested %
1 October 2012 30 September 2015 4,870,331 - 0 - 0
1 October 2013 30 September 2016 7,518,865 - 0 - 0
1 October 2014 30 September 2017 10,030,672 4,961,983 99 - 0
Take home pay for 2018
The remuneration detailed in this table represents the Senior Executives “take home pay” and is aligned to the current
reporting period, and therefore is particularly useful in understanding actual remuneration received during the year.
The table excludes adjustments made for accounting purposes and included in Statutory Remuneration (refer page 45),
specifically the probability and value of an employee obtaining long service leave and the fair value of performance
rights under three outstanding LTIP cycles expensed during the 2018 financial year. The remuneration packages for
all Senior Executives are shown in the following table in their employment currency.
Key Management Person Currency Salary STIP Superannuation
Vesting of performance
rights(ii)
Compensating payment
for LTIP scaleback(iii)
Take home pay(i)
(before tax)
2018
Executive Directors
T Carstens AUD 484,000 422,579 25,000 243,289 - 1,174,868
C Bwye AUD 484,000 399,674 25,000 243,289 - 1,151,963
Other Key Management Personnel
K Balloch AUD 370,000 163,953 25,000 97,472 - 656,425
A Greyling AUD 325,000 142,650 25,000 14,460 - 507,110
S Hay AUD 390,350 172,401 25,000 108,611 - 696,362
C Poletti AUD 300,000 139,773 25,000 31,124 - 495,897
2017
Executive Directors
T Carstens AUD 406,800 367,299 30,000 - 130,160 934,259
C Bwye AUD 401,800 354,195 35,000 - 130,160 921,155
Other Key Management Personnel
K Balloch AUD 320,000 150,091 30,000 - 52,148 552,239
A Greyling AUD 280,000 132,720 35,000 - 46,933 494,653
S Hay AUD 360,000 173,094 30,000 - 58,107 621,201
(i) �Base�Resources’�financial�results�are�reported�under�International�Financial�Reporting�Standards�(IFRS).�The�above�table�includes�certain�non-IFRS�measures�including�vested�performance�rights�and�take�home�pay.�These�measures�are�presented�to�enable�understanding�of�the�underlying�remuneration�of�KMPs.
(ii) The�value�of�performance�rights�vested�under�the�cycle�commencing�1�October�2014�has�been�calculated�by�reference�to�the�price�on�the�vesting�date�of�A$0.2733.
(iii) A�scale�back�was�applied�to�performance�rights�offered�under�the�LTIP�cycle�commencing�1�October�2016�in�order�to�ensure�compliance�with�applicable�ASIC�relief.�A�compensating�payment�was�made�during�the�2017�financial�year�to�eligible�staff�in�lieu�of�the�scale�back�in�performance�rights�offered.
Remuneration Report - audited (cont.)
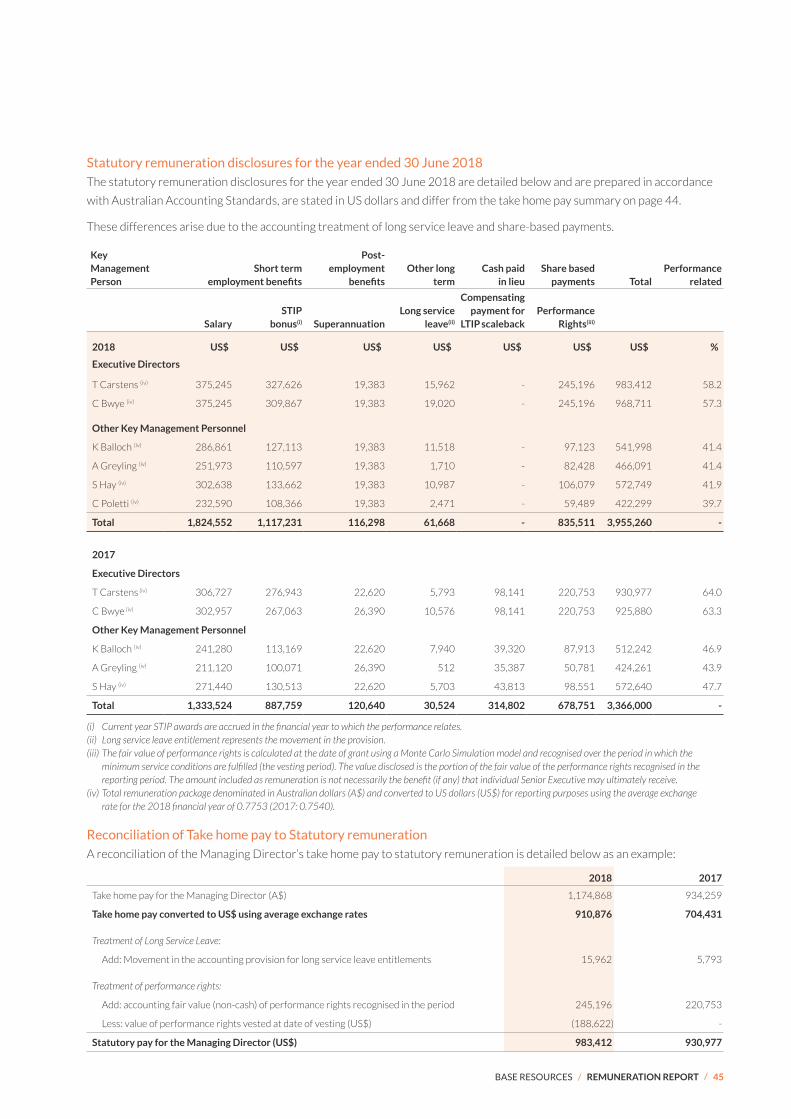
BASE RESOURCES / REMUNERATION REPORT / 45
Statutory remuneration disclosures for the year ended 30 June 2018
The statutory remuneration disclosures for the year ended 30 June 2018 are detailed below and are prepared in accordance
with Australian Accounting Standards, are stated in US dollars and differ from the take home pay summary on page 44.
These differences arise due to the accounting treatment of long service leave and share-based payments.
Key Management Person
Short term employment benefits
Post- employment
benefitsOther long
termCash paid
in lieuShare based
payments TotalPerformance
related
SalarySTIP
bonus(i) SuperannuationLong service
leave(ii)
Compensating payment for
LTIP scalebackPerformance
Rights(iii)
2018 US$ US$ US$ US$ US$ US$ US$ %
Executive Directors
T Carstens (iv) 375,245 327,626 19,383 15,962 - 245,196 983,412 58.2
C Bwye (iv) 375,245 309,867 19,383 19,020 - 245,196 968,711 57.3
Other Key Management Personnel
K Balloch (iv) 286,861 127,113 19,383 11,518 - 97,123 541,998 41.4
A Greyling (iv) 251,973 110,597 19,383 1,710 - 82,428 466,091 41.4
S Hay (iv) 302,638 133,662 19,383 10,987 - 106,079 572,749 41.9
C Poletti (iv) 232,590 108,366 19,383 2,471 - 59,489 422,299 39.7
Total 1,824,552 1,117,231 116,298 61,668 - 835,511 3,955,260 -
2017
Executive Directors
T Carstens (iv) 306,727 276,943 22,620 5,793 98,141 220,753 930,977 64.0
C Bwye (iv) 302,957 267,063 26,390 10,576 98,141 220,753 925,880 63.3
Other Key Management Personnel
K Balloch (iv) 241,280 113,169 22,620 7,940 39,320 87,913 512,242 46.9
A Greyling (iv) 211,120 100,071 26,390 512 35,387 50,781 424,261 43.9
S Hay (iv) 271,440 130,513 22,620 5,703 43,813 98,551 572,640 47.7
Total 1,333,524 887,759 120,640 30,524 314,802 678,751 3,366,000 -
(i) Current�year�STIP�awards�are�accrued�in�the�financial�year�to�which�the�performance�relates.�(ii) �Long�service�leave�entitlement�represents�the�movement�in�the�provision.�(iii) �The�fair�value�of�performance�rights�is�calculated�at�the�date�of�grant�using�a�Monte�Carlo�Simulation�model�and�recognised�over�the�period�in�which�the�
minimum�service�conditions�are�fulfilled�(the�vesting�period).�The�value�disclosed�is�the�portion�of�the�fair�value�of�the�performance�rights�recognised�in�the�reporting�period.�The�amount�included�as�remuneration�is�not�necessarily�the�benefit�(if�any)�that�individual�Senior�Executive�may�ultimately�receive.
(iv)� �Total�remuneration�package�denominated�in�Australian�dollars�(A$)�and�converted�to�US�dollars�(US$)�for�reporting�purposes�using�the�average�exchange�rate�for�the�2018�financial�year�of�0.7753�(2017:�0.7540).
Reconciliation of Take home pay to Statutory remuneration
A reconciliation of the Managing Director’s take home pay to statutory remuneration is detailed below as an example:
2018 2017
Take home pay for the Managing Director (A$) 1,174,868 934,259
Take home pay converted to US$ using average exchange rates 910,876 704,431
Treatment�of�Long�Service�Leave:
Add: Movement in the accounting provision for long service leave entitlements 15,962 5,793
Treatment�of�performance�rights:
Add: accounting fair value (non-cash) of performance rights recognised in the period 245,196 220,753
Less: value of performance rights vested at date of vesting (US$) (188,622) -
Statutory pay for the Managing Director (US$) 983,412 930,977

46 / BASE RESOURCES / ANNUAL REPORT 2018
Remuneration Report - audited (cont.)
Non-executive director remuneration
Shareholders approve the maximum aggregate remuneration for non-executive directors. Fees paid to non-executive
directors are recommended by the Remuneration & Nomination Committee and the Board is responsible for approving any
recommendations, if appropriate. As approved at the Annual General Meeting on 28 November 2011, the aggregate limit of
fees payable per annum is A$750,000 in total.
The Group’s policy is that non-executive director remuneration is structured to exclude equity-based remuneration and
reviewed annually.
All directors have their indemnity insurance paid by the Group.
Non-executive directors receive a fixed fee remuneration consisting of a cash fee and statutory superannuation contributions
made by the Group and additional fees for committee roles as set out below:
2018 2017
A$ A$
Base fees
Chairman 148,500 135,400
Other non-executive directors 77,000 70,000
Remuneration & Nomination Committee
Chair - -
Committee member 5,250 5,250
Audit Committee
Chair 14,000 14,000
Committee member 7,000 7,000
Risk Committee
Chair 7,900 7,900
Committee member 3,900 3,900

BASE RESOURCES / REMUNERATION REPORT / 47
Non-executive remuneration for the year ended 30 June 2018 and comparative 2017 remuneration:
Base fees Audit committee
Remuneration & Nomination
committee Risk committee Total(i)
US$ US$ US$ US$ US$
2018
K Spence 115,132 - - - 115,132
S Willis 59,698 10,854 4,070 3,024 77,646
M Anderson(ii) 9,950 905 - - 10,855
M Macpherson 59,698 5,427 4,070 6,125 75,320
M Stirzaker 59,698 - 4,070 3,024 66,792
D Radley (iii) 24,874 1,809 - 1,008 27,691
Total 329,050 18,995 12,210 13,181 373,436
2017
K Spence 102,092 - - - 102,092
S Willis 52,780 10,556 3,959 2,941 70,236
M Anderson 52,780 5,278 - - 58,058
M Macpherson 52,780 5,278 3,959 2,482 64,499
M Stirzaker 52,780 - 3,959 2,941 59,680
Total 313,212 21,112 11,877 8,364 354,565
(i) �Total�remuneration�packages�denominated�in�Australian�dollars�(A$)�and�converted�to�US�dollars�(US$)�for�reporting�purposes�using�the�average�exchange�rate�for�the�2018�financial�year�of�0.7753�(2017:�0.7540).
(ii) Retired�31�August�2017.(iii) Appointed�1�February�2018.

48 / BASE RESOURCES / ANNUAL REPORT 2018
Remuneration Report - audited (cont.)
Equity instruments
Performance Rights
The table below outlines movements in performance rights during 2018 and the balance held by each Senior Executive at
30 June 2018:
Name Grant date(i)
Number of performance
rights
Fair value of each
performance right A$ Vesting date(ii)
Number vested during
year
Number lapsed during
yearBalance at
end of year
T Carstens 1 October 2014 1,799,394 0.1400 30 September 2017 890,126 909,268 -
1 October 2015 6,964,806 0.0380 30 September 2018 - - 6,964,806
1 October 2016 1,725,567 0.1625 30 September 2019 - - 1,725,567
1 October 2017 2,113,056 0.2150 30 September 2020 - - 2,113,056
12,602,823 890,126 909,268 10,803,429
C Bwye 1 October 2014 1,799,394 0.1400 30 September 2017 890,126 909,268 -
1 October 2015 6,964,806 0.0380 30 September 2018 - - 6,964,806
1 October 2016 1,725,567 0.1625 30 September 2019 - - 1,725,567
1 October 2017 2,113,056 0.2150 30 September 2020 - - 2,113,056
12,602,823 890,126 909,268 10,803,429
K Balloch 1 October 2014 720,912 0.1400 30 September 2017 356,621 364,291 -
1 October 2015 2,790,387 0.0380 30 September 2018 - - 2,790,387
1 October 2016 691,333 0.1625 30 September 2019 - - 691,333
1 October 2017 819,899 0.2150 30 September 2020 - - 819,899
5,022,531 356,621 364,291 4,301,619
A Greyling 1 August 2015 108,731 0.1400 30 September 2017 52,906 55,825 -
1 October 2015 2,511,348 0.0380 30 September 2018 - - 2,511,348
1 October 2016 622,200 0.1625 30 September 2019 - - 622,200
1 October 2017 726,493 0.2150 30 September 2020 - - 726,493
3,968,772 52,906 55,825 3,860,041
S Hay 1 October 2014 803,301 0.1400 30 September 2017 397,378 405,923 -
1 October 2015 3,109,289 0.0380 30 September 2018 - - 3,109,289
1 October 2016 770,343 0.1625 30 September 2019 - - 770,343
1 October 2017 862,139 0.2150 30 September 2020 - - 862,139
5,545,072 397,378 405,923 4,741,771
C Poletti 16 February 2015 230,194 0.1400 30 September 2017 113,873 116,321 -
1 October 2015 1,435,056 0.0380 30 September 2018 - - 1,435,056
1 October 2016 355,543 0.1625 30 September 2019 - - 355,543
1 October 2017 674,600 0.2150 30 September 2020 - - 674,600
2,695,393 113,873 116,321 2,465,199
42,437,414 2,701,030 2,760,896 36,975,488
(i) The�amount�expensed�per�the�statutory�remuneration�table�reflects�the�period�since�commencement�of�services�when�the�Group�and�the�Senior�Executive�had�a�shared�understanding�of�the�award.
(ii) On�the�vesting�date,�performance�rights�are�tested�against�the�performance�criteria�and�only�those�performance�rights�that�satisfy�the�performance�criteria�vest.

BASE RESOURCES / REMUNERATION REPORT / 49
Key Management Personnel performance rights movements
Balance 1 July 2017 Granted Vested Lapsed Balance 30 June 2018
T Carstens 10,489,767 2,113,056 890,126 909,268 10,803,429
C Bwye 10,489,767 2,113,056 890,126 909,268 10,803,429
K Balloch 4,202,632 819,899 356,621 364,291 4,301,619
A Greyling 3,242,279 726,493 52,906 55,825 3,860,041
S Hay 4,682,933 862,139 397,378 405,923 4,741,771
C Poletti 2,020,793 674,600 113,873 116,321 2,465,199
35,128,171 7,309,243 2,701,030 2,760,896 36,975,488
Key Management Personnel shareholdings
The number of ordinary shares in Base Resources held by each director and KMP of the Group during the financial year
is as follows:
Balance 1 July 2017Vesting of
Performance Rights Purchased Sold Balance 30 June 2018
K Spence 500,000 - 166,667(i) - 666,667
T Carstens 1,228,522 890,126 536,992(i) - 2,655,640
C Bwye 1,842,739 890,126 431,334(i) - 3,164,199
S Willis 200,000 - 150,000(ii) - 350,000
M Anderson - - - - -
M Macpherson - - - - -
M Stirzaker - - - - -
D Radley - - 500,000 - 500,000
K Balloch 108,948 356,621 155,190(i) - 620,759
A Greyling 1,411,154 52,906 488,021(i) - 1,952,081
S Hay - 397,378 132,459(i) - 529,837
C Poletti 20,117 113,873 37,957(i) - 171,947
5,311,480 2,701,030 2,598,620 - 10,611,130
(i) Shares�acquired�pursuant�to�the�1�for�3�pro�rata�entitlements�offer�announced�on�19�December�2017.(ii) 66,667�shares�acquired�pursuant�to�the�1�for�3�pro�rata�entitlements�offer�announced�on�19�December�2017,�with�the�balance�purchased�on�market.

50 / BASE RESOURCES / ANNUAL REPORT 2018
Remuneration Report - audited (cont.)
Executive Key Management Personnel employment arrangements
The employment arrangements of the executive KMPs are formalised in standard employment agreements. Details of the
termination provisions contained in the agreements are provided below.
Name Term of contract Notice period by either party Termination benefit
T Carstens Permanent – ongoing until notice has been given by either party
3 months’ notice by the employee
1 month’s notice for termination by Company if unable to perform duties by reason of illness
No notice required for termination by Company for cause
12 months fixed remuneration in the case of termination by the Company
C Bwye
K Balloch
A Greyling
S Hay
C Poletti
Permanent – ongoing until notice has been given by either party
3 months’ notice by the employee
1 month’s notice for termination by Company for serious breach of employment agreement, incompetence, gross misconduct or refusing to comply with lawful direction given by the Company
No notice required for termination by Company if convicted of any major criminal offence
Company may elect to make payment in lieu of notice
6 months fixed remuneration in the case of termination by the Company
(3 month’s remuneration for A Greyling)
This Report of Directors, incorporating the Remuneration Report, is signed in accordance with a resolution of the Board of Directors.
Keith Spence
Chairman
Dated: 25 August 2018

BASE RESOURCES / REMUNERATION REPORT / 51
Corporate governance
The Company is committed to implementing high standards of corporate governance to create and deliver value for shareholders.
As an ASX listed entity, the Company must comply with the ASX Listing Rules and is required to report against the ASX
Corporate Governance Council’s Corporate Governance Principles and Recommendations (ASX Recommendations).
The Board considers that throughout the financial year ended 30 June 2018 the Company complied with the ASX
Recommendations, except to the limited extent noted in this statement.
This statement is current as at 30 June 2018 and has been approved by the Board. Where appropriate, the statement also
highlights relevant events that have occurred since 30 June 2018 with respect to the governance practices of the Company.
Board of Directors
Role of the Board
The Board Charter sets out the Board’s role, powers and duties and establishes the functions and responsibilities reserved
for the Board and those which are delegated to EXCO (comprising the Managing Director and the Executive Director
– Operations & Development) and the broader executive management team. Among other things, the Board reserves
responsibility for overseeing the business and affairs of the Company, including its control and accountability systems,
setting the strategic direction of the Company, reviewing and ratifying systems of risk management and internal compliance
and control, codes of conduct and legal compliance and ensuring a high standard of corporate governance practice and
regulatory compliance and promoting ethical and responsible decision making.
The Board delegates responsibility for the day-to-day operations, management and administration of the Company to
EXCO in accordance with the strategy approved by the Board. EXCO’s joint responsibilities include effective leadership of
the Company, preparation, and implementation of, development and operational plans, policies and procedures to achieve
the strategic, operational and financial objectives of the Company, management of the day to day affairs of the Company,
identifying and managing business risks and managing the Company’s financial and other reporting mechanisms.
A full list of those matters reserved to the Board and those matters delegated to management is set out in the Board Charter.
These delegations are further documented by way of the Delegation of Authority Standard which is reviewed and approved by
the Board at least annually.
The Company Secretary is appointed by the Board and is accountable to the Board, through the Chairman, on all matters to do
with the proper functioning of the Board. The Company Secretary’s role includes providing advice to the Board on corporate
governance matters, with all Directors having access to the advice and services provided by the Company Secretary.
Composition of the Board
As at 30 June 2018, the Board consisted of five non-executive Directors and two executive Directors (being the Managing
Director and the Executive Director – Operations & Development).
The Chairman, Mr Spence, is responsible for leadership and effective performance of the Board and for the maintenance
7of relations between Directors and management that are open, cordial and conducive to productive cooperation.
A Director’s independence is assessed in accordance with the Definition of Independence set out in the Board Charter.
The Chairman is considered independent, along with fellow non-executive Directors Mr Willis, Mr Macpherson and Ms Radley.
Mr Stirzaker, a non-executive Director, is not considered independent as a consequence of his relationship with the Company’s
major shareholder, Pacific Road Capital. Prior to his resignation as a non-executive Director on 31 August 2017, Mr Anderson
was also not considered independent given his relationship with the Company’s then substantial shareholder, Taurus Funds
Management (which is no longer a shareholder). With the appointment of Ms Radley on 1 February 2018, the Company complies
with ASX Recommendation 2.4 that a majority of the Board should be independent.
Skills and experience
The Board has established the following set of core competencies to assist in assessing the skills and experience of each
Director, and to assist in ensuring that the combined capabilities of the Board provides appropriate coverage across the core

52 / BASE RESOURCES / ANNUAL REPORT 2018
Corporate governance (cont.)
competencies. This set of competencies was further refined during the year, including addition of a specific core competency
for African business experience. The table below indicates those Directors on which the Board principally relies in ensuring
adequacy of coverage across the core competencies, recognising that all Directors bring a far broader and diverse range of
skills and experience to the Board.
Area Competency Key Directors
Resources industry experience
Experience in the resources industry, including broad knowledge of exploration, operations, project development, markets, shipping and competitors.
C Bwye, T Carstens, M Macpherson, K Spence, M Stirzaker
Mineral sands industry experience
Specific experience in the mineral sands industry, including an in depth knowledge of exploration, operations, project development, markets, shipping, competitors and relevant technology.
C Bwye, T Carstens, M Macpherson
Strategy Identifying and critically assessing strategic opportunities and threats to an organisation and developing and implementing successful strategies in context to the organisation’s policies and business objectives.
C Bwye, T Carstens, M Macpherson, D Radley, K Spence, M Stirzaker, S Willis
Mergers & acquisitions
Experience managing, directing or advising on mergers, acquisitions, divestments and portfolio optimisations.
M Macpherson, D Radley, K Spence, M Stirzaker, S Willis
Finance Senior executive or other relevant experience in financial accounting and reporting, internal financial and risk controls, corporate finance and, restructuring corporate transactions and project financing.
T Carstens, D Radley, M Stirzaker, S Willis
Risk management Experience working with and applying broad risk management frameworks in various country, regulatory or business environments, identifying key risks to an organisation, monitoring risks and compliance and knowledge of legal and regulatory requirements.
T Carstens, M Macpherson, D Radley, K Spence
Government relations
Senior management or equivalent experience working in diverse international political, cultural, regulatory and business environments.
T Carstens, K Spence
African business experience
Experience in the successful development and operation of reputable businesses in Africa. C Bwye, T Carstens, M Macpherson, D Radley, M Stirzaker
Capital projects; management
Experience with projects involving contractual negotiations, project management, significant capital outlays and long investment horizons.
C Bwye, K Spence
Sustainable development
Senior management or equivalent experience in workplace health and safety, environmental and social responsibility, and community.
T Carstens, K Spence
Previous board experience and governance
Serving on boards of varying size and composition, in varying industries and for a range of organisations. Implementing the high standards of governance in a major organisation that is subject to rigorous governance standards and identifying key issues for an organisation and developing appropriate policy parameters within which the organisation should operate.
M Macpherson, D Radley, K Spence, M Stirzaker, S Willis
Executive leadership
Experience in evaluating the performance of senior management, overseeing strategic human capital planning, industrial relations, organisational change management and sustainable success in business at a senior level.
C Bwye, T Carstens, M Macpherson, D Radley, K Spence, M Stirzaker, S Willis
Remuneration Remuneration and/or nomination committee membership or management experience in relation to succession planning, remuneration, talent management (including incentive programs, superannuation), and the legislative and contractual framework governing remuneration.
T Carstens, M Macpherson, D Radley, K Spence, M Stirzaker, S Willis
The diagram below further illustrates the Board’s depth of coverage across its core competencies. As shown, the Board
considers that collectively the Directors have the range of skills, knowledge, experience and competencies necessary to
effectively direct the Company. That said, the Board will continue its ongoing education program targeting emerging issues
identified through the course of the year.
Further details of the skills, experiences, expertise and period of service of each Director is set out on pages 29 to 33 of
the Annual Report.

BASE RESOURCES / REMUNERATION REPORT / 53
Director appointment, induction, training and continuing education
Newly appointed non-executive Directors are required to execute a letter of appointment which sets out the key terms and
conditions of their appointment, including duties, rights and responsibilities, envisioned time commitments and the Board’s
expectations with respect to committee work. Executive directors and all senior executives enter employment agreements
which govern their terms of employment.
An induction plan is tailored for specific needs of new appointees to the Board. The induction process typically includes a
comprehensive overview of the Company’s governance policies and procedures, in-depth discussions with each member
of EXCO and the executive management team and a site visit to the Company’s key operating asset in Kwale, Kenya and
development asset in Toliara, Madagascar. The induction materials provided to new appointees include information on the
Company’s governance and culture, including the “Base Way” (the set of core beliefs and principles that permeate every
aspect of the Company’s business and describes the Company’s desired culture). Ms Radley’s induction, as a new Board
appointment during the year, was consistent with the process described in this paragraph.
Directors are expected to maintain the skills necessary to discharge their obligations to the Company and its shareholders.
The Company provides the Board with regular information on industry-related matters and new developments with the
potential to affect the Company and its business. When a need is identified (for example, arising from a Board function
review or through the Remuneration & Nomination Committee’s Board education oversight role), the Company will
organise specific structured professional development opportunities for Directors.
The Board manages succession planning with the assistance of the Remuneration & Nomination Committee. Should a
vacancy exist or should it otherwise become appropriate for Board changes to be implemented, it is the responsibility of
the Remuneration & Nomination Committee (among other things) to identify and recommend to the Board candidates for
the Board after considering the necessary and desirable competencies of new Board members to ensure the appropriate
mix of skills, experience, expertise and diversity, and after assessment of how the candidate can contribute to the strategic
direction of the Company. The Board may engage an independent recruitment firm to undertake a search for suitable
candidates. The Company undertakes appropriate background and screening checks prior to nominating an individual for
election as a Director by shareholders, and provides shareholders all material information in its possession concerning a
Director standing for election or re-election in the explanatory memorandum accompanying the relevant notice of meeting.
Following the vacancy on the Board that occurred early in the year, the Board engaged an independent recruitment firm to
undertake a search for suitable candidates for Board appointment. This search focused on candidates with strong African
business experience, senior leadership experience and prior experience in mergers and acquisitions, which were considered
key skills and experiences for any new appointment. Following a short-listing of potential candidates, thorough background
and screening checks were undertaken through independent sources, followed by a multi-staged interview process.

54 / BASE RESOURCES / ANNUAL REPORT 2018
The outcome of this approximate four-month process resulted in the Board nominated appointment of Ms Radley as a
director. In accordance with the Company’s constitution, Ms Radley will automatically retire at the 2018 annual general
meeting and will be eligible for election by shareholders.
Board performance evaluation
It is the Company’s policy that once a year, the Board will review and critically evaluate the performance of the Board,
the Board Committees and individual Directors. The Board sets the method and scope of the performance evaluation each
year, which typically includes self-assessments designed to effectively review the performance of the Board and
each of its Committees against the requirements of their specific charters and the individual performance of each Director.
In appropriate circumstances, the Board performance evaluation may involve engagement of a third-party Board advisor.
The process for this annual review is set out in further detail in the Board Charter.
A performance evaluation of the Board, its Committees and individual Directors was undertaken during the reporting
period ended 30 June 2018. This review comprised of a questionnaire process completed by each Director designed to
assess performance of the Board, the Chairman and each Committee and its respective Chairman. The key outcomes of
the questionnaire process were analysed and considered at subsequent Board and Committee meetings. The Chairman
also undertook separate review discussions with each individual Director. Overall, the results of the review process
were pleasing, indicating that the Board, its Committees and individual Directors are considered to be performing their
respective roles effectively. The review process also identified a few areas for improvement that will be addressed through
the coming year. It is proposed that an externally facilitated Board review process will be undertaken in the coming year.
Director retirement and re-election
With the exception of the Managing Director, directors must retire at the third AGM following their last election or
re-election. At least one Director must stand for election at each AGM. Any director appointed to fill a casual vacancy since
the date of the previous AGM, as was the case with Ms Radley, retires at the next AGM and is eligible for election. Board
support for a Director’s election or re-election is not automatic and is subject to satisfactory Director performance. It is the
role of the Remuneration & Nomination Committee to consider and recommend to the Board candidates for election or
re-election to the Board.
Committees of the Board
The Company’s Constitution provides that the Board may delegate its powers as it considers appropriate. The Board has
established an Audit Committee, Remuneration & Nomination Committee and Risk Committee. The previously established
ad hoc Taurus Refinancing Committee was dissolved in August 2017 following retirement of the Company’s US$20 million
facility from Taurus Funds Management.
The Committees generally operate in a review or advisory capacity, except in limited circumstances where the Board’s
powers are specifically delegated to a Committee. Each Committee has a charter detailing its role, duties and membership
requirements. These charters are reviewed regularly, and at least annually, and are updated as required.
Details of the skills, experiences and expertise of each member of the respective Committees of the Board is set out on pages
29 to 33 of the Annual Report. Details of the Committee meetings held during the year and attendances of members at
those meetings is set out on page 33 of the Annual Report.
Audit Committee
The role of the Audit Committee is to assist the Board to meet its oversight responsibilities in relation to the Company’s
financial reporting, compliance with legal and regulatory requirements and external audit function.
The Audit Committee members during the year were Mr Willis, Mr Spence, Mr Anderson (resigned 31 August
2017), Mr Macpherson and Ms Radley (appointed 1 February 2018). Following Mr Anderson’s resignation, the Audit
Committees consists of only independent non-executive Directors. Mr Willis, an independent non-executive Director,
is Committee Chairman.
Corporate governance (cont.)

BASE RESOURCES / REMUNERATION REPORT / 55
Remuneration & Nomination Committee
The role of the Remuneration & Nomination Committee with respect to remuneration matters is to assist the Board in
fulfilling its oversight responsibilities in relation to the overall remuneration strategy of the Company, and its specific
application to EXCO and the senior management team, and reviewing and approving equity based plans and other incentive
schemes. This role is designed to assist in ensuring that the executive remuneration policy demonstrates a clear relationship
between executive performance and remuneration.
The role of the Committee with respect to nomination matters is to support the Board in fulfilling its responsibilities
by maintaining a Board that has an appropriate mix of skills and experience, developing the processes for evaluation of
performance of the Board and its Committees, ensuring the Company’s Diversity Policy is implemented in respect of the
Board and managing the process for identifying and selecting new Directors.
The Remuneration & Nomination Committee has four members, all of whom are non-executive Directors and a majority
of whom are independent. Members of the Committee were Mr Spence, Mr Willis, Mr Macpherson and Mr Stirzaker.
Mr Spence, an independent non-executive Director, is Committee Chairman.
Risk Committee
The role of the Risk Committee is to assist the Board with identification and management of business and operational risks
faced by the Company to a standard that considers the reasonable expectations of the Company’s shareholders, employees,
customers, suppliers, creditors and the broader community in which the Company operates.
The Risk Committee typically conducts a full review and update of the Company’s material business risk register and risk
management framework at each Committee meeting, and at least annually.
The Risk Committee has four members, all of whom are non-executive Directors and a majority of whom are independent.
Members of the Committee during the period were Mr Macpherson, Mr Spence, Mr Willis, Mr Stirzaker and Ms Radley.
Mr Stirzaker stepped down from the Committee and was replaced by Ms Radley with effect from 1 March 2018. Mr
Macpherson, an independent non-executive Director, is Committee Chairman.
Taurus Refinancing Committee
In June 2016, the Board established the ad hoc Taurus Refinancing Committee which had the primary purpose of assisting
the Board in assessing the available options for repayment or refinancing of the Company’s US$20 million facility from
Taurus Funds Management. The Taurus Refinancing Committee was not a separately remunerated committee. Members
of the Committee were Mr Willis, Mr Spence, Mr Carstens and the Company’s Chief Financial Officer whom had been
seconded to the Committee. Mr Willis, an independent non-executive Director, was Committee Chairman. As this facility
was retired in July 2017, the Taurus Refinancing Committee was no longer required and was formally dissolved by the Board
in August 2017.
Shareholder Communication
General
The Board recognises the importance of regular and proactive interaction with the market to ensure the Company’s
investors and key stakeholders remain informed about the Company’s activities. The Company has an investor relations
program designed to facilitate effective two-way communication with shareholders.
The Company’s Continuous Disclosure and Market Communications Policy sets out the Company’s commitment to:
• communicating effectively with shareholders through releases to the market via ASX and AIM, information mailed to
shareholders (e.g. notices of meetings and explanatory material and periodic disclosure, such as annual, half yearly and
quarterly reporting of exploration, production and corporate activities) and the general meetings of the Company;
• giving shareholders ready access to balanced and understandable information about the Company and corporate proposals; and
• making it easy for shareholders to participate in general meetings of the Company.

56 / BASE RESOURCES / ANNUAL REPORT 2018
The Board further recognises the rights of shareholders and encourages the effective exercise of those rights through
the following means:
• notices of meeting and other meeting materials are drafted in concise and clear language and are distributed in
accordance with the provisions of the Corporations Act;
• shareholders are encouraged to use their attendance at meetings to ask questions on relevant matters, with time being
specifically set aside at each meeting for shareholder questions;
• shareholders are encouraged to participate in voting on proposed resolutions by either attending the meeting or by way
of lodgement of proxies, if shareholders are unable to attend the meeting;
• it is general practice for a presentation on the Company’s recent activities to be made to shareholders at each annual
general meeting; and
• at annual general meetings, it is both the Company’s policy and the policy of the Company’s auditor for the lead e
ngagement partner to be present at the annual general meeting to answer any questions regarding the conduct of
the audit and the preparation and content of the auditor’s report.
The Company’s website (www.baseresources.com.au) provides information about the Company generally for the benefit
of its shareholders, market participants and key stakeholders. The Company’s website is promptly updated with material
released to ASX and AIM after confirmation of release by ASX. All information available on the Company’s website is
regularly reviewed and updated to ensure that information is current, or appropriately dated and archived. Of note, the
Company’s website includes the following sections which contain relevant information for shareholders:
• a governance section, which contains the Company’s current Constitution, relevant governance policies and practices,
Board and Board Committee Charters;
• a Board and management section, which contains the names and brief biographical information for each of the Directors
and senior executives;
• a reports section, which contains copies of annual, half yearly and quarterly reports; and
• a market releases section containing ASX announcements (including full text of notices of meeting and explanatory
material) and a presentations section containing power point presentations.
Further information about operations at the Kwale Project are made available from the website of the Company’s wholly-
owned operating subsidiary, Base Titanium (basetitanium.com). Further information about the Toliara Project are available
from the Company’s main website at baseresources.com.au.
The Company provides the opportunity for and encourages shareholders to receive communications from, and send
communications to, the Company and its securities registry electronically. The Company makes available telephone, fax
and email contact details on its website through which shareholders are welcomed to contact the Company.
Continuous disclosure and market communications
The Company is committed to ensuring that shareholders and the market are provided with full and timely information
about the Company and its activities and that all investors have equal opportunity to receive externally available information
issued by the Company.
The Company’s Continuous Disclosure and Market Communications Policy provides that the Managing Director and the
Company Secretary are primarily responsible for ensuring that the Company complies with its disclosure obligations and
for overseeing and co-ordinating the disclosure of information to relevant stock exchanges, shareholders and applicable
regulatory authorities. To assist in this process, it is the responsibility of every Director and employee to report to the
Company Secretary any potentially price sensitive information which that person has obtained. To the full extent practical
Corporate governance (cont.)
BASE RESOURCES / REMUNERATION REPORT / 57
(having regard to the requirement for immediate disclosure in certain circumstances), the Board is given the opportunity
to review and comment on material announcements prior to their release.
Promoting responsible and ethical behaviours
The “Base Way”, Code of Conduct and Integrity System
The “Base Way” sets out the unifying set of beliefs and behavioural expectations for the Company and its employees,
including the Company’s absolute commitment to conducting its business in a legal, honest and ethical manner.
The Company’s Code of Conduct provides an overview of the framework for decision making and actions in relation to
ethical conduct in employment at the Company and its subsidiaries. The Code of Conduct summarises the key business
systems (including relevant Policies and Standards) adopted by the Company that apply to the Company and its subsidiaries
and their respective employees which underpin the Company’s commitment to integrity and fair dealing in its business
affairs and to its duty of care to employees, customers and stakeholders. Breaches of the Code of Conduct may lead to
disciplinary action, as outlined in the Company’s Unacceptable Performance and Misconduct System.
The Company’s Integrity Policy expands on the Company’s commitment to conducting its business in a legal, honest
and ethical manner by:
• Prohibiting bribery and corruption in all forms. Employees must not commit, or be a party to, or be involved in
bribery or corruption.
• Ensuring that gifts, entertainment, travel and per diem reimbursements are not given or received as a reward or
encouragement for preferential treatment.
• The Company not participating in party politics. The Company does not make payments to political parties or
individual politicians.
• Not making charitable donations or sponsorships that could be perceived as bribes or payments to gain an improper
business advantage.
• Employees ensuring their personal activities and interests do not conflict with their responsibilities to the Company.
• Requiring third parties who act on the Company’s behalf to comply with the Integrity Policy and the Integrity Standard.
• Requiring all employees to confront inappropriate behaviour in others.
• Including demonstrating the “Base Way” as a specific accountability in every role description.
The Integrity Standard further sets out the responsibilities and limits of discretion of the Company’s personnel in observing
and upholding the absolute prohibition on bribery, corruption and related improper conduct and provides information and
guidance on how to recognise and deal with instances of potential bribery and corruption. A breach of the Integrity Standard
by a member of the Company’s personnel will be regarded as serious misconduct, and will lead to disciplinary action which may
include termination of employment. The Company also has a Whistleblower System providing a confidential mechanism for
employees to hold their leaders and co-workers accountable if not behaving with absolute integrity.
The Company is a signatory to the Extractive Industries Transparency Initiative (EITI), which was launched in 2002 at the World
Summit for Sustainable Development. The EITI has put in place a reporting system to encourage transparency and accountability
in the receipt and use by Governments of revenues from extractive industries. EITI supports good governance through the
verification and full publication of payments by companies and use of government revenues derived from oil, gas and mining.
The Company provides these publications via the governance section of the Base Titanium website (www.basetitanium.com).

58 / BASE RESOURCES / ANNUAL REPORT 2018
Securities ownership and dealing
The Company’s Securities Trading Policy (which was last updated with effect from 1 September 2016) applies to Directors and
employees of the Company and its subsidiaries. This policy provides summary of the law on insider trading and sets out the
policy requirements for the sale, purchase and conversion/exercise of the Company’s securities by Directors and employees.
The purpose of the policy is to:
• assist Directors and employees to avoid conduct known as “insider trading”;
• explain the type of conduct in relation to dealings in securities of the Company that is prohibited under the Corporations
Act and the European Union’s Market Abuse Regulation; and
• establish a procedure relating to dealing in the Company’s securities that provides best practice protection to the Company,
its Directors and employees against the misuse of unpublished information which could materially affect the price or value of
the Company’s securities.
Any dealing in the Company’s securities by Directors is notified to ASX, and any dealing by directors or other persons
discharging management responsibility is notified to AIM and the United Kingdom’s Financial Conduct Authority, without
delay. Directors and employees participating in equity-based incentive plans are also prohibited from entering into any
transaction which would have the effect of hedging or otherwise transferring to any other person the risk of any fluctuation
in the value of any unvested entitlement in the Company’s securities.
Strict compliance with the Securities Trading Policy is mandatory for all Directors and employees of the Company and its
subsidiaries. Any breach of this policy is taken seriously and is subject to disciplinary action, including possible termination of
a person’s employment or appointment.
Risk management and internal controls
Approach to risk management internal controls
The Company recognises that risk is an integral and unavoidable component of its business and is characterised by both risk
and opportunity. The effective management of risk enables the Company to enhance opportunities, reduce threats and in
so doing represent a source of competitive advantage. The Company is committed to managing risk in a proactive manner
that is integrated throughout the business and informs all decision making as part of day to day management.
Risk management roles and responsibilities
The Company established a Risk Committee of the Board in July 2015. The Risk Committee’s role is to assist the Board
in monitoring risk, with a full review and update of the Company’s material business risk register and risk management
framework typically occurring for each Committee meeting, and at least annually.
The Company does not have a formal internal audit function, however it has a well-established Risk Management Framework.
The Risk Committee annually reviews the need for a formal internal audit function from a risk management perspective,
which is also considered by the Audit Committee from an assurance perspective. When last considered at the June 2018
Audit Committee meeting and subsequently considered by the Board, it was determined that a formal internal audit process
was not required or justifiable at this time. However, it was noted that current business practice includes significant external
review and assurance of the Company’s key risk areas. It was therefore determined to undertake a review of existing external
assurances to understand the coverage and highlight any areas where further assurance may be warranted. This work will be
conducted over the coming year.
The Risk Committee is responsible for reviewing and approving the Company’s Risk Management Framework, Risk
Policy and key risk parameters at least annually, with the Committee having reviewed the Company’s Risk Management
Framework during the year. The Risk Committee is responsible for (amongst other things):
• ensuring that management designs and implements a risk management and internal control system to manage the
Company’s material business risks;
Corporate governance (cont.)

BASE RESOURCES / REMUNERATION REPORT / 59
• reviewing at least annually the Company’s risk management and internal control system and reporting to the Board on
its efficiency and effectiveness;
• reviewing the risk reports produced by management and reviewing the efficiency and effectiveness of that risk
management and internal control system;
• developing and maintaining a risk register which identifies the material business risks to the Company and its operations
(including economic, environmental and social sustainability risks) and assessing the likelihood of their occurrence;
• periodically reviewing the scope and adequacy of the Company’s insurance, having regard to the Company’s business and
its associated insurable risks;
• overseeing the Company’s operational and environmental risk management and occupational health and safety processes; and
• overseeing procedures for whistleblower protection.
Management is responsible for promoting and applying the Risk Policy, which involves establishing a risk-aware culture,
identifying and assessing business and operational risks, developing and implementing appropriate risk strategies,
systems and controls, monitoring the effectiveness of risk controls and reporting on risk management and performance.
Management also maintains the Material Business Risk Register.
The Company is exposed to several risks across its business, which it seeks to manage in a manner consistent with its Risk
Management Framework. These risks are categorised by the Company as strategic (e.g. the Company’s ability to execute its
growth strategy, access to exploration opportunities), financial (e.g. funding continuity), regulatory (e.g. political, mining and
fiscal policy) or operational (e.g. community, safety, security, human resources and production).
The Company has identified that it has a material exposure to certain environmental and social sustainability risks associated
with its operation of the Kwale Project and its development of the Toliara Project. Communities affected by the Kwale Project
and the Toliara Project play an integral role in the Company’s overall success, which the Company seeks to achieve through a
structured and integrated community engagement approach. The Company strives to build lasting and beneficial relationships
with the communities in which is operates. By supporting equitable development, the Company seeks to establish a model for
future development opportunities in Kenya, Madagascar and beyond, in a manner that emphasises the value of local community
participation and recognises their respective and diverse cultural heritage. The Company’s Communities Policy is based on
working together in a way that allows broad participation of affected people through mutual respect and demonstrates the
Company’s long-term commitment to delivering real, tangible and sustainable benefits. The Company’s social management
systems have been prepared to the highest international standards to guide the Company in achieving this objective.
The Company is also committed to undertaking its activities in a way that minimises impact on the environment. The Company’s
Environmental Policy and the “Base Way” drive the Company’s commitment to preventing pollution, minimising impacts,
contributing to protecting and conserving biodiversity and driving environmentally responsible behaviour.
The Company believes that good environmental performance contributes to business success. The Company empowers its
employees to work in an environmentally responsible manner and encourages everyone to take responsibility in this regard.
The Company works in partnership with its host communities, conservation groups and environmental experts to realise
its objectives and regularly reviews environmental performance to achieve continuous improvement. A comprehensive
understanding of the environmental impacts during design, construction, operations and ultimately closure of the Kwale
Project and the Toliara Project direct the Company’s environmental programs. Management of the Company’s environmental
function is based on an environmental management system as guided by the Environmental Policy. Refer to pages 11 to
15 of the Annual Report for more detail on the Company’s current sustainability practices.

60 / BASE RESOURCES / ANNUAL REPORT 2018
CEO and CFO assuranceThe Board receives monthly reports on the group’s financial and operational results. Before adoption by the Board of
the 31 December 2017 half-year and 30 June 2018 full-year financial statements, the Audit Committee and the Board
received written declarations from the Managing Director and the Chief Financial Officer that, in their opinion, the financial
records of the Company had been properly maintained and the financial statements comply with the appropriate accounting
standards and give a true and fair view of the financial position and performance of the Company and that their opinion had
been formed on the basis of a sound system of risk management and internal control which was operating effectively.
Diversity
The Company values and encourages a diverse workforce and provides a work environment in which everyone is treated
fairly, with respect and can realise their full potential. As set out further in the Company’s Employment Policy, the Company
seeks to achieve this by:
• Employing on the basis of job requirements and merit without discriminating on the grounds of age, ethnic or social
origin, gender, sexual orientation, politics or religion.
• Ensuring its people are trained to work, and then working, in safe, healthy and environmentally responsible ways.
• Requiring managers to be models of the highest standards of behaviour and to demonstrate visible leadership.
The Company’s employees must treat each other and those they deal with externally with dignity, fairness and respect.
The Company’s employees must guard against harassment in the workplace.
• Maintaining codes of conduct and performance standards that establish sound conditions of work and disciplinary
procedures in compliance with all applicable laws and which uphold human rights principles. Remuneration and incentive
systems are equitable and transparent.
• Establishing and developing integrated employment management systems that seek to elevate employee engagement
within the Company to a recognised competitive advantage.
• Including demonstrating the “Base Way” as a specific accountability in every employee’s role description.
A key focus of the Company since before commencement of Kwale Project operations in late 2013 has been establishment
of an operational workforce that delivers on commitments to maximise employment opportunities for local communities,
whilst achieving the highest standards of operational and safety performance. As at 30 June 2018, the Company is
pleased to report that it employed 97% Kenyan national employees at Kwale. This ratio evidences the effectiveness of
the Company’s systems which are designed to drive a structured transfer of skills over time. While the Company is in the
early stages of the proposed development of the Toliara Project, there will be a similar focus on maximising employment
opportunities for local communities against the backdrop of achieving the necessarily high standards of operational and
safety performance.
While the primary focus to date has been on maximising local participation, workforce establishment and performance
enhancement, in July 2015 the Company’s Diversity Standard was revised to require that the Board set measurable
objectives for achieving gender diversity, for those objectives to be reviewed annually and for the Board to assess annually
progress in achieving those objectives.
The Board set the following measurable objectives which applied for the financial year ended 30 June 2018:
• Increase the overall percentage of women employed by the group.
• Maintain female representation in the intake for graduate and apprentice programs at or above one third, subject
to the constraint of the operation of the Company’s established system for prioritising employment opportunities
to local communities.
Corporate governance (cont.)

BASE RESOURCES / REMUNERATION REPORT / 61
• Subject to vacancies, increase the percentage of women in executive roles (Stratum III and above).
• Subject to vacancies, to consider diversity when reviewing Board succession plans with the aim to further balance gender
representation and achieve greater diversity.
The above objectives were considered appropriate for the Company given its current state of operations, in particular
reflecting the relative stability of the Company’s workforce which naturally reduces the opportunities to increase gender
diversity as rapidly going forward. However, this is something that will be considered further as the Company progresses
development of its Toliara Project.
For the financial year ended 30 June 2018, the group met its objectives, achieving a slight increase in the overall percentage
of women employed, maintained female representation in the intake for graduate and apprentice programmes at or above one
third, increased the percentage of women in executive roles and increased Board gender diversity following the appointment
of Ms Radley in February 2018.
The Company considers that, given the relatively low turnover of senior employees, the group’s graduate and apprenticeship
programmes continue to represent the greatest opportunity to increase female representation within the Company over time
– particularly at executive level.
Shown below is the Company’s performance in achieving its set objectives during the year ended 30 June 2018, as compared
to the two prior periods.
ObjectiveFY2016
(%)FY2017
(%)FY2018
(%)Change FY17 to
FY18 (%)
Increase the overall percentage of women 112/684 16.4%
117/717 16.3%
139/829 16.8%
0.5%
Female representation in graduate and apprentice programs at or above one third
11/39 28.2%
10/21 47.6%
11/33 33.3%
(14.3)%
Women in executive roles (Stratum III and above) 3/21 14.3%
3/22 13.6%
4/28 14.3%
0.7%
Board gender diversity 0% 0% 14% 14%
The Board has determined to maintain the existing measurable objectives for the coming financial year. The Board will
report progress in achieving the revised objectives in next year’s corporate governance statement.
Availability of key corporate governance documentsThe following suite of the Company’s key corporate governance policies and procedures are available from the Company’s
website at http://www.baseresources.com.au/company-profile/governance/.
• Constitution
• Board Governance Plan (including Board Committee Charters)
• Code of Conduct
• Securities Trading Policy
• Continuous Disclosure and Market Communications Policy
• Risk Management Policy
• Environment Policy
• Communities Policy
• Employment Policy
• Diversity Standard
• Health and Safety Policy

62 / BASE RESOURCES / ANNUAL REPORT 2018
FINANCIAL STATEMENTS AND NOTES

BASE RESOURCES / LEAD AUDITOR'S INDEPEDENCE DECLARATION / 63
Lead Auditor’s Independence Declaration
KPMG, an Australian partnership and a member firm of the KPMG network of independent member firms affiliated with KPMG International Cooperative (“KPMG International”), a Swiss entity.
Liability limited by a scheme approved under Professional Standards Legislation.
Lead Auditor’s Independence Declaration under
Section 307C of the Corporations Act 2001
To the Directors of Base Resources Limited
I declare that, to the best of my knowledge and belief, in relation to the audit of Base Resources Limited for the financial year ended 30 June 2018 there have been:
i. no contraventions of the auditor independence requirements as set out in the Corporations Act 2001 in relation to the audit; and
ii. no contraventions of any applicable code of professional conduct in relation to the audit.
KPMG R Gambitta Partner Perth 25 August 2018

64 / BASE RESOURCES / ANNUAL REPORT 2018
Consolidated statement of profit or loss and other comprehensive incomeFOR THE YEAR ENDED 30 JUNE 2018
Notes2018
US$000s2017(i)
US$000s
Sales revenue 2 198,810 162,417
Cost of sales 2 (119,799) (104,106)
Profit from operations 79,011 58,311
Corporate and external affairs (9,338) (8,236)
Community development costs (3,000) (2,699)
Selling and distribution costs (4,056) (2,030)
Other expenses (765) (92)
Profit before financing costs and income tax 61,852 45,254
Financing costs 2 (18,489) (23,511)
Profit before income tax 43,363 21,743
Income tax expense 4 (9,389) (5,895)
Net profit for the year 33,974 15,848
Other comprehensive income
Items that may be reclassified subsequently to profit or loss:
Foreign currency translation differences - foreign operations (1,197) 1,169
Total other comprehensive (loss) / income for the year (1,197) 1,169
Total comprehensive income for the year 32,777 17,017
Net Earnings per share Cents Cents
Basic earnings per share (US cents per share) 3 3.66 2.14
Diluted earnings per share (US cents per share) 3 3.44 1.98
(i) �Restated�from�AUD�in�previous�financial�statements�in�accordance�with�change�in�presentation�currency.�Refer�to�“Note�1:�Basis�of�preparation”.�
The�accompanying�notes�form�part�of�these�consolidated�financial�statements.

BASE RESOURCES / CONSOLIDATED FINANCIAL STATEMENTS / 65
Consolidated statement of financial position AS AT 30 JUNE 2018
Notes2018
US$000s2017(i)
US$000s2016(ii)
US$000s
Current assets
Cash and cash equivalents 29,686 28,278 26,923
Restricted cash 6 29,591 26,166 22,077
Trade and other receivables 7 38,726 44,056 32,300
Inventories 8 19,789 18,517 20,742
Other current assets 5,993 4,528 4,322
Total current assets 123,785 121,545 106,364
Non-current assets
Capitalised exploration and evaluation 9 97,115 2,038 1,103
Property, plant and equipment 10 240,509 257,213 289,521
Total non-current assets 337,624 259,251 290,624
Total assets 461,409 380,796 396,988
Current liabilities
Trade and other payables 11 27,865 20,696 18,510
Borrowings 12 53,266 59,211 45,854
Provisions 13 1,581 1,304 870
Deferred revenue 833 833 833
Other liabilities 14 7,058 646 658
Total current liabilities 90,603 82,690 66,725
Non-current liabilities
Borrowings 12 35,532 88,112 145,605
Provisions 13 22,458 22,219 21,492
Deferred tax liability 4 15,106 5,846 -
Deferred revenue 625 1,458 2,292
Other liabilities 14 10,000 - -
Total non-current liabilities 83,721 117,635 169,389
Total liabilities 174,324 200,325 236,114
Net assets 287,085 180,471 160,874
Equity
Issued capital 15 305,277 231,079 229,747
Reserves (16,384) (14,267) (15,324)
Accumulated losses (1,808) (36,341) (53,549)
Total equity 287,085 180,471 160,874
(i) Restated�from�AUD�in�previous�financial�statements�in�accordance�with�change�in�presentation�currency.�Refer�to�“Note�1:�Basis�of�preparation”.(ii) Opening�balances�as�at�1�July�2016�are�reported�due�to�change�in�presentation�currency.�Refer�to�“Note�1:�Basis�of�preparation”.�
The�accompanying�notes�form�part�of�these�consolidated�financial�statements.

66 / BASE RESOURCES / ANNUAL REPORT 2018
Consolidated statement of changes in equity FOR THE YEAR ENDED 30 JUNE 2018
Issued Capital US$000s
Accumulated Losses
US$000s
Share based payment
reserve US$000s
Foreign currency
translation reserve
US$000s
Treasury shares reserve
US$000sTotal
US$000s
Balance at 1 July 2016(i) 229,747 (53,549) 5,362 (20,686) - 160,874
Profit for the year - 15,848 - - - 15,848
Other comprehensive income - - - 1,169 - 1,169
Total comprehensive income for the year - 15,848 - 1,169 - 17,017
Transactions�with�owners,�recognised�directly�in�equity
Shares issued during the year, net of costs 1,332 - - - - 1,332
Share based payments - 1,360 (112) - - 1,248
Balance at 30 June 2017(i) 231,079 (36,341) 5,250 (19,517) - 180,471
Balance at 1 July 2017 231,079 (36,341) 5,250 (19,517) - 180,471
Profit for the year - 33,974 - - - 33,974
Other comprehensive income - - - (1,197) - (1,197)
Total comprehensive income for the year - 33,974 - (1,197) - 32,777
Transactions�with�owners,�recognised�directly�in�equity
Shares issued during the year, net of costs 73,669 - - - - 73,669
Own shares acquired - - - - (1,476) (1,476)
Share based payments 529 559 556 - - 1,644
Balance at 30 June 2018 305,277 (1,808) 5,806 (20,714) (1,476) 287,085
(i) �Restated�from�AUD�in�previous�financial�statements�in�accordance�with�change�in�presentation�currency.�Refer�to�“Note�1:�Basis�of�preparation”.�
The�accompanying�notes�form�part�of�these�consolidated�financial�statements.

BASE RESOURCES / CONSOLIDATED FINANCIAL STATEMENTS / 67
Consolidated statement of cash flowsFOR THE YEAR ENDED 30 JUNE 2018
Notes2018
US$000s2017(i)
US$000s
Cash flows from operating activities
Receipts from customers 205,807 151,632
Payments in the course of operations (88,623) (75,008)
Other (42) (32)
Net cash from operating activities 5 117,142 76,592
Cash flows from investing activities
Purchase of property, plant and equipment (32,862) (6,513)
Payments for exploration and evaluation (78,077) (935)
Other 621 284
Net cash used in investing activities (110,318) (7,164)
Cash flows from financing activities
Proceeds from issue of shares 76,133 -
Payment of share issue costs (2,464) -
Purchase of treasury shares 16 (1,476) -
Proceeds from borrowings 12,500 -
Repayment of borrowings (72,553) (47,539)
Transfers to restricted cash 6 (3,425) (4,089)
Payments for debt service costs and re-scheduling fees (13,611) (16,512)
Net cash used in financing activities (4,896) (68,140)
Net increase in cash held 1,928 1,288
Cash at beginning of year 28,278 26,923
Effect of exchange fluctuations on cash held (520) 67
Cash at end of year 29,686 28,278
(i)� �Restated�from�AUD�in�previous�financial�statements�in�accordance�with�change�in�presentation�currency.�Refer�to�“Note�1:�Basis�of�preparation”.�
The�accompanying�notes�form�part�of�these�consolidated�financial�statements.

68 / BASE RESOURCES / ANNUAL REPORT 2018
Notes to the consolidated financial statements
Note 1: Basis of preparation
Base Resources Limited is a company domiciled in Australia. The registered address is located at Level 1, 50 Kings Park Road, West
Perth, WA, 6005. The consolidated financial statements of the Company, as at and for the year ended 30 June 2018, comprises
the Company and its wholly owned subsidiaries (together referred to as the Group). The Group is a for-profit entity and primarily
involved in the operation of the Kwale Mineral Sands Mine in Kenya and development of the Toliara Project in Madagascar.
The consolidated financial statements of the Group for the year ended 30 June 2018:
• is a general purpose financial report prepared in accordance with Australian Accounting Standards (AASBs) adopted by
the Australian Accounting Standards Board (AASB) and the Corporations�Act�2001;
• comply with International Financial Reporting Standards (IFRSs) and interpretations adopted by the International
Accounting Standards Board;
• are presented in United States dollars and all values are rounded to the nearest thousand dollars (US$000s) unless
otherwise stated, in accordance with ASIC instrument 2016/191. The functional currency of the Parent is Australian
dollars, whilst all other subsidiaries are United States dollars.
• have been prepared on an accruals basis and is based on historical costs, modified, where applicable, by the measurement
at fair value of selected non-current assets, financial assets and financial liabilities.
The consolidated financial statements were approved by the Board of Directors on 25th August 2018.
Foreign currency
Functional and presentation currency
The Directors have elected to change the Group’s presentation currency from Australian dollars (AUD) to United States
dollars (USD) effective from 1 July 2017. The change in presentation currency will present more relevant and reliable
information on the Group. Prior period comparatives used in this financial report have been restated to USD using the
procedures outlined below:
• Statement of Profit or Loss and Other Comprehensive Income and Statement of Cash Flows have been translated into
USD using average exchange rates prevailing for the relevant period.
• Assets and liabilities in the Statement of Financial Position have been translated into USD at the closing exchange rates
on the relevant balance sheet dates.
• The equity section of the Statement of Financial Position, including foreign currency translation reserve, retained earnings,
share capital and the other reserves, have been translated into USD using historical exchange rates.
• Earnings per share disclosures have also been restated to USD to reflect the change in presentation currency.
• The functional currency of the Parent is AUD, whilst the presentation currency of the Group is now in USD. All
subsidiaries have a functional currency of USD.
Foreign currency transactions
Transactions in foreign currencies are translated to the respective functional currencies of Group entities at exchange rates
at the dates of the transactions. Monetary assets and liabilities denominated in foreign currencies at the reporting date
are re-translated to the functional currency at the exchange rate at that date. Non-monetary items in a foreign currency
that are measured at historical cost are translated using the exchange rate at the date of the transaction. Foreign currency
differences arising on re-translation are recognised in the Statement of Profit or Loss and Comprehensive Income.

BASE RESOURCES / CONSOLIDATED FINANCIAL STATEMENTS / 69
Critical accounting estimates and judgements
Estimates and judgements used in developing and applying the Group’s accounting policies are continually evaluated and
are based on experience and other factors and are reviewed on an ongoing basis. Revisions to accounting estimates are
recognised in the period in which the estimate is revised. The critical estimates and judgements that have a significant risk
of causing a material adjustment to the carrying amounts of assets and liabilities are discussed in the respective sections
of the Consolidated Financial Statements. To assist in identifying critical accounting judgements, we have highlighted them
with the following formatting:
Ore reserves and resources estimates
The estimated quantities of economically recoverable reserves and resources are based upon interpretations of
geological and geophysical models and require assumptions to be made regarding factors such as future operating
costs, future commodity prices, future capital requirements and future operating performance. Changes in reported
reserves and resources estimates can impact the carrying value of PP&E, provisions for mine closure and rehabilitation
obligations, the recognition of deferred tax assets, as well as the amount of depreciation and amortisation charged to
the Statement of Profit or Loss and Other Comprehensive Income.
Note:�this�is�an�example�presentation.

70 / BASE RESOURCES / ANNUAL REPORT 2018
Notes to the consolidated financial statementsPERFORMANCE FOR THE YEAR
This section analyses the financial performance of the Group for the year ended 30 June 2018. It includes segment
performance, earnings per share and taxation.
Note 2: Segment reporting
Segment Principal activities
Kwale Operation The Group’s 100% owned Kwale Operation is located in Kenya and generates revenue from the sale of rutile, ilmenite and zircon.
Toliara Project The Toliara Project in Madagascar was acquired in January 2018. The Project is progressing through an accelerated feasibility study program that aims to advance toward a decision to proceed to construction in the second half of 2019.
Other Includes Group head office, all corporate expenditure not directly attributable to the Kwale Operation or Toliara Project and exploration activities not directly related to Kwale Operations or the Toliara Project.
2018 2017
Reportable segment
Kwale Operation
US$000s
Toliara Project
US$000sOther
US$000sTotal
US$000s
Kwale Operation
US$000sOther
US$000sTotal
US$000s
Sales revenue 198,810 - - 198,810 162,417 - 162,417
Cost of sales:
Operating costs (56,658) - - (56,658) (51,816) - (51,816)
Inventory movement (2,114) - - (2,114) (3,794) - (3,794)
Royalties expense (13,678) - - (13,678) (11,141) - (11,141)
Depreciation and amortisation (47,349) - - (47,349) (37,355) - (37,355)
Total cost of sales (119,799) - - (119,799) (104,106) - (104,106)
Profit from operations 79,011 - - 79,011 58,311 - 58,311
Corporate and external affairs (4,312) (87) (4,939) (9,338) (3,983) (4,253) (8,236)
Community development costs (3,000) - - (3,000) (2,699) - (2,699)
Selling and distribution costs (4,056) - - (4,056) (2,030) - (2,030)
Other income / (expenses) 28 (704) (89) (765) 352 (444) (92)
Profit before financing and tax 67,671 (791) (5,028) 61,852 49,951 (4,697) 45,254
Financing costs:
Interest expense, inclusive of withholding tax
(10,276) - (608) (10,884)(12,756) (1,693) (14,449)
Amortisation of capitalised borrowing costs
(2,280) - (1,208) (3,488)(2,572) (2,530) (5,102)
Unwinding of discount on provision for rehabilitation
(481) - - (481)(1,445)
-(1,445)
Other (2,892) - (744) (3,636) (2,491) (24) (2,515)
Total financing costs (15,929) - (2,560) (18,489) (19,264) (4,247) (23,511)
Income tax expense (9,389) - - (9,389) (5,895) - (5,895)
Reportable profit 42,353 (791) (7,588) 33,974 24,792 (8,944) 15,848

BASE RESOURCES / CONSOLIDATED FINANCIAL STATEMENTS / 71
2018 2017
Reportable segment
Kwale Operation
US$000s
Toliara Project
US$000sOther
US$000sTotal
US$000s
Kwale Operation
US$000sOther
US$000sTotal
US$000s
Other disclosures:
Capital expenditure 31,189 79,060 691 110,940 7,181 268 7,449
Total assets 361,955 94,433 5,021 461,409 376,770 4,026 380,796
Total liabilities 144,223 17,157 12,944 174,324 188,090 12,235 200,325
Determination and presentation of operating segments
Operating segments are components of the Group about which separate financial information is available that is evaluated
regularly by the Group’s senior executives in deciding how to allocate resources and in assessing performance.
The division of the Groups results into segments has been ascertained by identification of revenue / cost centres and
where interrelated segment costs exist, an allocation has been calculated on a pro rata basis.
Recognition and measurement of revenue
The Group sells mineral sands under a range of International Commercial Terms (Incoterms). Product sales are recognised
as revenue when the Group has transferred both the significant risks and rewards of ownership and control of the products
sold and the amount of revenue can be measured reliably. The passing of risk to the customer is usually realised at the
point that the physical control is transferred from the Group to the customer. The Incoterms set out the point at which the
transfer of risk to the customer takes place and are the ultimate determinant.
Contract terms for the Group’s rutile sales allow for a retrospective final price adjustment after shipment, based on average
market prices in the quarter that the product is shipped. Average market prices are derived from an independently published
quarterly dataset of all rutile trades, available approximately four months after the end of each quarter. Sales made under
these terms that have not yet been subject to a final price adjustment are recognised at the estimated fair value of the total
consideration receivable, which takes into account the latest available market data at the balance date. As a result, rutile
sales revenue of US$20.5 million is still subject to final market pricing at 30 June 2018 (2017: US$30.7 million).
Finance income and expenses
Financing income includes interest income on cash held and is recognised as it accrues. Financing expenses include:
• Interest on borrowings;
• Amortisation of costs incurred to establish the borrowings;
• Finance lease charges; and
• The unwinding of discount on provisions for mine closure and rehabilitation.
Financing expenses are calculated using the effective interest rate method. Finance expenses incurred for the development
of mining projects are capitalised up to the point at which commercial production is achieved. Other financing expenses are
expensed as incurred.

72 / BASE RESOURCES / ANNUAL REPORT 2018
Note 3: Earnings per share2018
US$000s2017
US$000s
Earnings used to calculate basic / diluted earnings per share 33,974 15,848
a) Weighted average number of ordinary shares on issue used in the calculation of basic earnings per share
in�thousands�of�shares 2018 2017
Issued ordinary shares at 1 July 742,232 732,232
Effect of performance rights vested under the Group’s LTIP 3,643 -
Effect of share placement 69,390 -
Effect of renounceable entitlement offer 113,657 -
Effect of shares issued as consideration for Taurus facility extension - 6,657
Weighted average number of ordinary shares at 30 June 928,922 738,889
b) Weighted average number of ordinary shares on issue used in the calculation of diluted earnings per share
in�thousands�of�shares 2018 2017
Weighted average number of ordinary shares (basic) 928,922 738,889
Effect of performance rights on issue 58,057 62,072
Weighted average number of ordinary shares (diluted) at 30 June 986,979 800,961
Note 4: Income tax2018
US$000s2017
US$000s
a) Amounts recognised in profit or loss
Current�income�tax
Income tax expense 129 48
Deferred�tax�expense
Origination and reversal of temporary differences 9,260 5,847
Income tax expense reported in comprehensive income 9,389 5,895
b) Reconciliation of income tax expense to prima facie tax payable
The�prima�facie�tax�payable�on�loss�from�ordinary�activities�before�tax�is�reconciled�to�the� income�tax�expense�as�follows:
Accounting profit before tax 43,363 21,743
Prima facie tax on operating profit at 30% (2017: 30%) 13,009 6,523
Add / (less) tax effect of:
Non-deductible items 2,256 2,797
Share based payments 253 208
Tax losses not recognised 1,649 1,371
Other deferred tax assets not brought to account as realisation not considered probable 1,767 990
Effect of tax rates in foreign jurisdictions(i) (9,545) (5,994)
Income tax attributable to operating profit 9,389 5,895
(i) The�Kenyan�tax�rate�applicable�to�Base�Titanium�Limited�is�15%�(2017:�15%)
Notes to the consolidated financial statements - performance for the year (cont.)

BASE RESOURCES / CONSOLIDATED FINANCIAL STATEMENTS / 73
2018 US$000s
2017 US$000s
c) Deferred tax recognised
Tax losses Kenya 5,638 20,382
Other 1,543 1,198
7,181 21,580
Deferred tax recognised
Property, plant and equipment (22,287) (27,426)
Net deferred tax liability recognised (15,106) (5,846)
d) Deferred tax assets unrecognised
Deductible temporary differences 313 257
Tax losses Australia 6,819 6,099
Tax losses other 231 68
7,363 6,424
Potential deferred tax assets attributable to tax losses and exploration expenditure carried forward, excluding those
recognised for Kwale Operations, have not been brought to account at 30 June 2018 and 2017 because the directors do
not believe it is appropriate to regard realisation of the deferred tax assets as probable at this point in time.
These benefits will only be obtained if:
1. The Group derives future assessable income of a nature and of an amount sufficient to enable the benefit from the
deductions for the loss and exploration expenditure to be realised;
2. The Group continues to comply with conditions for deductibility imposed by law; and
3. No changes in tax legislation adversely affect the Group in realising the benefit from the deductions for the loss and
exploration expenditure.
Recoverability of deferred tax assets
Balances related to taxation disclosed are based on the best estimates of directors. These estimates take into account
both the financial performance and position of the Group as they pertain to current income taxation legislation, and
the directors understanding thereof. No adjustment has been made for pending or future taxation legislation. The
current income tax position represents the directors’ best estimate, pending an assessment by the tax authorities in
Australia and jurisdictions where it has foreign operations.
A deferred tax asset is recognised for unused tax losses only if it is probable that future taxable profits will be available
to utilise those losses. Determination of future taxable profits requires estimates and assumptions as to future events
and circumstances, in particular, whether successful development and commercial exploitation, or alternatively, sale of
the respective areas of interest will be achieved. This includes estimates and judgements about commodity prices,
exchange rates, future capital requirements, future operational performance and the timing of estimated cash flows.
Changes in these estimates and assumptions could impact on the amount and probability of estimated taxable profits
and accordingly the recoverability of deferred tax assets.

74 / BASE RESOURCES / ANNUAL REPORT 2018
Recognition and measurement of income taxes
The income tax expense / benefit for the year comprises current income tax expense / benefit and deferred tax
expense / benefit.
Current income tax expense charged to the Statement of Profit or Loss and Other Comprehensive Income is the expected
tax payable or recoverable on the taxable income or loss calculated using applicable income tax rates enacted, or
substantially enacted, as at reporting date, and any adjustment to tax payable in respect of previous years. Deferred income
tax expense reflects movements in deferred tax asset and liability balances during the year as well as unused tax losses.
Current and deferred income tax expense / benefit is charged or credited directly to equity instead of the Statement of
Profit or Loss and Other Comprehensive Income when the tax relates to items that are credited or charged directly to equity.
Current tax assets and liabilities are measured at the amounts expected to be paid to / recovered from the relevant
taxation authority.
Deferred tax assets and liabilities are ascertained based on temporary differences arising between the tax bases of assets
and liabilities and their carrying amounts in the financial statements.
Deferred tax assets and liabilities are calculated at the tax rates that are expected to apply to the period when the asset is
realised or the liability is settled, based on tax rates enacted or substantively enacted at reporting date. Their measurement also
reflects the manner in which management expects to recover or settle the carrying amount of the related asset or liability.
Deferred tax assets relating to temporary differences and unused tax losses are recognised only to the extent that it is
probable that future taxable profit will be available against which the benefits of the deferred tax asset can be utilised.
Note 5: Operating cashflows
The Group’s operating cashflow reconciled to profit after tax is as follows:
2018 US$000s
2017 US$000s
Profit for the year 33,974 15,848
Depreciation and amortisation 47,349 37,355
Share based payments 1,835 1,248
Financing costs classified as financing activity 18,489 23,511
Amortisation of deferred revenue (833) (833)
Income tax expense 9,389 5,895
Changes in assets and liabilities:
Decrease / (increase) in receivables and other assets 3,924 (12,047)
(Increase) / decrease in inventories (1,271) 2,225
Increase in trade and other payables 4,427 3,333
(Decrease) / increase in provisions (141) 57
Cash flow from operations 117,142 76,592
Notes to the consolidated financial statements - performance for the year (cont.)

BASE RESOURCES / CONSOLIDATED FINANCIAL STATEMENTS / 75
Notes to the consolidated financial statements OPERATING ASSETS AND LIABILITIES
This section presents information about the Group’s assets and liabilities, including its policies and processes for measuring
and estimating these balances.
Note 6: Restricted cash2018
US$000s2017
US$000s2016
US$000s
Current
Restricted cash 29,591 26,166 22,077
Under the terms of the Kwale Facility, sufficient funds are required to be held on account in order to meet the debt
servicing requirements of the next six months.
Note 7: Trade and other receivables2018
US$000s2017
US$000s2016
US$000s
Current
Trade receivables 16,912 24,344 13,534
VAT receivables 21,321 19,657 18,692
Other receivables 493 55 74
38,726 44,056 32,300
Recoverability of construction period VAT receivable
The Group is owed US$21.3 million in VAT receivable by the Government of Kenya, of which US$17.1 million was
incurred during the construction of Kwale Operations and is overdue but not impaired. An estimation has been made
as to the timing of the receipt of this amount and forms the basis for its classification as a current asset.
Note 8: Inventories2018
US$000s2017
US$000s2016
US$000s
Current
Heavy mineral concentrate and other intermediate stockpiles (at cost) 4,717 4,674 6,717
Finished goods stockpiles – at cost 4,720 3,428 5,179
Stores and consumables – at cost 10,352 10,415 8,846
19,789 18,517 20,742
Net realisable value of inventories
Inventories are recognised at the lower of cost and net realisable value (NRV).
NRV is based on the estimated amount expected to be received when the product is sold, less all costs still to be
incurred in converting the relevant inventory to a saleable product, and delivering it to the customer. The computation
of NRV for inventories of heavy mineral concentrate and finished product involves significant judgements and
estimates in relation to timing of processing, processing costs, transport costs, commodity prices and the ultimate
timing of sale. A change in any of these critical assumptions will alter the estimated NRV and may therefore impact
the carrying value of inventories.

76 / BASE RESOURCES / ANNUAL REPORT 2018
Recognition and measurement of inventories
Inventories of heavy mineral concentrate and finished product are valued on a weighted average cost basis and include
direct costs and an appropriate portion of fixed and variable overhead expenditure, including depreciation and amortisation.
Inventories of consumable supplies and spare parts to be used in production are valued at weighted average cost. Obsolete
or damaged inventories are valued at NRV. A regular and ongoing review is undertaken to establish the extent of surplus
items, and a provision is made for any potential loss on their disposal.
Note 9: Capitalised exploration and evaluation2018
US$000s2017
US$000s2016
US$000s
Toliara Project – Madagascar (a) 94,250 - -
Kenya 2,399 1,910 1,103
Tanzania 466 128 -
Closing carrying amount 97,115 2,038 1,103
2018 US$000s
2017 US$000s
Movement in carrying amount
Opening balance 2,038 1,103
Toliara Project acquisition: up-front consideration 75,000 -
Toliara Project deferred consideration recognised 17,000 -
Other exploration and evaluation expenditure during the period 3,077 935
97,115 2,038
(a) Toliara Project - Madagascar
In January 2018, the Company completed the acquisition of the Toliara Project in Madagascar, with payment of US$75.0 million
in up-front consideration, for an initial 85% interest. The Company will acquire the remaining 15% interest, with a further
US$17.0 million (deferred consideration) payable on achievement of key milestones, as the project advances to mine development.
If the key milestones have not been achieved within two years, the remaining 15% interest automatically transfers to the Company,
however payment of deferred consideration remains payable on achievement of key milestones.
Despite retaining a 15% interest for up to two years, the seller will not contribute any development funding and will not have
access to the returns associated with their ownership stake. The Company has applied the anticipated acquisition method,
which treats the 15% non-controlling interest as already owned and the US$17.0 million is included as a component of the
Toliara Project asset value. This consequently requires that the financial liability associated with the 15% non-controlling
interest is recognised at the acquisition date. An estimation has been made as to the timing of payment of the future
consideration, which has resulted in a current and non-current liability being recognised (see note 14). The acquisition is
accounted for as an asset acquisition.
Recognition and measurement of exploration and evaluation expenditure
Exploration for and evaluation of mineral resources is the search for mineral resources after the entity has obtained legal
rights to explore in a specific area, as well as the determination of the technical feasibility and commercial viability of
extracting the mineral resource. Accordingly, exploration and evaluation expenditure are those expenditures incurred by
the Group in connection with the exploration for and evaluation of mineral resources before the technical feasibility and
commercial viability of extracting a mineral resource are demonstrable.
Notes to the consolidated financial statements - operating assets and liabilities (cont.)

BASE RESOURCES / CONSOLIDATED FINANCIAL STATEMENTS / 77
Accounting for exploration and evaluation expenditure is assessed separately for each ‘area of interest’. An ‘area of interest’
is an individual geological area which is considered to constitute a favourable environment for the presence of a mineral
deposit or has been proved to contain such a deposit.
For each area of interest, the expenditure is recognised as an exploration and evaluation asset when the rights of tenure
to that area of interest are current and the expenditure is expected to be recouped through successful development and
exploitation of an area of interest, or alternatively by its sale, and where activities in the area have not yet reached a stage
that permits reasonable assessment of the existence of economically recoverable reserves.
General and administrative costs are allocated to, and included in, the cost of exploration and evaluation assets only to
the extent that those costs can be related directly to operational activities in the area of interest to which the exploration
and evaluation assets relate. In all other instances, these costs are expensed as incurred.
Accumulated costs in relation to an abandoned area are written off in full to the Statement of Profit or Loss and Other
Comprehensive Income in the year in which the decision to abandon the area is made.
Impairment testing of exploration and evaluation assets
Exploration and evaluation assets are assessed for impairment if sufficient data exists to determine technical feasibility
and commercial viability or facts and circumstances suggest that the carrying amount exceeds the recoverable amount.
Note 10: Property, plant and equipment
2018Plant & equipment
US$000s
Mine property and development
US$000sBuildings US$000s
Capital work in progress US$000s
Total US$000s
At cost 220,156 178,642 6,274 920 405,992
Accumulated depreciation (100,292) (62,790) (2,401) - (165,483)
Closing carrying amount 119,864 115,852 3,873 920 240,509
Reconciliation of carrying amounts:
Balance at 1 July 2017 144,675 106,901 4,541 1,096 257,213
Additions 1,870 29,871 105 890 32,736
Transfers 1,004 - 49 (1,053) -
Disposals (9) - (214) - (223)
Reduction in mine rehabilitation asset - (972) - - (972)
Depreciation expense (27,676) (18,914) (608) - (47,198)
Effects of movement in foreign exchange - (1,034) - (13) (1,047)
Balance at 30 June 2018 119,864 115,852 3,873 920 240,509
2017
At cost 217,300 151,223 6,395 1,096 376,014
Accumulated depreciation (72,625) (44,322) (1,854) - (118,801)
Closing carrying amount 144,675 106,901 4,541 1,096 257,213
Reconciliation of carrying amounts:
Balance at 1 July 2016 164,476 118,446 5,005 1,594 289,521
Additions 1,048 2,033 1 2,205 5,287
Transfers 1,460 1,225 18 (2,703) -
Disposals (19) 29 - - 10
Reduction in mine rehabilitation asset - (1,261) - - (1,261)
Depreciation expense (22,293) (14,706) (483) - (37,482)
Effects of movement in foreign exchange 3 1,135 - - 1,138
Balance at 30 June 2017 144,675 106,901 4,541 1,096 257,213

78 / BASE RESOURCES / ANNUAL REPORT 2018
Impairment of assets
At each reporting date, the Group reviews the carrying values of its assets to determine whether there is any
indication those assets have been impaired. When impairment indicators are identified, the Group determines the
recoverable value of the cash-generating unit to which the assets are allocated, via an estimation of the fair value of
the cash-generating unit. Estimating the fair value amount requires management to make an estimate of expected
future cash flows from the cash-generating unit over the forecast period and also to determine a suitable discount
rate in order to calculate the present value of those cash flows. Key estimates supporting the expected future cash
flows include commodity prices, production output and cost forecasts.
Ore reserves and resources estimates
The estimated quantities of economically recoverable reserves and resources are based upon interpretations of
geological and geophysical models and require assumptions to be made regarding factors such as future operating
costs, future commodity prices, future capital requirements and future operating performance. Changes in reported
reserves and resources estimates can impact the carrying value of PP&E, provisions for mine closure and rehabilitation
obligations, the recognition of deferred tax assets, as well as the amount of depreciation and amortisation charged to
the Statement of Profit or Loss and Other Comprehensive Income.
Recognition and measurement of property, plant and equipment
Each class of property, plant and equipment (PP&E) is carried at cost less, where applicable, any accumulated depreciation
and impairment losses.
PP&E is measured on a historical cost basis. Cost includes expenditure that is directly attributable to the acquisition of the
asset. Subsequent costs are included in the asset’s carrying amount or recognised as a separate asset, as appropriate, only
when it is probable that future economic benefits associated with the item will flow to the Group and the cost of the item can
be measured reliably. All other repairs and maintenance are recognised in the Statement of Profit or Loss and Comprehensive
Income during the financial period in which they are incurred.
Any gain or loss on disposal of an item of PP&E is determined by comparing the proceeds from disposal with the carrying
amount, and is recognised net within other income / other expenses in the Statement of Profit or Loss and Other
Comprehensive Income.
Mine property and development assets include costs transferred from exploration and evaluation assets once technical
feasibility and commercial viability of an area of interest are demonstrable, and also includes subsequent development costs
required to bring the mine into production. Any ongoing costs associated with mining which are considered to benefit mining
operations in future periods are capitalised.
Depreciation
All PP&E, except freehold land, is depreciated on a straight line basis over the asset’s useful life to the Group commencing
from the time the asset is held ready for use. The depreciation methods used for each class of depreciable assets are:
Class of plant and equipment Depreciation method
Buildings Straight line at 5% per annum
Plant and equipment Straight line at 10% to 30% per annum
Mine property and development Straight line over remaining mine life
The assets’ residual values and useful lives are reviewed, and adjusted prospectively if appropriate, at each reporting date.
An asset’s carrying amount is written down immediately to its recoverable amount if the asset’s carrying amount is greater
than its estimated recoverable amount.
Notes to the consolidated financial statements - operating assets and liabilities (cont.)

BASE RESOURCES / CONSOLIDATED FINANCIAL STATEMENTS / 79
Note 11: Trade and other payables2018
US$000s2017
US$000s2016
US$000s
Trade payables and accruals 11,889 9,672 11,521
Provision for increase in Government of Kenya royalty (a) 15,976 11,024 6,989
27,865 20,696 18,510
(a) Government of Kenya (GoK) Royalty
The Group is in ongoing discussions with the GoK with respect to the royalty rate payable for the Kwale Operation in the
context of resolution of a number of outstanding issues, including refund of US$17.1 million VAT receivables related to
the construction of Kwale Operations (refer to “Note 7: Trade and other receivables”). Royalty costs are provided for, and
expensed, on the basis of a 5% royalty rate being payable to the GoK, whereas the royalty rate applicable under the terms
of the special mining lease, and currently being paid, is 2.5%.
Note 12: Borrowings2018
US$000s2017
US$000s2016
US$000s
Current
Kwale Facility (a) 53,200 47,500 26,600
Taurus Facility (b) - 11,799 20,000
Capitalised borrowing costs (b) - (4,858) (3,390)
Amortisation of capitalised borrowing costs (b) - 4,398 2,307
Finance lease liabilities 66 372 337
Total current borrowings 53,266 59,211 45,854
Non-current
Kwale Facility (a) 26,773 93,661 153,900
Revolving Credit Facility (c) 12,500 - -
Capitalised borrowing costs (a) (18,395) (17,477) (17,282)
Amortisation of capitalised borrowing costs (a) 14,654 11,862 8,549
Finance lease liabilities - 66 438
Total non-current borrowings 35,532 88,112 145,605
Total borrowings 88,798 147,323 191,459
Recognition and measurement of capitalised borrowing costs
All transaction costs directly attributable to establishing the Debt Facility are capitalised and offset against drawn loan
amounts. Capitalised borrowing costs are amortised over the life of the loan using the effective interest rate method.
(a) Kwale Facility
In November 2011, the Company entered into a debt facility for the development and construction of the Kwale Operation
(Kwale Facility). During the year to 30 June 2018, US$61.2 million was paid down, reducing outstanding debt to US$80.0 million.
Security for the Kwale Facility is a fixed and floating charge over all the assets of Base Titanium Limited (BTL) and the shares
in BTL held by Base Titanium (Mauritius) Limited (BTML) and Base Resources Limited (BRL) and the shares held in BTML by
BRL. In addition, BRL provides a parent guarantee to BTL.
The Kwale Facility carries an interest rate of LIBOR plus 630 basis points, inclusive of political risk insurance. The weighted
average effective interest rate on the Kwale Facility at 30 June 2018 is 8.80% (30 June 2017: 7.72%), with the difference
due movement in the LIBOR rate. The remaining tenor of the loan is two years.

80 / BASE RESOURCES / ANNUAL REPORT 2018
Subsequent to year end, in July 2018, in accordance with the terms of the Kwale Facility, surplus cash of US$14.9 million
was distributed from Kwale Operations (a ‘cash sweep’). Half of the cash sweep (US$7.45 million) went towards mandatory
repayment of the Kwale Facility, with the other half distributed to the parent entity, Base Resources. The outstanding debt
after this repayment was US$72.6 million.
(b) Taurus Facility
In July 2017, Base Resources applied US$11.8 million from Kwale Operations to retire the Taurus Debt Facility.
(c) Revolving Credit Facility (RCF)
In October 2017, the Group established a US$25.0 million Revolving Credit Facility (RCF) to provide the Group with additional
funding flexibility. Both Base Resources and Base Titanium are eligible borrowers under the RCF and the RCF benefits from
the same security package as the Kwale Facility. In January 2018, the RCF was extended to US$30.0 million, as permitted by
the facility terms, to provide Base Resources with additional funding flexibility. All other RCF terms remain unchanged.
The RCF carries an interest rate of LIBOR plus 620 basis points, inclusive of political risk insurance. The weighted average
effective interest rate on the RCF at 30 June 2018 is 8.70%. The remaining tenor of the loan is two years. The outstanding
debt at 30 June 2018 was US$12.5 million.
Note 13: Provisions2018
US$000s2017
US$000s2016
US$000s
Current
Employee benefits 1,146 927 870
Mine closure and rehabilitation 360 360 -
Income tax liability 75 17 -
1,581 1,304 870
Non-current
Mine closure and rehabilitation 22,413 22,176 21,448
Employee benefits 45 43 44
22,458 22,219 21,492
Movement in mine closure and rehabilitation:2018
US$000s2017
US$000s
Balance at 1 July 22,536 21,448
Increase / (decrease) in rehabilitation estimate 7 (357)
Rehabilitation activities (251) -
Unwinding of discount 481 1,445
Balance at 30 June 22,773 22,536
Mine closure and rehabilitation obligations
The calculation of the mine closure and rehabilitation provision requires assumptions such as application of environmental
legislation, plant closure dates, available technologies, engineering costs and inflation and discount rates. A change in any of
the assumptions used may have a material impact on the carrying value of mine closure and rehabilitation obligations.
The mine closure and rehabilitation provision is recorded as a liability at fair value, assuming a risk-free discount rate
equivalent to the 5 year US Government bonds rate of 2.73% as at 30 June 2018 (2017: 1.89%) and an inflation factor
of 1.32% (2017: 1.27%). Although the ultimate amount to be incurred is uncertain, management has, at 30 June 2018,
estimated the asset retirement cost of work completed to date using an expected remaining mine life of 5 years and a total
undiscounted estimated cash flow of US$24,159,245 (2017: US$23,234,044). Management’s estimate of the underlying
asset retirement costs are independently reviewed by an external consultant on a regular basis for completeness.
Notes to the consolidated financial statements - operating assets and liabilities (cont.)

BASE RESOURCES / CONSOLIDATED FINANCIAL STATEMENTS / 81
Recognition and measurement of provisions
Provisions are recognised when the Group has a legal or constructive obligation, as a result of past events, for which
it is probable that an outflow of economic benefits will result and that outflow can be reliably measured.
A mine closure and rehabilitation provision is recognised at the commencement of a mining project and/or construction
based on the estimated costs necessary to meet legislative requirements by estimating future costs and discounting these
to a present value. The provision is recognised as a liability, separated into current (estimated costs arising within twelve
months) and non-current components based on the expected timing of these cash flows. A corresponding asset is included
in mine property and mine development assets, only to the extent that it is probable that future economic benefits
associated with the restoration expenditure will flow to the entity, and is amortised over the life of the mine.
At each reporting date the mine closure and rehabilitation provision is re-measured in line with changes in discount rates
and timing or amounts of the costs to be incurred. Adjustments to the estimated amount and timing of future closure and
rehabilitation cash flows are a normal occurrence in light of the significant judgements and estimates involved and are dealt
with on a prospective basis as they arise.
Changes in the liability relating to mine closure and rehabilitation obligations are added to or deducted from the related
asset (where it is probable that future economic benefits will flow to the entity), other than the unwinding of the discount
which is recognised as a financing expense in the Statement of Profit and Loss and Other Comprehensive Income. Changes
in the asset value have a corresponding adjustment to future amortisation charges.
The mine closure and rehabilitation provision does not include any amounts related to remediation costs associated with
unforeseen circumstances.
Note 14: Other liabilities2018
US$000s2017
US$000s2016
US$000s
Current
Deferred consideration – Toliara acquisition 7,000 - -
Other 58 646 658
7,058 646 658
Non-current
Deferred consideration – Toliara acquisition 10,000 - -
10,000 - -
In January 2018, the Company completed the acquisition of the Toliara Project in Madagascar, with payment of
US$75.0 million in up-front consideration, for an initial 85% interest. The Company will acquire the remaining 15% interest,
with a further US$17.0 million (deferred consideration) payable on achievement of key milestones, as the project advances
to mine development. If the key milestones have not been achieved within two years, the remaining 15% interest automatically
transfers to the Company, however payment of deferred consideration remains payable on achievement of key milestones.
Despite retaining a 15% interest for up to two years, the seller will not contribute any development funding and will not
have access to the returns associated with their ownership stake. The Company has therefore elected to apply the anticipated
acquisition method, which treats the 15% non-controlling interest as already owned and the US$17.0 million is included as a
component of the Toliara Project asset value. This requires that the financial liability associated with the 15% non-controlling
interest is recognised at the acquisition date. An estimation has been made as to the timing of payment of the future
consideration, which has resulted in a current and non-current liability being recognised.

82 / BASE RESOURCES / ANNUAL REPORT 2018
This section presents information about the Group’s financial assets and liabilities, its exposure to financial risks, as well as
its objectives, policies and processes for measuring and managing risks.
Note 15: Issued capital2018
US$000s2017
US$000s2016
US$000s
Ordinary share capital:
Issued and fully paid 305,277 231,079 229,747
Date Number
1 July 2016 732,231,956 229,747
Shares issued as consideration for Taurus Facility extension 10,000,000 231,079
30 June 2017 742,231,956 231,079
1 July 2017 742,231,956 231,079
Partial vesting of 2014 performance rights under LTIP scheme 4,961,983 529
Institutional and retail entitlement offer and placement 380,381,075 76,313
Share issue costs - (2,644)
30 June 2018 1,127,575,014 305,277
All issued shares are fully paid. The Group does not have authorised capital or par value in respect of its issued shares.
The holders of ordinary shares are entitled to receive dividends as declared from time to time and are entitled to one vote
per share at meetings of the Group.
Recognition and measurement of issued capital
Ordinary shares are classified as equity. Incremental costs directly attributable to the issue of ordinary shares and share
options are recognised as a deduction from equity, net of any tax effects.
Note 16: Treasury shares reserve
During the reporting period, the Company directed the Base Resources Long Term Incentive Trust to purchase shares in
the Company on market, for the purpose of meeting the expected vesting of performance rights under the Company’s
LTIP for the cycle vesting on 30 September 2018. The reserve for the Company’s own shares comprises the cost of the
Company’s shares held by the Group. At 30 June 2018, the Group held 6.7 million of the Company’s shares (2017: nil).
Repurchase and reissue of share capital (treasury shares)
When share capital recognised as equity is repurchased, the amount of the consideration paid, which includes directly
attributable costs is recognised as a deduction from equity. Repurchased shares are classified as treasury shares and are
presented in the reserve for own shares. When treasury shares are sold or reissued subsequently, the amount received is
recognised as an increase in equity and the resulting surplus or deficit on the transaction is presented in retained earnings.
Note 17: Share-based payments
(a) Share options
Granted options are as follows:
Grant date Number Issue date
Taurus Funds Management 23 December 2014 30,712,531 23 December 2014
Taurus Funds Management 19 June 2015 30,712,530 19 June 2015
Notes to the consolidated financial statementsCAPITAL STRUCTURE, FINANCIAL INSTRUMENTS AND RISK MANAGEMENT

BASE RESOURCES / CONSOLIDATED FINANCIAL STATEMENTS / 83
Terms of granted options:
In December 2014, the Group executed the Taurus Facility, which entitled Taurus to 61,425,061 unlisted share options over
unissued fully paid shares, for nil consideration and exercisable at A$0.40, with half being issued at execution and half pro-rata
on facility drawdown above US$5 million, which occurred in June 2015. All Taurus options expire on 31 December 2018.
The fair value of the 61,425,061 options granted during the 2015 financial year were estimated at the date of grant using a
Black & Scholes model using the following assumptions: risk-free interest rate of 3%; no dividend yield; volatility factor of the
expected market price of the Company’s shares of 67% and 91% for each issue respectively; and a contractual life of 4 years.
Summary of shares under option are as follows:
Number
Weighted average exercise price
A$
Options outstanding as at 1 July 2016 61,425,061 0.40
Granted - -
Exercised - -
Lapsed - -
Options outstanding and exercisable as at 30 June 2017 61,425,061 0.40
Options outstanding as at 1 July 2017 61,425,061 0.40
Granted - -
Exercised - -
Lapsed - -
Options outstanding and exercisable as at 30 June 2018 61,425,061 0.40
(b) Performance rights
Total expenses arising from share based payment transactions during the year as part of employee benefit expenses was
US$1.6 million (comparative period: US$1.9 million).
Granted performance rights are as follows:
Performance cycle date KMP Other employees Total
Fair value at grant date
A$
1 October 2015 23,775,692 21,972,739 45,748,431 0.0380
1 October 2016 5,890,553 5,623,788 11,514,341 0.1625
1 October 2017 7,309,243 7,380,330 14,689,573 0.2150
All performance rights are granted for nil consideration.
The fair value of the performance rights granted during the 2018 financial year has been estimated at the date of grant
using a Monte Carlo Simulation model using the following assumptions: risk-free interest rate of 1.9%; no dividend yield;
volatility factor of the expected market price of the Company’s shares of 75%; and a remaining life of performance rights
of 2.86 years at valuation date. The fair value of the performance rights is recognised over the service period, which
commenced on the date of grant of 1 October 2017.
The movement in the number of performance rights during the year is set out below:
2018 2017
Opening balance 57,369,478 53,374,002
Granted 14,689,573 11,514,341
Vested 4,961,983 -
Lapsed (5,068,689) (7,518,865)
Closing balance 71,952,345 57,369,478

84 / BASE RESOURCES / ANNUAL REPORT 2018
Recognition and measurement of share based payments
The Group LTIP is an equity settled employee share scheme. The fair value of the equity to which employees become
entitled is measured at grant date and recognised as an expense over the vesting period, with a corresponding increase to
an equity account. The fair value of performance rights is ascertained using a recognised pricing model which incorporates
all market vesting conditions.
Note 18: Financial risk management
The Group’s activities expose it primarily to the following financial risks:
• Market risk consisting of commodity price risk, interest rate risk and currency exchange risk;
• Credit risk; and
• Liquidity risk.
The overall risk management strategy seeks to assist the Group in meeting its financial targets, whilst minimising potential
adverse effects on financial performance. The senior executives of the Group meet on a regular basis to analyse treasury
risks and evaluate treasury management strategies in the context of the prevailing economic conditions and forecasts.
Risk management policies are approved and reviewed by the Risk Committee and the Board on a regular basis.
Financial assets and liabilities of the Group are carried at amortised cost, which approximates fair value.
Recognition and measurement of financial instruments
Non-derivative financial assets
The Group initially recognises loans, receivables and deposits on the date that they are originated. All other financial assets
are recognised initially on the date at which the Group becomes a party to the contractual provisions of the instrument.
The Group derecognises a financial asset when the contractual rights to the cash flows from the asset expire, or it transfers
the rights to receive the contractual cash flows on the financial asset in a transaction in which substantially all the risks and
rewards of ownership of the financial asset are transferred. Any interest in transferred financial assets that is created or
retained by the Group is recognised as a separate asset or liability.
Financial assets and liabilities are offset and the net amount presented in the Statement of Financial Position when, and
only when, the Group has a legal right to offset the amounts and intends either to settle on a net basis or to realise the
asset and settle the liability simultaneously.
Loans and receivables
Loans and receivables are financial assets with fixed or determinable payments that are not quoted in an active market.
Such assets are recognised initially at fair value plus any directly attributable transaction costs. Subsequent to initial
recognition loans and receivables are measured at amortised cost using the effective interest method, less any
impairment losses.
Cash and Cash Equivalents
Cash and cash equivalents include cash on hand and deposits held at call with banks.
Non-derivative financial liabilities
The Group initially recognises financial liabilities on the date at which the Group becomes a party to the contractual
provisions of the instrument. Such liabilities are recognised initially at fair value plus any directly attributable transaction
costs. Subsequent to initial recognition they are measured at amortised cost using the effective interest rate method.
The Group derecognises a financial liability when its contractual obligations are discharged or cancelled or expire.
Notes to the consolidated financial statements - capital structure, financial instruments and risk management (cont.)

BASE RESOURCES / CONSOLIDATED FINANCIAL STATEMENTS / 85
The Group’s financial instruments consist of deposits with banks, accounts receivable and payables. The totals for each
category of financial instruments are as follows:
Notes2018
US$000s2017
US$000s
Financial assets
Cash and cash equivalents 29,686 28,278
Restricted cash 6 29,591 26,166
Trade and other receivables 7 38,726 44,056
98,003 98,500
Financial liabilities
Trade and other payables 11 27,865 20,696
Kwale Facility 12 79,973 141,161
Revolving Credit Facility 12 12,500 -
Taurus Facility 12 - 11,799
Finance lease liabilities 12 66 438
120,404 174,094
Commodity price risk
The Group is exposed to commodity price volatility on rutile sales made under contract terms which allow for a
retrospective final price adjustment based on average market prices in the quarter the product is sold. Average market
prices are derived from an independently published quarterly dataset of all rutile trades, available approximately four
months after the end of each quarter. Sales made under these terms that have not yet been subject to a final price
adjustment are recognised at the estimated fair value of the total consideration receivable, which takes into account the
latest available market data at the balance date.
Rutile sales revenue of US$20.5 million is still subject to final market pricing at 30 June 2018 (2017: US$30.7 million).
An interim adjustment to sales revenue has been recorded at the reporting date to align the estimated fair value of these
sales with the latest available market data. If commodity prices increased / decreased by 10%, with all other variables held
constant, the Group’s after tax profit / loss would have increased / decreased by US$2.1 million (2017: US$3.1 million).
Interest rate risk
All tranches of the Kwale Facility carry interest rates of LIBOR plus 630 basis points, inclusive of political risk insurance.
The Group does not mitigate its interest rate risk exposure to LIBOR through hedging or other means. The weighted
average effective interest rate on the Kwale Facility at 30 June 2018 is 8.80% (30 June 2017: 7.72%).
The RCF carries an interest rate of LIBOR plus 620 basis points, inclusive of political risk insurance. The weighted average
effective interest rate on the RCF at 30 June 2018 is 8.70%.
The majority of the Group’s cash deposits and restricted cash are held in accounts with Nedbank Limited at variable interest
rates, as required by the terms of the Kwale Facility.

86 / BASE RESOURCES / ANNUAL REPORT 2018
Carrying amount Realisable / payable within six months
2018 US$000s
2017 US$000s
2018 US$000s
2017 US$000s
Fixed rate instruments
Financial assets - - - -
Financial liabilities (66) (12,237) - -
(66) (12,237) - -
Variable rate instruments
Financial assets 59,277 54,444 29,686 23,942
Financial liabilities (92,473) (141,161) (26,600) (20,900)
(33,196) (86,717) 3,086 3,042
Cash flow sensitivity analysis for variable rate instruments
A change of 100 basis points in interest rates would have increased or decreased equity and profit or loss by the amounts
shown below. This analysis assumes that all other variables remain constant.
2018 US$000s
2017 US$000s
2018 US$000s
2017 US$000s
Variable rate instruments 100bp increase 100bp decrease 100bp increase 100bp decrease
Profit or loss (332) 332 (867) 867
Equity 332 (332) 867 (867)
Currency risk
The Group is exposed to currency risk from bank balances, payables and receivables that are denominated in a currency
other than the respective functional currencies of Group entities, being USD and AUD.
The USD carrying amount of the Group’s financial assets and liabilities by its currency risk exposure at the reporting date
is disclosed below:
30 June 2018
in US$000s: AUD USD KES Other Total USD
Cash and cash equivalents 2 225 597 4 828
Trade and other receivables - - 21,321 - 21,321
Other current assets - - 371 - 371
Trade and other payables (191) (124) (2,075) (88) (2,478)
Borrowings - (12,500) - - (12,500)
Net exposure (189) (12,399) 20,214 (84) 7,542
30 June 2017
in US$000s: AUD USD KES Other Total USD
Cash and cash equivalents 2 1,024 648 5 1,679
Trade and other receivables - - 19,657 - 19,657
Other current assets - - 179 - 179
Trade and other payables (39) - (963) (38) (1,040)
Borrowings - (11,799) - - (11,799)
Net exposure (37) (10,775) 19,521 (33) 8,676
Notes to the consolidated financial statements - capital structure, financial instruments and risk management (cont.)

BASE RESOURCES / CONSOLIDATED FINANCIAL STATEMENTS / 87
The following significant exchange rates applied during the year:
Average rate 30 June spot rate
2018 2017 2018 2017
USD : AUD 1.290 1.326 1.351 1.301
USD : KES 102.37 102.46 101.05 103.71
Sensitivity analysis
Based on the financial instruments held at reporting date, had the functional currencies weakened / strengthened by 10%
and all other variables held constant, the Group’s after-tax profit/(loss) for the year to date would have been US$0.8 million
lower/higher (2017: US$0.9 million lower/higher).
Credit risk
Credit risk refers to the risk that a counterparty will default on its contractual obligations resulting in financial
loss to the Group. Credit risk arises from cash and deposits with financial institutions as well as credit exposures
to outstanding receivables.
The Group is exposed to counterparty credit risk through sales of mineral sands products under normal terms of trade.
Total sales revenue for the year ended 30 June 2018 was US$198.8 million (2017: US$162.4 million). Major customers
who individually accounted for more than 10% of sales revenue contributed approximately 61% (2017: 61%) of sales
revenue. These customers represent 13% (2017: 42%) of the trade receivables balance at 30 June 2018.
Credit risk arising from sales to customers is managed by the Group’s policy to only trade with reputable companies, with
whom a long term offtake agreement is held, or where such an agreement is not in place, sales are backed by Letters of
Credit held with internationally recognised banks.
The Group is owed US$21.3 million in VAT receivable by the Government of Kenya (Note 7), of which US$17.1 million
relates to the construction of Kwale Operations and is overdue but not impaired. An estimation has been made as to the
timing of the receipt of this amount and forms the basis for its classification as a current asset.
At the reporting date the carrying amounts of financial assets are adjusted for any impairment and represent the Group’s
maximum exposure to credit risk, excluding the value of any collateral or other security, which was as follows:
2018 US$000s
2017 US$000s
Financial assets – cash flow realisable
Cash and cash equivalents 29,686 28,278
Restricted cash 29,591 26,166
Trade and other receivables 38,726 44,056
Total anticipated inflows 98,003 98,500
At 30 June 2018, the ageing of trade and other receivables that were not impaired was as follows:
2018 US$000s
2017 US$000s
Neither past due nor impaired 36,525 41,710
Past due 1 - 30 days 2,201 2,346
38,726 44,056

88 / BASE RESOURCES / ANNUAL REPORT 2018
There were no impairment losses in relation to financial assets during the current or the comparative financial year. The
maximum exposure to credit risk for financial assets at the reporting date by geographic region of the customer was:
2018 US$000s
2017 US$000s
United Kingdom 53,364 49,965
Kenya 22,522 20,806
China 10,418 15,359
USA 2,176 7,668
Australia 3,814 3,385
Other 5,709 1,317
Total 98,003 98,500
Liquidity risk
Liquidity risk is the risk that the Group will encounter difficulty in meeting the obligations associated with financial liabilities.
The Group manages liquidity risk by conducting regular reviews of the timing of cash outflows and the maturity profiles of
term deposits in order to ensure sufficient funds are available to meet its obligations.
Financial liability maturity analysis
Contractual cash flows
Carrying amount
US$000sTotal
US$000s
2 months or less
US$000s2-12 months
US$000s1-2years US$000s
2-5 years US$000s
More than 5 years
US$000s
30 June 2018
Trade and other payables 27,865 27,865 11,889 15,976 - - -
Kwale Facility 79,973 86,355 - 58,553 27,802 - -
RCF 12,500 14,591 177 867 13,547 - -
Finance lease liabilities 66 66 66 - - - -
120,404 128,877 12,132 75,396 41,349 - -
30 June 2017
Trade and other payables 20,696 20,696 9,672 11,024 - - -
Kwale Facility 141,161 157,911 - 56,775 58,833 42,303 -
Taurus Facility 11,799 12,101 - 12,101 - - -
Finance lease liabilities 438 465 66 333 66 - -
174,094 191,173 9,738 80,233 58,899 42,303 -
Notes to the consolidated financial statements - capital structure, financial instruments and risk management (cont.)

BASE RESOURCES / CONSOLIDATED FINANCIAL STATEMENTS / 89
Capital Management
Management controls the capital of the Group in order to maintain an appropriate working capital position to ensure that
the Group can fund its operations and continue as a going concern. Capital is managed by assessing the Group’s financial
risks and adjusting its capital structure in response to changes in these risks and in the market.
2018 US$000s
2017 US$000s
Cash and cash equivalents 29,686 28,278
Restricted cash 29,591 26,166
Trade and other receivables 38,726 44,056
Inventories 19,789 18,517
Other current assets 5,993 4,528
Trade and other payables (27,865) (20,696)
Borrowings (53,266) (59,211)
Provisions (1,581) (1,304)
Deferred revenue (833) (833)
Other liabilities (7,058) (646)
Working capital position 33,182 38,855

90 / BASE RESOURCES / ANNUAL REPORT 2018
Note 19: Parent entity disclosures
As at, and throughout the financial year ended 30 June 2018, the parent entity of the consolidated group was Base
Resources Limited.
Financial performance of the parent entity2018
US$000s2017
US$000s
Loss for the year (9,157) (8,413)
Total comprehensive loss for the year (9,157) (8,413)
Financial position of the parent entity2018
US$000s2017
US$000s
Current assets 3,867 3,346
Non-current assets 211,804 165,584
Total assets 215,671 168,930
Current liabilities 2,804 13,674
Non-current liabilities 11,624 9,073
Total liabilities 14,428 22,747
Net assets 201,243 146,183
Issued capital 236,646 173,173
Reserves 4,036 5,194
Accumulated losses (39,439) (32,184)
Total equity 201,243 146,183
Parent entity guarantee in respect of Kwale Operation Debt Facility
Base Resources Limited has entered into a shareholder support agreement in relation to the Kwale Facility. Refer to “Note
12: Borrowings” for further details.
Principles of consolidation
The consolidated financial statements incorporate the assets, liabilities and results of entities controlled by Base Resources
Limited at the end of the reporting period. The Group controls an entity when it is exposed to, or has rights to, variable
returns from its involvement with the entity and has the ability to affect those returns through its power over the entity.
The financial statements of subsidiaries are included in the consolidated financial statements from the date on which control
commences until the date on which control ceases.
Where controlled entities have entered or left the Group during the year, the financial performance of those entities
are included only for the period of the year that they were controlled.
In preparing these financial statements, all inter-group balances and transactions between entities in the Group have been
eliminated on consolidation. Accounting policies of subsidiaries have been changed where necessary to ensure consistency
with those adopted by the parent entity.
Notes to the consolidated financial statementsGROUP STRUCTURE AND OTHER INFORMATION

BASE RESOURCES / CONSOLIDATED FINANCIAL STATEMENTS / 91
Ownership %
Controlled entity Country of Incorporation 2018 2017
Base Titanium (Mauritius) Limited Mauritius 100 100
Base Titanium Limited Kenya 100 100
Base Exploration Tanzania Limited Tanzania 100 100
BTS Holdings (Mauritius) Limited(i) Mauritius 100 -
Madagascar Mineral Fields Limited(ii) Mauritius 85 -
Malagasy Sands No. 2 Limited(ii) Mauritius 85 -
Toliara SARL(ii) Madagascar 85 -
Madagascar Resources SARL(ii) Madagascar 85 -
(i) Incorporated�on�28�November�2017.(ii) Became�a�controlled�entity�upon�completion�of�the�acquisition�of�the�Toliara�Project�on�22�January�2018.
Note 20: Related parties
KMP compensation:2018
US$000s2017
US$000s
Short-term employment benefits 3,298,696 2,543,733
Post-employment benefits 132,821 152,755
Share-based payments 835,511 678,751
Compensating payment for LTIP scale back - 314,802
Other long term 61,668 30,524
4,328,696 3,720,565
Refer to the Remuneration Report for further details.
Recognition and measurement of short term employee benefits
STIP obligations are measured on an undiscounted basis and are expensed as the related service is provided. A liability
is recognised for the amount expected to be paid under the STIP where the Group has a present legal or constructive
obligation as a result of past services by the employee, and the obligation can be estimated reliably.
Recognition and measurement of defined contribution plans
Contributions are made by the Group to individual defined contribution superannuation plans for Australian directors and
employees and are charged as an expense in the Statement of Profit and Loss and Comprehensive Income when incurred.
Other related party transactions
In January 2017, one of the Company’s major shareholders, Pacific Road Capital Management Pty Limited (Pacific Road),
acquired 50% of a Kwale Operation royalty stream from Pangea Goldfields Inc. In the year to 30 June 2018, US$477,000
was paid or is payable to Pacific Road under this royalty arrangement. Mr Stirzaker, non-executive director of the Group,
is a partner of Pacific Road.

92 / BASE RESOURCES / ANNUAL REPORT 2018
Note 21: Auditors’ remuneration2018
US$000s2017
US$000s
Audit services
KPMG�Australia
Audit of financial report 132,407 101,810
Overseas�KPMG�firms
Audit services 117,362 81,939
249,769 183,749
Other services
KPMG�Australia
Tax compliance and advisory services 59,491 74,401
Other services 8,727 8,296
Overseas�KPMG�firms
Tax compliance and advisory services 68,728 82,122
136,946 164,819
Note 22: New accounting standards adopted in the current period
A number of new standards and amendments to standards are effective for annual periods beginning after 1 July 2017,
however, the Group has not applied the new or amended standards in preparing these consolidated financial statements.
Those which may be relevant to the Group are set out below. The Group does not plan to adopt these standards early.
AASB�15�Revenue�from�Contracts�with�Customers establishes a comprehensive framework for determining whether, how
much, and when revenue is recognised. It replaces existing revenue recognition guidance, including IAS 18 Revenue, IAS
11 Construction contracts, and IFRIC 13 Customer Loyalty Programmes. AASB 15 is effective for annual reporting periods
beginning on or after 1 January 2018, with early adoption permitted. Base Resources does not expect the implementation
of this standard to have a material impact on its existing revenue contracts.
AASB�16�Leases�removes the classification of leases as either operating or finance leases – for the lessee – effectively
treating all leases as finance leases. Short term leases (less than 12 months) and leases of low value assets are exempt from
the lease accounting requirements. Furthermore, there are changes in accounting over the life of the lease as a front-
loaded pattern of expense will be recognised for most leases, even when a constant annual rental is paid. Lessor accounting
remains similar to current practice. AASB 16 is effective for annual reporting periods beginning on or after 1 January 2019,
with early adoption permitted. Base Resources does not expect the implementation of this standard to have a material
impact on the financial statements.
AASB�9�Financial�Instruments, published in July 2014, replaces the existing guidance in IAS 39 Financial Instruments:
Recognition and Measurement. AASB 9 includes revised guidance on the classification and measurement of financial
instruments, a new expected credit loss model for calculating impairment on financial assets, and new general hedge
accounting requirements. It also carries forward the guidance on recognition and derecognition of financial instruments
from IAS 39. AASB 9 is effective for annual reporting periods beginning on or after 1 January 2018, with early adoption
permitted. Base Resources does not expect the implementation of this standard to have a material impact on the
financial statements.
Notes to the consolidated financial statements - group structure and other information (cont.)

BASE RESOURCES / CONSOLIDATED FINANCIAL STATEMENTS / 93
Note 23: Events after the reporting date
Other than the July 2018 US$14.9 million Cash Sweep from the Kwale Operations (refer “Note 12: Borrowings”), there
have been no significant events since the reporting date.
Note 24: Company details
The principal place of business and registered office of the Company is:
Base�Resources�Limited�(ASX�&�AIM:�BSE)
Level�1,�50�Kings�Park�Road
West�Perth,�6005�
Western�Australia

94 / BASE RESOURCES / ANNUAL REPORT 2018
1. In the opinion of the directors of Base Resources:
(a) the consolidated financial statements and notes that are set out on pages 64 to 93 and the Remuneration Report
on pages 35 to 50 in the Directors’ Report, are in accordance with the Corporations�Act�2001, including:
(i) giving a true and fair view of the Group’s financial position as at 30 June 2018 and of its performance, for the
financial year ended on that date; and
(ii) complying with Australian Accounting Standards and the Corporations�Regulations�2001; and
(b) there are reasonable grounds to believe that the Company will be able to pay its debts as and when they become
due and payable.
2. The directors have been given the declarations required by Section 295A of the Corporations�Act�2001 from the chief
executive officer and chief financial officer for the financial year ended 30 June 2018.
3. The directors draw attention to note 1 to the consolidated financial statements, which includes a statement of
compliance with International Financial Reporting Standards.
Signed in accordance with a resolution of the directors:
Keith Spence
Chairman
DATED at PERTH this 25th day of August 2018
Directors’ declaration

BASE RESOURCES / INDEPENDENT AUDITOR'S REPORT / 95
Independent auditor’s report
Liability limited by a scheme approved under Professional Standards Legislation.
KPMG, an Australian partnership and a member firm of the KPMG network of independent member firms affiliated with KPMG International Cooperative (“KPMG International”), a Swiss entity.
Independent Auditor’s Report
To the shareholders of Base Resources Limited
Report on the audit of the Financial Report
Opinion
We have audited the Financial Report of Base Resources Limited (the Company).
In our opinion, the accompanying Financial Report of the Company is in accordance with the Corporations Act 2001, including:
• giving a true and fair view of the Group's financial position as at 30 June 2018 and of its financial performance for the year ended on that date; and
• complying with Australian Accounting Standards and the Corporations Regulations 2001.
The Financial Report comprises:
• Consolidated statement of financial position as at 30 June 2018
• Consolidated statement of profit or loss and other comprehensive income, Consolidated statement of changes in equity, and Consolidated statement of cash flows for the year then ended
• Notes including a summary of significant accounting policies
• Directors' Declaration.
The Group consists of the Company and the entities it controlled at the year end or from time to time during the financial year.
Basis for opinion
We conducted our audit in accordance with Australian Auditing Standards. We believe that the audit evidence we have obtained is sufficient and appropriate to provide a basis for our opinion.
Our responsibilities under those standards are further described in the Auditor’s responsibilities for the audit of the Financial Report section of our report.
We are independent of the Group in accordance with the Corporations Act 2001 and the ethical requirements of the Accounting Professional and Ethical Standards Board’s APES 110 Code of Ethics for Professional Accountants (the Code) that are relevant to our audit of the Financial Report in Australia. We have fulfilled our other ethical responsibilities in accordance with the Code.
Key Audit Matters
The Key Audit Matters we identified are:
• Value of property, plant and equipment
• The acquisition of the Toliara Sands Project
Key Audit Matters are those matters that, in our professional judgement, were of most significance in our audit of the Financial Report of the current period.
These matters were addressed in the context of our audit of the Financial Report as a whole, and in forming our opinion thereon, and we do not provide a separate opinion on these matters.

96 / BASE RESOURCES / ANNUAL REPORT 2018
Value of property, plant and equipment (US$240,509,000)
Refer to Note 10 to the Financial Report
The key audit matter How the matter was addressed in our audit
The value of property, plant and equipment was considered a key audit matter due to:
The size of the Kwale mine property, plant and equipment balance (being 52% of total assets)
The mineral sands sector, within which the Group operates, has experienced volatile commodity prices and uncertainty in the global demand for products, putting pressure on the recoverability of asset values
The level of judgment required by us in evaluating the Group’s assessment of impairment, and
The Group’s market capitalisation at 30 June 2018 was less than the net assets, bringing into question the value ascribed to property, plant and equipment.
The assessment of impairment of the Group’s property, plant and equipment, applies significant judgments through the use of assumptions in a fair value less costs of disposal model. These judgments include:
Forecast sales, production levels, production costs and capital expenditure
Expected commodity prices for mineral sands
Discount rate including the assessment of Kenya country risk, and
Life of mineral reserves.
In assessing this key audit matter, we involved senior team members and valuation specialists.
Our procedures included:
We considered the appropriateness of adopting fair value less costs of disposal methodology by assessing the discounted cash flow forecast model to acceptable valuation techniques
We assessed the integrity of the fair value less costs of disposal model used
We assessed the historical accuracy of forecasts by the Group to inform our evaluation of forecasts incorporated in the fair value less costs of disposal model
We evaluated the sensitivity of the value of property, plant and equipment by considering downside scenarios against reasonably possible changes to the key judgments, such as forecast commodity prices and the discount rate, to determine the assumptions that we focused our testing on
We assessed key judgments underlying the discounted cash flows (including forecast sales, production levels and production costs) based on the historical performance of Kwale
We compared the forecast cash flows and capital expenditure contained in the fair value less costs of disposal model to Board approved forecasts
We compared expected commodity prices to published views of the market commentator on future trends
We analysed the life of mineral reserves based on the views of an external expert engaged by the Group
Working with our valuation specialists, we independently developed a discount rate range considered comparable using publicly available market data for comparable entities, adjusted for Kenya country risk
We assessed the Group’s analysis of the market capitalisation shortfall versus the net assets. This included consideration of the market capitalisation range implied by broker target valuation ranges, to the Group’s internal valuation model. EBITDA multiples were also assessed against comparable companies.
Independent auditor’s report (cont.)

BASE RESOURCES / INDEPENDENT AUDITOR'S REPORT / 97
The acquisition of the Toliara Sands project (US$92,000,000)
Refer to Note 9 and 14 to the Financial Report
The key audit matter How the matter was addressed in our audit
The Group’s acquisition of the Toliara Sands Project represents a significant transaction for the Group. This was a key audit matter due to the:
Size of the acquisition having a pervasive impact on the Group’s financial statements
Complexity of the terms of the Share Sale Agreement. We focussed on accounting for non-controlling interest (NCI) against the criteria of the accounting standards
Level of judgement required in determining the accounting approach as either a business (in accordance with IFRS 3 Business Combinations), or an asset acquisition. The difference in the accounting for the acquisition as a business or an asset is significant and could impact the recognition and measurement of amounts reported in the consolidated financial statements
The judgement applied by the Group to recognise and measure the fair value of deferred consideration. Consideration is payable by the Group upon reaching specific milestones as disclosed in Note 14 to the financial report.
These conditions and associated complex acquisition accounting required significant audit effort and greater involvement of senior team members.
Our procedures included:
Reading the Share Sale Agreement related to the acquisition to understand the structure, key terms and the nature of consideration. Using this information, we evaluated the accounting treatment of the acquisition. This included assessing the accounting treatment of the non-controlling interest against the criteria in the accounting standards.
We involved senior audit team members to assess the accounting treatment for the transaction. We researched and analysed the conclusions reached by the Group and compared those conclusions to accounting interpretations, industry practice and accounting literature.
Assessing the Group’s recognition and determination of fair value measurement of deferred consideration by checking the Group’s calculation to the Share Sale Agreement and to the Board approved investment proposal for the acquisition
We considered the adequacy of the Group’s disclosures in respect of this acquisition against the criteria in the accounting standards.
Other Information
Other Information is financial and non-financial information in Base Resources Limited’s annual reporting which is provided in addition to the Financial Report and the Auditor’s Report. The Directors are responsible for the Other Information.
The Other Information we obtained prior to the date of this Auditor’s Report was the Director’s Report. The Chairman’s Letter, and the Operations and Finance Report which includes the Operation Summary, Sustainability in Practice, Business Development, Corporate and Finance, Marketing and Sales, Mineral Sands Outlook and Resources and Reserves, are expected to be made available to us after the date of the Auditor's Report. Our opinion on the Financial Report does not cover the Other Information and, accordingly, we do not and will not express an audit opinion or any form of assurance conclusion thereon, with the exception of the Remuneration Report and our related assurance opinion.

98 / BASE RESOURCES / ANNUAL REPORT 2018
In connection with our audit of the Financial Report, our responsibility is to read the Other Information. In doing so, we consider whether the Other Information is materially inconsistent with the Financial Report or our knowledge obtained in the audit, or otherwise appears to be materially misstated.
We are required to report if we conclude that there is a material misstatement of this Other Information, and based on the work we have performed on the Other Information that we obtained prior to the date of this Auditor’s Report we have nothing to report.
Responsibilities of the Directors for the Financial Report
The Directors are responsible for:
• preparing the Financial Report that gives a true and fair view in accordance with Australian Accounting Standards and the Corporations Act 2001
• implementing necessary internal control to enable the preparation of a Financial Report that gives a true and fair view and is free from material misstatement, whether due to fraud or error
• assessing the Group and Company's ability to continue as a going concern. This includes disclosing, as applicable, matters related to going concern and using the going concern basis of accounting unless they either intend to liquidate the Group and Company or to cease operations, or have no realistic alternative but to do so.
Auditor’s responsibilities for the audit of the Financial Report
Our objective is:
• to obtain reasonable assurance about whether the Financial Report as a whole is free from material misstatement, whether due to fraud or error; and
• to issue an Auditor’s Report that includes our opinion.
Reasonable assurance is a high level of assurance, but is not a guarantee that an audit conducted in accordance with Australian Auditing Standards will always detect a material misstatement when it exists.
Misstatements can arise from fraud or error. They are considered material if, individually or in the aggregate, they could reasonably be expected to influence the economic decisions of users taken on the basis of this Financial Report.
A further description of our responsibilities for the audit of the Financial Report is located at the Auditing and Assurance Standards Board website at: http://www.auasb.gov.au/auditors_responsibilities/ar1.pdf. This description forms part of our Auditor’s Report.
Independent auditor’s report (cont.)

BASE RESOURCES / INDEPENDENT AUDITOR'S REPORT / 99
Report on the Remuneration Report
Opinion
In our opinion, the Remuneration Report of Base Resources Limited for the year ended 30 June 2018, complies with Section 300A of the Corporations Act 2001.
Directors’ responsibilities
The Directors of the Company are responsible for the preparation and presentation of the Remuneration Report in accordance with Section 300A of the Corporations Act 2001.
Our responsibilities
We have audited the Remuneration Report included on pages 16 to 33 of the Directors’ report for the year ended 30 June 2018.
Our responsibility is to express an opinion on the Remuneration Report, based on our audit conducted in accordance with Australian Auditing Standards.
KPMG R Gambitta Partner
Perth
25 August 2018

100 / BASE RESOURCES / ANNUAL REPORT 2018
Additional shareholder information
Base Resources is listed on the ASX and AIM under the code: BSE. The following additional information required by the
ASX Listing Rules is current as at 28 September 2018.
Ordinary Shares
Distribution of shares Holders Units %
1 – 1,000 134 12,065
1,001 – 5,000 192 582,543 0.05
5,001 – 10,000 172 1,404,415 0.12
10,001 – 100,000 508 19,509,065 1.73
100,001 and over 210 1,106,066,926 98.09
1,216 1,127,575,014 100.00
There were 163 holders of unmarketable parcels of shares (<A$500) based on the closing share price of A$0.265 as at
28 September 2018 comprising a total of 56,694 shares.
The voting rights attached to the ordinary shares are:
a) at a meeting of members or classes of members each member entitled to vote may vote in person or by proxy or
by attorney; and
b) on a show of hands every person present who is a member has one vote, and on a poll every person present in person or
by proxy or attorney has one vote for each ordinary share held.
20 largest registered holders of shares Number of Shares %
1 HSBC CUSTODY NOMINEES <AUSTRALIA> LIMITED 317,672,215 28.17
2 PACIFIC ROAD CAPITAL MANAGEMENT GP II LIMITED 213,122,088 18.90
3 J P MORGAN NOMINEES AUSTRALIA LIMITED 124,792,555 11.07
4 CITICORP NOMINEES PTY LIMITED 111,168,471 9.86
5 UBS NOMINEES PTY LTD 70,311,685 6.24
6 PACIFIC ROAD CAPITAL II PTY LIMITED 29,831,018 2.65
7 SANDHURST TRUSTEES LTD <JMFG CONSOL A/C> 20,127,140 1.78
8 TWYNAM AGRICULTURAL GROUP PTY LTD 18,350,020 1.63
9 COMPUTERSHARE CLEARING PTY LTD <CCNL DI A/C> 16,676,299 1.48
10 HSBC CUSTODY NOMINEES <AUSTRALIA> LIMITED - A/C 2 14,401,828 1.28
11 CS FOURTH NOMINEES PTY LIMITED <HSBC CUST NOM AU LTD 11 A/C> 13,979,183 1.24
12 BRISPOT NOMINEES PTY LTD <HOUSE HEAD NOMINEE A/C> 13,662,520 1.21
13 BNP PARIBAS NOMS PTY LTD <DRP> 11,841,207 1.05
14 CS THIRD NOMINEES PTY LIMITED <HSBC CUST NOM AU LTD 13 A/C> 10,088,123 0.89
15 NGE CAPITAL LIMITED 7,400,000 0.66
16 CPU SHARE PLANS PTY LTD <BSE LTR UNALLOCATED A/C> 6,700,405 0.59
17 WARBONT NOMINEES PTY LTD <UNPAID ENTREPOT A/C> 6,581,570 0.58
18 HARMANIS HOLDINGS PTY LTD <HARMAN FAMILY A/C> 5,850,000 0.52
19 NATIONAL NOMINEES LIMITED 4,996,372 0.44
20 AET CT PTY LIMITED <HENROTH PTY LIMITED> 4,500,000 0.40
1,022,052,699 90.64

BASE RESOURCES / ADDITIONAL SHAREHOLDER INFORMATION / 101
Substantial shareholdingsThe substantial shareholders of the Company, and the number of securities in which those shareholders and their associates
have a relevant interest, as disclosed in the substantial holding notices received by the Company are:
Name Number of shares
Pacific Road Capital II Pty Ltd and Pacific Road Capital Management GP II Limited 242,953,106
Sustainable Capital Ltd 112,050,380
Regal Funds Management Pty Limited 85,134,838
Wellington Management Group LLP 69,515,366
Bank of America Corporation 59,323,736
UBS Group AG 60,523,212
OptionsThe following unlisted options are on issue. Options do not carry a right to vote. Voting rights will attach to any ordinary shares
issued upon valid exercise of options.
Stream Date of Expiry Exercise Price Number of Options Number of Holders
1 31 December 2018 $0.40 61,425,061 1
61,425,061
Holders of greater than 20% of any stream of options:
Stream 1: Taurus Funds Management Pty Ltd – 61,425,061 options.
Performance rightsThe following unlisted performance rights are on issue. Performance rights do not carry a right to vote. Voting rights will attach
to any ordinary shares issued upon vesting of performance rights in accordance with their terms of issue pursuant
to the Base Resources Long Term Incentive Plan.
Cycle Date of Vesting/Expiry Number of performance rights Number of Holders
2015 30 September 2018 45,748,431 19
2016 30 September 2019 11,514,341 21
2017 30 September 2020 14,018,889 21
During the reporting period, the trustee of the Base Resources Long Term Incentive Plan trust acquired 6,700,405 ordinary
shares on-market at an average price of A$0.297 per share. These shares will be allocated by the Trustee to participants upon
vesting of performance rights pursuant to the Base Resources Long Term Incentive Plan.
Other informationThere is no current on-market buy back taking place. There are no restricted securities or securities the subject of voluntary
escrow on issue.
102 / BASE RESOURCES / ANNUAL REPORT 2018
Glossary
AASB Australian Accounting Standards Board
AIM Alternative Investment Market
APES Accounting Professional and Ethical Standards
ASIC Australia Securities and Investments Commission
ASX Australian Securities Exchange
AUD Australian dollar
CTA Common terms agreement for the Kwale Project Debt Facility
DMU Dozer-trap mining unit
EBITDA Earnings Before interest, taxes, depreciation, interest and amortisation
EITI Extractive Industries Transparency Initiative
FY Financial year
GoK Government of Kenya
HM Heavy mineral
HMC Heavy mineral concentrate
HMU Hydraulic mining unit
ILM Ilmenite
IUCN International Union for Conservation of Nature
JORC Joint Ore Reserves Committee
KMP Key management personnel
KP2 Kwale Phase 2 mine optimisation project
LIBOR London Inter-bank Offered Rate
LTI Lost time injury
LTIFR Lost time injury frequency rate
LTIP Long term incentive plan
MSP Mineral separation plant
Mt Million tonnes
NGOs Non-governmental organisations
NPAT Net profit after tax
NRV Net realisable value
OS Oversize material
PFS Project feasibility study
PPE Property, plant and equipment
RCF Revolving credit facility
RUT Rutile
SL Slimes
SML Special mining lease
SPL Special prospecting license
STIP Short term incentive plan
TFR Total fixed remuneration
Ti02 Titanium dioxide
tph Tonnes per hour
TRI Total recordable injury
TRIFR Total recordable injury frequency rate
TRP Total remuneration package
TSF Tailings storage facility
TSR Total shareholder return
USD United States dollar
VWAP Volume weighted average price
WCP Wet concentrator plant
ZIR Zircon

BASE RESOURCES / GLOSSARY / 103
Corporate directory
Directors
Mr Keith Spence
Non-Executive Chairman
Mr Tim Carstens
Managing Director
Mr Colin Bwye
Executive Director
Mr Samuel Willis
Non-Executive Director
Mr Malcolm Macpherson
Non-Executive Director
Mr Mike Stirzaker
Non-Executive Director
Mr Michael Anderson
Non-Executive Director – retired 31 August 2017
Mrs Diane Radley
Non-Executive Director – appointed 1 February 2018
Company secretary
Mr Chadwick Poletti
Principal place of business
and registered office
Level 1
50 Kings Park Road
West Perth WA 6005
Contact details
Website baseresources.com.au
Email [email protected]
Phone + 61 (8) 9413 7400
Fax + 61 (8) 9322 8912
Solicitors
Herbert Smith Freehills
Level 36, QV1
250 St Georges Terrace
Perth WA 6000
Auditors
KPMG
235 St Georges Terrace
Perth WA 6000
Nominated advisor
RFC Ambrian Limited
QV1 Building
250 St Georges Terrace
Perth WA 6000
Share registry
ASX
Computershare Investor Services Pty Limited
Level 11, 172 St Georges Terrace
Perth WA 6000
Enquiries (within Australia): 1300 850 505
(outside Australia): +61 (3) 9415 4000
Website computershare.com.au
AIM
Computershare Investor Services PLC
The Pavilions
Bridgwater Road
Bristol BS99 6ZZ
Enquiries +44 (0) 870 702 0003
Website computershare.co.uk
Joint brokers
RFC Ambrian Limited
Condor House
10 St Paul’s Churchyard
London EC4M 8AL
Numis Securities Limited
The London Stock Exchange Building
10 Paternoster Square
London EC4M 7LT

104 / BASE RESOURCES / ANNUAL REPORT 2018

BASE RESOURCES / / cv

cvi / BASE RESOURCES / ANNUAL REPORT 2018
50 Kings Park Rd West Perth WA 6005
+61 8 9413 7400baseresources.com.au
Base ResourcesAnnual Report 2018
50 Kings Park Rd West Perth WA 6005
+61 8 9413 7400baseresources.com.au ABN 88 125 546 910