broadscale frb frr51final
TRANSCRIPT
FireManagement
EFFECTIVENESS OF BROADSCALEFUEL REDUCTION BURNING
IN ASSISTING WITH WILDFIRE CONTROLIN PARKS AND FORESTS IN VICTORIA
Research Report No. 51Gregory J. McCarthy and Kevin G. TolhurstForest Science Centre, Orbost & Creswick
May 2001

© CopyrightCrown (State of Victoria) 2001
A Victorian Government Publication
Published by the Department of Natural Resources and Environment, 240 Victoria Parade, East Melbourne, Victoria, 3002,Australia, to whom all enquiries should be directed.
This publication is copyright. Apart from any fair dealing for private study, research, criticism or review as permitted under theCopyright Act 1968, no part of this publication may be reproduced, stored in a retrieval system, or transmitted in any form or byany means, electronic, photocopying or otherwise, without the prior permission of the copyright owner.
Note: This publication may be of assistance to you, but the State of Victoria and its employees do not guarantee that thepublication is without flaw of any kind, or is wholly appropriate for your particular purposes, and therefore disclaims all liabilityfor any error, loss or other consequence which may arise from you relying on any information in this publication.
Fire ManagementDepartment of Natural Resources and EnvironmentISBN 0 7311 4922 X
EFFECTIVENESS OF BROADSCALEFUEL REDUCTION BURNING
IN ASSISTING WITH WILDFIRE CONTROLIN PARKS AND FORESTS IN VICTORIA
Research Report No. 51Gregory J. McCarthy and Kevin G. TolhurstForest Science Centre, Orbost & Creswick
May 2001
This report was commissioned by Fire Management, Department of Natural Resources andEnvironment, Victoria.


Effectiveness of Broadscale FRB - McCarthy & Tolhurst (2001) 1
CopyrightCrown (State of Victoria) 2001
FOREWORD
In an average year over 600 unplanned bushfires start in Victoria’s national parks and State forests.While around one quarter of these fires are started by lightning, the remainder are caused by humanactivity.
While every effort is made to prevent fires from starting, Victoria will always experience bushfiresfrom either natural or human causes. These bushfires can threaten human life, property, assets and attimes, the environment. Some of these fires are difficult to control, in spite of the use of the latesttechnology and highly trained firefighters.
One way of protecting settlements and also limiting the spread and severity of bushfires is bystrategically reducing the ‘fuel’ in parts of our parks and forests. The reduction of fuels, such asleaves, twigs, grass, shrubs, bark or other vegetation, is referred to as ‘Fuel Management’.
Fire behaviour is determined by weather, topography and fuel. However, fuel is the only factor thatcan be altered before an unplanned fire starts. Once a fire has started, fire intensity and the speedwith which the fire spreads are affected by the fuel load.
Methods of reducing fuel hazard levels include mowing, raking, slashing or burning. Of these, onlyburning is feasible for larger areas.
By reducing fuel hazard levels in parts of our parks and forests, with fires lit during the cooler monthsof the year, a bushfire that either burns into a fuel reduced area or starts in one will have lower flameheight, reduced intensity and will spread at a slower rate, making fire supression easier and moresuccessful.
This report looks at the effectiveness of broadscale prescribed burning in assisting with wildfiresuppression, in a number of the forest types that are found in Victoria’s parks and forests. The studyon which the report is based is retrospective in its approach. It also uses a limited data set. Thenature of wildfire occurrence in Victoria, and the variable and complex nature of the factors whicheffect forest fire behaviour mean that a classical experimental approach to an evaluation is notpossible at this stage.
Nonetheless I believe the study will make a valuable contribution to the understanding Victoria’spark, forest and fire managers have of the role prescribed fires can play in helping protect human lifeand property. The study is also an important one in helping land managers strike the appropriatebalance between life and property protection and the need to meet the fire related ecologicalrequirements of many of our native ecosystems.
GARY MORGANCHIEF FIRE OFFICER
2 Effectiveness of Broadscale FRB - McCarthy & Tolhurst (2001)
SUMMARY
This study investigated the general effectiveness, for subsequent wildfire control, of broadscaleprescribed burning for fuel hazard reduction across Victoria. This form of prescribed burning is alsocommonly known as ‘fuel reduction burning (FRB)’. It involves the deliberate lighting of fires to burnwithin a predetermined area, with a predetermined intensity and in a predetermined time of year(generally in autumn) to reduce forest fuels (surface litter, bark and understorey shrubs/grasses)which are available for burning in the event of wildfires.
This study was primarily done by sampling a relatively large number of fires (114) from a selection offire districts, using the FIRES database of NRE. Sampling was aimed at identifying fires from therange of Fuel Management Zones and with a range of final fire sizes. (FMZs - all public land isdivided into one of five FMZs for fire protection purposes. These are set out in the Code ofPractice for Fire Management on Public Land (NRE 1995). Zones 1 to 3 have specific fuelmanagement targets, and Zones 3, 4 and 5 have ecological targets - the zoning system is the basis forthe production of Fire Protection Plans for fire districts and regions). Many wildfires known to beinfluenced by FRB were studied, and a selection of those fires where previous FRB did not assist insuppression were also investigated to determine what differences there were in fuel or otherconditions which contributed to these outcomes. Wildfires sampled occurred between the 1990/91and 1997/98 fire seasons inclusive.
The main aims of the study were to investigate how FRBs had moderated wildfire behaviour to anextent where it assisted in fire control, and to investigate whether there were significant differencesbetween the strategic location of FMZs in terms of how likely a wildfire was to encounter a “helpful”FRB within each Zone.
The findings of this study are prefaced by the acknowledgment that the results have come from adeliberately biased data set. This, it is argued, was due to the nature of the data available at the timeand was unavoidable. Further, a retrospective type study approach was taken in order to provideadvanced insights into the effectiveness of broadscale FRB on public land in Victoria. A classicalexperimental approach to investigate this complex and highly variable issue would have beenexceptionally difficult and expensive, with results not available for many years. The qualified resultsfrom the present study however can be immediately used to guide policy development and on-ground operational practice. It is likely that the qualified findings are generally correct from aStatewide perspective, but further analysis of an expanded data set is preferred.
A major finding of the study was that the maximum level of ‘Overall Fuel Hazard’ that would provideany assistance with suppression was that of High . This reinforces some earlier work on the subject(Wilson 1992, McCarthy et al. 1999).
Two predictive models were constructed from the data. The first predicts that, as fire dangerincreases, the benefits of previous FRB starts to reduce (particularly at FDIs 25-50, depending onthe ‘Overall Fuel Hazard’ level). That is, at higher levels of fire danger, weather influences becomemore important than fuel conditions, in terms of successful suppression operations.
The second model predicts that, beyond about 10 years post-fire, the probability of an FRB stillbeing ‘helpful’ for suppression operations decreases significantly. The highest probabilities of aprevious FRB being helpful to subsequent suppression operations occur in the first four years
Effectiveness of Broadscale FRB - McCarthy & Tolhurst (2001) 3
following the FRB, with decreasing probabilities up to about age 10 years. Assisting effects of aprevious FRB that is between 4 and 10 years old are most likely to be in terms of reduced bark andelevated fuel hazards, as surface fuels appear to re-accumulate to pre-burn levels within the first 4years.
This study has identified that FMZ 1 and FMZ 2 are the two Fuel Management Zones where asubsequent wildfire has the highest likelihood of running into a previous FRB which will both slow theheadfire and assist with suppression. Depending on the fire district, between 1 in 5 and 1 in 2wildfires will be likely to run into a ‘helpful’ FRB in FMZs 1 and 2. The frequency of burning inthese zones is important, with the most effective areas in FMZ 1 being burnt every five years onaverage, and the most effective areas in FMZ 2 being burnt every seven years on average.
Only about 1 in 20, on average, of the fires sampled in conjunction with FMZ 3 ran into a ‘helpful’FRB. This result suggests that in the current circumstances the impact of FMZ 3 treatment is closeto that of random fuel management. Larger FMZ 3 areas, or more frequent treatment of these areas,however, would probably alter this outcome. At present, the lower likelihood of a wildfire beingeffectively reduced in intensity by FMZ 3s appears to be as a result of the lower frequency ofburning within the current zone. An added factor here, given the often large size of FMZ 3, may bethe possibility that the percentage area burnt within the total area in this Zone is less than in FMZ 1and FMZ 2. Finally, the average burning frequency of 11 years appears to be sufficient to allow allfuel components (surface, bark and elevated) to increase to levels of more than High. Once VeryHigh and Extreme fuel hazard levels are reached, the effect of previous fuel reduction burning onwildfire behaviour is minimal.
The qualified results from this Statewide analysis of the effectiveness of broadscale FRB in assistingwith subsequent wildfire control may be useful in terms of future policy development for firemanagement in Victoria. The results may also prompt consideration of current operational practice,particularly in relation to Zone 3. On-going research on this subject, however, is clearly warranted.
4 Effectiveness of Broadscale FRB - McCarthy & Tolhurst (2001)
INTRODUCTION
Broadscale fuel reduction burning (FRB) has been practised in Victoria for nearly 30 years. FRBinvolves the deliberate use of fire, under prescribed (or pre-determined) weather and fuel moistureconditions (generally in the autumn), to reduce both the amount, and vertical extent, of forest fuels,including surface litter, bark and understorey shrubs. FRB is carried out to reduce these fuelhazards, and thereby assist with the control of wildfires in later years. On average approximately100,000 hectares, out of a total of 7.8 million hectares (about 1.5%), of public land is burnt in theannual fuel reduction burning program. (Note: Some vegetation types in Victoria are not ecologicallysuited to prescribed burning and these are excluded from the FRB program.) The Department ofNatural Resources and Environment (NRE) has most of the responsibility for fuel reduction burningon public land, due to its obligations for hazard reduction under the Forests Act 1958.
The majority of the area burnt is in areas identified in Fire Protection Plans as being of strategicimportance. The Code of Practice for Fire Management on Public Land (NRE 1995) identifiesfive Fuel Management Zones (FMZs) that have a range of fuel management and ecologicalobjectives. Zone 1 has as its aim the protection of human life, property and assets, and therefore thezone where fuel hazards are to be kept at their lowest possible levels commensurate with the localland management objectives. Zones 2, 3 and 4 are then seen as being of decreasing importancefrom a fuel management perspective. Zone 2 is intended to provide long strategic “corridors” of fuelreduced area which can act as a barrier to large, fast-moving wildfires. Zone 5 is intended not to beprescribed burnt during the period of the Fire Protection Plan.
Although a number of Victorian studies have investigated the effectiveness of fuel reduction burning inspecific case studies (Billing 1981, Rawson et al. 1985, Grant and Wouters 1993) there had notbeen a Statewide evaluation of the effectiveness of the broadscale fuel reduction burning program.
The increase in the number of dwellings and other assets on private land in close proximity toforested public land means that it has become increasingly important to ensure that all fire protectionworks, involving both prevention and suppression strategies, are effective.
Whilst past research, combined with operational experience, strongly indicates that FRB is veryeffective in reducing fire hazard, it is equally important to acknowledge that FRB is associated withecological impacts, and that factors such as human health (from smoke), and greenhouse issuesshould also be considered in any holistic evaluation of the practice. Neither does this study addressthe cost-benefits of FRB, nor the question of how much area should be burnt in the FRB program toachieve the desired level of fire protection. Such evaluations are well beyond the scope of this study,but these issues are the subject of complementary research and development by NRE and itscollaborators.
Fuel reduction burning has a number of effects on forest fuels, and these effects diminish with time(Tolhurst et al 1992). Immediately following a fuel reduction burn (or a wildfire which may havesimilar effects on the fuel), litter and fine surface fuels are generally significantly reduced throughburning. Depending on the site and the intensity of the burn, elevated shrub and bark fuels are oftenalso significantly reduced.
Tolhurst et al. (1992) reported that, following fuel reduction burns in the Wombat Forest in CentralVictoria, litter/surface fine fuels reaccumulated to pre-burn levels in 3 to 5 years (surface fine fuel
Effectiveness of Broadscale FRB - McCarthy & Tolhurst (2001) 5
being predominantly the dead leaf, bark and twig material on the ground and the fine grasses).Tolhurst et al. (1992) also reported that, where the burn consumed elevated shrub and tree barkfuels, the levels of these were significantly reduced for up to 25 years following the burn.
It therefore appears that, while fuel reduction burns may only reduce surface fuel levels for arelatively short time, there is a much longer effect on bark and elevated fuels.
McCarthy and Tolhurst (1998) reported that elevated and bark fuel hazard levels were significantlyhigher in the few cases where first attack failure occurred during wildfire suppression operations inVictoria for the period 1991/92 - 1994/95. They also reported the absence of any significant fuelreduction burning within the last 15 years for the sites where first attack operations failed.
Therefore, depending on the site and the vegetation, it is likely that fuel reduction burning would needto be less than 10 years old for it to have significant effects in assisting with wildfire suppressionoperations. This concurs with the findings of Grant and Wouters (1993) and Rawson et al. (1985)who found the best effect on wildfire incidence and containment occurred from burns which wereless than 5 years old. Two burns older than this - 7 years old - were reported by Buckley (1990)and Grant and Wouters (1993) as still having a significant hazard-reducing effect, and in these casesthe effect was attributed to a reduction in the bark and elevated fuel hazard levels.
The assessment of the various components of fuel hazard (viz. elevated fuel, bark on trees, andsurface fine fuel) has been simplified in Victoria in recent years by the production of the ElevatedFuel Guide (Wilson 1993) and the Bark Hazard Guide (Wilson 1992a). These two guides follow avisual assessment procedure based on a series of reference photographs accompanied by verbaldescriptions, and allow fire managers to assess the re-accumulation of bark and elevated fuel hazardsand judge when levels have built up to the stage where fuel reduction burning is required. A visualand rapid measurement system for the assessment of litter/surface fine fuels and near-surface fuelswas proposed by McCarthy (2000). Assessment of the three components of fuel hazard to give anOverall Fuel Hazard rating for a site can now be done operationally using the Overall Fuel HazardGuide (McCarthy et al. 1999). This Guide represents a major advance in the assessment of fuelhazards in a rapid and cost effective manner.
The techniques outlined in the Overall Fuel Hazard Guide were used in this study to measure boththe Overall Fuel Hazard levels for a site, as well as the hazard levels for the three individualcomponents of surface fine fuel, bark and elevated fuels.
The aims of this study were to investigate:
1) What reduction in Overall Fuel Hazard was required to assist with the suppression of asubsequent wildfire on the same site.
2) How frequent fuel reduction burns need to be undertaken to maintain Overall Fuel Hazards at orbelow levels identified in 1) above.
3) How effective the strategic placement of Fuel Management Zones (1, 2 & 3) were and how wellfuels in these Zones have been managed.

6 Effectiveness of Broadscale FRB - McCarthy & Tolhurst (2001)
METHODS
The methods, results and analysis are presented in three parts. Part 1 deals with the primary sampleof 114 fires Statewide, for which detailed data were collected on fuel hazard, weather, topography,resources and FRB effect. Part 2 uses two samples of fires (for which only distribution data andFRB effect were collected), the first of 152 fires - to investigate how fires with an FRB effect weredistributed across the FMZs - and the second of 1501 fires, to investigate the general occurrenceof all fires by FMZ. Part 3 deals with a sample of all fires (2425 fires) on public land over sevenfire seasons from 1990/91 to 1996/97 (for which only FRB influence data were collected). It wasdone to investigate the overall percentage of fires on public land which were influenced byprevious FRB.
Part 1. Wildfires for which detailed data were collected (114 fires, 1990/91 – 1997/98)
Selection of Fires
Wildfires to be analysed as part of this study were selected principally from the six fire seasonspreceding and including 1997/98. There were two main reasons for this. Firstly, data collectionrelied principally on interviewing relevant fire control staff, and the most recent information wasconsidered to be the freshest in people’s memories and therefore of the best reliability. Secondlybroad strategic FRB zones (Fuel Management Zone 2 - strategic corridors) have only beenincorporated into Fire Protection Plans since the late 1980s, with limited opportunities for them all tobe rotationally burnt between 1987/88 and 1993/94, due to a series of mild seasons.
One hundred and fourteen wildfires were selected from across Victoria to give Statewideapplicability to the results. Approximately 25-30 wildfires in each of FMZs 1, 2 and 3 were selectedto investigate possible differences in fuel hazard levels attained/maintained and hence their influenceon fire suppression performance. While it was quite easy to find sufficient fires to collect data from inFMZ 3, there were relatively few fires in FMZ 1 and FMZ 2 for which useful data could becollected.
Fires were selected by sorting the FIRES database (Fire Information and Recording System, adatabase managed by NRE1 ). Sorting was carried out to select a range of sites and final fire sizes.Sorting was hampered by the fact that FMZ was not recorded on the Final Fire Report (the FinalFire Report is one of the primary information input forms into the FIRES database - it summariseswildfire information for each individual fire by site, times/dates, cause, weather, fire behaviour, FRBinfluence, NRE response, total suppression forces, costs and any investigation data). Fires forFMZs 1 & 2 were mostly identified by the fact that, on the Final Fire Report, they were noted ashaving some influence from a previous FRB . Hence the sample of fires obtained for these Zoneswas biased towards fires for which there was some influence of a previous FRB (as reported in theFIRES database).
1 (The FIRES database is a computer-based data storage and analysis facility. It contains mainly records fromFinal Fire Reports, and has information back to 1972/73. It began in 1988, and was networked across theDepartment in 1988/89, which allowed remote viewing and data entry. It was designed specifically for reliabilityand integrity, using features such as finite selection lists, and data entry crosscheck rules, to reduce input error.Data were also checked centrally after fire district entry, and queried for obvious inconsistency. It has alwayshad security via restricted and hierarchical access. It was superseded by the Fireweb/IFIS system in early 2001.Fireweb/IFIS now contains all the data from FIRES.)
Effectiveness of Broadscale FRB - McCarthy & Tolhurst (2001) 7
For FMZ 3, the main aim was to sample a range of final fire sizes, which was relatively easy toachieve. Some of the fires in FMZ 3 were also deliberately selected from those which had influenceof previous FRBs, in order to investigate the factors of previous fuel hazard reduction which mayhave influenced the suppression operation. This sampling was therefore not just a random selectionfrom FMZ 3, as a random selection may not have sufficiently sampled either fire size variation, orinfluences due to previous fuel reduction.
The fire districts from which data were collected did not include any which had large amounts ofurban interface. This was done deliberately, as it was found during data collection that the largenumber of small blocks of State forest scattered in and around larger regional centres, such asBallarat and Bendigo, represented a set of circumstances which were quite complex. That is, thevery large task of fuel management across these small blocks meant that it was very difficult toconduct fuel hazard reduction burning on a regular basis. The increased risk of deliberate ignitionsfurther complicated the situation in these locations. Therefore, it was decided that they would begenerally excluded from the current study, but may well warrant separate detailed investigation in thefuture.
The mallee vegetation in north-western Victoria was also not included in this study. The fireprotection strategies used in that region differ from those used in forested areas and would haveconfounded the results. A separate study of the effectiveness of fuel management in this area isconsidered warranted, however.
Data collected for each fire
A range of fuel, weather, site, topography, fire behaviour and fuel reduction burn effect variableswere collected for each fire as follows:
(i) Fuel
The three individual components of fuel hazard - surface fine fuel; bark; and elevated - wereassessed for both the site at first attack, and also for the final control line. Fuel hazard, bothcomponent and Overall, was assessed using the Overall Fuel Hazard Guide (McCarthy et al. 1999).At the final control line, fuel hazard levels were recorded for both inside and outside the line, in orderto evaluate situations where a wildfire was stopped by a recent FRB on the other side of a track orroad. Thus fuel hazard was assessed at three locations altogether.
(ii) Weather
Air temperature, relative humidity, and wind direction and speed were collected for both the firstattack period and also for the conditions at the final control line. Where local records were notavailable for this purpose, records from the nearest Bureau of Meteorology Automatic WeatherStation (AWS) were used. Some interpolation of values was undertaken where the fire site differedsubstantially in altitude from the AWS site. These weather variables were then used to calculate theForest Fire Danger Index (FDI) at both first attack and also the final control line.
(iii) Site and topography
The first attack and final control line sites were assessed for the site variables of slope and aspect.Occurrence on a ridge-top or side-slope was also noted.
8 Effectiveness of Broadscale FRB - McCarthy & Tolhurst (2001)
(iv) Fire behaviour
Forward rate of spread (FROS), flame height and spotting distance were recorded as primarymeasures of fire behaviour at both first attack and also at the final control line. Initial fire size - that isthe size of the fire at the time of first attack - and also final fire size were recorded. Figures wererecorded for both perimeter and area. All fire behaviour information was the best estimate of theperson on the fireline at the particular time. It was not measured precisely, except in the fewinstances where fire research or other fire situation staff were present.
(v) Fuel reduction burn effects
Where known, the age of the last wildfire or fuel reduction burn on the site was recorded. Wherethis was not known but appeared to be long unburnt, 15 years was used as a default figure. Fromthe work of Tolhurst et al. (1992) it was inferred that all three components of fuel (surface fine,bark, and elevated) would be approaching pre-burn hazard levels at 15-20 years post-burn.
Various questions were asked of fire controllers to attempt to ascertain if any, and what level of, fuelreduction burning had influenced the behaviour of the subsequent wildfire on the site.
Questions asked were:What percentage of the headfire burnt through or into an FRB?Did the FRB slow the headfire?Did the FRB assist suppression?Did the FRB stop the headfire?Did the headfire encounter an area of naturally low fuel hazard?Was the headfire stopped on a fuelbreak such as a track or firebreak?
The data were analysed using non-linear regression techniques, as most of the information on theeffects of FRB on subsequent wildfires was collected as categorical data.
Part 2. Sample of wildfires from nine fire districts (1653 fires, 1990/91 – 1996/97)
To investigate the relative proportions of how fires occurred by FMZ, as distinct from how wildfiresencountered FRBs by FMZ, a sample of fires was taken from 9 of the 24 fire districts acrossVictoria. The first part of this sample entailed sending fire management officers (FMOs) a record ofall the fires in their fire district which encountered an FRB in the period 1990/91 to 1996/97. TheFMOs were then asked to classify these fires by FMZ.
The second part of the sample entailed overlaying the fire origins map on the FMZ map for each firedistrict, and counting overall numbers of fires by FMZ for the same period.
These two results were then graphed, and the relative occurrences were compared using aChi-square test.

Effectiveness of Broadscale FRB - McCarthy & Tolhurst (2001) 9
Part 3. Statewide sample of fires (2425 fires, 1990/91 – 1996/97)
A Statewide sample of wildfires was also taken (using the FIRES database) from the period1990/91 to 1996/97. All fires which occurred on public land, and could therefore be expected to besubject to the influence of a previous wildfire or a FRB, were sorted from the total number of fires.Within this sample, the total number of fires having some influence from a previous FRB or wildfirewas also sorted.
10 Effectiveness of Broadscale FRB - McCarthy & Tolhurst (2001)
RESULTS
As highlighted in the Methods section of this report, data collection for the report could not be doneon a completely random basis for a variety of technical or other reasons. As a consequence of thisintentional (and unavoidable) bias in data collection, the results should not be regarded as definitive ina statistical sense, and any conclusions drawn from the findings must be appropriately qualified.Although it is likely that the general trends of the results are valid, further studies are necessary toconfirm this. The future availability of digital Geographic Information System (GIS) data on fireoccurrence, fire history and FMZ should make this possible.
Part 1. Fires for which detailed data was collected for this study
Selection of fires
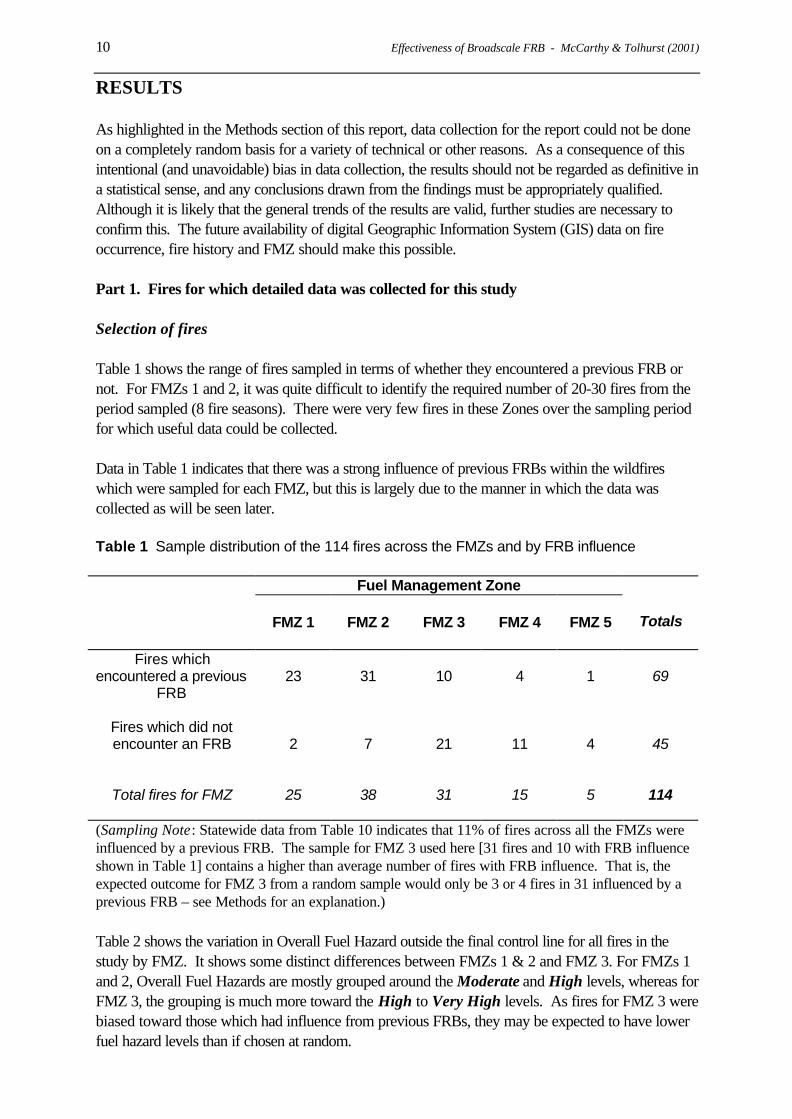
Table 1 shows the range of fires sampled in terms of whether they encountered a previous FRB ornot. For FMZs 1 and 2, it was quite difficult to identify the required number of 20-30 fires from theperiod sampled (8 fire seasons). There were very few fires in these Zones over the sampling periodfor which useful data could be collected.
Data in Table 1 indicates that there was a strong influence of previous FRBs within the wildfireswhich were sampled for each FMZ, but this is largely due to the manner in which the data wascollected as will be seen later.
Table 1 Sample distribution of the 114 fires across the FMZs and by FRB influence
Fuel Management Zone
FMZ 1 FMZ 2 FMZ 3 FMZ 4 FMZ 5 Totals
Fires whichencountered a previous
FRB23 31 10 4 1 69
Fires which did notencounter an FRB 2 7 21 11 4 45
Total fires for FMZ 25 38 31 15 5 114
(Sampling Note: Statewide data from Table 10 indicates that 11% of fires across all the FMZs wereinfluenced by a previous FRB. The sample for FMZ 3 used here [31 fires and 10 with FRB influenceshown in Table 1] contains a higher than average number of fires with FRB influence. That is, theexpected outcome for FMZ 3 from a random sample would only be 3 or 4 fires in 31 influenced by aprevious FRB – see Methods for an explanation.)
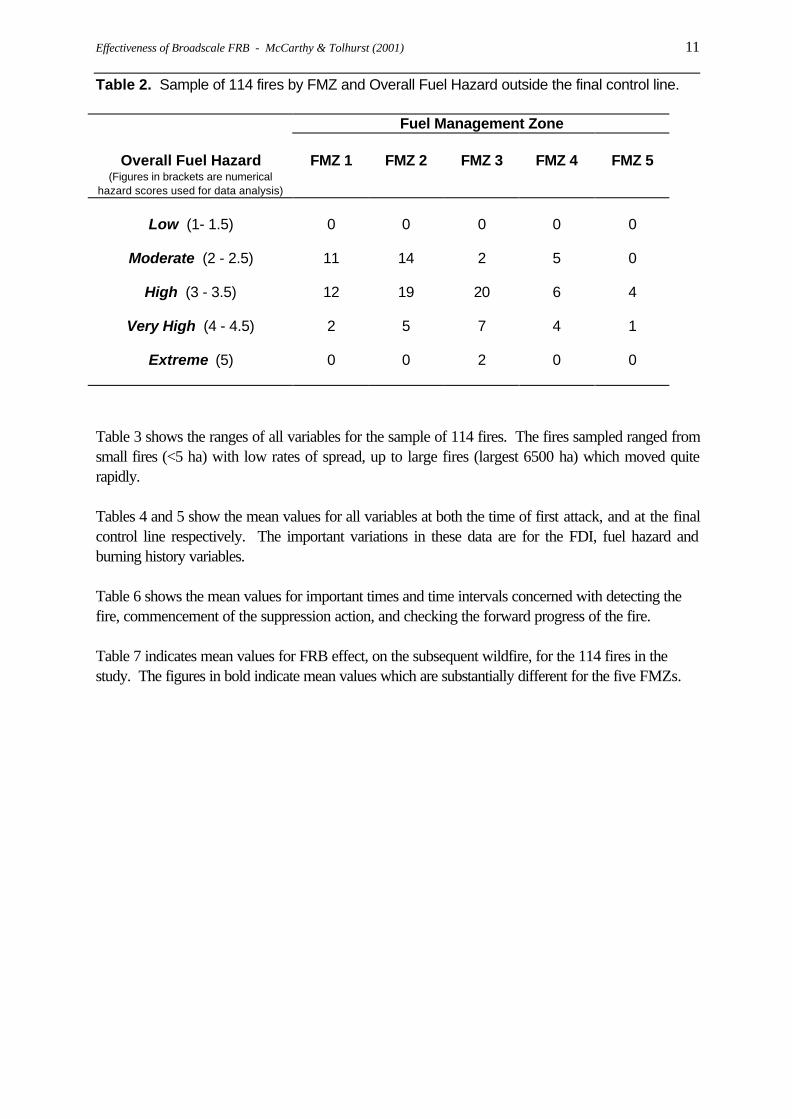
Table 2 shows the variation in Overall Fuel Hazard outside the final control line for all fires in thestudy by FMZ. It shows some distinct differences between FMZs 1 & 2 and FMZ 3. For FMZs 1and 2, Overall Fuel Hazards are mostly grouped around the Moderate and High levels, whereas forFMZ 3, the grouping is much more toward the High to Very High levels. As fires for FMZ 3 werebiased toward those which had influence from previous FRBs, they may be expected to have lowerfuel hazard levels than if chosen at random.
Effectiveness of Broadscale FRB - McCarthy & Tolhurst (2001) 11
Table 2. Sample of 114 fires by FMZ and Overall Fuel Hazard outside the final control line.
Fuel Management Zone
Overall Fuel Hazard(Figures in brackets are numerical
hazard scores used for data analysis)
FMZ 1 FMZ 2 FMZ 3 FMZ 4 FMZ 5
Low (1- 1.5) 0 0 0 0 0
Moderate (2 - 2.5) 11 14 2 5 0
High (3 - 3.5) 12 19 20 6 4
Very High (4 - 4.5) 2 5 7 4 1
Extreme (5) 0 0 2 0 0
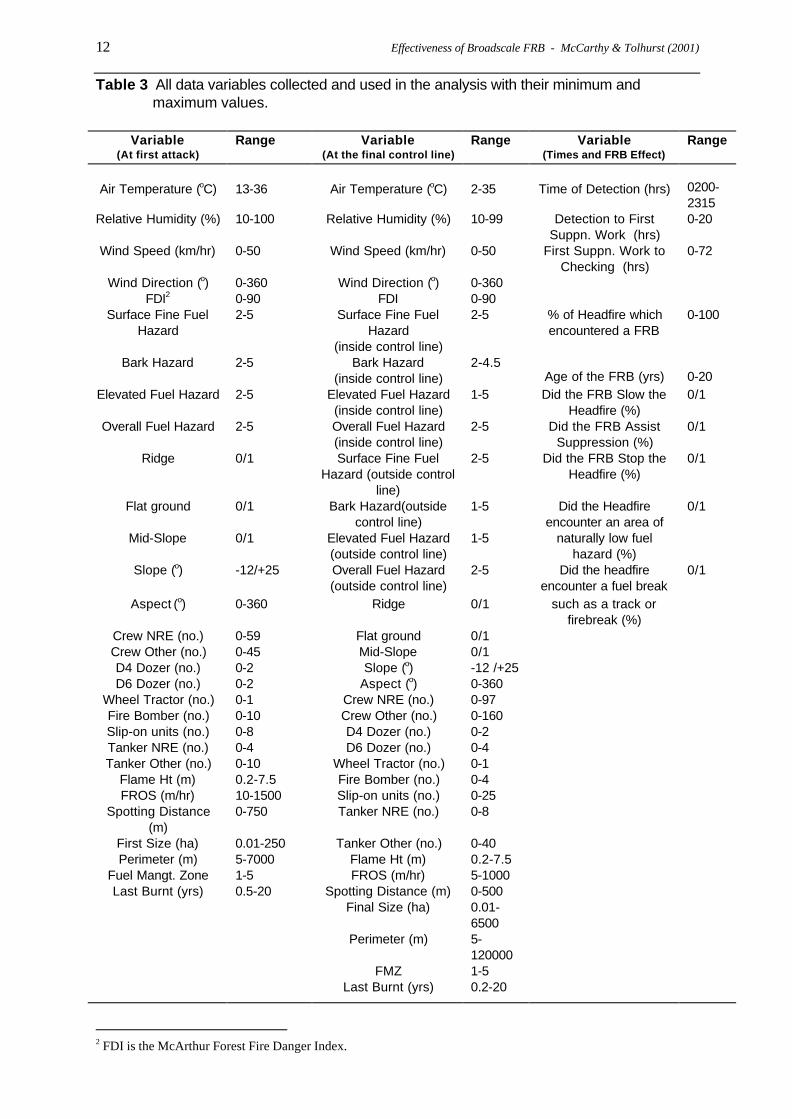
Table 3 shows the ranges of all variables for the sample of 114 fires. The fires sampled ranged fromsmall fires (<5 ha) with low rates of spread, up to large fires (largest 6500 ha) which moved quiterapidly.
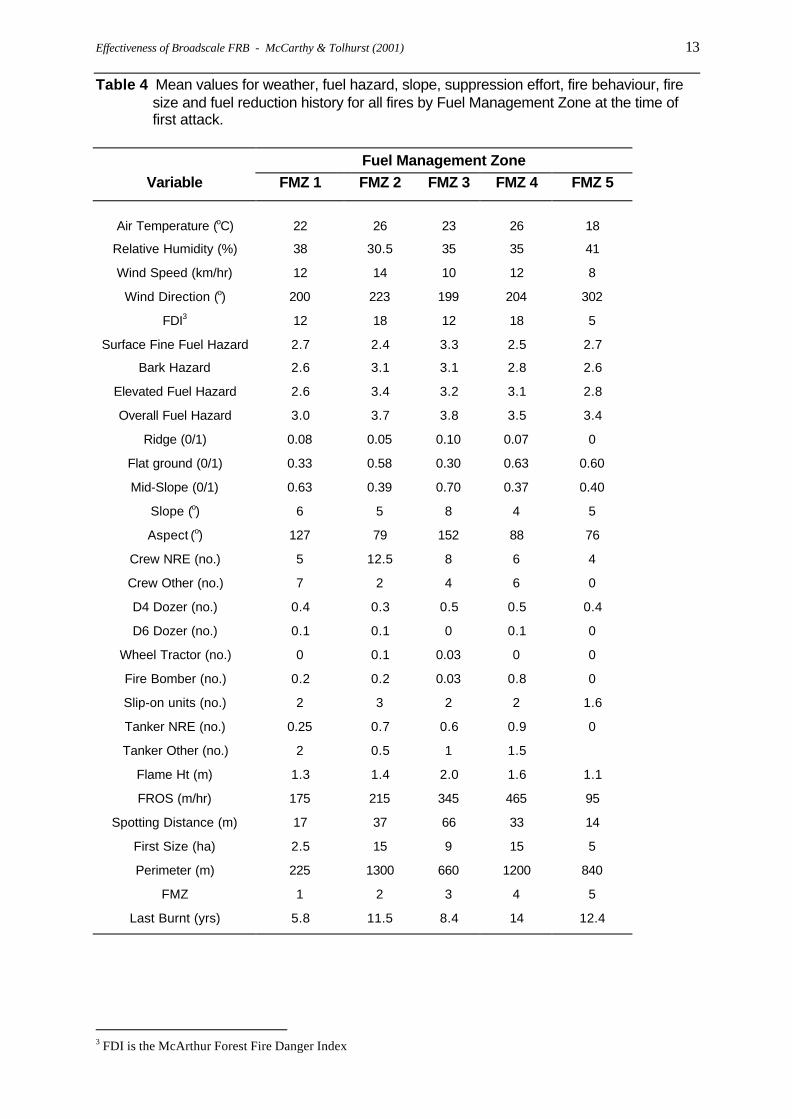
Tables 4 and 5 show the mean values for all variables at both the time of first attack, and at the finalcontrol line respectively. The important variations in these data are for the FDI, fuel hazard andburning history variables.
Table 6 shows the mean values for important times and time intervals concerned with detecting thefire, commencement of the suppression action, and checking the forward progress of the fire.
Table 7 indicates mean values for FRB effect, on the subsequent wildfire, for the 114 fires in thestudy. The figures in bold indicate mean values which are substantially different for the five FMZs.
12 Effectiveness of Broadscale FRB - McCarthy & Tolhurst (2001)
Table 3 All data variables collected and used in the analysis with their minimum andmaximum values.
Variable(At first attack)
Range Variable(At the final control line)
Range Variable(Times and FRB Effect)
Range
Air Temperature (oC) 13-36 Air Temperature (oC) 2-35 Time of Detection (hrs) 0200-2315
Relative Humidity (%) 10-100 Relative Humidity (%) 10-99 Detection to FirstSuppn. Work (hrs)
0-20
Wind Speed (km/hr) 0-50 Wind Speed (km/hr) 0-50 First Suppn. Work toChecking (hrs)
0-72
Wind Direction (o) 0-360 Wind Direction (o) 0-360FDI2 0-90 FDI 0-90
Surface Fine FuelHazard
2-5 Surface Fine FuelHazard
(inside control line)
2-5 % of Headfire whichencountered a FRB
0-100
Bark Hazard 2-5 Bark Hazard(inside control line)
2-4.5Age of the FRB (yrs) 0-20
Elevated Fuel Hazard 2-5 Elevated Fuel Hazard(inside control line)
1-5 Did the FRB Slow theHeadfire (%)
0/1
Overall Fuel Hazard 2-5 Overall Fuel Hazard(inside control line)
2-5 Did the FRB AssistSuppression (%)
0/1
Ridge 0/1 Surface Fine FuelHazard (outside control
line)
2-5 Did the FRB Stop theHeadfire (%)
0/1
Flat ground 0/1 Bark Hazard(outsidecontrol line)
1-5 Did the Headfireencounter an area of
0/1
Mid-Slope 0/1 Elevated Fuel Hazard(outside control line)
1-5 naturally low fuelhazard (%)
Slope (o) -12/+25 Overall Fuel Hazard(outside control line)
2-5 Did the headfireencounter a fuel break
0/1
Aspect (o) 0-360 Ridge 0/1 such as a track orfirebreak (%)
Crew NRE (no.) 0-59 Flat ground 0/1Crew Other (no.) 0-45 Mid-Slope 0/1D4 Dozer (no.) 0-2 Slope (o) -12 /+25D6 Dozer (no.) 0-2 Aspect (o) 0-360
Wheel Tractor (no.) 0-1 Crew NRE (no.) 0-97Fire Bomber (no.) 0-10 Crew Other (no.) 0-160Slip-on units (no.) 0-8 D4 Dozer (no.) 0-2Tanker NRE (no.) 0-4 D6 Dozer (no.) 0-4Tanker Other (no.) 0-10 Wheel Tractor (no.) 0-1
Flame Ht (m) 0.2-7.5 Fire Bomber (no.) 0-4FROS (m/hr) 10-1500 Slip-on units (no.) 0-25
Spotting Distance(m)
0-750 Tanker NRE (no.) 0-8
First Size (ha) 0.01-250 Tanker Other (no.) 0-40Perimeter (m) 5-7000 Flame Ht (m) 0.2-7.5
Fuel Mangt. Zone 1-5 FROS (m/hr) 5-1000Last Burnt (yrs) 0.5-20 Spotting Distance (m) 0-500
Final Size (ha) 0.01-6500
Perimeter (m) 5-120000
FMZ 1-5Last Burnt (yrs) 0.2-20
2 FDI is the McArthur Forest Fire Danger Index.
Effectiveness of Broadscale FRB - McCarthy & Tolhurst (2001) 13
Table 4 Mean values for weather, fuel hazard, slope, suppression effort, fire behaviour, firesize and fuel reduction history for all fires by Fuel Management Zone at the time offirst attack.
Fuel Management ZoneVariable FMZ 1 FMZ 2 FMZ 3 FMZ 4 FMZ 5
Air Temperature (oC) 22 26 23 26 18
Relative Humidity (%) 38 30.5 35 35 41
Wind Speed (km/hr) 12 14 10 12 8
Wind Direction (o) 200 223 199 204 302
FDI3 12 18 12 18 5
Surface Fine Fuel Hazard 2.7 2.4 3.3 2.5 2.7
Bark Hazard 2.6 3.1 3.1 2.8 2.6
Elevated Fuel Hazard 2.6 3.4 3.2 3.1 2.8
Overall Fuel Hazard 3.0 3.7 3.8 3.5 3.4
Ridge (0/1) 0.08 0.05 0.10 0.07 0
Flat ground (0/1) 0.33 0.58 0.30 0.63 0.60
Mid-Slope (0/1) 0.63 0.39 0.70 0.37 0.40
Slope (o) 6 5 8 4 5
Aspect (o) 127 79 152 88 76
Crew NRE (no.) 5 12.5 8 6 4
Crew Other (no.) 7 2 4 6 0
D4 Dozer (no.) 0.4 0.3 0.5 0.5 0.4
D6 Dozer (no.) 0.1 0.1 0 0.1 0
Wheel Tractor (no.) 0 0.1 0.03 0 0
Fire Bomber (no.) 0.2 0.2 0.03 0.8 0
Slip-on units (no.) 2 3 2 2 1.6
Tanker NRE (no.) 0.25 0.7 0.6 0.9 0
Tanker Other (no.) 2 0.5 1 1.5
Flame Ht (m) 1.3 1.4 2.0 1.6 1.1
FROS (m/hr) 175 215 345 465 95
Spotting Distance (m) 17 37 66 33 14
First Size (ha) 2.5 15 9 15 5
Perimeter (m) 225 1300 660 1200 840
FMZ 1 2 3 4 5
Last Burnt (yrs) 5.8 11.5 8.4 14 12.4
3 FDI is the McArthur Forest Fire Danger Index
14 Effectiveness of Broadscale FRB - McCarthy & Tolhurst (2001)
Table 5 Mean values for weather, fuel hazard, slope, suppression effort, fire behaviour, firesize and fuel reduction history for all fires by FMZ the final control line.
Fuel Management Zone
Variable FMZ 1 FMZ 2 FMZ 3 FMZ 4 FMZ 5
Air Temperature (oC) 20 24 19 23 17
Relative Humidity (%) 45 32 40 42 51Wind Speed (km/hr) 10 11.5 6.5 12 7
Wind Direction (o) 175 225 160 195 290FDI 8 16 7 15 5
Surface Fine Fuel Hazard(inside control line)
2.6 2.1 3.2 2.6 2.9
Bark Hazard(inside control line)
2.7 3.0 3.0 2.7 2.4
Elevated Fuel Hazard(inside control line)
2.5 3.3 2.9 3.0 2.2
Overall Fuel Hazard(inside control line)
3.0 3.6 3.5 3.3 3.2
Surface Fine Fuel Hazard(outside control line)
2.5 2.2 3.2 2.6 2.9
Bark Hazard(outside control line)
2.6 2.4 3.0 2.5 2.4
Elevated Fuel Hazard(outside control line)
2.5 2.7 2.8 2.7 2.6
Overall Fuel Hazard(outside control line)
2.9 3.0 3.6 3.0 3.2
Ridge (0/1) 0.13 0.11 0.10 0.07 0Flat ground (0/1) 0.38 0.55 0.30 0.50 0.60Mid-Slope (0/1) 0.54 0.39 0.66 0.50 0.40
Slope (o) 5 5 8 6.5 5.5Aspect (o) 110 7 135 120 75
Crew NRE (no.) 13 21 21 24 7Crew Other (no.) 26 9 9 6 0D4 Dozer (no.) 0.4 0.7 0.7 0.7 0.4D6 Dozer (no.) 0.4 0.2 0.7 0.7 0
Wheel Tractor (no.) 0 0.2 0.05 0.1 0.2Fire Bomber (no.) 0.4 0.2 0.3 0.2 0Slip-on units (no.) 3 4.5 3.5 6 2Tanker NRE (no.) 0.6 1 1.3 1.8 0.4Tanker Other (no.) 7 1.7 2.5 2 0
Flame Ht (m) 0.8 1.2 1.3 0.7 0.8FROS (m/hr) 95 170 160 180 85
Spotting Distance (m) 3 11 25 3 0Final Size (ha) 17 200 340 395 12Perimeter (m) 765 4260 8820 6675 1450
FMZ 1 2 3 4 5
Last Burnt (yrs) 5.1 7.5 11.8 13.1 13.4
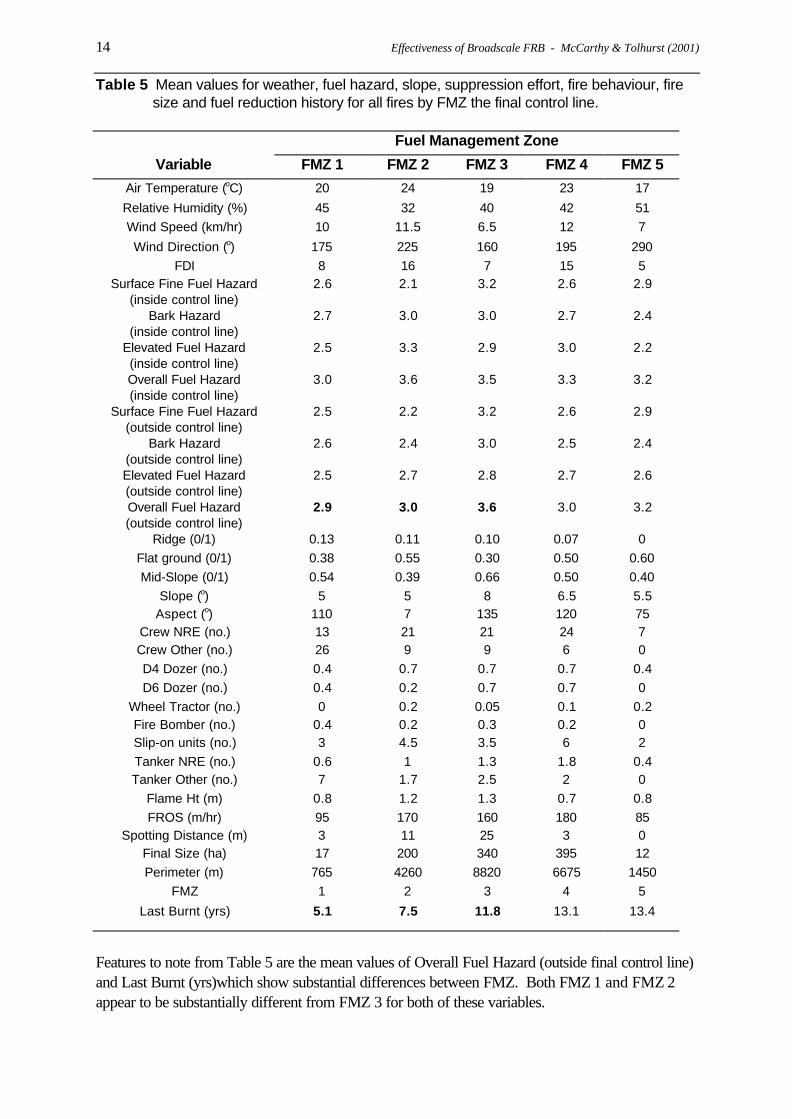
Features to note from Table 5 are the mean values of Overall Fuel Hazard (outside final control line)and Last Burnt (yrs)which show substantial differences between FMZ. Both FMZ 1 and FMZ 2appear to be substantially different from FMZ 3 for both of these variables.
Effectiveness of Broadscale FRB - McCarthy & Tolhurst (2001) 15
Table 6 Mean values for time intervals for all fires by Fuel Management Zone at the finalcontrol line.
Fuel Management ZoneTime interval FMZ 1 FMZ 2 FMZ 3 FMZ 4 FMZ 5
Time of Detection (24 hr) 14:40 14:50 14:30 16:10 13:30
Detection to First Suppn. Work(hrs)
1.4 1.3 0.9 1.6 5
First Suppn. Work to Checking(hrs)
3.3 5.5 10.5 12 3
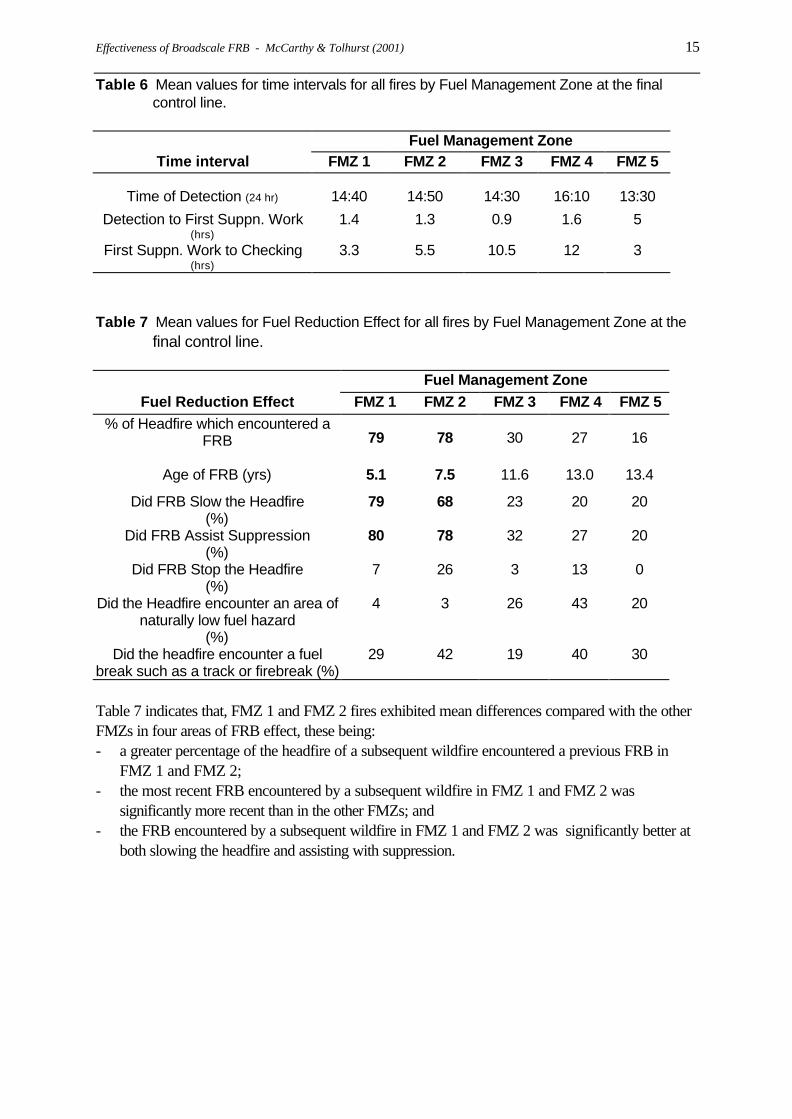
Table 7 Mean values for Fuel Reduction Effect for all fires by Fuel Management Zone at thefinal control line.
Fuel Management ZoneFuel Reduction Effect FMZ 1 FMZ 2 FMZ 3 FMZ 4 FMZ 5
% of Headfire which encountered aFRB 79 78 30 27 16
Age of FRB (yrs) 5.1 7.5 11.6 13.0 13.4
Did FRB Slow the Headfire(%)
79 68 23 20 20
Did FRB Assist Suppression(%)
80 78 32 27 20
Did FRB Stop the Headfire(%)
7 26 3 13 0
Did the Headfire encounter an area ofnaturally low fuel hazard
(%)
4 3 26 43 20
Did the headfire encounter a fuelbreak such as a track or firebreak (%)
29 42 19 40 30
Table 7 indicates that, FMZ 1 and FMZ 2 fires exhibited mean differences compared with the otherFMZs in four areas of FRB effect, these being:- a greater percentage of the headfire of a subsequent wildfire encountered a previous FRB in
FMZ 1 and FMZ 2;- the most recent FRB encountered by a subsequent wildfire in FMZ 1 and FMZ 2 was
significantly more recent than in the other FMZs; and- the FRB encountered by a subsequent wildfire in FMZ 1 and FMZ 2 was significantly better at
both slowing the headfire and assisting with suppression.
16 Effectiveness of Broadscale FRB - McCarthy & Tolhurst (2001)
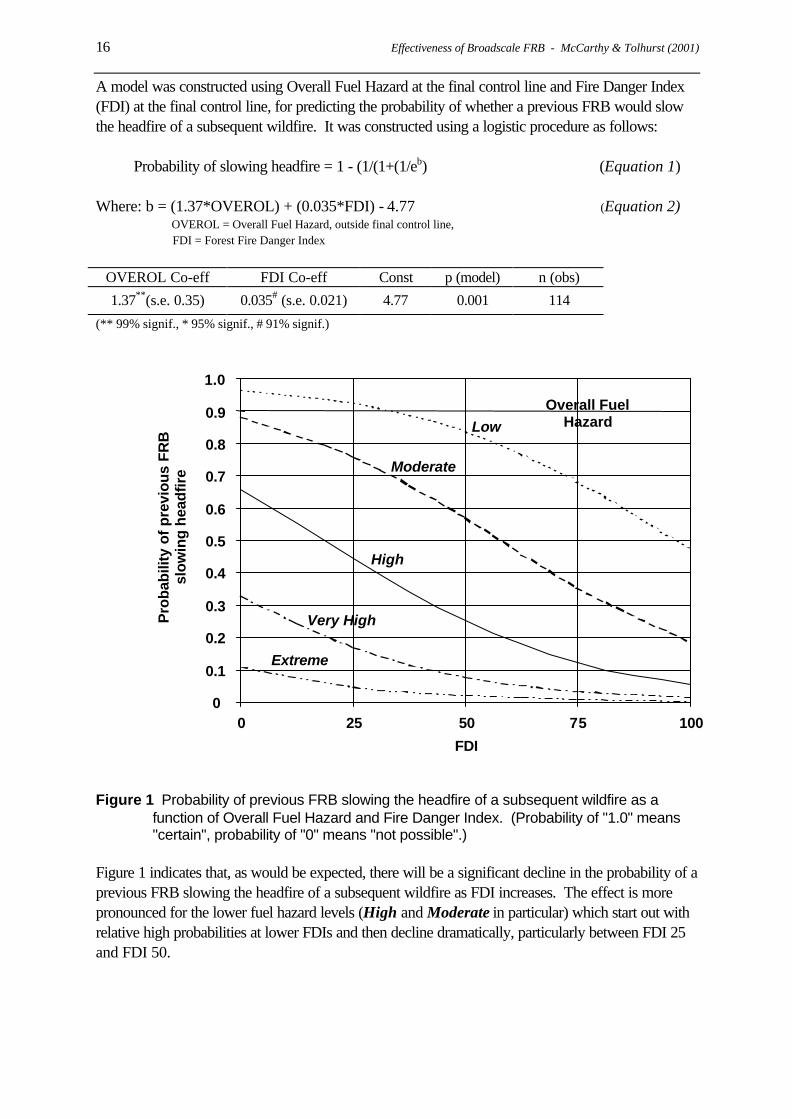
A model was constructed using Overall Fuel Hazard at the final control line and Fire Danger Index(FDI) at the final control line, for predicting the probability of whether a previous FRB would slowthe headfire of a subsequent wildfire. It was constructed using a logistic procedure as follows:
Probability of slowing headfire = 1 - (1/(1+(1/eb) (Equation 1)
Where: b = (1.37*OVEROL) + (0.035*FDI) - 4.77 (Equation 2)OVEROL = Overall Fuel Hazard, outside final control line,FDI = Forest Fire Danger Index
OVEROL Co-eff FDI Co-eff Const p (model) n (obs)
1.37**(s.e. 0.35) 0.035# (s.e. 0.021) 4.77 0.001 114
(** 99% signif., * 95% signif., # 91% signif.)
0
0.1
0.2
0.3
0.4
0.5
0.6
0.7
0.8
0.9
1.0
0 25 50 75 100
Pro
babi
lity
of p
revi
ous
FRB
slo
win
g h
ead
fire
FDI
Overall FuelHazardLow
Moderate
High
Very High
Extreme
Figure 1 Probability of previous FRB slowing the headfire of a subsequent wildfire as afunction of Overall Fuel Hazard and Fire Danger Index. (Probability of "1.0" means"certain", probability of "0" means "not possible".)
Figure 1 indicates that, as would be expected, there will be a significant decline in the probability of aprevious FRB slowing the headfire of a subsequent wildfire as FDI increases. The effect is morepronounced for the lower fuel hazard levels (High and Moderate in particular) which start out withrelative high probabilities at lower FDIs and then decline dramatically, particularly between FDI 25and FDI 50.
Effectiveness of Broadscale FRB - McCarthy & Tolhurst (2001) 17
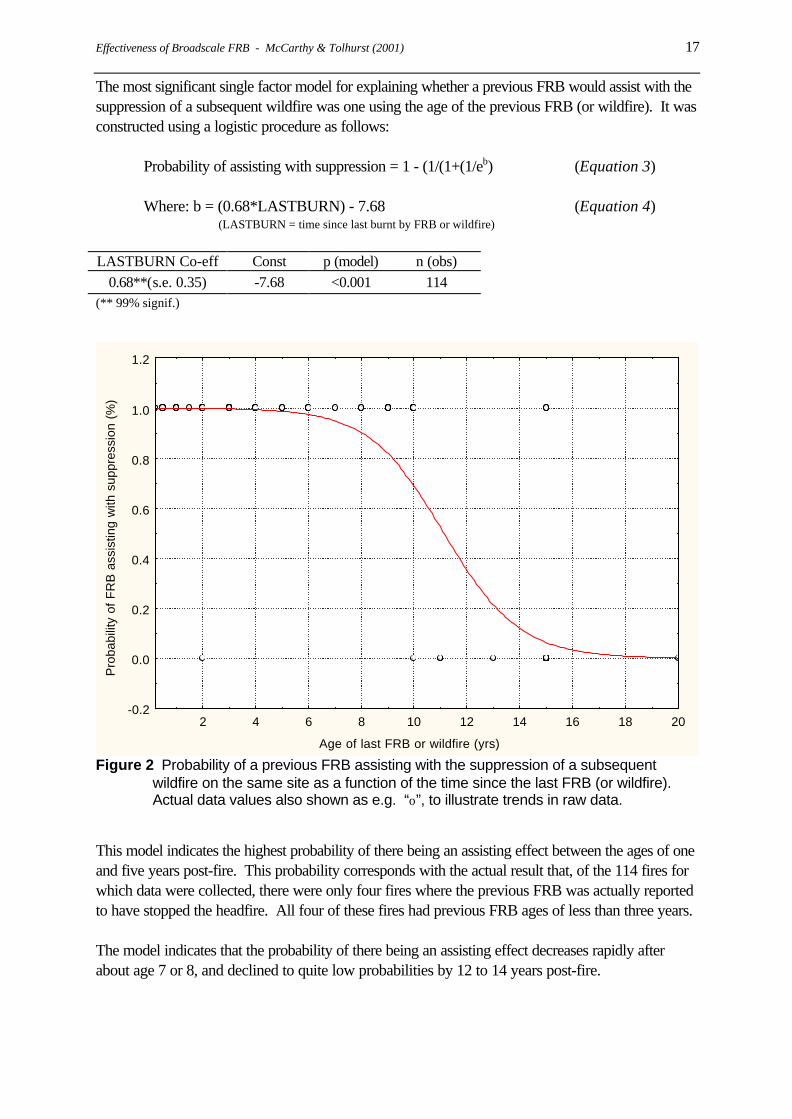
The most significant single factor model for explaining whether a previous FRB would assist with thesuppression of a subsequent wildfire was one using the age of the previous FRB (or wildfire). It wasconstructed using a logistic procedure as follows:
Probability of assisting with suppression = 1 - (1/(1+(1/eb) (Equation 3)
Where: b = (0.68*LASTBURN) - 7.68 (Equation 4)(LASTBURN = time since last burnt by FRB or wildfire)
LASTBURN Co-eff Const p (model) n (obs)0.68**(s.e. 0.35) -7.68 <0.001 114
(** 99% signif.)
Age of last FRB or wildfire (yrs)
Pro
babi
lity
of F
RB
ass
istin
g w
ith s
uppr
essi
on (
%)
-0.2
0.0
0.2
0.4
0.6
0.8
1.0
1.2
2 4 6 8 10 12 14 16 18 20
Figure 2 Probability of a previous FRB assisting with the suppression of a subsequentwildfire on the same site as a function of the time since the last FRB (or wildfire).Actual data values also shown as e.g. “ο”, to illustrate trends in raw data.
This model indicates the highest probability of there being an assisting effect between the ages of oneand five years post-fire. This probability corresponds with the actual result that, of the 114 fires forwhich data were collected, there were only four fires where the previous FRB was actually reportedto have stopped the headfire. All four of these fires had previous FRB ages of less than three years.
The model indicates that the probability of there being an assisting effect decreases rapidly afterabout age 7 or 8, and declined to quite low probabilities by 12 to 14 years post-fire.
18 Effectiveness of Broadscale FRB - McCarthy & Tolhurst (2001)
Part 2. Sample of fires from nine fire districts
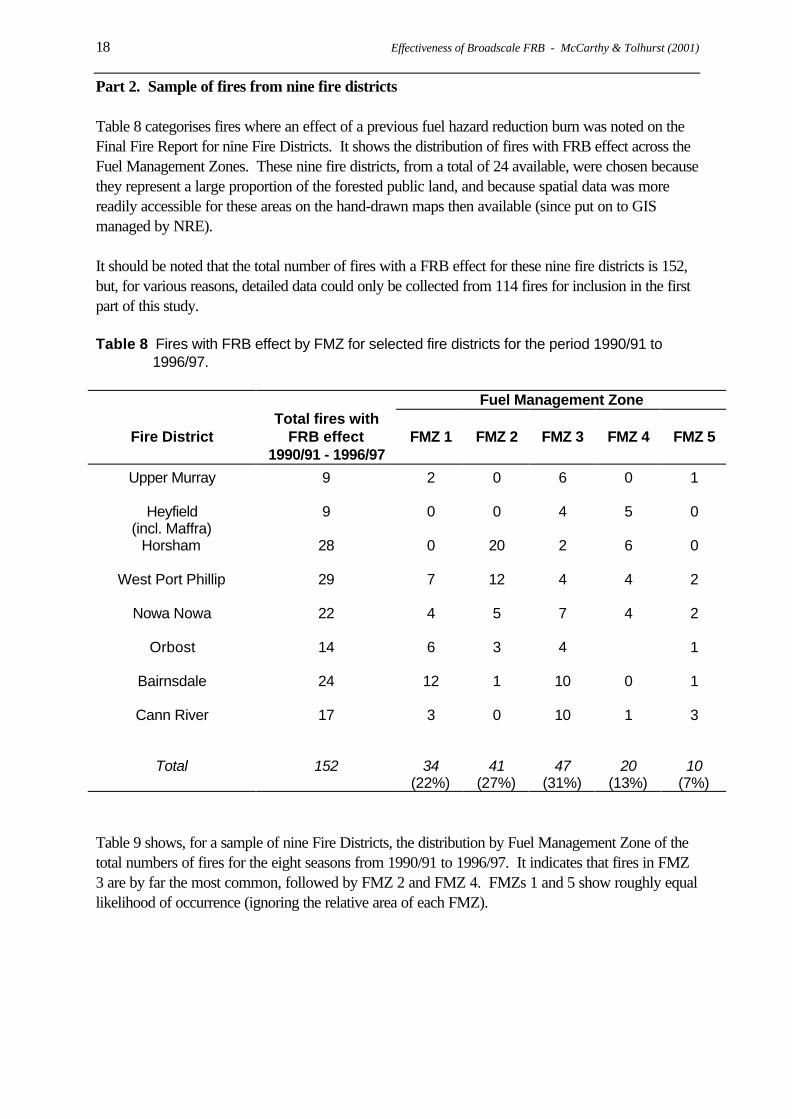
Table 8 categorises fires where an effect of a previous fuel hazard reduction burn was noted on theFinal Fire Report for nine Fire Districts. It shows the distribution of fires with FRB effect across theFuel Management Zones. These nine fire districts, from a total of 24 available, were chosen becausethey represent a large proportion of the forested public land, and because spatial data was morereadily accessible for these areas on the hand-drawn maps then available (since put on to GISmanaged by NRE).
It should be noted that the total number of fires with a FRB effect for these nine fire districts is 152,but, for various reasons, detailed data could only be collected from 114 fires for inclusion in the firstpart of this study.
Table 8 Fires with FRB effect by FMZ for selected fire districts for the period 1990/91 to1996/97.
Fuel Management Zone
Fire DistrictTotal fires with
FRB effect1990/91 - 1996/97
FMZ 1 FMZ 2 FMZ 3 FMZ 4 FMZ 5
Upper Murray 9 2 0 6 0 1
Heyfield(incl. Maffra)
9 0 0 4 5 0
Horsham 28 0 20 2 6 0
West Port Phillip 29 7 12 4 4 2
Nowa Nowa 22 4 5 7 4 2
Orbost 14 6 3 4 1
Bairnsdale 24 12 1 10 0 1
Cann River 17 3 0 10 1 3
Total 152 34(22%)
41(27%)
47(31%)
20(13%)
10(7%)
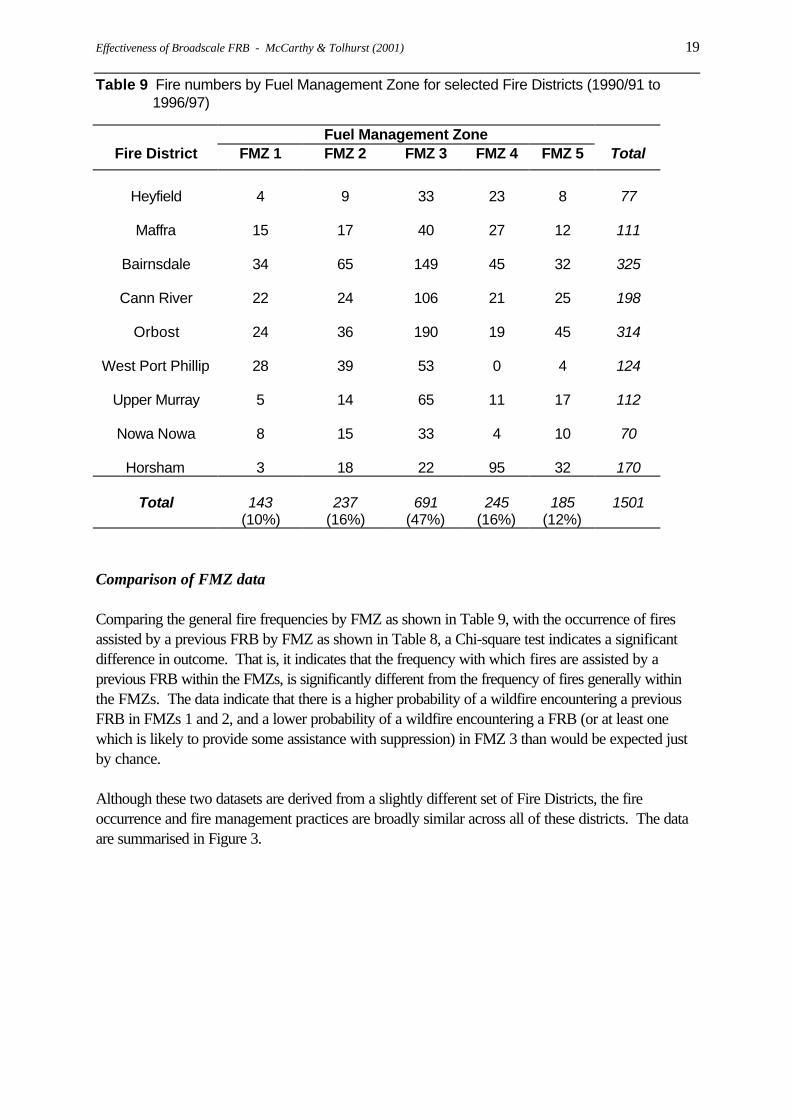
Table 9 shows, for a sample of nine Fire Districts, the distribution by Fuel Management Zone of thetotal numbers of fires for the eight seasons from 1990/91 to 1996/97. It indicates that fires in FMZ3 are by far the most common, followed by FMZ 2 and FMZ 4. FMZs 1 and 5 show roughly equallikelihood of occurrence (ignoring the relative area of each FMZ).
Effectiveness of Broadscale FRB - McCarthy & Tolhurst (2001) 19
Table 9 Fire numbers by Fuel Management Zone for selected Fire Districts (1990/91 to1996/97)
Fuel Management ZoneFire District FMZ 1 FMZ 2 FMZ 3 FMZ 4 FMZ 5 Total
Heyfield 4 9 33 23 8 77
Maffra 15 17 40 27 12 111
Bairnsdale 34 65 149 45 32 325
Cann River 22 24 106 21 25 198
Orbost 24 36 190 19 45 314
West Port Phillip 28 39 53 0 4 124
Upper Murray 5 14 65 11 17 112
Nowa Nowa 8 15 33 4 10 70
Horsham 3 18 22 95 32 170
Total 143(10%)
237(16%)
691(47%)
245(16%)
185(12%)
1501
Comparison of FMZ data
Comparing the general fire frequencies by FMZ as shown in Table 9, with the occurrence of firesassisted by a previous FRB by FMZ as shown in Table 8, a Chi-square test indicates a significantdifference in outcome. That is, it indicates that the frequency with which fires are assisted by aprevious FRB within the FMZs, is significantly different from the frequency of fires generally withinthe FMZs. The data indicate that there is a higher probability of a wildfire encountering a previousFRB in FMZs 1 and 2, and a lower probability of a wildfire encountering a FRB (or at least onewhich is likely to provide some assistance with suppression) in FMZ 3 than would be expected justby chance.
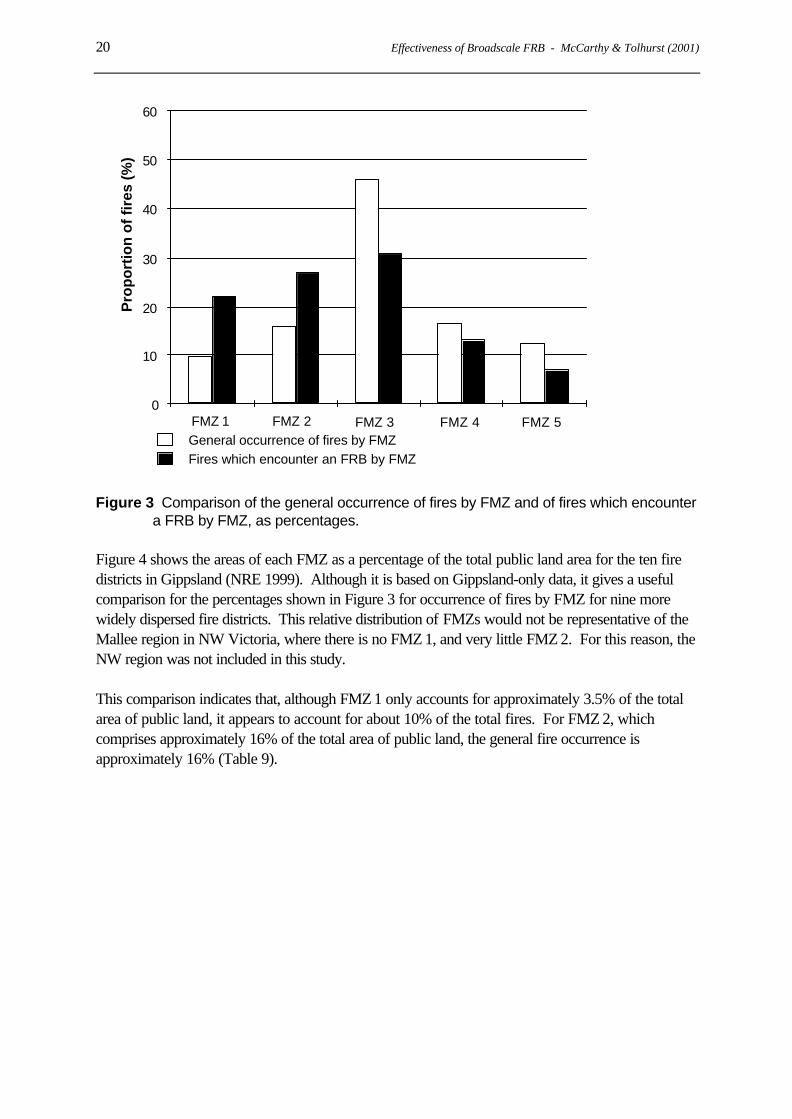
Although these two datasets are derived from a slightly different set of Fire Districts, the fireoccurrence and fire management practices are broadly similar across all of these districts. The dataare summarised in Figure 3.
20 Effectiveness of Broadscale FRB - McCarthy & Tolhurst (2001)
0
10
20
30
40
50
60
FMZ 1 FMZ 2 FMZ 3 FMZ 4 FMZ 5
Pro
po
rtio
n o
f fir
es (%
)
General occurrence of fires by FMZFires which encounter an FRB by FMZ
Figure 3 Comparison of the general occurrence of fires by FMZ and of fires which encountera FRB by FMZ, as percentages.
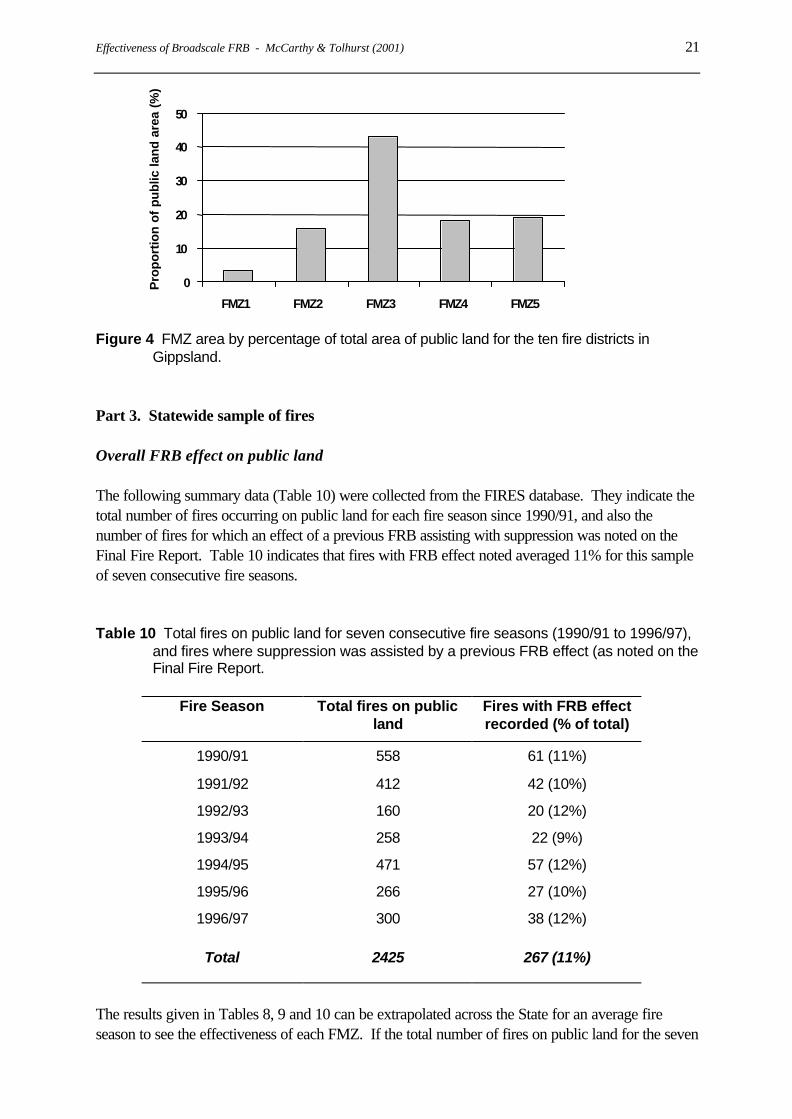
Figure 4 shows the areas of each FMZ as a percentage of the total public land area for the ten firedistricts in Gippsland (NRE 1999). Although it is based on Gippsland-only data, it gives a usefulcomparison for the percentages shown in Figure 3 for occurrence of fires by FMZ for nine morewidely dispersed fire districts. This relative distribution of FMZs would not be representative of theMallee region in NW Victoria, where there is no FMZ 1, and very little FMZ 2. For this reason, theNW region was not included in this study.
This comparison indicates that, although FMZ 1 only accounts for approximately 3.5% of the totalarea of public land, it appears to account for about 10% of the total fires. For FMZ 2, whichcomprises approximately 16% of the total area of public land, the general fire occurrence isapproximately 16% (Table 9).
Effectiveness of Broadscale FRB - McCarthy & Tolhurst (2001) 21
Figure 4 FMZ area by percentage of total area of public land for the ten fire districts inGippsland.
Part 3. Statewide sample of fires
Overall FRB effect on public land
The following summary data (Table 10) were collected from the FIRES database. They indicate thetotal number of fires occurring on public land for each fire season since 1990/91, and also thenumber of fires for which an effect of a previous FRB assisting with suppression was noted on theFinal Fire Report. Table 10 indicates that fires with FRB effect noted averaged 11% for this sampleof seven consecutive fire seasons.
Table 10 Total fires on public land for seven consecutive fire seasons (1990/91 to 1996/97),and fires where suppression was assisted by a previous FRB effect (as noted on theFinal Fire Report.
Fire Season Total fires on publicland
Fires with FRB effectrecorded (% of total)
1990/91 558 61 (11%)
1991/92 412 42 (10%)
1992/93 160 20 (12%)
1993/94 258 22 (9%)
1994/95 471 57 (12%)
1995/96 266 27 (10%)
1996/97 300 38 (12%)
Total 2425 267 (11%)
The results given in Tables 8, 9 and 10 can be extrapolated across the State for an average fireseason to see the effectiveness of each FMZ. If the total number of fires on public land for the seven
0
10
20
30
40
50
FMZ1 FMZ2 FMZ3 FMZ4 FMZ5
Pro
po
rtio
n o
f p
ub
lic la
nd
are
a (%
)
22 Effectiveness of Broadscale FRB - McCarthy & Tolhurst (2001)
fire seasons from 1990/91 to 1996/97 was 2425 as indicated by the FIRES database, then theannual average number of fires is 346. The FIRES database has also shown that around 11% of allfires encounter an area previously burnt by a FRB which assists in fire suppression (Table 10). If it isassumed that the distribution of fires across the State is similar to that in nine representative FireDistricts shown in Table 9, then around 10% of the 346 wildfires (35) will occur in FMZ 1, 16% ofthe 346 wildfires (55) will occur in FMZ 2 and 47% of the wildfires (163) will occur in FMZ 3 onaverage each year. Given that about 11% of all wildfires are likely to encounter a "helpful" FRB,then around 38 of the 346 wildfires should be easier to suppress because of a FRB. Again,assuming that the effectiveness of the FMZs is similar across the State to that of the ninerepresentative Fire Districts shown in Table 8, then 22% of the 38 "helpful" FRBs should occur inFMZ 1, which represents eight of the 35 fires or 23% of wildfires in FMZ 1. Similarly, 18% of thewildfires in FMZ 2 and only 7% of the wildfires in FMZ 3 will encounter a FRB which will assist infire suppression operations.

Effectiveness of Broadscale FRB - McCarthy & Tolhurst (2001) 23
DISCUSSION
There are two aspects of this study which need to be considered. The first is the effectiveness of anindividual FRB in assisting with suppression once a subsequent wildfire runs into it. The second iswhether or not the current Fuel Management Zones are located in the right places to interceptpotentially destructive wildfires.
Effectiveness of an FRB once encountered by a subsequent wildfire
That Overall Fuel Hazard level on the sites where a previous FRB assisted with suppression wasnever more than High appears to confirm the findings of previous work on Overall Fuel Hazard andfirst attack effectiveness (McCarthy et al. 1999, McCarthy and Tolhurst 1998). The evidence of allthese studies strongly suggests, that sites which accumulate Overall Fuel Hazards of anything morethan High offer little prospect of any assistance to suppression of a subsequently occurring wildfire.
The average age of the previous FRB in FMZ 1 areas was around five years (Table 7). This issomewhat less than the 10 year period suggested by Tolhurst et al. (1992) over which a previousFRB may provide useful reductions in bark and elevated fuel hazards. Tolhurst et al. (1992) alsoinferred that by five years post-fire, surface fine fuel hazards/loads would have easily re-accumulatedto pre-burn levels. This suggests that the principal effect of a previous FRBs in assisting withsuppression of subsequent wildfires in FMZ 1 is mostly in terms of reduced elevated and bark fuelhazards. This is almost certainly the case for FMZ 2 also where the average age of the previous FRBwas around seven years.
The mean figures for Overall Fuel Hazard outside the final control line indicate that the type of fuelhazard reduction operations carried out in FMZ 1 and 2 areas have been more effective atmaintaining levels of Overall Fuel Hazard of High or less. That is, these types of operations mayhave been, due to both higher fire intensities and higher fire frequencies, significantly more effective atreducing bark and elevated fuel hazards to the stage where Overall Fuel Hazard levels were likely toassist with subsequent suppression operations. The mean component fuel hazard level numericalscores of approximately 2.6 (Moderate to High) for Bark hazard, and 2.5 (Moderate to High) forElevated fuel hazard for FMZs 1 and 2 support this (Table 5).
The single factor predictive model using the time since the last FRB or wildfire serves to enhancesome trends which have been suggested by earlier work. In particular, the model indicates that thefrequency of burning is very important to the usefulness of fuel reduction burning, and that the mostobvious effects on subsequent wildfires are produced by FRBs which are no more than two to fouryears-old.
In the very few instances where a previous FRB actually stopped the headfire of a subsequentwildfire (only 4 fires out of 114), the age of the previous FRB was always less than 3 years. This isquite expected given the findings of Tolhurst et al. (1992), Chatto (1996) and McCarthy (2000) thatsurface fine fuel hazards re-accumulate to pre-burn levels within the first 2 to 4 years after burning forforests with extensive litter beds. It is likely that only a previous FRB of 3 years or less in age willhave discontinuous surface fuels, and importantly, to the extent that they will not support a continuoussurface fire.
24 Effectiveness of Broadscale FRB - McCarthy & Tolhurst (2001)
The other important trend from this model is that FRBs any older than 10 years will have a very lowprobability of assisting with suppression. This concurs well with the findings of Tolhurst et al. (1992)in regard to reduced levels of bark and elevated fuels in Central Victoria. It seems likely that theseresults will apply more generally across the State, and particularly where substantial bark andelevated fuels are present.
The predictive model, using FDI and Overall Fuel Hazard to predict the probability of a previousFRB slowing the headfire of a subsequent wildfire, shows trends in relation to what is likely to occuras fire danger increases. It indicates that even for sites of High Overall Fuel Hazard or less, theprobability of a previous FRB slowing the headfire of a subsequent wildfire, to a point which assistssuppression, declines quite rapidly as FDI increases. There is a higher probability of a previous FRBslowing the headfire of a subsequent wildfire when FDIs are lower, while higher FDIs are more likelyto give rise to uncontrollable fire behaviour even when fuel hazard levels are lower. More severeweather conditions and lower fuel moisture contents, which are able to negate the benefits ofreduced fuel hazards, may explain this.
Another contributing factor may be that, at higher fire intensities due to higher FDIs, longer flamelengths are able to bridge the gap between surface fuels and unburnt bark fuels, particularly on siteswhere the bark has only been charred to 2 m or less (bark hazard High to Very High). Futureprescribed burning for hazard reduction may be more effective if more bark fuels further up the boleare burnt (thus reducing the bark hazard to Moderate to High).
Effectiveness of the location of the FMZs.
The main implications of the results reported here are that, while there appears to have been asignificant effect of previous Fuel Reduction Burns (FRBs) assisting with the suppression of wildfiresin Fuel Management Zones (FMZs) 1 and 2, the results for FMZ 3 are inconclusive. That is, therewas no clear strategic benefit from FMZ 3 - the likelihood of there being an assisting effect in FMZ 3was no better than if burning had been located randomly across the forest. This probably relates tothe frequency of burning which has been achieved in FMZ 3, which averaged just over 11 years forthe fires analysed in this study (remembering also that this represents an "artificially" low mean figurefor FMZ 3, because the sample for FMZ 3 deliberately included more than the expected number offires which had some influence from a previous FRB).
It is possible that elevated and bark fuel hazards in many FMZ 3 areas, with inter-fire periods of 11years or more, are re-accumulating to levels where they are unlikely to produce assistance with thesuppression of subsequent wildfires. The mean numerical hazard score value obtained of 3.6 forOverall Fuel Hazard outside the final control line supports this, as this indicates an Overall FuelHazard rating of High to Very High. Overall Fuel Hazards of this level are unlikely to be of anybenefit to firefighters, and in fact substantially reduce the probability of first attack efforts succeeding(McCarthy and Tolhurst 1998).
The higher probabilities of assistance in FMZs 1 and 2 may also be related to both closer proximityof these zones generally to suppression force centres, as well as to the better access provided withinthem by the relative absence of elevated fuels.
The average of only 11% of fires on public land over the last decade having any influence from aprevious FRB (as noted on the Final Fire Report) is a general concern. Given the emphasis which
Effectiveness of Broadscale FRB - McCarthy & Tolhurst (2001) 25
NRE has placed on the implementation of Fire Protection Plans, and the consequent level ofbroadscale fuel hazard reduction burning undertaken, this level of 11% raises questions of just whatconstitutes an effective and lasting fuel hazard reduction prescribed burn. However the finding thatfires in FMZs 1 and 2 have a relatively high probability of encountering a previous FRB indicatesthat they are well located, and effective if rotational burning is maintained.
Anecdotal information collected during this study indicated that some FMZ 1 and FMZ 2 areas maynot have been rotationally burnt since the Fuel Management Zoning system came into place. That is,a combination of finite resources and relatively short prescribed burning seasons during the 1990s,may have led to planned FRB targets for FMZ 1 and FMZ 2 areas not being met.
This anecdotal information from Fire Management Officers also suggested that the level of fuelhazard reduction burning in FMZ 3 had never reached the original target levels set at the beginning ofthe Fire Protection Planning process in the late 1980s. This information further suggests thatconsistent under-achievement in FMZ 3 was a fact of operational life. Priority is given to burning inFMZ 1 and FMZ 2 where possible for obvious strategic reasons. In the light of this anecdotalinformation, it may be appropriate to review the way in which targets are set for prescribed burningfor fuel management within the various FMZs, and particularly FMZ 3.
26 Effectiveness of Broadscale FRB - McCarthy & Tolhurst (2001)
CONCLUSIONS
The following conclusions are prefaced by the acknowledgement that the results have been derivedfrom a biased data set. Also, a retrospective type study approach was taken in order to provideadvanced insights into the effectiveness of broadscale FRB on public land in Victoria. A classicalexperimental approach to investigate this complex and highly variable issue would have beenexceptionally difficult and expensive, with results not available for many years, whereas qualifiedresults from the present study can be immediately used to guide policy development and on-groundoperational practice. It is likely that the qualified conclusions below are generally correct from aStatewide perspective, but further analysis of an expanded data set would be wise to confirm them.
Maintaining Overall Fuel Hazard levels at High or less by fuel hazard reduction, is significant inproviding a situation where there will be assistance to the suppression of a subsequent wildfire.Levels of Moderate to High or less, as found in most FMZ 1 and 2 areas, give higher probabilitiesof there being an assisting effect. Models have been produced to illustrate this effect.
Increasing ‘Fire Danger Indices’ tend to reduce the probability of there being an effect of slowingrates of spread from previous fuel hazard reduction burning on most sites, even where Overall FuelHazards have been kept at Moderate or less. The predictive model constructed indicates that, onHigh Overall Fuel Hazard sites, the probability of a previous FRB slowing rates of spread drops toless than 50% at FDIs over 25.
The maximum period of usefulness of an FRB appears to be about 10 years, after which bark andelevated fuels add to surface fuels to produce fire behaviour which is not readily controllable.Effective fuel reduction in the future should be aimed at reducing particularly bark and elevated fuelhazards to produce the most lasting fuel reduction effects.
Prescribed burning for fuel hazard reduction has had a significant effect in assisting with thesuppression of subsequent wildfires in Fuel Management Zones 1 and 2, with often between 20%and 50% of wildfires (depending on the fire district) in these zones encountering a previous fuelhazard reduction burn which can slow the headfire and assist with suppression.
In Fuel Management Zone 3, the general effect across this zone is such that only around 7% ofwildfires in this zone encounter a previous fuel hazard reduction burn which is useful in assisting withsuppression. Lack of effectiveness of previous FRBs in FMZ 3 appears to be mainly related tofrequency of burning. This in turn could be related to either available resources to conduct FRB orlimited opportunities for FRB due to unfavourable weather conditions during the prescribed burningseasons.
ACKNOWLEDGEMENTS
The authors wish to thank Dr David Flinn, Michael Leonard and Jonathan Sanders for their valuablecomments on the manuscript and the many NRE Fire Management and Parks Victoria staff whowillingly supported the project by providing the base data for this study.
Effectiveness of Broadscale FRB - McCarthy & Tolhurst (2001) 27
REFERENCES
Billing, P. (1981) The effectiveness of fuel reduction burning. Five case histories. Fire ResearchBranch Report No. 10. Forests Commission Victoria. Nov 1981. 13pp.
Buckley, A. (1990) Fire behaviour and fuel reduction burning – Bemm River wildfire, October1988. Fire Research Report No. 28, Dept. Conservation & Environment, Victoria. 25pp.
Chatto, K. (1996) Fuel hazard levels in relation to site characteristics and fire history - ChilternRegional Park case study. Fire Research Report No. 43 Dept. Natural Resources andEnvironment, Victoria. 34pp.
Grant, S. and Wouters, M. (1993) The effect of fuel reduction burning on the suppression of fourwildfires in western Victoria. Dept. Conservation and Natural Resources, Victoria, FireResearch Report No. 41, Dec 1993. 38pp.
McCarthy, G. J., Tolhurst, K.G., and Chatto, K. (1999) Overall Fuel Hazard Guide. ResearchReport 47. Fire Management. Dept. Natural Resources and Environment Victoria. 28pp.
McCarthy, G.J. (2000) Fuel hazard rating for forest fuels - surface fine fuel hazard. ResearchReport No. 44. Fire Management Branch, Dept. Natural Resources and Environment,Victoria. 30pp.
McCarthy, G.J. and Tolhurst, K.G. (1998) Effectiveness of fire-fighting first attack operations, NREVictoria 1991/92-1994/95. Research Report No. 45. Fire Management Branch. Dept.Natural Resources and Environment, Victoria. 46pp.
NRE (1995) Code of Practice for Fire Management on Public Land. Dept. Natural Resourcesand Environment, Victoria. 38pp.
NRE (1999) Gippsland Fire Protection Plan. Prepared by McDonald, J. McI., Fire Management,Dept. Natural Resources and Environment, Victoria. 64pp.
Rawson, R., Billing, P., and Rees, B. (1985) Effectiveness of fuel reduction burning. Fire ResearchReport No. 25. Dept. Conservation, Forests & Lands, Victoria. 49pp.
Tolhurst, K.G., Kellas, J.D. and Wilson, A.A.G. (1992) Low intensity fire behaviour and fueldynamics in dry sclerophyll forest, Wombat State Forest. In: Tolhurst, K.G. and Flinn, D.W.(1992) Ecological Impacts of Fuel Reduction Burning in Dry Sclerophyll Forest.Research Report No. 349. Forest Research, Dept. Conservation and Natural Resources,Victoria. 40pp.
Wilson, A.A.G. (1992) Eucalypt Bark Hazard Guide. Research Report No. 32, Fire ManagementBranch, Dept. Conservation and Environment, Victoria. 16pp.
Wilson, A.A.G. (1993) Elevated Fuel Guide. Research Report No. 35. Fire Management Branch,Dept. Conservation and Natural Resources, Victoria. 27pp.