brookwood and oak grove fields, black warrior basin,...
TRANSCRIPT
Production history matching to determine reservoir properties of important coal groups in the Upper Pottsville formation, Brookwood and Oak Grove fields, Black Warrior Basin, Alabama
C. Özgen Karacan*
NIOSH, Office of Mine Safety and Health Research, 626 Cochrans Mill Road, PO Box 18070, Pittsburgh, PA 15236, USA
Abstract
The Black Warrior Basin of Alabama is one of the most important coal mining and coalbed
methane production areas in the United States. Methane control efforts through degasification that
started almost 25 years ago for the sole purpose of ensuring mining safety resulted in more than
5000 coalbed methane wells distributed within various fields throughout the basin. The wells are
completed mostly in the Pratt, Mary Lee, and Black Creek coal groups of the Upper Pottsville
formation and present a unique opportunity to understand methane reservoir properties of these
coals and to improve their degasification performances.
The Brookwood and Oak Grove fields in the Black Warrior Basin are probably two of the most
important fields in the basin due to current longwall coal mining activities. In this work, methane
and water productions of 92 vertical wellbores drilled, some completed 20 years ago, over a
current large coal mine district located in these two fields, were analyzed by history matching
techniques. The boreholes were completed at the Mary Lee coal group, or at combinations of the
Pratt, Mary Lee, and Black Creek groups. History matching models were prepared and performed
according to properties of each coal group.
Decline curve analyses showed that effective exponential decline rates of the wells were between
2% and 25% per year. Results of production history matching showed, although they varied by
coal group, that pressure decreased as much as 80% to nearly 25 psi in some areas and resulted in
corresponding decreases in methane content. Water saturation in coals decreased from 100% to
between 20 and 80%, improving gas relative permeabilities to as much as 0.8. As a result of
primary depletion, permeability of coal seams increased between 10 and 40% compared to their
original permeability, which varied between 1 and 10 md depending on depth and coal seam.
These results not only can be used for diagnostic and interpretation purposes, but can be used as
parameter distributions in probabilistic simulations, as illustrated in the last section of this paper.
They can also be used in conjunction with spatial modeling and geological considerations to
calculate potential methane emissions in operating mines.
* Tel.: +1 412 3864008; fax: +1 412 3866595. [email protected]..
Disclaimer: The findings and conclusions in this paper are those of the authors and do not necessarily represent the views of the National Institute for Occupational Safety and Health. Mention of any company name, product, or software does not constitute endorsement by NIOSH.
Appendix A. Supplementary materialSupplementary material related to this article can be found at http://dx.doi.org/10.1016/j.jngse.2012.10.005.
HHS Public AccessAuthor manuscriptJ Nat Gas Sci Eng. Author manuscript; available in PMC 2015 July 17.
Published in final edited form as:J Nat Gas Sci Eng. 2013 January ; 10: 51–67. doi:10.1016/j.jngse.2012.10.005.
Author M
anuscriptA
uthor Manuscript
Author M
anuscriptA
uthor Manuscript

Keywords
History matching; Black Warrior basin; Mary Lee coal group; Upper Pottsville formation; Coal reservoir properties
1. Introduction
1.1. Significance and objective
Ventilation of underground coal mines with adequate amounts of air is important to prevent
formation of explosive methane-air mixtures during mining operations. However, when gas
contents of coal seams are high, or their structural and reservoir properties favor high
methane emissions, ventilation alone may not be enough to keep methane levels within
statutory limits, increasing the potential for methane ignitions and explosions. At this
juncture, using vertical or horizontal degasification wells prior to mining is an effective way
to supplement ventilation to control methane emissions during mining and improve worker
safety (Diamond, 1994; Karacan et al., 2007, 2011; Moore, 2012).
Regardless of whether methane emissions can be controlled by ventilation alone or by any
pre-mining degasification methods, fluid-flow-related and fluid-storage-related reservoir
properties of the coal seam must be known. Coal seam pressure, permeability, relative
permeability, gas content, isotherms, and water saturation are most important. These
properties of the mined seam are not only important for estimating methane emissions into
the ventilation system but are also critical for the success of degasification operations prior
to mining. The importance of sorption, permeability, multiple influencing factors, and
relative permeability in coal seams are discussed in detail in various publications (e.g.
Saulsberry et al., 1996; Karacan, 2008; Busch and Gensterblum, 2011; Liu et al., 2011;
Clarkson et al., 2011). In addition, the effects of various mining and coal reservoir properties
on potential emissions into mine workings during development mining of coal seams are
discussed in Karacan (2008) using dynamic reservoir simulation.
If there are no producing wells in the field, proven techniques to determine coal reservoir
properties include laboratory analyses (Gash, 1991; Saulsberry et al., 1996), geophysical
logs (Li et al., 2011), and well testing methods (Aminian and Ameri, 2009; Nie et al., 2012).
The major problem is, however, that it is not easy to determine reservoir properties of coal
seams and they may be quite variable within the coal seam, even within relatively short
distances. In addition, each of these methods has advantages and disadvantages. For
example, laboratory analyses may not reproduce in-situ conditions, whereas well testing
techniques, although dependable, can be complicated, expensive, and sometimes require
lengthy times to gather and process the information. If there are existing wells which have
produced or have been producing for sufficiently long times, their production information
can be analyzed by decline curve and in history matching methods to determine reservoir
properties of coal seams.
In this paper, methane and water production of 92 vertical wellbores drilled in the
Brookwood and Oak Grove fields of the Black Warrior Basin were analyzed by history
Karacan Page 2
J Nat Gas Sci Eng. Author manuscript; available in PMC 2015 July 17.
Author M
anuscriptA
uthor Manuscript
Author M
anuscriptA
uthor Manuscript

matching techniques. The study area shown in Fig. 1 is approximately 12,900 acres and is
located on the border of Tuscaloosa and Jefferson counties. The coal mine located within the
study area has recently begun operation in the Mary Lee coal group to primarily extract the
Blue Creek seam by longwall method. The goal of this work is to determine reservoir
properties of Pratt, Mary Lee, and Black Creek coal groups separately, so the results can be
used in probabilistic simulations of methane production to estimate potential methane
emissions and better plan degasification drilling in advance of mining to reduce methane
levels to safe, manageable levels.
1.2. A brief description of the Black Warrior basin and Upper Pottsville formation in relation to this study
The Black Warrior basin is one of the most important coal mining and coalbed methane
production basins in the Alabama thrust belt and in the US. The basin has a complicated and
yet interesting sedimentary and structural geology that affects coal mining and gas
production. However, for the purpose of this paper, only a brief description of the basin and
the Pottsville formation that is most relevant to the current study and presented data will be
given.
The original intent of coalbed methane production, which still is one of the prime objectives,
was to decrease gas content of the coal seams to ensure safe mining. The first attempt to
degasify coal seams in the Black Warrior Basin started in 1971, in the Oak Grove field in
Jefferson County, with a 5-hole pattern drilled in the Mary Lee coal to reduce the emissions
of a then-operated mine. The results of this test showed that methane production using
vertical boreholes combined with hydraulic fracturing significantly decreased frictional
ignitions and methane explosion danger in the coal mine (Elder and Deul, 1974). After this
test, drilling vertical boreholes and fracture stimulation became a standard practice in the
area for mining safety and concurrent economic gas production. The wells completed in 5–
20 coal seams in various coal groups (Pashin et al., 2010a) ensured safe mining and
provided economic gas production. They also provided unique information about the
impacts of major stratigraphic, structural, and hydrogeological effects on coalbed methane
well performance.
The majority of the coal-bearing strata of economic value in the Black Warrior Basin are in
the Pennsylvanian age Pottsville formation. Coal bed gas is generally produced from the
Upper Pottsville formation shallower than 3000 ft (Pashin and Groshong, 1998). The Upper
Pottsville formation contains Brookwood, Utley, Gwin, Cobb, Pratt, Mary Lee, and Black
Creek coal groups. Among these coal groups, Pratt, Mary Lee, and Black Creek coal groups
are the most important due to ongoing coal mining and coal gas production activities (Fig.
2). These coal groups were studied in this paper to determine their reservoir properties using
history matching.
Pratt, Mary Lee, and Black Creek groups include individual seams of varying thickness
within the study area. The Pratt group contains the Pratt, Curry, and Gillespy seams, the
Mary Lee group contains the New Castle, Mary Lee, Blue Creek, and Jagger seams, and the
Black Creek group contains the upper and lower Black Creek seams (Fig. 2). The rank, or
maturity, of these coals ranges from high volatile A to low volatile depending on depth.
Karacan Page 3
J Nat Gas Sci Eng. Author manuscript; available in PMC 2015 July 17.
Author M
anuscriptA
uthor Manuscript
Author M
anuscriptA
uthor Manuscript
The southeast margin of the Black Warrior basin is upturned by strata folding into local
anticlines and synclines, namely the Blue Creek anticline and syncline (Fig. 1). These two
local folds bring the coal seams to the surface, where the reservoir pressure is relieved and
where the coal seams can accept meteoric waters. Structural deformation in the general area
has significant effect on the performance of coalbed methane reservoirs, the hydrodynamics
in the area, and on the pressure gradients within the coal reservoirs with varying distance to
these deformations (Pashin, 2007; Groshong et al., 2009; Pashin, 2010). The particular study
area of this paper is approximately 5 miles from the main thrust fault and from the Blue
Creek anticline and syncline (Fig. 1). Therefore, neither of the coal groups that are
investigated in this paper outcrop within the study area. The average depths, which were
determined from perforation intervals of the studied boreholes and from their logs, are
between 600 and 1200 ft for the Pratt coal group, between 1200 and 1950 ft for the Mary
Lee coal group, and between 1950 and 2500 ft for the Black Creek coal group (Fig. 2). The
relative frequency histograms of the completion intervals of each of the coal groups are
given in Fig. 3.
Due to the distance to the Blue Creek anticline-syncline and mining activities that started
long before the start of coalbed methane activities, the study area is moderately under-
pressurized. The average hydrostatic gradient within and around the study area is 0–0.3
psi/ft (Pashin, 2007).
The coal groups in the Upper Pottsville formation effectively have no matrix permeability.
Thus, flow within the Pottsville coal groups takes place through cleats and fractures and
makes coal seams in this formation the best aquifers of all existing rock types within the
interval. Unless there is a disturbance, such as gas production or mining, coal seams can be
assumed to be 100% water saturated.
The permeability of Warrior basin coals is highly sensitive to stress, with permeability
decreasing with depth from ~100 md at the surface to 1–2 md below 2000 feet (McKee et
al., 1988). As with permeability, porosity of coals in the Pottsville formation varies with
depth as well. The porosity of the coal can be as high as 5% at the surface and can decrease
substantially with depth as a function of overburden stress and the coal’s mechanical
properties. Pashin et al. (2004, 2008) and Pashin (2012, personal communication) suggest
that porosity is less than 3.0 percent in the Pratt coal group, which is the shallowest of the
three coal groups studied in the paper and also the shallowest target for coalbed methane
development in the area. On the other hand, they suggest that porosity in the Mary Lee coal
group ranges from 1.5 to 1.8 percent, with porosity around 1.0 percent in the Black Creek
coal group, which is the deepest coal group of interest.
2. Vertical coalbed methane wells of the study area and their overall
production history
2.1. Production durations and decline rates
The 12,900-acre study area with coalbed methane well locations is shown in Fig. 4. The first
of the wells was drilled in 1987 in the Oak Grove field and was completed only in the Mary
Lee coal group. In later years, other wells were drilled and completed in one or more of the
Karacan Page 4
J Nat Gas Sci Eng. Author manuscript; available in PMC 2015 July 17.
Author M
anuscriptA
uthor Manuscript
Author M
anuscriptA
uthor Manuscript

three target coal groups, as shown in Fig. 4. By the year 1998, virtually all of the 92 wells in
this area were drilled, perforated, and fractured to put them into production.
Production histories of vertical methane wells in the Black Warrior basin are affected by
water and gas saturation in the coal seams as well as well completion efficiencies and local
geology (Pashin, 2007). Scheduling of mining operations also affects production histories of
the wells as they are progressively terminated before coal mining commences. These factors
may also affect production duration of the wellbores. The production duration overlay image
in Fig. 4 spatially shows that the majority of the wells have more than 7500 production days.
These wells were completed at multiple zones, mainly in Mary Lee and Black Creek coal
groups (Fig. 4). Wells at the northeast corner of the study area produced for 4000 days or
less. These wells were completed only in the Mary Lee coal zone and were terminated when
the Oak Grove mine was developed in this location in 1993–1994. Wells that were placed on
the western margin of the study area, in the Brookwood field, were drilled in 1997 and were
completed at all three coal groups. They have been in production since their start date, for
about 6000 days. Fig. 5 shows a 3-dimensional reservoir view of the three coal groups
studied in this work. This figure shows the variation of depth from surface to these coal
groups, locations of well completions in each of the coal groups, as well as the locations and
displacements of faults shown in Fig. 4. In addition, the Mary Lee coal group image in Fig.
5 marks the boundaries of the mine panels and how they relate to well locations and
proximities to faults.
Production start dates of all wells and their production durations, as of the date of the last
recorded data at the time of preparation of this work, are given in Fig. 6. Despite the fact that
all producing wells in this area are currently in their decline periods, Figs. 4 and 6 show that
almost all wells have been extremely long producers. Variations in production durations can
be due to mining operations, well completion properties (i.e. whether the wells are
completed at a single zone or at multiple zones), coal reservoir properties, and proximities to
faults (Fig. 5). Sparks et al. (1993) observed that fault lines in many areas in the basin may
not be as productive as blocks between the faults—supported by Pitman et al. (2003) who
observed that cementation of coal cleats within ~30 ft of normal faults could preclude flow
along large parts of faults.
To further investigate production and decline behaviors of wells in the study area, decline
curve analyses were performed. The analyses showed that almost all wells exhibit
exponential decline, which by definition is constant with production duration. An example
of exponential decline curve analysis on production data plotted as the logarithm of gas rate
versus time is given as the inset of Fig. 7. It should be noted, however, that traditional
decline analyses apply only to the long-term decline periods where boundary-dominated
flow is dominant. Therefore, as also seen in this inset figure, initial and intermittent short-
lived declines due to various operational factors and rate transients were not included in this
analysis.
The decline rate data given in Fig. 7 has a minimum of 1.8% per year and maximum of 25%
per year. The mean and standard deviation of the distribution is 9.2% per year and 6.3% per
year, respectively. Interestingly, the distribution shows a multi-modal behavior, in which
Karacan Page 5
J Nat Gas Sci Eng. Author manuscript; available in PMC 2015 July 17.
Author M
anuscriptA
uthor Manuscript
Author M
anuscriptA
uthor Manuscript
low, medium, and high decline rates are clearly distinguishable and the wells creating these
populations of data approximately coincide with the wells grouped in Fig. 4 based on their
completion zones.
2.2. Production rates and cumulative productions
Pashin (2007) and Groshong et al. (2009) discussed that folds and faults in the Black
Warrior Basin and close to its margins can have significant impact on peak production rates
and production durations of coalbed methane wells. Folding of the strata is believed to
increase methane rates locally as a result of increased fracture permeability. Such areas of
increased methane rates, or peak rates of as much as 150–300 Mscf/day, are generally
observed along the lower limb of the Coalburg syncline in the Cedar Cove field (Pashin et
al., 2010a). Peak rates of water production as much as 250–750 bbl/day, on the other hand,
were observed close to the Blue Creek syncline and anticline where the strata upturned and
were exposed to the surface, accepting meteoric water encroachment.
The study area is not directly located on or at very close proximity to one of the major
structures in the Appalachian front. However, tectonic maps prepared from various borehole
logs and seismic reflection profiles indicate that the Pottsville formation in the southwestern
edge of the Oak Grove field and in a majority of the Brookwood field have normal faults
(Groshong et al., 2009). The major faults of the study area are also shown in Fig. 4 and more
clearly with variations in depths in Fig. 5. Thus, impact of normal faults dissecting the
Upper Pottsville formation may be present in gas and water production rates, as well as
cumulative productions, of wellbores of the study area.
Methane and water rate histograms using 20,100 recorded rate data from all wells and the
cumulative production histograms of 92 wells are shown in Fig. 8A–D. The histogram in
Fig. 8A shows that the methane production rate was generally lower than 200 Mscf/day with
a mean of 58 Mscf/day and standard deviation of 42 Mscf/day. The maximum recorded rate
from the wellbores in this area was 706 Mscf/day. However, this extreme rate was
instantaneous and should not be considered a peak. Water production data shown in Fig. 8B,
on the other hand, shows that the majority of recorded rates were lower than 100 bbl/day,
with a mean value of 47 bbl/day and a standard deviation of 99 bbl/day. The highest water
production rate recorded from the wells in the study area was 1384 bbl/day.
Histograms of cumulative production are shown in Fig. 8C and D for methane and water,
respectively. Cumulative methane production distribution shows a multi-modal behavior,
where the minimum cumulative methane production was 28 MMscf and the maximum was
1100 MMscf. The mean and standard deviation of cumulative methane production was 362
MMscf and 256 MMscf, respectively. Cumulative water production is similar to water rates
in distribution, having a mean of 268,000 bbl and standard deviation of 443 bbl.
In general, all wells in the study area have been exceptional producers. The production
durations, decline rates, as well as production rates and volumes may have been affected by
the geological structure of the basin, or more specifically by the structural features of the
study area. However, they may also have been strongly impacted by the near-wellbore
effects of well stimulations (such as hydraulic fracturing) and by reservoir properties of the
Karacan Page 6
J Nat Gas Sci Eng. Author manuscript; available in PMC 2015 July 17.
Author M
anuscriptA
uthor Manuscript
Author M
anuscriptA
uthor Manuscript

coal groups in the study area, which were not exclusively studied in the literature. In
addition, and probably more importantly from a mining safety point of view, coal reservoir
properties and their change over time dictate potential amount and rate of methane emissions
into working areas and active and sealed longwall gobs. Therefore, it is critical to determine
coal reservoir properties and their distributions in a mining and gas production site.
In the following sections, the properties of Pratt, Mary Lee, and Black Creek coal groups
will be investigated. The production history matching technique will be implemented to
delineate reservoir properties and their time-dependent changes.
3. Production history matching
3.1. Preliminary preparation of data for auxiliary functions and history matching
The objective of history matching is to find an optimum solution to the theoretical model-
field data problem to determine unknown reservoir parameters. Ideally, performing history
matching of all wells at the same time using reservoir simulation is preferred to better
capture interferences. However, the reservoir simulation method can be computationally
expensive and time consuming for matching tens of wells at the same time. This is
particularly the case if reservoir properties show spatial variations, which is usually the case
in coal seams. In this case, reservoir simulation becomes a tedious and lengthy task for
matching the production behavior of all wells by changing relevant reservoir properties.
Single-well history matching practice by using analytical or numerical models for each well
independently, on the other hand, can be employed in lieu of large-scale reservoir
simulations to estimate the reservoir properties in a relatively shorter timeframe. The results
can later be used in forecast mode to predict future production behavior of the well, if
needed.
In this study, history matching computations and analyses were completed using Fekete’s
F.A.S.T. CBM™ software version 4.7 (Fekete Associates, Inc., 2012) independently for
each well. Although single-well history matching is easier than full-scale reservoir
simulation, it is not straight forward either. Using F.A.S.T CBM™ for this purpose is no
exception. Following sections give details of preparing well data, pressures, deliverability
data, sorption properties of each coal seam and porosity-permeability-sorption relationships
and associated considerations. The first step of history matching, of course, is learn about
the geology of the area and general reservoir conditions. Gathering any seismic and well log
data immensely help in understanding the reservoir and low/pressure behaviors. Next, it is
essential to evaluate the production data and production pressures. It is important to
recognize the data trends and to be able to explain the changes with the help of
Supplementary Information, such as any workover or stimulations, or general characteristics
of the reservoir. In some cases where the data is erratic, data filtering may help for making
the actual behaviors clear. It is also important to analyze the reported completion intervals
and to decide whether all completions are producing from the same horizon. This will help
deciding whether the well and the layers in the model should be planned as a single unit or
as multi-layer.
Karacan Page 7
J Nat Gas Sci Eng. Author manuscript; available in PMC 2015 July 17.
Author M
anuscriptA
uthor Manuscript
Author M
anuscriptA
uthor Manuscript
Decline curve analysis as the first step of modeling is helpful, as it is easy to conduct and it
provides information on decline trends, coefficients related to reservoir and flow mechanics.
It also helps and gives an idea about reservoir extends, future production potential in terms
of expected ultimate recovery, gas-in-place, and in the case of using type-curves, it gives a
preliminary idea about permeability.
History matching phase includes importing the final data set into the simulator with
appropriate units. Defining wellbore geometry and wellbore hydraulics follow. These data
are usually available in well drilling and production records as well as in well log reports.
Next, parameters of reservoir volumetrics are defined. These include defining sorption
functions, coal density and the basis of these measurements. It is important to pay attention
to conduct the volumetric calculations with the correct basis that the data come from. For
instance, it should be paid attention whether the measurements were on as received basis or
dry-ash free basis, as these will affect volumetric gas-in-place.
It is also important to know, to the best of the knowledge, whether the reservoir is a dry coal
or wet coal reservoir. This means that if there is water flowing along with gas, this should be
known as some of the numerical models cannot be used in the case of wet coals. So, this
consideration help selecting an appropriate model that will reflect the actual flow processes,
and boundary conditions. Upon completion of relative permeability, matrix shrinkage and
other reservoir related properties, such as near-wellbore conditions, history match can be
conducted either manually or automatically, during which some of the reservoir parameters
are adjusted for matching water and gas productions, or the pressures. It is important also to
note that relativity permeability and porosity can further be used to adjust the shape of
production curves to obtain a successful match.
Uniqueness of results is important in history matching. Therefore, results should be checked
to see whether they make sense when compared with near-by wells or with the data in
literature. Further, it is important to obtain the results where the error is at global minimum,
rather than at local minimum. It helps to provide the simulator with slightly different
parameters than the ones determined and run the simulation again. If the results come back
to the same values, then it increases the confidence toward the values. It also should be
noted that each well can have a different situation that necessitates selecting a different
model or boundary conditions. Therefore, each well should be treated individually and by
paying attention to the details while preparing the simulations.
Above paragraphs give general aspects of the workflow followed in this study. Detailed
discussion of production data analyses and workflow for unconventional reservoirs is given
in Clarkson (submitted for publication-a,submitted for publication-b).
Following sections give the details of estimation of input parameters in this study.
3.1.1. Production model for history matching and layer definitions—For
modeling, pseudo-steady state (PSS) boundary-dominated solutions were used. This is
justified by all wellbores within the study area having been productive for a sufficiently long
duration as discussed in the previous section. A PSS solution does not capture the initial, and
Karacan Page 8
J Nat Gas Sci Eng. Author manuscript; available in PMC 2015 July 17.
Author M
anuscriptA
uthor Manuscript
Author M
anuscriptA
uthor Manuscript
usually short, transient part of the production history that stems from the pressure and
desorption changes at the immediate vicinity of the wellbore in the initial production period.
However, given the long production times and the nature of the reservoir data being
determined, initial transients were deemed not critically important. With these
considerations, the following formulas were used in deliverability calculations for gas and
water rates, respectively, in history matching:
(1)
(2)
In these equations, h is net pay, which was calculated from the total thicknesses of coal
seams in a coal group, kegis gas effective permeability, m(P) is gas pseudo-pressure, P̄ is
average reservoir pressure, Pwfis flowing bottom hole pressure, T is temperature, re is
external radius, rw is wellbore radius, μw Bw are water viscosity and water formation volume
factor, respectively, and s is the near-wellbore skin due to stimulation. Since all wellbores
were hydraulically fractured, s was retained in equations from which fracture half-length
could be calculated using:
(3)
where Xf is the fracture half-length and α is a function of the fracture’s dimensionless
conductivity (FCD).
The study area has 92 wells with varying completion intervals (Figs. 4 and 5). All of these
wells are completed in the Mary Lee coal group, with 20 and 45 of these wells also being
completed in the Pratt and Black Creek groups, respectively. Thus, from a modeling point of
view, if a well is completed only at the Mary Lee group, a single-layer completion approach
was used. However, if a well is completed in more than one interval, then a multi-layer
approach was used as the total production had contributions from each layer. In the latter
approach, known parameters of each layer were assigned separately to corresponding layers
according to their properties.
3.1.2. Flowing pressures—The Alabama Oil and Gas Board collects water and gas
production data, but it does not monitor wellhead flowing pressures. Pashin (2012) indicated
that wellhead pressure is gauged routinely by operators, and most wells are operated at a
surface flowing pressure of 8–12 psig. Thus, surface flowing pressures of all wells were
taken as constant at 10 psig during their entire production period. Bottom hole flowing
pressures were estimated using well depth and by assuming pressure loss due to friction to
be zero. Additionally, all wellbores were assumed to have an internal diameter of 6 inches
for each completion interval over the entire borehole length.
Karacan Page 9
J Nat Gas Sci Eng. Author manuscript; available in PMC 2015 July 17.
Author M
anuscriptA
uthor Manuscript
Author M
anuscriptA
uthor Manuscript

3.1.3. Adsorption isotherms, initial pressures, and gas contents—In coalbed
methane fields, the majority of gas is produced from initially adsorbed gas quantity, which is
a function of pressure and is defined by the Langmuir isotherm of the coal seam. Langmuir
isotherm defines the relationship between pressure and gas content of coal according to the
formula:
(4)
In this equation, P is pressure, V(P) is the amount of gas at P, also known as the gas content,
VL is Langmuir volume parameter, and PL is Langmuir pressure. Gas content data is also
used in calculating gas-in-place for material balance calculations.
Langmuir parameters are coal-specific. Thus, they should be determined at representative
temperatures of the coal seams. The isotherms used in this study were determined at 86 °F
using samples from the coal seams of interest, and Langmuir values were determined and
used in the models based on an “as received” basis reflecting the presence of moisture and
ash in the data.
Langmuir isotherms used in this study were obtained from measurements conducted at
different seams included in each of the coal groups. In order to determine representative
Langmuir parameters for the Mary Lee coal group, experimental data obtained separately
from the New Castle, Mary Lee, Blue Creek, and Jagger seams (Fig. 2) were used. A single
Langmuir isotherm was fitted to represent all coal within the interval. The same procedure
was applied for Pratt and Black Creek Coal groups. The results are given in Fig. 9.
Estimation of the study area pressure gradient and Langmuir parameters of coal groups
makes it possible to determine initial pressure of the coal reservoir and its gas content.
Pashin (2007) reported that the average hydrostatic gradient within and around the study
area was between 0 and 0.3 psi/ft. As an average value, 0.15 psi/ft gradient was used to
calculate initial pressures at mid-depths of each of the coal groups and their initial gas
contents.
All wells in the study area simultaneously started their production with gas and water
without any indication of under-saturation. Thus, coals were assumed to be saturated and
initial pressure of each coal group was taken as equal to their desorption pressure.
3.1.4. Permeability increase as a result of matrix shrinkage during depletion—Permeability increases as a result of reservoir pressure depletion during methane production
have been observed in various coalbed methane basins (e.g. San Juan Basin). Several
mechanistic and geomechanical models have been proposed to model this phenomenon. A
critical review of these models with field and experimental data reflecting those
circumstances for which these models can be used is given in Pan and Connell (2012).
Recently, Mazumder et al. (2012) applied some of these models to permeability increase in
the Bowen basin coals as a result of primary depletion. They observed that absolute
permeability increased by several magnitudes as a function of estimated reservoir pressure.
Karacan Page 10
J Nat Gas Sci Eng. Author manuscript; available in PMC 2015 July 17.
Author M
anuscriptA
uthor Manuscript
Author M
anuscriptA
uthor Manuscript

The Shi and Durucan model (2003), which is shown in Eqs. (5) and (6), was used to model
matrix shrinkage and permeability increase as a result of methane production from wells.
(5)
In Eq. (5), k is the permeability at effective stress (σ) at coal reservoir pressure (P), ko is the
initial permeability at initial effective stress (σo ) at initial reservoir pressure (Po ). As
mentioned in the previous discussion, coals were assumed to be saturated, and calculated
initial reservoir pressure was equal to desorption pressure. This means that the pressure-gas
content cross point is on the isotherm and changes following the isotherm function. With
these conclusions, Eq. (6) can be used since reservoir pressure will be under desorption
pressure after production starts. Thus, the desorption-induced stress change in coals is:
(6)
The terms of Eq. (6) are γ – Poisson’s ratio, Pd – desorption pressure, Pε – the pressure at
50% of maximum matrix strain, E – Young’s modulus, and εL – maximum strain.
Unfortunately, there was no separate data available for Pratt, Mary Lee, and Black Creek
groups. Thus, geo-mechanical parameters were selected for coal strain as a result of methane
desorption based on reported data in literature (Fekete Associates, Inc., 2012; Robertson,
2005). Fig. 10 shows the shape of permeability change functions for coal groups and the
parameters used in this study.
3.1.5. Permeability anisotropy—Interference testing studies indicate that anisotropy is
best developed in the shallow, low-stress seams of the Pratt coal zone, and is typically
greater than 15:1 (Pashin et al., 2010b). In the pre-fracture tests performed in Oak Grove
field, the flow in the face cleat direction was favored. On the other hand, no permeability
anisotropy was observed in the Mary Lee coal zone of the Oak Grove field. Observations at
the Oak Grove mine, near the study area, indicate that the coals in this zone are sheared as a
result of bedding-plane slip driven by Appalachian folding (Pashin, 2012). Some thin
detachments within the Blue Creek seam in Brookwood field are observed. However, the
coal is largely cleated and may exhibit cleat and hydraulic fracture-dominated anisotropy
locally. The Black Creek seams of the Black Creek coal group exhibit weak anisotropy in
the systematic joint direction in the Oak Grove field and may have anisotropy in the face
cleat direction in the Brookwood field.
Because of a lack of a generally known trend and the ratio of natural permeability anisotropy
in the coal groups within the study area, and because permeability anisotropy around the
wells is generally dictated by the direction of hydraulic fractures created, no specific
anisotropy ratio was used in history matching. For the Pratt, Mary Lee, and Black Creek
groups, the direction of estimated fracture half-lengths should correspond to the general
direction of fracture growth observed in previous studies (Gazonas et al., 1988; Steidl,
1993). This will be discussed later in the history matching results.
Karacan Page 11
J Nat Gas Sci Eng. Author manuscript; available in PMC 2015 July 17.
Author M
anuscriptA
uthor Manuscript
Author M
anuscriptA
uthor Manuscript

3.1.6. Relative permeability functions—Relative permeability of coal seams is not
only important for deliverability of gas and water, but also for determination of gas and
water production characteristics. Clarkson et al. (2011) discuss the importance of relative
permeability curves for coal seam gas production.
Relative permeabilities are a function of saturation of corresponding phases in multi-phase
flow in porous media. Field evidence and production characteristics of the wells suggest that
cleats were initially 100% saturated with water at the start of well production. Thus, initial
water saturation was taken as 100%.
Corey relative permeability functions given in Eqs. (7) and (8) were used for gas and water,
respectively.
(7)
(8)
where krg is the relative permeability to gas, krgo is the end-point relative permeability to
gas, krw is the relative permeability to water, krwo is the end-point relative permeability to
water, Nw is the exponent of the water relative permeability curve, Ng is the exponent of the
gas relative permeability curve, S̄g is the average gas saturation, S̄w is the average water
saturation, Sgc is the irreducible gas saturation and Swc is the irreducible water saturation.
In the absence of experimental data suggesting otherwise, gas and water end-point relative
permeabilities were kept at 1. Owing to the long production durations of the wells with high
gas and water rates, irreducible saturations of the phases were assigned low values—1% and
0.1% for water and gas, respectively. Basically, gas and water relative permeability
exponents were the main adjustable parameters of these functions, along with other
parameters of deliverability during history matching. It was found that the gas exponent
could take values changing between 1 and 2, whereas the water exponent could change
between 3 and 12, depending on the shape of production curves and rates. Fig. 11 shows the
general shape of the relative permeability curves and the parameters of the Corey model that
were used in history matching.
3.1.7. Porosity—Porosity of coal is the fracture porosity and is mostly responsible for the
amount of water storage. Thus, porosity was used as a matching parameter primarily for
water quantity and flow rate.
Estimated initial porosities were converted to final porosity using the following relation:
Karacan Page 12
J Nat Gas Sci Eng. Author manuscript; available in PMC 2015 July 17.
Author M
anuscriptA
uthor Manuscript
Author M
anuscriptA
uthor Manuscript

(9)
In this relationship, ko and k are initial and final permeabilities, respectively, and Øo and Ø
are initial and final porosities. The exponent n was set to 3, consistent with typical
applications.
4. Production history matching results and their discussion
Well productions were simulated starting from their production start until the date of last
collected or reported data for June, 2011. Thus, if a well has operated through 2011 and into
2012, the final value of the changing reservoir and transport properties (e.g. pressure, gas
content, permeability, relative permeability, saturations) are reported for June, 2011, and are
termed as “existing” in this section to refer to the “current” values in the field. However, if
the well stopped production before June of 2011, the final value of the simulation at the
production-end date was reported as of June 2011, assuming that the values had not
changed.
As discussed earlier, history matching was performed based on the completion properties of
each well to determine properties by individual coal groups and completed either as single-
layer or multi-layer models. Fig. 12 shows examples of history matching results for wells
5236-C, 5603-C, and 6137-C, completed at the Mary Lee group only (single layer), at the
Mary Lee and Black Creek groups (dual layer), and at the Pratt, Mary Lee, and Black Creek
coal groups (three layers), respectively.
For each well and coal group, initial and “existing” reservoir properties, as appropriate, were
determined using history matching. These include permeability, relative permeability (gas
and water), effective permeability (gas and water), water saturation, formation pressure, gas
content, skin, and fracture half-length. Minimums, maximums, means, standard deviations
as well as quartiles of the distributions of existing values of reservoir and fluid transport
properties for each coal group are given in Table 1. The same statistical measures for near-
wellbore effects and drainage area are given in Tables 2 and 3, respectively. The following
discusses matching results and reservoir parameters for the various coal groups.
4.1. Coal reservoir and fluid transport properties
4.1.1. Pressures and gas contents—Fig. 13 shows the initial and “existing” pressures
of the coal groups as of June 2011. Initial pressures were calculated based on an initial
pressure gradient of 0.15 psi/ft. Thus, pressures increased with depth and reached to values
close to 175 psi, 265 psi, and 355 psi at the depths of the Pratt, Mary Lee, and Black Creek
coal groups, respectively. After history matching, existing formation pressures in the coal
groups were estimated as low as 25–50 psi at some well locations, which corresponded to
the highest producers. The mean pressures estimated from all well locations were 94 psia,
117 psia, and 215 psia with standard deviations of 39, 57, and 72 psia for Pratt, Mary Lee,
and Black Creek groups, respectively.
Karacan Page 13
J Nat Gas Sci Eng. Author manuscript; available in PMC 2015 July 17.
Author M
anuscriptA
uthor Manuscript
Author M
anuscriptA
uthor Manuscript

The ultimate objective of any degasification process is decreasing gas content of the coal
seams prior to mining. Fig. 14 shows the initial gas contents within coal groups as a function
of depth, which were calculated based on initial pressures and the isotherm functions of the
coal groups shown in Fig. 9. Initial values show that the highest gas contents between 275
and 360 scf/ton were in the Mary Lee coal group, followed by the Black Creek and Pratt
groups. This is particularly important as the Blue Creek and Mary Lee seams are the main
mining targets, and the New Castle and Jagger seams (Fig. 2) contribute to methane
emissions from roof and floor, respectively. Therefore, it is important to also decrease gas
content of this coal group to improve mine safety. Indeed, gas content predictions based on
history matching show that gas contents of coals decreased to 50–60 scf/ton in some areas
(Fig. 14), corresponding to those locations where existing pressures were lowest. However,
distribution of gas content data between initial and existing values suggests that there are
remaining locations in all coal groups with very high methane contents. This is particularly
important for the Mary Lee coal group as it is a primary mining target. Such high gas
content locations should be further degasified using other options prior to mining. The
mining company operating here is presently addressing this problem by degasifying the Blue
Creek seam using horizontal cross-panel holes. Although this is certainly a benefit, the
overlying New Castle and underlying Jagger seams can still contribute to the emissions.
Spatial distributions of existing gas contents within the Mary Lee group are shown in Fig.
15.
4.1.2. Permeability and porosity—Permeability and porosity control fluid-flow and
fluid-storage capacity in porous formations. Practically, these refer to the properties of coal
cleats or fractures since there is no matrix permeability. Permeability of coal seams is not
only important for the efficiency of degasification, but also for methane emissions into coal
workings during mining.
Initial and existing permeability and porosities of coal groups were determined using history
matching of gas and water productions. In history matching, permeability and its evolution
controlled both gas and water rates to match the full trend of production. Porosity was
estimated to ensure there was adequate water produced and also for matching water
production. Permeability change as a result of desorption and stress variation in coal was
calculated using the Shi and Durucan model given in Eqs. (5) and (6). A corresponding
change in porosity was calculated using Eq. (9). Results are shown in Fig. 16A and B.
Fig. 16A shows in general that Black Creek group has the minimum permeability, ranging
between 0.1 and 2 md. Existing permeabilities in this group have a mean of ~1 md. The
Mary Lee group, on the other hand, has existing permeabilities that vary between 0.5 and 18
md. The Pratt coal group has higher estimated permeabilities between ~4 and 15 md with a
mean of 8.4 md, potentially due to its shallower depth. It is clear from Fig. 14A that the
permeability of coals is sensitive to depth, and thus to stress. The statistics of permeability
distribution are given in Table 1. Porosities that are given in Fig. 16B show values that
generally range between 0.2% and 3%. However, they do not seem to be as sensitive to
depth as permeability. Permeabilities and porosities estimated for Pratt, Mary Lee, and
Black Creek coal group corroborate well with the findings and measurements reported by
McKee et al. (1988) and by Pashin et al. (2004, 2008) and Pashin (2012), who presented
Karacan Page 14
J Nat Gas Sci Eng. Author manuscript; available in PMC 2015 July 17.
Author M
anuscriptA
uthor Manuscript
Author M
anuscriptA
uthor Manuscript

similar values for permeability and its sensitivity to depth. They also presented porosity
values under 3% as predicted in this study.
History matched values estimated for initial permeability and porosity are slightly lower
than the existing values computed during the matching process (Fig. 16A and B), likely due
to the matrix shrinkage effects as a result of desorption and pressure decrease. The amount
of change in permeability and porosity in each coal group is given in Fig. 17A and B,
respectively. These data indicate that existing permeabilities in the Pratt group coals exceed
their initial values by 25–30%, whereas this increase is up to 20% in the Black Creek group
coals. In the Mary Lee group, the permeability increase is up to 50%. These anomalies in
different coal groups are due to the differences in their isotherms and the amount of pressure
decrease and gas desorption experienced during production. Porosity has a similar trend and
behavior to permeability, compared to initial values. However, calculated porosity increases
are less than 15% of the initial values (Fig. 17B).
4.1.3. Relative and effective permeability—Relative permeabilities to gas and water
are functions of saturation. As saturations change as a result of depletion, relative
permeabilities vary based on the approximated relative permeability function in history
matching. In this work, Corey functions were used, as discussed in Section 3.1.6. Values of
gas and water curve exponents were adjusted during history matching for each of the wells.
Fig. 18A–C shows plots of existing relative permeabilities to gas and water versus existing
water saturations in each of the coal groups.
The horizontal axes of Fig. 18A–C show that water saturations, which were 100% at each
location when production started, diminished to values that vary at each well location.
Existing water saturation in the Pratt coal group varies between 29 and 82%, depending on
the well location, placing relative permeabilities to gas between 0.2 and 0.7 (Fig. 18A).
Consequently, relative permeabilities to water decreased to 0.01 and 0.26 with a mean value
of 0.08. In the Mary Lee group, existing water saturation changed between 17 and 88%
within the study area. Relative gas permeabilities within this coal group range between 0.07
and 0.82 (Fig. 18B). In the Black Creek coal group, existing water saturations are higher
than those of the Pratt and Mary Lee groups. Existing water saturations in the Black Creek
groups are between 40 and 95%, indicating there are locations with high water saturation
which should be dewatered for more effective degasification. Area-wide gas relative
permeabilities in Black Creek coals are between 0.05 and 0.65.
Effective permeabilities to each flowing phase in coals are as important as the relative
permeabilities, as they are absolute measures of permeability to a specific phase at a given
saturation. Existing effective permeabilities are calculated by multiplying the existing
absolute permeabilities given in Fig. 16A for each coal group by the relative permeabilities
in Fig. 18A–C. Thus, effective permeabilities prevail at the same saturation conditions.
Existing effective permeabilities in each coal group and wellbore location are shown in Fig.
18D–F, for Pratt, Mary Lee, and Black Creek coal groups, respectively. These figures show
that effective permeabilities to gas vary between 0.4 and 6.4 md, between 0.15 and 11.1 md,
and between 0.02 and 0.9 md in various well locations, in Pratt, Mary Lee, and Black Creek
Karacan Page 15
J Nat Gas Sci Eng. Author manuscript; available in PMC 2015 July 17.
Author M
anuscriptA
uthor Manuscript
Author M
anuscriptA
uthor Manuscript

groups, respectively. These values indicate the current water saturation state of these coals
and that the effective permeability of gas in the Black Creek coals is very low.
Basic statistics and quartile values of existing coal reservoir and fluid-transport-related
parameters presented so far are given in Table 1. These data are intended for understanding
the existing values of different properties in these coal groups. More importantly, they can
help researchers to construct parameter distributions for probabilistic simulations for
forecasting future degasification efficiencies of the wells and related reductions in mine
emissions for ventilation and mining safety applications.
4.2. Near-wellbore effects and drainage area
All wellbores in the study area were hydraulically fractured at each completion interval.
Therefore, wellbore skins due to fracturing, given in Eqs. (1) and (2), were calculated during
history matching for each applicable coal group. Skin due to fracturing is a negative number.
Skin values computed during the matching process were later converted to fracture half-
lengths in these zones (Eq. (3)). These values are given in Table 2.
Table 2 shows that values of skin in each of the coal zones range between −0.1 and −7.7.
Mean skin values for coal zones are around −4.2. Although both skin values and the
differences between coal zones are small numbers, they may translate to large fracture half-
lengths through Eq. (3) and through their relation with dimensionless fracture conductivity.
Indeed, fracture half-lengths calculated at different well locations indicate that total fracture
lengths can be as long as 1100–1200 ft. Calculated median values for total lengths are within
48–89 ft, and 75% quartile values are between 320 ft and 430 ft. Fig. 19 shows the spatial
distribution of fracture half-lengths calculated at different well locations in the Mary Lee
coal group.
Hydraulic fractures in the Black Warrior coals generally dictate the directional permeability
anisotropy. Therefore, the directions of estimated fracture half-lengths should correspond to
the general directions of fracture growth observed in previous studies for the Pratt, Mary
Lee, and Black Creek groups. Steidl (1993) indicated that hydraulic fractures had 70° to 80°
azimuths in Black Warrior coals. Gazonas et al. (1988) conducted hydraulic fracturing tests
in these coal groups and interpreted tiltmeter and geophysical data to estimate dip, direction,
and growth of fractures around the bore-holes. In shallow zones, they have observed both
vertical and horizontal fractures. In deep intervals, they have observed a vertical fractures
strike of N 78° E in the Mary Lee group and a N 93° E strike in the Black Creek group, with
oblique orientations to face (N 61° E) and butt cleats. They have also calculated the length
of the vertical fractures as 319 ± 269 ft in the Mary Lee group and 598 ± 245 ft in the Black
Creek groups, respectively. Calculated widths of these fractures were 0.07 ± 0.025 ft. With
this information, the directions of fractures reported in Fig. 19 can be approximated as N 78°
E. Furthermore, it is interesting to note that the reported fracture lengths in Gazonas et al.
(1988) are of the same order of magnitude of the values calculated in this study.
Drainage areas of each well for the coal group that they were completed in were also
predicted during history matching. Drainage areas established in each coal group are
functions of cumulative gas production, net pay thickness, porosity and gas amount stored in
Karacan Page 16
J Nat Gas Sci Eng. Author manuscript; available in PMC 2015 July 17.
Author M
anuscriptA
uthor Manuscript
Author M
anuscriptA
uthor Manuscript

the coal. Predicted drainage areas are given in Table 3. These values show minimum areas
6–24 acres and maximum areas between 117 and 173 acres, depending on the coal group
and the well location; smaller areas were affected by wells that did not produce for a long
time.
5. An example with the use of results
It is very rare to know the exact value of each of the coal reservoir properties. The values,
either measured at the laboratory or determined by well testing, can change drastically
within a certain range in the field. The uncertainties associated with the values of different
reservoir properties can result in over- or under-estimation of production potentials. This can
ultimately affect field management for gas production and for gas control for mining safety
purposes.
As mentioned earlier in this paper, the possible values of coal reservoir properties
determined using history matching of productions from a large number of wells drilled and
completed at various coal zones can serve for understanding the effects of various coal
parameters in planning degasification wells in this field, their range of values and for
conducting probabilistic simulations of well productivity. This section presents an example
of using the data given in this paper as tables for probabilistic simulation.
The simulation was conducted using the Monte Carlo module in F.A.S.T CBM™. This
module basically solves deliverability equations with a stochastic approach. For this
example, the calculations were performed for the well at 5236-C location and for production
from Mary Lee coal group. For the sake of this illustration, some of the properties were kept
at constant values, while others were varied according to the results given in Tables 1–3.
The data given in these tables enable to fit exact distributions (using quartiles), or to use
uniform (by using minimum and maximum only), or to use an arbitrary distribution (by just
using mean and standard deviation) that the researcher thinks most likely. In order not to
create any bias for these options, no distribution was reported as a priori. However, for the
example, the set of values given in Table 4 were used. The computations were performed
using 1000 simulations. The results, in terms of cumulative gas and water production and
rates, and with their associated probabilities (for 10, 50 and 90 percentiles) are given in Figs.
20 and 21.
Fig. 20 shows cumulative histogram built by using the results of cumulative gas and water
productions from 1000 simulations. The values of gas and water productions that correspond
to 10, 50 and 90 percentiles are given as an inset table in this figure. The data shows that at
the most favorable cases (P90) interms of input parameters provided, gas and water
productions can be as high as 527.5 MMscf and 137,100 bbl, respectively. When the input
parameters are not favorable (P10), the productions are as low as 9.8 MMscf and 6900 bbl.
The median values (P50) are 190.7 MMscf and 52,500 bbl for gas and water, respectively.
Rates are, of course, as important as the cumulative productions. Fig. 21 shows expected gas
and water production rates at P10, P50 and P90 probabilities. As a note of interest, the
predicted rates are very similar to what’s given for 5236-C in Fig. 12. In addition, the
presented values in Fig. 20 and the entire range of values in the histogram compare well
Karacan Page 17
J Nat Gas Sci Eng. Author manuscript; available in PMC 2015 July 17.
Author M
anuscriptA
uthor Manuscript
Author M
anuscriptA
uthor Manuscript

with the actual cumulative production values given in Fig. 8C and D. Both of these
observations provide additional support to the results beyond literature data and suggest that
the reservoir properties estimated using history matching is close to actual values.
6. Summary and conclusions
This study conducted production data analyses, decline curve analyses, and production
history matching on 92 vertical coalbed methane wells drilled in a 12,900-acre area in
Brookwood and Oak Grove fields. A large-scale longwall mining operation has recently
commenced in this area, and will operate in the next few years to mine Blue Creek coal of
the Mary Lee coal group. Therefore, understanding coal reservoir properties and their
existing values is of prime importance to effectively degasify coal seams and to ensure safe
mining. A brief description of Black Warrior basin and the Upper Pottsville formation where
major coal groups are located is given in the first section of the paper.
The first vertical well in the study area was drilled in the 1980s and the last in 1998. The
wells in the study area have been exceptional producers. Decline curve analyses showed that
effective exponential decline rates of the wells were between 2 and 25% per year, except for
a few wells completed only at the Mary Lee group, which have been producing with low
constant percentage decline rates. Productivity of wells with produced volumes of gas and
water and their rates are discussed in Section 2.
The main objective of this work was to evaluate coal reservoir properties of Pratt, Mary Lee,
and Black Creek coal groups. For this purpose, history matching analyses were performed
using pseudo-steady state, boundary-dominated flow solution. Since wellbores were
completed at single or multiple coal zones, analyses were conducted to reflect these
completion characteristics.
Results of history matching were compiled to reflect the initial and existing conditions in the
coal groups. Analyses showed that pressure decreased as much as 80% to nearly 25 psi in
some areas and resulted in corresponding decreases in methane content. The lowest gas
content calculated for existing conditions in coal groups was 50–60 scf/ton. Water saturation
in coals decreased from 100% to values between 20 and 80%, depending on location. The
decrease in water saturation improved gas relative permeability to values as much as 0.8.
As a result of primary depletion and matrix shrinkage, permeability of coal seams increased
between 10 and 40% compared to their original, which varied between 1 and 10 md
depending on depth and coal seam. Calculated permeabilities and porosities were found to
be close to the values reported in the literature for Black Warrior coals. Existing effective
permeabilities calculated for gas and water at existing saturations showed that permeabilities
to gas are moderate in Pratt and Mary Lee groups; however, they are very low, less than 1
md, for the Black Creek group.
Since the wells were fractured, skin and fracture lengths were calculated in matching
process. Fracture lengths calculated using skin showed similar values reported in the
literature for these coals. Based on the literature, permeability anisotropy that is controlled
by induced-fractures was assumed to be in the N 70–90 E directions.
Karacan Page 18
J Nat Gas Sci Eng. Author manuscript; available in PMC 2015 July 17.
Author M
anuscriptA
uthor Manuscript
Author M
anuscriptA
uthor Manuscript

Since history matching was performed for 20 completions in Pratt, 92 completions in Mary
Lee, and 45 completions in Black Creek coal groups, compiled results brought the same
amount of data for initial and existing conditions of each of the reservoir parameters.
However, existing conditions are more important for future forecasts and models related to
degasification and emissions. Therefore, basic statistical values and quartile values of each
of the parameters of coal groups are reported in tables. These results can be used, as shown
in Section 5, to build parameter distributions for probabilistic simulations of degasification
efficiency and also can be used in conjunction with geological considerations to calculate
potential future methane emissions in operating mines, reducing the potential for ignitions
and explosions and improving worker safety.
Supplementary Material
Refer to Web version on PubMed Central for supplementary material.
Acknowledgments
Dr. Jack Pashin and Richard Carroll of Alabama Geological Survey are greatly appreciated for their efforts and help in gathering the borehole production data used in this study.
Nomenclature
AD drainage area (acres)
Bw water formation volume factor (bbl/stb)
E Young’s modulus (psi)
ε max. strain as P approaches 0
h net pay thickness (ft)
k permeability (md)
keg gas effective permeability (md)
kew water effective permeability (md)
ko initial permeability (md)
krg relative permeability to gas
krw relative permeability to water
Ng gas exponent (Corey equation)
Nw water exponent (Corey equation)
m(P) gas pseudo-pressure (psi2/cp)
μw water viscosity (cp)
Ø porosity
Øo initial porosity
Ṗ average reservoir pressure (psia)
Karacan Page 19
J Nat Gas Sci Eng. Author manuscript; available in PMC 2015 July 17.
Author M
anuscriptA
uthor Manuscript
Author M
anuscriptA
uthor Manuscript
Pd desorption pressure (psi)
Pε pressure at 50% of maximum matrix strain (psia)
PL Langmuir pressure parameter (psia)
Po initial pressure
Pwf bottomhole flowing pressure (psia)
qg gas rate (mscf/d)
qw water rate (bbl/day)
re external radius (ft)
rw wellbore radius (ft)
s skin
Sw water saturation (%)
σ effective stress (psi)
T temperature (R)
V(P) gas content (scf/ton)
VL Langmuir volume parameter (scf/ton)
Xf fracture half-length (ft)
γ Poisson’s ratio
References
Aminian K, Ameri S. Predicting production performance of CBM reservoirs. Journal of Natural Gas Science and Engineering. 2009; 1:25–30.
Busch A, Gensterblum Y. CBM and CO2-ECBM related sorption processes in coal: a review. International Journal of Coal Geology. 2011; 87:49–71.
Clarkson CR, Rahmanian M, Kantzas A, Morad K. Relative permeability of CBM reservoirs: controls on curve shape. International Journal of Coal Geology. 2011; 88:204–217.
Clarkson CR. Production data analysis of unconventional gas: review of theory and best practices. International Journal of Coal Geology. submitted for publication-a.
Clarkson CR. Production data analysis of unconventional gas: workflow. International Journal of Coal Geology. submitted for publication-b.
Diamond, WP. Methane Control for Underground Coal Mines. Pittsburgh, PA: 1994. US Bureau of Mines Information Circular No. 9395
Elder CH, Deul M. Degasification of Mary Lee Coalbed, near Oak Grove, Jefferson County, Alabama, by vertical borehole in advance of mining. 1974 U.S. Bureau of Mines, Report of Investigations 7968.
Fekete Associates, Inc. 2012 F.A.S.T. CBM. Calgary, Alberta, Canada.
Gash, BW. Measurement of rock properties in coal for coalbed methane production. SPE 22909, SPE Annual Technical Conference and Exhibition; 1991.
Gazonas, GA.; Wright, CA.; Wood, MD. Tiltmeter mapping and monitoring of hydraulic fracture propagation in coal: a case study in the Warrior Basin, Alabama. In: Fassett, JE., editor. Geology and Coalbed Methane Resources of the Northern San Juan Basin, Colorado and New Mexico. Rocky Mountain Association of Geologists; Denver, Colorado: 1988.
Karacan Page 20
J Nat Gas Sci Eng. Author manuscript; available in PMC 2015 July 17.
Author M
anuscriptA
uthor Manuscript
Author M
anuscriptA
uthor Manuscript

Groshong RH, Pashin JC, McIntyre MR. Structural controls on fractured coal reservoirs in the southern Appalachian Black Warrior foreland basin. Journal of Structural Geology. 2009; 31:874–886.
Karacan CÖ, Ruiz FA, Cotè M, Phipps S. Coal mine methane: a review of capture and utilization practices with benefits to mining safety and to green-house gas reduction. International Journal of Coal Geology. 2011; 86:121–156.
Karacan CÖ. Evaluation of the relative importance of coal bed reservoir parameters for prediction of methane inflow rates during mining of longwall development entries. Computers and Geosciences. 2008; 34:1093–1114.
Karacan CÖ, Diamond WP, Schatzel SJ. Numerical analysis of the influence of in-seam horizontal methane drainage boreholes on longwall face emission rates. International Journal of Coal Geology. 2007; 72:15–32.
Li J, Liu D, Yao Y, Cai Y, Qiu Y. Evaluation of the reservoir permeability of anthracite coals by geophysical logging data. International Journal of Coal Geology. 2011; 87:121–127.
Liu J, Chen Z, Elsworth D, Qu H, Chen D. Interactions of multiple processes during CBM extraction: a critical review. International Journal of Coal Geology. 2011; 87:175–189.
Mazumder S, Scott M, Jiang J. Permeability increase in Bowen basin coal as a result of matrix shrinkage during primary depletion. International Journal of Coal Geology. 2012; 96-97:109–119.
McKee CR, Bumb AC, Koenig RA. Stress-dependent Permeability and Porosity of Coal and Other Geologic Formations. Society of Petroleum Engineers Formation Evaluation. Mar.1988 :81–91. 1988.
Moore TA. Coalbed methane: a review. International Journal of Coal Geology. 2012; 101:36–81.
Nie R-S, Meng Y-F, Guo J-C, Jia Y-L. Modeling transient flow behavior of a horizontal well in a coal seam. International Journal of Coal Geology. 2012; 92:54–68.
Pan Z, Connell L. Modeling permeability for coal reservoirs: a review of analytical models and testing data. International Journal of Coal Geology. 2012; 92:1–44.
Pashin JC. Personal communication. 2012
Pashin JC, Guohai J, Chunmiao Z, Song C, McIntyre MR. 2008:118. Discrete fracture networks for risk assessment of carbon sequestration in coal: final Technical Report, U.S. Department of Energy, National Energy Technology Laboratory, Award DE-FC26-05NT42435.
Pashin JC, Guohai J, Payton JW. Three-dimensional computer models of natural and induced fractures in coalbed methane reservoirs of the Black Warrior basin. Alabama Geological Survey Bulletin. 2004; 174:62.
Pashin JC. Hydrodynamics of coalbed methane reservoirs in the Black Warrior Basin: key to understanding reservoir performance and environmental issues. Applied Geochemistry. 2007; 22:2257–2272.
Pashin JC. Variable gas saturation in coalbed methane reservoirs of the Black Warrior Basin: implications for exploration and production. International Journal Coal Geology. 2010; 82:135–146.
Pashin, JC.; Carroll, RE.; McIntyre, MR.; Grace, RLB. Geology of unconventional gas plays in the southern Appalachian thrust belt. Guidebook for Field Trip 7, AAPG Annual Conference and Exposition; New Orleans, LA. Apr 14-16. 2010a
Pashin JC, McIntyre MR, Clark PE, Esposito RA. 2010b:101. Southeastern Regional carbon sequestration Partnership (SECARB) phase II, SECARB Black Warrior Test Site, Blue Creek Field, Tuscaloosa County, Alabama: Virginia Tech Subaward Agreement CR-19655-415227 under U.S. Department of Energy Prime Award DE-FC26-05NT42590. Final report.
Pashin JC, Groshong RH. Structural control of coalbed methane production in Alabama. International Journal of Coal Geology. 1998; 38:89–113.
Pitman JK, Pashin JC, Hatch JR, Goldhaber MB. Origin of minerals in joint and cleat systems of the Pottsville formation, Black Warrior basin, Alabama: implications for coalbed methane generation and production. American Association of Petroleum Geologists Bulletin. 2003; 87:713–731.
Robertson E. Measurement and modeling of sorption-induced strain and permeability changes in coal. 2005 Report no: INL/EXT-06-11832. Idaho National Laboratory, Idaho Falls, Idaho. Available at: http://www.inl.gov/technicalpublications/Documents/3501810.pdf.
Karacan Page 21
J Nat Gas Sci Eng. Author manuscript; available in PMC 2015 July 17.
Author M
anuscriptA
uthor Manuscript
Author M
anuscriptA
uthor Manuscript
Saulsberry, JL.; Schafer, PS.; Schraufnagel, RA., editors. A Guide to Coalbed Methane Reservoir Engineering. Chicago, Illinois: 1996. Gas Research Institute Report GRI-94/0397
Shi, JQ.; Durucan, S. Changes in permeability of coal beds during primary recovery – Part 1: Model formulation and analysis. Paper 0341. In: Proceedings International Coalbed Methane Symposium; Tuscaloosa, AL. 2003.
Sparks, DP.; Lambert, SW.; McLendon, TH. Coalbed gas well flow performance controls, Cedar Cove area, Warrior Basin, USA. Paper 9376. In: Proceedings of the 1993 International Coalbed Methane Symposium; Tuscaloosa, AL. 1993. p. 529-547.
Steidl, PF. Evaluation of induced fractures intercepted by mining: Tuscaloosa, Alabama. Proceedings of 1993 International Coalbed Methane Symposium; 1993. p. 675-686.
Karacan Page 22
J Nat Gas Sci Eng. Author manuscript; available in PMC 2015 July 17.
Author M
anuscriptA
uthor Manuscript
Author M
anuscriptA
uthor Manuscript

Fig. 1. Coalbed methane fields in west-central Alabama (shown by solid black lines), major fault
and folds along the upturned margin of the basin, and location of the study area between the
Brookwood and Oak Grove fields (modified from Pashin and Groshong, 1998).
Karacan Page 23
J Nat Gas Sci Eng. Author manuscript; available in PMC 2015 July 17.
Author M
anuscriptA
uthor Manuscript
Author M
anuscriptA
uthor Manuscript

Fig. 2. A typical well log showing gamma ray and density log responses of Upper Pottsville coals.
The figure also shows the seams within each coal group and their approximate depth
intervals within the study area.
Karacan Page 24
J Nat Gas Sci Eng. Author manuscript; available in PMC 2015 July 17.
Author M
anuscriptA
uthor Manuscript
Author M
anuscriptA
uthor Manuscript

Fig. 3. Completion depth intervals of each coal group in the study area.
Karacan Page 25
J Nat Gas Sci Eng. Author manuscript; available in PMC 2015 July 17.
Author M
anuscriptA
uthor Manuscript
Author M
anuscriptA
uthor Manuscript

Fig. 4. A detailed picture showing the study area, field boundary, and location of wells with their
permit names and their completion intervals. The image overlay is the production duration
of the wells as of the last data recording at the beginning of 2012, and solid black lines are
the normal faults detected within the area.
Karacan Page 26
J Nat Gas Sci Eng. Author manuscript; available in PMC 2015 July 17.
Author M
anuscriptA
uthor Manuscript
Author M
anuscriptA
uthor Manuscript

Fig. 5. 3-Dimensional depth view of coal groups studied in this paper. The variations in these
figures show the changes of coal depths from surface and the displacements due to structural
faults. Each figure also shows the locations of well completions within each of them. Mary
Lee group’s figure in the middle shows the boundaries of the coal mine.
Karacan Page 27
J Nat Gas Sci Eng. Author manuscript; available in PMC 2015 July 17.
Author M
anuscriptA
uthor Manuscript
Author M
anuscriptA
uthor Manuscript
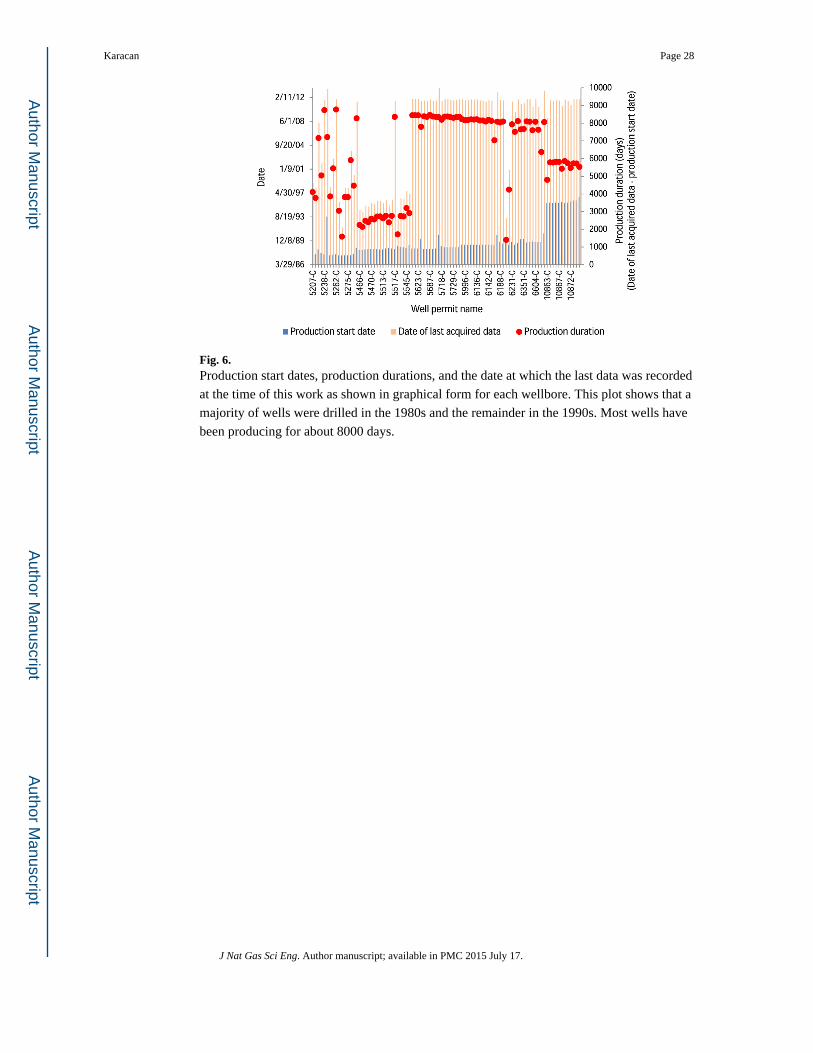
Fig. 6. Production start dates, production durations, and the date at which the last data was recorded
at the time of this work as shown in graphical form for each wellbore. This plot shows that a
majority of wells were drilled in the 1980s and the remainder in the 1990s. Most wells have
been producing for about 8000 days.
Karacan Page 28
J Nat Gas Sci Eng. Author manuscript; available in PMC 2015 July 17.
Author M
anuscriptA
uthor Manuscript
Author M
anuscriptA
uthor Manuscript

Fig. 7. Exponential decline rates of the wells determined by conventional decline curve analyses.
The inset is a logarithm of gas rate versus time plot of one of the wells given as an example
to show exponential decline.
Karacan Page 29
J Nat Gas Sci Eng. Author manuscript; available in PMC 2015 July 17.
Author M
anuscriptA
uthor Manuscript
Author M
anuscriptA
uthor Manuscript
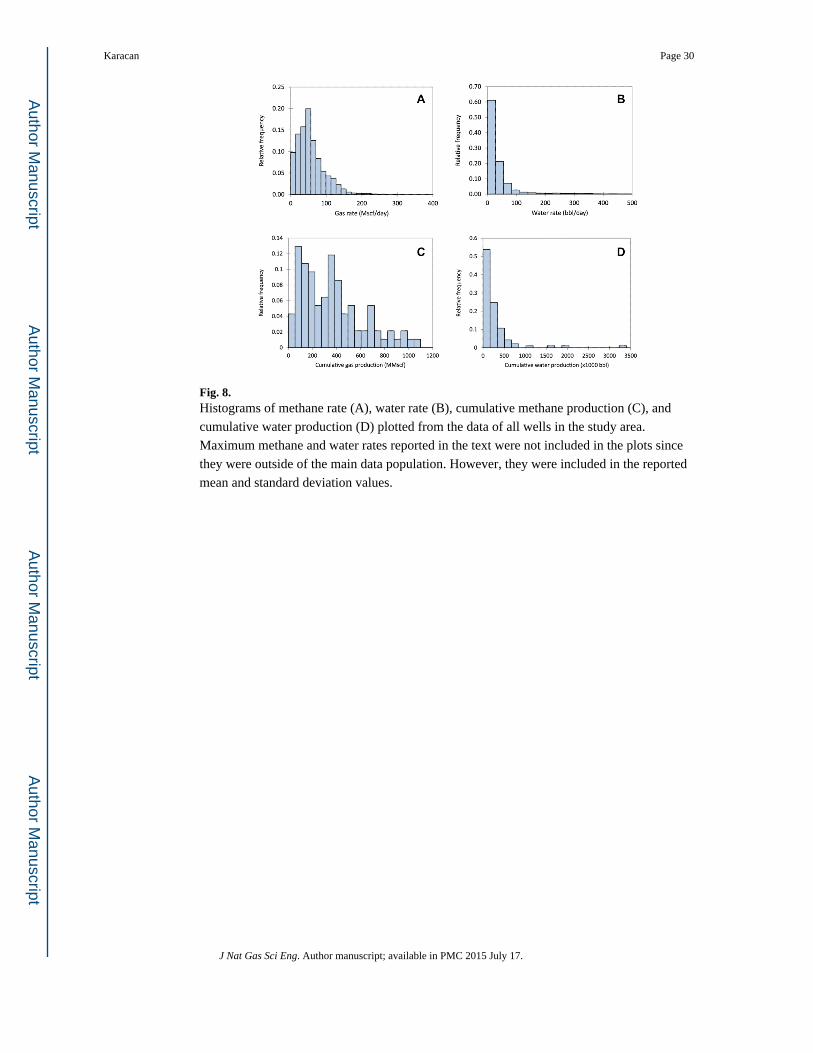
Fig. 8. Histograms of methane rate (A), water rate (B), cumulative methane production (C), and
cumulative water production (D) plotted from the data of all wells in the study area.
Maximum methane and water rates reported in the text were not included in the plots since
they were outside of the main data population. However, they were included in the reported
mean and standard deviation values.
Karacan Page 30
J Nat Gas Sci Eng. Author manuscript; available in PMC 2015 July 17.
Author M
anuscriptA
uthor Manuscript
Author M
anuscriptA
uthor Manuscript

Fig. 9. Langmuir isotherms and their parameters determined for each of the coal groups.
Karacan Page 31
J Nat Gas Sci Eng. Author manuscript; available in PMC 2015 July 17.
Author M
anuscriptA
uthor Manuscript
Author M
anuscriptA
uthor Manuscript

Fig. 10. Estimated permeability increase in Pratt, Mary Lee, and Black Creek coal groups as a
function of pressure change.
Karacan Page 32
J Nat Gas Sci Eng. Author manuscript; available in PMC 2015 July 17.
Author M
anuscriptA
uthor Manuscript
Author M
anuscriptA
uthor Manuscript
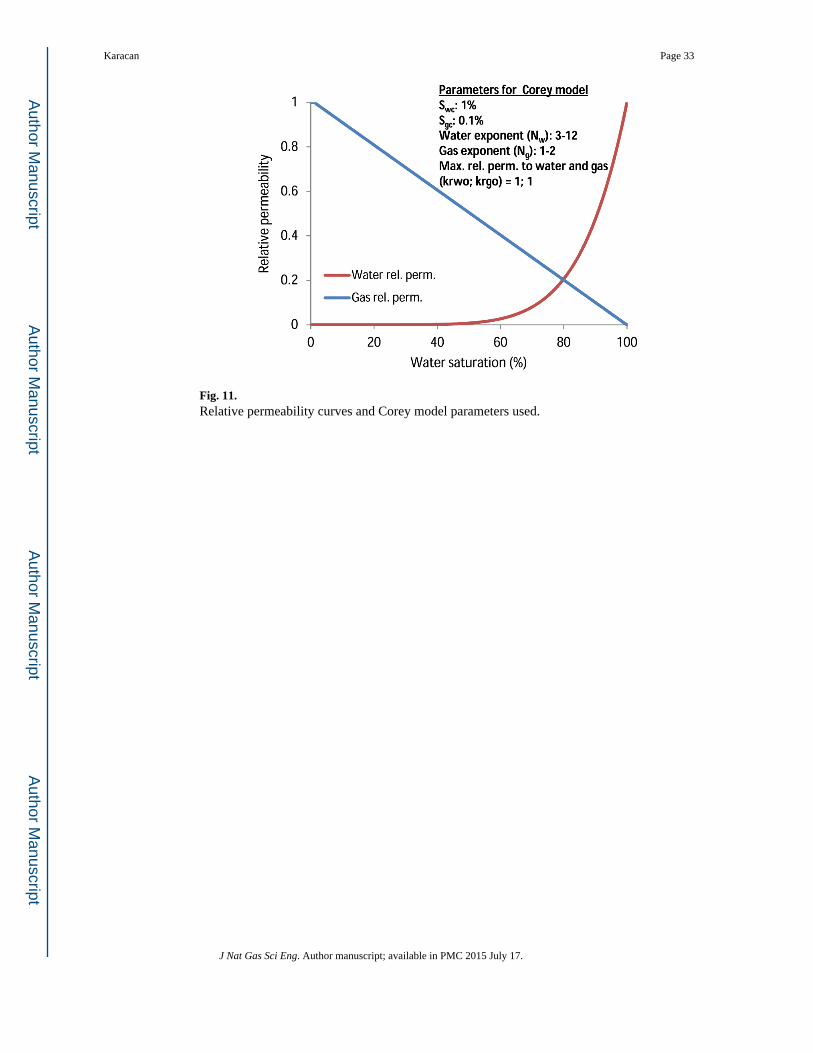
Fig. 11. Relative permeability curves and Corey model parameters used.
Karacan Page 33
J Nat Gas Sci Eng. Author manuscript; available in PMC 2015 July 17.
Author M
anuscriptA
uthor Manuscript
Author M
anuscriptA
uthor Manuscript

Fig. 12. Example history match results from wells that are completed in one, two, and three layers.
The bracket “]” shows water rate predictions contributed from each coal group.
Karacan Page 34
J Nat Gas Sci Eng. Author manuscript; available in PMC 2015 July 17.
Author M
anuscriptA
uthor Manuscript
Author M
anuscriptA
uthor Manuscript

Fig. 13. Calculated initial pressures and estimated existing pressures of the coal groups, from history
matching (based on 0.15 psi/ft pressure gradient).
Karacan Page 35
J Nat Gas Sci Eng. Author manuscript; available in PMC 2015 July 17.
Author M
anuscriptA
uthor Manuscript
Author M
anuscriptA
uthor Manuscript
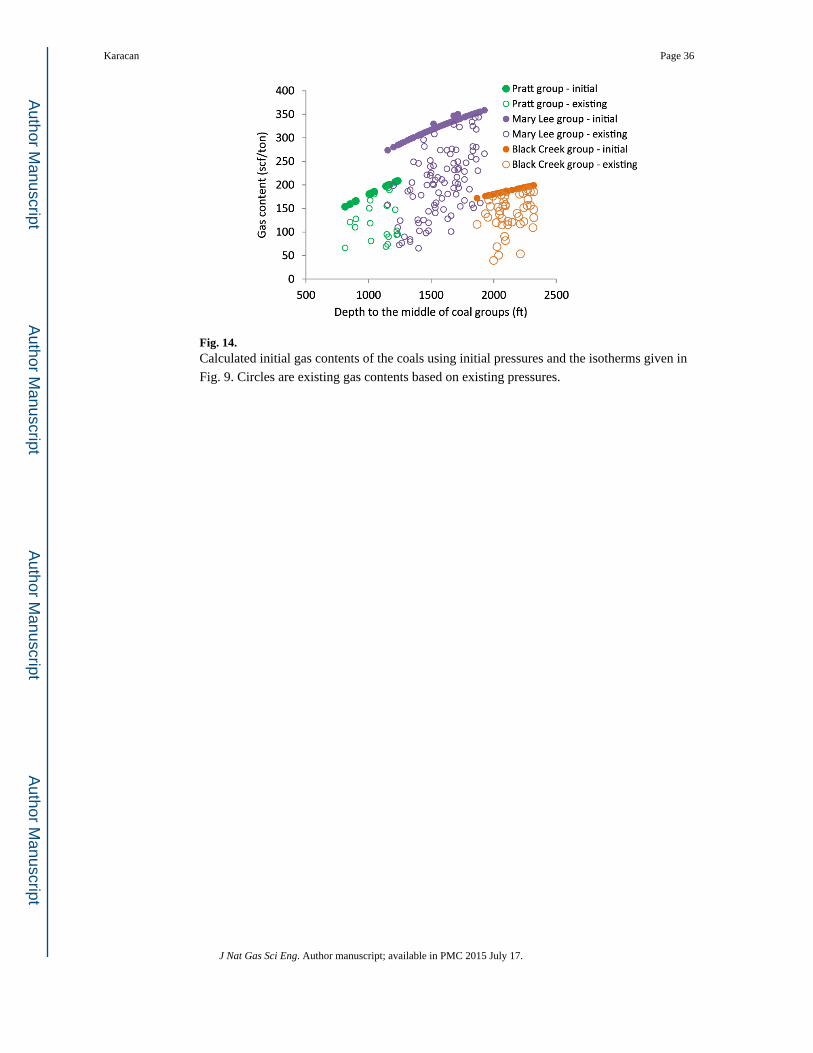
Fig. 14. Calculated initial gas contents of the coals using initial pressures and the isotherms given in
Fig. 9. Circles are existing gas contents based on existing pressures.
Karacan Page 36
J Nat Gas Sci Eng. Author manuscript; available in PMC 2015 July 17.
Author M
anuscriptA
uthor Manuscript
Author M
anuscriptA
uthor Manuscript

Fig. 15. Spatial distribution of predicted existing gas contents within the Mary Lee coal group in the
study area. In the sorted class map, symbol sizes were scaled according to their magnitude.
Karacan Page 37
J Nat Gas Sci Eng. Author manuscript; available in PMC 2015 July 17.
Author M
anuscriptA
uthor Manuscript
Author M
anuscriptA
uthor Manuscript

Fig. 16. Initial and existing permeability (A), and initial and existing porosity (B) of coal groups
estimated using production history matching.
Karacan Page 38
J Nat Gas Sci Eng. Author manuscript; available in PMC 2015 July 17.
Author M
anuscriptA
uthor Manuscript
Author M
anuscriptA
uthor Manuscript
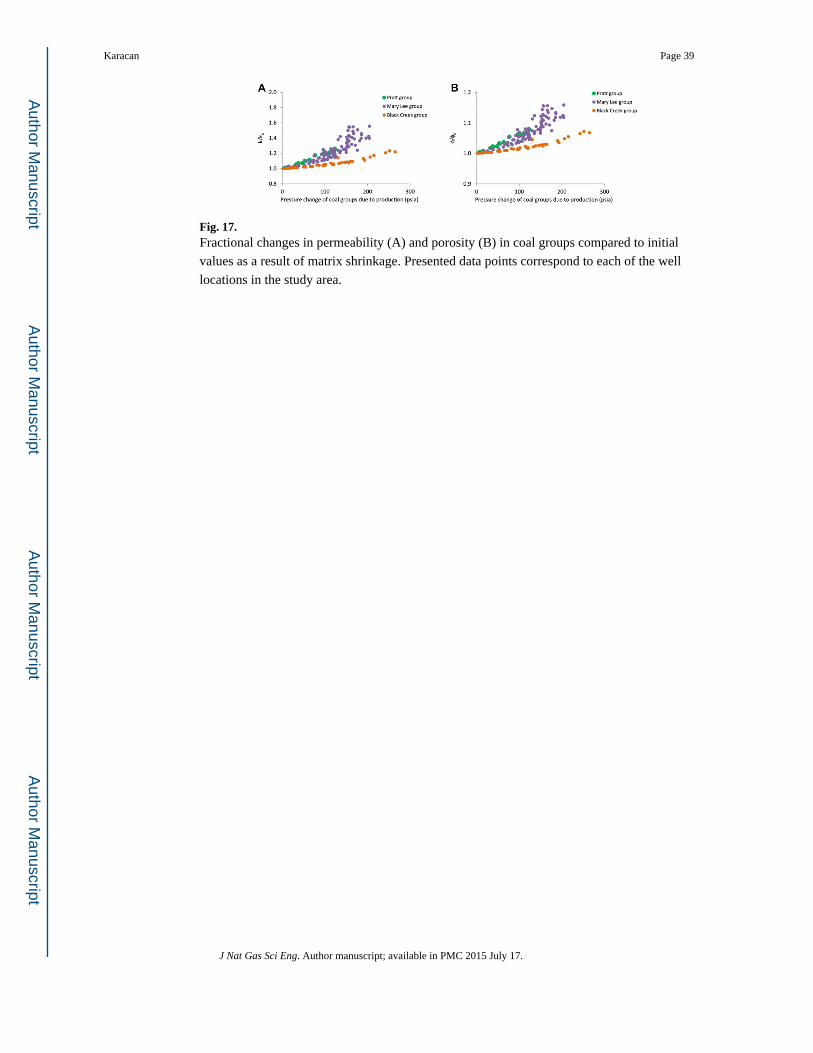
Fig. 17. Fractional changes in permeability (A) and porosity (B) in coal groups compared to initial
values as a result of matrix shrinkage. Presented data points correspond to each of the well
locations in the study area.
Karacan Page 39
J Nat Gas Sci Eng. Author manuscript; available in PMC 2015 July 17.
Author M
anuscriptA
uthor Manuscript
Author M
anuscriptA
uthor Manuscript

Fig. 18. Existing relative (A–C) and effective permeabilities (D–F) to gas and water in Pratt, Mary
Lee, and Black Creek coal groups.
Karacan Page 40
J Nat Gas Sci Eng. Author manuscript; available in PMC 2015 July 17.
Author M
anuscriptA
uthor Manuscript
Author M
anuscriptA
uthor Manuscript
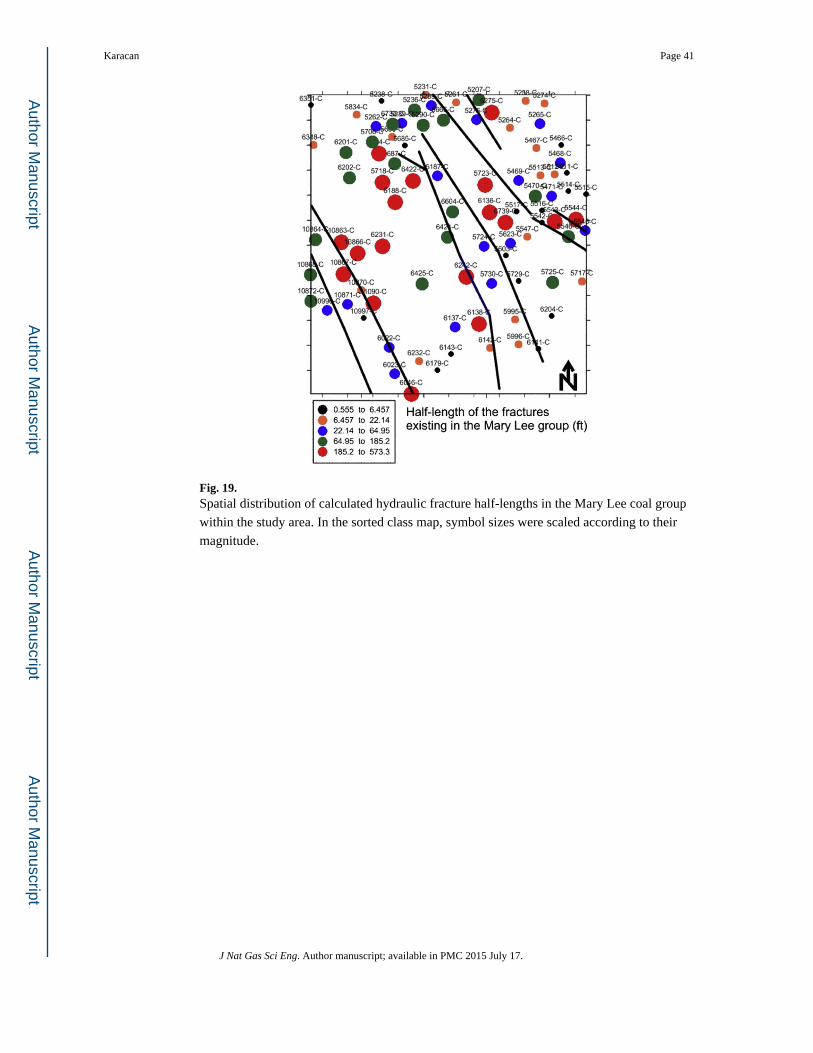
Fig. 19. Spatial distribution of calculated hydraulic fracture half-lengths in the Mary Lee coal group
within the study area. In the sorted class map, symbol sizes were scaled according to their
magnitude.
Karacan Page 41
J Nat Gas Sci Eng. Author manuscript; available in PMC 2015 July 17.
Author M
anuscriptA
uthor Manuscript
Author M
anuscriptA
uthor Manuscript

Fig. 20. Cumulative frequency histogram of gas and water productions estimated using the values in
Table 4 with a stochastic approach. The percentile values are given in the inset table.
Karacan Page 42
J Nat Gas Sci Eng. Author manuscript; available in PMC 2015 July 17.
Author M
anuscriptA
uthor Manuscript
Author M
anuscriptA
uthor Manuscript

Fig. 21. Gas and water rates (P10, P50 and P90) predicted using stochastic simulation and the input
values given in Table 4.
Karacan Page 43
J Nat Gas Sci Eng. Author manuscript; available in PMC 2015 July 17.
Author M
anuscriptA
uthor Manuscript
Author M
anuscriptA
uthor Manuscript

Author M
anuscriptA
uthor Manuscript
Author M
anuscriptA
uthor Manuscript
Karacan Page 44
Table 1
Basic statistics and quartile values of existing coal reservoir and fluid-transport-related parameters in each coal
group.
Coal group and variable Minimum Maximum Mean 1st quartile Median(2nd quartile)
3rd quartile Standarddeviation
Pratt – P (psia) 44.90 167.15 93.51 66.07 84.45 120.14 38.76
Mary Lee – P (psia) 26.98 264.19 116.55 74.42 109.05 148.18 57.09
Black Creek – P (psia) 47.99 325.22 214.70 172.17 220.39 271.01 72.34
Pratt – V(P) (scf/t) 72.53 251.97 156.19 116.80 150.80 198.64 56.38
Mary Lee – V(P) (scf/t) 65.35 343.53 202.40 153.72 203.40 249.10 69.05
Black Creek – V(P) (scf/t) 39.32 190.26 138.64 119.61 144.57 167.94 38.14
Pratt – k (md) 3.83 14.90 8.42 6.48 8.79 10.23 2.65
Mary Lee – k (md) 0.53 18.30 6.24 3.84 5.72 8.09 3.53
Black C – k (md) 0.32 2.12 1.03 0.81 1.06 1.22 0.40
Pratt – krg 0.10 0.67 0.39 0.24 0.37 0.54 0.19
Mary Lee – krg 0.07 0.82 0.44 0.31 0.44 0.57 0.16
Black Creek – krg 0.05 0.62 0.29 0.17 0.28 0.39 0.13
Pratt – krw 0.01 0.26 0.08 0.04 0.05 0.14 0.06
Mary Lee – krw 0.01 0.53 0.08 0.02 0.04 0.08 0.10
Black Creek – krw 0.05 0.78 0.24 0.12 0.21 0.29 0.16
Pratt – keg (md) 0.39 6.73 3.45 1.56 3.62 5.13 2.12
Mary Lee – keg (md) 0.14 11.11 2.80 1.15 2.50 3.88 2.07
Black Creek – keg (md) 0.02 0.87 0.32 0.18 0.27 0.46 0.21
Pratt – kew (md) 0.05 2.13 0.60 0.33 0.51 0.80 0.45
Mary Lee – kew (md) 0.02 5.75 0.43 0.11 0.20 0.44 0.78
Black Creek – kew (md) 0.03 0.78 0.22 0.12 0.19 0.27 0.15
Pratt – Ø (%) 0.52 3.07 1.40 1.02 1.07 2.02 0.63
Mary Lee – Ø (%) 0.27 5.65 1.42 1.01 1.11 2.01 0.85
Black Creek – Ø (%) 0.50 3.16 1.87 2.00 2.02 2.05 0.54
Pratt – Sw (%) 29.20 82.12 56.22 38.33 58.01 68.38 16.01
Mary Lee – Sw (%) 17.37 88.44 51.63 39.37 52.88 62.74 16.13
Black Creek – Sw (%) 38.30 95.22 70.30 61.61 72.12 77.62 11.82
J Nat Gas Sci Eng. Author manuscript; available in PMC 2015 July 17.

Author M
anuscriptA
uthor Manuscript
Author M
anuscriptA
uthor Manuscript
Karacan Page 45
Table 2
Basic statistics and quartile values of skin and fracture half-lengths existing in each coal group.
Coal group and variable Min. Max. Mean 1st quartile Median(2nd quartile)
3rd quartile Standarddeviation
Pratt – skin −0.7 −6.9 −4.2 −6.1 −4.0 −2.7 2.0
Mary Lee – skin −0.1 −7.7 −4.3 −5.8 −4.6 −3.0 1.8
Black Creek – skin −1.1 −7.1 −4.1 −5.8 −3.9 −2.5 1.7
Pratt – Frac. half-length (ft) 1.0 513.0 119.8 7.9 27.6 214.1 160.3
Mary Lee – Frac. half-length (ft) 0.6 573.3 100.0 9.2 44.8 160.9 130.0
Black Creek – Frac. half-length (ft) 1.6 607.7 103.1 6.2 23.8 161.6 144.8
J Nat Gas Sci Eng. Author manuscript; available in PMC 2015 July 17.

Author M
anuscriptA
uthor Manuscript
Author M
anuscriptA
uthor Manuscript
Karacan Page 46
Table 3
Statistics of drainage area (AD) calculated for each coal group.
Coal group andvariable
Min. Max. Mean 1stquartile
Median (2ndquartile)
3rdquartile
Standarddeviation
Pratt – AD
(acres)24.0 117.0 76.1 51.0 76.0 95.0 26.7
Mary Lee – AD
(acres)6.0 173.0 58.4 25.0 50.0 81.0 39.0
Black Creek – AD
(acres)12.0 136.0 59.8 35.3 54.0 77.3 32.5
J Nat Gas Sci Eng. Author manuscript; available in PMC 2015 July 17.

Author M
anuscriptA
uthor Manuscript
Author M
anuscriptA
uthor Manuscript
Karacan Page 47
Table 4
Parameter values and their ranges used in probabilistic well deliverability calculation for Mary Lee coal group.
Parameter Unit Values Distribution
Pi psia Mean: 116.6 Std. Dev: 57.1 Normal
VL (CH4) scf/ton Constant: 666
PL (CH4) psia Constant: 248
V(P) scf/ton Constant: 291.5
A D acres Mean: 58.34 Std. Dev: 39.01 Normal
h ft Constant: 22
Ø % Mean: 1.42 Std. Dev: 0.85 Normal
S w % Constant: 100
T oF Constant: 86
k md Mean: 6.24 Std. Dev: 3.53 Normal
s Mean: −4.3 Std. Dev: 1.8 Normal
S wc % Constant: 1
S gc % Constant: 0.1
N w Min: 3 Max: 12 Uniform
N g Min: 1 Max: 2 Uniform
J Nat Gas Sci Eng. Author manuscript; available in PMC 2015 July 17.