brt and tod - rail~volutionrailvolution.org/.../andrew-knudtsen-brt-and-tod.pdf · brt los angeles...
TRANSCRIPT
BRT and TOD
September 20, 2017
Presented by: Andrew Knudtsen, Managing Principal Economic & Planning Systems
The Economics of Land Use
O a k l a n d S a c r a m e n t o D e n v e r L o s A n g e l e s
What makes TOD on BRT Work?
ECONOMIC & PLANNING SYSTEMS 1
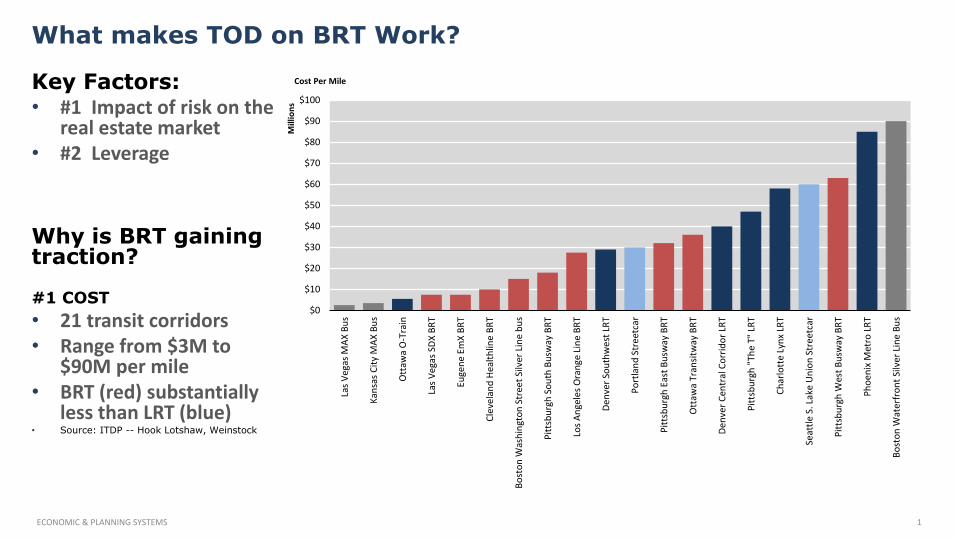
Key Factors: • #1 Impact of risk on the
real estate market • #2 Leverage Why is BRT gaining traction? #1 COST • 21 transit corridors • Range from $3M to
$90M per mile • BRT (red) substantially
less than LRT (blue) • Source: ITDP -- Hook Lotshaw, Weinstock
$0
$10
$20
$30
$40
$50
$60
$70
$80
$90
$100
Las V
egas
MAX
Bus
Kans
as C
ity M
AX B
us
Ott
awa
O-T
rain
Las V
egas
SDX
BRT
Euge
ne E
mX
BRT
Clev
elan
d He
alth
line
BRT
Bost
on W
ashi
ngto
n St
reet
Silv
er L
ine
bus
Pitt
sbur
gh S
outh
Bus
way
BRT
Los A
ngel
es O
rang
e Li
ne B
RT
Denv
er S
outh
wes
t LRT
Port
land
Str
eetc
ar
Pitt
sbur
gh E
ast B
usw
ay B
RT
Ott
awa
Tran
sitw
ay B
RT
Denv
er C
entr
al C
orrid
or L
RT
Pitt
sbur
gh "T
he T
" LRT
Char
lott
e Ly
nx L
RT
Seat
tle S
. Lak
e U
nion
Str
eetc
ar
Pitt
sbur
gh W
est B
usw
ay B
RT
Phoe
nix
Met
ro L
RT
Bost
on W
ater
fron
t Silv
er L
ine
Bus
Cost Per Mile
Mill
ions
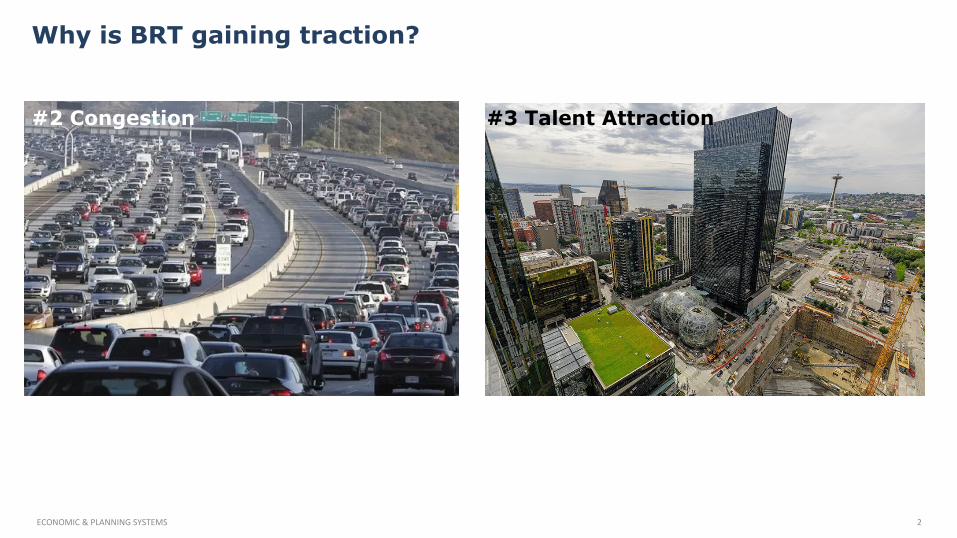
Why is BRT gaining traction?
ECONOMIC & PLANNING SYSTEMS 2
#2 Congestion
#3 Talent Attraction
Key Variables
ECONOMIC & PLANNING SYSTEMS 3
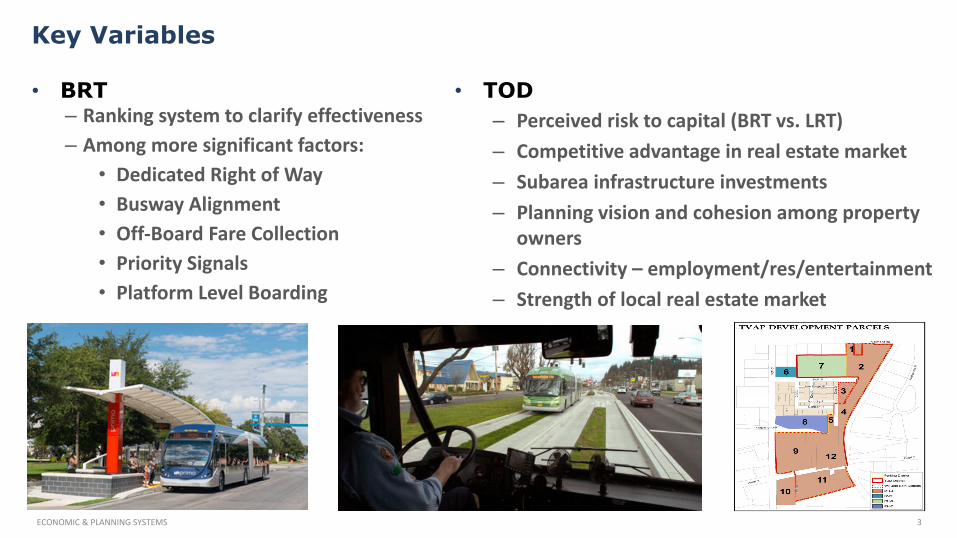
• BRT
– Ranking system to clarify effectiveness – Among more significant factors:
• Dedicated Right of Way • Busway Alignment • Off-Board Fare Collection • Priority Signals • Platform Level Boarding
• TOD – Perceived risk to capital (BRT vs. LRT) – Competitive advantage in real estate market – Subarea infrastructure investments – Planning vision and cohesion among property
owners – Connectivity – employment/res/entertainment – Strength of local real estate market
Seattle South Lanke Union Streetcar
Portland Streetcar
Boston Washing Street Silver Line Bus
Boston Waterfrton Silver Line bus
ClevelandHealthLine BRT
Las Vegas Strip and Downtown Express BRT
Eugene Emerald Express Green Line BRT
Pittsburgh MLK Jr. East Busway BRT
Los Angeles Orange Line BRT
Ottawa Transitway BRT
PortalndMAX Blue Line LRT
Denver Central Corridor LRT
Phoenix Metro LRT
Charlotte Lynx LRT
Denver Southwest Corridor LRT$0
$1,000
$2,000
$3,000
$4,000
$5,000
$6,000
$7,000
$8,000
-$200 $300 $800 $1,300 $1,800 $2,300
TOD
Inve
stm
ent
Mill
ions
Transit Investment Millions
Street Car Bus BRT LRT/Street Car
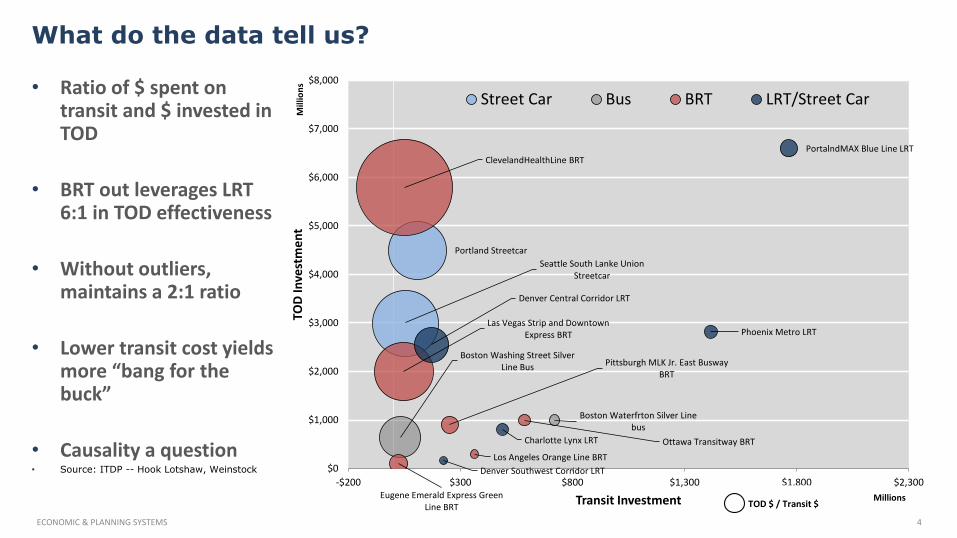
What do the data tell us?
ECONOMIC & PLANNING SYSTEMS 4
• Ratio of $ spent on
transit and $ invested in TOD
• BRT out leverages LRT 6:1 in TOD effectiveness
• Without outliers, maintains a 2:1 ratio
• Lower transit cost yields more “bang for the buck”
• Causality a question • Source: ITDP -- Hook Lotshaw, Weinstock
TOD $ / Transit $
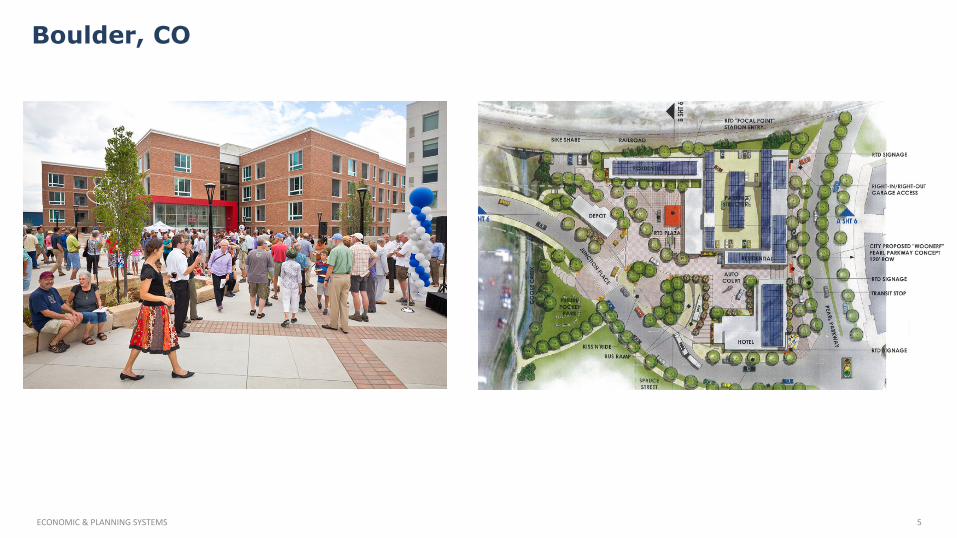
Boulder, CO
ECONOMIC & PLANNING SYSTEMS 5
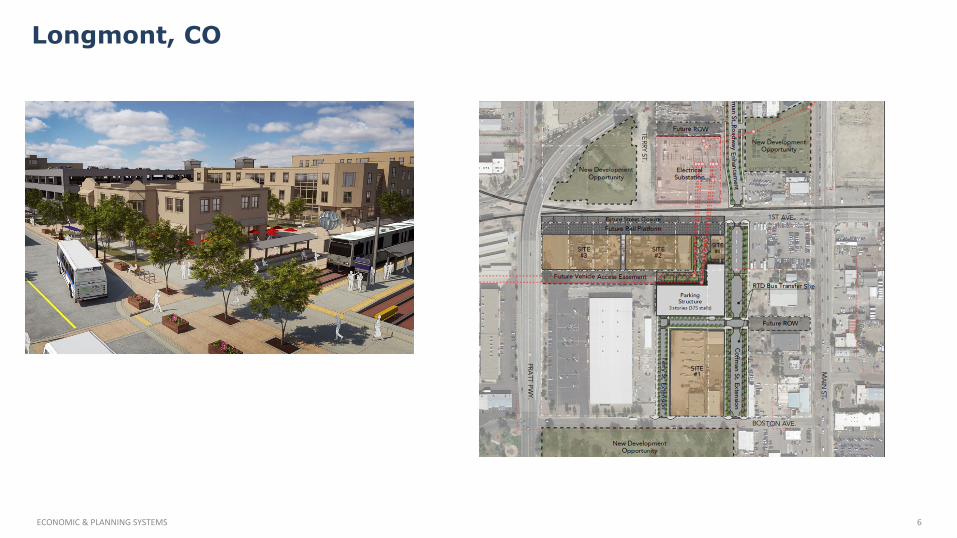
Longmont, CO
ECONOMIC & PLANNING SYSTEMS 6
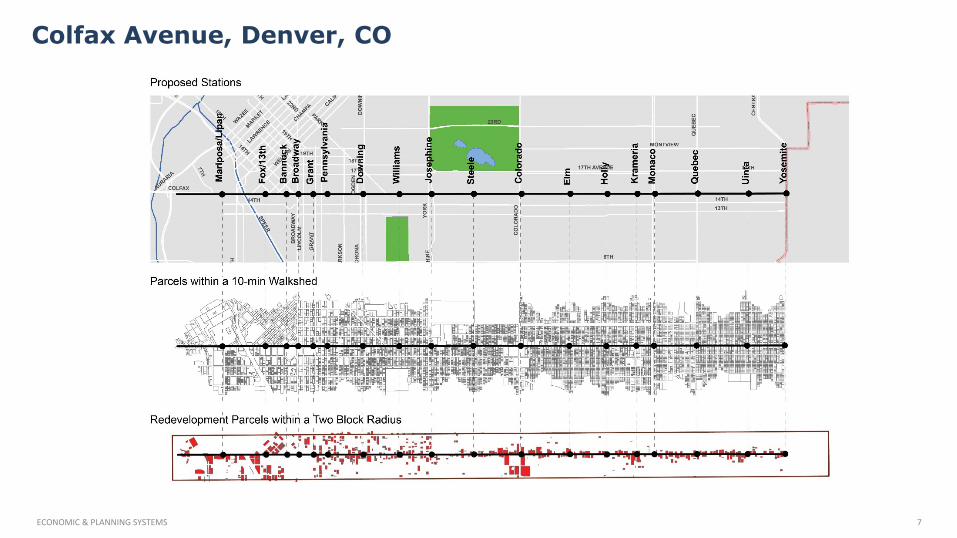
Colfax Avenue, Denver, CO
ECONOMIC & PLANNING SYSTEMS 7
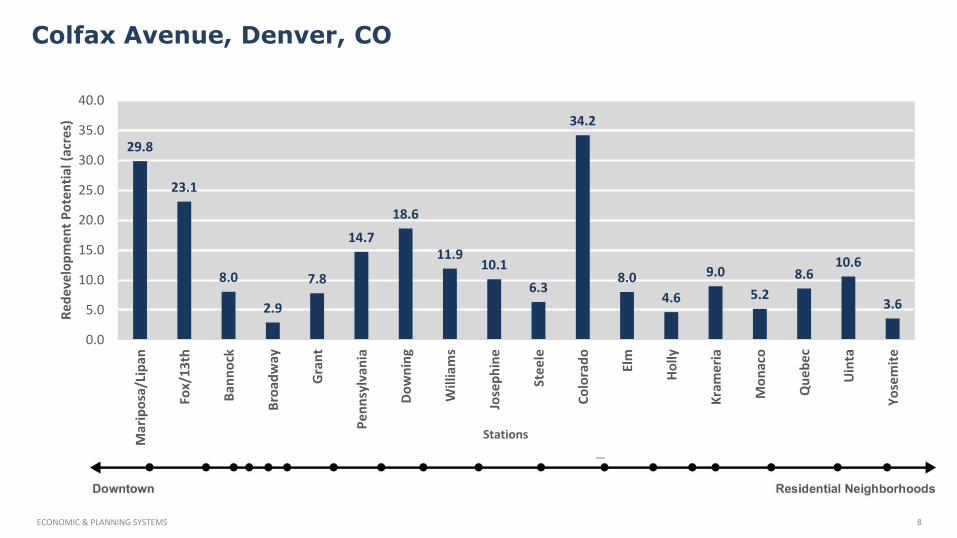
Colfax Avenue, Denver, CO
ECONOMIC & PLANNING SYSTEMS 8
29.8
23.1
8.0
2.9
7.8
14.7
18.6
11.9 10.1
6.3
34.2
8.0 4.6
9.0 5.2
8.6 10.6
3.6
0.0
5.0
10.0
15.0
20.0
25.0
30.0
35.0
40.0
Mar
ipos
a/Li
pan
Fox/
13th
Bann
ock
Broa
dway
Gra
nt
Penn
sylv
ania
Dow
ning
Will
iam
s
Jose
phin
e
Stee
le
Colo
rado Elm
Hol
ly
Kram
eria
Mon
aco
Que
bec
Uin
ta
Yose
mite
Rede
velo
pmen
t Pot
entia
l (ac
res)
Stations