bruker avance 300 using topspin 2 - kenyon collegechemistry.kenyon.edu/getzler/research...
TRANSCRIPT

Getzler Instrument Instructions 1
Bruker Avance 300 using TOPSPIN 2.0
Acquiring a Routine 1H or 13C Spectrum Check that the three green indicator lights on the metal strip just below the large picture window are all illuminated. If they are not, inform one of the faculty immediately and do not proceed further. If TopSpin 2.0 is not already running. Open TopSpin 2.0 from the desktop and then launch Automation.
Sign in as user Advanced_lab and then start automation by clicking on the green gear in the upper left hand corner. If TopSpin 2.0 and ICON-NMR Automation are already running. Select the Change User icon and sign in as user Advanced_lab. Select an Available number in the automation screen and enter your compound ID number in the Name field. Place your sample in the appropriate slot on the sample changer. Select the appropriate Solvent and Experiment, enter the appropriate information in Title/Orig (compound name or ID number, solvent, other relevant information) and click on Submit.
You can observe the progress of the experiment in the upper right hand corner of the screen. When locking, shimming and data acquisition is complete (~6 minutes), a full width spectrum will be automatically printed and the sample will be ejected. Switch back to Bruker TOPSPIN 2.0… and dismiss the sref warning.1
1 The program looks for TMS, so most samples will return the “no peak found” error.
2 Instrumental Analysis Getzler
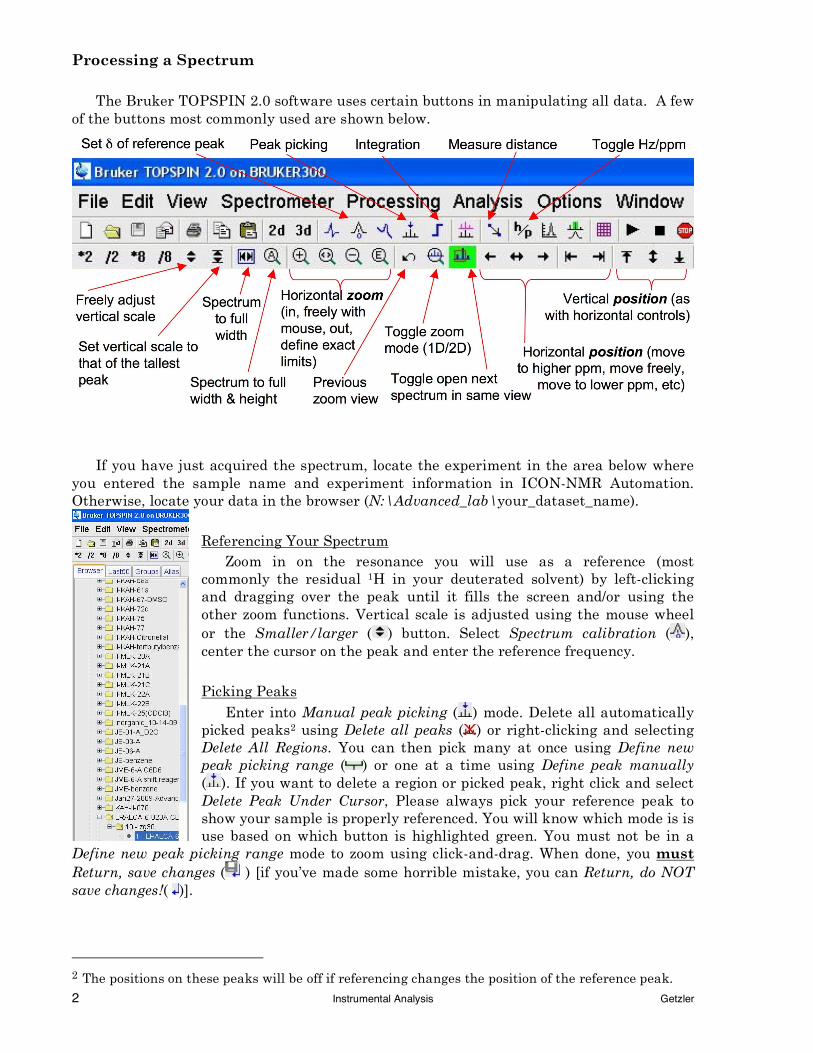
Processing a Spectrum The Bruker TOPSPIN 2.0 software uses certain buttons in manipulating all data. A few of the buttons most commonly used are shown below.
If you have just acquired the spectrum, locate the experiment in the area below where you entered the sample name and experiment information in ICON-NMR Automation. Otherwise, locate your data in the browser (N:\Advanced_lab\your_dataset_name).
Referencing Your Spectrum Zoom in on the resonance you will use as a reference (most commonly the residual 1H in your deuterated solvent) by left-clicking and dragging over the peak until it fills the screen and/or using the other zoom functions. Vertical scale is adjusted using the mouse wheel or the Smaller/larger ( ) button. Select Spectrum calibration ( ), center the cursor on the peak and enter the reference frequency. Picking Peaks Enter into Manual peak picking ( ) mode. Delete all automatically picked peaks2 using Delete all peaks ( ) or right-clicking and selecting Delete All Regions. You can then pick many at once using Define new peak picking range ( ) or one at a time using Define peak manually ( ). If you want to delete a region or picked peak, right click and select Delete Peak Under Cursor, Please always pick your reference peak to show your sample is properly referenced. You will know which mode is is use based on which button is highlighted green. You must not be in a
Define new peak picking range mode to zoom using click-and-drag. When done, you must Return, save changes ( ) [if you’ve made some horrible mistake, you can Return, do NOT save changes!( )].
2 The positions on these peaks will be off if referencing changes the position of the reference peak.
Getzler Instrument Instructions 3
Integration Enter into Interactive integration mode ( ). Delete all integrals3 by using Select/Deselect all regions ( ) followed by Delete selected regions ( ). Zoom in on an area you want to integrate, select Define new region using cursor ( ) and integrate by left-clicking and dragging. Your integral should go from flat baseline to flat baseline whenever possible. If you make a mistake, right click in an integral and select Delete current integral. Move along the spectrum or zoom in and out to define all regions. As with integration, you may not use click-and-drag to zoom while you are picking regions; to do so, click on again. You can also right click on a given integral to give it a specific value and adjust other accordingly or to define the value of the sum of all the integrals (Calibrate current integral or Normalize sum of integrals). Please do not integrate the solvent residual peak. When done, you must Return, save changes ( ) [if you’ve made some horrible mistake, you can Return, do NOT save changes!( )]. Printing When done with peak picking and integration, click on Print active window ( )and select Print with layout – start Plot Editor. Your spectra should be printed in a standard layout to make it simpler to compare them to each other. Under File select Open Layout/Portfolio from Dataset… or selecting Open ( ). Navigate to N:\\Bruker\TOPSPIN2\plot\layouts\ CHEM341_Layouts and select an appropriate layout for your spectrum. For most proton spectra, there will be areas of the spectrum you want to show in more detail. To create an inset, click on the Create 1D button to the left of the spectrum. Click-and-drag to create an inset. To resize, reposition or delete the inset (or other objects), click
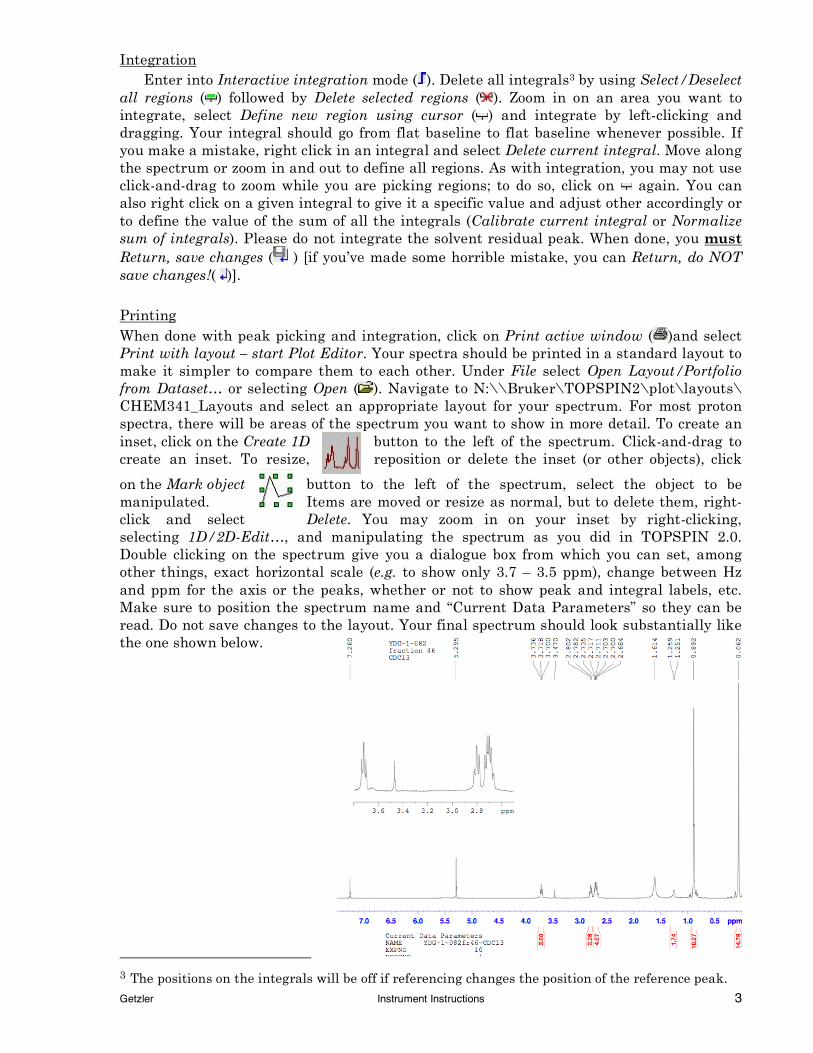
on the Mark object button to the left of the spectrum, select the object to be manipulated. Items are moved or resize as normal, but to delete them, right-click and select Delete. You may zoom in on your inset by right-clicking, selecting 1D/2D-Edit…, and manipulating the spectrum as you did in TOPSPIN 2.0. Double clicking on the spectrum give you a dialogue box from which you can set, among other things, exact horizontal scale (e.g. to show only 3.7 – 3.5 ppm), change between Hz and ppm for the axis or the peaks, whether or not to show peak and integral labels, etc. Make sure to position the spectrum name and “Current Data Parameters” so they can be read. Do not save changes to the layout. Your final spectrum should look substantially like the one shown below.
3 The positions on the integrals will be off if referencing changes the position of the reference peak.