b.sc. iii chemistry paper a - govt.college for girls ...cms.gcg11.ac.in/attachments/article/107/b.sc...
TRANSCRIPT
B.sc. III Chemistry PAPER A
Submited by :- Dr. Sangeeta Mehtani Associate Professor Deptt. Of Chemistry PGGCG, sec11 Chd
Electronic Spectra Of Transition Metal Complexes part 2
Atomic Quantum Numbers
Quantum numbers L and S describe collections of microstates, whereas ML and MS describe the individual microstates themselves.
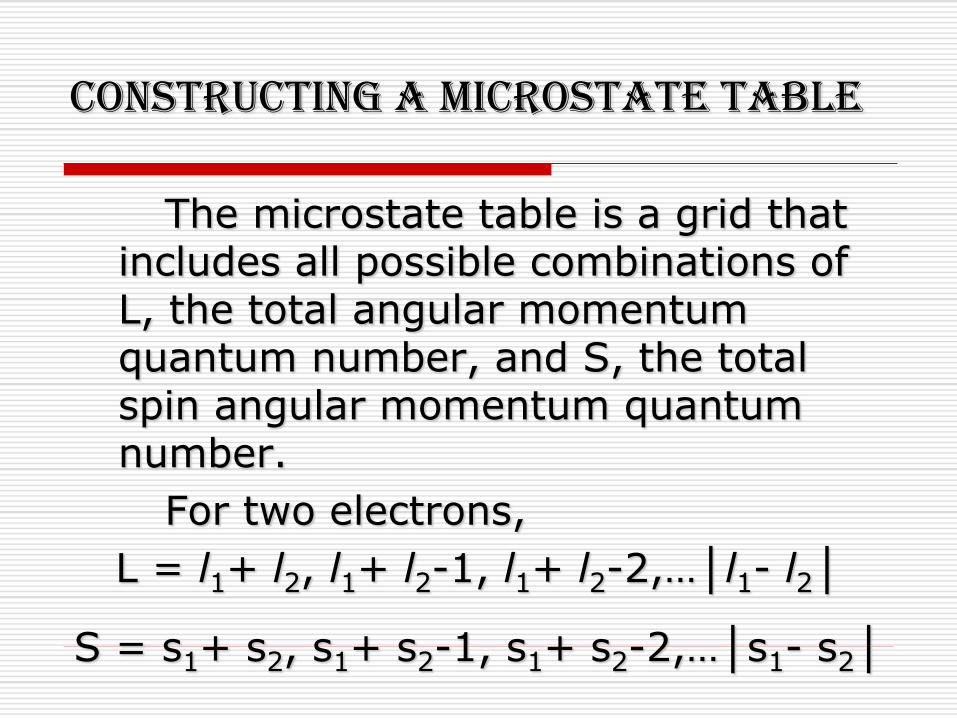
Constructing a Microstate Table
The microstate table is a grid that includes all possible combinations of L, the total angular momentum quantum number, and S, the total spin angular momentum quantum number.
For two electrons,
L = l1+ l2, l1+ l2-1, l1+ l2-2,…│l1- l2│
S = s1+ s2, s1+ s2-1, s1+ s2-2,…│s1- s2│

Constructing a Microstate Table
Once the microstate table is complete, all microstates associated with an energy state with specific value of L and S are grouped.
It doesn’t matter which specific microstates are placed in the group. Microstates are grouped and eliminated until all microstates are associated with a specific energy state or term.
Term Symbols
The upper left corner of the term symbol contains a number called the multiplicity. The multiplicity is the number of unpaired electrons +1, or 2S+1.
Assigning Term Symbols
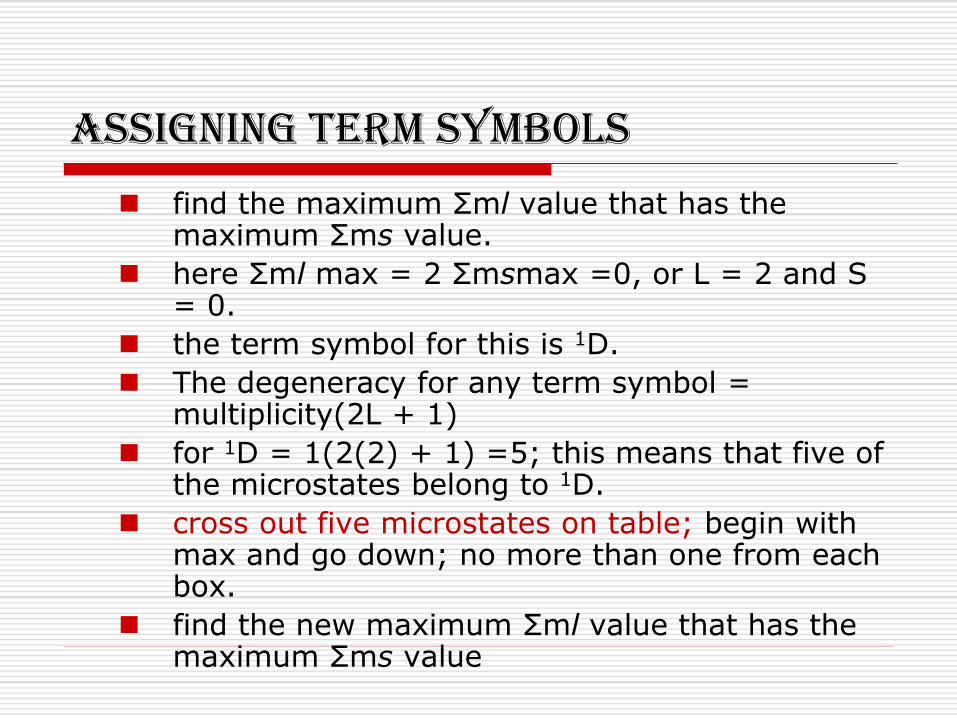
find the maximum Σml value that has the maximum Σms value.
here Σml max = 2 Σmsmax =0, or L = 2 and S = 0.
the term symbol for this is 1D.
The degeneracy for any term symbol = multiplicity(2L + 1)
for 1D = 1(2(2) + 1) =5; this means that five of the microstates belong to 1D.
cross out five microstates on table; begin with max and go down; no more than one from each box.
find the new maximum Σml value that has the maximum Σms value
Assigning Term Symbols
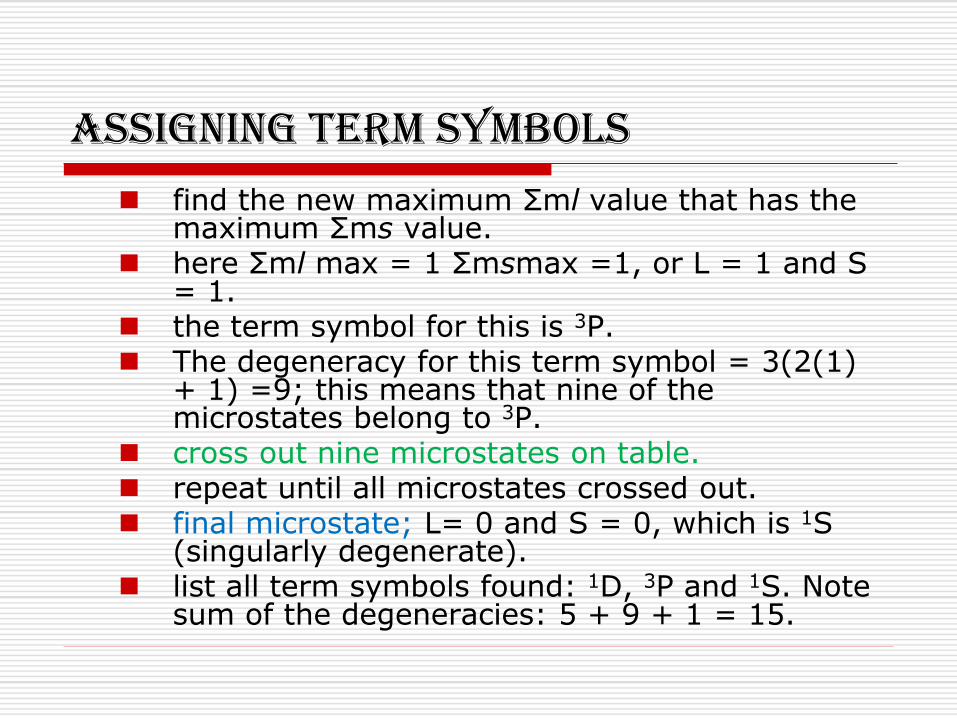
find the new maximum Σml value that has the maximum Σms value.
here Σml max = 1 Σmsmax =1, or L = 1 and S = 1.
the term symbol for this is 3P. The degeneracy for this term symbol = 3(2(1)
+ 1) =9; this means that nine of the microstates belong to 3P.
cross out nine microstates on table. repeat until all microstates crossed out. final microstate; L= 0 and S = 0, which is 1S
(singularly degenerate). list all term symbols found: 1D, 3P and 1S. Note
sum of the degeneracies: 5 + 9 + 1 = 15.
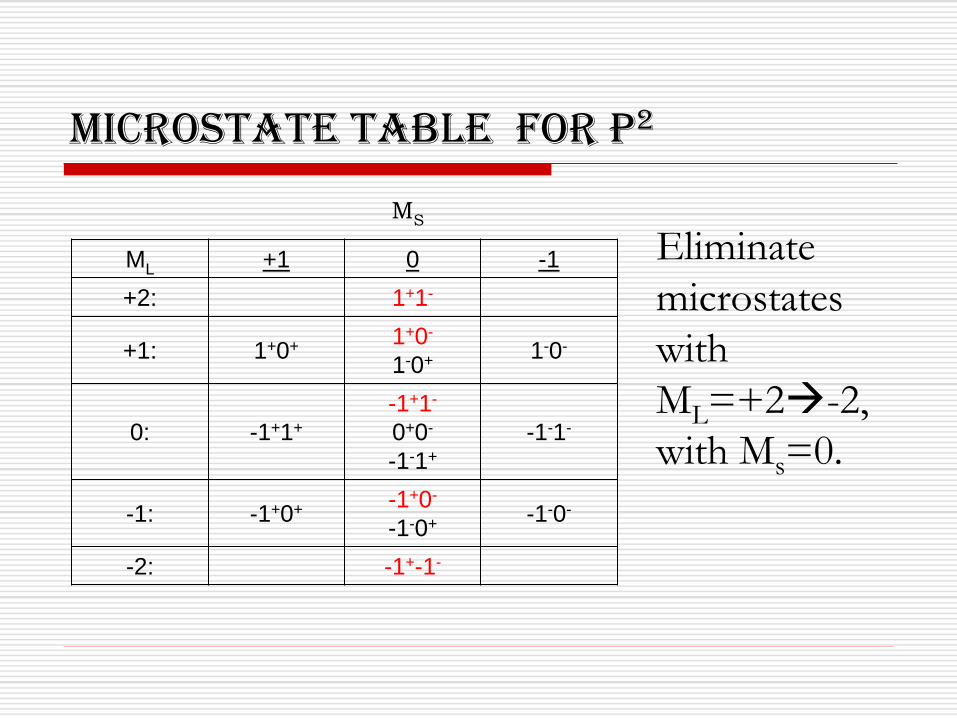
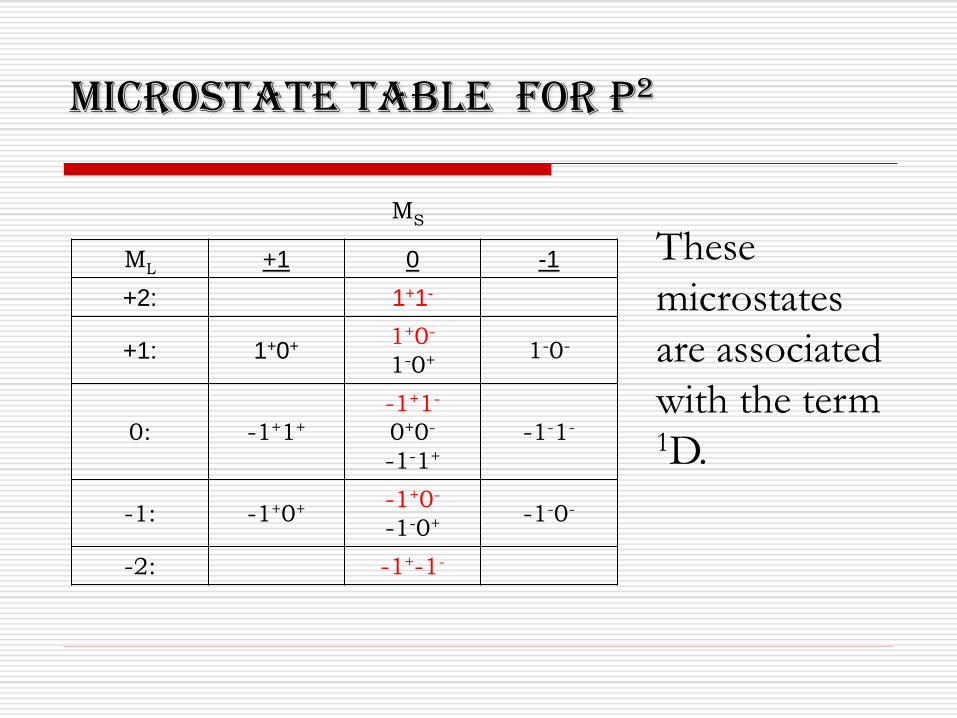
Microstate Table for p2
MS
ML +1 0 -1
+2: 1+1-
+1: 1+0+ 1+0-
1-0+ 1-0-
0: -1+1+
-1+1-
0+0-
-1-1+
-1-1-
-1: -1+0+ -1+0-
-1-0+ -1-0-
-2: -1+-1-
Eliminate
microstates
with
ML=+2-2,
with Ms=0.
Microstate Table for p2
MS
ML +1 0 -1
+2: 1+1-
+1: 1+0+ 1+0-
1-0+ 1-0-
0: -1+1+
-1+1-
0+0-
-1-1+
-1-1-
-1: -1+0+ -1+0-
-1-0+ -1-0-
-2: -1+-1-
These
microstates
are associated
with the term 1D.
Microstate Table for p2
MS
ML +1 0 -1
+2: 1+1-
+1: 1+0+ 1+0-
1-0+ 1-0-
0: -1+1+
-1+1-
0+0-
-1-1+
-1-1-
-1: -1+0+ -1+0-
-1-0+ -1-0-
-2: -1+-1-
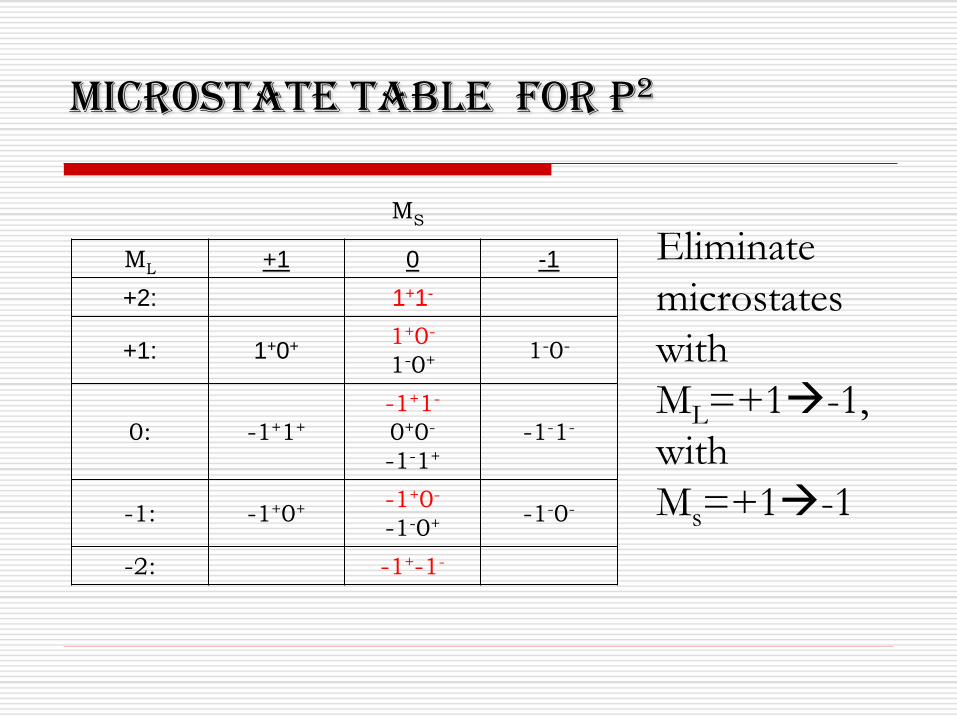
Eliminate
microstates
with
ML=+1-1,
with
Ms=+1-1
Microstate Table for p2
MS
ML +1 0 -1
+2: 1+1-
+1: 1+0+ 1+0-
1-0+ 1-0-
0: -1+1+
-1+1-
0+0-
-1-1+
-1-1-
-1: -1+0+ -1+0-
-1-0+ -1-0-
-2: -1+-1-
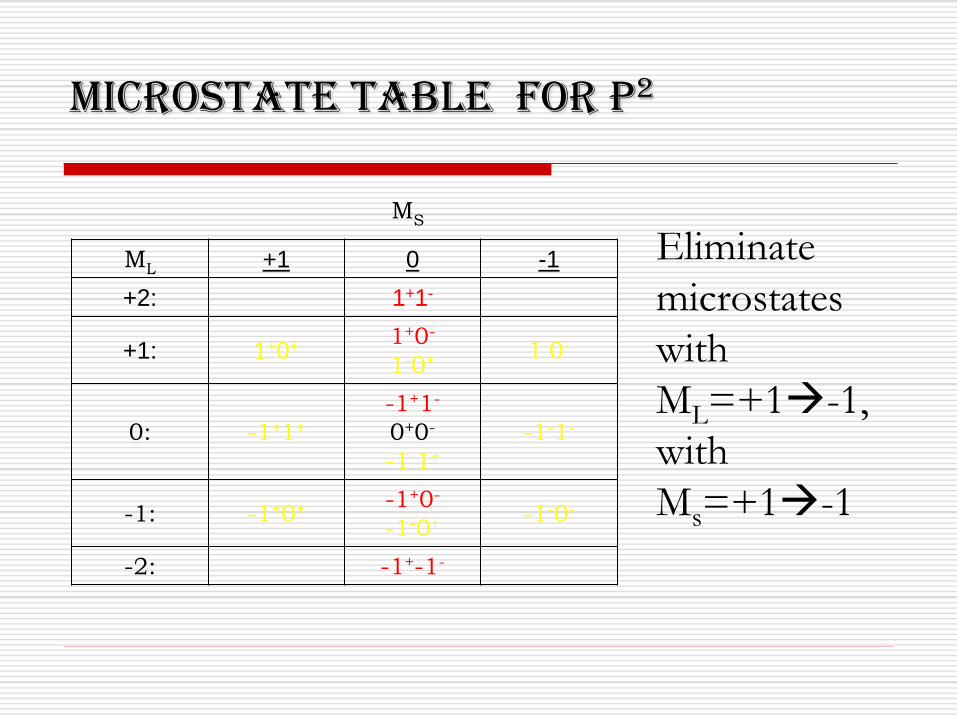
Eliminate
microstates
with
ML=+1-1,
with
Ms=+1-1
Microstate Table for p2
MS
ML +1 0 -1
+2: 1+1-
+1: 1+0+ 1+0-
1-0+ 1-0-
0: -1+1+
-1+1-
0+0-
-1-1+
-1-1-
-1: -1+0+ -1+0-
-1-0+ -1-0-
-2: -1+-1-
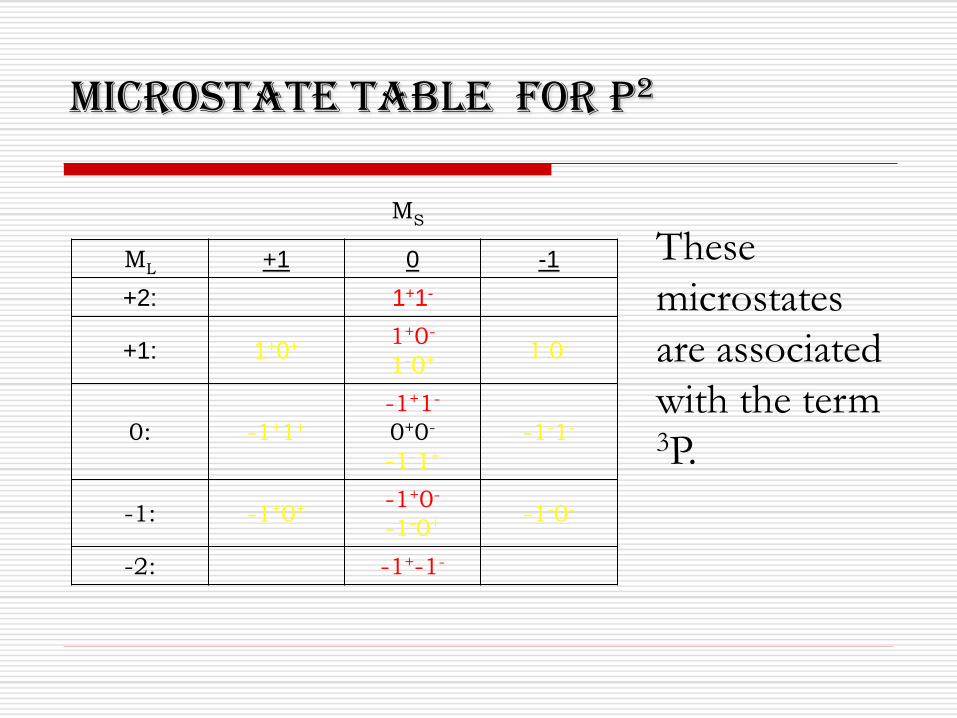
These
microstates
are associated
with the term 3P.
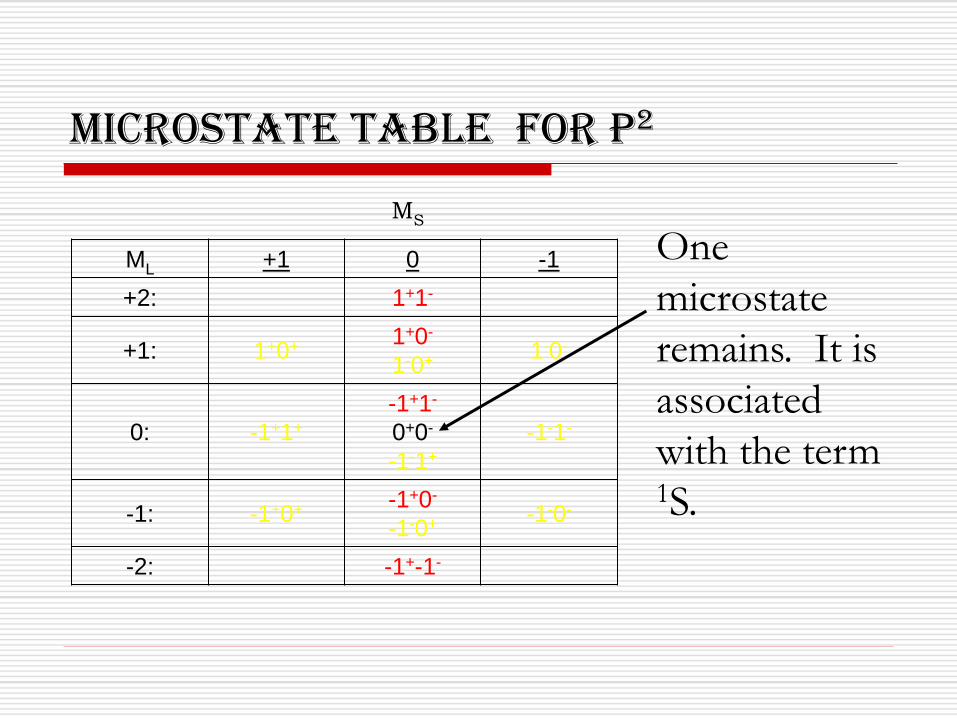
Microstate Table for p2
MS
ML +1 0 -1
+2: 1+1-
+1: 1+0+ 1+0-
1-0+ 1-0-
0: -1+1+
-1+1-
0+0-
-1-1+
-1-1-
-1: -1+0+ -1+0-
-1-0+ -1-0-
-2: -1+-1-
One
microstate
remains. It is
associated
with the term 1S.
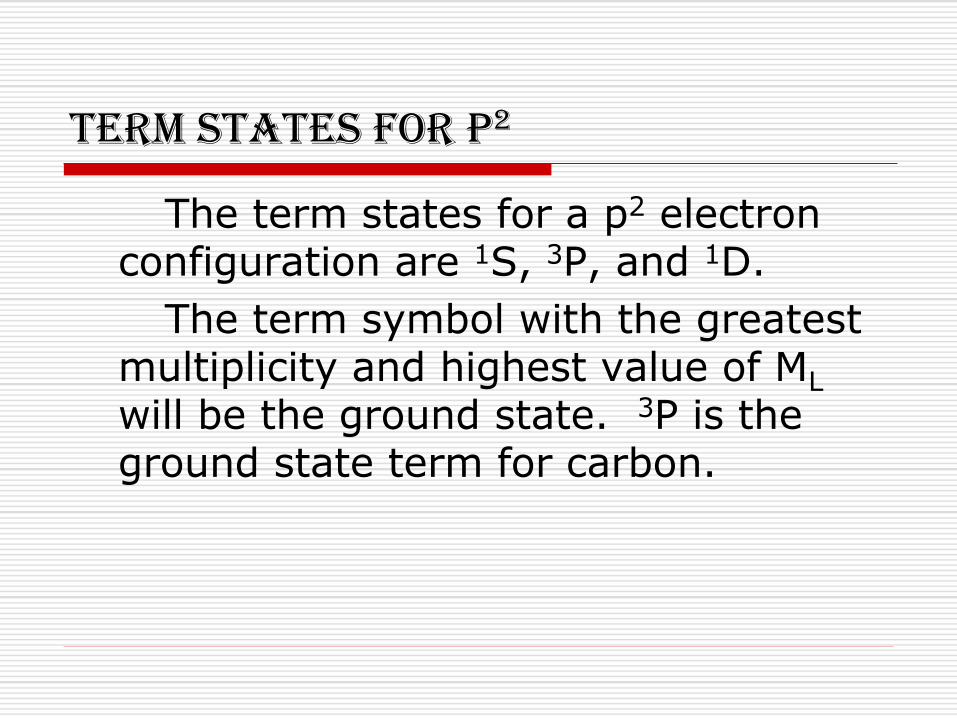
Term States for p2
The term states for a p2 electron configuration are 1S, 3P, and 1D.
The term symbol with the greatest multiplicity and highest value of ML will be the ground state. 3P is the ground state term for carbon.
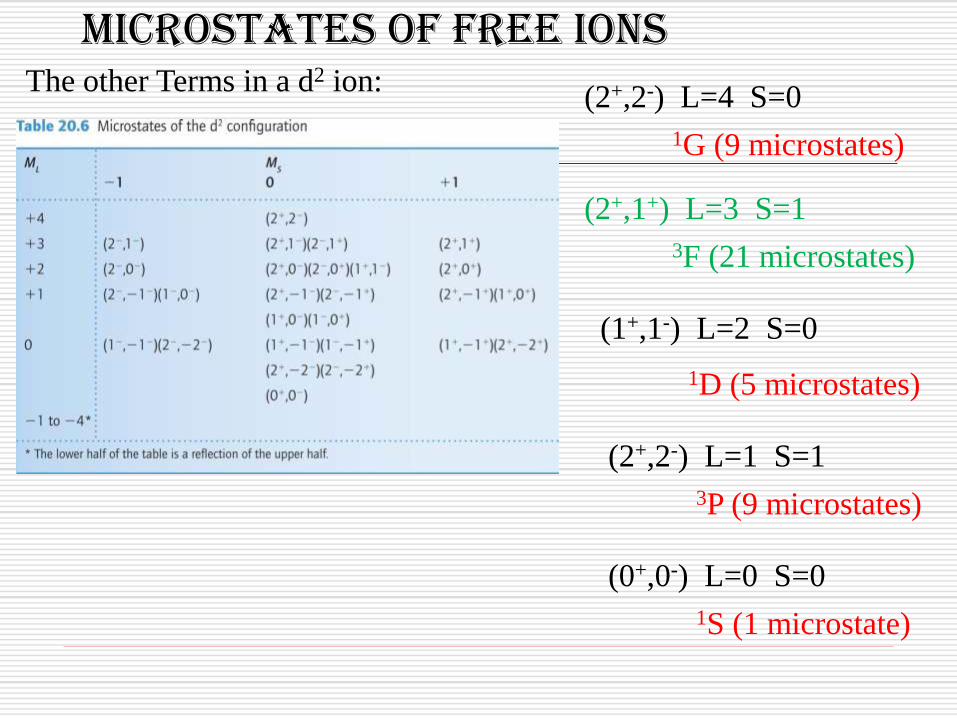
Microstates of Free Ions The other Terms in a d2 ion:
(2+,2-) L=4 S=0
1G (9 microstates)
(1+,1-) L=2 S=0
1D (5 microstates)
(2+,1+) L=3 S=1
3F (21 microstates)
(2+,2-) L=1 S=1
3P (9 microstates)
(0+,0-) L=0 S=0
1S (1 microstate)
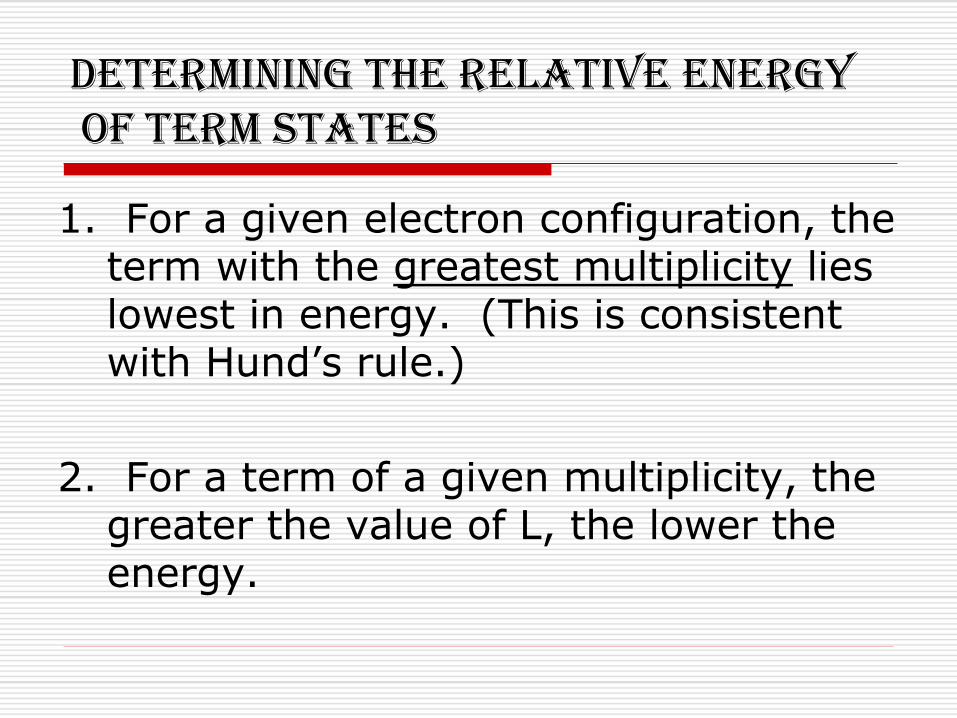
Determining the Relative Energy of Term States
1. For a given electron configuration, the term with the greatest multiplicity lies lowest in energy. (This is consistent with Hund’s rule.)
2. For a term of a given multiplicity, the greater the value of L, the lower the energy.
Lowest Energy Term Including Spin-Orbit Coupling
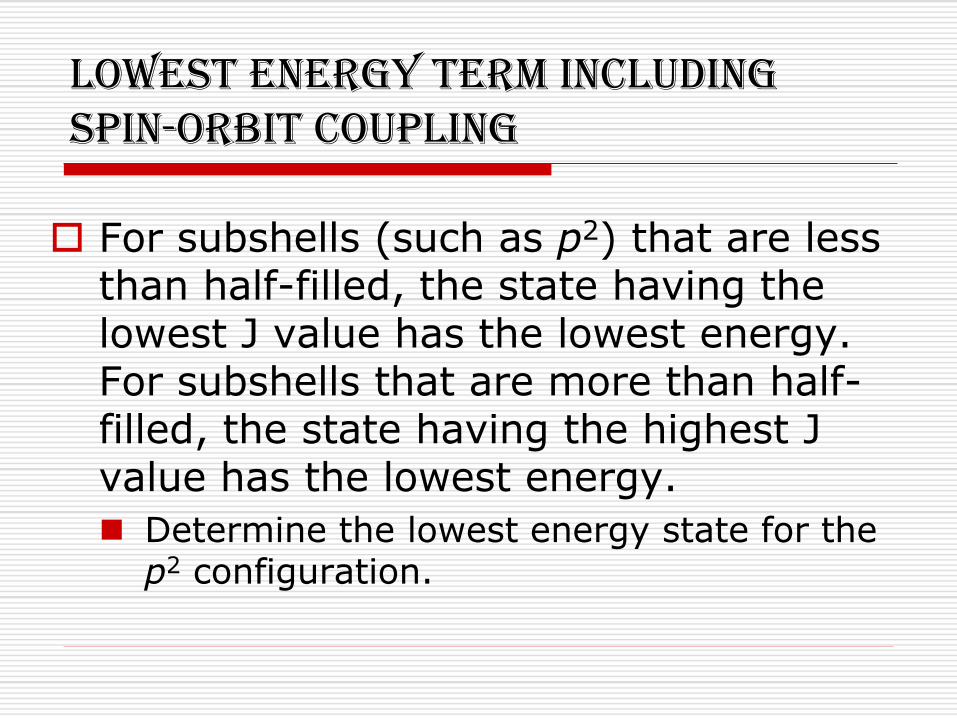
For subshells (such as p2) that are less than half-filled, the state having the lowest J value has the lowest energy. For subshells that are more than half-filled, the state having the highest J value has the lowest energy.
Determine the lowest energy state for the p2 configuration.

Determining the Relative Energy of Term States
For a p2 configuration, the term states are 3P, 1D and 1S.
The terms for the free atom should have the following relative energies:
3P< 1D <1S
Determining the Relative Energy of Term States
The rules for predicting the ground state always work, but they may fail in predicting the order of energies for excited states.
Energy States for a d2 Configuration
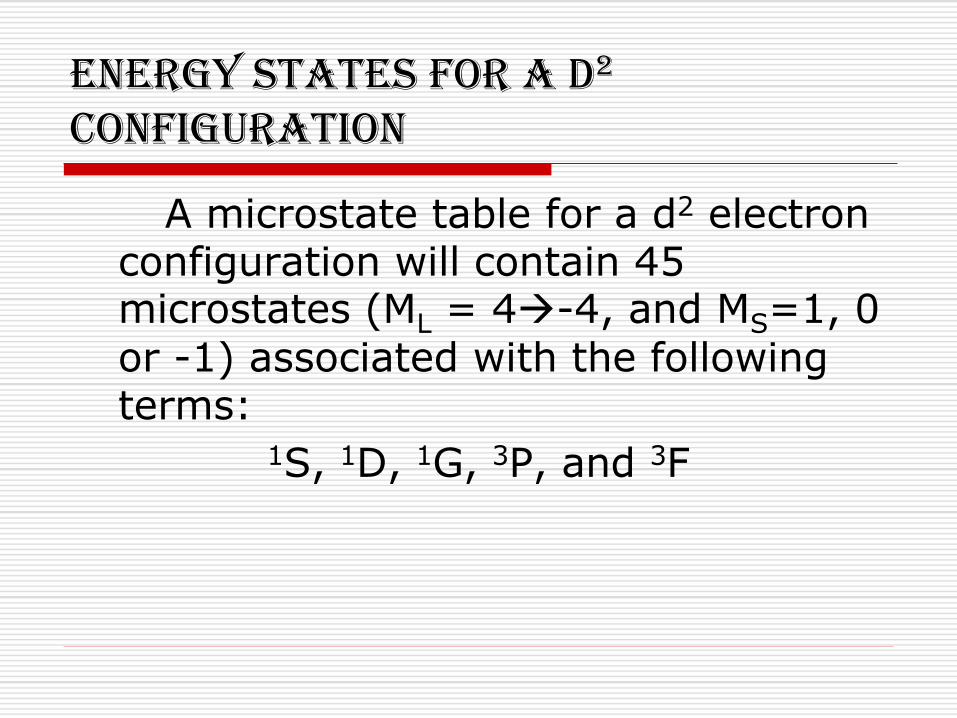
A microstate table for a d2 electron configuration will contain 45 microstates (ML = 4-4, and MS=1, 0
or -1) associated with the following terms:
1S, 1D, 1G, 3P, and 3F

Determining the Ground State Term
We only need to know the ground state term to interpret the spectra of transition metal complexes. This can be obtained without constructing a microstate table.
The ground state will
a) have the maximum multiplicity
b) have the maximum value of ML for the configuration obtained in part (a).
Hole formulation
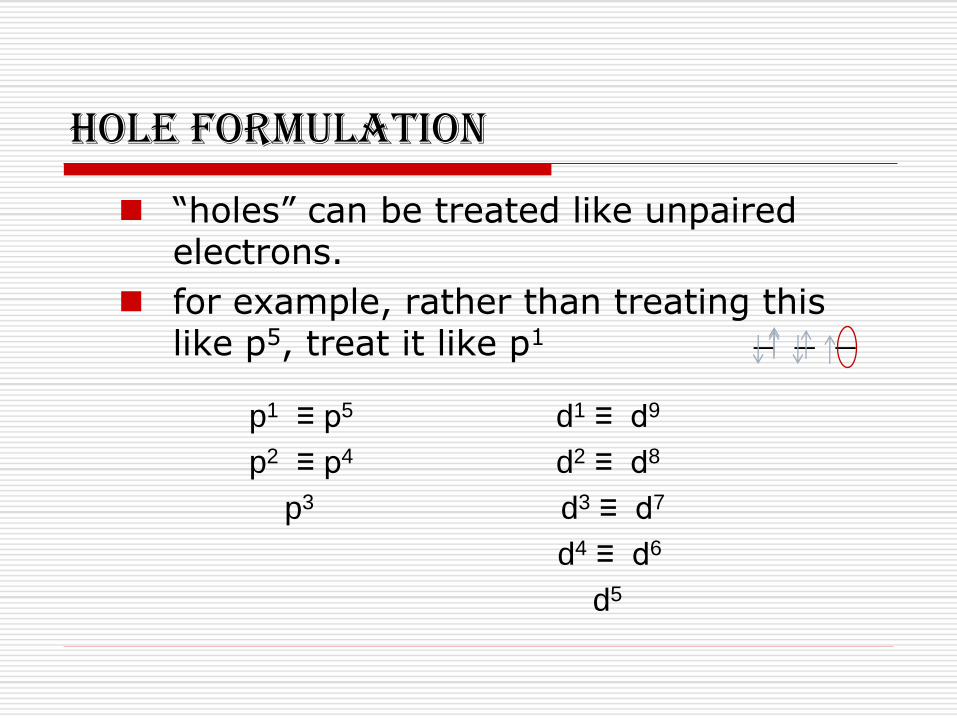
“holes” can be treated like unpaired electrons.
for example, rather than treating this like p5, treat it like p1
p1 ≡ p5 d1 ≡ d9
p2 ≡ p4 d2 ≡ d8
p3 d3 ≡ d7
d4 ≡ d6
d5
— — —
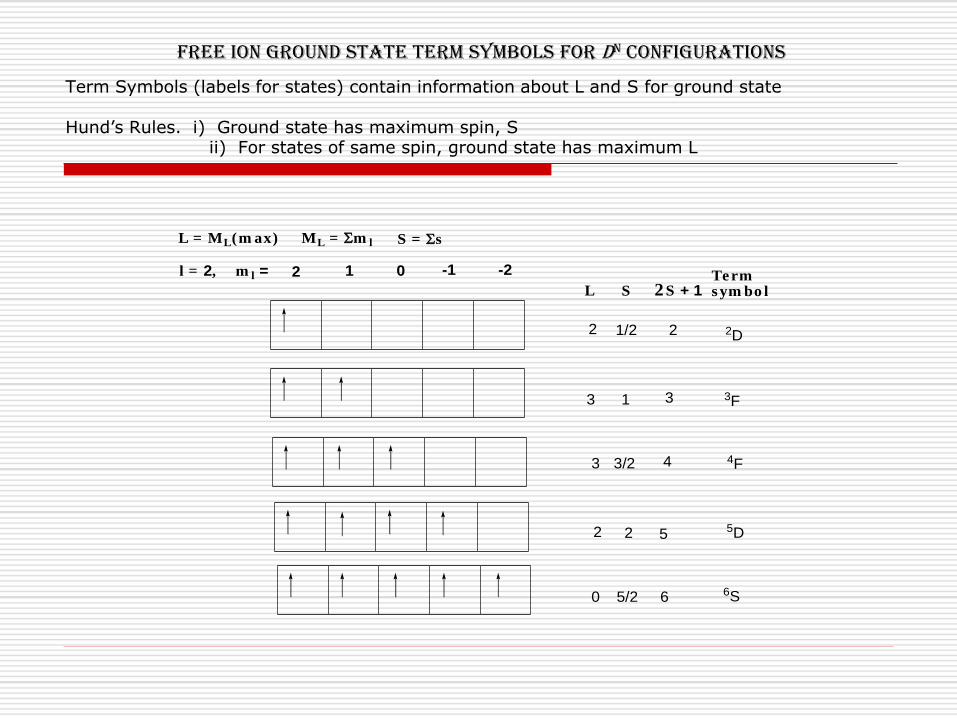
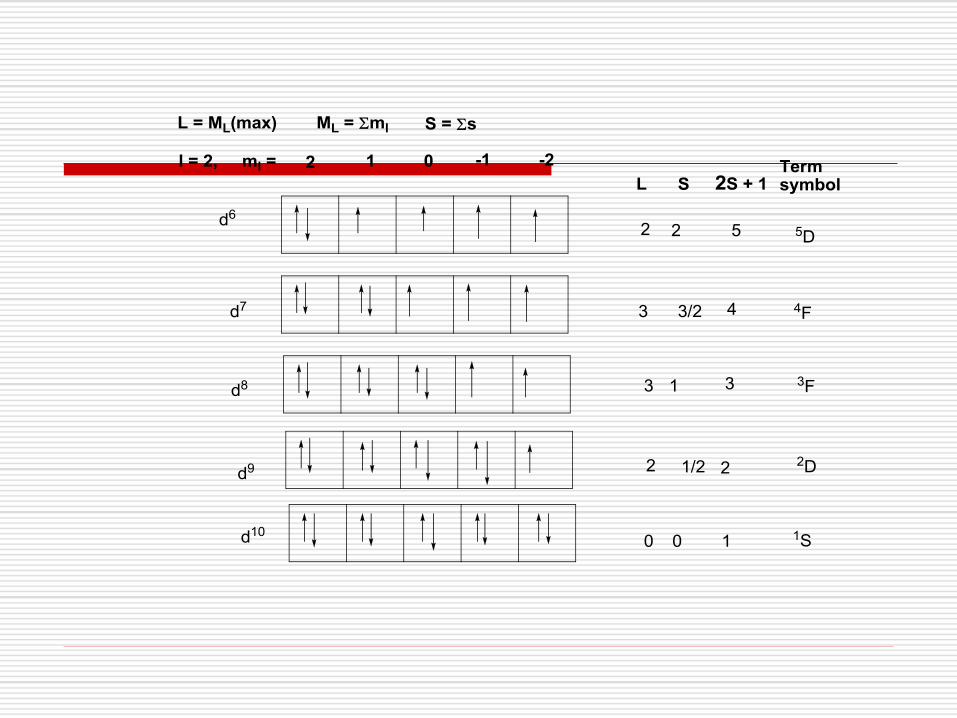
Free ion ground state Term Symbols for dn configurations
Term Symbols (labels for states) contain information about L and S for ground state Hund’s Rules. i) Ground state has maximum spin, S ii) For states of same spin, ground state has maximum L
2 1 0 -1 -2m l =l = 2,
SL 2 S + 1
2 1/2 2
3 1 3
3 3/2 4
2 2 5
0 5/2 6
L = ML(m ax) ML = m l S = s
Te rms ym bo l
2D
3F
4F
5D
6S
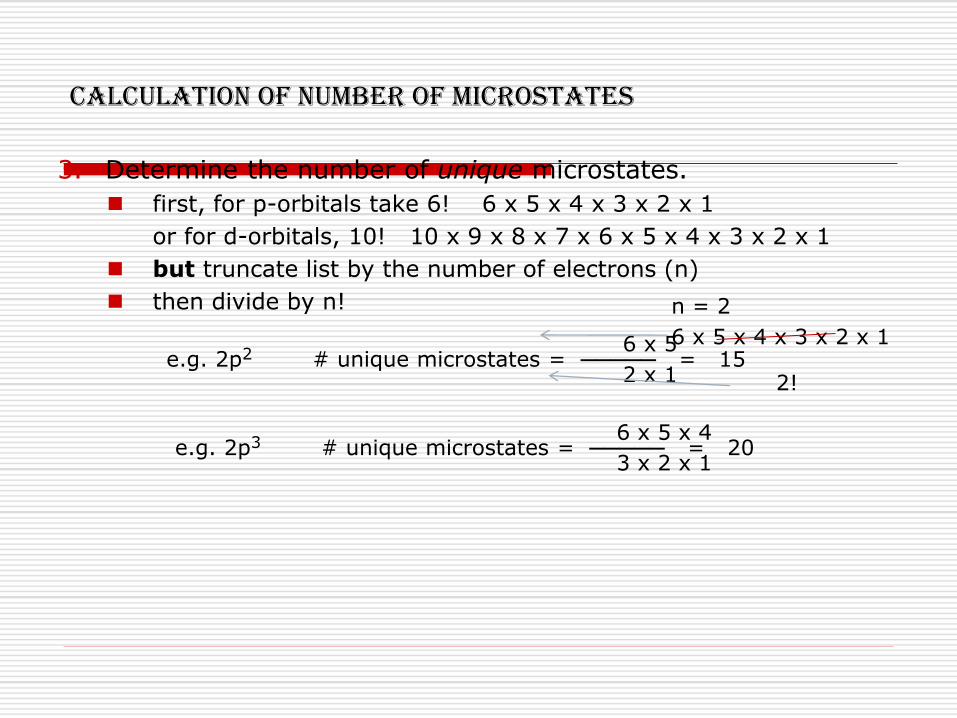
Calculation of number of Microstates
3. Determine the number of unique microstates.
first, for p-orbitals take 6! 6 x 5 x 4 x 3 x 2 x 1
or for d-orbitals, 10! 10 x 9 x 8 x 7 x 6 x 5 x 4 x 3 x 2 x 1
but truncate list by the number of electrons (n)
then divide by n!
6 x 5 e.g. 2p2 # unique microstates = ───── = 15 2 x 1
n = 2 6 x 5 x 4 x 3 x 2 x 1 2!
6 x 5 x 4 e.g. 2p3 # unique microstates = ───── = 20 3 x 2 x 1
Electron Spectra
The UV/Vis spectra are used to determine the value of ∆o for the complex. The spectra arise from electronic transitions between the t2g and eg sets of molecular orbitals. Electron-electron interactions can greatly complicate the spectra. Only in the case of a single electron is interpretation of the spectrum straightforward.
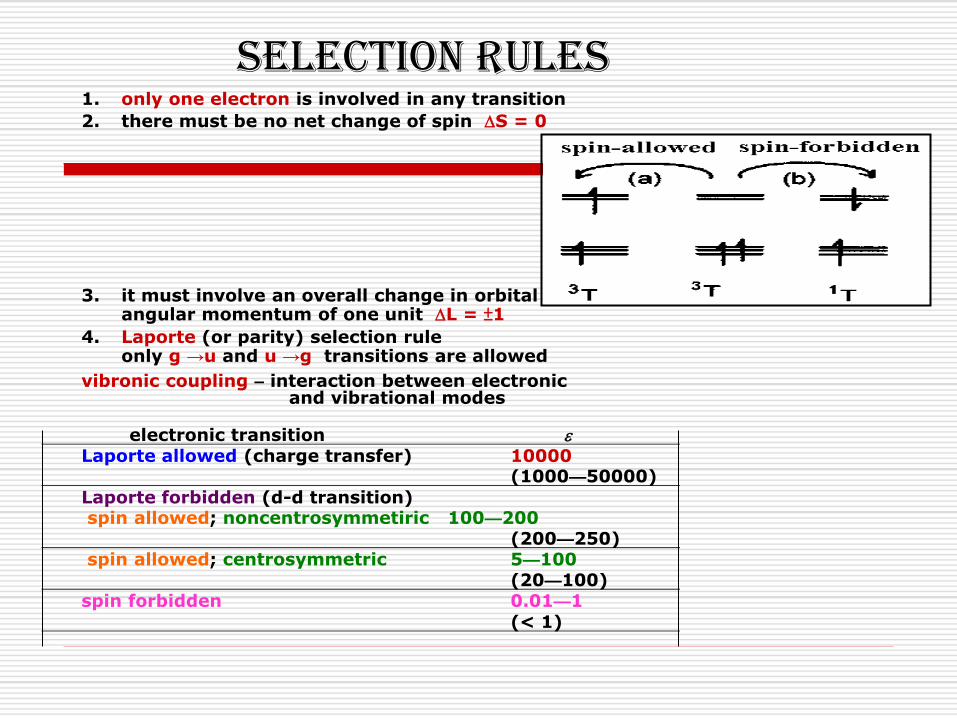
selection rules 1. only one electron is involved in any transition
2. there must be no net change of spin DS = 0
3. it must involve an overall change in orbital angular momentum of one unit DL = ±1
4. Laporte (or parity) selection rule only g →u and u →g transitions are allowed
vibronic coupling – interaction between electronic and vibrational modes electronic transition e Laporte allowed (charge transfer) 10000 (1000—50000)
Laporte forbidden (d-d transition) spin allowed; noncentrosymmetiric 100—200 (200—250) spin allowed; centrosymmetric 5—100 (20—100) spin forbidden 0.01—1
(< 1)
The relaxations in the laporte rule occur because of the following reasons
The bonds in transition metal complexes are not rigid but undergo vibrations that may temporarily change the symmetry which provides a way to relax the first selection rule. And these transitions are called vibronically allowed transitions
If the transition metal complex ion does not have perfect octahedral structure, but is slightly distorted, so that the centre of symmetry is disorted and is therefore a coloured compound

Splitting of rusell saunders states in octahedral and terahedral crystal fields
S and P states do not split
D states split into two states
F states split into three states
G states split into four states
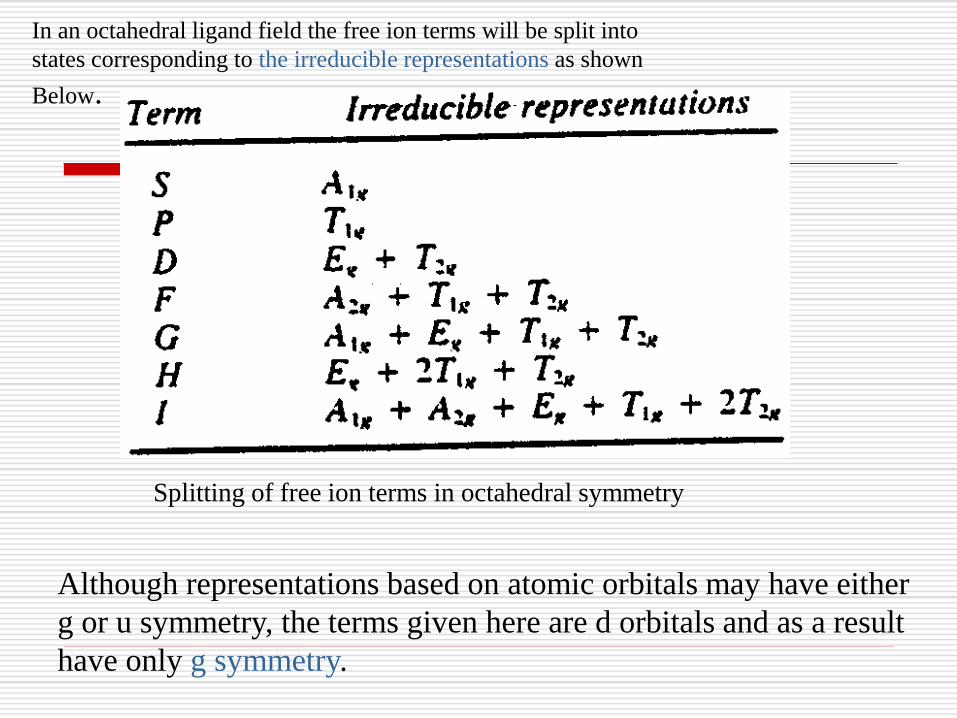
In an octahedral ligand field the free ion terms will be split into
states corresponding to the irreducible representations as shown
Below.
Splitting of free ion terms in octahedral symmetry
Although representations based on atomic orbitals may have either
g or u symmetry, the terms given here are d orbitals and as a result
have only g symmetry.
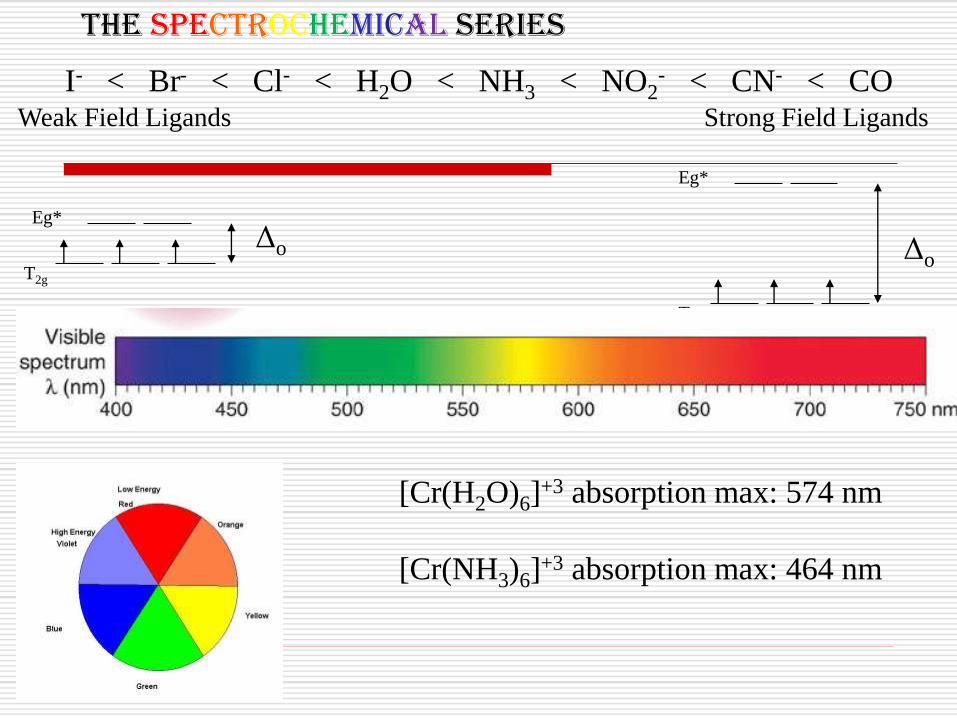
The Spectrochemical Series
I- < Br- < Cl- < H2O < NH3 < NO2- < CN- < CO
Weak Field Ligands
Δo
Eg*
T2g Δo
Eg*
T2g
[Cr(H2O)6]+3 absorption max: 574 nm
[Cr(NH3)6]+3 absorption max: 464 nm
Strong Field Ligands
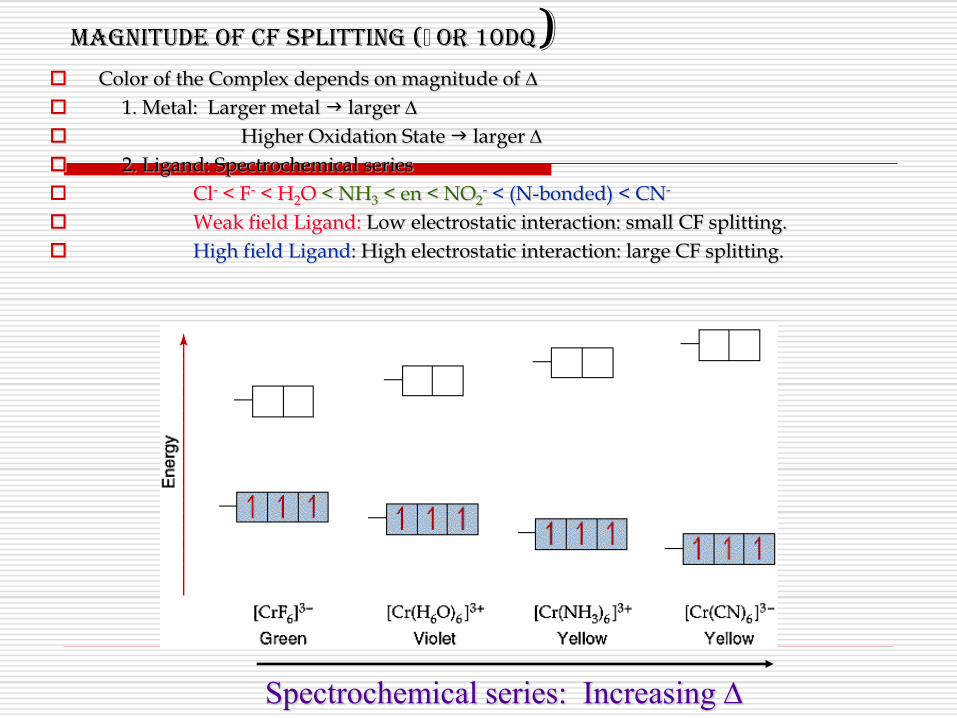
Magnitude of CF Splitting ( or 10Dq) Color of the Complex depends on magnitude of D
1. Metal: Larger metal larger D
Higher Oxidation State larger D
2. Ligand: Spectrochemical series
Cl- < F- < H2O < NH3 < en < NO2- < (N-bonded) < CN-
Weak field Ligand: Low electrostatic interaction: small CF splitting.
High field Ligand: High electrostatic interaction: large CF splitting.
Spectrochemical series: Increasing D
2Eg
2T2g
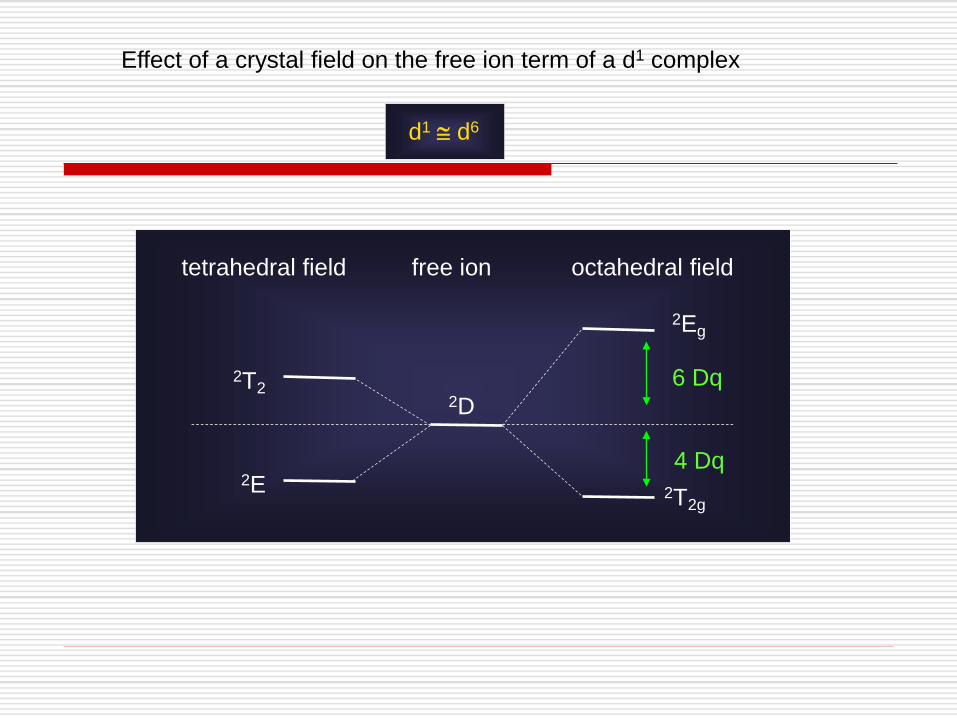
Effect of a crystal field on the free ion term of a d1 complex
2T2
2E
6 Dq
4 Dq
2D
tetrahedral field free ion octahedral field
d1 d6

D
2Eg
2T2g
2D
Energy
ligand field strength, Doct
Energy level diagram for d1 ions in an Oh field
For d6 ions in an Oh field, the splitting is the same, but the multiplicity of the states is 5,
ie 5Eg and 5T2g
A
n / cm-1 -
30 000 20 000 10 000
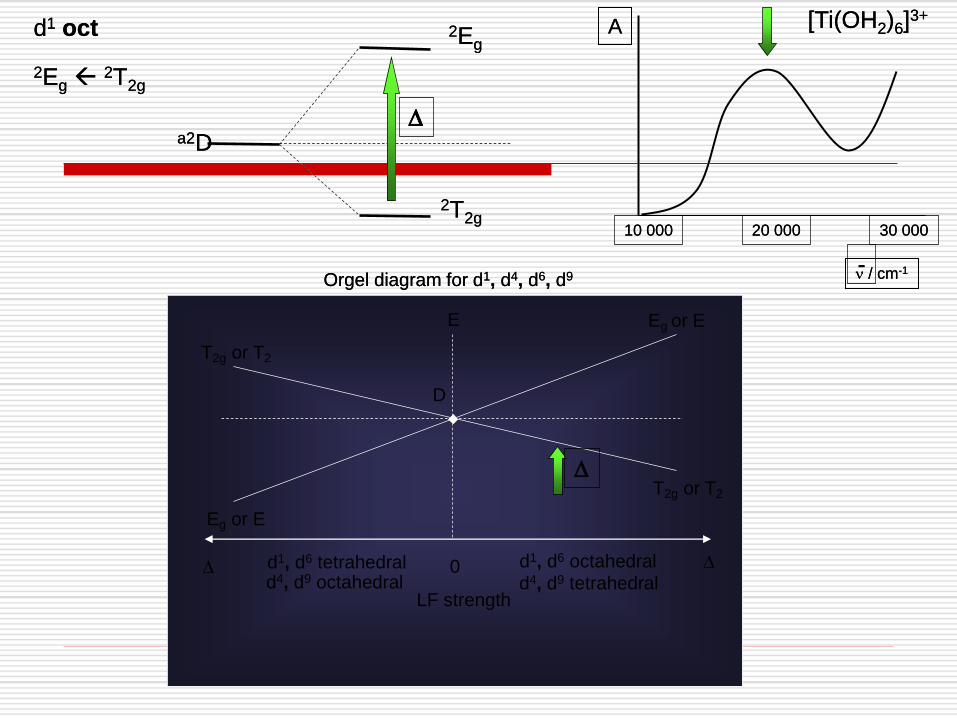
d1 oct [Ti(OH2)6]3+
E
LF strength
Orgel diagram for d1, d4, d6, d9
0 D D
D
d4, d9 tetrahedral
T2g or T2
T2g or T2
d4, d9 octahedral
Eg or E
d1, d6 tetrahedral
Eg or E
d1, d6 octahedral
2Eg 2T2g
2Eg
2T2g
a2D
D
D
A
n / cm-1 -
30 000 20 000 10 000
d1 oct [Ti(OH2)6]3+
E
LF strength
Orgel diagram for d1, d4, d6, d9
0 D D
D
d4, d9 tetrahedral
T2g or T2
T2g or T2
d4, d9 octahedral
Eg or E
d1, d6 tetrahedral
Eg or E
d1, d6 octahedral
2Eg 2T2g
2Eg
2T2g
a2D
D
D

Orgel Diagrams We can combine the d1 and d9 Oh diagrams into a single Orgel
Diagram.
Remember that d1 Td splitting is just the opposite of d1 Oh, so d1 Td and d9 Oh have similar Orgel Diagrams; same with d9 Td and d1 Oh.
Note that gerade (g) and ungerade (u) designations apply only to Oh case.
d9 Oh d1 Oh
d1 Td d9 Td T2g
T2g
Eg
Eg
T2g → Eg transition
Eg → T2g transition
←increasing 10Dq 0 increasing 10Dq→
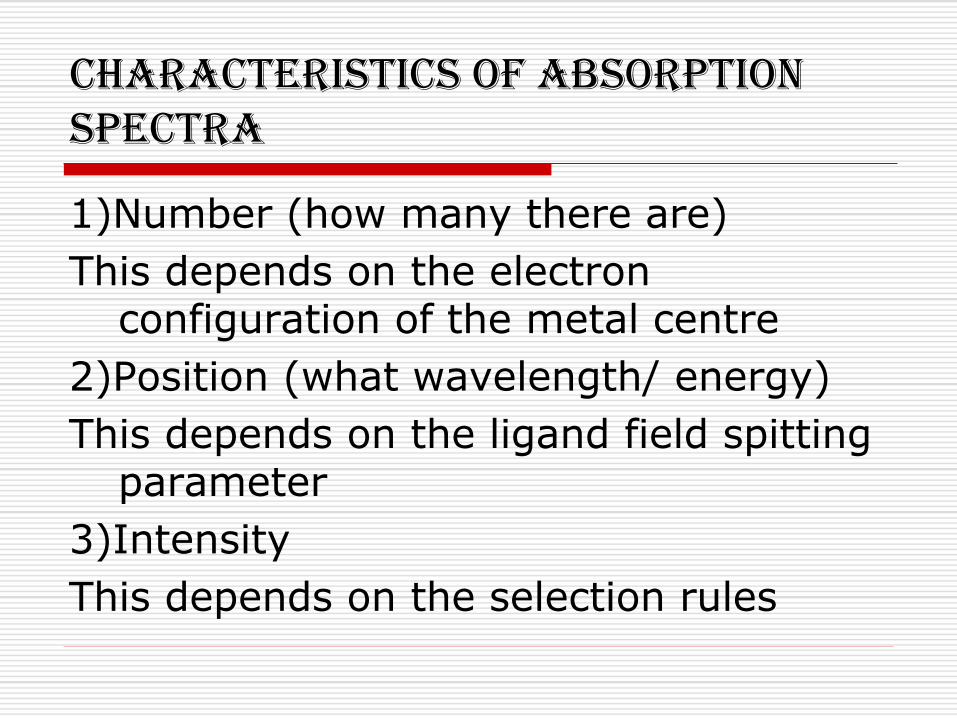
Characteristics of Absorption Spectra
1)Number (how many there are)
This depends on the electron configuration of the metal centre
2)Position (what wavelength/ energy)
This depends on the ligand field spitting parameter
3)Intensity
This depends on the selection rules
General Features
Absorption bands in electronic spectra are usually broad, and occur much more rapidly than molecular vibrations. As a result, the spectra represent a “snapshot” of molecules in various vibrational and rotational states.
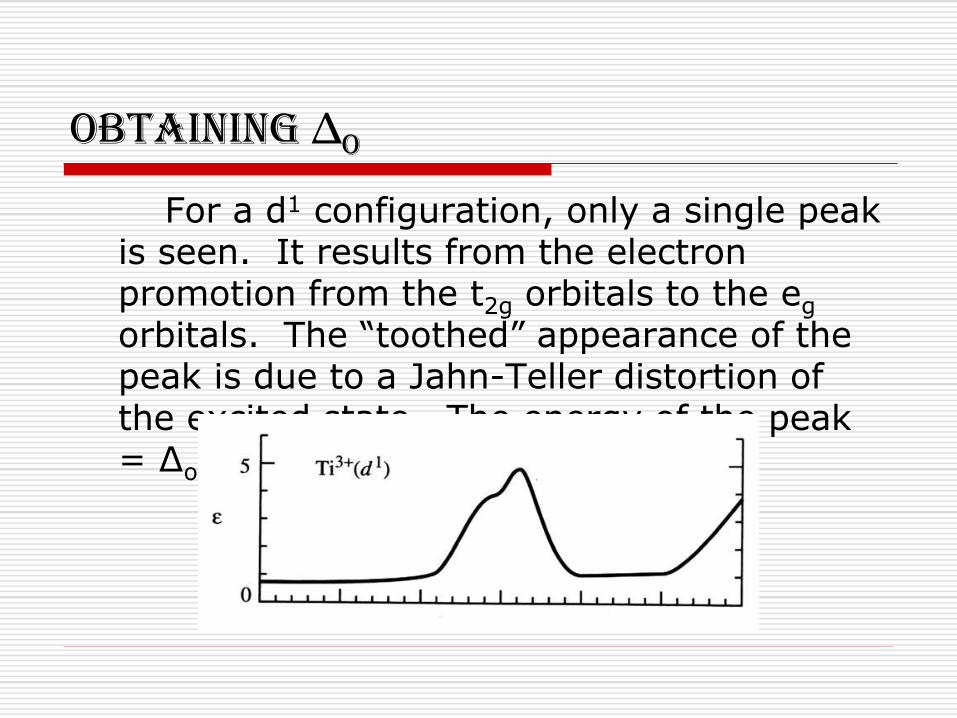
Obtaining ∆o
For a d1 configuration, only a single peak is seen. It results from the electron promotion from the t2g orbitals to the eg orbitals. The “toothed” appearance of the peak is due to a Jahn-Teller distortion of the excited state. The energy of the peak = ∆o.
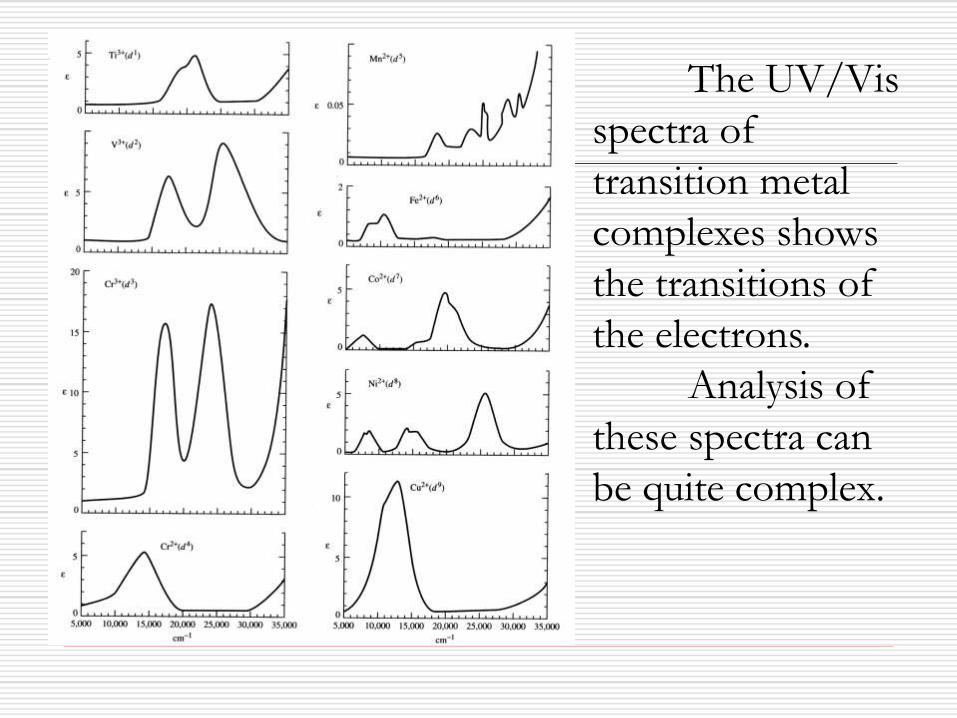
The UV/Vis
spectra of
transition metal
complexes shows
the transitions of
the electrons.
Analysis of
these spectra can
be quite complex.
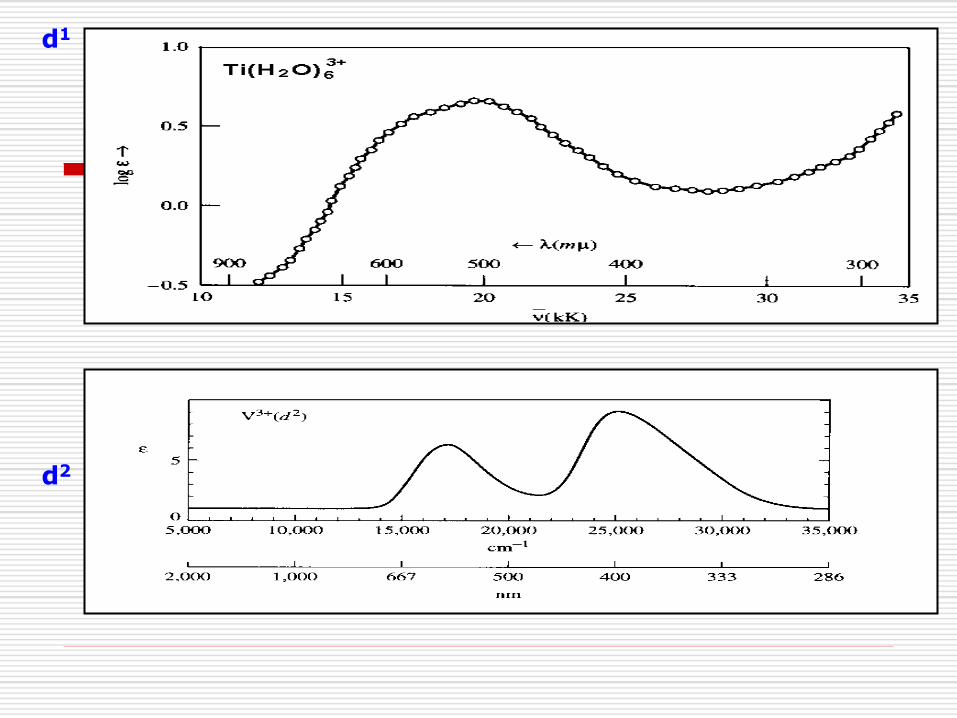
d1
d2

Limitations 0f Orgel Energy Level Diagrams
Orgel Energy Level Diagrams consider only weak field cases ( or high spin ) cases
Orgel Energy Level Diagrams consider spin allowed transitions in which the ground and excited states are of same multiplicities
Tanabe Sugano Diagrams
In order to interpret the spectra of coordination compounds in both weak and strong fields
These diagrams are more comprehensive than Orgel diagrams
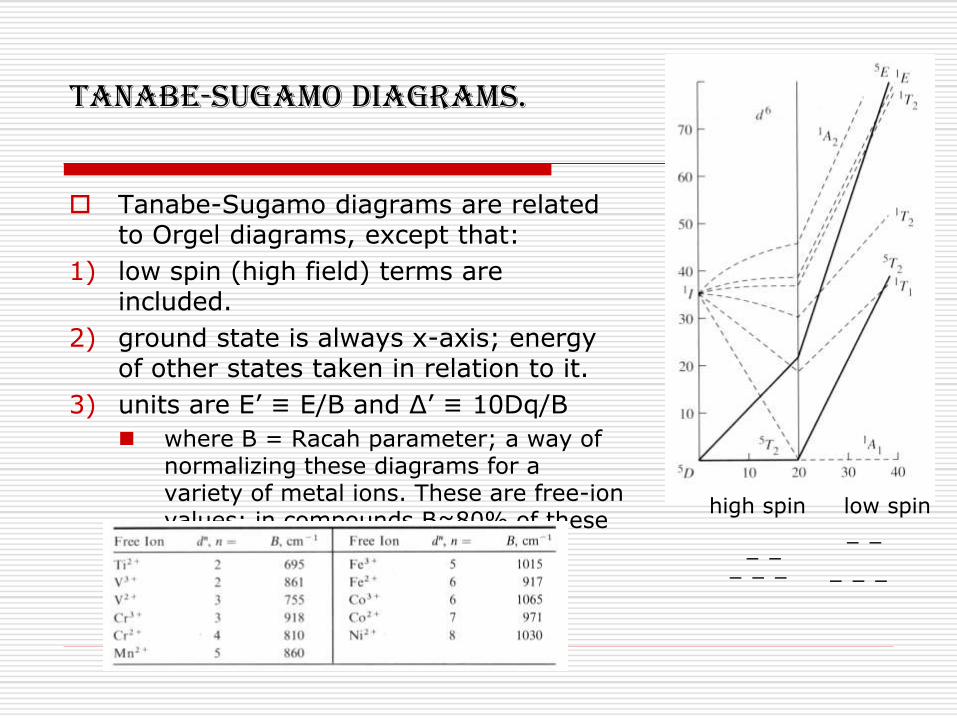
Tanabe-Sugamo Diagrams.
Tanabe-Sugamo diagrams are related to Orgel diagrams, except that:
1) low spin (high field) terms are included.
2) ground state is always x-axis; energy of other states taken in relation to it.
3) units are E’ ≡ E/B and Δ’ ≡ 10Dq/B
where B = Racah parameter; a way of normalizing these diagrams for a variety of metal ions. These are free-ion values; in compounds B≈80% of these values.
high spin low spin
─ ─ ─ ─ ─
─ ─ ─ ─ ─
Summary Crystal Field Theory provides a basis for explaining many features of transition-metal complexes. Examples include why transition metal complexes are highly colored, and why some are paramagnetic while others are diamagnetic. The spectrochemical series for ligands explains nicely the origin of color and magnetism for these compounds. There is evidence to suggest that the metal-ligand bond has covalent character which explains why these complexes are very stable. Molecular Orbital Theory can also be used to describe the bonding scheme in these complexes. A more in depth analysis is required however.