bsc thesis biotechnology
TRANSCRIPT

BSc Thesis Biotechnology
Modelling the influence of particle design on CO2 capture from ambient air using solid adsorbents
Biobased Chemistry and Technology
Ellen van Beersum
19-07-2018

Biobased Chemistry and Technology (BCT) BSc thesis
ii
Biobased Chemistry and Technology (BCT) BSc thesis
iii
Modelling the influence of particle design on CO2 capture from
ambient air using solid adsorbents
Name course : BSc Thesis Biobased Chemistry and Technology Number : YBT-80324 Study load : 24 ects Date : March – July (2018) Student : Ellen van Beersum Registration number : 970107044010 Study programme : BBT Report number : 104BCT Supervisor(s) : dr. LW (Lars) Kiewidt Examiners : dr. EL (Elinor) Scott Group : Biobased Chemistry and Technology Address : Bornse Weilanden 9 6708 WG Wageningen The Netherlands

Biobased Chemistry and Technology (BCT) BSc thesis
iv
Abstract A possible method to reduce the concentration of the greenhouse gas CO2 in ambient air is direct air capture (DAC). For DAC, a promising technology is being developed by Antecy and it uses potassium carbonate (K2CO3) supported on porous activated carbon (AC). The K2CO3 reacts with the CO2 and by this chemisorption, the CO2 can be captured. It can be released again after steam is added. In this research the diffusion of air through the cylindrical AC particles and the reaction of CO2 with the K2CO3 was modelled in Python. This was done to find the influence of different particle and pore sizes on the capacity, pressure drop and loading time. It was shown that a small particle and large pores lead to less diffusional limitations, and thus shorter loading time, compared to a large particle and small pores. The capacity was shown to be inversely proportional to the pore size and the pressure drop proportional to the particle size. A high capacity and a low pressure drop were preferred. From the model, a particle with small pores (<10 nm) and a diameter of 3 mm was recommended. The effect of temperature on the diffusion and reaction was also modelled and this showed that the diffusion was limiting for the adsorption. As the reaction rate was affected by temperature and the diffusion not much and the overall carbonation conversion was also not changed much. The model gave insight in the chemisorption on particle scale and can be used for particle design in practice.

Biobased Chemistry and Technology (BCT) BSc thesis
v
Table of contents 1 Introduction ......................................................................................................................... 1
1.1 Direct Air Capture technique .......................................................................................... 1 1.2 Proposed technology .................................................................................................... 1 1.3 Bottlenecks for adsorption ............................................................................................. 2 1.4 Effect particle and pore size on adsorption ....................................................................... 2 1.5 Research objective and approach ................................................................................... 3
2 Methodology ........................................................................................................................ 4 2.1 Description of the model ............................................................................................... 4
2.1.1 Balance equation ...................................................................................................... 4 2.1.2 Diffusion model ........................................................................................................ 4 2.1.3 Kinetic model ........................................................................................................... 5
2.2 Solving the balance equation ......................................................................................... 6 2.2.1 Assumptions ............................................................................................................ 6 2.2.2 Initial conditions ....................................................................................................... 6 2.2.3 Boundary conditions ................................................................................................. 7
2.3 Temperature change .................................................................................................... 7 2.4 Calculating the pressure drop ........................................................................................ 7
3 Results and discussion........................................................................................................... 8 3.1 Changing the particle size ............................................................................................. 8 3.2 Changing the pore size ................................................................................................. 9 3.3 Effect of temperature ................................................................................................. 10 3.4 Effect of particle size on pressure drop .......................................................................... 11 3.5 Verification of the model ............................................................................................. 11
4 Conclusion ......................................................................................................................... 12 5 Outlook ............................................................................................................................. 12 Bibliography ............................................................................................................................ 14 Appendix A: Abbreviations ........................................................................................................ 16 Appendix B: notation list ........................................................................................................... 16 Appendix C: Values and constants used ....................................................................................... 17
Biobased Chemistry and Technology (BCT) BSc thesis
1/18
1 Introduction Carbon dioxide (CO2) concentrations in the atmosphere have been increasing steadily since the industrial era. In 1750, the concentration of CO2 in the air was about 280 ppm [1]. Currently, this amount has increased to more than 400 ppm [2,3]. This increase in CO2 and other greenhouse gas concentrations in the atmosphere is the main cause of global warming [4]. To decrease the CO2 concentrations, several strategies can be applied. For example, the promotion of renewable energy sources, reforestation, or the reduction of emissions of large point sources of CO2 such as current industrial facilities. This last method to reduce CO2 is called carbon dioxide capture and storage (CCS). However, CCS can merely avoid release of additional carbon. To remove CO2 from air another method must be applied, known as direct air capture (DAC). DAC is considered important because roughly half of all CO2 emissions is originated from distributed sources such as cars, airplanes and cattle [2,5]. Only performing CCS on large point sources can at best slow down the rate of increasing CO2 concentration [3], while DAC has the potential to actually stabilize and maybe even lower the concentration [5–9].
1.1 Direct Air Capture technique DAC as a method to mitigate the effects of CO2 on the climate was first introduced by Lackner et al. [8] in 1999. They concluded that it was feasible capture CO2 from air, faster compared to photosynthesis from plants and not limited by sunlight. They proposed a method which was based on an aqueous hydroxide adsorption process. Before Lackner, similar adsorption processes to extract CO2 from air were performed for aircrafts/submarines or for enhanced oil recovery (EOR) [9,10], but Lackner was the first to actually couple the capture to climate change mitigation. Lackner used adsorption using calcium hydroxide, but it required much energy for regeneration and the capacity was low [2]. This resulted in the development of other techniques for DAC such as membrane separation, which is based on an electrochemical approach, used by e.g. Eisaman et al. [11] and Bandi et al. [12].
Because the concentrations of CO2 in air are relatively low (400 ppm), a very selective absorption/adsorption method is needed [5]. Firstly, for the method a distinction in physisorption and chemisorption can be made: physisorption is the physical absorption of a component to an absorber material. It involves the forces of molecular interaction and does not change the chemical composition of a component. These forces are mostly not strong enough to absorb CO2 at 400 ppm [5]. In contrast to chemisorption, where a reaction takes place that changes the composition of the adsorbent. The covalent bonds formed in the reaction makes the interaction stronger than with physisorption [13]. Secondly a distinction between liquid or solid adsorption can be made. For liquid absorption, amines such as mono-ethanol-amine (MEA) can be used. This is the most widely used technique for CO2 capture, but not the most efficient. The reason for this is the large amount of energy needed for regeneration of the liquid sorbent [2,9]. Lastly, when using solid absorbers a distinction can be made between different porous materials such as zeolites (porous solid made from aluminum, silicon, oxygen and an alkali metal), metal organic frameworks (MOF), polymeric resins, activated carbon and oxide support [14]. These solids have pores that can be classified according to the IUPAC into micro-, meso-, or macropores, which are, smaller than 2 nm, 2-50 nm and larger than 50 nm respectively [15]. Porous materials can be supported with alkali metals such as K, Li, Na and Cs to make the adsorption more effective [7]. This adsorption process can best be described as the chemisorption mentioned before. For further reading on the different methods of DAC consult [5,9,16].
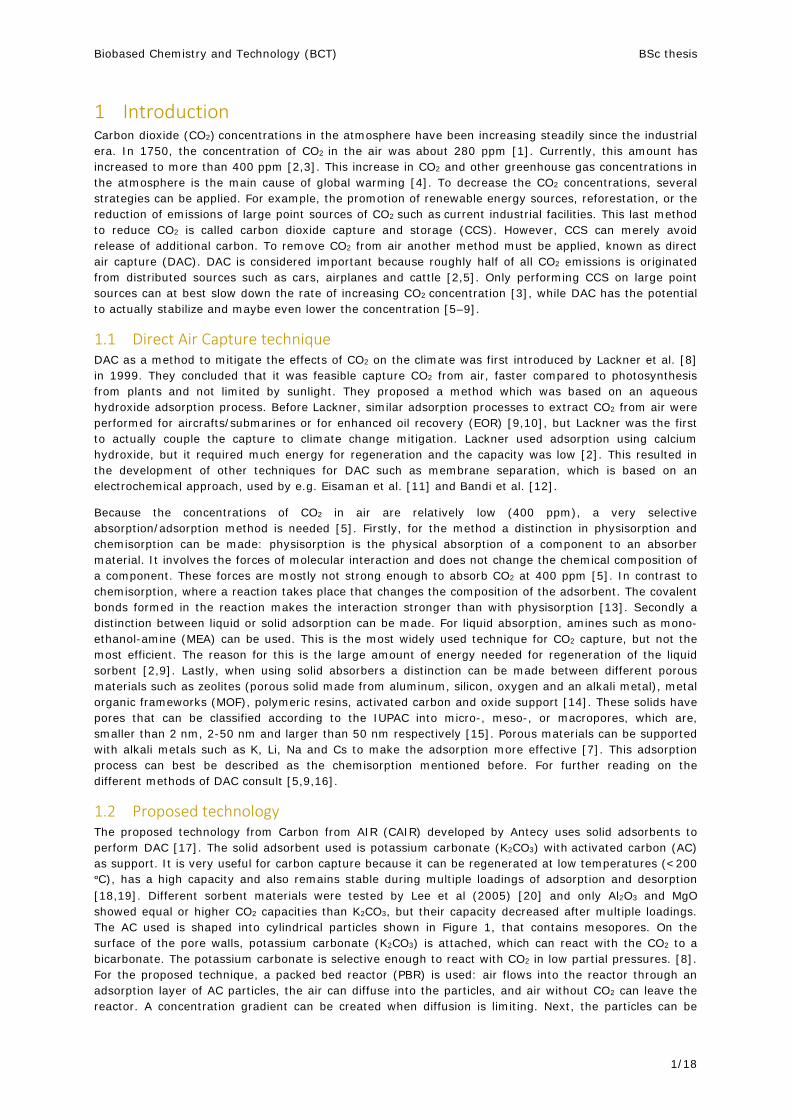
1.2 Proposed technology The proposed technology from Carbon from AIR (CAIR) developed by Antecy uses solid adsorbents to perform DAC [17]. The solid adsorbent used is potassium carbonate (K2CO3) with activated carbon (AC) as support. It is very useful for carbon capture because it can be regenerated at low temperatures (<200 ᵒC), has a high capacity and also remains stable during multiple loadings of adsorption and desorption [18,19]. Different sorbent materials were tested by Lee et al (2005) [20] and only Al2O3 and MgO showed equal or higher CO2 capacities than K2CO3, but their capacity decreased after multiple loadings. The AC used is shaped into cylindrical particles shown in Figure 1, that contains mesopores. On the surface of the pore walls, potassium carbonate (K2CO3) is attached, which can react with the CO2 to a bicarbonate. The potassium carbonate is selective enough to react with CO2 in low partial pressures. [8]. For the proposed technique, a packed bed reactor (PBR) is used: air flows into the reactor through an adsorption layer of AC particles, the air can diffuse into the particles, and air without CO2 can leave the reactor. A concentration gradient can be created when diffusion is limiting. Next, the particles can be
Biobased Chemistry and Technology (BCT) BSc thesis
2/18
regenerated by adding steam, releasing the CO2. The CO2 can be concentrated and processed to chemicals, combined with hydrogen to make a methanol fuel or it can be used directly for greenhouses or algae production.
Figure 1 Air with CO2 diffuses into the AC particle and enters the mesopores. Inside the K2CO3 (triangle shapes) reacts with CO2
(dark blue) to KHCO3
The reaction between K2CO3 and the CO2 is shown in Eq. (1):
𝐾𝐾2𝐶𝐶𝐶𝐶3(𝑠𝑠) + 𝐶𝐶𝐶𝐶2 (𝑔𝑔) + 𝐻𝐻2𝐶𝐶 (𝑔𝑔) ↔ 2𝐾𝐾𝐻𝐻𝐶𝐶𝐶𝐶3(𝑠𝑠) Eq. (1)
In which the forward reaction (the adsorption) is exothermic and the backward reaction (regeneration) is endothermic. According to studies on the temperature conditions of the reaction the optimal temperature for the capture is 50-80ᵒC and the desorption temperature around the low value of 120-200ᵒC [20–22]. The proposed process is operated at pilot scale, not yet on large scale. An interesting thing to look at is the effect of the particle and pore size on the adsorption efficiency, as this has not been done before for this application.
1.3 Bottlenecks for adsorption Possible bottlenecks in the CO2 capture are the loading time, pressure drop, and capacity. Firstly, the loading time is the time it takes to completely load one AC particle with CO2. It is favourable to have a short loading time for an efficient process. Secondly, the pressure drop in the reactor is important for the energy consumption of the reactor: a large pressure drop implies a high frictional force for the convection of air, which costs a lot of energy. Lastly the capacity needs to be high to capture more CO2 per batch. In terms of particle design, both particle and pore size can have an influence on these three possible bottlenecks.
1.4 Effect particle and pore size on adsorption Pore and particle size are expected to have an influence on the efficient capture of CO2. If for example the particle size is increased, it will take longer to load the particle with CO2 due to a longer travelling distance for the diffusing molecules. Decreasing the particle size will not have a big influence on the maximum capacity, because more particles can fit into one reactor and the capacity is defined as CO2 reacted per unit volume. It does affect the pressure drop, because the friction will increase when using smaller particles according to the Ergun equation for pressure drop through a packed bed [23].
Air + CO2
Mesopores (5-70 nm)
Air +CO2
(2-10 mm)
Biobased Chemistry and Technology (BCT) BSc thesis
3/18
Decreasing the pore size will on one hand increase the available surface for K2CO3 to attach to, leading to a higher capacity of the adsorbent. On the other hand, by making the pores smaller, the loading time increases due to diffusional limitations, so a trade-off must be made. Lastly the pressure drop will not change much by changing the pore size. Air will take the path through the adsorption layer in the reactor with the lowest resistance, which is in between the AC particles. This is not influenced by pore size inside the particles.
1.5 Research objective and approach The objective of this research was to identify the effect of particle design on the capture of CO2 from air using solid adsorbents, by modelling the chemisorption of CO2 molecules to potassium carbonate. The influence of different particle/pore sizes on the possible bottlenecks had to be found, which included capacity of the adsorbent, loading time, and pressure drop.
To find the effect of the particle and pore size on the possible bottlenecks, a model combining the reaction kinetics and diffusion of air through a single particle was made in Python. For the reaction kinetics, a Langmuir-Hinshelwood (LH) model was used. For diffusion, a Wilke approximation was used, which is especially useful for multicomponent diffusion through porous media [24].
The used model was time and space dependent, because the transient uptake of CO2 is dependent on both the distance from the center of the AC particle, and time. Partial differential equations were made for the different components with the distance from the center (r) and time (t) as independent variables. They were solved by method of lines. This method consisted of discretizing the spatial (r) derivatives and consequently integrating the time derivatives for every spatial point. The parameters were: temperature, pressure, particle size, and pore size. By changing these, the effect of them on the capacity, pressure drop, and loading time were found.
Biobased Chemistry and Technology (BCT) BSc thesis
4/18
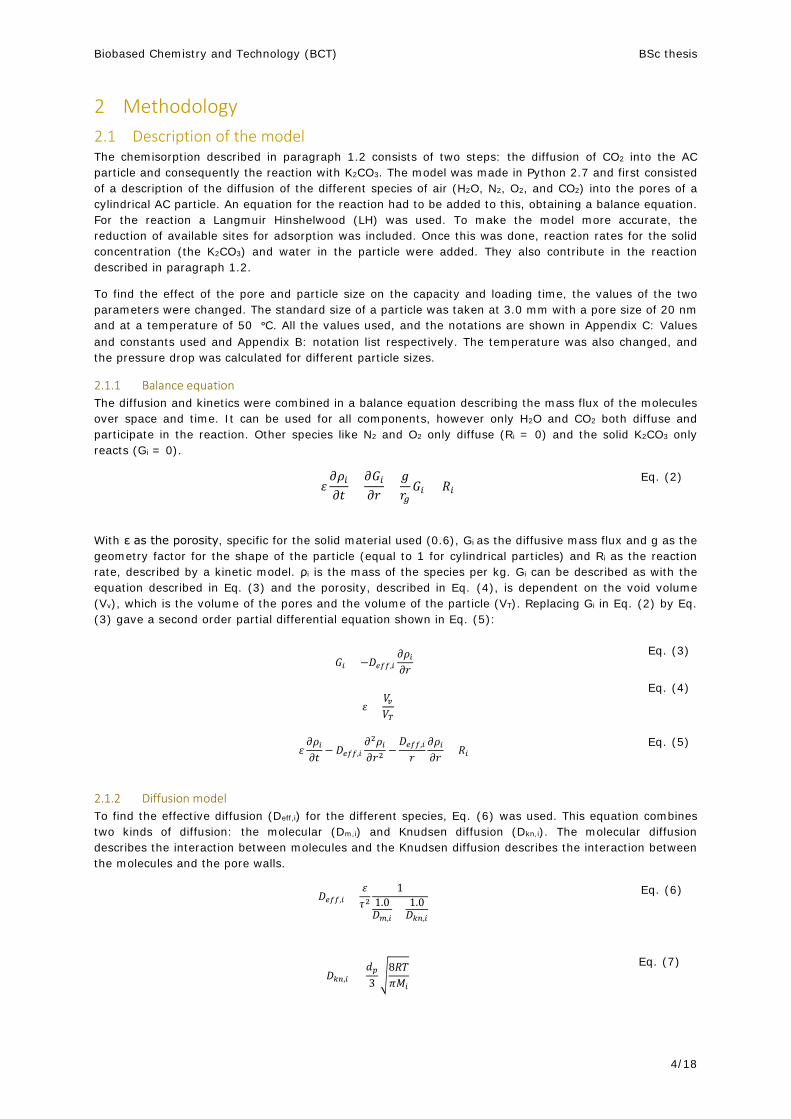
2 Methodology 2.1 Description of the model The chemisorption described in paragraph 1.2 consists of two steps: the diffusion of CO2 into the AC particle and consequently the reaction with K2CO3. The model was made in Python 2.7 and first consisted of a description of the diffusion of the different species of air (H2O, N2, O2, and CO2) into the pores of a cylindrical AC particle. An equation for the reaction had to be added to this, obtaining a balance equation. For the reaction a Langmuir Hinshelwood (LH) was used. To make the model more accurate, the reduction of available sites for adsorption was included. Once this was done, reaction rates for the solid concentration (the K2CO3) and water in the particle were added. They also contribute in the reaction described in paragraph 1.2.
To find the effect of the pore and particle size on the capacity and loading time, the values of the two parameters were changed. The standard size of a particle was taken at 3.0 mm with a pore size of 20 nm and at a temperature of 50 ᵒC. All the values used, and the notations are shown in Appendix C: Values and constants used and Appendix B: notation list respectively. The temperature was also changed, and the pressure drop was calculated for different particle sizes.
2.1.1 Balance equation The diffusion and kinetics were combined in a balance equation describing the mass flux of the molecules over space and time. It can be used for all components, however only H2O and CO2 both diffuse and participate in the reaction. Other species like N2 and O2 only diffuse (Ri = 0) and the solid K2CO3 only reacts (Gi = 0).
𝜀𝜀𝜕𝜕𝜌𝜌𝑖𝑖𝜕𝜕𝜕𝜕
+𝜕𝜕𝐺𝐺𝑖𝑖𝜕𝜕𝜕𝜕
+𝑔𝑔𝜕𝜕𝑔𝑔𝐺𝐺𝑖𝑖 = 𝑅𝑅𝑖𝑖
Eq. (2)
With ε as the porosity, specific for the solid material used (0.6), Gi as the diffusive mass flux and g as the geometry factor for the shape of the particle (equal to 1 for cylindrical particles) and Ri as the reaction rate, described by a kinetic model. ρi is the mass of the species per kg. Gi can be described as with the equation described in Eq. (3) and the porosity, described in Eq. (4), is dependent on the void volume (Vv), which is the volume of the pores and the volume of the particle (VT). Replacing Gi in Eq. (2) by Eq. (3) gave a second order partial differential equation shown in Eq. (5):
𝜀𝜀𝜕𝜕𝜌𝜌𝑖𝑖𝜕𝜕𝜕𝜕 − 𝐷𝐷𝑒𝑒𝑒𝑒𝑒𝑒,𝑖𝑖
𝜕𝜕2𝜌𝜌𝑖𝑖𝜕𝜕𝜕𝜕2 −
𝐷𝐷𝑒𝑒𝑒𝑒𝑒𝑒,𝑖𝑖
𝜕𝜕𝜕𝜕𝜌𝜌𝑖𝑖𝜕𝜕𝜕𝜕 = 𝑅𝑅𝑖𝑖
Eq. (5)
2.1.2 Diffusion model To find the effective diffusion (Deff,i) for the different species, Eq. (6) was used. This equation combines two kinds of diffusion: the molecular (Dm,i) and Knudsen diffusion (Dkn,i). The molecular diffusion describes the interaction between molecules and the Knudsen diffusion describes the interaction between the molecules and the pore walls.
𝐺𝐺𝑖𝑖 = −𝐷𝐷𝑒𝑒𝑒𝑒𝑒𝑒,𝑖𝑖
𝜕𝜕𝜌𝜌𝑖𝑖𝜕𝜕𝜕𝜕
Eq. (3)
𝜀𝜀 =
𝑉𝑉𝑣𝑣𝑉𝑉𝑇𝑇
Eq. (4)
𝐷𝐷𝑒𝑒𝑒𝑒𝑒𝑒,𝑖𝑖 =𝜀𝜀𝜏𝜏2
11.0𝐷𝐷𝑚𝑚,𝑖𝑖
+ 1.0𝐷𝐷𝑘𝑘𝑘𝑘,𝑖𝑖
Eq. (6)
𝐷𝐷𝑘𝑘𝑘𝑘,𝑖𝑖 =
𝑑𝑑𝑝𝑝3�
8𝑅𝑅𝑅𝑅𝜋𝜋𝑀𝑀𝑖𝑖
Eq. (7)

Biobased Chemistry and Technology (BCT) BSc thesis
5/18
Next to the Knudsen and molecular diffusion, the effective diffusion is also dependent on the porosity ε and the tortuosity τ of the AC. The molecular diffusion is described by a Wilke approximation in Eq. (8). Mi represents the molar fractions of the different species (O2, N2, H2O or CO2). Dij was described by the Chapman-Enskog theory for binary diffusion [25]. The Knudsen diffusion is shown in Eq. (7) and it is more important at a low concentration of molecules as there are relatively more interactions with the pore walls compared to interactions with other molecules. With dp as the pore size (m), R as the gas constant and Mi again as the molar fractions [24,26]. Next, the effective diffusion (Def,if ) was found using Eq. (6), combining Knudsen and molecular diffusion [27].
2.1.3 Kinetic model For the reaction rate Ri in Eq. (5), a kinetic model was needed. The one used was the Langmuir-Hinshelwood (LH) model. It is mostly used for surface reactions and it was also used for the reaction between CO2 and dry K2CO3 by Gao et al. (2013) [28]. It can describe a reaction in the following way [29]: if the reaction is A -> B
𝑅𝑅𝑖𝑖 =𝑘𝑘𝐾𝐾𝐴𝐴𝐶𝐶𝐴𝐴
1 + 𝐾𝐾𝐴𝐴𝐶𝐶𝐴𝐴 + 𝐾𝐾𝐵𝐵𝐶𝐶𝐵𝐵 Eq.(9)
The LH model used here could not be used for the backward reaction, because the equilibrium for the reaction was not included. It was assumed that H2O and CO2 react on the same type of site and that gave the following equation for the LH model.
𝑅𝑅𝑖𝑖 = 𝑁𝑁𝑇𝑇𝑘𝑘𝑅𝑅𝐾𝐾𝑒𝑒𝑒𝑒𝑒𝑒𝑂𝑂2𝐾𝐾𝑒𝑒𝑒𝑒𝐻𝐻2𝑂𝑂𝐶𝐶𝑠𝑠𝐶𝐶𝑤𝑤�1+𝐾𝐾𝑒𝑒𝑒𝑒𝑒𝑒𝑂𝑂2𝐶𝐶𝑠𝑠+𝐾𝐾𝑒𝑒𝑒𝑒𝐻𝐻2𝑂𝑂𝐶𝐶𝑤𝑤�
2 Eq. (10)
As can be seen an extra term NT was added which stands for the total available sites of K2CO3. NT decreases over time during the loading of the particle because CO2 reacts with the K2CO3. To describe NT, an inactivation term φ was introduced by Forzatti et al. [30] shown in Eq. (11). It can be used to describe the consumption of the K2CO3. The equation that describes the NT, is shown in Eq. (13) with Cc as the amount of K2CO3 that has reacted, C0 as the initial amount of K2CO3 and Cs as the amount of K2CO3 still available.
𝐷𝐷𝑚𝑚,𝑖𝑖 =1 −𝑀𝑀𝑖𝑖
∑ 𝑀𝑀𝑖𝑖𝐷𝐷𝑖𝑖𝑖𝑖
𝑁𝑁𝑠𝑠𝑖𝑖=1
Eq. (8)
𝜑𝜑 =𝐶𝐶0 − 𝐶𝐶𝑠𝑠𝐶𝐶0
Eq. (11)
𝑁𝑁𝑇𝑇 = 𝜑𝜑 𝑐𝑐0
Eq. (12)
𝑁𝑁𝑇𝑇 = 𝐶𝐶0 − 𝐶𝐶𝑠𝑠 = 𝐶𝐶𝑡𝑡
Eq. (13)

Biobased Chemistry and Technology (BCT) BSc thesis
6/18
Back to equation Eq. (10), Cw represents the concentration of water and the reaction rate constant (kR) is described in Eq. (14). The value for the activation energy εact (28 kJ mol - 1) was found by making Arrhenius plots using data from Gao et al. (2013) [28]. The natural logarithm of the equilibrium constant was plotted against 1/T to obtain a straight line of which the slope represented Ea/R. KeqCO2 and KeqH2O represent respectively the adsorption equilibrium constants of CO2 and H2O. They can be described according to Gao in the following way, with the adsorption activation energies (εact) for CO2 and H2O as 81.344 103 J mol-1 and 69.489 10 3 J mol-1respectively (shown in Eq. (15) and Eq. (16)).
𝐾𝐾𝑒𝑒𝑒𝑒𝐶𝐶𝑂𝑂2 = 1.252 ∗ 10−20𝑒𝑒81.377∗103
𝑅𝑅∗𝑇𝑇 Eq. (15)
𝐾𝐾𝑒𝑒𝑒𝑒𝐻𝐻2𝑂𝑂 = 1.200 ∗ 10−8𝑒𝑒69.489∗103
𝑅𝑅∗𝑇𝑇 Eq. (16)
2.2 Solving the balance equation The balance equation was solved by using a method called method of lines (MOL). With this technique a PDE can be solved by discretizing all dimensions except one. In this case, the values for space (r) were discretized. If for example r is discretized 12 times, 48 states are obtained for the four species (H2O, N2, O2, and CO2) over twelve places (r) in time (t). The obtained time derivatives (ODE) were integrated in Python for every spatial point and every species. For solving several assumptions had to be made and initial and boundary conditions were necessary.
2.2.1 Assumptions The following assumptions were made for the model:
• The product layer of KHCO3 that arises over time does not influence the diffusion [31] (no reduction of the void fraction if solid product is formed [22].)
• Condensed water that influences the diffusion is not taken into consideration. • Temperature gradients inside the particle are not considered. There is heat production from the
reaction (exothermic). However, the amount of heat released is small due to a small concentration of CO2.
• There is no co-adsorption of O2, N2 or other components of air as they do not react with the K2CO3.
• A monolayer of K2CO3 is assumed on the pore walls. Not all molecules of K2CO3 can be reached by the CO2 due to inaccessibility.
• There is no physisorption of CO2, as the chemisorption is much stronger and the concentration of CO2 in ambient air is low.
• The pathway the molecules travel through the AC particle is assumed to be tortuous. • The pore distribution is assumed to be homogeneous with one average pore size.
2.2.2 Initial conditions The four gaseous species had initial concentrations inside the particle and in air, of which the values can be seen in Table 1. Initially the particle is mostly filled with water as the desorption step of the process consists of adding steam. The concentrations of the gas species in ambient air are considered as the surface (boundary) conditions. As for the solid species: It was given that 10% of the total mass of the particle existed of K2CO3, but this amount changes by changing the pore size because this influences the internal surface area for the K2CO3 to attach to. A relation between pore size and initial K2CO3 had to be found. To do so, a layer of certain thickness (1.0 nm) of K2CO3 had to be assumed. This layer occupied a certain volume inside the particle, which was dependent on the total surface area. The internal surface area (A) was calculated with the void volume from the porosity. It was assumed that the void volume was occupied by one large pore with a certain diameter (dp) and a surface area described in Eq. (17). With the internal surface area and the thickness of the layer of CO2, the total volume of K2CO3 was calculated. Combined with the pure density of K2CO3, the concentration was calculated. Not all K2CO3 was available for the CO2 as some of it was not reachable. Eq. (18) shows the obtained equation:
𝑘𝑘𝑅𝑅 =𝑘𝑘𝑏𝑏𝑅𝑅ℎ 𝑒𝑒
−𝜀𝜀𝑎𝑎𝑎𝑎𝑎𝑎𝑅𝑅𝑇𝑇
Eq. (14)

Biobased Chemistry and Technology (BCT) BSc thesis
7/18
Table 1 Molar fractions of the different species
Species: Initial Air (yi)
CO2 (g) 0.00 4.000 10-4 H2O (g) 0.99 0.0070 N2 (g) 8.00 10-3 0.7926 O2 (g) 2.00 10-3 0.2000 𝐴𝐴 = 𝑉𝑉𝑣𝑣
4𝑑𝑑𝑝𝑝
Eq. (17)
𝐶𝐶0 = 𝜂𝜂
𝐴𝐴 ℎ 𝜌𝜌𝐾𝐾2𝐶𝐶𝑂𝑂3𝑉𝑉𝑇𝑇
Eq. (18)
With η as the fraction of total K2CO3 available for reaction (0.05). This value was chosen such that with a particle of 3 mm and pore size of 20 nm, 10% of the total weight of the particle was K2CO3
as stated before. VT represents as the total volume of one particle, A as the internal surface area, calculated with Eq. (17), h as the height of the layer of K2CO3 on the pore surface (m) and lastly ρk2CO3 as the density of pure K2CO3 (2.43 103 mol m-3). Now it was possible to change the initial concentration by changing the pore size.
2.2.3 Boundary conditions A Dirichlet boundary condition for the outer surface of the particles was necessary to solve the equation, shown in Eq. (19). It is valid for all gas species;
𝜌𝜌|𝑟𝑟𝑖𝑖 = 𝜌𝜌0 Eq. (19)
At the surface of the particle (ri), the values for the gas species is equal to the concentrations in ambient air (ρ0). These values are also shown in the second column of Table 1. For the solid no boundary condition is necessary, only an initial condition as the K2CO3 does not diffuse.
2.3 Temperature change The effect of temperature change was analyzed by changing only the temperature within a range of 20 ᵒC and 80 ᵒC and keeping the rest of the variables constant. The effect of temperature on the conversion and diffusion was analyzed by plotting of the conversion percentage against time for different temperatures.
2.4 Calculating the pressure drop As said before, a larger particle size will lead to a lower pressure drop over the reactor. Ergun [23] made an equation that shows this relation between pressure drop and particle size. This equation is shown in Eq. (20).
∆𝑝𝑝𝐿𝐿 =
150𝜇𝜇𝐿𝐿𝑉𝑉𝑠𝑠𝐷𝐷𝑝𝑝2
(1−∈)2
∈3 +1.75𝜌𝜌𝑔𝑔𝐷𝐷𝑝𝑝
(1 − 𝜖𝜖)∈3 𝑉𝑉𝑠𝑠2
Eq. (20)
With ΔP as the pressure drop, L as the height of the bed with AC particles, Dp as the particle diameter , ∈ as the porosity of the whole bed (0.37, [32]), μ as the gas viscosity (1.96 * 10-5 Pa s-1 at 50 ᵒC [33]), Vs as the superficial velocity of air through the bed (0.4 m s-1, [32]) and ρg as the gas density (1.225 kg m3 for air at 50 ᵒC [34]).
Biobased Chemistry and Technology (BCT) BSc thesis
8/18
3 Results and discussion The aim was to find the effect of changing the particle and pore sizes and temperature on the capacity and loading time of an activated carbon particle. All values used are shown in: Appendix C: Values and constants used, and the notations in: Appendix B: notation list. The results are shown in graphs and discussed.
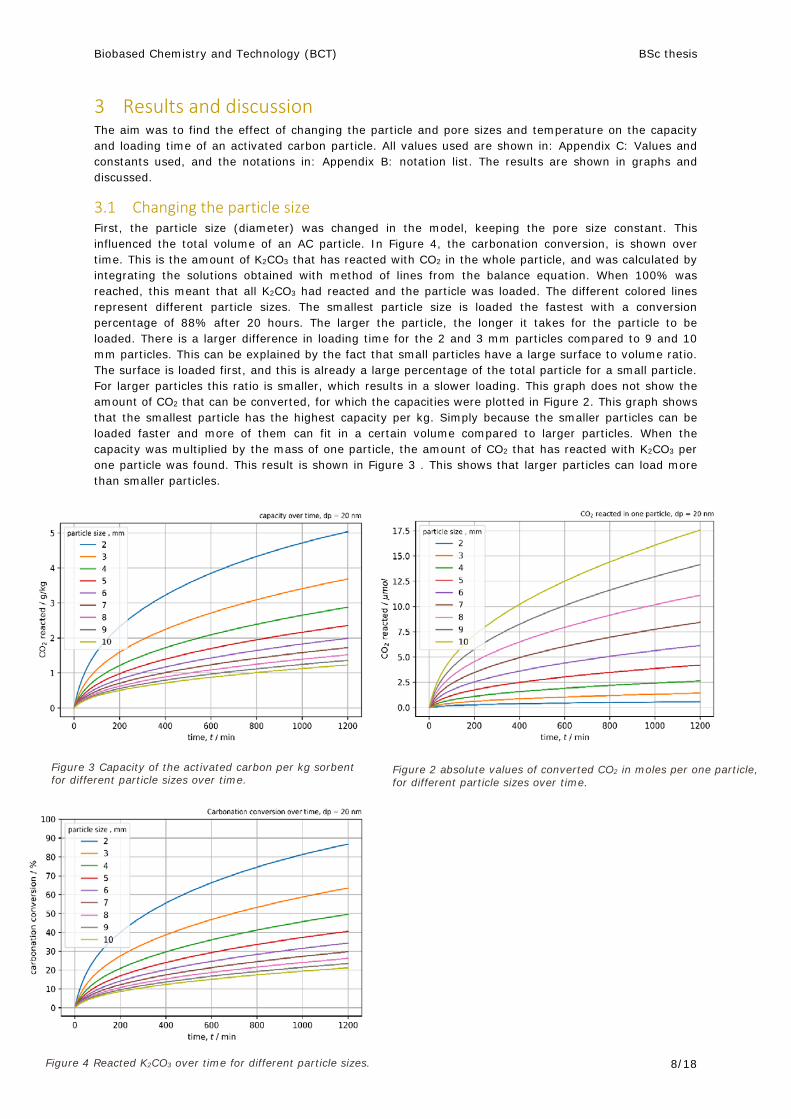
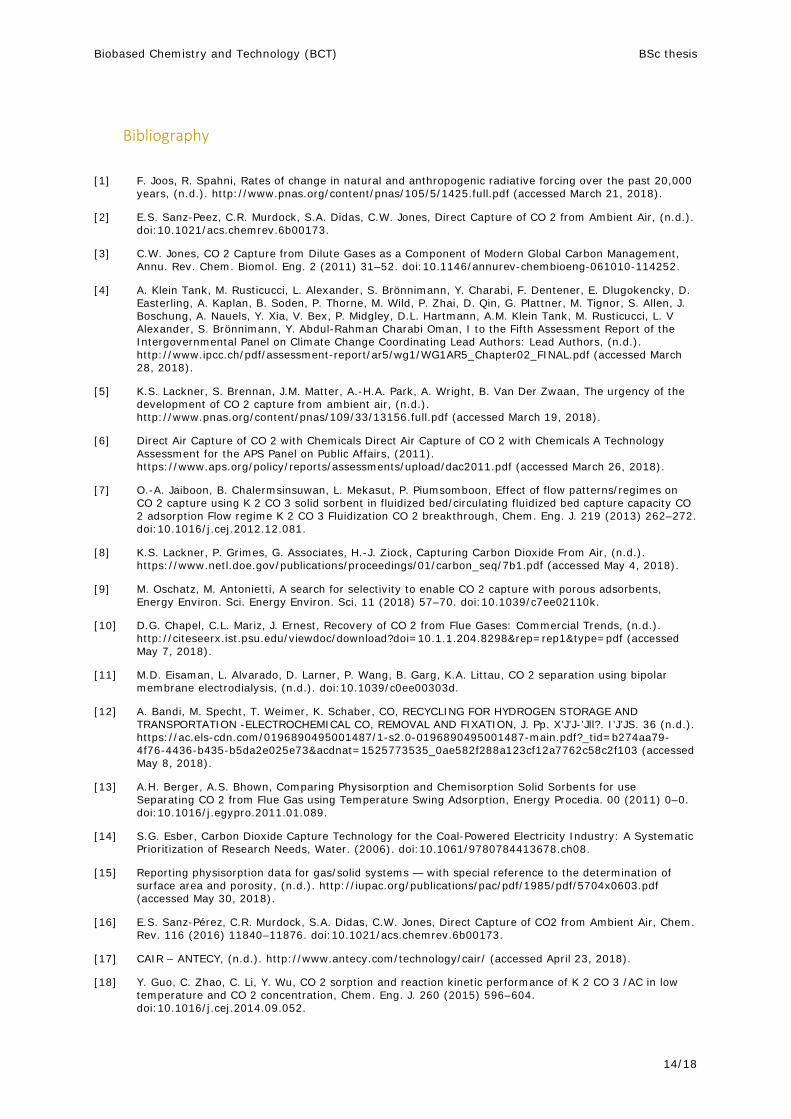
3.1 Changing the particle size First, the particle size (diameter) was changed in the model, keeping the pore size constant. This influenced the total volume of an AC particle. In Figure 4, the carbonation conversion, is shown over time. This is the amount of K2CO3 that has reacted with CO2 in the whole particle, and was calculated by integrating the solutions obtained with method of lines from the balance equation. When 100% was reached, this meant that all K2CO3 had reacted and the particle was loaded. The different colored lines represent different particle sizes. The smallest particle size is loaded the fastest with a conversion percentage of 88% after 20 hours. The larger the particle, the longer it takes for the particle to be loaded. There is a larger difference in loading time for the 2 and 3 mm particles compared to 9 and 10 mm particles. This can be explained by the fact that small particles have a large surface to volume ratio. The surface is loaded first, and this is already a large percentage of the total particle for a small particle. For larger particles this ratio is smaller, which results in a slower loading. This graph does not show the amount of CO2 that can be converted, for which the capacities were plotted in Figure 2. This graph shows that the smallest particle has the highest capacity per kg. Simply because the smaller particles can be loaded faster and more of them can fit in a certain volume compared to larger particles. When the capacity was multiplied by the mass of one particle, the amount of CO2 that has reacted with K2CO3 per one particle was found. This result is shown in Figure 3 . This shows that larger particles can load more than smaller particles.
Figure 2 absolute values of converted CO2 in moles per one particle, for different particle sizes over time.
Figure 3 Capacity of the activated carbon per kg sorbent for different particle sizes over time.
Figure 4 Reacted K2CO3 over time for different particle sizes.

Biobased Chemistry and Technology (BCT) BSc thesis
9/18
3.2 Changing the pore size Next, the pore size was changed, keeping the particle size constant. This influenced the internal surface area of the particle and thus also the initially available K2CO3 per kg of adsorbent. The carbonation conversion is plotted against the time again, only this time the colored lines represent the different pore sizes (Figure 5). A larger pore size resulted in a faster loading of the particle compared to a particle with smaller pores. A drawback of a larger pore size is that the capacity decreases. This can be seen in Figure 6: the maximum capacity is inversely proportional to the pore size.
Figure 7 shows the capacity in grams of CO2 converted per kg of adsorbent for different pore sizes. Smaller pore sized particles have a larger capacity than particles with larger pores. When decreasing the pore size, it was expected that at a certain point the diffusion limitations were visible. This was expected because the Knudsen diffusion decreases when the pore size decreases, as can be seen in Eq. (7). Slower diffusion would result in a lower capacity for a given time for small pore sized particles, but this is not seen in Figure 7. Apparently, the increase in internal surface area had more effect than the diffusional limitations on the capacity. The amount of CO2 reacted kept increasing by decreasing pore size.
To show the effect of pore size on diffusion, the change in internal surface area was cancelled out by be keeping it constant (2.5447 m2 for pore size = 20 nm, particle size = 3 mm). By doing this, the initial amount of K2CO3 is the same for all pore sizes. The result is shown in Figure 8. As can be seen, the particle was loaded faster with larger pore sizes compared to particles with smaller pore sizes. This agrees with the statement that diffusion is slower for smaller pore sizes. Comparing Figure 7with Figure 8 shows that the change in surface area is more dominant than the diffusion for the capacity.
Figure 6 Maximum capacity for different pore sizes
Figure 8 Capacity of particles with different pore sizes, whilst the internal surface area is kept constant at 2.5447 m2.
Figure 7 Capacity for different pore sizes over time.
Figure 5 Carbonation conversion over time for different pore sizes.

Biobased Chemistry and Technology (BCT) BSc thesis
10/18
3.3 Effect of temperature Lastly the temperature was changed, keeping both the particle and the pore size constant. The carbonation conversion was expected to be affected by T as the reaction is exothermic. It was expected that the conversion went down upon increasing the temperature. This effect cannot be seen in Figure 9. An explanation of this result can be that diffusion is not much affected by temperature and much by the concentration gradient. The equation for diffusion was described in paragraph 2.1.2 in Eq. (3). If the concentration gradient (∂ρi
∂r) is much smaller than 1, the diffusion Di is not limiting. This was shown by
making a simulation of a very small particle (20 micrometer) with a small concentration gradient (Figure 10). In this particle, the temperature had a larger effect on the carbonation conversion. This can be explained by the reaction rate, which does increase exponentially upon increasing the temperature. Nothing can be said about temperatures higher than 80 ᵒC as the reverse reaction was not implemented in the model. With the Langmuir Hinshelwood model used here, the reaction rate keeps increasing upon increasing the temperature.
Figure 10 Carbonation conversion for different temperatures over time for a 3 mm particle.
Figure 9 Carbonation conversion for different temperatures over time for a 20 μm particle.
Biobased Chemistry and Technology (BCT) BSc thesis
11/18
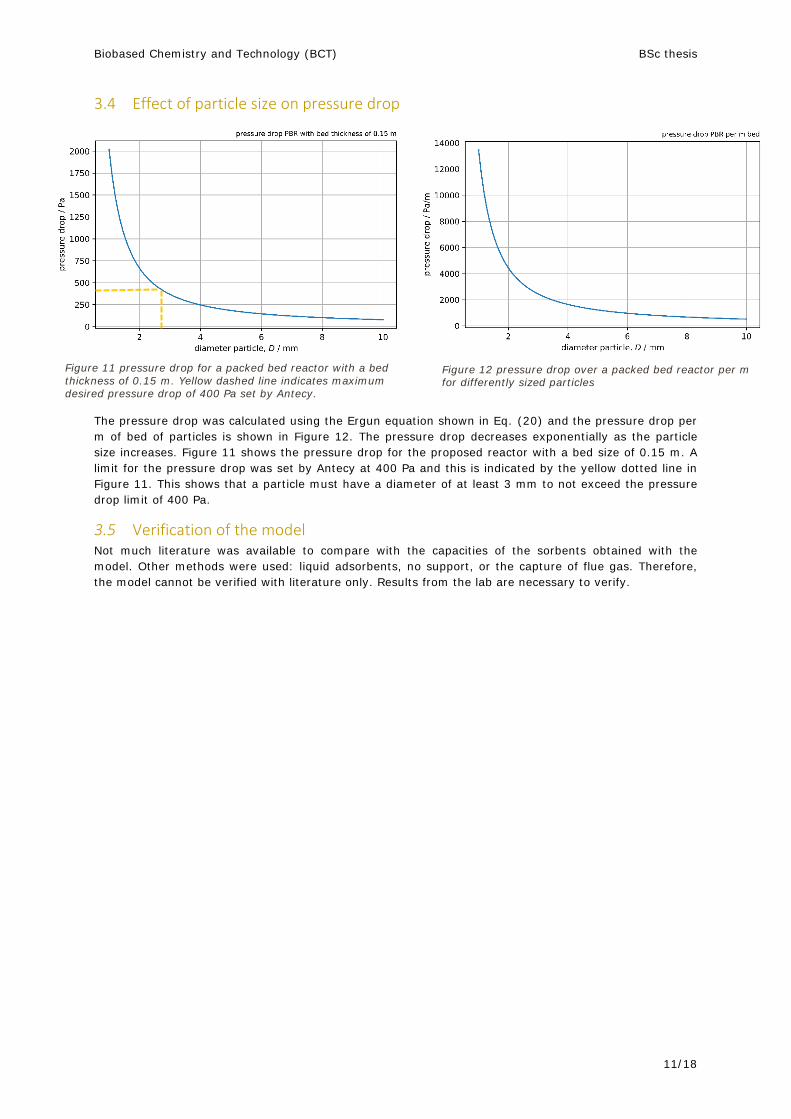
3.4 Effect of particle size on pressure drop
The pressure drop was calculated using the Ergun equation shown in Eq. (20) and the pressure drop per m of bed of particles is shown in Figure 12. The pressure drop decreases exponentially as the particle size increases. Figure 11 shows the pressure drop for the proposed reactor with a bed size of 0.15 m. A limit for the pressure drop was set by Antecy at 400 Pa and this is indicated by the yellow dotted line in Figure 11. This shows that a particle must have a diameter of at least 3 mm to not exceed the pressure drop limit of 400 Pa.
3.5 Verification of the model Not much literature was available to compare with the capacities of the sorbents obtained with the model. Other methods were used: liquid adsorbents, no support, or the capture of flue gas. Therefore, the model cannot be verified with literature only. Results from the lab are necessary to verify.
Figure 11 pressure drop for a packed bed reactor with a bed thickness of 0.15 m. Yellow dashed line indicates maximum desired pressure drop of 400 Pa set by Antecy.
Figure 12 pressure drop over a packed bed reactor per m for differently sized particles

Biobased Chemistry and Technology (BCT) BSc thesis
12/18
4 Conclusion For efficient capture of CO2 using solid adsorbents, the particle design of the support was found to be important. Diffusion was the limiting factor for the adsorption and it was influenced by pore and particle size. For effective capture small pores and small particles were preferred over larger ones.
The made diffusion-reaction model showed that smaller particles could reach the same capacity with a shorter loading time compared to larger particles. By looking at capacity only, a small particle seemed to be the best option, but pressure drop also plays a role. The pressure drop, calculated with the Ergun equation, showed that by taking a particle size of at least 3 mm the limit of 400 Pa was not exceeded. This limit was set by Antecy to avoid high energy costs for the reactor.
It was thought that the pores size influences the maximum capacity as it influences the available surface and thus also the available K2CO3. Based on calculations used for the model, this was found to be true. The capacity doubled by halving the pore size. The smaller the pore sizes, the better. A downside of smaller pores was thought to be the diffusional limitations and thus longer loading times, but this appeared not to be a problem. With smaller pore sizes, less of the whole particle was reached by CO2, but the increased internal surface area compensated for this effect. A smaller fraction of all K2CO3 in one particle was used in the same time span, but in absolute values more grams of CO2 could react per kg of adsorbent. In the end, the most conversion in the shortest time is preferred, and this was obtained with the smallest pore size, independent on the loading time. The pressure drop did not change upon changing the pore size because the particle size was kept constant.
Next to this, the effect of the temperature on the capture process was also found. Due to the exothermic behavior of the reaction it was expected that the reaction would go backward, but this effect was not seen as the backward reaction was not in the kinetic model (Langmuir-Hinshelwood). Instead the reaction was only sped up by increasing the temperature. The diffusion rate was expected to be larger with larger temperatures, however this was not seen. An explanation was that the diffusive mass flux is dependent on the temperature and the concentration gradient. As the concentration gradient is low due to low concentrations of CO2 in air, the effect of temperature on diffusion was minimal.
Concluded, the loading time is not considered to be a bottleneck for the CO2 capture, the capacity on the other hand is. The pressure drop is also a bottleneck, because it inhibits the particles to be smaller than 3 mm for better adsorption capacities. The temperature does not influence the diffusion, as it does to the kinetics. Still it is best to keep the temperature low for adsorption, to reduce costs. This results in a better understanding of the whole technology, and consequently also closer to stabilizing the CO2 concentrations in air.
5 Outlook This research was part of the CAIR project by Antecy, who are creating a low cost technology for capturing CO2 from ambient air using solid adsorbents in packed bed reactors [35]. A pilot scale reactor is in development, the characteristics of the sorbent material were analyzed, and modelling has been done on the reactor itself. The effect of the concentration gradient inside the particles was not yet known and thus modelled in this research. The created model can be used in the process of making the particles and gave some new insights. The model showed for example that to get the highest capacity in the shortest time, a particle has to have small pores (<15 nm) even while only a small percentage of this whole particle is actually used for adsorption. As the middle of the particle is not used, it might as well be left out completely. This makes the obtained particle hollow, which has an advantage of creating a lower pressure drop over the reactor and increasing the diffusion and available surface. A downside of a hollow particle is that it is more difficult and probably more expensive to make and more fragile than the proposed design. To make the hollow particles less fragile a honeycomb structure can be made, by connecting them to each other. This is something to consider when designing an adsorbent material.
The model itself can be improved by including an equilibrium in the reaction for the backward reaction. If this is done, the desorption can be modelled. By increasing the temperature, which is done for desorption, the equilibrium of the reaction will shift to the other side. Also, the model can be improved if it can be verified with data from experiments.
The sensitivity of the reaction to H2O was not tested in this research, and this might be an interesting thing to do as the reaction needs H2O, but the humidity of air can change. As not much water is needed

Biobased Chemistry and Technology (BCT) BSc thesis
13/18
for the reaction, it reacts 1:1 with CO2, there will possibly be too much water. This can have a negative effect on the adsorption. The influence of H2O was tested by Zhao et al. [36]: they stated that a higher water concentration lead to a faster carbonation conversion up to 12% H2O and that diffusion was slower at higher H2O concentrations.
There is still a lot to do till CO2 concentrations in air stabilize or decrease. The whole proposed process needs to be energy efficient and low cost for scale up. If the CO2 capture is coupled to electrolysis of water to hydrogen, methanol fuels can be made. This makes the CO2 capture process more economically interesting. The CO2 can also be concentrated and sold to for example algae parks, the chemical industry or greenhouses. Evidently, there are enough applications for the captured CO2, and if this can replace the use of fossil fuels we can work towards a circular use of CO2 with emission, capture and consequently utilization.
Biobased Chemistry and Technology (BCT) BSc thesis
14/18
Bibliography
[1] F. Joos, R. Spahni, Rates of change in natural and anthropogenic radiative forcing over the past 20,000 years, (n.d.). http://www.pnas.org/content/pnas/105/5/1425.full.pdf (accessed March 21, 2018).
[2] E.S. Sanz-Peez, C.R. Murdock, S.A. Didas, C.W. Jones, Direct Capture of CO 2 from Ambient Air, (n.d.). doi:10.1021/acs.chemrev.6b00173.
[3] C.W. Jones, CO 2 Capture from Dilute Gases as a Component of Modern Global Carbon Management, Annu. Rev. Chem. Biomol. Eng. 2 (2011) 31–52. doi:10.1146/annurev-chembioeng-061010-114252.
[4] A. Klein Tank, M. Rusticucci, L. Alexander, S. Brönnimann, Y. Charabi, F. Dentener, E. Dlugokencky, D. Easterling, A. Kaplan, B. Soden, P. Thorne, M. Wild, P. Zhai, D. Qin, G. Plattner, M. Tignor, S. Allen, J. Boschung, A. Nauels, Y. Xia, V. Bex, P. Midgley, D.L. Hartmann, A.M. Klein Tank, M. Rusticucci, L. V Alexander, S. Brönnimann, Y. Abdul-Rahman Charabi Oman, I to the Fifth Assessment Report of the Intergovernmental Panel on Climate Change Coordinating Lead Authors: Lead Authors, (n.d.). http://www.ipcc.ch/pdf/assessment-report/ar5/wg1/WG1AR5_Chapter02_FINAL.pdf (accessed March 28, 2018).
[5] K.S. Lackner, S. Brennan, J.M. Matter, A.-H.A. Park, A. Wright, B. Van Der Zwaan, The urgency of the development of CO 2 capture from ambient air, (n.d.). http://www.pnas.org/content/pnas/109/33/13156.full.pdf (accessed March 19, 2018).
[6] Direct Air Capture of CO 2 with Chemicals Direct Air Capture of CO 2 with Chemicals A Technology Assessment for the APS Panel on Public Affairs, (2011). https://www.aps.org/policy/reports/assessments/upload/dac2011.pdf (accessed March 26, 2018).
[7] O.-A. Jaiboon, B. Chalermsinsuwan, L. Mekasut, P. Piumsomboon, Effect of flow patterns/regimes on CO 2 capture using K 2 CO 3 solid sorbent in fluidized bed/circulating fluidized bed capture capacity CO 2 adsorption Flow regime K 2 CO 3 Fluidization CO 2 breakthrough, Chem. Eng. J. 219 (2013) 262–272. doi:10.1016/j.cej.2012.12.081.
[8] K.S. Lackner, P. Grimes, G. Associates, H.-J. Ziock, Capturing Carbon Dioxide From Air, (n.d.). https://www.netl.doe.gov/publications/proceedings/01/carbon_seq/7b1.pdf (accessed May 4, 2018).
[9] M. Oschatz, M. Antonietti, A search for selectivity to enable CO 2 capture with porous adsorbents, Energy Environ. Sci. Energy Environ. Sci. 11 (2018) 57–70. doi:10.1039/c7ee02110k.
[10] D.G. Chapel, C.L. Mariz, J. Ernest, Recovery of CO 2 from Flue Gases: Commercial Trends, (n.d.). http://citeseerx.ist.psu.edu/viewdoc/download?doi=10.1.1.204.8298&rep=rep1&type=pdf (accessed May 7, 2018).
[11] M.D. Eisaman, L. Alvarado, D. Larner, P. Wang, B. Garg, K.A. Littau, CO 2 separation using bipolar membrane electrodialysis, (n.d.). doi:10.1039/c0ee00303d.
[12] A. Bandi, M. Specht, T. Weimer, K. Schaber, CO, RECYCLING FOR HYDROGEN STORAGE AND TRANSPORTATION -ELECTROCHEMICAL CO, REMOVAL AND FIXATION, J. Pp. X’J’J-’Jll?. I’J’JS. 36 (n.d.). https://ac.els-cdn.com/0196890495001487/1-s2.0-0196890495001487-main.pdf?_tid=b274aa79-4f76-4436-b435-b5da2e025e73&acdnat=1525773535_0ae582f288a123cf12a7762c58c2f103 (accessed May 8, 2018).
[13] A.H. Berger, A.S. Bhown, Comparing Physisorption and Chemisorption Solid Sorbents for use Separating CO 2 from Flue Gas using Temperature Swing Adsorption, Energy Procedia. 00 (2011) 0–0. doi:10.1016/j.egypro.2011.01.089.
[14] S.G. Esber, Carbon Dioxide Capture Technology for the Coal-Powered Electricity Industry: A Systematic Prioritization of Research Needs, Water. (2006). doi:10.1061/9780784413678.ch08.
[15] Reporting physisorption data for gas/solid systems — with special reference to the determination of surface area and porosity, (n.d.). http://iupac.org/publications/pac/pdf/1985/pdf/5704x0603.pdf (accessed May 30, 2018).
[16] E.S. Sanz-Pérez, C.R. Murdock, S.A. Didas, C.W. Jones, Direct Capture of CO2 from Ambient Air, Chem. Rev. 116 (2016) 11840–11876. doi:10.1021/acs.chemrev.6b00173.
[17] CAIR – ANTECY, (n.d.). http://www.antecy.com/technology/cair/ (accessed April 23, 2018).
[18] Y. Guo, C. Zhao, C. Li, Y. Wu, CO 2 sorption and reaction kinetic performance of K 2 CO 3 /AC in low temperature and CO 2 concentration, Chem. Eng. J. 260 (2015) 596–604. doi:10.1016/j.cej.2014.09.052.

Biobased Chemistry and Technology (BCT) BSc thesis
15/18
[19] Soo Chool Lee a, Bo Yun Choi a, Tae Jin Lee b, Chong Kul Ryu c, Young Soo Ahn d, Jae Chang Kim, CO2 absorption and regeneration of alkali metal-based solid sorbents, Catal. Today. 111 (2006). https://ac.els-cdn.com/S0920586105008102/1-s2.0-S0920586105008102-main.pdf?_tid=a5255244-092e-4600-a0bf-904ff5d09952&acdnat=1522307719_09ad750e7d46e5e4328e244906196e75 (accessed March 29, 2018).
[20] S.C. Lee, B.Y. Choi, T.J. Lee, C.K. Ryu, Y.S. Ahn, J.C. Kim, CO 2 absorption and regeneration of alkali metal-based solid sorbents, (2005). doi:10.1016/j.cattod.2005.10.051.
[21] S. Chool Lee, H. Jin Chae, S. Jae Lee, Y. Hee Park, C. Kul Ryu, C. Keun Yi, J. Chang Kim, Novel regenerable potassium-based dry sorbents for CO 2 capture at low temperatures, J. Mol. Catal. B Enzym. 56 (2009) 179–184. doi:10.1016/j.molcatb.2008.07.007.
[22] S.C. Lee, H.J. Chae, B.Y. Choi, S.Y. Jung, C.Y. Ryu, J.J. Park, J.-I. Baek, C.K. Ryu, J.C. Kim, The effect of relative humidity on CO 2 capture capacity of potassium-based sorbents K 2 CO 3 , K 2 CO 3 ·1.5H 2 O, Korean J. Chem. Eng. 28 (2011) 480–486. doi:10.1007/s11814-010-0398-x.
[23] S. Ergun, Fluid flow through packed columns, Fluid. Eng. 2nd Ed. 48 (1952) 89–94.
[24] W. He, W. Lv, J. Dickerson, Gas transport in solid oxide fuel cells, in: Springer, 2014. doi:10.1007/978-3-319-09737-4.
[25] T.. Chapman, S.; Cowling, The Mathematical Theory of Non-uniform Gases: An Account of the Kinetic Theory of Viscosity, Thermal Conduction and Diffusion in Gase, 1990.
[26] J. Solsvik, S. Tangen, H.A. Jakobsen, On the Consistent Modeling of Porous Catalyst Pellets: Mass and Molar Formulations, (n.d.). doi:10.1021/ie3007853.
[27] N. Epstein, On tortuosity and the tortuosity factor in flow and diffusion through porous media, Chem. Eng. Sci. 44 (1989) 777–779. doi:10.1016/0009-2509(89)85053-5.
[28] H. Gao, S. Pishney, M.J. Janik, First principles study on the adsorption of CO 2 and H 2 O on the K 2 CO 3 (001) surface, (2013). doi:10.1016/j.susc.2012.11.014.
[29] L.S. Thesis, G.W. Roberts, C.N. Satterfield, EFFECTIVENESS FACTOR FOR POROUS CATALYSTS Langmuir-Hinshelwood Kinetic Expressions, Lit. Cited Chem. Commun. Z. Anorg. Chem. J. Am. Chem. Soc. J. Phys. Chem. J. Prakt. Chem. Compt. Rend. 8 (1954) 714–2818. https://pubs.acs.org/doi/pdf/10.1021/i160015a009 (accessed May 8, 2018).
[30] P. Forzatti, L. Lietti, Catalyst deactivation, (n.d.). https://pdfs.semanticscholar.org/6c14/8bd0cb1d42b070dacd8998477a675e8b3e32.pdf (accessed May 9, 2018).
[31] P.W. Xiao, J.Y. Jun, J. Cheng, P.H. Zheng, P.X. Zhi, High-temperature adsorption of carbon dioxide on mixed oxides derived from hydrotalcite-like compounds, Environ. Sci. Technol. 42 (2008) 614–618. doi:10.1021/es072085a.
[32] B. Vanwinsen, Exploring the Potential of the Radial Flow Packed Bed Reactor for the Capture of CO2 from Ambient Air, (2018).
[33] E. ToolBox, Gases-dynamic viscosity, (2014). https://www.engineeringtoolbox.com/gases-absolute-dynamic-viscosity-d_1888.html (accessed June 28, 2018).
[34] Engineering ToolBox, Air - Density, Specific Weight and Thermal Expansion Coefficient at Varying Temperature and Constant Pressures, (2003). https://www.engineeringtoolbox.com/air-density-specific-weight-d_600.html?vA=50&units=C# (accessed June 28, 2018).
[35] A. Zimmermann, M. Kant, T. Strunge, E. Tzimas, W. Leitner, W. Arlt, P. Styring, K. Arning, M. Ziefle, R. Meys, A. Kätelhön, A. Bardow, A. Castillo Castillo, N. Flanders, S. Marinić, S.-P. Mechnig, CO2 Utilisation Today - Report 2017, (2017) 45. doi:10.14279/depositonce-5806.
[36] C. Zhao, X. Chen, C. Zhao, Carbonation Behavior and the Reaction Kinetic of a New Dry Potassium-Based Sorbent for CO 2 Capture, (n.d.). doi:10.1021/ie302497r.

Biobased Chemistry and Technology (BCT) BSc thesis
16/18
Appendix A: Abbreviations
Abbreviation Full: AC Activated carbon CAIR Carbon from AIR CCS Carbon capture and storage DAC Direct air capture LH Langmuir-Hinshelwood MEA mono-ethanol-amine MOL Method of lines PBR Packed bed reactor PDE Partial differential equation
Appendix B: notation list Symbol Name Unit D Particle diameter (m) Deff Effective diffusion (m2 s-1) Dkn Knudsen diffusion (m2 s-1) Dm Molecular diffusion (m2 s-1) dp pore diameter (m) g geometry factor (-) Gi Diffusive mass flux (mole m-2 s-1) H Planck constant (m2 kg s-1) h height K2CO3 layer (m) Kb Boltzman constant (m2 kg s-2 K-1) Keqco2 Adsorption equilibrium constants CO2 (-) KeqH2O Adsorption equilibrium constants H2O (-) KR reaction rate constant (s-1) Mi Mole fraction (-) NT Total available K2CO3 (mole m-3) R gas constant (J mole-1 K-1) r radial dimension (m) Ri reaction (s-1) T temperature (K) t Time (s) Vs the superficial velocity of air (m s-1) VT Total volume (m3) Vv Void volume (m3) ε Porosity (-) εact activation energy (J mol-1) η Fraction available K2CO3 (-) μ viscosity (Pa s-1) ρ density (kg m-3) ρg density gas (kg m-3) τ Tortuosity (-) є bed porosity (-)

Biobased Chemistry and Technology (BCT) BSc thesis
17/18
Appendix C: Values and constants used Symbol Name Value H Planck constant 6.63*10-34 h height of K2CO3 layer 1.0 (nm) L Height of bed 0.15 (m)[32] Vs Superficial velocity 0.4 (m s-1) εb Porosity bed 0.37 (-) μ Gas viscosity 1.96E-5 (Pa s-1)[33] ρg Gas density 1.225 (kg m-3)[34]

Biobased Chemistry and Technology (BCT) BSc thesis
18/18