bsi-hsi activity eval report 2014-final
TRANSCRIPT

________________________________________________________________________
Institutional Research & Planning; BSI-HSI Activity Evaluation Report 2014
BSI-HSI Activity Evaluation Report 2014
Institutional Research and Planning
Palomar College

________________________________________________________________________
Institutional Research & Planning; BSI-HSI Activity Evaluation Report 2014
Table of Contents
INTRODUCTION .............................................................................................................. 1
BASIC SKILLS STUDENTS ............................................................................................. 2
Placement ........................................................................................................................ 2
Basic Skills Course Taking ............................................................................................. 4
Student Characteristics .................................................................................................... 9
Progress through Basic Skills Sequences ...................................................................... 12
LEARNING COMMUNITIES ......................................................................................... 16
Learning Communities Use ........................................................................................... 16
Use and Student Demographics ................................................................................. 17
Learning Communities Impact ...................................................................................... 18
Success and Retention ............................................................................................... 19
Persistence ................................................................................................................. 25
Learning Communities Student Survey ........................................................................ 26
Data ............................................................................................................................ 26
Results ....................................................................................................................... 27
Satisfaction ............................................................................................................ 27
Education Plans and Goals .................................................................................. 30
Integrative Learning and Assignments ................................................................. 34
Benefit of Learning Community Participation ...................................................... 38
Comments .............................................................................................................. 39
Learning Communities Summary ................................................................................. 46
TEACHING AND LEARNING CENTER ...................................................................... 47
TLC Use ........................................................................................................................ 47
Students, Time, and Visits ......................................................................................... 47
Student Characteristics .............................................................................................. 53

________________________________________________________________________
Institutional Research & Planning; BSI-HSI Activity Evaluation Report 2014
TLC Impact ................................................................................................................... 62
TLC Summary ............................................................................................................... 68
TUTORING ...................................................................................................................... 69
Tutoring Use .................................................................................................................. 69
Student Characteristics .............................................................................................. 72
Tutoring Impact ............................................................................................................. 75
English Success and Retention .................................................................................. 76
Math Success and Retention ...................................................................................... 79
Tutoring Summary ........................................................................................................ 82
SUMMER BRIDGE ......................................................................................................... 83
Summer Bridge Use ...................................................................................................... 83
Summer Bridge Impact ................................................................................................. 84
Fall Enrollment .......................................................................................................... 84
Success and Retention ............................................................................................... 85
Summer Bridge Survey ................................................................................................. 86
Data ............................................................................................................................ 86
Results ....................................................................................................................... 87
Satisfaction ............................................................................................................ 87
Preparedness......................................................................................................... 89
Knowledge............................................................................................................. 91
Instruction Modalities ........................................................................................... 92
Benefit ................................................................................................................... 96
Improvement ....................................................................................................... 100
Summer Bridge Summary ........................................................................................... 103
SUMMARY .................................................................................................................... 104
APPENDIX A: LEARNING COMMUNITIES QUESTIONNAIRE ITEMS ............... 105
APPENDIX B: SUMMER BRIDGE QUESTIONNAIRE ITEMS................................ 112

________________________________________________________________________
Institutional Research & Planning; BSI-HSI Activity Evaluation Report 2014 1
INTRODUCTION
The Basic Skills Initiative/Title V Hispanic Serving Institution Steering Committee is charged with implementing a broad collection of activities and services geared toward improving student outcomes for basic skills and disadvantaged students. As part of the effort to make ongoing improvements to these activities and services, the Office of Institutional Research and Planning has collected data relevant to some of these components. The current focus of this study is on (1) Learning Communities, (2), the Teaching and Learning Center, (3) Tutoring, and (4) Summer Bridge. This report summarizes the data gathered in this effort.

________________________________________________________________________
Institutional Research & Planning; BSI-HSI Activity Evaluation Report 2014 2
BASIC SKILLS STUDENTS
Before focusing on the activities, it may be informative to examine some data regarding basic skills students. Therefore, this section presents data regarding placement, basic skills course taking, and some demographics of basic skills students
Placement
For the purposes of this report, basic skills students are defined as students who are taking a basic skills course (regardless of placement). So, a basic skills student is one who in a given term is taking a course numbered below 50. However, it is still useful to consider the placement of our students. The numbers of placements per academic year are shown in Table BS1.
English ESL Math Reading2009-10 9,022 2,314 9,558 9,0132010-11 8,801 1,894 9,103 8,8002011-12 7,969 1,650 8,575 7,9672012-13 7,714 1,604 8,251 7,711
SubjectAcademic Year
Table BS1. Placements by Academic Year
Tables BS2 through BS5 display the levels at which students were placed in each subject area. For English, two out of five of those assessed were placed at transfer level. For math, approximately 11-12% were placed at transfer level. However, for reading, two-thirds were placed at transfer level. Of the ESL placements, half were at seven or eight levels below college level.
English Placement Level 2009-10 2010-11 2011-12 2012-13100+ - Transfer Level 39.6% 39.7% 39.0% 38.6%50 - 1 Level Below Transfer 26.1% 26.2% 26.8% 26.7%10 - 2 Levels Below Transfer 34.3% 34.1% 34.2% 34.7%Total 100.0% 100.0% 100.0% 100.0%
Table BS2. English Placement Level by Academic Year

________________________________________________________________________
Institutional Research & Planning; BSI-HSI Activity Evaluation Report 2014 3
ESL Placement Level 2009-10 2010-11 2011-12 2012-13103 - 1 Level Prior to College 3.5% 4.1% 4.0% 4.6%102 - 2 Levels Prior to College 4.4% 4.1% 5.3% 4.8%101 - 3 Levels Prior to College 8.0% 7.6% 9.4% 8.9%36/55 - 4 Levels Prior to College 12.3% 10.0% 10.4% 11.3%35/45 - 5 Levels Prior to College 11.8% 11.4% 12.4% 12.3%34 - 6 Levels Prior to College 10.7% 10.8% 10.8% 12.5%3 - 7 Levels Prior to College 14.3% 16.2% 14.5% 13.0%1 & 2 - 8 Levels Prior to College 35.0% 35.9% 33.2% 32.6%Total 100.0% 100.0% 100.0% 100.0%
Table BS3. ESL Placement Level by Academic Year
Math Placement Level 2009-10 2010-11 2011-12 2012-13100+ - Transfer Level 12.2% 11.2% 10.9% 11.2%60 - 1 Level Below Transfer 12.1% 12.5% 12.8% 12.8%56 - 1 Level Below Transfer 7.0% 7.5% 8.1% 7.9%50 - 2 Levels Below Transfer 12.6% 21.9% 22.2% 22.3%15 - 3 Levels Below Transfer 54.1% 46.9% 46.0% 45.7%10 - 4 Levels Below Transfer 1.9% 0.1% 0.0% 0.0%Total 100.0% 100.0% 100.0% 100.0%
Table BS4. Math Placement Level by Academic Year
Reading Placement Level 2009-10 2010-11 2011-12 2012-13110 - Transfer Level 67.6% 68.0% 67.5% 66.7%50 - 1 Level Below Transfer 27.4% 27.1% 28.0% 28.3%30 - 2 Levels Below Transfer 5.0% 4.9% 4.6% 5.0%Total 100.0% 100.0% 100.0% 100.0%
Table BS5. Reading Placement Level by Academic Year

________________________________________________________________________
Institutional Research & Planning; BSI-HSI Activity Evaluation Report 2014 4
Basic Skills Course Taking
The enrollments at different levels below transfer are summarized in Table BS6. Approximately one in ten enrollments were below transfer level. Just over two percent of enrollments are three levels below transfer or lower.
None One Two Three Four Five Six Total2009-10
Fall 89.1% 4.1% 4.0% 2.1% 0.4% 0.1% 0.1% 100.0%Spring 90.8% 3.8% 3.2% 1.8% 0.2% 0.1% 0.1% 100.0%
2010-11Fall 89.0% 4.3% 3.9% 2.1% 0.4% 0.1% 0.1% 100.0%Spring 90.1% 4.2% 3.5% 1.7% 0.2% 0.1% 0.1% 100.0%
2011-12Fall 88.8% 4.6% 4.2% 1.9% 0.3% 0.2% 0.0% 100.0%Spring 89.7% 4.6% 3.5% 1.8% 0.2% 0.2% 0.0% 100.0%
2012-13Fall 88.2% 4.8% 4.4% 2.1% 0.3% 0.2% 0.0% 100.0%Spring 89.4% 4.7% 3.6% 2.0% 0.2% 0.1% 0.0% 100.0%
2013-14Fall 88.5% 4.9% 4.1% 2.0% 0.3% 0.2% 0.0% 100.0%
Table BS6. Enrollments by Levels Below Transfer
Levels Below TransferTerm

________________________________________________________________________
Institutional Research & Planning; BSI-HSI Activity Evaluation Report 2014 5
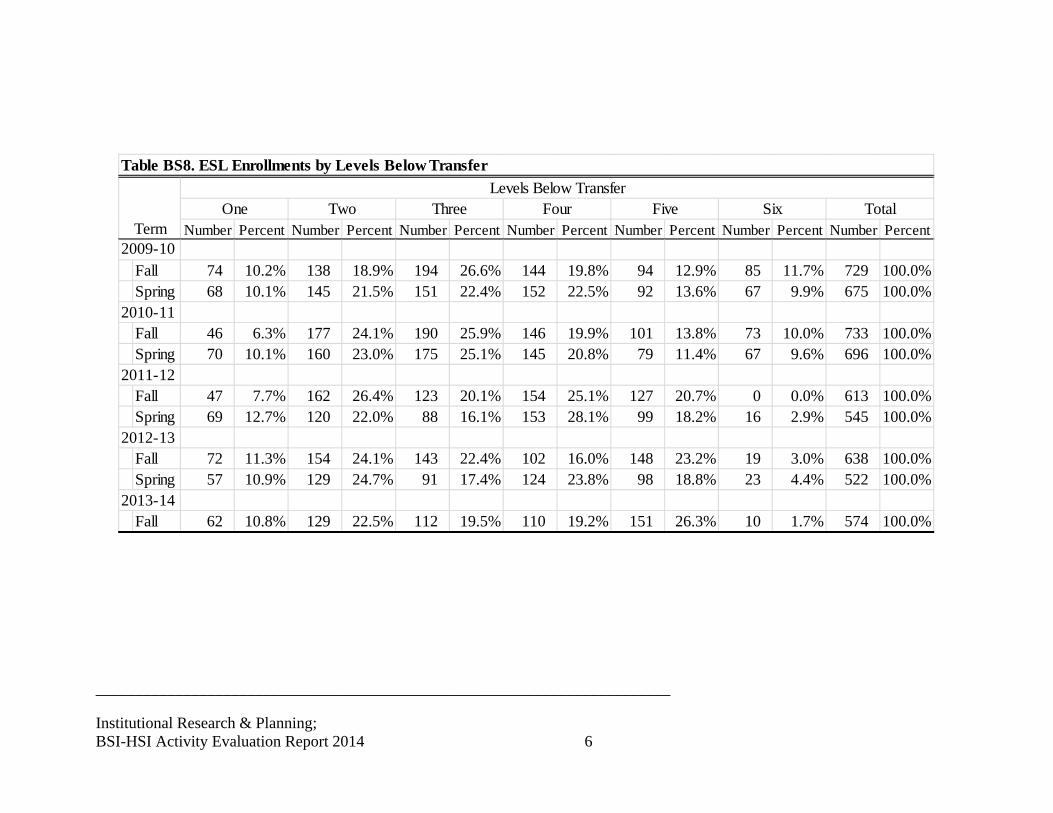
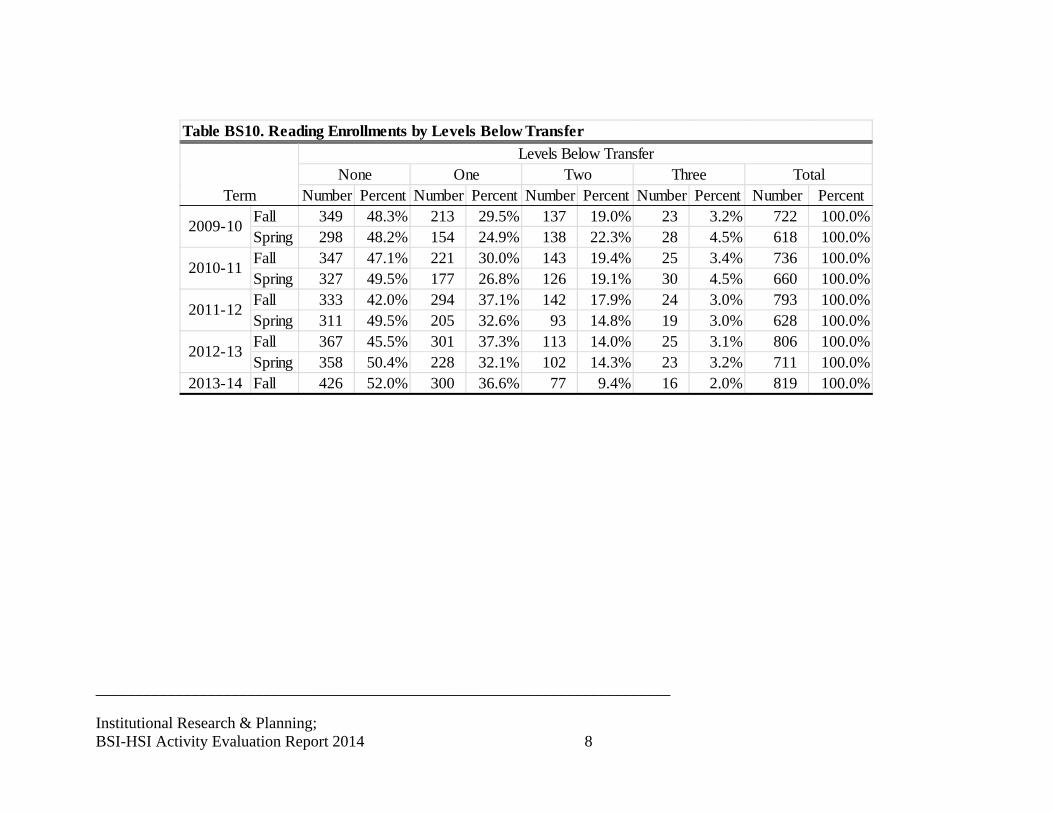
Table BS7 shows English enrollments by levels below transfer. About 37 percent of English enrollments were one or two levels below transfer. Table BS8 shows the ESL enrollments, all of which are below college level. Nearly two-thirds of math enrollments were below transfer level, as indicated in Table BS9. Just under half of the reading enrollments are at transfer level. This is seen in Table BS10.
Number Percent Number Percent Number Percent Number PercentFall 2,664 60.0% 889 20.0% 886 20.0% 4,439 100.0%Spring 2,621 67.1% 745 19.1% 542 13.9% 3,908 100.0%Fall 2,532 59.8% 885 20.9% 815 19.3% 4,232 100.0%Spring 2,858 65.5% 892 20.5% 611 14.0% 4,361 100.0%Fall 2,652 61.4% 881 20.4% 783 18.1% 4,316 100.0%Spring 3,014 66.0% 915 20.0% 635 13.9% 4,564 100.0%Fall 2,879 62.9% 929 20.3% 767 16.8% 4,575 100.0%Spring 3,117 66.7% 956 20.5% 601 12.9% 4,674 100.0%
2013-14
Fall 2,949 62.0% 988 20.8% 819 17.2% 4,756 100.0%
2012-13
2011-12
Table BS7. English Enrollments by Levels Below Transfer
2009-10
2010-11
None One Two TotalTerm
Levels Below Transfer
________________________________________________________________________
Institutional Research & Planning; BSI-HSI Activity Evaluation Report 2014 6
Number Percent Number Percent Number Percent Number Percent Number Percent Number Percent Number Percent
Fall 74 10.2% 138 18.9% 194 26.6% 144 19.8% 94 12.9% 85 11.7% 729 100.0%Spring 68 10.1% 145 21.5% 151 22.4% 152 22.5% 92 13.6% 67 9.9% 675 100.0%
Fall 46 6.3% 177 24.1% 190 25.9% 146 19.9% 101 13.8% 73 10.0% 733 100.0%Spring 70 10.1% 160 23.0% 175 25.1% 145 20.8% 79 11.4% 67 9.6% 696 100.0%
2011-12Fall 47 7.7% 162 26.4% 123 20.1% 154 25.1% 127 20.7% 0 0.0% 613 100.0%Spring 69 12.7% 120 22.0% 88 16.1% 153 28.1% 99 18.2% 16 2.9% 545 100.0%
2012-13Fall 72 11.3% 154 24.1% 143 22.4% 102 16.0% 148 23.2% 19 3.0% 638 100.0%Spring 57 10.9% 129 24.7% 91 17.4% 124 23.8% 98 18.8% 23 4.4% 522 100.0%
2013-14Fall 62 10.8% 129 22.5% 112 19.5% 110 19.2% 151 26.3% 10 1.7% 574 100.0%
2010-11
TermOne Two
Table BS8. ESL Enrollments by Levels Below Transfer
TotalFive SixLevels Below Transfer
2009-10
Three Four

________________________________________________________________________
Institutional Research & Planning; BSI-HSI Activity Evaluation Report 2014 7
Number Percent Number Percent Number Percent Number Percent Number Percent Number PercentFall 2,470 34.0% 1,731 23.8% 1,684 23.2% 1,243 17.1% 133 1.8% 7,261 100.0%Spring 2,301 37.1% 1,558 25.1% 1,300 21.0% 1,044 16.8% 0 0.0% 6,203 100.0%Fall 2,450 34.7% 1,789 25.3% 1,529 21.6% 1,182 16.7% 118 1.7% 7,068 100.0%Spring 2,476 37.9% 1,684 25.7% 1,429 21.9% 951 14.5% 0 0.0% 6,540 100.0%Fall 2,649 36.4% 1,774 24.4% 1,642 22.6% 1,133 15.6% 70 1.0% 7,268 100.0%Spring 2,533 37.7% 1,761 26.2% 1,396 20.8% 1,020 15.2% 0 0.0% 6,710 100.0%Fall 2,746 36.7% 1,756 23.5% 1,749 23.4% 1,157 15.5% 66 0.9% 7,474 100.0%Spring 2,946 39.4% 1,835 24.5% 1,525 20.4% 1,170 15.7% 0 0.0% 7,476 100.0%
2013-14
Fall 3,135 39.5% 1,875 23.7% 1,698 21.4% 1,155 14.6% 65 0.8% 7,928 100.0%
2012-13
2011-12
2009-10
2010-11
Table BS9. MATH Enrollments by Levels Below Transfer
Levels Below TransferThree Four Total
TermNone One Two
________________________________________________________________________
Institutional Research & Planning; BSI-HSI Activity Evaluation Report 2014 8
Number Percent Number Percent Number Percent Number Percent Number PercentFall 349 48.3% 213 29.5% 137 19.0% 23 3.2% 722 100.0%Spring 298 48.2% 154 24.9% 138 22.3% 28 4.5% 618 100.0%Fall 347 47.1% 221 30.0% 143 19.4% 25 3.4% 736 100.0%Spring 327 49.5% 177 26.8% 126 19.1% 30 4.5% 660 100.0%Fall 333 42.0% 294 37.1% 142 17.9% 24 3.0% 793 100.0%Spring 311 49.5% 205 32.6% 93 14.8% 19 3.0% 628 100.0%Fall 367 45.5% 301 37.3% 113 14.0% 25 3.1% 806 100.0%Spring 358 50.4% 228 32.1% 102 14.3% 23 3.2% 711 100.0%
2013-14 Fall 426 52.0% 300 36.6% 77 9.4% 16 2.0% 819 100.0%
2012-13
2011-12
2009-10
2010-11
Table BS10. Reading Enrollments by Levels Below Transfer
Levels Below TransferThree Total
TermNone One Two

________________________________________________________________________
Institutional Research & Planning; BSI-HSI Activity Evaluation Report 2014 9
Student Characteristics
This section presents some characteristics of those students enrolled in basic skills courses at Palomar College. Table BS11 shows the gender distribution of basic skills and non-basic skills students. Basic skills students were more likely than other students to be female. Table BS12 shows that basic skills students were more likely to be Hispanic and less likely to be white compared to other students. Basic skills students were also much more likely to be first-time students, as indicated in Table BS13.
Female Male Unknown Total TotalNo 45.6% 53.8% 0.5% 100.0% 20,808Yes 53.8% 45.8% 0.4% 100.0% 5,921No 46.0% 53.5% 0.6% 100.0% 20,560Yes 52.6% 47.0% 0.5% 100.0% 5,076No 44.7% 54.7% 0.6% 100.0% 19,892Yes 51.9% 47.6% 0.5% 100.0% 5,775No 44.9% 54.5% 0.6% 100.0% 20,124Yes 51.5% 48.1% 0.4% 100.0% 5,343No 43.9% 55.5% 0.6% 100.0% 19,065Yes 50.6% 48.8% 0.6% 100.0% 5,687No 44.1% 55.3% 0.6% 100.0% 19,085Yes 50.9% 48.5% 0.6% 100.0% 5,323No 44.2% 55.3% 0.5% 100.0% 18,423Yes 50.8% 48.6% 0.6% 100.0% 5,809No 44.2% 55.3% 0.4% 100.0% 18,871Yes 49.7% 49.8% 0.5% 100.0% 5,589No 42.5% 57.0% 0.5% 100.0% 18,974Yes 48.5% 51.0% 0.5% 100.0% 5,769
2013-14
Spring
Fall
2012-13
2011-12Spring
Fall
Fall
2009-10
2010-11
Fall
Spring
Fall
Spring
TermCurrent Basic Skills Student
Gender
Table BS11. Gender by Academic Year

________________________________________________________________________
Institutional Research & Planning; BSI-HSI Activity Evaluation Report 2014 10
African American
Asian & Pacific
Islander Filipino HispanicMulti Ethnic
Native American Unknown White Total Total
No 3.9% 6.1% 3.4% 27.6% 2.4% 1.0% 8.8% 46.8% 100.0% 20,808Yes 4.4% 6.6% 2.9% 41.3% 2.7% 0.6% 4.9% 36.5% 100.0% 5,921No 3.5% 6.3% 3.3% 28.3% 2.6% 0.9% 8.2% 47.0% 100.0% 20,560Yes 4.6% 7.0% 2.6% 42.9% 2.6% 0.7% 4.8% 34.8% 100.0% 5,076No 3.5% 5.9% 3.3% 28.4% 2.9% 0.9% 7.5% 47.6% 100.0% 19,892Yes 3.9% 5.9% 2.3% 42.9% 3.3% 0.7% 4.1% 36.9% 100.0% 5,775No 3.5% 5.8% 3.0% 29.1% 3.1% 1.0% 7.3% 47.0% 100.0% 20,124Yes 4.1% 6.0% 2.4% 43.5% 3.0% 0.8% 4.3% 35.9% 100.0% 5,343No 3.4% 5.6% 3.1% 30.2% 3.4% 0.8% 6.6% 46.9% 100.0% 19,065Yes 3.5% 6.0% 2.8% 43.6% 3.9% 0.8% 3.7% 35.7% 100.0% 5,687No 3.2% 5.5% 3.1% 31.1% 3.7% 0.9% 6.3% 46.1% 100.0% 19,085Yes 3.8% 6.0% 2.8% 45.8% 3.8% 0.8% 3.8% 33.2% 100.0% 5,323No 3.5% 5.6% 3.1% 31.6% 3.8% 0.9% 6.0% 45.5% 100.0% 18,423Yes 3.5% 5.6% 2.5% 46.7% 4.1% 0.8% 3.3% 33.5% 100.0% 5,809No 3.3% 5.7% 3.3% 33.0% 3.6% 0.9% 5.9% 44.3% 100.0% 18,871Yes 3.9% 5.3% 2.7% 47.3% 4.4% 0.8% 3.4% 32.2% 100.0% 5,589No 3.1% 5.3% 3.2% 33.3% 3.9% 0.8% 5.6% 44.6% 100.0% 18,974Yes 3.9% 5.9% 2.0% 48.0% 4.5% 0.7% 2.9% 32.0% 100.0% 5,769
2013-14
Spring
Fall
2012-13
Ethnicity
2011-12
Spring
Fall
Fall
Table BS12. Race & Ethnicity by Academic Year
2010-11
Fall
Spring
Term
Current Basic Skills
Student
2009-10
Fall
Spring

________________________________________________________________________
Institutional Research & Planning; BSI-HSI Activity Evaluation Report 2014 11
First-time Student
First-time Transfer
StudReturning Student
Continuing Student
Special Admit Total Total
No 16.5% 7.8% 14.9% 56.8% 4.0% 100.0% 20,808Yes 45.0% 3.0% 8.5% 42.1% 1.4% 100.0% 5,921No 7.6% 5.5% 12.5% 69.2% 5.1% 100.0% 20,560Yes 9.9% 2.0% 9.0% 77.1% 2.0% 100.0% 5,076No 15.7% 7.6% 15.7% 57.2% 3.8% 100.0% 19,892Yes 38.4% 2.8% 9.5% 47.8% 1.5% 100.0% 5,775No 6.8% 5.4% 13.2% 69.7% 4.9% 100.0% 20,124Yes 10.6% 2.4% 8.8% 76.4% 1.8% 100.0% 5,343No 14.4% 8.0% 14.1% 59.9% 3.6% 100.0% 19,065Yes 35.0% 3.9% 10.1% 50.0% 1.0% 100.0% 5,687No 6.2% 5.6% 12.6% 71.2% 4.3% 100.0% 19,085Yes 9.5% 2.8% 7.9% 78.0% 1.7% 100.0% 5,323No 14.7% 7.9% 14.8% 59.5% 3.1% 100.0% 18,423Yes 35.6% 3.8% 8.9% 50.6% 1.1% 100.0% 5,809No 6.4% 5.9% 13.4% 70.5% 3.7% 100.0% 18,871Yes 9.9% 2.1% 9.8% 76.6% 1.7% 100.0% 5,589No 14.6% 7.9% 15.4% 59.1% 3.0% 100.0% 18,974Yes 36.1% 3.2% 10.1% 49.2% 1.4% 100.0% 5,769
TermCurrent Basic Skills Student
2009-10Fall
Spring
Table BS13. Enrollment Status by Academic Year
Enrollment Status
Fall
Spring
Fall
2013-14
Spring
Fall
2012-13
Spring
Fall
2011-12
2010-11

________________________________________________________________________
Institutional Research & Planning; BSI-HSI Activity Evaluation Report 2014 12
Progress through Basic Skills Sequences
It is useful to consider the flow of students through the basic skills sequences.1 The following table show, for students starting in Fall 2009 or Fall 2010, progress made through the basic skills sequences in three academic years. Table BS14 summarizes progress for students starting at one level below transfer in reading (Reading 50 – Reading Improvement). (Few students started at a level lower than one level below transfer, so these levels are not examined for this report.) The figure shows that by the end of three years four-fifths of those who had started in Reading 50 successfully passed Reading 50. Only 27.3% to 30.2$ of the students in the cohort enrolled in transfer-level reading (Reading 110, 115, or 120) within three years, and under a quarter of the students passed a transfer-level reading course successfully within the three-year time frame.
Student Success Student SuccessNumber 209 171 57 45% of Cohort 100.0% 81.8% 27.3% 21.5%Number 215 168 65 55% of Cohort 100.0% 78.1% 30.2% 25.6%
Cohort
Table BS14. Reading Basic Skills Progress (Ns=209, 215)One Level Below
Transfer TransferableEntry Level
Fall 2010-Spring 2013
Fall 2009-Spring 2012
One Level Below Transfer
1 These results come from the Basic Skills Cohort Tracker on the Chancellor’s Office website (http://datamart.cccco.edu/Outcomes/BasicSkills_Cohort_Tracker.aspx).
________________________________________________________________________
Institutional Research & Planning; BSI-HSI Activity Evaluation Report 2014 13
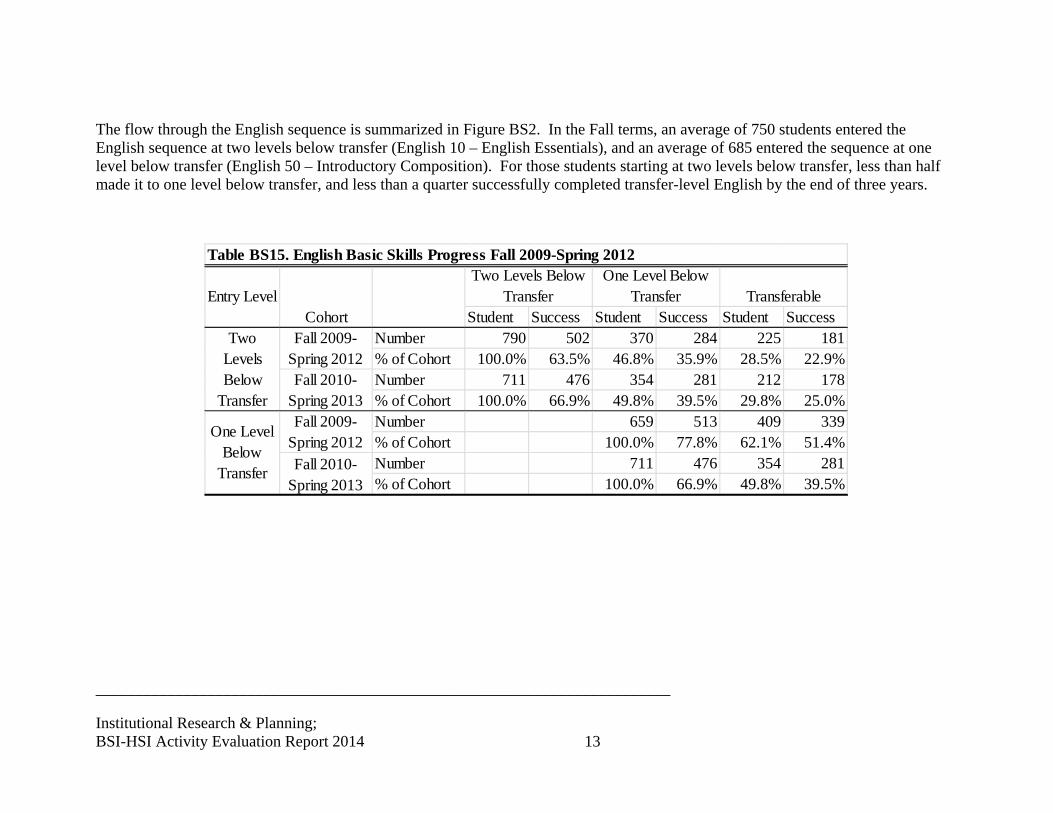
The flow through the English sequence is summarized in Figure BS2. In the Fall terms, an average of 750 students entered the English sequence at two levels below transfer (English 10 – English Essentials), and an average of 685 entered the sequence at one level below transfer (English 50 – Introductory Composition). For those students starting at two levels below transfer, less than half made it to one level below transfer, and less than a quarter successfully completed transfer-level English by the end of three years.
Student Success Student Success Student SuccessNumber 790 502 370 284 225 181% of Cohort 100.0% 63.5% 46.8% 35.9% 28.5% 22.9%Number 711 476 354 281 212 178% of Cohort 100.0% 66.9% 49.8% 39.5% 29.8% 25.0%Number 659 513 409 339% of Cohort 100.0% 77.8% 62.1% 51.4%Number 711 476 354 281% of Cohort 100.0% 66.9% 49.8% 39.5%
Table BS15. English Basic Skills Progress Fall 2009-Spring 2012One Level Below
Transfer Transferable Cohort
Two Levels Below Transfer Entry Level
Two Levels Below
Transfer
One Level Below
Transfer
Fall 2009-Spring 2012Fall 2010-
Spring 2013Fall 2009-
Spring 2012Fall 2010-
Spring 2013
________________________________________________________________________
Institutional Research & Planning; BSI-HSI Activity Evaluation Report 2014 14
For the 2009 cohort, a total of 114 students entered the math sequence four levels below transfer (Math 10 – Basic Arithmetic); 995 students entered three levels below transfer (Math 15 – Prealgebra); 894 entered two levels below transfer (Math 50 – Beginning Algebra); and 812 entered one level below transfer (Math 56 – Beginning/Intermediate Algebra and 60 – Intermediate Algebra). The 2010 cohort contained comparable numbers.
Table BS16 shows the success rates of students beginning in Fall 2009 and Fall 2010 as they progress through the math basic skills sequence. The table shows that for students starting three or four levels below transfer, about two-thirds of those students successfully pass the level at which they started by the end of three years, and about 5% pass a transfer-level math course. For those starting one level below, three quarters succeed at their starting level, and about 36% succeed at a transfer-level math course. In general, just over a third of the basic skills students successfully passed a course one level above where they started in the sequence within the time-frame of the study.

________________________________________________________________________
Institutional Research & Planning; BSI-HSI Activity Evaluation Report 2014 15
Students Success Students Success Students Success Students Success Students SuccessNumber 114 77 72 50 39 29 25 15 8 6% of Cohort 100.0% 67.5% 63.2% 43.9% 34.2% 25.4% 21.9% 13.2% 7.0% 5.3%Number 90 53 41 27 23 13 11 9 5 4% of Cohort 100.0% 58.9% 45.6% 30.0% 25.6% 14.4% 12.2% 10.0% 5.6% 4.4%Number 995 656 519 349 277 193 79 46% of Cohort 100.0% 65.9% 52.2% 35.1% 27.8% 19.4% 7.9% 4.6%Number 960 661 523 351 298 206 83 53% of Cohort 100.0% 68.9% 54.5% 36.6% 31.0% 21.5% 8.6% 5.5%Number 894 654 392 286 179 120% of Cohort 100.0% 73.2% 43.8% 32.0% 20.0% 13.4%Number 773 557 453 336 194 133% of Cohort 100.0% 72.1% 58.6% 43.5% 25.1% 17.2%Number 812 613 397 294% of Cohort 100.0% 75.5% 48.9% 36.2%Number 799 589 375 282% of Cohort 100.0% 73.7% 46.9% 35.3%
Table BS16. Math Basic Skills Progress
2010
2009
2010
Entry Level
Four Levels Below Transfer
Fall Cohort Year
Four Levels Below Transfer Three Levels Below Transfer Two Levels Below Transfer One Level Below Transfer
2009
2009
2010
2009
2010
Transferable Two Levels Below
Transfer One Level Below
Transfer Three Levels Below
Transfer

________________________________________________________________________
Institutional Research & Planning; BSI-HSI Activity Evaluation Report 2014 16
LEARNING COMMUNITIES
Each learning community involves a set of linked courses that provide for a learning environment that fosters cohesion and engagement. This is accomplished by having the students take the set of courses together as a group, and typically faculty coordinate their efforts and present material integrated across courses.
Learning Communities Use
The number of learning communities at Palomar since the Fall 2009 semester has varied from four to ten. The enrollment in these learning communities is displayed in Figure L1. The number of students enrolled by term ranges from 86 to 299.
149
108124
86
141 139
289
143
299
0
50
100
150
200
250
300
350
Fall 09 Spring10
Fall 10 Spring11
Fall 11 Spring12
Fall 12 Spring13
Fall 13
Figure L1. Number of Patricipants in Learning Communities

________________________________________________________________________
Institutional Research & Planning; BSI-HSI Activity Evaluation Report 2014 17
Use and Student Demographics
This section examines certain student demographic characteristics of learning communities participants. Table L1 shows that learning communities participants were about evenly split between male and female. Table L2 reveals that in the learning communities, Hispanics were overrepresented while whites were underrepresented. Table L3 shows that learning communities students were considerably younger than the average student.
Gender No Yes No YesFemale 48.0% 50.7% 46.7% 43.1%Male 51.5% 48.6% 52.9% 56.5%Unknown 0.6% 0.7% 0.4% 0.3%Total 100.0% 100.0% 100.0% 100.0%Number 187,985 1,176 22,488 299
LC Member LC MemberPrevious Terms Fall'13
Table L1. Gender of Learning Communities Students
Ethnicity No Yes No YesAfrican American, Non-Hispanic 3.1% 4.1% 3.0% 5.0%Asian 4.8% 4.3% 4.9% 4.7%Filipino 2.9% 2.9% 3.0% 1.7%Hispanic 32.0% 52.8% 35.8% 50.8%Multi Ethnic 3.7% 3.9% 4.4% 5.7%Native American 0.8% 0.9% 0.7% 0.3%Pacific Islander 0.7% 0.8% 0.6% 0.3%White Non-Hisp 48.6% 28.5% 44.6% 30.8%Unknown 3.4% 1.9% 3.0% 0.7%Total 100.0% 100.0% 100.0% 100.0%Number 187,985 1,176 22,488 299
Previous Terms
Table L2. Race and Ethnicity of Learning Communities Students
LC Member
Fall'13
LC Member

________________________________________________________________________
Institutional Research & Planning; BSI-HSI Activity Evaluation Report 2014 18
Age Number Age NumberNo 26.0 187,985 25.6 22,488Yes 21.0 1,176 20.8 299
Previous Terms Fall'13
LC Member
Table L3. Age of Learning Communities Students
Learning Communities Impact
The impact of the learning communities was assessed, in part, by examining courses that were common to at least a few of the learning communities. Specifically, English 10 (English Essentials), English 50 (Introductory Composition), Math 15 (Pre-algebra), Math 50 (Beginning Algebra), and Reading 50 (Reading Improvement) were commonly included in the learning communities, so outcomes for students in those courses were examined. Three outcomes were of primary interest: success (receiving a grade of A, B, C, CR, or P), retention (completing the semester and receiving a grade), and persistence (receiving a grade in the following term).
________________________________________________________________________
Institutional Research & Planning; BSI-HSI Activity Evaluation Report 2014 19
Success and Retention
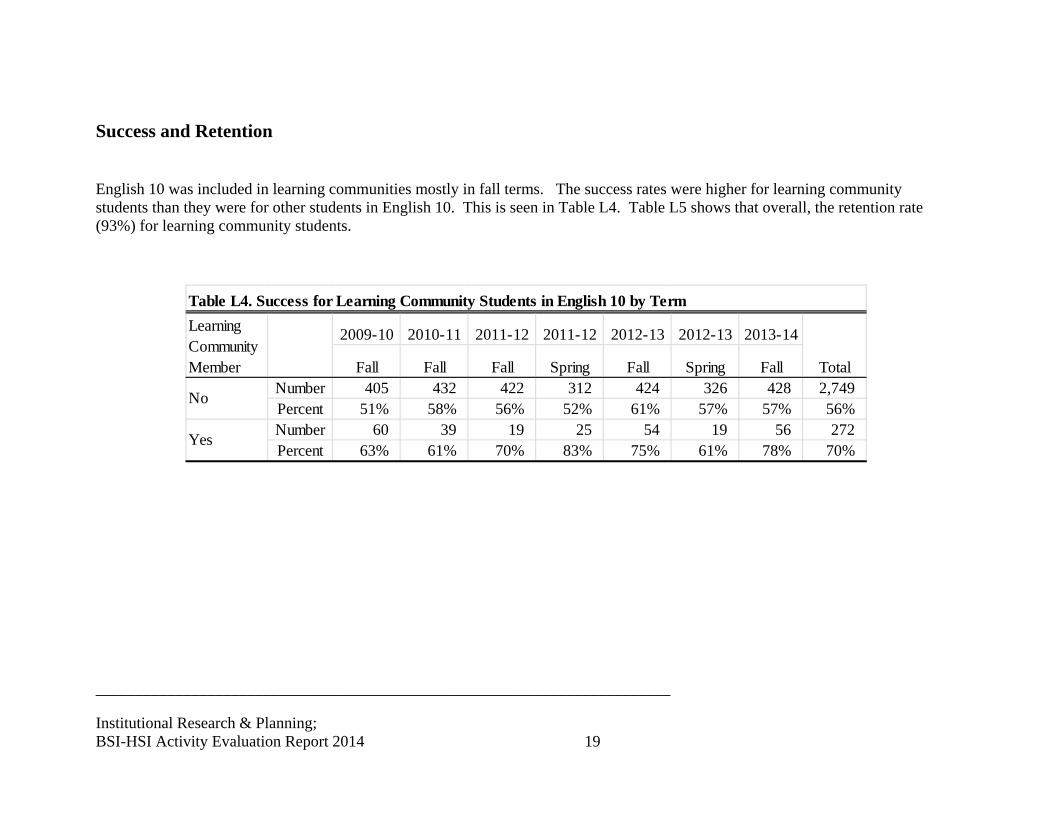
English 10 was included in learning communities mostly in fall terms. The success rates were higher for learning community students than they were for other students in English 10. This is seen in Table L4. Table L5 shows that overall, the retention rate (93%) for learning community students.
2009-10 2010-11 2011-12 2011-12 2012-13 2012-13 2013-14
Fall Fall Fall Spring Fall Spring FallNumber 405 432 422 312 424 326 428 2,749Percent 51% 58% 56% 52% 61% 57% 57% 56%Number 60 39 19 25 54 19 56 272Percent 63% 61% 70% 83% 75% 61% 78% 70%
No
Yes
Total
Learning Community Member
Table L4. Success for Learning Community Students in English 10 by Term

________________________________________________________________________
Institutional Research & Planning; BSI-HSI Activity Evaluation Report 2014 20
2009-10 2010-11 2011-12 2011-12 2012-13 2012-13 2013-14
Fall Fall Fall Spring Fall Spring FallNumber 730 697 709 572 634 526 675 4,543Percent 92% 93% 94% 95% 91% 92% 90% 92%Number 93 59 26 29 62 28 69 366Percent 98% 92% 96% 97% 86% 90% 96% 94%
Learning Community Member
No
Yes
Total
Table L5. Retention for Learning Community Students in English 10 by Term
Table L6 shows the success rates for English 50 students. Learning community students had a higher success rate than other English 50 students only in the Fall 2010, Fall 2011, and Spring 2013 terms. Table L7 shows that learning-community students had comparable retention rates to other English 50 students.
2013-14Fall Spring Fall Spring Fall Spring Fall Spring Fall
Number 612 451 649 580 594 615 665 594 665 5,425Percent 70% 65% 74% 71% 72% 69% 72% 64% 70% 70%Number 12 25 13 45 47 15 8 21 33 219Percent 60% 44% 93% 52% 80% 58% 53% 78% 69% 62%
Table L6. Success for Learning Community Students in English 50 by Term
Total2009-10 2010-11 2011-12 2012-13
Learning Community Member
No
Yes

________________________________________________________________________
Institutional Research & Planning; BSI-HSI Activity Evaluation Report 2014 21
2013-14Fall Spring Fall Spring Fall Spring Fall Spring Fall
Number 828 635 831 757 774 852 860 835 860 7,232Percent 95% 92% 95% 93% 94% 96% 94% 90% 91% 93%Number 19 51 14 77 57 25 14 26 44 327Percent 95% 89% 100% 90% 97% 96% 93% 96% 92% 93%
2012-13Total
2011-122009-10 2010-11
Yes
Learning Community Member
No
Table L7. Retention for Learning Community Students in English 50 by Term
The success and retention rates for students taking Math 15 are displayed in Tables L8 and L9. Generally, success was lower while retention was similar for learning community students compared to other Math 15 students.
2010-11 2013-14Fall Spring Fall Fall Spring Fall Spring Fall
Number 690 549 659 654 553 647 655 603 5,010Percent 61% 54% 59% 61% 55% 60% 98% 57% 58%Number 40 7 26 29 10 38 15 47 212Percent 45% 23% 53% 74% 56% 68% 2% 51% 53%
2012-132009-10 2011-12
Table L8. Success for Learning Community Students in Math 15 by Term
Total
Learning Community Member
No
Yes

________________________________________________________________________
Institutional Research & Planning; BSI-HSI Activity Evaluation Report 2014 22
2010-11 2013-14Fall Spring Fall Fall Spring Fall Spring Fall
Number 1,069 940 1,042 1,014 911 979 1,006 937 7,898Percent 94% 93% 94% 94% 91% 91% 98% 89% 92%Number 88 30 44 35 16 52 24 86 375Percent 99% 97% 90% 90% 89% 93% 2% 93% 94%
2009-10 2011-12
No
Yes
Learning Community Member
2012-13
Table L9. Retention for Learning Community Students in Math 15 by Term
Total

________________________________________________________________________
Institutional Research & Planning; BSI-HSI Activity Evaluation Report 2014 23
Table L10 shows that the success rate for Math 50 was at 57% for learning communities students and 52% for other Math 50 students. Table L11 shows that retention in Math 50 was similar between learning community and other Math 50 students.
2012-13 2013-14Fall Spring Fall Spring Fall Spring Fall Fall
Number 871 651 784 671 866 702 821 734 6,100Percent 54% 53% 54% 49% 56% 53% 51% 48% 52%Number 12 17 10 25 32 18 50 87 251Percent 60% 40% 33% 52% 68% 49% 61% 67% 57%
Learning Community Member Total
No
Yes
Table L10. Success for Learning Community Students in Math 50 by Term
2009-10 2010-11 2011-12
2012-13 2013-14Fall Spring Fall Spring Fall Spring Fall Fall
Number 1451 1111 1308 1223 1426 1,233 1,452 1,348 10,552Percent 90% 90% 91% 90% 93% 92% 90% 89% 91%Number 19 38 26 42 46 34 76 124 405Percent 95% 88% 87% 88% 98% 92% 93% 95% 93%
No
Yes
Learning Community Member Total
Table L11. Retention for Learning Community Students in Math 50 by Term
2009-10 2010-11 2011-12

________________________________________________________________________
Institutional Research & Planning; BSI-HSI Activity Evaluation Report 2014 24
Student outcomes for Reading 50 students are displayed in Tables L12 and L13. Generally, learning-community students enjoyed an advantage both in success rates and retention rates.
2013-14Fall Spring Fall Spring Fall Spring Fall Spring Fall
Number 79 95 120 97 164 86 157 107 141 1,046Percent 77% 73% 75% 73% 71% 64% 74% 61% 71% 71%Number 91 17 49 30 57 48 61 38 42 433Percent 83% 74% 82% 68% 90% 68% 69% 70% 74% 76%
Table L12. Success for Learning Community Students in Reading 50 by Term
Learning Community Member
No
Yes
2009-10 2010-11Total
2011-12 2012-13
2013-14Fall Spring Fall Spring Fall Spring Fall Spring Fall
Number 97 126 153 128 164 128 201 157 182 1,336Percent 94% 96% 95% 96% 71% 96% 94% 90% 91% 90%Number 109 23 56 40 57 70 75 48 54 532Percent 99% 100% 93% 91% 90% 99% 85% 89% 95% 93%
2009-10 2010-11 2011-12Total
2012-13
Table L13. Retention for Learning Community Students in Reading 50 by Term
No
Yes
Learning Community Member

________________________________________________________________________
Institutional Research & Planning; BSI-HSI Activity Evaluation Report 2014 25
Persistence
Table L14 shows the persistence rates for learning communities students as well as all other credit students. As is generally the case, fall-to-spring persistence was higher than spring-to-fall persistence for all students. The table reveals higher persistence rates for learning-community students compared to other students.
Fall Spring Fall Spring Fall Spring Spring SpringNumber 17,557 13,767 17,417 13,810 17,036 13,529 12,035 8,453 113,604Percent 66% 50% 68% 51% 69% 52% 46% 33% 54%Number 118 61 98 54 127 85 70 56 669Percent 79% 56% 79% 63% 90% 61% 50% 40% 65%
2011-122011-12
Total
Table L14. Persistence to Next Term Learning Community Member
No
Yes
2009-10 2010-11
________________________________________________________________________
Institutional Research & Planning; BSI-HSI Activity Evaluation Report 2014 26
Learning Communities Student Survey
The learning communities student survey is conducted at the end of each term. The survey is conducted in order to assess student satisfaction with the learning communities.
Data
Each of the learning communities was invited to participate in the survey. The survey is administered toward the end of the semester. A total of 177 students from the Fall 2013 learning communities completed the survey, and 788 overall. Data from the current term are compared to data from the learning communities of the previous terms.
The questionnaire for the survey was designed to assess the students’ satisfaction with the learning communities as well as some other constructs such as engagement, perceived support, and the benefit of participation in a learning community. The questions from the survey are found in Appendix A.

________________________________________________________________________
Institutional Research & Planning; BSI-HSI Activity Evaluation Report 2014 27
Results
Satisfaction Survey items were aggregated to form scales of (1) satisfaction with the learning communities, (2) engagement at the college, and (3) perceived support. The scales range from zero to ten, with higher numbers indicating more of the construct being measured. The items used to construct the scales are found in Appendix A. The responses are summarized in Figure LS1. Satisfaction with the learning communities was very high, with an average scale score of 8.2 on the 0-to-10 scale. Perceived support at the college was also very high.
8.27.0
8.38.26.5
8.3
.0
2.0
4.0
6.0
8.0
10.0
Satisfaction withLearning
Communities
Engagement Support
Figure LS1. Mean Ratings on Satisfaction, Engagement, and Support (N's = 177 & 613)
Current Term Previous Terms

________________________________________________________________________
Institutional Research & Planning; BSI-HSI Activity Evaluation Report 2014 28
The satisfaction items comprise one general measure of satisfaction along with seven items assessing satisfaction with specific elements of the learning communities. The mean scores for these items are found in Table LS1.
MeanOverall Satisfaction 8.30Satisfaction with Counseling Received 8.23Satisfaction with Tutoring 7.99Satisfaction with Faculty Availability 8.13Satisfaction with the Educational Experience 8.38Satisfaction with the Integration of Material across Courses
7.89
Satisfaction with Social Activities 7.96Satisfaction with Being with the Same Students in All the Classes
8.66
Table LS1. Satisfaction with Learning Communities (N=759)

________________________________________________________________________
Institutional Research & Planning; BSI-HSI Activity Evaluation Report 2014 29
Figure LS2 (which displays standardized regression weights) illustrates the relative strength of association between the satisfaction with the various elements and the general satisfaction measure. The figure reveals that satisfaction with the educational experience was by far the most closely associated with general satisfaction. Satisfaction with (a) being with the same students in all the classes and with (b) the integration of material across courses were also related to the general satisfaction measure.
.017.054 .057
.540
.137
.025
.153
.000
.100
.200
.300
.400
.500
.600
CounselingReceived
Tutoring* FacultyAvailability*
TheEducationalExperience*
TheIntegrationOf Material
AcrossCourses*
SocialActivities
Being WithThe SameStudents In
All TheClass*
Figure LS2. Association with General Satisfaction (N = 759)
What would you say has been the greatest benefit of participating in a learning community?
''building relationships with my professors and my classmates.''

________________________________________________________________________
Institutional Research & Planning; BSI-HSI Activity Evaluation Report 2014 30
Education Plans and Goals Respondents answered a set of questions regarding education plans and educational goals. Figure LS3 shows that roughly three quarters of the respondents had completed an education plan at the time of the survey, and in Fall 2013 one in ten didn’t know if they had completed an education plan.
71.2
18.610.2
76.2
17.16.7
0.0
10.0
20.0
30.0
40.0
50.0
60.0
70.0
80.0
Yes No Don't Know
Figure LS3. Completed an Education Plan by Term (Ns=177 & 609)
Current Term Previous Terms

________________________________________________________________________
Institutional Research & Planning; BSI-HSI Activity Evaluation Report 2014 31
Those who had completed an education plan were asked if they had completed it prior to the start of the learning community. Figure LS4 shows that almost two thirds (65.9%) of the learning community students in Fall 2013 who had completed an education plan had done so prior to the start of the learning community.
65.9
23.011.1
53.6
39.5
6.90.0
10.020.030.040.050.060.070.0
Yes No Don't Know
Figure LS4. Education Plan Was Completed prior to Entering the Learning Community by Term (Ns=126 &
463)
Current Term Previous Terms

________________________________________________________________________
Institutional Research & Planning; BSI-HSI Activity Evaluation Report 2014 32
Those who had not completed their education plan, as well as those who had completed it since they started in the learning community, were asked if participation in the learning community helped them make progress on their education plans. Their responses are summarized in Figure LS5. Two thirds of the respondents indicated that their participation in the learning community had helped them make progress on their education plan.
62.4
14.023.7
66.7
16.0 17.30.0
10.020.030.040.050.060.070.0
Yes No Don't Know
Figure LS5. Learning Community Helped Student Make Progress on an Education Plan by Term (Ns=93
& 294)
Current Term Previous Terms
What would you say has been the greatest benefit of participating in a learning community?
''The tutoring for math and its services and counseling became very helpful for understanding topics that webassign doesnt explain and counseling became useful for making my education plan''
________________________________________________________________________
Institutional Research & Planning; BSI-HSI Activity Evaluation Report 2014 33
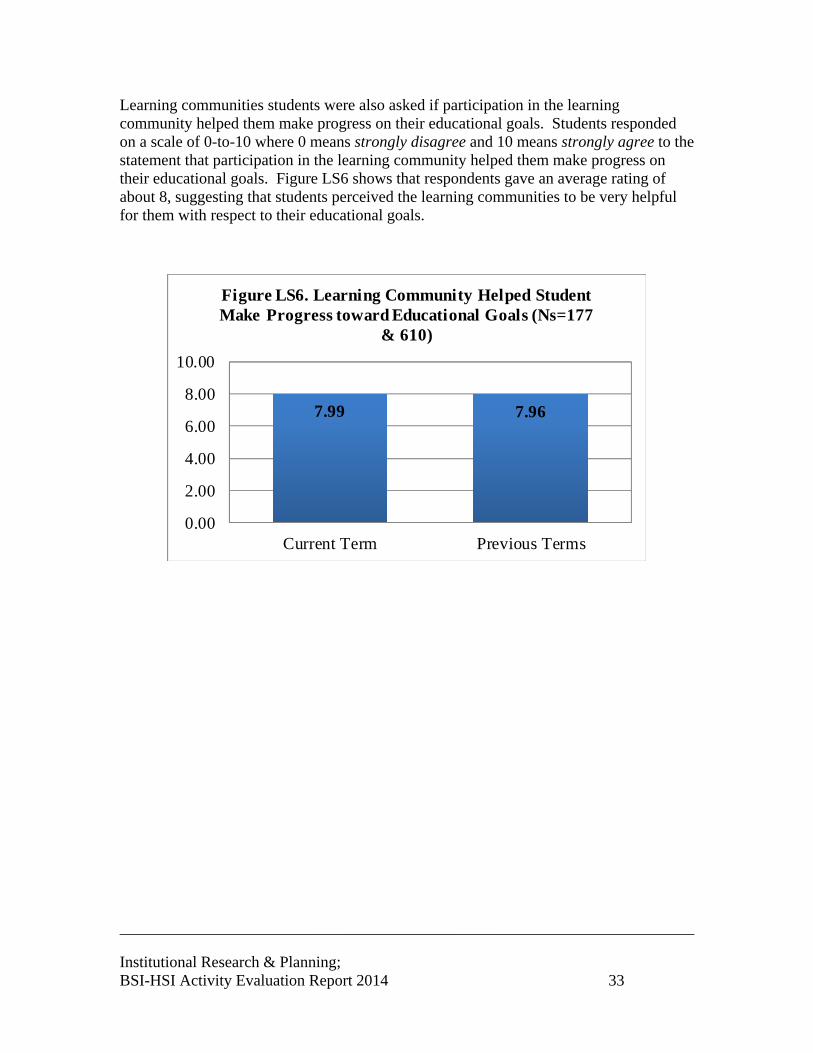
Learning communities students were also asked if participation in the learning community helped them make progress on their educational goals. Students responded on a scale of 0-to-10 where 0 means strongly disagree and 10 means strongly agree to the statement that participation in the learning community helped them make progress on their educational goals. Figure LS6 shows that respondents gave an average rating of about 8, suggesting that students perceived the learning communities to be very helpful for them with respect to their educational goals.
7.99 7.96
0.00
2.00
4.00
6.00
8.00
10.00
Current Term Previous Terms
Figure LS6. Learning Community Helped Student Make Progress toward Educational Goals (Ns=177
& 610)

________________________________________________________________________
Institutional Research & Planning; BSI-HSI Activity Evaluation Report 2014 34
Integrative Learning and Assignments Respondents were asked about the integration of material across courses in their learning communities. Specifically, they were asked to rate on a 0-to-10 scale, where 0 means not at all integrated and 10 means completely integrated, to what extent was the material integrated across their learning community courses. The average rating of 7.41 demonstrates that students perceived substantial integration of material across their learning-community courses. This is seen in Figure LS7.
7.41 7.44
0.00
2.00
4.00
6.00
8.00
10.00
Current Term Previous Terms
Figure LS7. Perceived Integration of Material across Courses (Ns = 158, 596)

________________________________________________________________________
Institutional Research & Planning; BSI-HSI Activity Evaluation Report 2014 35
Integrative Learning. Beginning with the Fall 2011 term, respondents were asked a set of questions regarding the extent to which participation in the learning communities resulted in integrative learning. For example, one question asked “How much have your learning community classes helped you become better at pulling different principles together?” These items were combined to form a scale ranging from 1 to 5, where higher numbers indicate greater integrative learning. Figure LS8 shows that students gave an average score of 3.65 on the 1-to-5 scale.
3.65 3.70
1.00
1.50
2.00
2.50
3.00
3.50
4.00
4.50
5.00
Current Term Previous Terms
Figure LS8. Integrative Learning (Ns = 177, 449)
________________________________________________________________________
Institutional Research & Planning; BSI-HSI Activity Evaluation Report 2014 36
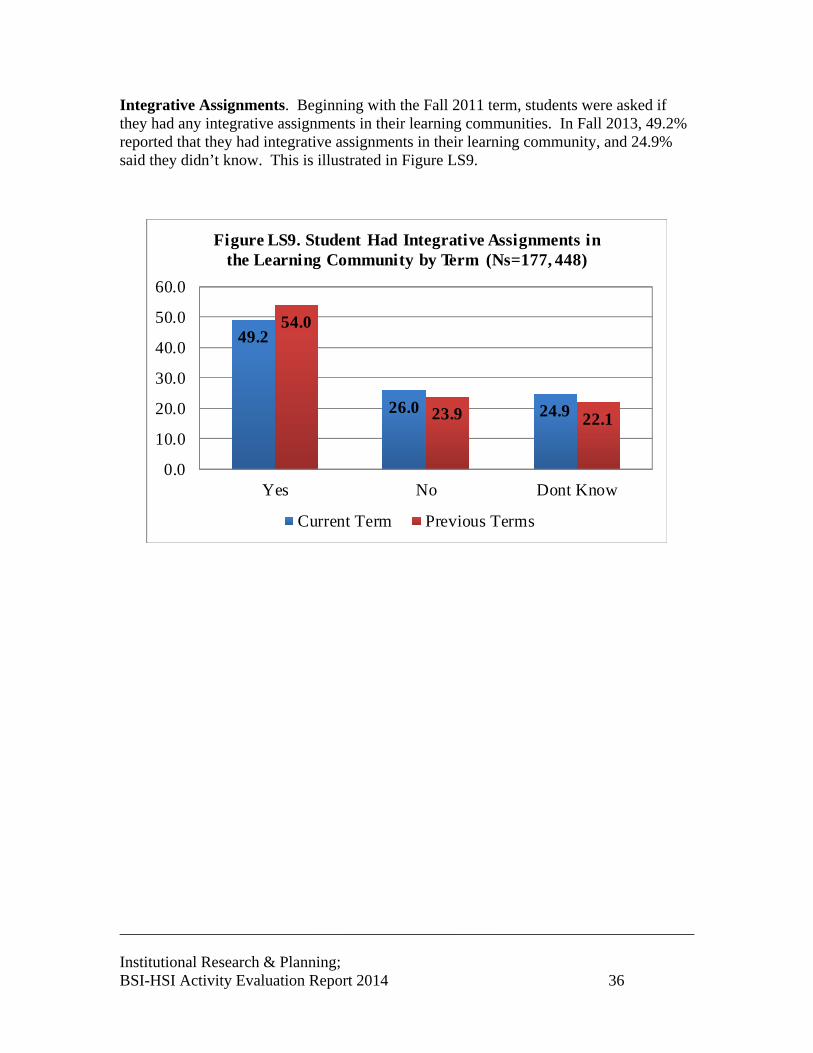
Integrative Assignments. Beginning with the Fall 2011 term, students were asked if they had any integrative assignments in their learning communities. In Fall 2013, 49.2% reported that they had integrative assignments in their learning community, and 24.9% said they didn’t know. This is illustrated in Figure LS9.
49.2
26.0 24.9
54.0
23.9 22.1
0.0
10.0
20.0
30.0
40.0
50.0
60.0
Yes No Dont Know
Figure LS9. Student Had Integrative Assignments in the Learning Community by Term (Ns=177, 448)
Current Term Previous Terms

________________________________________________________________________
Institutional Research & Planning; BSI-HSI Activity Evaluation Report 2014 37
Those students who indicated that they had integrative assignments in their learning community were asked about their attitudes regarding those integrative assignments. Each of these attitudes were measured using a 0-to-10 scale. Their responses are summarized in Table LS2. Their responses reveal very positive attitudes about these assignments. Table LS3 shows these attitudes are highly correlated.
Mean Count Mean CountWere Enjoyable 7.63 87 7.88 242Made Learning Easier 7.64 87 7.65 242Were Effective 7.70 87 7.76 242Made The Assignments More Meaningful 7.78 87 7.74 242Were Interesting 7.74 87 7.85 242
Current Term Previous TermsIntegrative assignments …
Table LS2. Attitudes about Integrative Assignments
Integrative assignments … Enjoyable Easier Effective Meaningful InterestingWere Enjoyable 1.000 .763 .810 .788 .839Made Learning Easier .763 1.000 .770 .811 .778Were Effective .810 .770 1.000 .789 .787Made The Assignments More Meaningful
.788 .811 .789 1.000 .798
Were Interesting .839 .778 .787 .798 1.000
Table LS3. Correlations among Integrative Assignments Attiutudes (N = 329)
What would you say has been the greatest benefit of participating in a learning community?
''Having both teachers communicate so it makes it easier to know what I am doing in both classes.''
________________________________________________________________________
Institutional Research & Planning; BSI-HSI Activity Evaluation Report 2014 38
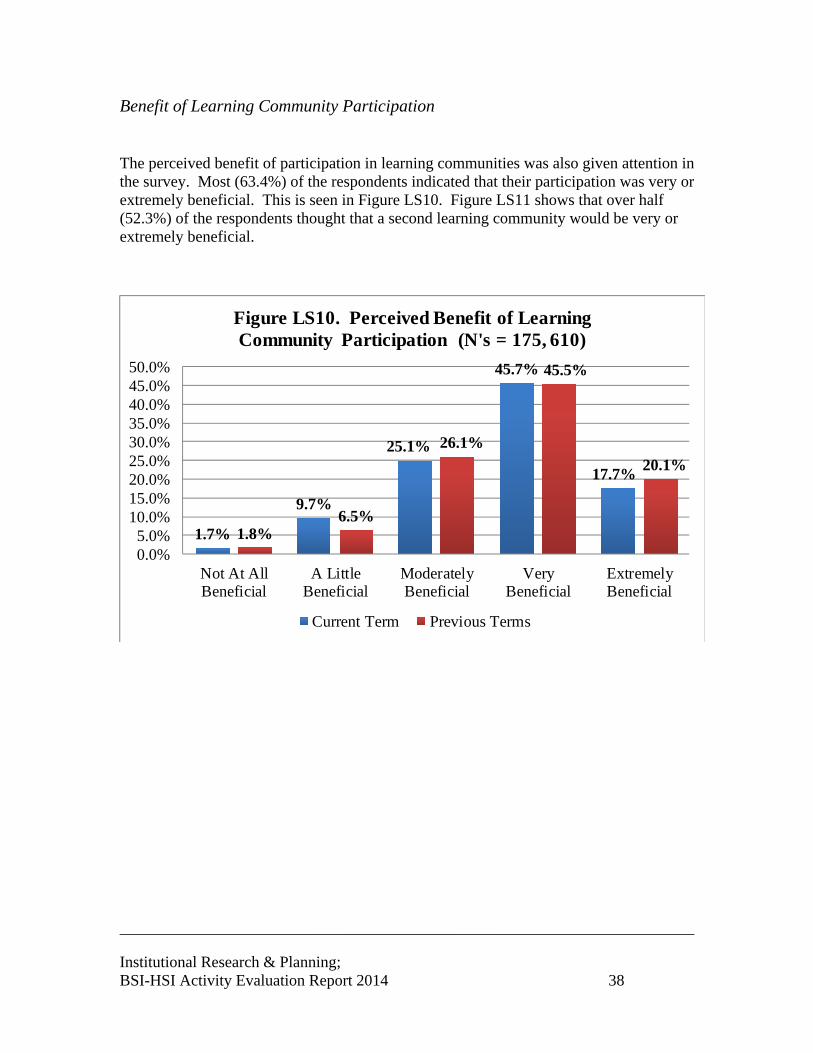
Benefit of Learning Community Participation
The perceived benefit of participation in learning communities was also given attention in the survey. Most (63.4%) of the respondents indicated that their participation was very or extremely beneficial. This is seen in Figure LS10. Figure LS11 shows that over half (52.3%) of the respondents thought that a second learning community would be very or extremely beneficial.
1.7%
9.7%
25.1%
45.7%
17.7%
1.8%6.5%
26.1%
45.5%
20.1%
0.0%5.0%
10.0%15.0%20.0%25.0%30.0%35.0%40.0%45.0%50.0%
Not At AllBeneficial
A LittleBeneficial
ModeratelyBeneficial
VeryBeneficial
ExtremelyBeneficial
Figure LS10. Perceived Benefit of Learning Community Participation (N's = 175, 610)
Current Term Previous Terms

________________________________________________________________________
Institutional Research & Planning; BSI-HSI Activity Evaluation Report 2014 39
4.5%7.4%
35.8%30.7%
21.6%
4.2%8.9%
30.1%
36.6%
20.2%
0.0%5.0%
10.0%15.0%20.0%25.0%30.0%35.0%40.0%45.0%50.0%
Not At AllBeneficial
A LittleBeneficial
ModeratelyBeneficial
VeryBeneficial
ExtremelyBeneficial
Figure LS11. Expected Benefit of Participation in a Second Learning Community (N's = 176, 611)
Current Term Previous Terms
Comments
General, open-ended questions were asked of the learning community students regarding the greatest benefits, recommendations, and other comments about the learning communities. The responses from students in the most recent term to these questions are found in Tables LS4 through LS6.
What would you say has been the greatest benefit of participating in a learning community?
''Learning with a broader capacity and using the resources available to me that I normally would not have known or cared about.''

________________________________________________________________________
Institutional Research & Planning; BSI-HSI Activity Evaluation Report 2014 40
Table LS4. Greatest Benefit of Learning Community Participation
the teachers
all the help from students and teachers.
all the people willing to helpare group work
being able to communicate with the same people constantly for both classes. easier to make friends.
Being able to finish more than one class at a time and finish two GED requirements.Being able to learn with the same people has helped.BEING ABLE TO STAY IN COMMUNICATIONS WITH OTHERS ABOUT ASSIGNMENTS FOR BOTH CLASSES/SHARING COURSE ASSIGNMENT/MATERIAL COMMONAILTYbeing able to work with different people and being able to get alot of help with classesbeing able to work with others to learn each lesson.being exposed to all the different resources made available to students.being helped with class and things outside of class as well.Being with friendsBeing with the same group of people.being with the same people every day and focusing on one subjectbeing with the same people in both classes and being able to ask for help and getting to know one another .being with the same people in each class so you can communicate with them betterbuilding relationships with my professors and my classmates.Comunicatincontecting both classeseverithingEveryone got hands on attention to what they needed if they reached out for it. since the community is smaller than a normal class each of the instructors got to know all of us which helped us out more.EVERYTHINGExposed to the college cultureFinding the different resources you can use at the college.gaining a great amount of diversity and knowledge.Getting both math 50 and 60 out of the way.

________________________________________________________________________
Institutional Research & Planning; BSI-HSI Activity Evaluation Report 2014 41
Table LS4. Continued
Getting help in mathgetting help in my homework because sometimes i did not understand what was my homework about.getting other peoples veiwGetting to know classmates better making the classrooms much more comfortable and easy to discuss topics with classmates for help.getting to know you classmates, weve helped eachother.give the ability to advance to higher level classes soonerGiving me more braveness to go to tutoring center.Having a id.having a support group with the same people and i got comfortable with themHaving both teachers communicate so it makes it easier to know what I am doing in both classes.Having support when needed.Having the ability to work with other students between both classes. Also, the professors were always willing to help, and I learnd a lot from them.having the same people in both classesHaving the same people in my classeshaving the time to make new friends that were in both classeshelping me set goalsHelping me understand the material a lot better.I 've met some of new people, they are friendly and help a lot for support if I need everything.I can know about essays, and I can use some strategies when I write a research paper.
I can use what I learne in ESL classes when I write research paper for other classes.I feel good when I am moving toward my education goals. I have been to 5 colleges over the past 14 years because of children and moving, etc. I feel that the instructors and the resources for help at Palomar College are by far the best of any of the schools I have been to.i get to meet lots of new peopleI have learned a lot in the learning community. For example I learn how the structure of a paragraph goes, and new vocabulary words.I have learned much from the learning communityi know where everything is in school/

________________________________________________________________________
Institutional Research & Planning; BSI-HSI Activity Evaluation Report 2014 42
Table LS4. Continued
I LEARN TO WORK WELL WTH OTHERS AND I REALIZE THAT I'M NOT THE ONLY ONY THAT HAS TROUBLE.I learned much more than I expected. Found about resources that can be used on campus.I like that we had the same students in the two classes. It helps because you get to know the students to help one another with assignments and to study.I loved being with the same people in both classes. It really helped with both classesI really enjoyed my counseling class.I think the greatest benefit was having the work in both the classes link together. Having it linked together made it easier to understand the material and get the additional help that i need.I was able to get two classes I needed as a first-year student when I was having a hard time getting any other classes. It was also nice being able to have the same people in both classes.I WAS ABLE TO PARTICIPATE IN A WONDERFUL CLASS AND GOT TO LEARN MANY NEW THINGS.I would say that professors encouraging us and telling us what time and when to go to tutoring. Also giving us extra credit.i would say that there are so many clubs and activities in the community college which is a good thingI'm not sure but it has been a Great experience.if I have questions I can ask my peers because we have the same classesIn the beginning I received strong support from my tutors and classmates.It has allowed me to be in an environment where I can feel more open with the students around me and therefore integrate better into group projects and more comfortably ask for assistance when I need it.it help me with my readingKnowing the people in your class to ask for help outside of class.learn from thersLearning about my majorlearning alot of things that will help me in the futureLearning math 50learning my MBTI codelearning new thingslearning new things about where i can get more information at Palomar.Learning things that i never wanted to learn and now they stickLearning things you can apply in everyday life.

________________________________________________________________________
Institutional Research & Planning; BSI-HSI Activity Evaluation Report 2014 43
Table LS4. Continued
Learning with a broader capacity and using the resources available to me that I normally would not have known or cared about.made learning a lot easyermade lots of friends that made it easier to studyMaking new friends
Making new friends and learning things that are actually related to my major.maybed doing group work in class with class matesmeet new peopleMeeting new peoplemeeting new people and asking eachother for help when we needed itmeeting new students, and working wth them on a day to day basis.Meeting peoplemy counseling class was the best part of it. the professsor was very concerned about us and helped us with everything she couldmy reading comprehension has raised a considerable ammountMY TEACHER IS ALWAYS WILLING TO HELP US OUT WITH ANYTHING EVEN IF IS NOT A CLASS ROOM ASSIGNMENTmy writing has improvedno commentnothingPalomar location services knowledge.PEOPLE ALWASYS BEING THERE TO HELP YOUPersonality types!!!! FOR SURE!readingReading fasterSeeing life in a new manor.share knowledgesmaller classes and teacher is very helpfullsocial connectionssome assignments are the samespelling and grammarStudying skills improved and reading skillsThat since we have the same people in the same class every one gets to know each other and every one can talk about problems.that you get to be with the same people in different classes.That you know all your instructors very well.the 1 hour break

________________________________________________________________________
Institutional Research & Planning; BSI-HSI Activity Evaluation Report 2014 44
Table LS4. Continued
The best benefit of participating in a learning community is having all the help and support available when necessary.the chance to become closer with the other students in my class.the classes subjects both connected in a way of understanding by getting broken downThe fact that you are able to get to know your peers better.The gratest benefit that I receive was the fact that I developed my ideas in an extended or profund manner.The greatest benefit has been vocabularythe greatest benefit of participating in a learning community is the you get to be the same group of students for a hole year which is a good thing another thing is the help your getting plus the big advancement you receive.the greatest benefit of participating in a learning community was that i got to learn in a different way i actually feel very surprise how much i learned this semester and probably because they pushed me harder to do better in everythingThe greatest benefit of participating in this course of learning community is that you learn more and are less students that normal classes, the teacher has more time to talk with each students about their grade, how to success in class, teachers take care of their students. Also that teacher make the class funny.The greatest benefit to participating in a learning community is that working with students and creating bonds was awesome.Very funThe greatest benefit would be completing 3 math classes in one semester.The greatest benefits is getting to know people more and learning new things.
The greatestet benefit of participating in a learing community would be all the teacher feed back we got. Also how many people we got to meet and spend time with.The idea of a notes packetThe learning community has help me with my class assingments and also my outside work.The learning enviornmentthe same studentsThe teachers were always checking our work and were very helpful.The tutoring for math and its services and counseling became very helpful for understanding topics that webassign doesnt explain and counseling became useful for making my education planTHE VOCABULARY AND REading skills

________________________________________________________________________
Institutional Research & Planning; BSI-HSI Activity Evaluation Report 2014 45
Table LS4. Continued
There is more of a bond between students and teachersumm...I get to meet new girls. just kidding. being able to be friendly with all of the classmates so that it isn't awkward while working together.Understanding on more subjectsVery goodViewing different perspectiveswe can save time and money even though we have to work hardwell basically everything being with the same group of students.Working as a groupWorking with other classmates has been helpful.working with other students
working with the same peopleWorking with the same peopleWorking with the same students, and learning a lot of materialyesYesYou can always tur for educational advice in your learning community.
You establish better relationships with your fellow classmates making it a team effort to pass the class. you can rely on them for information if you missed class.. etc.you plan your classes and futre betteryou really get to no the people in your class which makes it very easy to ask questions and speak up etc...

________________________________________________________________________
Institutional Research & Planning; BSI-HSI Activity Evaluation Report 2014 46
Learning Communities Summary
The results for the learning communities were generally positive. Some key points are noted below.
A total of 1,478 students have participated in the learning communities from fall 2009 to fall 2013.
Retention and success was enhanced, in some cases, for learning-community students relative to other students taking the same courses.
Persistence to the next term was clearly higher for learning-community students than it was for others.
Students were very satisfied with the learning communities, and found it to be beneficial.
Most (71.2%) of the students in Fall 2013 had completed an education plan. Half (49.2%) of the students in Fall 2013 reported that they had integrative
assignments in their learning community, and rated them quite positively.

________________________________________________________________________
Institutional Research & Planning; BSI-HSI Activity Evaluation Report 2014 47
TEACHING AND LEARNING CENTER
The Teaching and Learning Center (TLC) at the Escondido Center is a multi-use space designed to increase student contact with faculty, tutors, counselors, and other students. The TLC services include counseling, instruction, and tutoring, as well as housing workshops and providing space for students to complete homework and interact with other students.
TLC Use
Students, Time, and Visits
The numbers of students, visits, and time spent in the TLC are summarized in Table TLC1. The TLC, on average, serves over 1,500 students per term. Since the Fall 2009 term, 15.5% of the visits were missing departure time, so elapsed time for those visits could not be computed. Therefore, those cases do not contribute to the total number of minutes, and were excluded from the averages in Table TLC1. The number of visits peaked in Spring 2013 at 8,601. The average visit length is well over an hour.
TermNumber of Students Visits
Total Number of
Minutes
Minutes per
Visit*Minutes per
Student*
Fall 09 543 1,628 78,737 71.91 115.88Spring 10 1,581 6,143 371,360 75.60 140.45Fall 10 1,414 6,023 444,681 87.74 157.34Spring 11 1,464 6,050 424,421 83.61 164.82Fall 11 1,638 7,149 503,720 82.73 156.24Spring 12 1,492 7,071 529,256 84.59 164.19Fall 12 1,699 8,079 544,385 76.05 164.38Spring 13 1,685 8,601 598,316 80.78 178.71Fall 13 1,428 6,310 443,339 85.92 157.67* Averages exclude orphans.
Table TLC1. Use of TLC

________________________________________________________________________
Institutional Research & Planning; BSI-HSI Activity Evaluation Report 2014 48
The time students spent at the TLC is summarized in Table TLC2. At the time of check-in, students why they are at the TLC by selecting one from a list of reasons. The table shows that 39.1% of the time spent at the TLC in Fall 2013 was for the purpose of doing homework. Overall, 33.6% of the time at the TLC was explicitly for assistance with math.
Fall 09Spring
10 Fall 10Spring
11 Fall 11Spring
12 Fall 12Spring
12 Fall 13% % % % % % % % %
Unknown 0.0% 0.0% 0.0% 0.0% 0.0% 0.0% 0.3% 0.1% 1.6%Counseling 1.3% 0.6% 0.7% 0.8% 0.7% 0.5% 0.7% 0.5% 0.7%Financial Aid
0.0% 0.0% 0.0% 0.1% 0.2% 0.1% 0.1% 0.2% 0.2%
Homework 46.9% 42.1% 32.1% 30.6% 36.2% 28.8% 36.9% 38.6% 39.1%Information 1.3% 0.6% 0.2% 0.2% 0.1% 0.1% 0.1% 0.3% 0.3%Lab: ESL 0.8% 2.2% 0.8% 3.2% 1.1% 1.1% 1.7% 0.8% 0.8%Language Lab
0.0% 0.0% 0.0% 0.0% 0.0% 0.0% 13.2% 0.4% 1.1%
Lab: Math 30.5% 10.7% 19.4% 9.7% 15.2% 20.0% 12.6% 19.5% 17.5%Lab: Other 5.3% 5.1% 3.9% 4.9% 5.3% 8.8% 1.0% 1.3% 0.3%Lab: Reading
0.0% 1.0% 0.7% 0.1% 0.3% 0.4% 0.4% 0.5% 0.5%
Other 1.8% 6.9% 5.0% 6.1% 3.2% 1.5% 2.7% 2.2% 3.9%Tutoring: ESL
2.4% 4.6% 5.5% 8.0% 5.9% 7.7% 3.4% 6.2% 5.2%
Tutoring: Math
6.3% 13.8% 16.9% 19.3% 16.9% 20.4% 16.8% 18.6% 17.4%
Tutoring: Other
1.2% 3.0% 2.1% 3.2% 2.1% 1.8% 1.8% 1.0% 2.9%
Tutoring: Reading
0.2% 0.3% 1.0% 0.8% 1.1% 0.6% 0.7% 0.9% 0.9%
Tutoring: Writing
1.8% 8.3% 11.3% 12.0% 11.2% 7.9% 7.1% 7.7% 7.0%
Workshop 0.3% 0.9% 0.4% 1.0% 0.5% 0.3% 0.4% 1.3% 0.6%Total 100% 100% 100% 100% 100% 100% 100% 100% 100%
TLC Visit Reason
Table TLC2. Percent of Minutes at TLC by Reason

________________________________________________________________________
Institutional Research & Planning; BSI-HSI Activity Evaluation Report 2014 49
Table TLC3 shows the number of visits by the reason the students gave for their visit to the TLC. Consistent with the amount of time spent, homework was the most common reason given for a visit to the TLC. Just over a quarter (26.4%) of the visits were explicitly math oriented visits.
Fall 09Spring
10 Fall 10Spring
11 Fall 11Spring
12 Fall 12Spring
12 Fall 13Visits Visits Visits Visits Visits Visits Visits Visits Visits
Unknown 0 0 0 0 0 0 24 10 48Counseling 17 63 96 90 93 83 116 85 98Financial Aid
0 0 0 12 29 7 16 34 14
Homework 919 2,641 2,011 2,210 2,911 2,233 2,916 3,366 2,458Information 65 60 22 40 25 17 23 42 77Lab: ESL 11 170 87 174 92 126 157 107 80Language Lab
0 0 0 0 0 0 1,315 61 51
Lab: Math 270 436 874 392 737 1,173 784 1,539 884Lab: Other 68 406 307 359 412 685 83 109 40Lab: Reading
1 68 53 13 39 18 35 38 31
Other 41 770 547 478 333 232 430 361 365Tutoring: ESL
41 271 356 494 458 477 368 620 380
Tutoring: Math
118 594 911 887 1,020 1,170 985 1,274 1,024
Tutoring: Other
24 164 135 143 168 181 138 138 222
Tutoring: Reading
5 27 46 64 63 52 60 66 54
Tutoring: Writing
38 396 523 612 686 589 584 631 421
Workshop 10 77 55 82 83 28 45 120 63Total 1,628 6,143 6,023 6,050 7,149 7,071 8,079 8,601 6,310
TLC Visit Reason
Table TLC3. Visits to the TLC
________________________________________________________________________
Institutional Research & Planning; BSI-HSI Activity Evaluation Report 2014 50
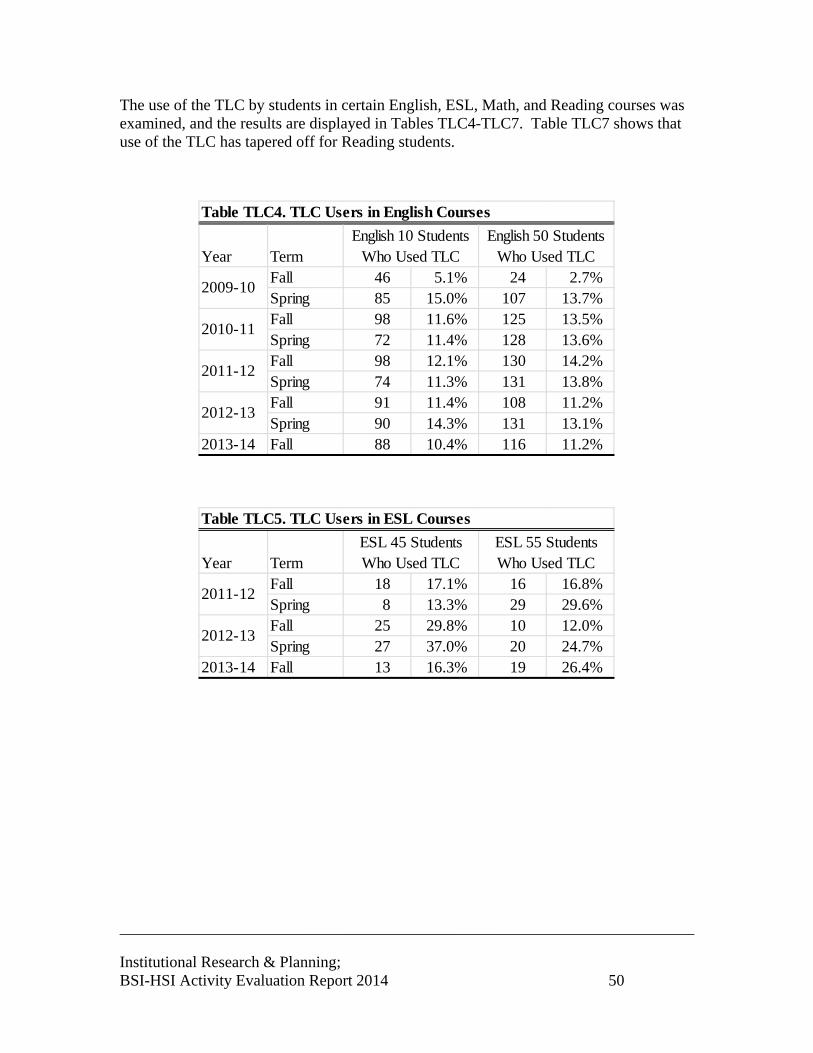
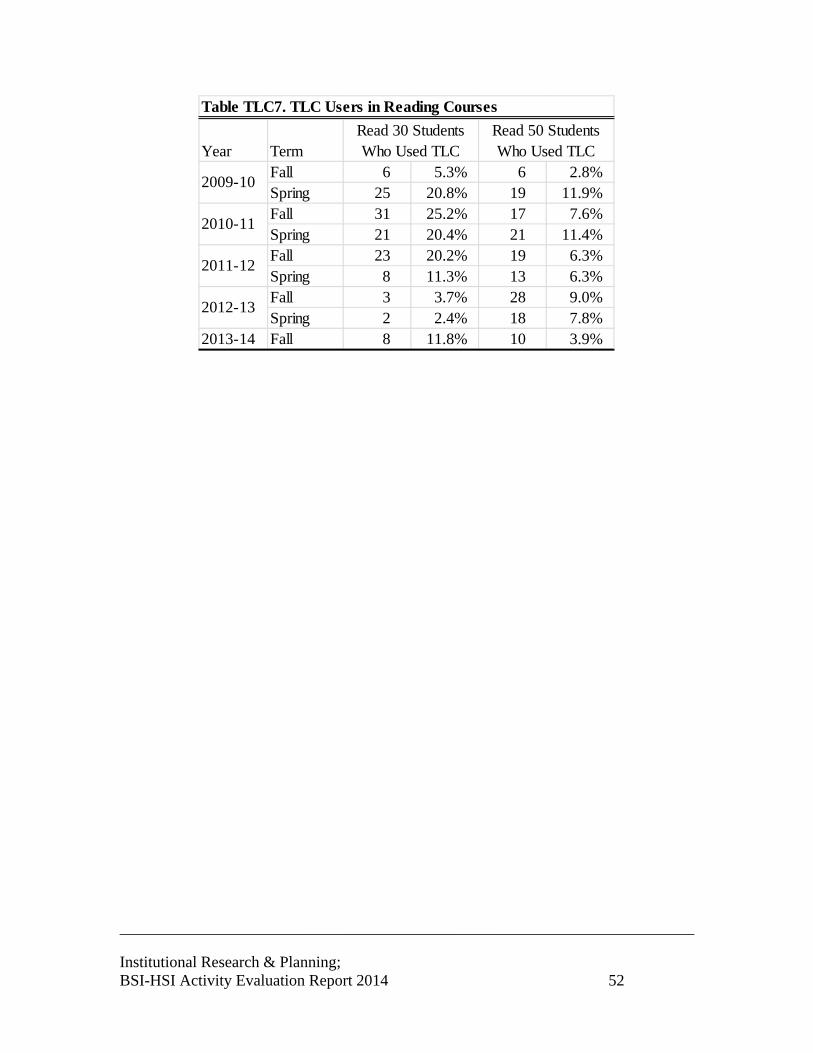
The use of the TLC by students in certain English, ESL, Math, and Reading courses was examined, and the results are displayed in Tables TLC4-TLC7. Table TLC7 shows that use of the TLC has tapered off for Reading students.
Year TermFall 46 5.1% 24 2.7%Spring 85 15.0% 107 13.7%Fall 98 11.6% 125 13.5%Spring 72 11.4% 128 13.6%Fall 98 12.1% 130 14.2%Spring 74 11.3% 131 13.8%Fall 91 11.4% 108 11.2%Spring 90 14.3% 131 13.1%
2013-14 Fall 88 10.4% 116 11.2%
2012-13
English 50 Students Who Used TLC
English 10 Students Who Used TLC
Table TLC4. TLC Users in English Courses
2009-10
2010-11
2011-12
Year TermFall 18 17.1% 16 16.8%Spring 8 13.3% 29 29.6%Fall 25 29.8% 10 12.0%Spring 27 37.0% 20 24.7%
2013-14 Fall 13 16.3% 19 26.4%
Table TLC5. TLC Users in ESL Courses
ESL 45 Students Who Used TLC
ESL 55 Students Who Used TLC
2011-12
2012-13

________________________________________________________________________
Institutional Research & Planning; BSI-HSI Activity Evaluation Report 2014 51
Year TermFall 11 9.2% 66 5.3%Spring 0 140 12.9%Fall 12 11.8% 144 12.0%Spring 0 131 13.3%Fall 2 3.4% 184 15.7%Spring 0 165 15.4%Fall 6 10.9% 141 12.0%Spring 0 143 11.8%
2013-14 Fall 5 9.4% 157 13.2%
2012-13
2011-12
Table TLC6a. TLC Users in Math Courses
Math 10 Students Who Used TLC
Math 15 Students Who Used TLC
2009-10
2010-11
Year TermFall 60 3.6% 5 1.6% 54 3.7%Spring 156 11.9% 16 8.2% 136 9.7%Fall 146 9.7% 29 9.2% 163 10.6%Spring 154 10.6% 15 8.2% 133 8.6%Fall 232 14.0% 16 5.8% 171 11.0%Spring 164 11.6% 51 24.1% 162 10.1%Fall 216 12.3% 13 4.7% 217 14.1%Spring 189 12.3% 65 26.5% 194 11.7%
2013-14 Fall 199 11.6% 33 9.8% 149 9.3%
2011-12
2012-13
Math 60 Students Who Used TLC
Table TLC6b. TLC Users in Math Courses
Math 50 Students Who Used TLC
Math 56 Students Who Used TLC
2009-10
2010-11
________________________________________________________________________
Institutional Research & Planning; BSI-HSI Activity Evaluation Report 2014 52
Year TermFall 6 5.3% 6 2.8%Spring 25 20.8% 19 11.9%Fall 31 25.2% 17 7.6%Spring 21 20.4% 21 11.4%Fall 23 20.2% 19 6.3%Spring 8 11.3% 13 6.3%Fall 3 3.7% 28 9.0%Spring 2 2.4% 18 7.8%
2013-14 Fall 8 11.8% 10 3.9%
2011-12
2012-13
Table TLC7. TLC Users in Reading Courses
Read 30 Students Who Used TLC
Read 50 Students Who Used TLC
2009-10
2010-11

________________________________________________________________________
Institutional Research & Planning; BSI-HSI Activity Evaluation Report 2014 53
Student Characteristics
Certain student characteristics of the TLC users were examined. Table TLC8 shows the gender distribution for TLC users as well as for students who took at least one class at the Escondido center but did not use the TLC, and all other students. The gender distribution appears stable over the terms examined. TLC users were more likely to be female than male, while the rest of the credit student population was evenly split by gender.

________________________________________________________________________
Institutional Research & Planning; BSI-HSI Activity Evaluation Report 2014 54
2013-14Fall Spring Fall Spring Fall Spring Fall Spring Fall
264 771 709 722 818 740 856 838 74955.9% 55.8% 57.5% 56.4% 57.4% 56.1% 55.8% 56.0% 59.4%
200 595 512 550 592 563 663 648 50242.4% 43.1% 41.5% 42.9% 41.6% 42.7% 43.2% 43.3% 39.8%
8 16 13 9 14 16 14 11 91.7% 1.2% 1.1% 0.7% 1.0% 1.2% 0.9% 0.7% 0.7%
Total 472 1,382 1,234 1,281 1,424 1,319 1,533 1,497 1,260
1,791 1,412 1,458 1,330 1,281 1,307 1,184 1,100 1,18848.8% 47.3% 46.3% 47.6% 45.7% 47.3% 46.4% 45.9% 46.8%1,862 1,560 1,677 1,450 1,511 1,440 1,348 1,286 1,337
50.7% 52.2% 53.2% 51.9% 53.9% 52.1% 52.9% 53.7% 52.7%20 15 16 16 13 17 17 9 11
0.5% 0.5% 0.5% 0.6% 0.5% 0.6% 0.7% 0.4% 0.4%Total 3,673 2,987 3,151 2,796 2,805 2,764 2,549 2,395 2,536
10,116 9,722 9,545 9,503 9,133 8,963 9,121 9,160 8,82248.9% 49.4% 47.9% 47.7% 46.6% 47.3% 47.1% 46.8% 45.9%10,473 9,854 10,272 10,325 10,341 9,860 10,156 10,332 10,30150.6% 50.0% 51.5% 51.8% 52.8% 52.1% 52.4% 52.8% 53.6%
117 114 116 113 126 112 94 80 820.6% 0.6% 0.6% 0.6% 0.6% 0.6% 0.5% 0.4% 0.4%
Total 20,706 19,690 19,933 19,941 19,600 18,935 19,371 19,572 19,205
Male
Unknown
Female
Male
Unknown
Female
Escondido Center Student
Other Student
Female
Male
Unknown
Gender2011-122009-10 2010-11 2012-13
TLC User
Table TLC8. TLC Users by Gender & Student Category

________________________________________________________________________
Institutional Research & Planning; BSI-HSI Activity Evaluation Report 2014 55
Table TLC9 shows the distributions of students by race and ethnicity for (a) TLC users, (b) the Escondido Center, and (c) the rest of the credit students at the college. The distributions of students by race and ethnicity have remained stable over the terms examined. While the Escondido Center population, in general, looks much like the population of Palomar College as a whole, those using the TLC differed in terms of race and ethnicity. Table TLC9 shows that 40-50% of the TLC users were Hispanic. TLC users were more likely to be Hispanic, and less likely to be white in comparison to Escondido Center and other students in general.

________________________________________________________________________
Institutional Research & Planning; BSI-HSI Activity Evaluation Report 2014 56
Ethnicity
Afr.Am. Non-Hisp
15 3.2% 48 3.9% 53 3.7% 64 4.2% 44 3.5%
Asian 22 4.7% 52 4.2% 61 4.3% 79 5.2% 45 3.6%Filipino 15 3.2% 30 2.4% 28 2.0% 40 2.6% 31 2.5%Hispanic 196 41.5% 550 44.6% 633 44.5% 773 50.4% 654 51.9%Multi Ethnic 10 2.1% 29 2.4% 39 2.7% 41 2.7% 36 2.9%Nat.Am. 4 0.8% 13 1.1% 21 1.5% 16 1.0% 18 1.4%Pacific 4 0.8% 17 1.4% 15 1.1% 8 0.5% 8 0.6%Unknown 22 4.7% 62 5.0% 44 3.1% 48 3.1% 37 2.9%White Non- 184 39.0% 433 35.1% 530 37.2% 464 30.3% 387 30.7%Total 472 100.0% 1,234 100.0% 1,424 100.0% 1,533 100.0% 1,260 100.0%
Afr.Am. Non-Hisp
120 3.3% 92 2.9% 64 2.3% 77 3.0% 63 2.5%
Asian 102 2.8% 91 2.9% 67 2.4% 82 3.2% 82 3.2%Filipino 99 2.7% 82 2.6% 70 2.5% 51 2.0% 51 2.0%Hispanic 1,271 34.6% 1,058 33.6% 1,041 37.1% 972 38.1% 1,068 42.1%Multi Ethnic 94 2.6% 113 3.6% 92 3.3% 105 4.1% 93 3.7%Nat.Am. 43 1.2% 33 1.0% 22 0.8% 17 0.7% 20 0.8%Pacific Islander
19 0.5% 15 0.5% 12 0.4% 12 0.5% 13 0.5%
Unknown 150 4.1% 105 3.3% 99 3.5% 83 3.3% 73 2.9%White Non-Hisp
1,775 48.3% 1,562 49.6% 1,338 47.7% 1,150 45.1% 1,073 42.3%
Total 3,673 100.0% 3,151 100.0% 2,805 100.0% 2,549 100.0% 2,536 100.0%
Fall 2013-14TLC User
Escondido Center Student
Fall 2012-13Fall 2009-10 Fall 2010-11 Fall 2011-12Table TLC9. TLC Users by Ethnicity & Student Category

________________________________________________________________________
Institutional Research & Planning; BSI-HSI Activity Evaluation Report 2014 57
Ethnicity
Afr.Am. 678 3.3% 603 3.0% 627 3.2% 619 3.2% 596 3.1%Asian 1,118 5.4% 1,010 5.1% 988 5.0% 952 4.9% 988 5.1%Filipino 631 3.0% 575 2.9% 598 3.1% 579 3.0% 597 3.1%Hispanic 5,785 27.9% 5,941 29.8% 6,132 31.3% 6,443 33.3% 6,649 34.6%
Multi Ethnic605 2.9% 698 3.5% 783 4.0% 855 4.4% 891 4.6%
Nat.Am. 153 0.7% 133 0.7% 137 0.7% 147 0.8% 135 0.7%Pacific Islander
172 0.8% 156 0.8% 124 0.6% 116 0.6% 114 0.6%
Unknown 889 4.3% 686 3.4% 627 3.2% 609 3.1% 560 2.9%White Non-Hisp
10,675 51.6% 10,131 50.8% 9,584 48.9% 9,051 46.7% 8,675 45.2%
Total 20,706 100.0% 19,933 100.0% 19,600 100.0% 19,371 100.0% 19,205 100.0%
Other Student
Table TLC9. ContinuedFall 2009-10 Fall 2010-11 Fall 2011-12 Fall 2012-13 Fall 2013-14

________________________________________________________________________
Institutional Research & Planning; BSI-HSI Activity Evaluation Report 2014 58
Table TLC10 shows that about half of the TLC users were daytime only students, and in Fall 2013 about 10% were evening only students. Relative to other Escondido Center students, TLC users were much more likely to attend courses during the day.
2013-14Fall Spring Fall Spring Fall Spring Fall Spring Fall
Number 193 575 504 518 538 518 682 571 491% 40.9% 41.6% 40.8% 40.4% 37.8% 39.3% 44.5% 38.1% 39.0%
Number 233 633 600 616 690 591 641 726 647% 49.4% 45.8% 48.6% 48.1% 48.5% 44.8% 41.8% 48.5% 51.3%
Number 46 174 130 147 196 210 210 200 121% 9.7% 12.6% 10.5% 11.5% 13.8% 15.9% 13.7% 13.4% 9.6%
Number 472 1,382 1,234 1,281 1,424 1,319 1,533 1,497 1,260% 100% 100% 100% 100% 100% 100% 100% 100% 100%
Number 1,442 1,120 1,241 1,096 1,089 1,113 1,053 901 987% 39.3% 37.5% 39.4% 39.2% 38.8% 40.3% 41.3% 37.6% 38.9%
Number 1,323 1,054 1,132 1,034 1,007 1,040 887 972 1,099% 36.0% 35.3% 35.9% 37.0% 35.9% 37.6% 34.8% 40.6% 43.3%
Number 908 798 778 666 709 611 609 522 450% 24.7% 26.7% 24.7% 23.8% 25.3% 22.1% 23.9% 21.8% 17.7%
Number 0 15 0 0 0 0 0 0 0% 0.0% 0.5% 0.0% 0.0% 0.0% 0.0% 0.0% 0.0% 0.0%
Number 3,673 2,987 3,151 2,796 2,805 2,764 2,549 2,395 2,536% 100% 100% 100% 100% 100% 100% 100% 100% 100%
Table TLC10. TLC Users by Day Eve & Student Category
TLC User
Escondido Center Student
2009-10 2010-11 2011-12 2012-13Day Eve
D/E
Day
Eve
Total
D/E
Day
Eve
Ukn
Total

________________________________________________________________________
Institutional Research & Planning; BSI-HSI Activity Evaluation Report 2014 59
2013-14Fall Spring Fall Spring Fall Spring Fall Spring Fall
Number 5,532 5,197 5,446 5,442 5,307 5,077 4,953 5,172 5,193% 26.7% 26.4% 27.3% 27.3% 27.1% 26.8% 25.6% 26.4% 27.0%
Number 12,035 11,701 11,593 11,662 11,630 11,368 11,730 11,716 11,465% 58.1% 59.4% 58.2% 58.5% 59.3% 60.0% 60.6% 59.9% 59.7%
Number 3,139 2,792 2,894 2,824 2,659 2,490 2,688 2,684 2,547% 15.2% 14.2% 14.5% 14.2% 13.6% 13.2% 13.9% 13.7% 13.3%
Number 0 0 0 13 4 0 0 0 0% 0.0% 0.0% 0.0% 0.1% 0.0% 0.0% 0.0% 0.0% 0.0%
Number 20,706 19,690 19,933 19,941 19,600 18,935 19,371 19,572 19,205% 100% 100% 100% 100% 100% 100% 100% 100% 100%
Total Number 24,851 24,059 24,318 24,018 23,829 23,018 23,453 23,464 23,001
Table TLC10. Continued
Other StudentDay Eve
2009-10 2010-11 2011-12 2012-13
Total
Eve
Ukn
D/E
Day

________________________________________________________________________
Institutional Research & Planning; BSI-HSI Activity Evaluation Report 2014 60
For the purposes of this analysis, students were classified (based on the lowest level class they were enrolled in for the given term) as (a) basic skills, (b) AA, or (c) transfer level students. TLC users were more likely to be basic skills students than were Escondido Center students, and other students in general. This is illustrated in Table TLC11, which also shows that TLC users were also more likely to be AA level students compared to others.
2013-14Fall Spring Fall Spring Fall Spring Fall Spring Fall
Number 129 281 269 246 286 251 248 255 231% 27.3% 20.3% 21.8% 19.2% 20.1% 19.0% 16.2% 17.0% 18.3%
Number 108 315 344 325 427 390 460 477 390% 22.9% 22.8% 27.9% 25.4% 30.0% 29.6% 30.0% 31.9% 31.0%
Number 235 786 621 710 711 678 825 765 639% 49.8% 56.9% 50.3% 55.4% 49.9% 51.4% 53.8% 51.1% 50.7%
Number 472 1,382 1,234 1,281 1,424 1,319 1,533 1,497 1,260% 100.0% 100.0% 100.0% 100.0% 100.0% 100.0% 100.0% 100.0% 100.0%
Number 517 315 416 315 306 273 299 289 312% 14.1% 10.5% 13.2% 11.3% 10.9% 9.9% 11.7% 12.1% 12.3%
Number 603 461 536 512 499 489 493 437 481% 16.4% 15.4% 17.0% 18.3% 17.8% 17.7% 19.3% 18.2% 19.0%
Number 2,553 2,211 2,199 1,969 2,000 2,002 1,757 1,669 1,743% 69.5% 74.0% 69.8% 70.4% 71.3% 72.4% 68.9% 69.7% 68.7%
Number 3,673 2,987 3,151 2,796 2,805 2,764 2,549 2,395 2,536% 100.0% 100.0% 100.0% 100.0% 100.0% 100.0% 100.0% 100.0% 100.0%
AA
Transfer
Basic Skills
Total
AA
Transfer
Total
Escondido Center Student
Basic Skills
Student Level
Table TLC11. TLC Users by Student Level & Student Category
TLC User
2009-10 2010-11 2011-12 2012-13

________________________________________________________________________
Institutional Research & Planning; BSI-HSI Activity Evaluation Report 2014 61
2013-14Fall Spring Fall Spring Fall Spring Fall Spring Fall
Number 1,670 1,306 1,640 1,281 1,470 1,233 1,499 1,386 1,598% 8.1% 6.6% 8.2% 6.4% 7.5% 6.5% 7.7% 7.1% 8.3%
Number 2,501 2,352 2,590 2,599 2,728 2,644 2,822 2,791 2,847% 12.1% 11.9% 13.0% 13.0% 13.9% 14.0% 14.6% 14.3% 14.8%
Number 16,535 16,032 15,703 16,061 15,402 15,058 15,050 15,395 14,760% 79.9% 81.4% 78.8% 80.5% 78.6% 79.5% 77.7% 78.7% 76.9%
Number 20,706 19,690 19,933 19,941 19,600 18,935 19,371 19,572 19,205% 100.0% 100.0% 100.0% 100.0% 100.0% 100.0% 100.0% 100.0% 100.0%
Total Number 24,851 24,059 24,318 24,018 23,829 23,018 23,453 23,464 23,001
2011-12 2012-13Table TLC11. Continued
Transfer
Total
Basic Skills
AA
Other Student
Student Level
2009-10 2010-11

________________________________________________________________________
Institutional Research & Planning; BSI-HSI Activity Evaluation Report 2014 62
TLC Impact
The impact of the TLC was assessed, in a limited way, by examining course success (receiving a grade of A, B, C, CR, or P) and retention (completing the semester and receiving a transcript grade) rates for specific math classes. These courses were selected because of the relatively higher number of students in these courses who used the TLC. The impact of TLC use was also examined in terms of persistence.

________________________________________________________________________
Institutional Research & Planning; BSI-HSI Activity Evaluation Report 2014 63
Table TLC12 shows the success rates for students in Math 10, 15, 50, 56, and 60 who visited the TLC explicitly for the purpose of getting help in math. The table also shows this information for the other students in these courses. While these two categories of students cannot be assumed to have been equivalent, the other students taking these courses are included in this table because they may provide a useful point of reference. The success rates below suggest a greater advantage for TLC users in the Spring compared to the Fall.
2013-14
Fall Spring Fall Spring Fall Spring Fall Spring FallNumber 2,110 1,949 1,999 1,991 1,872 1,941 2,113 2,133 2,183 18,291
% 44.8% 49.7% 43.9% 48.5% 40.5% 47.0% 45.7% 48.1% 46.0% 45.9%Number 2,605 1,971 2,552 2,115 2,745 2,193 2,512 2,303 2,563 21,559
% 55.2% 50.3% 56.1% 51.5% 59.5% 53.0% 54.3% 51.9% 54.0% 54.1%Number 4,715 3,920 4,551 4,106 4,617 4,134 4,625 4,436 4,746 39,850
% 100.0% 100.0% 100.0% 100.0% 100.0% 100.0% 100.0% 100.0% 100.0% 100.0%Number 16 29 61 21 42 77 79 90 69 484
% 35.6% 35.8% 52.6% 36.8% 44.2% 44.5% 45.1% 42.3% 43.9% 43.5%Number 29 52 55 36 53 96 96 123 88 628
% 64.4% 64.2% 47.4% 63.2% 55.8% 55.5% 54.9% 57.7% 56.1% 56.5%Number 45 81 116 57 95 173 175 213 157 1,112
100.0% 100.0% 100.0% 100.0% 100.0% 100.0% 100.0% 100.0% 100.0% 100.0%
Total
2012-13
Table TLC12. Success for TLC Users in Math 10, 15, 50, or 60 Who Visited the TLC for Math Help
Yes
Total
Yes
No
2009-10 2010-11 2011-12
No
No
Yes
Total
Visited the TLC for Math
Help Success

________________________________________________________________________
Institutional Research & Planning; BSI-HSI Activity Evaluation Report 2014 64
Table TLC13 shows the success rates for students in Math 10, 15, 50, 56, and 60 who visited the TLC for any reason, not just help in math. Those who visited the TLC had a success rate of about 61%.
2013-14
Fall Spring Fall Spring Fall Spring Fall Spring FallNumber 2,044 1,798 1,856 1,848 1,674 1,820 1,964 1,988 2,042 17,034
% 44.8% 50.6% 44.5% 49.5% 40.8% 48.3% 46.7% 49.0% 46.8% 46.6%Number 2,520 1,755 2,317 1,882 2,433 1,945 2,243 2,070 2,318 19,483
% 55.2% 49.4% 55.5% 50.5% 59.2% 51.7% 53.3% 51.0% 53.2% 53.4%Number 4,564 3,553 4,173 3,730 4,107 3,765 4,207 4,058 4,360 36,517
% 100.0% 100.0% 100.0% 100.0% 100.0% 100.0% 100.0% 100.0% 100.0% 100.0%Number 82 180 204 164 240 198 228 235 210 1,741
% 41.8% 40.2% 41.3% 37.9% 39.7% 36.5% 38.4% 39.8% 38.7% 39.2%Number 114 268 290 269 365 344 365 356 333 2,704
% 58.2% 59.8% 58.7% 62.1% 60.3% 63.5% 61.6% 60.2% 61.3% 60.8%Number 196 448 494 433 605 542 593 591 543 4,445
100.0% 100.0% 100.0% 100.0% 100.0% 100.0% 100.0% 100.0% 100.0% 100.0%
Total
2012-13
Table TLC13. Success for TLC Users in Math 10, 15, 50, or 60 Who Visited the TLC for Any Reason
2010-11 2011-12Visited
the TLC for Any Reason Success
2009-10
No
No
Yes
Total
Yes
No
Yes
Total

________________________________________________________________________
Institutional Research & Planning; BSI-HSI Activity Evaluation Report 2014 65
The retention rates in these same math courses are displayed in Table TLC14. The retention rate for those who used the TLC for math assistance was 90%.
2013-14Fall Spring Fall Spring Fall Spring Fall Spring Fall
Number 404 384 359 346 332 351 502 430 497 3,605% 8.6% 9.8% 7.9% 8.4% 7.2% 8.5% 10.9% 9.7% 10.5% 9.0%
Number 4,311 3,536 4,192 3,760 4,285 3,783 4,123 4,006 4,249 36,245% 91.4% 90.2% 92.1% 91.6% 92.8% 91.5% 89.1% 90.3% 89.5% 91.0%
Number 4,715 3,920 4,551 4,106 4,617 4,134 4,625 4,436 4,746 39,850% 100.0% 100.0% 100.0% 100.0% 100.0% 100.0% 100.0% 100.0% 100.0% 100.0%
Number 4 9 19 6 10 8 21 16 21 114% 8.9% 11.1% 16.4% 10.5% 10.5% 4.6% 12.0% 7.5% 13.4% 10.3%
Number 41 72 97 51 85 165 154 197 136 998% 91.1% 88.9% 83.6% 89.5% 89.5% 95.4% 88.0% 92.5% 86.6% 89.7%
Number 45 81 116 57 95 173 175 213 157 1,112% 100.0% 100.0% 100.0% 100.0% 100.0% 100.0% 100.0% 100.0% 100.0% 100.0%
Total2012-13
Table TLC14. Retention for TLC Users in Math 10, 15, 50, or 60 Who Visited the TLC for Math Help
Yes
No
Yes
Total
Retained
No
Yes
Total
Visited the TLC for
Math Help
No
2009-10 2010-11 2011-12

________________________________________________________________________
Institutional Research & Planning; BSI-HSI Activity Evaluation Report 2014 66
Retention in these math courses for all TLC users is displayed in Table TLC15. Overall, the retention rate in the select math courses is about 92%.
2013-14Fall Spring Fall Spring Fall Spring Fall Spring Fall
Number 386 362 346 319 301 332 462 401 468 3,377% 8.5% 10.2% 8.3% 8.6% 7.3% 8.8% 11.0% 9.9% 10.7% 9.2%
Number 4,178 3,191 3,827 3,411 3,806 3,433 3,745 3,657 3,892 33,140% 91.5% 89.8% 91.7% 91.4% 92.7% 91.2% 89.0% 90.1% 89.3% 90.8%
Number 4,564 3,553 4,173 3,730 4,107 3,765 4,207 4,058 4,360 36,517% 100.0% 100.0% 100.0% 100.0% 100.0% 100.0% 100.0% 100.0% 100.0% 100.0%
Number 22 31 32 33 41 27 61 45 50 342% 11.2% 6.9% 6.5% 7.6% 6.8% 5.0% 10.3% 7.6% 9.2% 7.7%
Number 174 417 462 400 564 515 532 546 493 4,103% 88.8% 93.1% 93.5% 92.4% 93.2% 95.0% 89.7% 92.4% 90.8% 92.3%
Number 196 448 494 433 605 542 593 591 543 4,445% 100.0% 100.0% 100.0% 100.0% 100.0% 100.0% 100.0% 100.0% 100.0% 100.0%
Total2012-13
Table TLC15. Retention for TLC Users in Math 10, 15, 50, or 60 Who Visited the TLC for Math Help
2010-11 2011-12Visited the TLC for
Math Help Retained2009-10
No
No
Yes
Total
Yes
No
Yes
Total
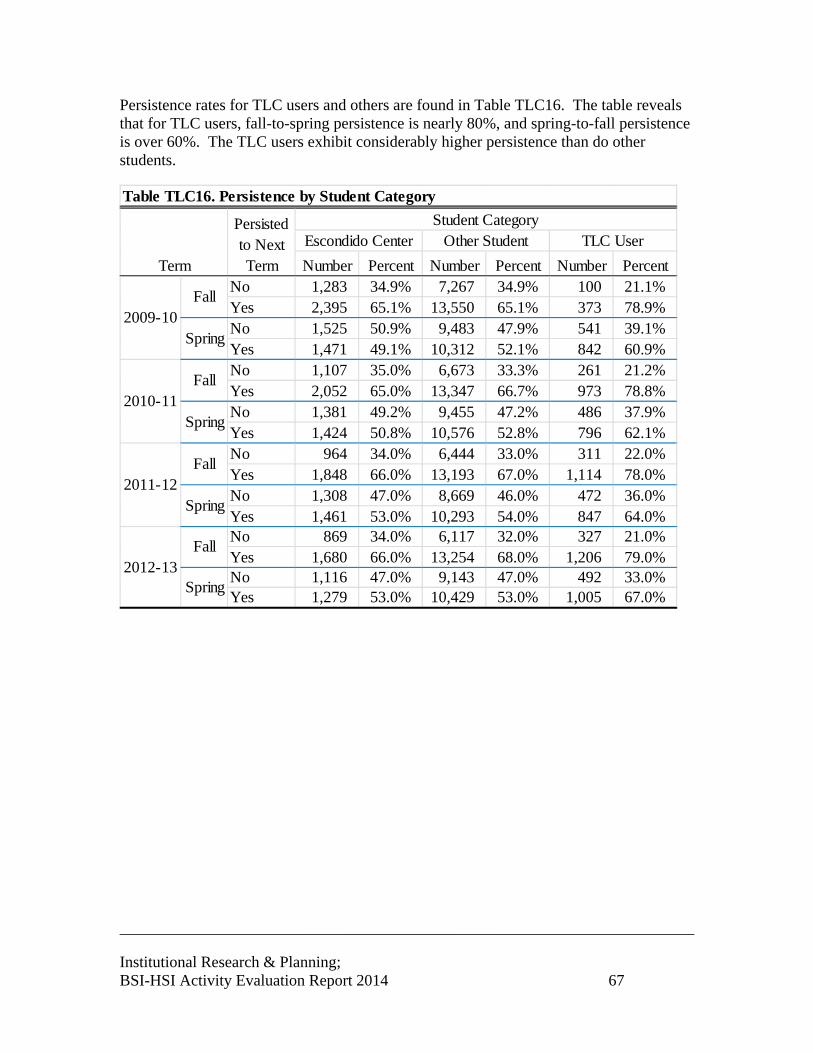
________________________________________________________________________
Institutional Research & Planning; BSI-HSI Activity Evaluation Report 2014 67
Persistence rates for TLC users and others are found in Table TLC16. The table reveals that for TLC users, fall-to-spring persistence is nearly 80%, and spring-to-fall persistence is over 60%. The TLC users exhibit considerably higher persistence than do other students.
Number Percent Number Percent Number PercentNo 1,283 34.9% 7,267 34.9% 100 21.1%Yes 2,395 65.1% 13,550 65.1% 373 78.9%No 1,525 50.9% 9,483 47.9% 541 39.1%Yes 1,471 49.1% 10,312 52.1% 842 60.9%No 1,107 35.0% 6,673 33.3% 261 21.2%Yes 2,052 65.0% 13,347 66.7% 973 78.8%No 1,381 49.2% 9,455 47.2% 486 37.9%Yes 1,424 50.8% 10,576 52.8% 796 62.1%No 964 34.0% 6,444 33.0% 311 22.0%Yes 1,848 66.0% 13,193 67.0% 1,114 78.0%No 1,308 47.0% 8,669 46.0% 472 36.0%Yes 1,461 53.0% 10,293 54.0% 847 64.0%No 869 34.0% 6,117 32.0% 327 21.0%Yes 1,680 66.0% 13,254 68.0% 1,206 79.0%No 1,116 47.0% 9,143 47.0% 492 33.0%Yes 1,279 53.0% 10,429 53.0% 1,005 67.0%
2012-13Fall
Spring
2011-12Fall
Spring
Student CategoryEscondido Center Other Student TLC User
Table TLC16. Persistence by Student Category
Persisted to Next TermTerm
Fall
Spring2009-10
2010-11Fall
Spring

________________________________________________________________________
Institutional Research & Planning; BSI-HSI Activity Evaluation Report 2014 68
TLC Summary
Use of the Escondido TLC was significant for a number of students. Some key points are noted below.
Use of the TLC peaked in the Spring 2013 term at 8,601 visits.
The primary reasons students went to the TLC was to do homework or work on math.
Compared to other students, TLC users were more likely to be (a) female, (b) Hispanic, and (c) basic skills students.
The success rate of math students using the TLC was about 61%, while the retention rate was about 92%.
Persistence was very high for TLC users.

________________________________________________________________________
Institutional Research & Planning; BSI-HSI Activity Evaluation Report 2014 69
TUTORING
Tutoring at Palomar College takes a number of forms. The present study focuses on supervised tutoring activity captured in the ESL Center, the Math Learning Center, the STAR Center in the library, and the STEM Center, the TLC, and the Writing Center.
Tutoring Use
Table T1 shows the number of students using tutoring. This includes tutoring at the Writing Center, the Math Learning Center, the TLC, the ESL tutoring, the STAR Center, and the STEM Center. The table shows that the number of students utilizing tutoring is climbing each term. The table also shows the number of tutoring hours for each term, as well as the average tutoring hours per tutored student. Spring terms appear to get a little heavier tutor usage compared to fall terms.
Year Students HoursHours per
StudentFall 1,746 16,843.90 9.65Spring 1,825 18,597.70 10.19Fall 1,940 17,968.20 9.26Spring 2,031 22,553.50 11.10Fall 2,290 19,899.00 8.69Spring 2,384 21,282.40 8.93Fall 2,528 23,250.60 9.20Spring 2,644 32,179.90 12.17
2012-13
2009-10
2010-11
2011-12
Table T1. Number and Hours of Tutoring Students
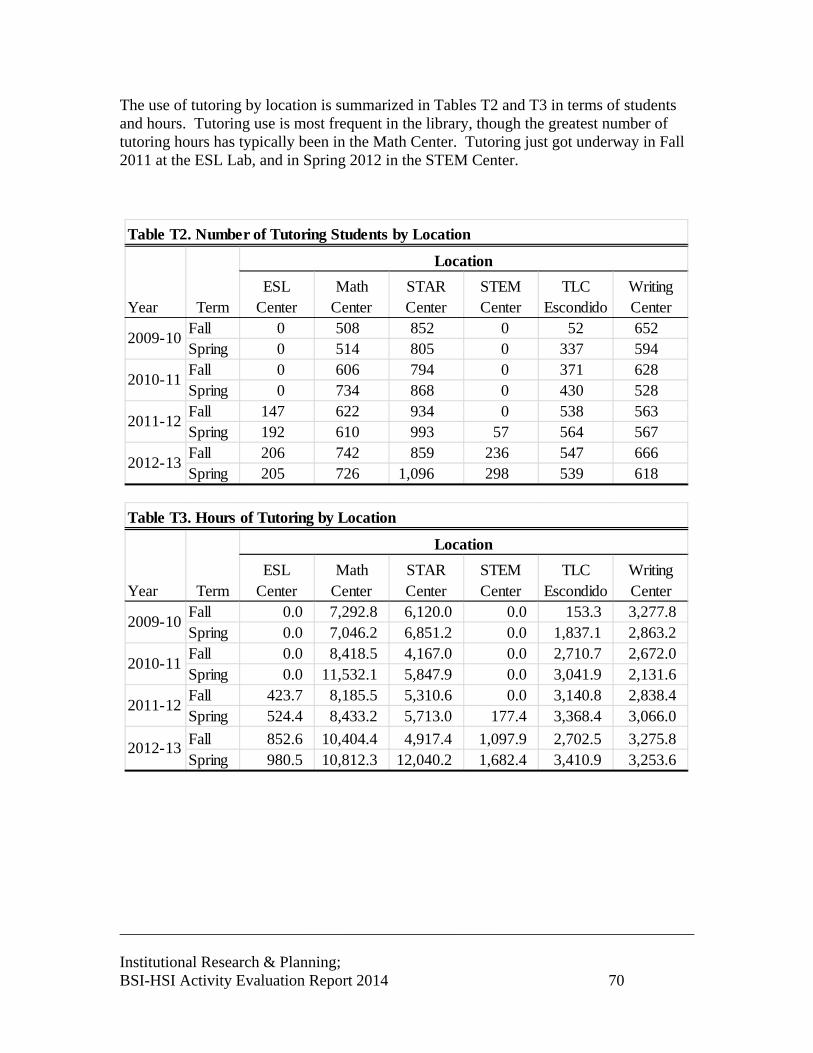
________________________________________________________________________
Institutional Research & Planning; BSI-HSI Activity Evaluation Report 2014 70
The use of tutoring by location is summarized in Tables T2 and T3 in terms of students and hours. Tutoring use is most frequent in the library, though the greatest number of tutoring hours has typically been in the Math Center. Tutoring just got underway in Fall 2011 at the ESL Lab, and in Spring 2012 in the STEM Center.
ESL Center
Math Center
STAR Center
STEM Center
TLC Escondido
Writing Center
Fall 0 508 852 0 52 652Spring 0 514 805 0 337 594Fall 0 606 794 0 371 628Spring 0 734 868 0 430 528Fall 147 622 934 0 538 563Spring 192 610 993 57 564 567Fall 206 742 859 236 547 666Spring 205 726 1,096 298 539 618
2012-13
2009-10
2010-11
2011-12
Location
Year Term
Table T2. Number of Tutoring Students by Location
ESL Center
Math Center
STAR Center
STEM Center
TLC Escondido
Writing Center
Fall 0.0 7,292.8 6,120.0 0.0 153.3 3,277.8Spring 0.0 7,046.2 6,851.2 0.0 1,837.1 2,863.2Fall 0.0 8,418.5 4,167.0 0.0 2,710.7 2,672.0Spring 0.0 11,532.1 5,847.9 0.0 3,041.9 2,131.6Fall 423.7 8,185.5 5,310.6 0.0 3,140.8 2,838.4Spring 524.4 8,433.2 5,713.0 177.4 3,368.4 3,066.0
Fall 852.6 10,404.4 4,917.4 1,097.9 2,702.5 3,275.8Spring 980.5 10,812.3 12,040.2 1,682.4 3,410.9 3,253.6
2012-13
2010-11
2011-12
Table T3. Hours of Tutoring by Location
Year Term
Location
2009-10
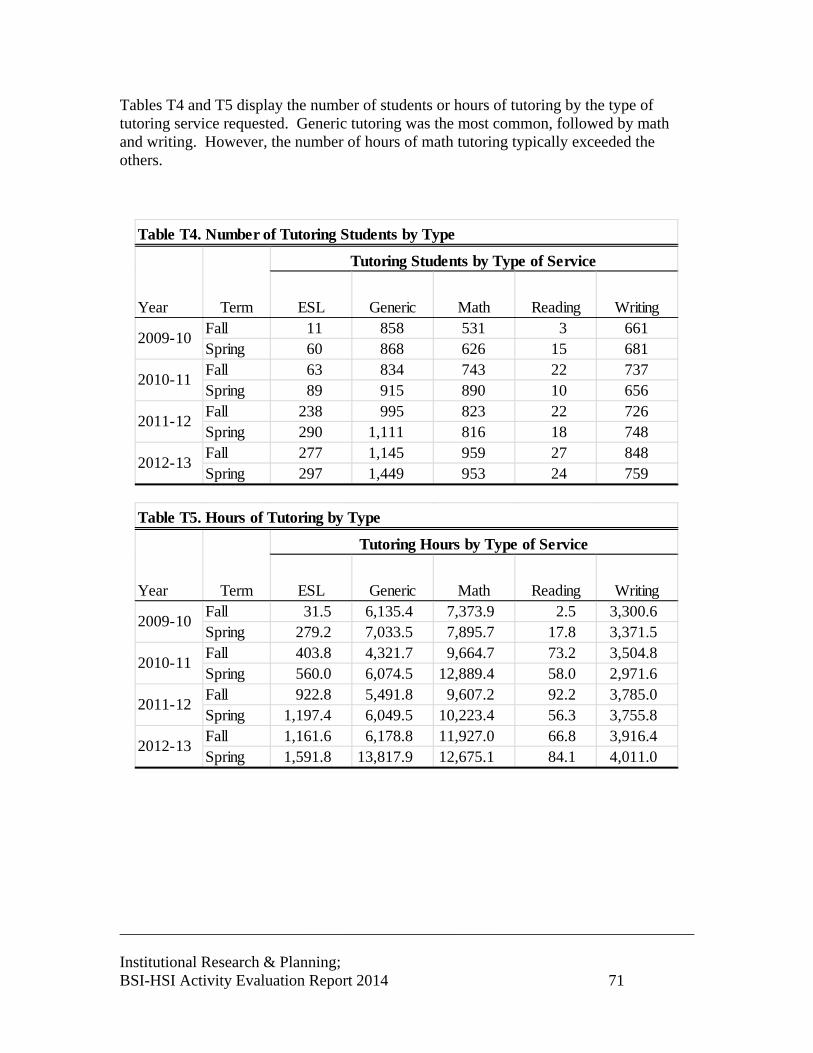
________________________________________________________________________
Institutional Research & Planning; BSI-HSI Activity Evaluation Report 2014 71
Tables T4 and T5 display the number of students or hours of tutoring by the type of tutoring service requested. Generic tutoring was the most common, followed by math and writing. However, the number of hours of math tutoring typically exceeded the others.
ESL Generic Math Reading WritingFall 11 858 531 3 661Spring 60 868 626 15 681Fall 63 834 743 22 737Spring 89 915 890 10 656Fall 238 995 823 22 726Spring 290 1,111 816 18 748Fall 277 1,145 959 27 848Spring 297 1,449 953 24 759
Year Term
2009-10
2012-13
2010-11
2011-12
Table T4. Number of Tutoring Students by Type
Tutoring Students by Type of Service
ESL Generic Math Reading WritingFall 31.5 6,135.4 7,373.9 2.5 3,300.6Spring 279.2 7,033.5 7,895.7 17.8 3,371.5Fall 403.8 4,321.7 9,664.7 73.2 3,504.8Spring 560.0 6,074.5 12,889.4 58.0 2,971.6Fall 922.8 5,491.8 9,607.2 92.2 3,785.0Spring 1,197.4 6,049.5 10,223.4 56.3 3,755.8Fall 1,161.6 6,178.8 11,927.0 66.8 3,916.4Spring 1,591.8 13,817.9 12,675.1 84.1 4,011.0
2012-13
2010-11
2011-12
Table T5. Hours of Tutoring by Type
Year Term
Tutoring Hours by Type of Service
2009-10

________________________________________________________________________
Institutional Research & Planning; BSI-HSI Activity Evaluation Report 2014 72
Student Characteristics
A number of student characteristics were examined for both those who received tutoring and those who did not. Each of these characteristics showed differences between students receiving tutoring and the other credit students.
Gender. Table T6 shows the tutoring students by gender. Those receiving tutoring were more likely to be female than male.
Female Male UnknownNo 46.6% 52.7% 0.7%Yes 57.8% 41.2% 1.0%No 46.5% 52.8% 0.7%Yes 55.7% 43.0% 1.3%No 45.3% 54.0% 0.7%Yes 57.0% 41.7% 1.3%No 45.5% 53.8% 0.7%Yes 53.7% 45.1% 1.2%No 44.4% 54.9% 0.7%Yes 55.4% 43.4% 1.1%No 44.1% 55.2% 0.7%Yes 57.2% 41.5% 1.3%No 44.3% 55.1% 0.6%Yes 55.2% 44.2% 0.7%No 44.2% 55.2% 0.6%Yes 55.2% 44.3% 0.6%
2011-12Fall
Spring
Fall2012-13
Spring
Year Term
2009-10
2010-11
Fall
Spring
Fall
Spring
Table T6. Tutoring Students by Gender
Used Tutoring
Gender

________________________________________________________________________
Institutional Research & Planning; BSI-HSI Activity Evaluation Report 2014 73
Race and Ethnicity. About 40% of the tutoring students were white, non-Hispanic. This is revealed in Table T7. The table also shows that over a third of the tutoring students were Hispanic.
African American Asian Filipino Hispanic
Multi Ethnic
Native American
Pacific Islander Unknown White
No 3.0% 3.7% 2.6% 25.9% 2.1% 0.8% 0.9% 5.7% 55.3%Yes 3.5% 9.2% 2.6% 32.8% 1.4% 0.6% 0.8% 8.0% 41.1%No 2.7% 4.0% 2.5% 26.6% 2.4% 0.8% 0.9% 5.5% 54.5%Yes 3.4% 8.9% 2.4% 33.3% 1.2% 0.5% 1.0% 6.7% 42.5%No 2.8% 3.8% 2.6% 27.6% 2.7% 0.8% 0.8% 5.2% 53.8%Yes 3.5% 7.9% 2.7% 32.2% 2.3% 0.8% 1.2% 7.6% 41.8%No 2.9% 4.0% 2.5% 28.4% 2.9% 0.9% 0.8% 5.0% 52.7%Yes 3.9% 7.7% 2.6% 33.8% 2.1% 0.9% 0.9% 7.3% 40.8%No 2.9% 3.7% 2.7% 29.5% 3.3% 0.7% 0.7% 4.8% 51.7%Yes 2.6% 8.3% 2.6% 35.1% 3.0% 1.0% 0.7% 6.5% 40.2%No 2.8% 3.8% 2.7% 31.0% 3.6% 0.9% 0.8% 4.5% 50.0%Yes 3.2% 8.8% 2.5% 36.7% 2.3% 0.6% 0.6% 7.0% 38.4%No 3.1% 3.9% 2.6% 31.7% 3.7% 0.8% 0.7% 4.5% 48.9%Yes 2.6% 8.3% 3.1% 39.2% 3.2% 1.0% 0.9% 5.5% 36.3%No 2.9% 3.8% 2.8% 33.1% 3.8% 0.8% 0.7% 4.4% 47.7%Yes 3.4% 8.8% 3.4% 39.4% 2.8% 0.8% 0.6% 5.8% 35.1%
Fall2012-13
Spring
Year Term
2011-12Fall
Spring
EthnicityUsed
Tutoring
Table T7. Percent of Students Using Tutoring by Ethnicity
2009-10
2010-11
Fall
Spring
Fall
Spring
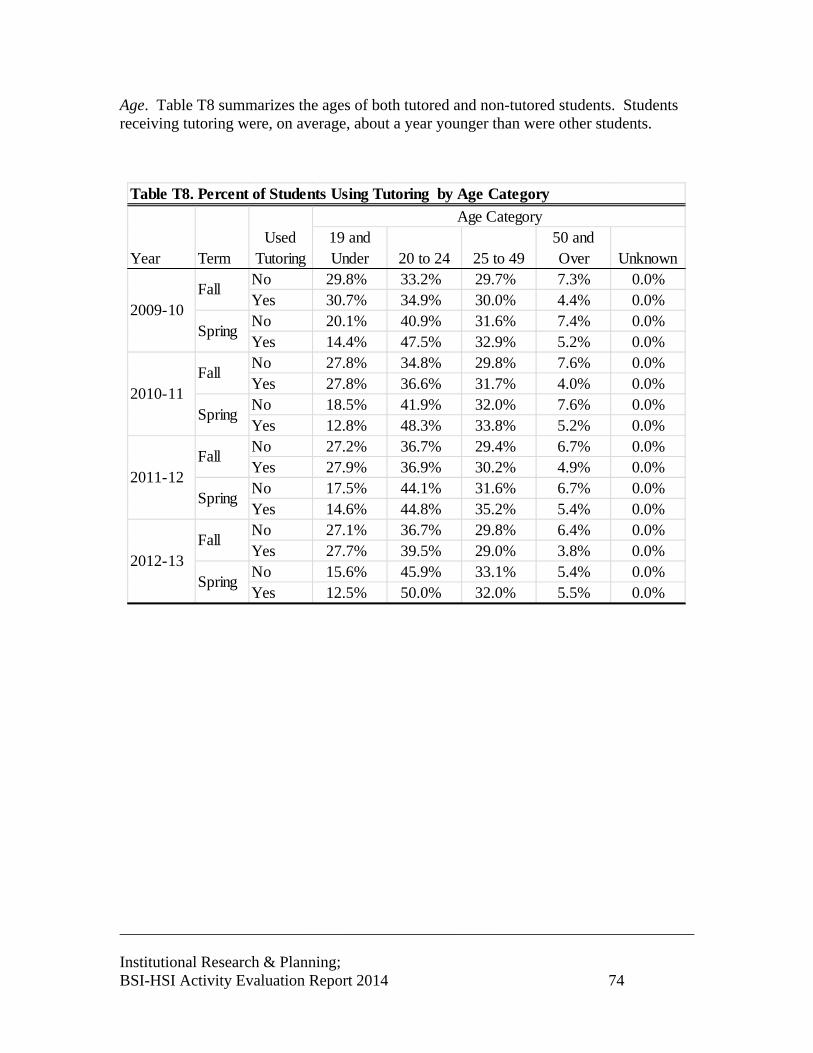
________________________________________________________________________
Institutional Research & Planning; BSI-HSI Activity Evaluation Report 2014 74
Age. Table T8 summarizes the ages of both tutored and non-tutored students. Students receiving tutoring were, on average, about a year younger than were other students.
19 and Under 20 to 24 25 to 49
50 and Over Unknown
No 29.8% 33.2% 29.7% 7.3% 0.0%Yes 30.7% 34.9% 30.0% 4.4% 0.0%No 20.1% 40.9% 31.6% 7.4% 0.0%Yes 14.4% 47.5% 32.9% 5.2% 0.0%No 27.8% 34.8% 29.8% 7.6% 0.0%Yes 27.8% 36.6% 31.7% 4.0% 0.0%No 18.5% 41.9% 32.0% 7.6% 0.0%Yes 12.8% 48.3% 33.8% 5.2% 0.0%No 27.2% 36.7% 29.4% 6.7% 0.0%Yes 27.9% 36.9% 30.2% 4.9% 0.0%No 17.5% 44.1% 31.6% 6.7% 0.0%Yes 14.6% 44.8% 35.2% 5.4% 0.0%No 27.1% 36.7% 29.8% 6.4% 0.0%Yes 27.7% 39.5% 29.0% 3.8% 0.0%No 15.6% 45.9% 33.1% 5.4% 0.0%Yes 12.5% 50.0% 32.0% 5.5% 0.0%
2009-10
2010-11
2011-12
Fall
Fall
Spring
Fall
Spring
Fall
Spring
2012-13Spring
Year TermUsed
Tutoring
Table T8. Percent of Students Using Tutoring by Age Category
Age Category
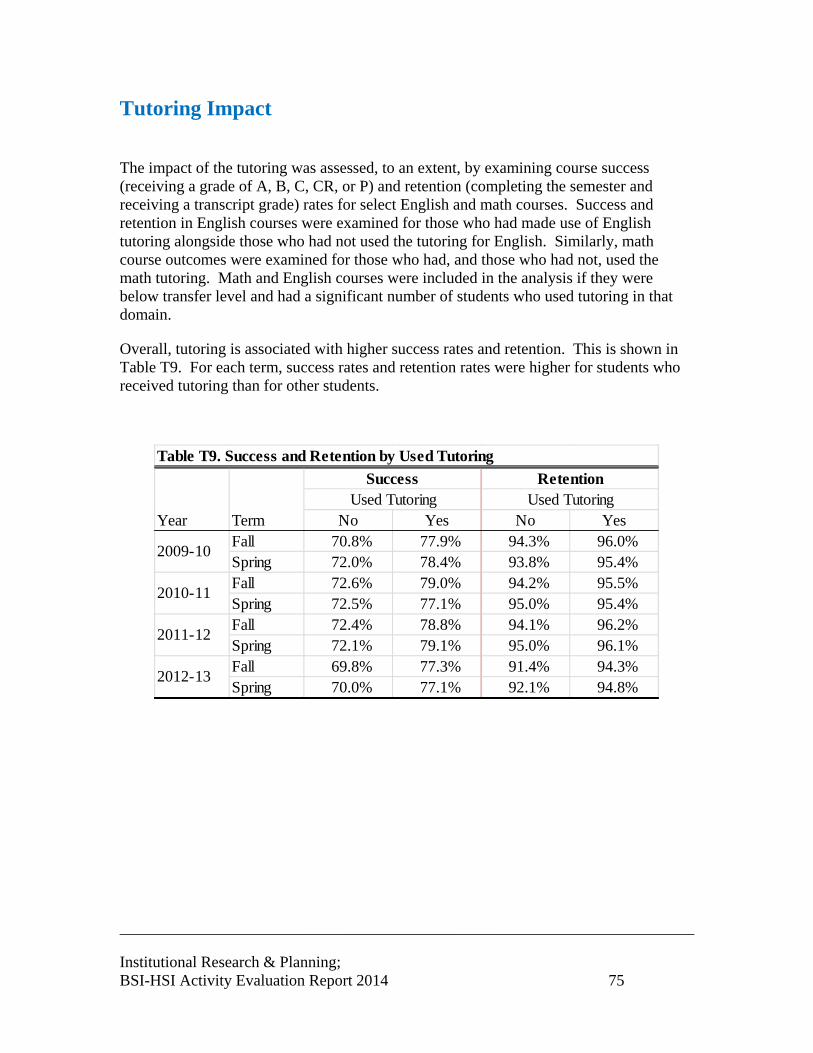
________________________________________________________________________
Institutional Research & Planning; BSI-HSI Activity Evaluation Report 2014 75
Tutoring Impact
The impact of the tutoring was assessed, to an extent, by examining course success (receiving a grade of A, B, C, CR, or P) and retention (completing the semester and receiving a transcript grade) rates for select English and math courses. Success and retention in English courses were examined for those who had made use of English tutoring alongside those who had not used the tutoring for English. Similarly, math course outcomes were examined for those who had, and those who had not, used the math tutoring. Math and English courses were included in the analysis if they were below transfer level and had a significant number of students who used tutoring in that domain.
Overall, tutoring is associated with higher success rates and retention. This is shown in Table T9. For each term, success rates and retention rates were higher for students who received tutoring than for other students.
No Yes No YesFall 70.8% 77.9% 94.3% 96.0%Spring 72.0% 78.4% 93.8% 95.4%Fall 72.6% 79.0% 94.2% 95.5%Spring 72.5% 77.1% 95.0% 95.4%Fall 72.4% 78.8% 94.1% 96.2%Spring 72.1% 79.1% 95.0% 96.1%Fall 69.8% 77.3% 91.4% 94.3%Spring 70.0% 77.1% 92.1% 94.8%
Table T9. Success and Retention by Used Tutoring
2009-10
2010-11
2012-13
2011-12
Used Tutoring Used TutoringSuccess Retention
Year Term

________________________________________________________________________
Institutional Research & Planning; BSI-HSI Activity Evaluation Report 2014 76
English Success and Retention
English Course Success. Table T10 shows the success rates for students in English 10 (English Essentials), English 50 (Introductory Composition), and English 100 (English Composition) courses. While those receiving tutoring cannot be assumed to have been equivalent to the other students taking these courses, the categories are included here because they may provide a useful point of reference. Those receiving tutoring in English had a success rate of 64% in English 10, 74% in English 50, and 80% in English 100.
No Yes No Yes No YesFall 51.2% 57.5% 68.6% 79.3% 67.6% 75.3%Spring 49.8% 63.3% 62.5% 67.9% 63.4% 80.2%Fall 58.9% 53.5% 73.6% 79.3% 70.5% 80.8%Spring 49.1% 68.9% 69.5% 70.2% 65.7% 73.6%Fall 54.6% 64.3% 72.2% 73.7% 73.0% 79.7%Spring 49.0% 73.1% 67.1% 73.3% 63.2% 81.1%
2012-13 Fall 60.4% 70.8% 72.3% 74.1% 68.3% 80.3%
2009-10
2010-11
2011-12
English 100Used Tutoring
Year Term
Table T10. Success Rates in English by Used Tutoring
English 10 English 50Used Tutoring Used Tutoring

________________________________________________________________________
Institutional Research & Planning; BSI-HSI Activity Evaluation Report 2014 77
English Course Retention. The retention rates in English courses for tutored and non-tutored students are displayed in Table T11. The retention rates for those who used English tutoring were very high.
No Yes No Yes No YesFall 92.5% 93.8% 94.4% 98.5% 92.4% 94.7%Spring 91.0% 96.9% 91.0% 93.9% 89.5% 95.5%Fall 92.7% 89.9% 95.3% 95.7% 92.2% 95.2%Spring 90.1% 94.3% 93.2% 93.2% 93.4% 95.9%Fall 92.7% 97.1% 93.8% 95.4% 95.2% 97.3%Spring 93.9% 98.1% 95.4% 96.9% 93.0% 96.2%
2012-13 Fall 89.4% 95.8% 94.1% 94.9% 91.2% 95.6%
2009-10
2010-11
2011-12
Table T11. Retention Rates in English by Used Tutoring
English 10 English 50 English 100Used Tutoring Used Tutoring Used Tutoring
Year Term

________________________________________________________________________
Institutional Research & Planning; BSI-HSI Activity Evaluation Report 2014 78
English Course Success and Retention for Students Receiving Tutoring on Writing. Tables T12 and T13 Show success and retention rates for students receiving tutoring on writing. These tables cohere with the effects of any tutoring illustrated in Tables T10 and T11.
No Yes No Yes No YesFall 51.5% 58.3% 69.6% 75.6% 68.0% 78.4%Spring 50.9% 61.5% 63.0% 67.9% 64.8% 81.3%Fall 58.0% 58.4% 74.2% 78.1% 71.5% 80.6%Spring 51.3% 66.0% 69.1% 72.9% 66.1% 75.7%Fall 55.5% 63.8% 72.9% 70.8% 73.6% 79.4%Spring 50.7% 77.2% 67.8% 73.5% 64.5% 83.9%Fall 60.9% 72.3% 73.2% 69.4% 68.5% 86.4%Spring 56.6% 64.2% 62.7% 74.3% 66.2% 79.9%
2012-13
2009-10
2010-11
2011-12
Table T12. Success Rates in English by Received Tutoring on Writing
English 10 English 50 English 100
Received Tutoring on Writing
Received Tutoring on Writing
Received Tutoring on Writing
Year Term
No Yes No Yes No YesFall 92.4% 95.8% 94.7% 97.8% 92.5% 95.5%Spring 91.4% 96.9% 91.3% 93.6% 89.9% 96.7%Fall 92.6% 89.9% 95.3% 95.6% 92.2% 96.9%Spring 90.7% 92.5% 93.0% 94.7% 93.6% 95.9%Fall 93.0% 97.5% 94.2% 94.4% 95.4% 97.5%Spring 94.3% 98.2% 95.4% 97.7% 93.0% 98.6%
2012-13 Fall 89.7% 97.0% 94.1% 95.5% 91.3% 97.4%
2009-10
2010-11
2011-12
Table T13. Retention Rates in English by Received Tutoring on Writing
Year Term
English 10 English 50 English 100
Received Tutoring on Writing
Received Tutoring on Writing
Received Tutoring on Writing

________________________________________________________________________
Institutional Research & Planning; BSI-HSI Activity Evaluation Report 2014 79
Math Success and Retention
Math Course Success. Success rates in Math 15 (Pre-algebra), Math 50 (Beginning Algebra), and Math 60 (Intermediate Algebra) courses are displayed in Table T14 for both those who had made use of tutoring and those who had not. The success rate for all students in these math courses tended to be higher in fall compared to spring. Overall, tutoring students had higher success rates than did other students.
No Yes No Yes No YesFall 59.6% 60.0% 54.2% 52.8% 50.8% 61.5%Spring 52.8% 57.0% 51.1% 60.3% 43.7% 54.4%Fall 59.1% 58.3% 53.6% 56.2% 54.1% 61.2%Spring 49.1% 53.8% 48.8% 52.7% 51.4% 60.2%Fall 60.1% 65.7% 56.1% 59.0% 60.3% 67.9%Spring 52.8% 66.1% 51.0% 57.9% 49.8% 57.4%Fall 58.3% 70.5% 49.0% 60.9% 50.7% 59.6%Spring 55.3% 68.4% 46.3% 49.3% 48.6% 62.0%
Math 15
Table T14. Success Rates in Math by Used Tutoring
Math 50 Math 60
Year TermUsed Tutoring Used Tutoring Used Tutoring
2012-13
2009-10
2010-11
2011-12
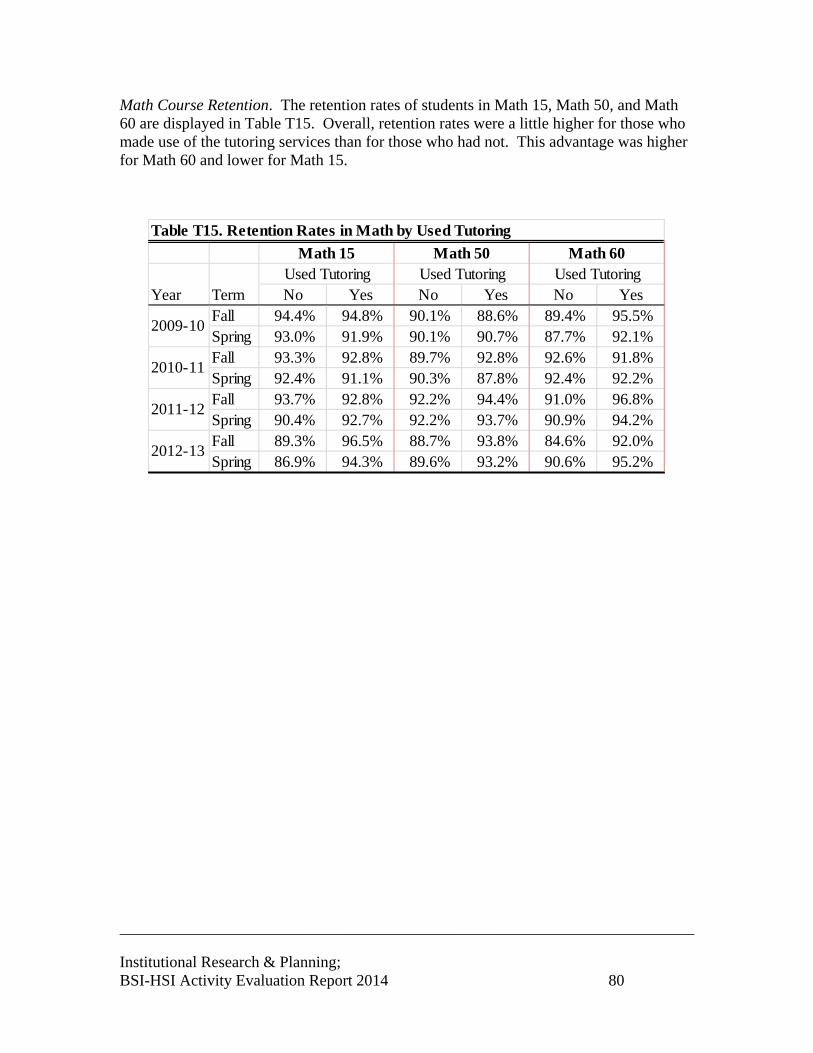
________________________________________________________________________
Institutional Research & Planning; BSI-HSI Activity Evaluation Report 2014 80
Math Course Retention. The retention rates of students in Math 15, Math 50, and Math 60 are displayed in Table T15. Overall, retention rates were a little higher for those who made use of the tutoring services than for those who had not. This advantage was higher for Math 60 and lower for Math 15.
No Yes No Yes No YesFall 94.4% 94.8% 90.1% 88.6% 89.4% 95.5%Spring 93.0% 91.9% 90.1% 90.7% 87.7% 92.1%Fall 93.3% 92.8% 89.7% 92.8% 92.6% 91.8%Spring 92.4% 91.1% 90.3% 87.8% 92.4% 92.2%Fall 93.7% 92.8% 92.2% 94.4% 91.0% 96.8%Spring 90.4% 92.7% 92.2% 93.7% 90.9% 94.2%Fall 89.3% 96.5% 88.7% 93.8% 84.6% 92.0%Spring 86.9% 94.3% 89.6% 93.2% 90.6% 95.2%
Used TutoringMath 50 Math 60
Table T15. Retention Rates in Math by Used Tutoring
2011-12
Year Term
2009-10
2010-11
2012-13
Math 15Used Tutoring Used Tutoring

________________________________________________________________________
Institutional Research & Planning; BSI-HSI Activity Evaluation Report 2014 81
Math Course Success and Retention for Students Receiving Tutoring on Math. Tables T16 and T17 show success and retention rates for students receiving tutoring on math. As with tutoring in general, tutoring in math was associated with higher success rates and slightly higher retention rates.
No Yes No Yes No YesFall 60.0% 47.1% 54.1% 53.8% 51.5% 61.6%Spring 53.4% 53.2% 51.6% 64.0% 44.7% 51.5%Fall 59.1% 57.6% 53.6% 57.7% 54.8% 59.3%Spring 49.1% 57.4% 49.4% 51.0% 52.8% 53.8%Fall 60.5% 67.1% 56.4% 58.6% 60.9% 69.3%Spring 53.8% 69.0% 51.6% 59.0% 50.6% 58.0%Fall 59.1% 75.3% 50.5% 58.5% 51.6% 60.8%Spring 56.8% 64.5% 46.0% 54.6% 50.0% 63.4%
Received Tutoring on Math
Math 50 Math 60
Table T16. Success Rates in Math by Received Tutoring on Math
2011-12
Year Term
2009-10
2010-11
2012-13
Math 15Received Tutoring on
MathReceived Tutoring on
Math
No Yes No Yes No YesFall 94.6% 88.2% 90.0% 88.5% 89.8% 94.6%Spring 93.2% 87.2% 90.2% 90.0% 87.7% 94.7%Fall 93.3% 92.4% 89.8% 94.2% 92.6% 91.1%Spring 92.2% 92.1% 90.2% 86.3% 92.8% 89.3%Fall 93.7% 92.4% 92.5% 93.8% 91.7% 95.6%Spring 90.4% 95.2% 92.4% 92.9% 91.2% 95.0%Fall 90.1% 95.9% 89.3% 93.3% 85.7% 89.9%Spring 87.5% 96.8% 89.8% 94.1% 91.1% 95.5%
2012-13
2009-10
2010-11
2011-12
Table T17. Retention Rates in Math by Received Tutoring on Math
Math 15 Math 50 Math 60
Year Term
Received Tutoring on Math
Received Tutoring on Math
Received Tutoring on Math

________________________________________________________________________
Institutional Research & Planning; BSI-HSI Activity Evaluation Report 2014 82
Tutoring Summary
Many students made use of the tutoring services available to Palomar students through the ESL Center, the Math Center, the STAR center, the STEM Center, the TLC in Escondido, and the Writing Center. Some key points are below.
The student characteristics of tutoring users differed somewhat from other students in terms of gender and race. Tutoring students were more likely to be female and non-white.
Generally, success and retention rates were higher in the English courses examined for students who used tutoring than they were for students who did not.
Similarly, success rates were higher in the Math courses for students who used tutoring than they were for students who did not.

________________________________________________________________________
Institutional Research & Planning; BSI-HSI Activity Evaluation Report 2014 83
SUMMER BRIDGE
The Palomar College Summer Bridge program was designed to assist students who tested into Math 15 to achieve greater success in math. This is accomplished by improving their math skills and helping them test into a higher level math.
Summer Bridge Use
Summer Bridge at Palomar College had 38 participants. Table SB1 shows that these students were more likely to be female than male. Table SB2 shows that most were Hispanic.
Gender NumberFemale 71Male 64Total 135
Table SB1. Summer Bridge 2013 Student Gender
Ethnicity NumberAfr.Am. Non-Hisp 2Asian 3Hispanic 103Multi Ethnic 1Unknown 5White Non-Hisp 21Total 135
Table SB2. Summer Bridge 2013

________________________________________________________________________
Institutional Research & Planning; BSI-HSI Activity Evaluation Report 2014 84
Summer Bridge Impact
Fall Enrollment
Enrollment in math in the Fall 2013 term was an important outcome for Summer Bridge 2013 students. Of the 135 Summer Bridge students, 115 enrolled in the fall term. Table SB3 shows the highest level math course taken by the Summer Bridge students that came to Palomar in the fall. Of the 115 enrolled, 72.2% took a math course in the fall. About half (48.9%) of the Summer Bridge students advanced to Math 50 or higher.
MATH 15 17 14.8%MATH 50 29 25.2%MATH 60 14 12.2%Other Math 23 20.0%No MATH 32 27.8%Total 115 100.0%
Fall Math Course2013-14
Fall
Table SB3. Math Course Taken in Fall, 2013 Following Summer Bridge

________________________________________________________________________
Institutional Research & Planning; BSI-HSI Activity Evaluation Report 2014 85
Success and Retention
Course success (receiving a grade of A, B, C, CR, or P) and retention (completing the semester and receiving a transcript grade) rates in the fall term were also of interest. Table SB4 shows that 35.3% of those who took Math 15 succeeded, and two thirds (66.7%) of those who took Math 50 met with success.
No YesSuccess 56.9% 35.3%Retention 89.0% 88.2%Success 49.3% 66.7%Retention 89.0% 90.9%Success 67.3% 40.0%Retention 92.5% 100.0%Success 53.5% 42.9%Retention 89.0% 85.7%
MATH 56
MATH 60
1132, 17
1621, 33
321, 5
1543, 14
MATH 15
MATH 50
Summer BridgeCourse Number Ns
Table SB4. Success and Retention of Summer Bridge Students in Fall 2013-14 Math Courses
________________________________________________________________________
Institutional Research & Planning; BSI-HSI Activity Evaluation Report 2014 86
Summer Bridge Survey
In addition to the use and impact, student satisfaction with Summer Bridge was of interest. This outcome is addressed with a student survey. Beginning with summer 2011, survey data from Summer Bridge students is incorporated into this report.
Data A total of 67 students responded to the Summer Bridge survey in the summer of 2013. In the last week of class, students were asked to complete the survey online, during class time.
The Summer Bridge student survey topics included (1) satisfaction, (2) perceived college preparedness, (3) attitudes regarding instruction modalities, and (4) perceived benefit of the Summer Bridge program. The questionnaire items are found in Appendix B.
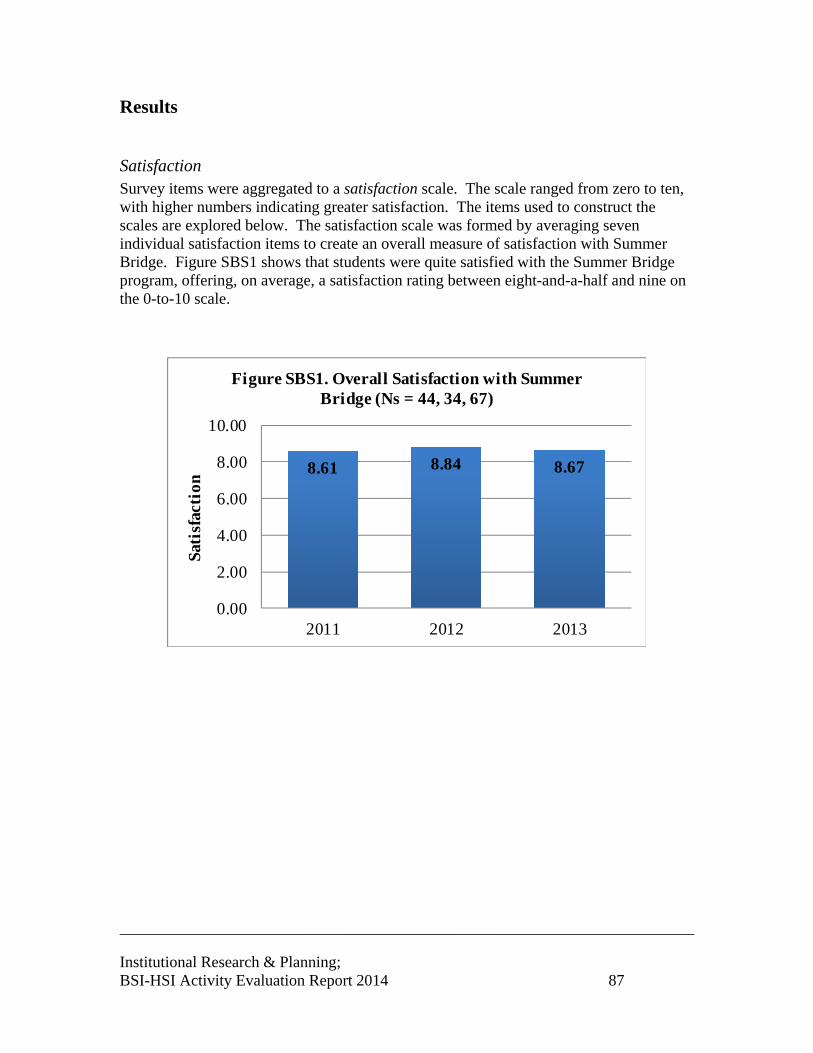
________________________________________________________________________
Institutional Research & Planning; BSI-HSI Activity Evaluation Report 2014 87
Results
Satisfaction Survey items were aggregated to a satisfaction scale. The scale ranged from zero to ten, with higher numbers indicating greater satisfaction. The items used to construct the scales are explored below. The satisfaction scale was formed by averaging seven individual satisfaction items to create an overall measure of satisfaction with Summer Bridge. Figure SBS1 shows that students were quite satisfied with the Summer Bridge program, offering, on average, a satisfaction rating between eight-and-a-half and nine on the 0-to-10 scale.
8.61 8.84 8.67
0.00
2.00
4.00
6.00
8.00
10.00
2011 2012 2013
Sati
sfac
tion
Figure SBS1. Overall Satisfaction with Summer Bridge (Ns = 44, 34, 67)

________________________________________________________________________
Institutional Research & Planning; BSI-HSI Activity Evaluation Report 2014 88
Consistent with the average overall satisfaction score, all the individual satisfaction items had high average ratings. This is seen in Figure SBS2. In fact, all of the average ratings were over 8 on the 0-to-10 scale. Not all of these items were asked in 2011, but for those items asked in both years, a comparison was made.
8.61
8.77
8.09
8.70
8.94
9.41
8.29
9.12
9.12
8.06
8.66
8.97
8.90
8.44
8.24
8.90
.00 2.00 4.00 6.00 8.00 10.00
General Satisfaction
Counseling
Reading
Math
Math Tutoring
Reading
Figure SBS2. Average Ratings on Satisfaction Items (Ns=44, 34, 67)
2013 2012 2011

________________________________________________________________________
Institutional Research & Planning; BSI-HSI Activity Evaluation Report 2014 89
Preparedness
Preparedness was assessed with a set of four Likert-type items that used a 0-to-10 scale where 0 means strongly disagree and 10 means strongly agree. As illustrated in Table SBS3, the students perceived themselves to be very prepared as the result of their participation in Summer Bridge. This is indicated by the average scores of 8.91, 9.31, and 8.32 on the 0-to-10 scale.
8.91 9.318.32
0.00
2.00
4.00
6.00
8.00
10.00
2011 2012 2013
Pre
pare
dnes
s
Figure SBS3. Overall Preparedness Level of Summer Bridge Students (Ns = 44, 34, 67)
The Greatest Benefit of Participating in Summer Bridge:
"Getting the help and learning what college is going to be like"
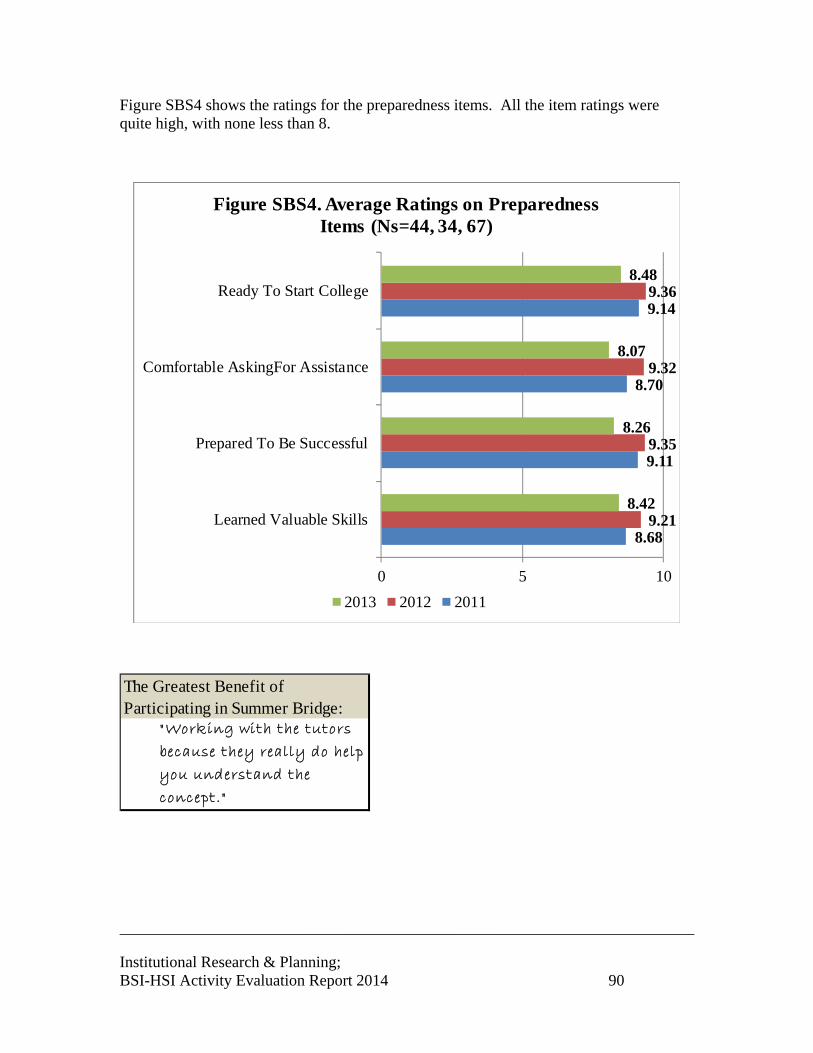
________________________________________________________________________
Institutional Research & Planning; BSI-HSI Activity Evaluation Report 2014 90
Figure SBS4 shows the ratings for the preparedness items. All the item ratings were quite high, with none less than 8.
8.68
9.11
8.70
9.14
9.21
9.35
9.32
9.36
8.42
8.26
8.07
8.48
0 5 10
Learned Valuable Skills
Prepared To Be Successful
Comfortable AskingFor Assistance
Ready To Start College
Figure SBS4. Average Ratings on Preparedness Items (Ns=44, 34, 67)
2013 2012 2011
The Greatest Benefit of Participating in Summer Bridge:
"Working with the tutors because they really do help you understand the concept."

________________________________________________________________________
Institutional Research & Planning; BSI-HSI Activity Evaluation Report 2014 91
Knowledge Summer Bridge participants were asked about some of the knowledge they had gained about themselves or library resources. Figure SBS5 shows that overwhelmingly students agreed with the statement that “The library component of Summer Bridge helped me know what library resources are available,” with an average rating near 9 on the 0-to-10 scale. Students also indicated that they knew their preferred learning style, and that the reading component of Summer Bridge helped them gain a clear understanding of their reading level.
8.84
8.52
9.12
8.65
8.56
9.19
0 2 4 6 8 10
I Know My Preferred Learning Style
Clear Understanding Of My ReadingLevel
Figure SBS5. Average Ratings on Knowledge Items (Ns=44, 34, 66)
2013 2012 2011

________________________________________________________________________
Institutional Research & Planning; BSI-HSI Activity Evaluation Report 2014 92
Instruction Modalities Instruction was delivered during Summer Bridge in various amounts through three modalities: (1) working with the tutor, (2) computer instruction, and (3) classroom lectures. Students rated how effective they thought these different instruction modalities were for each of three components of the Summer Bridge program: math, reading, and library.
Figure SBS6 reveals that working with the math tutor was regarded as very effective. Classroom lectures and computer instruction in math were also regarded as effective, though less so compared to working with the math tutor.
9.127.62
8.407.33
.00
2.00
4.00
6.00
8.00
10.00
Working with the MathTutor
Math Instruction on theComputer
Eff
ecti
vene
ss
Figure SBS6. Effectiveness Ratings of Instruction Modalities for Math (Ns=34, 45)
2012 2013
The Greatest Benefit of Participating in Summer Bridge:
"I think that the greatest benifit is that if you actually try then you will be able to move up a level. The tutors are also a lot of help and they make you understand things that you didnt know before."

________________________________________________________________________
Institutional Research & Planning; BSI-HSI Activity Evaluation Report 2014 93
The effectiveness ratings for the reading component are found in Figure SBS7. All three modes of instruction were regarded by participants as effective.
7.71 8.26 8.448.80 8.59 8.15
.00
2.00
4.00
6.00
8.00
10.00
Working with theReading Tutor
ReadingInstruction on the
Computer
ReadingClassroomLectures
Eff
ecti
vene
ssFigure SBS7. Effectiveness Ratings of
Instruction Modalities for Reading
2012 2013

________________________________________________________________________
Institutional Research & Planning; BSI-HSI Activity Evaluation Report 2014 94
Summer Bridge participants were also asked about the amount of time they thought should be allotted in the future to the different modalities for each component of Summer Bridge. The tables that follow reveal that for each modality within each component, a large proportion of the students suggested keeping the time allocation about the same. However, of those recommending a change, overwhelmingly the suggested change was an increase for all elements.
Math. Table SBS1 shows that most students recommended more time working with the tutor.
Activity Recommended Time 2012 2013A Lot Less 0.0% 0.0%A Little Less 8.8% 2.2%Keep It about the Same 47.1% 26.7%A Little More 26.5% 37.8%A Lot More 17.6% 33.3%Count 34 45A Lot Less 6.5% 13.3%A Little Less 12.9% 24.4%Keep It about the Same 45.2% 33.3%A Little More 29.0% 11.1%A Lot More 6.5% 17.8%Count 31 45
Working with the Math Tutor
Math Instruction on the Computer
Table SBS1. Recommended Time Allocation for Math

________________________________________________________________________
Institutional Research & Planning; BSI-HSI Activity Evaluation Report 2014 95
Reading. Student recommendations for how much time should be spent on the different instruction modalities for the reading component are found in Table SBS2. Most students recommended more reading time allocated to working with the tutor. Nearly half of the students recommended an increase in reading instruction on the computer.
Activity Recommended Time 2012 2013A Lot Less 0.0% 0.0%A Little Less 2.9% 0.0%Keep It about the Same 35.3% 26.7%A Little More 41.2% 33.3%A Lot More 20.6% 40.0%Count 34 30A Lot Less 0.0% 0.0%A Little Less 9.1% 10.0%Keep It about the Same 45.5% 40.0%A Little More 36.4% 26.7%A Lot More 9.1% 23.3%Count 33 30A Lot Less 3.0% 0.0%A Little Less 6.1% 3.4%Keep It about the Same 54.5% 34.5%A Little More 27.3% 34.5%A Lot More 9.1% 27.6%Count 33 29
Table SBS2. Recommended Time Allocation for Reading
Working with the Reading Tutor
Reading Instruction on the Computer
Reading Classroom Lectures

________________________________________________________________________
Institutional Research & Planning; BSI-HSI Activity Evaluation Report 2014 96
Library. Just over half (52.9%) of the students favored increased time to library instruction on the computer, and just over half (51.5%) of the students favored increased time to library classroom lectures. This is seen in Table SBS3.
Activity Recommended Time 2012 2013A Lot Less 0.0% 4.8%A Little Less 0.0% 0.0%Keep It about the Same 47.1% 52.4%A Little More 38.2% 28.6%A Lot More 14.7% 14.3%Count 34 21A Lot Less 0.0% 0.0%A Little Less 3.0% 22.7%Keep It about the Same 45.5% 40.9%A Little More 39.4% 22.7%A Lot More 12.1% 13.6%Count 33 22
Table SBS3. Recommended Time Allocation for Library
Library Instruction on the Computer
Library Classroom Lectures
Benefit Students overwhelmingly viewed the Summer Bridge program as beneficial. Table SBS4 shows that 94 to 95% of the students regarded the program as very or extremely beneficial. Respondents were also asked about what they thought was the greatest benefit of participating in Summer Bridge. Their responses are found in Table SBS5.
YearNot At All Beneficial
A Little Beneficial
Moderately Beneficial
Very Beneficial
Extremely Beneficial Total
1 0 1 16 25 432.3% 0.0% 2.3% 37.2% 58.1% 100.0%
0 1 1 9 23 340.0% 2.9% 2.9% 26.5% 67.6% 100.0%
0 5 11 32 19 670.0% 7.5% 16.4% 47.8% 28.4% 100.0%
2013
2011
2012
Table SBS4. Perceived Benefit of Participating in Summer Bridge

________________________________________________________________________
Institutional Research & Planning; BSI-HSI Activity Evaluation Report 2014 97
Table SBS5. Greatest Benefit of Participating in Summer Bridge - 2013
After all these years that I have not being in school it was very helpful to have the oportunity to keep learning English with Mr. Lee.Being able to help sharpen my math skills.Counseling help for courses needed to be taken. Workshops. Financial Aid assistance. Very open to helping out students and making sure they sign up for the right classes.everythingfree foodGetting a feel for College before it actually starts.Getting practice with my math skills and reading skillsGetting the help and learning what college is going to be likeGetting to become more comfortable at the campus and confident in my math skills.got to be more CONFIDENTgreatest benefit of being in summer bridge is that i got to practice some old math skillsHands on with the tutors, easy to talk to.Having the opportunity to get ahead in my studies.Having this teachers Mr. lee, Mr Diego and Ms Siegried because they help me to comprehend alot of thinks I didn't know. They help to relize that i need school to get somewhere so this was the best part to have them as teacher.I get to have my math skills refreshed and to have a review in math so I actually remember things and not forget all the math i've learned when college starts.I Have gotten alot better at reading and math.I have learned about various programs offered at Palomar.I have learned very important rules for grammar, and I think they are really useful to do my test.i learn in what leave i am of math and englishI learned more grammar.I refreshed my algebra skills and will be able to use them when I attend college in the fall.I think that the greatest benifit is that if you actually try then you will be able to move up a level. The tutors are also a lot of help and they make you understand things that you didnt know before.If I wouldn't been in this program I would of been lost on what I needed to do on rolling in my classes and knowing what was going with palomar college. If i wouldn't been in the summer bridge I would been have the knowledge i thought i didn't had today. I learned the things i didn't knew i had in me.

________________________________________________________________________
Institutional Research & Planning; BSI-HSI Activity Evaluation Report 2014 98
Table SBS5. ContinuedIt helped me pick up on a lot of new math skills before starting in the fall.Knowing my english level and getting help with it.Learning how to enroll in classes.learning mathMy greatest benefit is develop strong relationship with tutor , and I could experience how the college life be .Participating in the Summer Bridge Program has greatest benefits including counceling class, learning Math or refreshing, and not to mention the tutors who helped us a lot.Preparing for collegePreparing for next semesters Math class.Progressing in MathRefreshed my math skills that I had forgotten.refreshing my math skills.Simple math chapters.staying on track, and having math fresh in my mind, preparing for the fall.teachers, tutors, computer timeTeam work, discussion answers in a class, doing home work in a class. I learned about critical thinking, and how it's important to eleminate the answers that are wrong to get faster to the right answer.thanks for the helpthat i have the possibility to be able to progress and even get bumped into the next class if i worked hard at it.That I was able to improve my mathematical capabilities.the ability to test out of a classThe communication with other people.the greastes benefit of been in this program its that it gives you like a head start on how your class might be and they focused on one thing mostly on what you really need depending on your knowledge that you have and this has help me alot because i didnt have too paythe greatest benefit is that you are gething a chance to advance on your math and english level.Another benefit is that you get to meat new people.The greatest benefit of participating in Summer Bridge is I have more of an idea of how college is and the tutors are amazing and very helpful.Katie and Dona are extremely helpful and do their job well as counselors. I had a great experience with summer bridge and would love to join again next summer.

________________________________________________________________________
Institutional Research & Planning; BSI-HSI Activity Evaluation Report 2014 99
Table SBS5. ContinuedThe greatest benefit of participating in the Summer Bridge Program was that I learned a lot of new things that I had never seem. For example, I was on ESL Jam and this program helped me to improve my writing and reading skills. In addition, it helped me to understand and learn more about grammar.The greatest benefit of participating in the summer bridge was learning grammar and punctuation. Also learning the differences between subodinating conjunctions, cordination conjuctions, ideantifying, non-identifying, etc. I feel well prepared as a first year expirence student.The greatest benefit of summmer brideg was being able to improve my mathematical skills and review important topics.The greatest benefit was moving up a level in math.The greatest benefit was that you can move up to 2 levels.The greatest beniefit i had during the summer bridge prgram was the counselling sessions and the financial aid workshops.The greatest benit i got from the Summer Bridge program, is that i got help to chose the classes i need it and enrolled in them.The greatest thing about summer bridge is that it prepares you for college, and reach your goals streamly high in just some few weeks.The intensity of the course was very important. I could learn a lot of grammar. I could improve my vocabulary and writing skills.This summerbridge has been helpful for me becuase I learn more math and I get to learn more.
To participate in summer bridge program was a great opportunity for me to improve my knowledge in English, also to become visualize the life of a student in college.We get the opportunity to strengthen our math skills for free with the help of online services and tutors.
working on the computer was for me the most beneficial thing in summer bridge
Working with the tutors because they really do help you understand the concept.Yes, I think this program was great because it helped to understand and comprehend better this language.

________________________________________________________________________
Institutional Research & Planning; BSI-HSI Activity Evaluation Report 2014 100
Improvement Students offered their recommendations for how to improve the Summer Bridge program. These recommendations are found in Table SBS6.
Table SBS6. Recommendation for Improvement of Summer Bridge - 2013
- I would like more time. I think that 7 or 8 weeks is more appropriate than 3 weeks. -I would like have more time to do more academic writing every day. - The reading component has excellent teachers, tutors and computers but it was very short.- More tutors - Less computer work - More assistance - Emphasize on Financial Aid Guide - How many days you have to pay for classes - How much classes are - Help studensts with special circumsyances (AB-540) - Breakdown on classes and what the numbers meana bit more of lecture and a bit less on computerAdd a few more weeks to the program. I was unable to complete all of my program.everthing is perfectGive different food's brakefest and luch each week.Give out Free Lunch More oftengive us each day of class... i did not like the week offGiving more lectures and lessons. Such as, the day there was a fraction workshop.Have more instruction in the math part not just on the computer all the timeI recommend giving more time to students to study during the Summer Bridge program.I don't have any recommendations about the Summer Bridge program. I enjoyed everything about this program.I think that the Summer bridge program is fine how it is, well that is my opinion.I think that this is a very useful program, and I don't have anything to add. For me, this program works perfectly but it depends each student.I think this program could be beeter if you added two more weeks.I think you should lower the time instedof 3 o'clock do it early because people have to work or do some other important thinks I know that school is important but people need to pay bill or work for the family.I would include a part of gramma about a/the articalces and more writing. Also reading course has to be longer, 4 days is not enough.I would like that teacher practice more with the students in class and use less the computer.

________________________________________________________________________
Institutional Research & Planning; BSI-HSI Activity Evaluation Report 2014 101
Table SBS6. Continuedi would like to have a free or reduce cost on parking permit because is just one month and during enrollment class time have more time with each student and don't ask for code permiss to enroll my self and for food tacosI would recommend a lot less computer time and more interaction in the class.Computer work is tiring.I would recommend having students placed in a classroom with their appropriate math level so that they can coorperate together to help others solve difficult problems.I would suggest putting more emphasis on doing work at home, as compared to only doing work at school.It needs to have a lilttle more time so the lectures don't have so many things to learn all at once.Keep it the same.less hours in school and more sustancial activities.Make everyone check out the same book and have homework about it. Take a homework quiz about the readung the next day in class. Start Summer Bridge earlier like around 7:30 A.M.Maybe a little long so there is no rush and more can get done.Maybe offer more interactive learningMore lecturesmore person to person interaction less computermore timeMore tutors.n/anahNeed more sessions, like the one on Fractions. Game's were not useful. More class room instruction on basics, i.e. math.noNono all was great. maybe different lunch ideas. but other than that all was great thank you.no i don't have any recommendationsNo, everything was o.k.No.none that I cant think ofNope

________________________________________________________________________
Institutional Research & Planning; BSI-HSI Activity Evaluation Report 2014 102
Table SBS6. Continuednot have it all on technology, i personally find it easier when i have an instructor teach me the steps the computer doesnt help all the time for me to understandnot have it so longnothing really from me i loved everything about itPersonally , I think Summer Bridege program is very helpful and exceptionally benefit for who enrolled in the program . I would recommend this program should extend a little longer, for students might need extra help to gain more momentum before enter to fall .Seperate the different levels, and have the instructor give examples on the board where people need help.
that instead of working on the computer all day for the math portion you should have one on one,like teaching a class with books,because the computer does not helpThe recommedations that I would suggest you is to hire more tutors, and also make the Summer Bridge Program a little more long. I think that four weeks are not enough to retake the assitment test again. Thank you so much for everything you have done for us during this 2013 Summer Bridge Program.To teach instead of testing in the reading class.
Well only paying attention on what your doing and what really matters. You got to be focouse on what your doing and comit on being in the summer bridge program. Achive your goal on the program.
Work a little less on the computer and have more group activities.Yes they should give more lunch time for all the students are participating in the summerbridge.Yes, this program helps out a lot.

________________________________________________________________________
Institutional Research & Planning; BSI-HSI Activity Evaluation Report 2014 103
Summer Bridge Summary
The Summer Bridge program was quite successful in helping to move most of the participants on to Math 50 or higher. Some key points are noted below.
Eighty five percent of the Summer Bridge students from 2013 enrolled at Palomar in the fall.
Sixty one percent of the Summer Bridge students enrolled in Math 50 or higher in Fall 2013.
Summer Bridge students expressed high levels of satisfaction, and indicated that participation in Summer Bridge helped them become prepared for college success.
Students reported that participating in Summer Bridge was of great benefit to them.

________________________________________________________________________
Institutional Research & Planning; BSI-HSI Activity Evaluation Report 2014 104
SUMMARY
Overall, the findings of this report were positive. Each BSI-HSI activity addressed in this report showed a positive impact on student outcomes. Students using the TLC, and students using tutoring services were retained and succeeded at higher rates than did other students taking the same courses. Learning community students and TLC users persisted at a higher rate than did other students. The survey results suggest that students in the learning communities were satisfied with the learning communities, and they thought the learning communities were very beneficial. Summer Bridge students also demonstrated positive outcomes in terms of entry into math courses above Math 15. Summer Bridge students expressed a great deal of satisfaction with the program, and indicated that it had been very beneficial to them.

________________________________________________________________________
Institutional Research & Planning; BSI-HSI Activity Evaluation Report 2014 105
APPENDIX A: LEARNING COMMUNITIES QUESTIONNAIRE ITEMS
Satisfaction
First we have some questions regarding your satisfaction with different aspects of the learning community. For each question, please use a scale of 0-to-10, where 0 means not at all satisfied and 10 means completely satisfied.
S1. Considering your experience in this learning community as a whole, how satisfied are you with the learning community that you are in?
_______
S2. How satisfied are you with the counseling you have received in your learning community?
_______
S3. How satisfied are you with the tutoring in your learning community?
_______
S4. How satisfied are you with the availability (outside of class time) of the faculty in your learning community?
_______
S5. How satisfied are you with your educational experience as a member of a learning community?
_______

________________________________________________________________________
Institutional Research & Planning; BSI-HSI Activity Evaluation Report 2014 106
S6. How satisfied are you with the integration of material across courses in your learning community?
_______
S7. How satisfied are you with the social activities of the learning community?
_______
S8. How satisfied are you with being with the same students in all of the classes in the learning community?
_______
Activities
This set of questions asks about various activities you might have engaged in during this semester. Please respond to the questions using a 0-to-10 scale where 0 means never and 10 means very frequently.
During this semester, how often have you …
E1. participated in class discussions?
_______
E2. worked with other students during class time?
_______
E3. worked with other students outside of class?
_______

________________________________________________________________________
Institutional Research & Planning; BSI-HSI Activity Evaluation Report 2014 107
E4. discussed assignments, grades, ideas, or other matters with faculty outside the classroom?
_______
E5. talked to faculty about assignments, grades, ideas, or other matters with faculty in class?
_______
E6. made use of student support services such as tutoring and counseling?
_______
Assignments and Learning
I1. To what extent have the assignments in your learning community classes required you to put different ideas together in new ways?
a. Not at all b. A little c. Some d. A lot e. A great deal
I2. How much have your learning community classes helped you become better at pulling different principles together?
a. Not at all b. A little c. Some d. A lot e. A great deal

________________________________________________________________________
Institutional Research & Planning; BSI-HSI Activity Evaluation Report 2014 108
I3. To what degree would you say that being in this learning community has improved your ability to see relationships between different topics within a class or in different classes?
a. Not at all b. A little c. Some d. A lot e. A great deal
We would like to ask you about SHARED ASSIGNMENTS in your learning community, that is, assignments that count toward your grades in more than one class, and require you to apply ideas from each of those classes.
I4. Did you have SHARED ASSIGNMENTS in your learning community?
a. Yes b. No c. Don’t know
[IF I4 <> Yes, GOTO Services & Support]
Using a 0-to10 scale where 0 means Strongly disagree and 10 means Strongly agree, please indicate how much you agree or disagree with the following:
The integrative assignments in my learning community …
I5. were enjoyable.
I6. made learning the material easier.
I7. were effective in showing me how different ideas connect to one another.
I8. made the assignments more meaningful.
I9. were interesting.

________________________________________________________________________
Institutional Research & Planning; BSI-HSI Activity Evaluation Report 2014 109
Services and Support
For each statement, please indicate the extent to which you agree or disagree (using a scale of 0-to-10, where 0 means strongly disagree and 10 means strongly agree).
U1. Being part of a learning community has helped me become aware of the services and support available at Palomar.
_______
U2. Being part of a learning community has made it easier for me get access to support services (advising, counseling, tutoring).
_______
U3. Instructors encourage students to get support on campus when they need it.
_______
Education Plans and Goals
Now we’d like to ask a few questions about Education Plans and progress toward your educational goals.
P1. Have you completed an Education Plan (that is, a form completed a counselor that outlines a sequence of courses to help you obtain your educational goal)?
a. Yes
b. No
c. Don’t know
[If P1=yes]
P2. Did you complete the Education Plan prior to starting in the learning community?

________________________________________________________________________
Institutional Research & Planning; BSI-HSI Activity Evaluation Report 2014 110
[If P1<> yes or P2=no]
P3. Did your participation in the learning community help you make progress on an Education Plan?
a. Yes
b. No
c. Don’t know
P4. For the statement below, using a scale of 0-to-10, where 0 means strongly disagree and 10 means strongly agree, please indicate the extent to which you agree or disagree.
Participating in a learning community has helped me progress toward my educational goals.
_______
General
G1. Using a 0-to-10 scale where 0 means not at all integrated and 10 means completely integrated, to what extent would you say that material was integrated across your learning community courses?
_______
G2. In general, how beneficial has it been for you to participate in this learning community?
a. Not at all beneficial
b. A little beneficial
c. Moderately beneficial
d. Very beneficial
e. Extremely beneficial

________________________________________________________________________
Institutional Research & Planning; BSI-HSI Activity Evaluation Report 2014 111
G2. How beneficial would you say it would be for you to participate in another learning community after you have completed this one?
a. Not at all beneficial
b. A little beneficial
c. Moderately beneficial
d. Very beneficial
e. Extremely beneficial
G3. What would you say has been the greatest benefit of participating in a learning community?
G4. Do you have any recommendations about how to improve the learning communities?
G5. Do you have any other comments about the topics addressed in this survey?
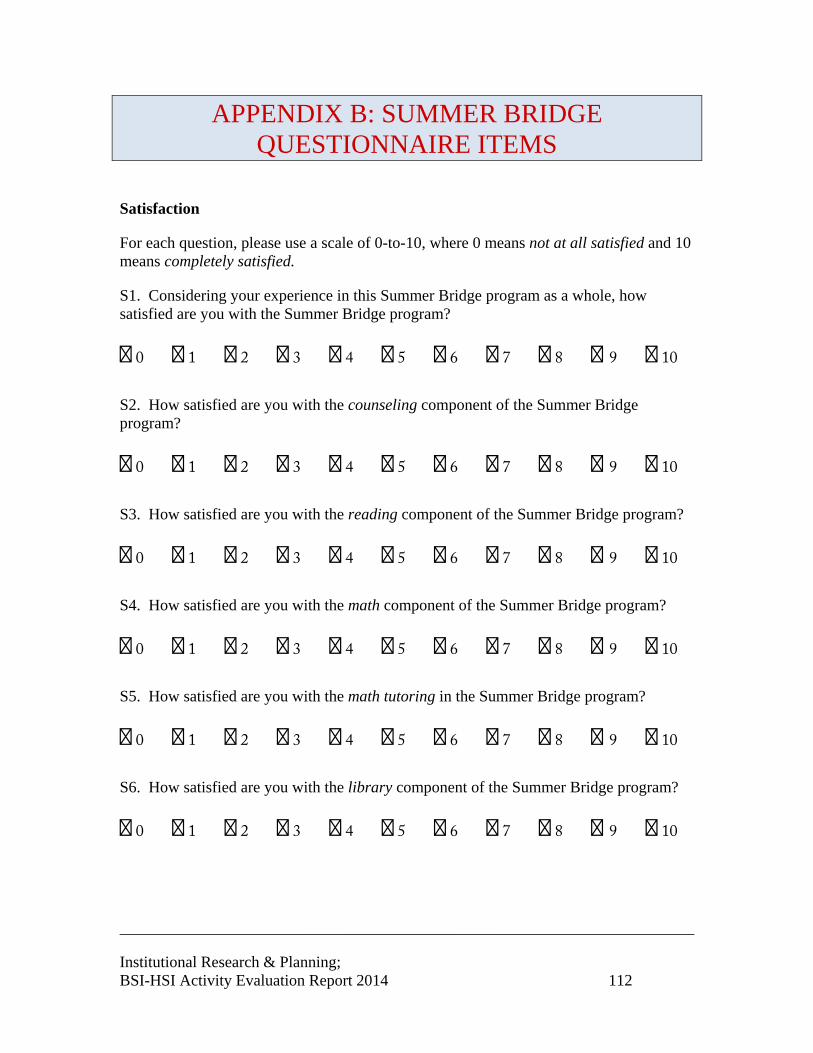
________________________________________________________________________
Institutional Research & Planning; BSI-HSI Activity Evaluation Report 2014 112
APPENDIX B: SUMMER BRIDGE QUESTIONNAIRE ITEMS
Satisfaction
For each question, please use a scale of 0-to-10, where 0 means not at all satisfied and 10 means completely satisfied.
S1. Considering your experience in this Summer Bridge program as a whole, how satisfied are you with the Summer Bridge program?
� 0 � 1 � 2 � 3 � 4 � 5 � 6 � 7 � 8 � 9 � 10
S2. How satisfied are you with the counseling component of the Summer Bridge program?
� 0 � 1 � 2 � 3 � 4 � 5 � 6 � 7 � 8 � 9 � 10
S3. How satisfied are you with the reading component of the Summer Bridge program?
� 0 � 1 � 2 � 3 � 4 � 5 � 6 � 7 � 8 � 9 � 10
S4. How satisfied are you with the math component of the Summer Bridge program?
� 0 � 1 � 2 � 3 � 4 � 5 � 6 � 7 � 8 � 9 � 10
S5. How satisfied are you with the math tutoring in the Summer Bridge program?
� 0 � 1 � 2 � 3 � 4 � 5 � 6 � 7 � 8 � 9 � 10
S6. How satisfied are you with the library component of the Summer Bridge program?
� 0 � 1 � 2 � 3 � 4 � 5 � 6 � 7 � 8 � 9 � 10

________________________________________________________________________
Institutional Research & Planning; BSI-HSI Activity Evaluation Report 2014 113
S7. How satisfied are you with the reading tutoring in the Summer Bridge program?
� 0 � 1 � 2 � 3 � 4 � 5 � 6 � 7 � 8 � 9 � 10
College Success
For each of the following statements, please indicate the extent to which you agree or disagree (using a scale of 0-to-10, where 0 means strongly disagree and 10 means strongly agree).
P1. I have learned valuable skills in the Summer Bridge program.
� 0 � 1 � 2 � 3 � 4 � 5 � 6 � 7 � 8 � 9 � 10
P2. As a result of Summer Bridge, I am better prepared to be successful in college.
� 0 � 1 � 2 � 3 � 4 � 5 � 6 � 7 � 8 � 9 � 10
P3. The Summer Bridge program has helped me feel more comfortable asking tutors for assistance.
� 0 � 1 � 2 � 3 � 4 � 5 � 6 � 7 � 8 � 9 � 10
P4. The Summer Bridge program has helped me become ready to start college in the fall.
� 0 � 1 � 2 � 3 � 4 � 5 � 6 � 7 � 8 � 9 � 10
P5. I know my preferred learning style, and how I learn best.
� 0 � 1 � 2 � 3 � 4 � 5 � 6 � 7 � 8 � 9 � 10
P6. The reading component of Summer Bridge provided me with a clear understanding of my reading level.
� 0 � 1 � 2 � 3 � 4 � 5 � 6 � 7 � 8 � 9 � 10

________________________________________________________________________
Institutional Research & Planning; BSI-HSI Activity Evaluation Report 2014 114
P7. The library component of Summer Bridge helped me know what library resources are available.
� 0 � 1 � 2 � 3 � 4 � 5 � 6 � 7 � 8 � 9 � 10
Program Components
For each component, using a scale of 0-to-10, where 0 means not at all effective and 10 means extremely effective, please indicate how effective the component was for you.
For the math portion of Summer Bridge, how effective the component was …
C1. working with the tutor
� 0 � 1 � 2 � 3 � 4 � 5 � 6 � 7 � 8 � 9 � 10
C2. working on the computer (e.g., video instruction, electronic resources)
� 0 � 1 � 2 � 3 � 4 � 5 � 6 � 7 � 8 � 9 � 10
C3. classroom lectures
� 0 � 1 � 2 � 3 � 4 � 5 � 6 � 7 � 8 � 9 � 10
For the reading portion of Summer Bridge, how effective the component was …
C4. working with the tutor
� 0 � 1 � 2 � 3 � 4 � 5 � 6 � 7 � 8 � 9 � 10
C5. working on the computer (e.g., video instruction, electronic resources)
� 0 � 1 � 2 � 3 � 4 � 5 � 6 � 7 � 8 � 9 � 10

________________________________________________________________________
Institutional Research & Planning; BSI-HSI Activity Evaluation Report 2014 115
C6. classroom lectures
� 0 � 1 � 2 � 3 � 4 � 5 � 6 � 7 � 8 � 9 � 10
For the library portion of Summer Bridge, how effective the component was …
C7. working on the computer (e.g., video instruction, electronic resources)
� 0 � 1 � 2 � 3 � 4 � 5 � 6 � 7 � 8 � 9 � 10
C8. classroom lectures
� 0 � 1 � 2 � 3 � 4 � 5 � 6 � 7 � 8 � 9 � 10
In the future, how much time would you say should be spent in Summer Bridge on …
MT1. working with the math tutor?
a. A lot more b. A little more c. Keep it about the same d. A little less e. A lot less
MT2. math work on the computer?
a. A lot more b. A little more c. Keep it about the same d. A little less e. A lot less
MT3. math class lectures?
a. A lot more b. A little more c. Keep it about the same d. A little less e. A lot less

________________________________________________________________________
Institutional Research & Planning; BSI-HSI Activity Evaluation Report 2014 116
MT4. working with the reading tutor?
a. A lot more b. A little more c. Keep it about the same d. A little less e. A lot less
MT5. reading work on the computer?
a. A lot more b. A little more c. Keep it about the same d. A little less e. A lot less
MT6. reading class lectures?
a. A lot more b. A little more c. Keep it about the same d. A little less e. A lot less
MT7. library work on the computer?
a. A lot more b. A little more c. Keep it about the same d. A little less e. A lot less
MT8. library class lectures?
a. A lot more b. A little more c. Keep it about the same d. A little less e. A lot less

________________________________________________________________________
Institutional Research & Planning; BSI-HSI Activity Evaluation Report 2014 117
General
G1. In general, how beneficial has it been for you to participate in the Summer Bridge program?
a. Not at all beneficial
b. A little beneficial
c. Moderately beneficial
d. Very beneficial
e. Extremely beneficial
G2. What would you say has been the greatest benefit of participating in Summer Bridge?
G3. Do you have any recommendations about how to improve the Summer Bridge program?