bubble entrainment and dispersion in plunging jet flows: …8290/jcr06_3a.pdf · 2019-10-11 ·...
TRANSCRIPT
Journal of Coastal Research 22 3 664–677 West Palm Beach, Florida May 2006
Bubble Entrainment and Dispersion in Plunging Jet Flows:Freshwater vs. SeawaterH. Chanson†, S. Aoki‡, and A. Hoque§
†Department of CivilEngineering
The University of QueenslandBrisbane QLD 4072, [email protected]
‡Department of Architectureand Civil Engineering
Toyohashi University ofTechnology
tempaku-cho, Toyohashi441-8580, Japan
§Department of MathematicsRajshahi UniversityRajshahi-6205, Bangladesh
ABSTRACT
CHANSON, H.; AOKI, S., and HOQUE, A., 2006. Bubble entrainment and dispersion in plunging jet flows: freshwatervs. seawater. Journal of Coastal Research, 22(3), 664–677. West Palm Beach (Florida), ISSN 0749-0208.
Air entrainment and bubble dispersion were studied systematically at vertical circular plunging jets in freshwater,saltwater, and seawater. Although the inception conditions for air entrainment are identical for all water solutions,experimental results show lesser air entrainment in seawater plunging jets for identical inflow conditions. Comparisonbetween seawater and saltwater results suggest that organic matter and biochemicals harden the induction trumpetat plunge point and diminish air entrapment at impingement in seawater. Froude-similar experiments with differentgeometric scales show lesser air entrainment for inflow conditions satisfying , 103. The results show that2r V d /sw 1 1
classical dimensional analysis of air entrainment is incomplete, while they would imply scales effects in terms of airentrainment for small laboratory studies with wave height at breaking less than 0.3 m.
ADDITIONAL INDEX WORDS: Air entrainment, similitude, physical modeling, scale effects, seawater.
INTRODUCTION
The aeration of the ocean is an important process for themass exchange of nitrogen, oxygen, and carbon dioxide be-tween the atmosphere and the ocean. During storm events orfor large wind speeds, wave breaking with extensive air bub-ble entrainment occurs. Large numbers of bubbles are en-trained as shown by COLES (1967), DEANE and STOKES
(2002), LIN and HWUNG (1992), LONGUET-HIGGINS (1988),and MELVILLE and RAPP (1985). WALLACE and WIRICK
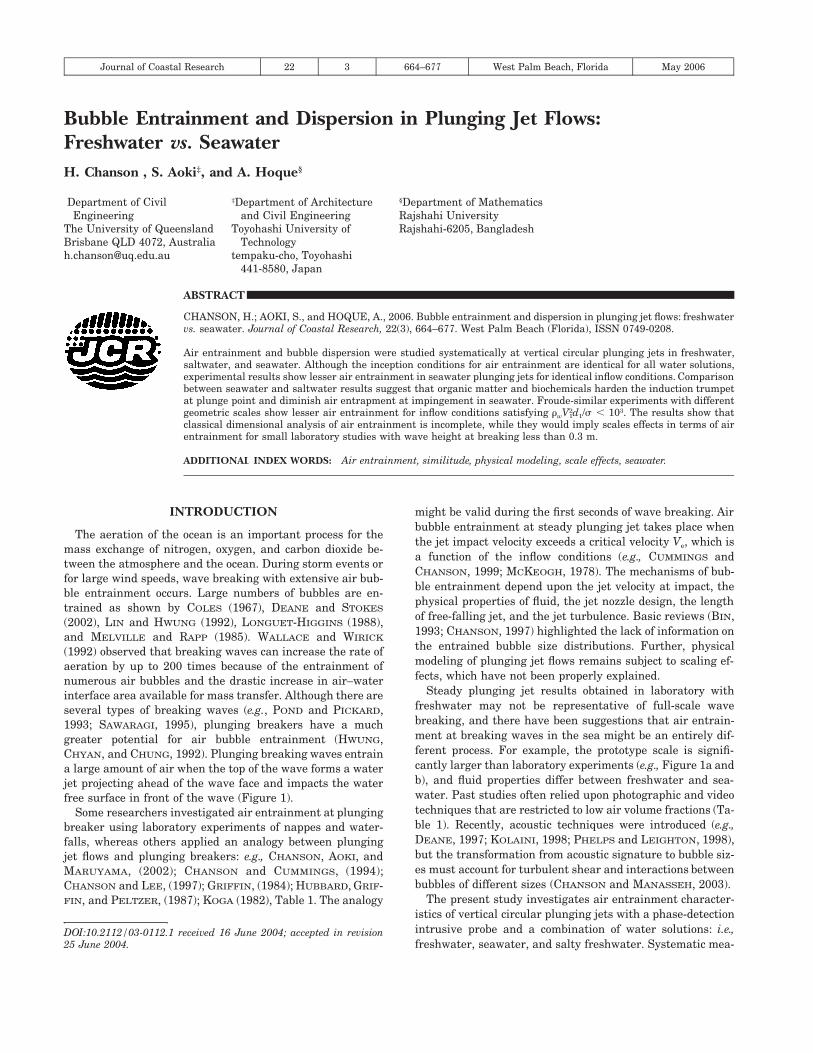
(1992) observed that breaking waves can increase the rate ofaeration by up to 200 times because of the entrainment ofnumerous air bubbles and the drastic increase in air–waterinterface area available for mass transfer. Although there areseveral types of breaking waves (e.g., POND and PICKARD,1993; SAWARAGI, 1995), plunging breakers have a muchgreater potential for air bubble entrainment (HWUNG,CHYAN, and CHUNG, 1992). Plunging breaking waves entraina large amount of air when the top of the wave forms a waterjet projecting ahead of the wave face and impacts the waterfree surface in front of the wave (Figure 1).
Some researchers investigated air entrainment at plungingbreaker using laboratory experiments of nappes and water-falls, whereas others applied an analogy between plungingjet flows and plunging breakers: e.g., CHANSON, AOKI, andMARUYAMA, (2002); CHANSON and CUMMINGS, (1994);CHANSON and LEE, (1997); GRIFFIN, (1984); HUBBARD, GRIF-FIN, and PELTZER, (1987); KOGA (1982), Table 1. The analogy
DOI:10.2112/03-0112.1 received 16 June 2004; accepted in revision25 June 2004.
might be valid during the first seconds of wave breaking. Airbubble entrainment at steady plunging jet takes place whenthe jet impact velocity exceeds a critical velocity Ve, which isa function of the inflow conditions (e.g., CUMMINGS andCHANSON, 1999; MCKEOGH, 1978). The mechanisms of bub-ble entrainment depend upon the jet velocity at impact, thephysical properties of fluid, the jet nozzle design, the lengthof free-falling jet, and the jet turbulence. Basic reviews (BIN,1993; CHANSON, 1997) highlighted the lack of information onthe entrained bubble size distributions. Further, physicalmodeling of plunging jet flows remains subject to scaling ef-fects, which have not been properly explained.
Steady plunging jet results obtained in laboratory withfreshwater may not be representative of full-scale wavebreaking, and there have been suggestions that air entrain-ment at breaking waves in the sea might be an entirely dif-ferent process. For example, the prototype scale is signifi-cantly larger than laboratory experiments (e.g., Figure 1a andb), and fluid properties differ between freshwater and sea-water. Past studies often relied upon photographic and videotechniques that are restricted to low air volume fractions (Ta-ble 1). Recently, acoustic techniques were introduced (e.g.,DEANE, 1997; KOLAINI, 1998; PHELPS and LEIGHTON, 1998),but the transformation from acoustic signature to bubble siz-es must account for turbulent shear and interactions betweenbubbles of different sizes (CHANSON and MANASSEH, 2003).
The present study investigates air entrainment character-istics of vertical circular plunging jets with a phase-detectionintrusive probe and a combination of water solutions: i.e.,freshwater, seawater, and salty freshwater. Systematic mea-
665Bubble Entrainment and Dispersion in Plunging Jet Flows
Journal of Coastal Research, Vol. 22, No. 3, 2006
Figure 1. Photographs of air bubble entrainment at plunging breakingwaves. (a) Breaking wave with surfer at Point Danger, Gold Coast (Aus-tralia) on 13 April 2001. (b) Laboratory model of a plunging breaker ona sloping beach. Water depth: 0.5 m; beach slope:1V:6H, Freshwater.
surements of air–water flow characteristics were performedfor a range of flow situations including those with large voidfractions (up to 45%). The study is focused on inception con-ditions for air entrainment, air entrainment rate, bubble pro-duction rate, and bubble chord sizes. Applications are dis-cussed, including scale effects in terms of air entrainment.
Similitude and Dimensional Analysis
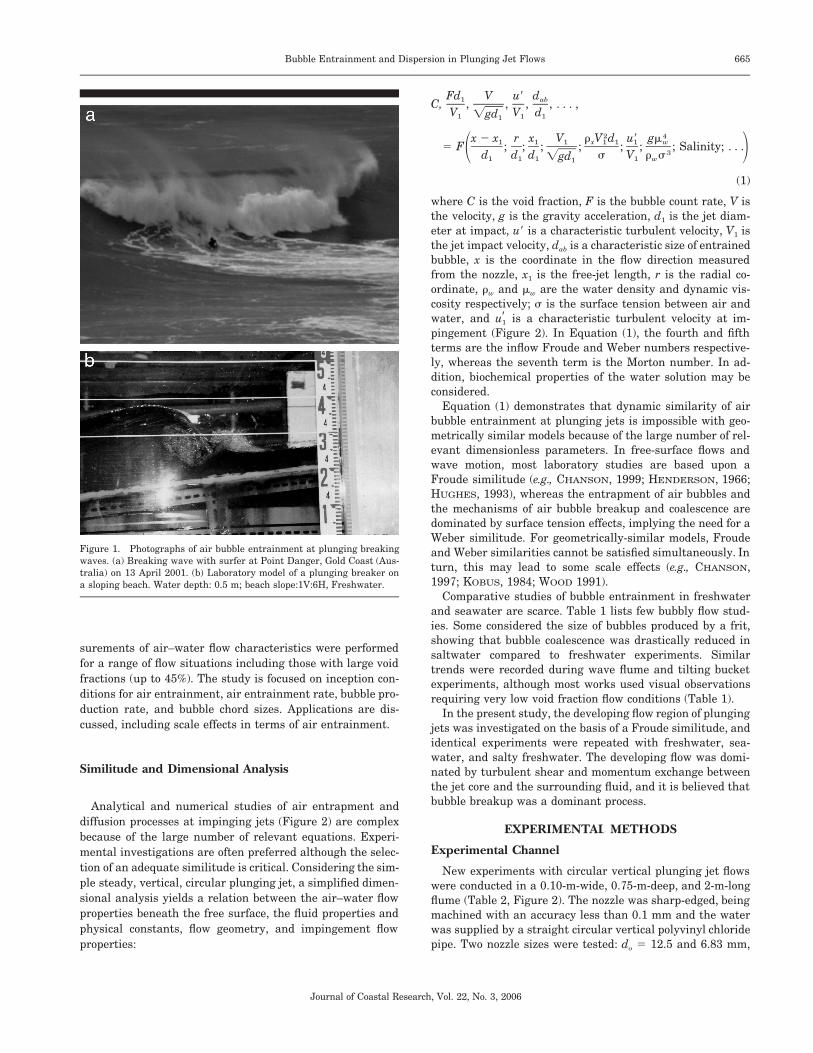
Analytical and numerical studies of air entrapment anddiffusion processes at impinging jets (Figure 2) are complexbecause of the large number of relevant equations. Experi-mental investigations are often preferred although the selec-tion of an adequate similitude is critical. Considering the sim-ple steady, vertical, circular plunging jet, a simplified dimen-sional analysis yields a relation between the air–water flowproperties beneath the free surface, the fluid properties andphysical constants, flow geometry, and impingement flowproperties:
Fd V u9 d1 abC, , , , , . . . ,V V dÏgd1 1 11
2 4x 2 x r x V r V d u9 gm1 1 1 x 1 1 1 w5 F ; ; ; ; ; ; ; Salinity; . . .31 2d d d s V r sÏgd1 1 1 1 w1
(1)
where C is the void fraction, F is the bubble count rate, V isthe velocity, g is the gravity acceleration, d1 is the jet diam-eter at impact, u9 is a characteristic turbulent velocity, V1 isthe jet impact velocity, dab is a characteristic size of entrainedbubble, x is the coordinate in the flow direction measuredfrom the nozzle, x1 is the free-jet length, r is the radial co-ordinate, rw and mw are the water density and dynamic vis-cosity respectively; s is the surface tension between air andwater, and is a characteristic turbulent velocity at im-′u1
pingement (Figure 2). In Equation (1), the fourth and fifthterms are the inflow Froude and Weber numbers respective-ly, whereas the seventh term is the Morton number. In ad-dition, biochemical properties of the water solution may beconsidered.
Equation (1) demonstrates that dynamic similarity of airbubble entrainment at plunging jets is impossible with geo-metrically similar models because of the large number of rel-evant dimensionless parameters. In free-surface flows andwave motion, most laboratory studies are based upon aFroude similitude (e.g., CHANSON, 1999; HENDERSON, 1966;HUGHES, 1993), whereas the entrapment of air bubbles andthe mechanisms of air bubble breakup and coalescence aredominated by surface tension effects, implying the need for aWeber similitude. For geometrically-similar models, Froudeand Weber similarities cannot be satisfied simultaneously. Inturn, this may lead to some scale effects (e.g., CHANSON,1997; KOBUS, 1984; WOOD 1991).
Comparative studies of bubble entrainment in freshwaterand seawater are scarce. Table 1 lists few bubbly flow stud-ies. Some considered the size of bubbles produced by a frit,showing that bubble coalescence was drastically reduced insaltwater compared to freshwater experiments. Similartrends were recorded during wave flume and tilting bucketexperiments, although most works used visual observationsrequiring very low void fraction flow conditions (Table 1).
In the present study, the developing flow region of plungingjets was investigated on the basis of a Froude similitude, andidentical experiments were repeated with freshwater, sea-water, and salty freshwater. The developing flow was domi-nated by turbulent shear and momentum exchange betweenthe jet core and the surrounding fluid, and it is believed thatbubble breakup was a dominant process.
EXPERIMENTAL METHODS
Experimental Channel
New experiments with circular vertical plunging jet flowswere conducted in a 0.10-m-wide, 0.75-m-deep, and 2-m-longflume (Table 2, Figure 2). The nozzle was sharp-edged, beingmachined with an accuracy less than 0.1 mm and the waterwas supplied by a straight circular vertical polyvinyl chloridepipe. Two nozzle sizes were tested: do 5 12.5 and 6.83 mm,
666 Chanson, Aoki, and Hoque
Journal of Coastal Research, Vol. 22, No. 3, 2006
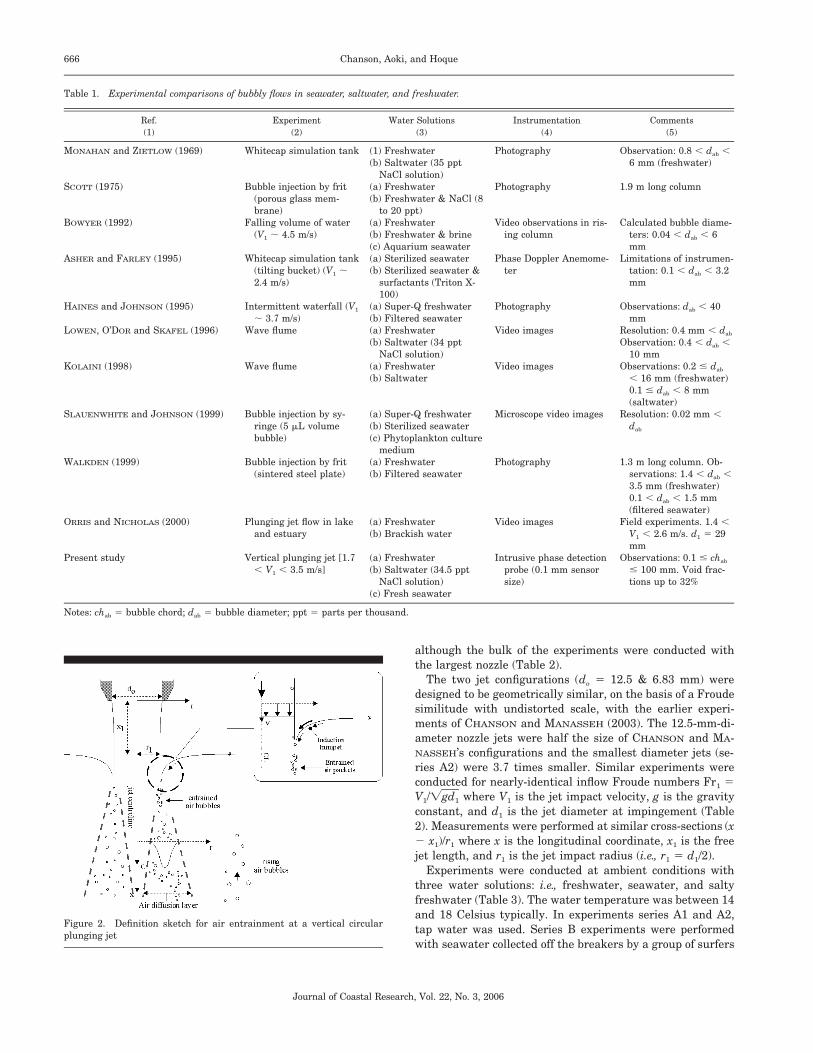
Table 1. Experimental comparisons of bubbly flows in seawater, saltwater, and freshwater.
Ref.(1)
Experiment(2)
Water Solutions(3)
Instrumentation(4)
Comments(5)
MONAHAN and ZIETLOW (1969) Whitecap simulation tank (1) Freshwater(b) Saltwater (35 ppt
NaCl solution)
Photography Observation: 0.8 , dab ,6 mm (freshwater)
SCOTT (1975) Bubble injection by frit(porous glass mem-brane)
(a) Freshwater(b) Freshwater & NaCl (8
to 20 ppt)
Photography 1.9 m long column
BOWYER (1992) Falling volume of water(V1 ; 4.5 m/s)
(a) Freshwater(b) Freshwater & brine(c) Aquarium seawater
Video observations in ris-ing column
Calculated bubble diame-ters: 0.04 , dab , 6mm
ASHER and FARLEY (1995) Whitecap simulation tank(tilting bucket) (V1 ;2.4 m/s)
(a) Sterilized seawater(b) Sterilized seawater &
surfactants (Triton X-100)
Phase Doppler Anemome-ter
Limitations of instrumen-tation: 0.1 , dab , 3.2mm
HAINES and JOHNSON (1995) Intermittent waterfall (V1
; 3.7 m/s)(a) Super-Q freshwater(b) Filtered seawater
Photography Observations: dab , 40mm
LOWEN, O’DOR and SKAFEL (1996) Wave flume (a) Freshwater(b) Saltwater (34 ppt
NaCl solution)
Video images Resolution: 0.4 mm , dab
Observation: 0.4 , dab ,10 mm
KOLAINI (1998) Wave flume (a) Freshwater(b) Saltwater
Video images Observations: 0.2 # dab
, 16 mm (freshwater)0.1 # dab , 8 mm(saltwater)
SLAUENWHITE and JOHNSON (1999) Bubble injection by sy-ringe (5 mL volumebubble)
(a) Super-Q freshwater(b) Sterilized seawater(c) Phytoplankton culture
medium
Microscope video images Resolution: 0.02 mm ,dab
WALKDEN (1999) Bubble injection by frit(sintered steel plate)
(a) Freshwater(b) Filtered seawater
Photography 1.3 m long column. Ob-servations: 1.4 , dab ,3.5 mm (freshwater)0.1 , dab , 1.5 mm(filtered seawater)
ORRIS and NICHOLAS (2000) Plunging jet flow in lakeand estuary
(a) Freshwater(b) Brackish water
Video images Field experiments. 1.4 ,V1 , 2.6 m/s. d1 5 29mm
Present study Vertical plunging jet [1.7, V1 , 3.5 m/s]
(a) Freshwater(b) Saltwater (34.5 ppt
NaCl solution)(c) Fresh seawater
Intrusive phase detectionprobe (0.1 mm sensorsize)
Observations: 0.1 # chab
# 100 mm. Void frac-tions up to 32%
Notes: chab 5 bubble chord; dab 5 bubble diameter; ppt 5 parts per thousand.
Figure 2. Definition sketch for air entrainment at a vertical circularplunging jet
although the bulk of the experiments were conducted withthe largest nozzle (Table 2).
The two jet configurations (do 5 12.5 & 6.83 mm) weredesigned to be geometrically similar, on the basis of a Froudesimilitude with undistorted scale, with the earlier experi-ments of CHANSON and MANASSEH (2003). The 12.5-mm-di-ameter nozzle jets were half the size of CHANSON and MA-NASSEH’s configurations and the smallest diameter jets (se-ries A2) were 3.7 times smaller. Similar experiments wereconducted for nearly-identical inflow Froude numbers Fr1 5V1/Ïgd1 where V1 is the jet impact velocity, g is the gravityconstant, and d1 is the jet diameter at impingement (Table2). Measurements were performed at similar cross-sections (x2 x1)/r1 where x is the longitudinal coordinate, x1 is the freejet length, and r1 is the jet impact radius (i.e., r1 5 d1/2).
Experiments were conducted at ambient conditions withthree water solutions: i.e., freshwater, seawater, and saltyfreshwater (Table 3). The water temperature was between 14and 18 Celsius typically. In experiments series A1 and A2,tap water was used. Series B experiments were performedwith seawater collected off the breakers by a group of surfers
667Bubble Entrainment and Dispersion in Plunging Jet Flows
Journal of Coastal Research, Vol. 22, No. 3, 2006
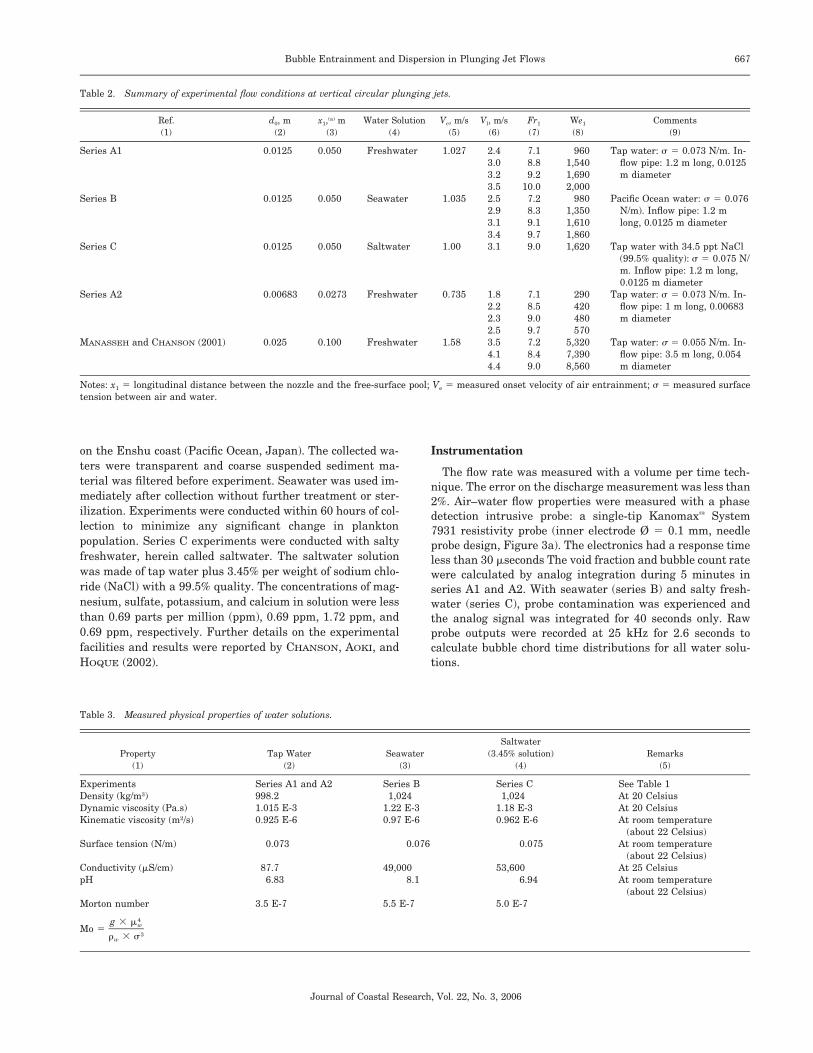
Table 2. Summary of experimental flow conditions at vertical circular plunging jets.
Ref.(1)
d0, m(2)
x1,(a) m(3)
Water Solution(4)
Ve, m/s(5)
Vl, m/s(6)
Fr1
(7)We1
(8)Comments
(9)
Series A1 0.0125 0.050 Freshwater 1.027 2.43.03.23.5
7.18.89.2
10.0
9601,5401,6902,000
Tap water: s 5 0.073 N/m. In-flow pipe: 1.2 m long, 0.0125m diameter
Series B 0.0125 0.050 Seawater 1.035 2.52.93.13.4
7.28.39.19.7
9801,3501,6101,860
Pacific Ocean water: s 5 0.076N/m). Inflow pipe: 1.2 mlong, 0.0125 m diameter
Series C 0.0125 0.050 Saltwater 1.00 3.1 9.0 1,620 Tap water with 34.5 ppt NaCl(99.5% quality): s 5 0.075 N/m. Inflow pipe: 1.2 m long,0.0125 m diameter
Series A2 0.00683 0.0273 Freshwater 0.735 1.82.22.32.5
7.18.59.09.7
290420480570
Tap water: s 5 0.073 N/m. In-flow pipe: 1 m long, 0.00683m diameter
MANASSEH and CHANSON (2001) 0.025 0.100 Freshwater 1.58 3.54.14.4
7.28.49.0
5,3207,3908,560
Tap water: s 5 0.055 N/m. In-flow pipe: 3.5 m long, 0.054m diameter
Notes: x1 5 longitudinal distance between the nozzle and the free-surface pool; Ve 5 measured onset velocity of air entrainment; s 5 measured surfacetension between air and water.
Table 3. Measured physical properties of water solutions.
Property(1)
Tap Water(2)
Seawater(3)
Saltwater(3.45% solution)
(4)Remarks
(5)
ExperimentsDensity (kg/m3)Dynamic viscosity (Pa.s)Kinematic viscosity (m2/s)
Series A1 and A2998.21.015 E-30.925 E-6
Series B1,024
1.22 E-30.97 E-6
Series C1,024
1.18 E-30.962 E-6
See Table 1At 20 CelsiusAt 20 CelsiusAt room temperature
(about 22 Celsius)Surface tension (N/m)
Conductivity (mS/cm)pH
0.073
87.76.83
0.076
49,0008.1
0.075
53,6006.94
At room temperature(about 22 Celsius)
At 25 CelsiusAt room temperature
(about 22 Celsius)Morton number
4g 3 mwMo 53r 3 sw
3.5 E-7 5.5 E-7 5.0 E-7
on the Enshu coast (Pacific Ocean, Japan). The collected wa-ters were transparent and coarse suspended sediment ma-terial was filtered before experiment. Seawater was used im-mediately after collection without further treatment or ster-ilization. Experiments were conducted within 60 hours of col-lection to minimize any significant change in planktonpopulation. Series C experiments were conducted with saltyfreshwater, herein called saltwater. The saltwater solutionwas made of tap water plus 3.45% per weight of sodium chlo-ride (NaCl) with a 99.5% quality. The concentrations of mag-nesium, sulfate, potassium, and calcium in solution were lessthan 0.69 parts per million (ppm), 0.69 ppm, 1.72 ppm, and0.69 ppm, respectively. Further details on the experimentalfacilities and results were reported by CHANSON, AOKI, andHOQUE (2002).
Instrumentation
The flow rate was measured with a volume per time tech-nique. The error on the discharge measurement was less than2%. Air–water flow properties were measured with a phasedetection intrusive probe: a single-tip Kanomaxy System7931 resistivity probe (inner electrode Ø 5 0.1 mm, needleprobe design, Figure 3a). The electronics had a response timeless than 30 mseconds The void fraction and bubble count ratewere calculated by analog integration during 5 minutes inseries A1 and A2. With seawater (series B) and salty fresh-water (series C), probe contamination was experienced andthe analog signal was integrated for 40 seconds only. Rawprobe outputs were recorded at 25 kHz for 2.6 seconds tocalculate bubble chord time distributions for all water solu-tions.
668 Chanson, Aoki, and Hoque
Journal of Coastal Research, Vol. 22, No. 3, 2006
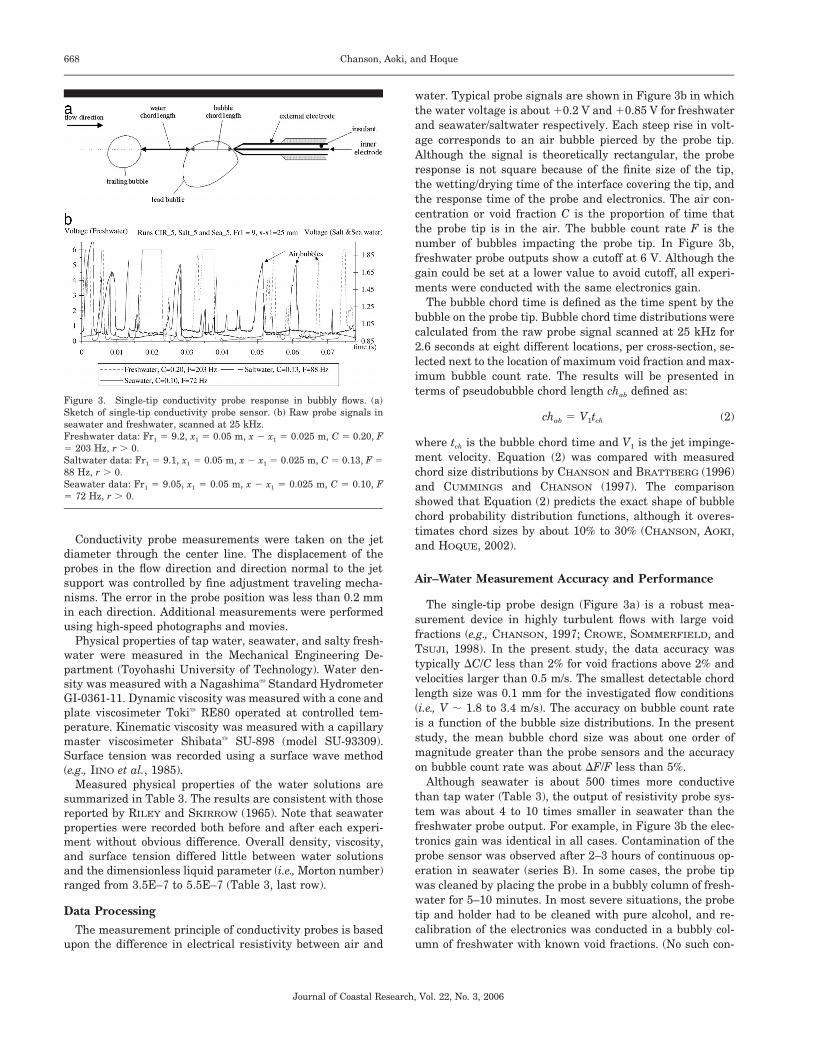
Figure 3. Single-tip conductivity probe response in bubbly flows. (a)Sketch of single-tip conductivity probe sensor. (b) Raw probe signals inseawater and freshwater, scanned at 25 kHz.Freshwater data: Fr1 5 9.2, x1 5 0.05 m, x 2 x1 5 0.025 m, C 5 0.20, F5 203 Hz, r . 0.Saltwater data: Fr1 5 9.1, x1 5 0.05 m, x 2 x1 5 0.025 m, C 5 0.13, F 588 Hz, r . 0.Seawater data: Fr1 5 9.05, x1 5 0.05 m, x 2 x1 5 0.025 m, C 5 0.10, F5 72 Hz, r . 0.
Conductivity probe measurements were taken on the jetdiameter through the center line. The displacement of theprobes in the flow direction and direction normal to the jetsupport was controlled by fine adjustment traveling mecha-nisms. The error in the probe position was less than 0.2 mmin each direction. Additional measurements were performedusing high-speed photographs and movies.
Physical properties of tap water, seawater, and salty fresh-water were measured in the Mechanical Engineering De-partment (Toyohashi University of Technology). Water den-sity was measured with a Nagashimay Standard HydrometerGI-0361-11. Dynamic viscosity was measured with a cone andplate viscosimeter Tokiy RE80 operated at controlled tem-perature. Kinematic viscosity was measured with a capillarymaster viscosimeter Shibatay SU-898 (model SU-93309).Surface tension was recorded using a surface wave method(e.g., IINO et al., 1985).
Measured physical properties of the water solutions aresummarized in Table 3. The results are consistent with thosereported by RILEY and SKIRROW (1965). Note that seawaterproperties were recorded both before and after each experi-ment without obvious difference. Overall density, viscosity,and surface tension differed little between water solutionsand the dimensionless liquid parameter (i.e., Morton number)ranged from 3.5E–7 to 5.5E–7 (Table 3, last row).
Data ProcessingThe measurement principle of conductivity probes is based
upon the difference in electrical resistivity between air and
water. Typical probe signals are shown in Figure 3b in whichthe water voltage is about 10.2 V and 10.85 V for freshwaterand seawater/saltwater respectively. Each steep rise in volt-age corresponds to an air bubble pierced by the probe tip.Although the signal is theoretically rectangular, the proberesponse is not square because of the finite size of the tip,the wetting/drying time of the interface covering the tip, andthe response time of the probe and electronics. The air con-centration or void fraction C is the proportion of time thatthe probe tip is in the air. The bubble count rate F is thenumber of bubbles impacting the probe tip. In Figure 3b,freshwater probe outputs show a cutoff at 6 V. Although thegain could be set at a lower value to avoid cutoff, all experi-ments were conducted with the same electronics gain.
The bubble chord time is defined as the time spent by thebubble on the probe tip. Bubble chord time distributions werecalculated from the raw probe signal scanned at 25 kHz for2.6 seconds at eight different locations, per cross-section, se-lected next to the location of maximum void fraction and max-imum bubble count rate. The results will be presented interms of pseudobubble chord length chab defined as:
chab 5 V1tch (2)
where tch is the bubble chord time and V1 is the jet impinge-ment velocity. Equation (2) was compared with measuredchord size distributions by CHANSON and BRATTBERG (1996)and CUMMINGS and CHANSON (1997). The comparisonshowed that Equation (2) predicts the exact shape of bubblechord probability distribution functions, although it overes-timates chord sizes by about 10% to 30% (CHANSON, AOKI,and HOQUE, 2002).
Air–Water Measurement Accuracy and Performance
The single-tip probe design (Figure 3a) is a robust mea-surement device in highly turbulent flows with large voidfractions (e.g., CHANSON, 1997; CROWE, SOMMERFIELD, andTSUJI, 1998). In the present study, the data accuracy wastypically DC/C less than 2% for void fractions above 2% andvelocities larger than 0.5 m/s. The smallest detectable chordlength size was 0.1 mm for the investigated flow conditions(i.e., V ; 1.8 to 3.4 m/s). The accuracy on bubble count rateis a function of the bubble size distributions. In the presentstudy, the mean bubble chord size was about one order ofmagnitude greater than the probe sensors and the accuracyon bubble count rate was about DF/F less than 5%.
Although seawater is about 500 times more conductivethan tap water (Table 3), the output of resistivity probe sys-tem was about 4 to 10 times smaller in seawater than thefreshwater probe output. For example, in Figure 3b the elec-tronics gain was identical in all cases. Contamination of theprobe sensor was observed after 2–3 hours of continuous op-eration in seawater (series B). In some cases, the probe tipwas cleaned by placing the probe in a bubbly column of fresh-water for 5–10 minutes. In most severe situations, the probetip and holder had to be cleaned with pure alcohol, and re-calibration of the electronics was conducted in a bubbly col-umn of freshwater with known void fractions. (No such con-
669Bubble Entrainment and Dispersion in Plunging Jet Flows
Journal of Coastal Research, Vol. 22, No. 3, 2006
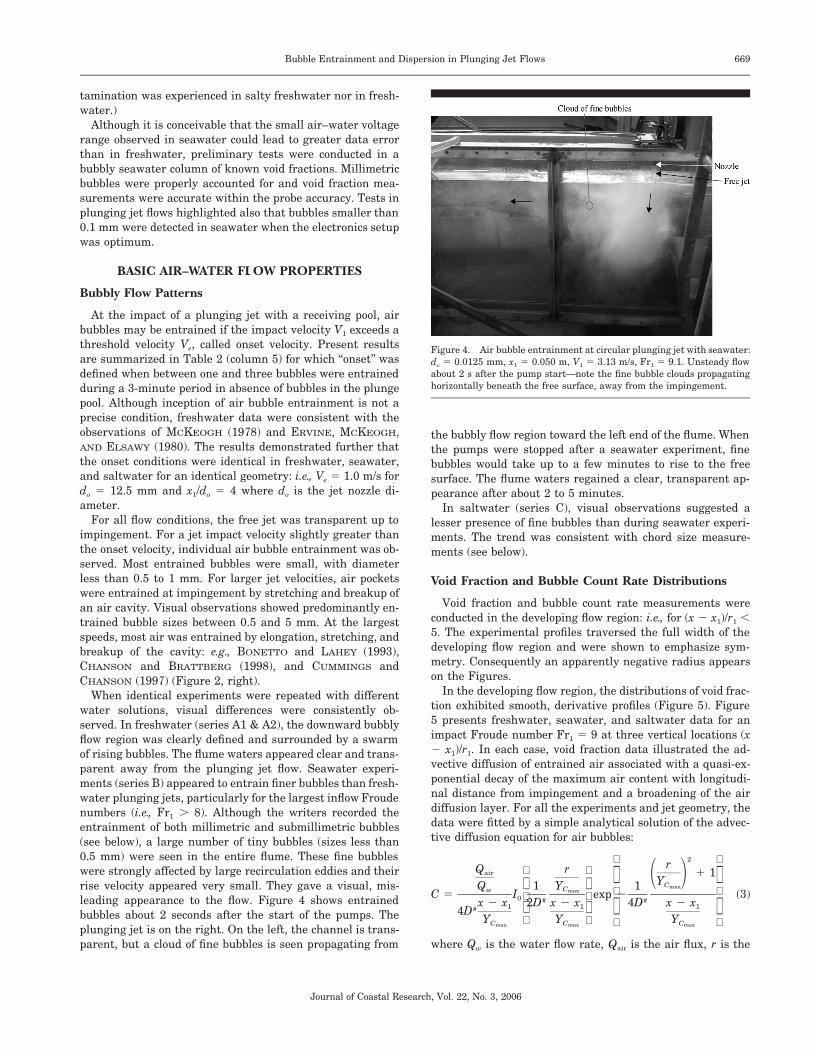
Figure 4. Air bubble entrainment at circular plunging jet with seawater:do 5 0.0125 mm, x1 5 0.050 m, V1 5 3.13 m/s, Fr1 5 9.1. Unsteady flowabout 2 s after the pump start—note the fine bubble clouds propagatinghorizontally beneath the free surface, away from the impingement.
tamination was experienced in salty freshwater nor in fresh-water.)
Although it is conceivable that the small air–water voltagerange observed in seawater could lead to greater data errorthan in freshwater, preliminary tests were conducted in abubbly seawater column of known void fractions. Millimetricbubbles were properly accounted for and void fraction mea-surements were accurate within the probe accuracy. Tests inplunging jet flows highlighted also that bubbles smaller than0.1 mm were detected in seawater when the electronics setupwas optimum.
BASIC AIR–WATER FLOW PROPERTIES
Bubbly Flow Patterns
At the impact of a plunging jet with a receiving pool, airbubbles may be entrained if the impact velocity V1 exceeds athreshold velocity Ve, called onset velocity. Present resultsare summarized in Table 2 (column 5) for which ‘‘onset’’ wasdefined when between one and three bubbles were entrainedduring a 3-minute period in absence of bubbles in the plungepool. Although inception of air bubble entrainment is not aprecise condition, freshwater data were consistent with theobservations of MCKEOGH (1978) and ERVINE, MCKEOGH,AND ELSAWY (1980). The results demonstrated further thatthe onset conditions were identical in freshwater, seawater,and saltwater for an identical geometry: i.e., Ve 5 1.0 m/s fordo 5 12.5 mm and x1/do 5 4 where do is the jet nozzle di-ameter.
For all flow conditions, the free jet was transparent up toimpingement. For a jet impact velocity slightly greater thanthe onset velocity, individual air bubble entrainment was ob-served. Most entrained bubbles were small, with diameterless than 0.5 to 1 mm. For larger jet velocities, air pocketswere entrained at impingement by stretching and breakup ofan air cavity. Visual observations showed predominantly en-trained bubble sizes between 0.5 and 5 mm. At the largestspeeds, most air was entrained by elongation, stretching, andbreakup of the cavity: e.g., BONETTO and LAHEY (1993),CHANSON and BRATTBERG (1998), and CUMMINGS andCHANSON (1997) (Figure 2, right).
When identical experiments were repeated with differentwater solutions, visual differences were consistently ob-served. In freshwater (series A1 & A2), the downward bubblyflow region was clearly defined and surrounded by a swarmof rising bubbles. The flume waters appeared clear and trans-parent away from the plunging jet flow. Seawater experi-ments (series B) appeared to entrain finer bubbles than fresh-water plunging jets, particularly for the largest inflow Froudenumbers (i.e., Fr1 . 8). Although the writers recorded theentrainment of both millimetric and submillimetric bubbles(see below), a large number of tiny bubbles (sizes less than0.5 mm) were seen in the entire flume. These fine bubbleswere strongly affected by large recirculation eddies and theirrise velocity appeared very small. They gave a visual, mis-leading appearance to the flow. Figure 4 shows entrainedbubbles about 2 seconds after the start of the pumps. Theplunging jet is on the right. On the left, the channel is trans-parent, but a cloud of fine bubbles is seen propagating from
the bubbly flow region toward the left end of the flume. Whenthe pumps were stopped after a seawater experiment, finebubbles would take up to a few minutes to rise to the freesurface. The flume waters regained a clear, transparent ap-pearance after about 2 to 5 minutes.
In saltwater (series C), visual observations suggested alesser presence of fine bubbles than during seawater experi-ments. The trend was consistent with chord size measure-ments (see below).
Void Fraction and Bubble Count Rate Distributions
Void fraction and bubble count rate measurements wereconducted in the developing flow region: i.e., for (x 2 x1)/r1 ,5. The experimental profiles traversed the full width of thedeveloping flow region and were shown to emphasize sym-metry. Consequently an apparently negative radius appearson the Figures.
In the developing flow region, the distributions of void frac-tion exhibited smooth, derivative profiles (Figure 5). Figure5 presents freshwater, seawater, and saltwater data for animpact Froude number Fr1 5 9 at three vertical locations (x2 x1)/r1. In each case, void fraction data illustrated the ad-vective diffusion of entrained air associated with a quasi-ex-ponential decay of the maximum air content with longitudi-nal distance from impingement and a broadening of the airdiffusion layer. For all the experiments and jet geometry, thedata were fitted by a simple analytical solution of the advec-tive diffusion equation for air bubbles:
2 rQ r air 1 11 2 YCmax Q 1 Y 1Cw max C 5 I exp 2 (3) 0 # #x 2 x 2D x 2 x 4D x 2 x1 1 1# 4DY Y Y C C C max max max
where Qw is the water flow rate, Qair is the air flux, r is the
670 Chanson, Aoki, and Hoque
Journal of Coastal Research, Vol. 22, No. 3, 2006
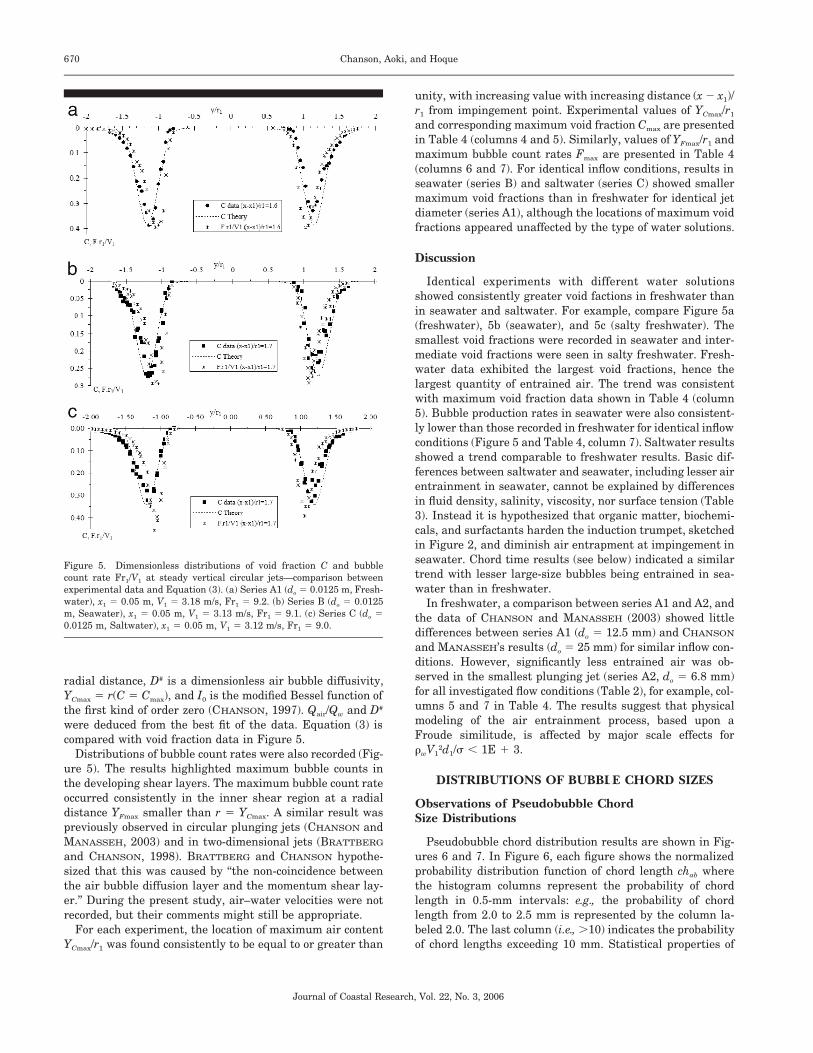
Figure 5. Dimensionless distributions of void fraction C and bubblecount rate Fr1/V1 at steady vertical circular jets—comparison betweenexperimental data and Equation (3). (a) Series A1 (do 5 0.0125 m, Fresh-water), x1 5 0.05 m, V1 5 3.18 m/s, Fr1 5 9.2. (b) Series B (do 5 0.0125m, Seawater), x1 5 0.05 m, V1 5 3.13 m/s, Fr1 5 9.1. (c) Series C (do 50.0125 m, Saltwater), x1 5 0.05 m, V1 5 3.12 m/s, Fr1 5 9.0.
radial distance, D# is a dimensionless air bubble diffusivity,5 r(C 5 Cmax), and I0 is the modified Bessel function ofYCmax
the first kind of order zero (CHANSON, 1997). Qair/Qw and D#
were deduced from the best fit of the data. Equation (3) iscompared with void fraction data in Figure 5.
Distributions of bubble count rates were also recorded (Fig-ure 5). The results highlighted maximum bubble counts inthe developing shear layers. The maximum bubble count rateoccurred consistently in the inner shear region at a radialdistance smaller than r 5 . A similar result wasY YFmax Cmax
previously observed in circular plunging jets (CHANSON andMANASSEH, 2003) and in two-dimensional jets (BRATTBERG
and CHANSON, 1998). BRATTBERG and CHANSON hypothe-sized that this was caused by ‘‘the non-coincidence betweenthe air bubble diffusion layer and the momentum shear lay-er.’’ During the present study, air–water velocities were notrecorded, but their comments might still be appropriate.
For each experiment, the location of maximum air content/r1 was found consistently to be equal to or greater thanYCmax
unity, with increasing value with increasing distance (x 2 x1)/r1 from impingement point. Experimental values of /r1YCmax
and corresponding maximum void fraction Cmax are presentedin Table 4 (columns 4 and 5). Similarly, values of /r1 andYFmax
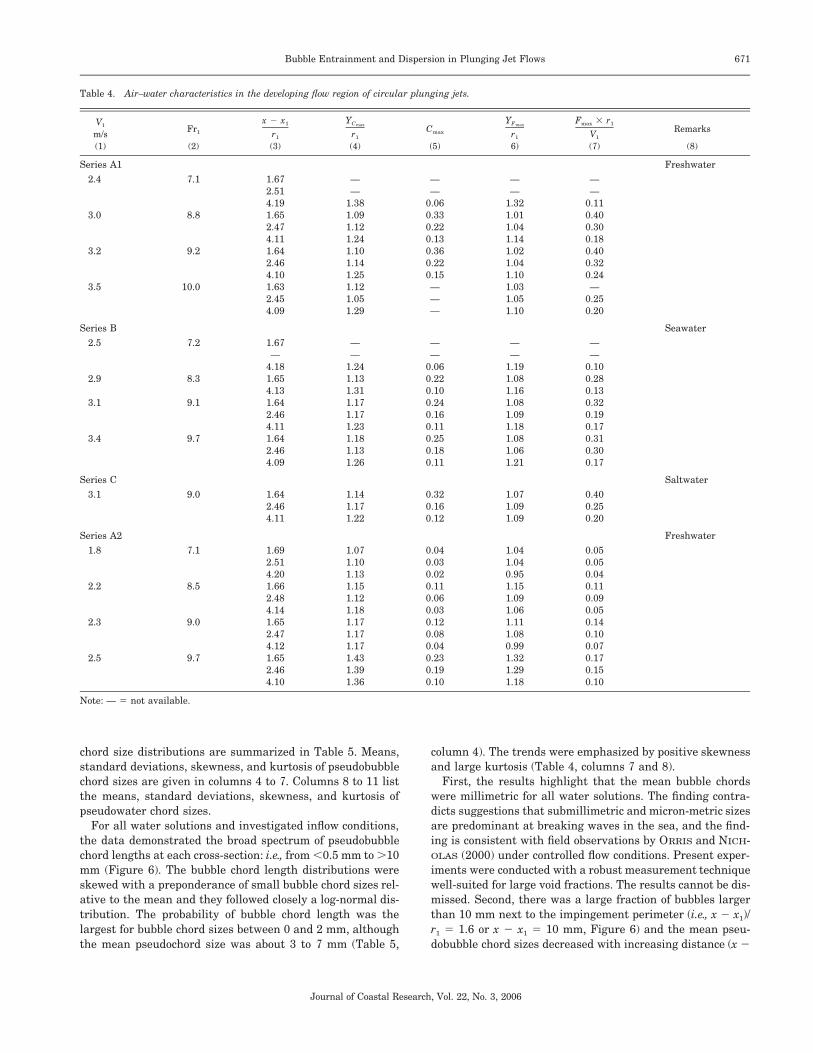
maximum bubble count rates Fmax are presented in Table 4(columns 6 and 7). For identical inflow conditions, results inseawater (series B) and saltwater (series C) showed smallermaximum void fractions than in freshwater for identical jetdiameter (series A1), although the locations of maximum voidfractions appeared unaffected by the type of water solutions.
Discussion
Identical experiments with different water solutionsshowed consistently greater void factions in freshwater thanin seawater and saltwater. For example, compare Figure 5a(freshwater), 5b (seawater), and 5c (salty freshwater). Thesmallest void fractions were recorded in seawater and inter-mediate void fractions were seen in salty freshwater. Fresh-water data exhibited the largest void fractions, hence thelargest quantity of entrained air. The trend was consistentwith maximum void fraction data shown in Table 4 (column5). Bubble production rates in seawater were also consistent-ly lower than those recorded in freshwater for identical inflowconditions (Figure 5 and Table 4, column 7). Saltwater resultsshowed a trend comparable to freshwater results. Basic dif-ferences between saltwater and seawater, including lesser airentrainment in seawater, cannot be explained by differencesin fluid density, salinity, viscosity, nor surface tension (Table3). Instead it is hypothesized that organic matter, biochemi-cals, and surfactants harden the induction trumpet, sketchedin Figure 2, and diminish air entrapment at impingement inseawater. Chord time results (see below) indicated a similartrend with lesser large-size bubbles being entrained in sea-water than in freshwater.
In freshwater, a comparison between series A1 and A2, andthe data of CHANSON and MANASSEH (2003) showed littledifferences between series A1 (do 5 12.5 mm) and CHANSON
and MANASSEH’s results (do 5 25 mm) for similar inflow con-ditions. However, significantly less entrained air was ob-served in the smallest plunging jet (series A2, do 5 6.8 mm)for all investigated flow conditions (Table 2), for example, col-umns 5 and 7 in Table 4. The results suggest that physicalmodeling of the air entrainment process, based upon aFroude similitude, is affected by major scale effects forrwV1
2d1/s , 1E 1 3.
DISTRIBUTIONS OF BUBBLE CHORD SIZES
Observations of Pseudobubble ChordSize Distributions
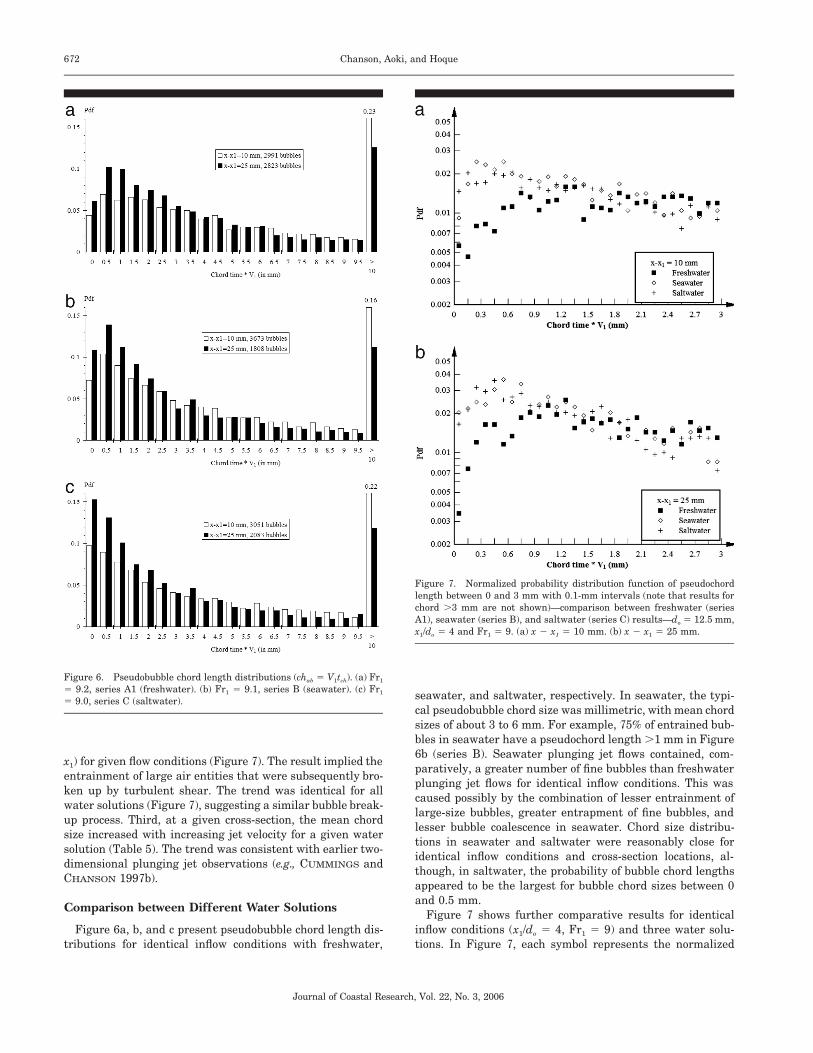
Pseudobubble chord distribution results are shown in Fig-ures 6 and 7. In Figure 6, each figure shows the normalizedprobability distribution function of chord length chab wherethe histogram columns represent the probability of chordlength in 0.5-mm intervals: e.g., the probability of chordlength from 2.0 to 2.5 mm is represented by the column la-beled 2.0. The last column (i.e., .10) indicates the probabilityof chord lengths exceeding 10 mm. Statistical properties of
671Bubble Entrainment and Dispersion in Plunging Jet Flows
Journal of Coastal Research, Vol. 22, No. 3, 2006
Table 4. Air–water characteristics in the developing flow region of circular plunging jets.
V1
m/s(1)
Fr1
(2)
x 2 x1
r1
(3)
YCmax
r1
(4)
Cmax
(5)
YFmax
r1
6)
F 3 rmax 1
V1
(7)
Remarks
(8)
Series A1 Freshwater2.4
3.0
7.1
8.8
1.672.514.191.652.47
——
1.381.091.12
——
0.060.330.22
——
1.321.011.04
——
0.110.400.30
3.2 9.24.111.642.464.10
1.241.101.141.25
0.130.360.220.15
1.141.021.041.10
0.180.400.320.24
3.5 10.0 1.632.454.09
1.121.051.29
———
1.031.051.10
—0.250.20
Series B Seawater2.5
2.9
7.2
8.3
1.67—
4.181.654.13
——
1.241.131.31
——
0.060.220.10
——
1.191.081.16
——
0.100.280.13
3.1
3.4
9.1
9.7
1.642.464.111.642.464.09
1.171.171.231.181.131.26
0.240.160.110.250.180.11
1.081.091.181.081.061.21
0.320.190.170.310.300.17
Series C Saltwater3.1 9.0 1.64
2.464.11
1.141.171.22
0.320.160.12
1.071.091.09
0.400.250.20
Series A2 Freshwater1.8
2.2
7.1
8.5
1.692.514.201.662.48
1.071.101.131.151.12
0.040.030.020.110.06
1.041.040.951.151.09
0.050.050.040.110.09
2.3 9.04.141.652.474.12
1.181.171.171.17
0.030.120.080.04
1.061.111.080.99
0.050.140.100.07
2.5 9.7 1.652.464.10
1.431.391.36
0.230.190.10
1.321.291.18
0.170.150.10
Note: — 5 not available.
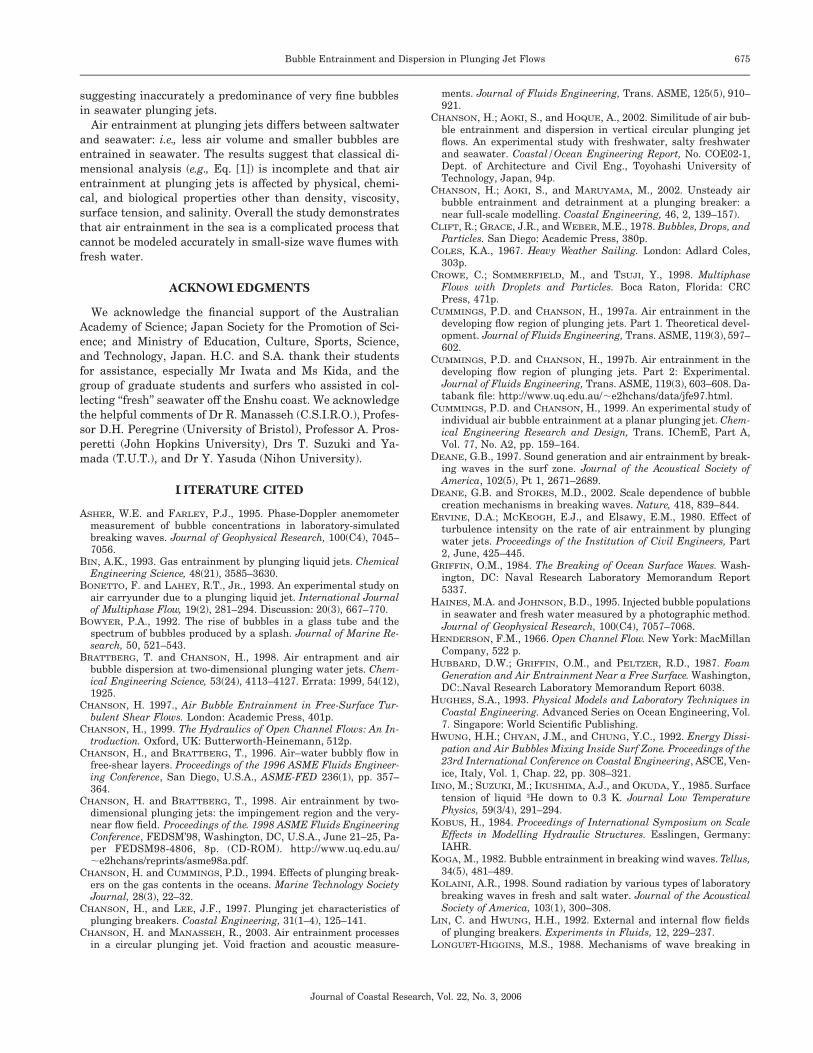
chord size distributions are summarized in Table 5. Means,standard deviations, skewness, and kurtosis of pseudobubblechord sizes are given in columns 4 to 7. Columns 8 to 11 listthe means, standard deviations, skewness, and kurtosis ofpseudowater chord sizes.
For all water solutions and investigated inflow conditions,the data demonstrated the broad spectrum of pseudobubblechord lengths at each cross-section: i.e., from ,0.5 mm to .10mm (Figure 6). The bubble chord length distributions wereskewed with a preponderance of small bubble chord sizes rel-ative to the mean and they followed closely a log-normal dis-tribution. The probability of bubble chord length was thelargest for bubble chord sizes between 0 and 2 mm, althoughthe mean pseudochord size was about 3 to 7 mm (Table 5,
column 4). The trends were emphasized by positive skewnessand large kurtosis (Table 4, columns 7 and 8).
First, the results highlight that the mean bubble chordswere millimetric for all water solutions. The finding contra-dicts suggestions that submillimetric and micron-metric sizesare predominant at breaking waves in the sea, and the find-ing is consistent with field observations by ORRIS and NICH-OLAS (2000) under controlled flow conditions. Present exper-iments were conducted with a robust measurement techniquewell-suited for large void fractions. The results cannot be dis-missed. Second, there was a large fraction of bubbles largerthan 10 mm next to the impingement perimeter (i.e., x 2 x1)/r1 5 1.6 or x 2 x1 5 10 mm, Figure 6) and the mean pseu-dobubble chord sizes decreased with increasing distance (x 2
672 Chanson, Aoki, and Hoque
Journal of Coastal Research, Vol. 22, No. 3, 2006
Figure 6. Pseudobubble chord length distributions (chab 5 V1tch). (a) Fr1
5 9.2, series A1 (freshwater). (b) Fr1 5 9.1, series B (seawater). (c) Fr1
5 9.0, series C (saltwater).
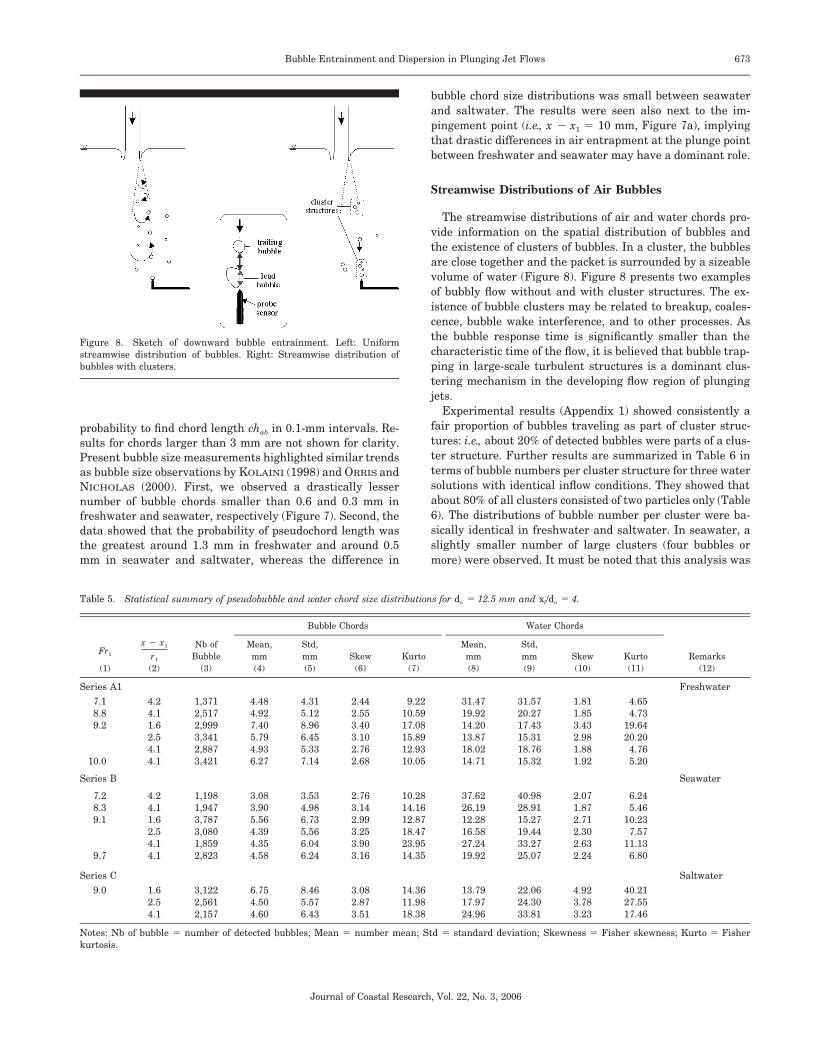
Figure 7. Normalized probability distribution function of pseudochordlength between 0 and 3 mm with 0.1-mm intervals (note that results forchord .3 mm are not shown)—comparison between freshwater (seriesA1), seawater (series B), and saltwater (series C) results—do 5 12.5 mm,x1/do 5 4 and Fr1 5 9. (a) x 2 x1 5 10 mm. (b) x 2 x1 5 25 mm.
x1) for given flow conditions (Figure 7). The result implied theentrainment of large air entities that were subsequently bro-ken up by turbulent shear. The trend was identical for allwater solutions (Figure 7), suggesting a similar bubble break-up process. Third, at a given cross-section, the mean chordsize increased with increasing jet velocity for a given watersolution (Table 5). The trend was consistent with earlier two-dimensional plunging jet observations (e.g., CUMMINGS andCHANSON 1997b).
Comparison between Different Water Solutions
Figure 6a, b, and c present pseudobubble chord length dis-tributions for identical inflow conditions with freshwater,
seawater, and saltwater, respectively. In seawater, the typi-cal pseudobubble chord size was millimetric, with mean chordsizes of about 3 to 6 mm. For example, 75% of entrained bub-bles in seawater have a pseudochord length .1 mm in Figure6b (series B). Seawater plunging jet flows contained, com-paratively, a greater number of fine bubbles than freshwaterplunging jet flows for identical inflow conditions. This wascaused possibly by the combination of lesser entrainment oflarge-size bubbles, greater entrapment of fine bubbles, andlesser bubble coalescence in seawater. Chord size distribu-tions in seawater and saltwater were reasonably close foridentical inflow conditions and cross-section locations, al-though, in saltwater, the probability of bubble chord lengthsappeared to be the largest for bubble chord sizes between 0and 0.5 mm.
Figure 7 shows further comparative results for identicalinflow conditions (x1/do 5 4, Fr1 5 9) and three water solu-tions. In Figure 7, each symbol represents the normalized
673Bubble Entrainment and Dispersion in Plunging Jet Flows
Journal of Coastal Research, Vol. 22, No. 3, 2006
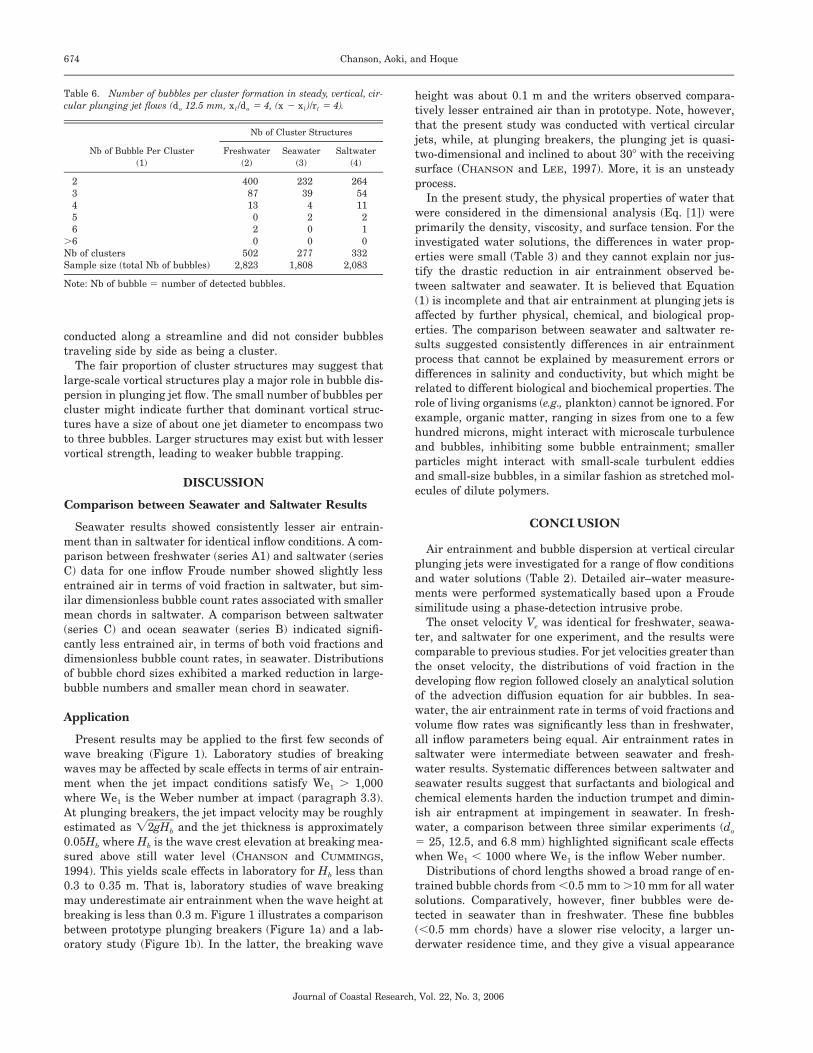
Figure 8. Sketch of downward bubble entrainment. Left: Uniformstreamwise distribution of bubbles. Right: Streamwise distribution ofbubbles with clusters.
Table 5. Statistical summary of pseudobubble and water chord size distributions for do 5 12.5 mm and xl/do 5 4.
Fr1
(1)
x 2 x1
r1
(2)
Nb ofBubble
(3)
Bubble Chords
Mean,mm(4)
Std,mm(5)
Skew(6)
Kurto(7)
Water Chords
Mean,mm(8)
Std,mm(9)
Skew(10)
Kurto(11)
Remarks(12)
Series A1 Freshwater7.18.89.2
10.0
4.24.11.62.54.14.1
1,3712,5172,9993,3412,8873,421
4.484.927.405.794.936.27
4.315.128.966.455.337.14
2.442.553.403.102.762.68
9.2210.5917.0815.8912.9310.05
31.4719.9214.2013.8718.0214.71
31.5720.2717.4315.3118.7615.32
1.811.853.432.981.881.92
4.654.73
19.6420.204.765.20
Series B Seawater
7.28.39.1
9.7
4.24.11.62.54.14.1
1,1981,9473,7873,0801,8592,823
3.083.905.564.394.354.58
3.534.986.735.566.046.24
2.763.142.993.253.903.16
10.2814.1612.8718.4723.9514.35
37.6226.1912.2816.5827.2419.92
40.9828.9115.2719.4433.2725.07
2.071.872.712.302.632.24
6.245.46
10.237.57
11.136.80
Series C Saltwater9.0 1.6
2.54.1
3,1222,5612,157
6.754.504.60
8.465.576.43
3.082.873.51
14.3611.9818.38
13.7917.9724.96
22.0624.3033.81
4.923.783.23
40.2127.5517.46
Notes: Nb of bubble 5 number of detected bubbles; Mean 5 number mean; Std 5 standard deviation; Skewness 5 Fisher skewness; Kurto 5 Fisherkurtosis.
probability to find chord length chab in 0.1-mm intervals. Re-sults for chords larger than 3 mm are not shown for clarity.Present bubble size measurements highlighted similar trendsas bubble size observations by KOLAINI (1998) and ORRIS andNICHOLAS (2000). First, we observed a drastically lessernumber of bubble chords smaller than 0.6 and 0.3 mm infreshwater and seawater, respectively (Figure 7). Second, thedata showed that the probability of pseudochord length wasthe greatest around 1.3 mm in freshwater and around 0.5mm in seawater and saltwater, whereas the difference in
bubble chord size distributions was small between seawaterand saltwater. The results were seen also next to the im-pingement point (i.e., x 2 x1 5 10 mm, Figure 7a), implyingthat drastic differences in air entrapment at the plunge pointbetween freshwater and seawater may have a dominant role.
Streamwise Distributions of Air Bubbles
The streamwise distributions of air and water chords pro-vide information on the spatial distribution of bubbles andthe existence of clusters of bubbles. In a cluster, the bubblesare close together and the packet is surrounded by a sizeablevolume of water (Figure 8). Figure 8 presents two examplesof bubbly flow without and with cluster structures. The ex-istence of bubble clusters may be related to breakup, coales-cence, bubble wake interference, and to other processes. Asthe bubble response time is significantly smaller than thecharacteristic time of the flow, it is believed that bubble trap-ping in large-scale turbulent structures is a dominant clus-tering mechanism in the developing flow region of plungingjets.
Experimental results (Appendix 1) showed consistently afair proportion of bubbles traveling as part of cluster struc-tures: i.e., about 20% of detected bubbles were parts of a clus-ter structure. Further results are summarized in Table 6 interms of bubble numbers per cluster structure for three watersolutions with identical inflow conditions. They showed thatabout 80% of all clusters consisted of two particles only (Table6). The distributions of bubble number per cluster were ba-sically identical in freshwater and saltwater. In seawater, aslightly smaller number of large clusters (four bubbles ormore) were observed. It must be noted that this analysis was
674 Chanson, Aoki, and Hoque
Journal of Coastal Research, Vol. 22, No. 3, 2006
Table 6. Number of bubbles per cluster formation in steady, vertical, cir-cular plunging jet flows (do 12.5 mm, xl /do 5 4, (x 2 xl )/rl 5 4).
Nb of Bubble Per Cluster(1)
Nb of Cluster Structures
Freshwater(2)
Seawater(3)
Saltwater(4)
2345
40087130
2323942
26454112
6.6Nb of clustersSample size (total Nb of bubbles)
20
5022,823
00
2771,808
10
3322,083
Note: Nb of bubble 5 number of detected bubbles.
conducted along a streamline and did not consider bubblestraveling side by side as being a cluster.
The fair proportion of cluster structures may suggest thatlarge-scale vortical structures play a major role in bubble dis-persion in plunging jet flow. The small number of bubbles percluster might indicate further that dominant vortical struc-tures have a size of about one jet diameter to encompass twoto three bubbles. Larger structures may exist but with lesservortical strength, leading to weaker bubble trapping.
DISCUSSION
Comparison between Seawater and Saltwater Results
Seawater results showed consistently lesser air entrain-ment than in saltwater for identical inflow conditions. A com-parison between freshwater (series A1) and saltwater (seriesC) data for one inflow Froude number showed slightly lessentrained air in terms of void fraction in saltwater, but sim-ilar dimensionless bubble count rates associated with smallermean chords in saltwater. A comparison between saltwater(series C) and ocean seawater (series B) indicated signifi-cantly less entrained air, in terms of both void fractions anddimensionless bubble count rates, in seawater. Distributionsof bubble chord sizes exhibited a marked reduction in large-bubble numbers and smaller mean chord in seawater.
Application
Present results may be applied to the first few seconds ofwave breaking (Figure 1). Laboratory studies of breakingwaves may be affected by scale effects in terms of air entrain-ment when the jet impact conditions satisfy We1 . 1,000where We1 is the Weber number at impact (paragraph 3.3).At plunging breakers, the jet impact velocity may be roughlyestimated as Ï2gHb and the jet thickness is approximately0.05Hb where Hb is the wave crest elevation at breaking mea-sured above still water level (CHANSON and CUMMINGS,1994). This yields scale effects in laboratory for Hb less than0.3 to 0.35 m. That is, laboratory studies of wave breakingmay underestimate air entrainment when the wave height atbreaking is less than 0.3 m. Figure 1 illustrates a comparisonbetween prototype plunging breakers (Figure 1a) and a lab-oratory study (Figure 1b). In the latter, the breaking wave
height was about 0.1 m and the writers observed compara-tively lesser entrained air than in prototype. Note, however,that the present study was conducted with vertical circularjets, while, at plunging breakers, the plunging jet is quasi-two-dimensional and inclined to about 308 with the receivingsurface (CHANSON and LEE, 1997). More, it is an unsteadyprocess.
In the present study, the physical properties of water thatwere considered in the dimensional analysis (Eq. [1]) wereprimarily the density, viscosity, and surface tension. For theinvestigated water solutions, the differences in water prop-erties were small (Table 3) and they cannot explain nor jus-tify the drastic reduction in air entrainment observed be-tween saltwater and seawater. It is believed that Equation(1) is incomplete and that air entrainment at plunging jets isaffected by further physical, chemical, and biological prop-erties. The comparison between seawater and saltwater re-sults suggested consistently differences in air entrainmentprocess that cannot be explained by measurement errors ordifferences in salinity and conductivity, but which might berelated to different biological and biochemical properties. Therole of living organisms (e.g., plankton) cannot be ignored. Forexample, organic matter, ranging in sizes from one to a fewhundred microns, might interact with microscale turbulenceand bubbles, inhibiting some bubble entrainment; smallerparticles might interact with small-scale turbulent eddiesand small-size bubbles, in a similar fashion as stretched mol-ecules of dilute polymers.
CONCLUSION
Air entrainment and bubble dispersion at vertical circularplunging jets were investigated for a range of flow conditionsand water solutions (Table 2). Detailed air–water measure-ments were performed systematically based upon a Froudesimilitude using a phase-detection intrusive probe.
The onset velocity Ve was identical for freshwater, seawa-ter, and saltwater for one experiment, and the results werecomparable to previous studies. For jet velocities greater thanthe onset velocity, the distributions of void fraction in thedeveloping flow region followed closely an analytical solutionof the advection diffusion equation for air bubbles. In sea-water, the air entrainment rate in terms of void fractions andvolume flow rates was significantly less than in freshwater,all inflow parameters being equal. Air entrainment rates insaltwater were intermediate between seawater and fresh-water results. Systematic differences between saltwater andseawater results suggest that surfactants and biological andchemical elements harden the induction trumpet and dimin-ish air entrapment at impingement in seawater. In fresh-water, a comparison between three similar experiments (do
5 25, 12.5, and 6.8 mm) highlighted significant scale effectswhen We1 , 1000 where We1 is the inflow Weber number.
Distributions of chord lengths showed a broad range of en-trained bubble chords from ,0.5 mm to .10 mm for all watersolutions. Comparatively, however, finer bubbles were de-tected in seawater than in freshwater. These fine bubbles(,0.5 mm chords) have a slower rise velocity, a larger un-derwater residence time, and they give a visual appearance
675Bubble Entrainment and Dispersion in Plunging Jet Flows
Journal of Coastal Research, Vol. 22, No. 3, 2006
suggesting inaccurately a predominance of very fine bubblesin seawater plunging jets.
Air entrainment at plunging jets differs between saltwaterand seawater: i.e., less air volume and smaller bubbles areentrained in seawater. The results suggest that classical di-mensional analysis (e.g., Eq. [1]) is incomplete and that airentrainment at plunging jets is affected by physical, chemi-cal, and biological properties other than density, viscosity,surface tension, and salinity. Overall the study demonstratesthat air entrainment in the sea is a complicated process thatcannot be modeled accurately in small-size wave flumes withfresh water.
ACKNOWLEDGMENTS
We acknowledge the financial support of the AustralianAcademy of Science; Japan Society for the Promotion of Sci-ence; and Ministry of Education, Culture, Sports, Science,and Technology, Japan. H.C. and S.A. thank their studentsfor assistance, especially Mr Iwata and Ms Kida, and thegroup of graduate students and surfers who assisted in col-lecting ‘‘fresh’’ seawater off the Enshu coast. We acknowledgethe helpful comments of Dr R. Manasseh (C.S.I.R.O.), Profes-sor D.H. Peregrine (University of Bristol), Professor A. Pros-peretti (John Hopkins University), Drs T. Suzuki and Ya-mada (T.U.T.), and Dr Y. Yasuda (Nihon University).
LITERATURE CITED
ASHER, W.E. and FARLEY, P.J., 1995. Phase-Doppler anemometermeasurement of bubble concentrations in laboratory-simulatedbreaking waves. Journal of Geophysical Research, 100(C4), 7045–7056.
BIN, A.K., 1993. Gas entrainment by plunging liquid jets. ChemicalEngineering Science, 48(21), 3585–3630.
BONETTO, F. and LAHEY, R.T., JR., 1993. An experimental study onair carryunder due to a plunging liquid jet. International Journalof Multiphase Flow, 19(2), 281–294. Discussion: 20(3), 667–770.
BOWYER, P.A., 1992. The rise of bubbles in a glass tube and thespectrum of bubbles produced by a splash. Journal of Marine Re-search, 50, 521–543.
BRATTBERG, T. and CHANSON, H., 1998. Air entrapment and airbubble dispersion at two-dimensional plunging water jets. Chem-ical Engineering Science, 53(24), 4113–4127. Errata: 1999, 54(12),1925.
CHANSON, H. 1997., Air Bubble Entrainment in Free-Surface Tur-bulent Shear Flows. London: Academic Press, 401p.
CHANSON, H., 1999. The Hydraulics of Open Channel Flows: An In-troduction. Oxford, UK: Butterworth-Heinemann, 512p.
CHANSON, H., and BRATTBERG, T., 1996. Air–water bubbly flow infree-shear layers. Proceedings of the 1996 ASME Fluids Engineer-ing Conference, San Diego, U.S.A., ASME-FED 236(1), pp. 357–364.
CHANSON, H. and BRATTBERG, T., 1998. Air entrainment by two-dimensional plunging jets: the impingement region and the very-near flow field. Proceedings of the. 1998 ASME Fluids EngineeringConference, FEDSM’98, Washington, DC, U.S.A., June 21–25, Pa-per FEDSM98-4806, 8p. (CD-ROM). http://www.uq.edu.au/;e2hchans/reprints/asme98a.pdf.
CHANSON, H. and CUMMINGS, P.D., 1994. Effects of plunging break-ers on the gas contents in the oceans. Marine Technology SocietyJournal, 28(3), 22–32.
CHANSON, H., and LEE, J.F., 1997. Plunging jet characteristics ofplunging breakers. Coastal Engineering, 31(1–4), 125–141.
CHANSON, H. and MANASSEH, R., 2003. Air entrainment processesin a circular plunging jet. Void fraction and acoustic measure-
ments. Journal of Fluids Engineering, Trans. ASME, 125(5), 910–921.
CHANSON, H.; AOKI, S., and HOQUE, A., 2002. Similitude of air bub-ble entrainment and dispersion in vertical circular plunging jetflows. An experimental study with freshwater, salty freshwaterand seawater. Coastal/Ocean Engineering Report, No. COE02-1,Dept. of Architecture and Civil Eng., Toyohashi University ofTechnology, Japan, 94p.
CHANSON, H.; AOKI, S., and MARUYAMA, M., 2002. Unsteady airbubble entrainment and detrainment at a plunging breaker: anear full-scale modelling. Coastal Engineering, 46, 2, 139–157).
CLIFT, R.; GRACE, J.R., and WEBER, M.E., 1978. Bubbles, Drops, andParticles. San Diego: Academic Press, 380p.
COLES, K.A., 1967. Heavy Weather Sailing. London: Adlard Coles,303p.
CROWE, C.; SOMMERFIELD, M., and TSUJI, Y., 1998. MultiphaseFlows with Droplets and Particles. Boca Raton, Florida: CRCPress, 471p.
CUMMINGS, P.D. and CHANSON, H., 1997a. Air entrainment in thedeveloping flow region of plunging jets. Part 1. Theoretical devel-opment. Journal of Fluids Engineering, Trans. ASME, 119(3), 597–602.
CUMMINGS, P.D. and CHANSON, H., 1997b. Air entrainment in thedeveloping flow region of plunging jets. Part 2: Experimental.Journal of Fluids Engineering, Trans. ASME, 119(3), 603–608. Da-tabank file: http://www.uq.edu.au/;e2hchans/data/jfe97.html.
CUMMINGS, P.D. and CHANSON, H., 1999. An experimental study ofindividual air bubble entrainment at a planar plunging jet. Chem-ical Engineering Research and Design, Trans. IChemE, Part A,Vol. 77, No. A2, pp. 159–164.
DEANE, G.B., 1997. Sound generation and air entrainment by break-ing waves in the surf zone. Journal of the Acoustical Society ofAmerica, 102(5), Pt 1, 2671–2689.
DEANE, G.B. and STOKES, M.D., 2002. Scale dependence of bubblecreation mechanisms in breaking waves. Nature, 418, 839–844.
ERVINE, D.A.; MCKEOGH, E.J., and Elsawy, E.M., 1980. Effect ofturbulence intensity on the rate of air entrainment by plungingwater jets. Proceedings of the Institution of Civil Engineers, Part2, June, 425–445.
GRIFFIN, O.M., 1984. The Breaking of Ocean Surface Waves. Wash-ington, DC: Naval Research Laboratory Memorandum Report5337.
HAINES, M.A. and JOHNSON, B.D., 1995. Injected bubble populationsin seawater and fresh water measured by a photographic method.Journal of Geophysical Research, 100(C4), 7057–7068.
HENDERSON, F.M., 1966. Open Channel Flow. New York: MacMillanCompany, 522 p.
HUBBARD, D.W.; GRIFFIN, O.M., and PELTZER, R.D., 1987. FoamGeneration and Air Entrainment Near a Free Surface. Washington,DC:.Naval Research Laboratory Memorandum Report 6038.
HUGHES, S.A., 1993. Physical Models and Laboratory Techniques inCoastal Engineering. Advanced Series on Ocean Engineering, Vol.7. Singapore: World Scientific Publishing.
HWUNG, H.H.; CHYAN, J.M., and CHUNG, Y.C., 1992. Energy Dissi-pation and Air Bubbles Mixing Inside Surf Zone. Proceedings of the23rd International Conference on Coastal Engineering, ASCE, Ven-ice, Italy, Vol. 1, Chap. 22, pp. 308–321.
IINO, M.; SUZUKI, M.; IKUSHIMA, A.J., and OKUDA, Y., 1985. Surfacetension of liquid 3He down to 0.3 K. Journal Low TemperaturePhysics, 59(3/4), 291–294.
KOBUS, H., 1984. Proceedings of International Symposium on ScaleEffects in Modelling Hydraulic Structures. Esslingen, Germany:IAHR.
KOGA, M., 1982. Bubble entrainment in breaking wind waves. Tellus,34(5), 481–489.
KOLAINI, A.R., 1998. Sound radiation by various types of laboratorybreaking waves in fresh and salt water. Journal of the AcousticalSociety of America, 103(1), 300–308.
LIN, C. and HWUNG, H.H., 1992. External and internal flow fieldsof plunging breakers. Experiments in Fluids, 12, 229–237.
LONGUET-HIGGINS, M.S., 1988. Mechanisms of wave breaking in
676 Chanson, Aoki, and Hoque
Journal of Coastal Research, Vol. 22, No. 3, 2006
deep water. In: Kerman, B.R. (ed.), See Surface Sound. Doldrecht,The Netherlands: Kluwer Academic Press Publishers, 1–30.
LOWEN, M.R.; O’DOR, M.A., and SKAFEL, M.G., 1996. Bubbles en-trained by mechanically generated breaking waves. Journal ofGeophysical Research, 101(C9), 20759–20769.
MANASSEH, R. and CHANSON, H., 2001. Void-fraction and acousticcharacteristics of gas bubbles entrained by a circular plunging jet.In: MICHAELIDES, E.E. (ed), Proceedings of the 4th InternationalConference on Multiphase Flow, ICMF’01, New Orleans, Louisiana,U.S.A., Paper 347, 12 pages (CD-ROM).
MCKEOGH, E.J., 1978. A Study of Air Entrainment Using PlungingWater Jets. Belfast: Queen’s University of Belfast, Ph.D. thesis,374p.
MELVILLE, W.K. and RAPP, R.F., 1985. Momentum flux in breakingwaves. Nature, 317, 514–516.
MONAHAN, E.C. and ZIETLOW, C.R., 1969. Laboratory comparisonsof fresh-water and salt-water whitecaps. Journal of GeophysicalResearch, 74(28), 6961–6966.
ORRIS, G.J. and NICHOLAS, M., 2000. Collective oscillations of freshand salt water bubble plumes. Journal of Acoustical Society ofAmerica, 107(2), 771–787.
PHELPS, A.D. and LEIGHTON, T.G., 1998. Oceanic bubble populationmeasurement using a buoy-deployed combination frequency tech-nique. IEEE Journal of Oceanic Engineering, 23(4), 400–410.
POND, S. and PICKARD, G.L., 1993. Introductory Dynamical Ocean-ography, 3rd edition. Oxford, UK: Butterworth Heinemann, 329 p.
RILEY, J.P. and SKIRROW, G., 1965. Chemical Oceanography. Lon-don: Academic Press.
SAWARAGI, T., 1995. Coastal Engineering—Waves, Beaches, Wave-Structure Interactions. Developments in Geotechnical EngineeringSeries, No. 78. Amsterdam: Elsevier, 479p.
SCOTT, J.C., 1975. The preparation of water for surface clean fluidmechanics. Journal of Fluid Mechanics, 69, 339–351.
SLAUENWHITE, D.E. and JOHNSON, B.D., 1999. Bubble shattering:differences in bubble formation in freshwater and seawater. Jour-nal of Geophysical Research, 104(C2), 3265–3275.
WALKDEN, M.J.A., 1999. Model Wave Impulse Loads on CaissonBreakwaters: Aeration, Scale and Structural Response. Plymouth,UK: University of Plymouth, Ph.D. thesis, 250 p.
WALLACE, D.W.R. and WIRICK, C.D., 1992. Large air-sea gas fluxesassociated with breaking waves. Nature, 356, 23 Apr., 694–696.
WOOD, I.R., 1991. Air entrainment in free-surface flows. IAHR Hy-draulic Structures Design Manual No. 4, Hydraulic Design Consid-erations.. Rotterdam, The Netherlands: Balkema Publishers, 149p.
APPENDIX I—BUBBLE CLUSTERING ANALYSIS
A cluster of bubbles is defined as a group of two or moreparticles, with a distinct separation from other particles be-fore and after the cluster. The streamwise distribution of bub-bles was analyzed. Considering a group of two bubbles (e.g.,Figure 3a), the trailing particle may be adversely affected inthe near-wake of the lead bubble. The wake length is about0.5 to 2 times the particle size for spherical particles andspheroids at large-particle Reynolds numbers (e.g., CLIFT,GRACE, and WEBER 1978, pp. 106 and 144). Herein two suc-cessive bubbles were defined as a cluster when the trailingbubble was separated from the lead particle by a water chordlength smaller than one leading bubble chord. Results aresummarized in Table 6 for one experiment at one cross-sec-tion in the developing flow region (do 5 12.5 mm, x1/do 5 4,(x 2 x1)/r1 5 4). The results showed about 20% of bubblestraveling as part of a cluster structure. About 80% of theclusters consisted of two particles only (Table 6).
It must be noted that the above analysis was conductedalong a streamline. It did not consider bubbles traveling sideby side as being a cluster.
NOTATION
C 5 air concentration defined as the volume of air perunit volume of air and water; it is also called voidfraction;
Cmax 5 maximum void fraction in a cross-section;chab 5 pseudobubble chord length (m) defined as: chab 5
V1tch;Dt 5 turbulent diffusivity (m2/s) of air bubbles in air–wa-
ter flow;D# 5 dimensionless turbulent diffusivity: D# 5 Dt/V1r1;d 5 (1) characteristic flow thickness (m) measured nor-
mal to the flow direction;(2) circular jet diameter;
dab 5 air bubble diameter (m);do 5 nozzle diameter (m);d1 5 (1) jet thickness (m) at plunge point;
(2) jet diameter (m) at plunge point;F 5 bubble count rate or bubble frequency (Hz) defined
as the number of bubbles impacting the probe sensorper second;
Fmax 5 maximum bubble count rate or bubble frequency(Hz) in a cross-section;
Fr 5 Froude number defined as: Fr 5 V/Ïgd;Fr1 5 impingement Froude number: Fr1 5 V1/Ïgd1;g 5 gravity constant (m/s2);Hb 5 breaking wave elevation (m) measured above still
water level;Mo 5 Morton number defined as: Mo 5 /(rws3;4gmw
Q 5 volume discharge (m3/s);Qair 5 quantity of entrained air (m3/s);Qw 5 water jet discharge (m3/s);r 5 radial distance (m) from the center line;r1 5 jet radius (m) at impingement point (e.g., of plunging
jet);t 5 time (s);tch 5 bubble chord time (s) defined as the time spent by
the bubble on the probe tip;u9 5 root mean square of longitudinal component of tur-
bulent velocity (m/s);V 5 velocity (m/s);Ve 5 onset velocity (m/s) for air entrainment; i.e., air en-
trainment occurs for V1 . Ve;V1 5 impact flow velocity (m/s) of plunging jet;We 5 Weber number: We 5 rV2d/s;We1 5 Weber number at impingement: We1 5 d1/s;w 2r V1
X 5 horizontal coordinate (m);x 5 distance along the flow direction (m), measured from
the nozzle;x1 5 distance (m) between nozzle and impingement point
(e.g., of plunging jet); that is, x1 is the free-jet length;Z 5 vertical coordinate (m);YCmax 5 radial distance (m) measured from the jet center line
where C 5 Cmax;YFmax
5 radial distance (m) measured from the jet center linewhere F 5 Fmax

677Bubble Entrainment and Dispersion in Plunging Jet Flows
Journal of Coastal Research, Vol. 22, No. 3, 2006
Greek Symbols
m 5 dynamic viscosity (Pa s);mw 5 dynamic viscosity (Pa s) of water;n 5 kinematic viscosity (m2/s): n 5 m/r;u 5 angle between impinging jet and receiving free-sur-
face;r 5 density (kg/m3);rw 5 water density (kg/m3);s 5 surface tension between air and water (N/m)
Other
Ø 5 diameter (m);
Subscripts
o 5 nozzle conditions;w 5 water solution flow (i.e., freshwater, saltwater, or
seawater);1 5 upstream flow conditions or inflow conditions (e.g.,
at impingement)