bubble size effects in coal flotation and phosphate
TRANSCRIPT

Graduate Theses, Dissertations, and Problem Reports
2014
Bubble Size Effects in Coal Flotation and Phosphate Reverse Bubble Size Effects in Coal Flotation and Phosphate Reverse
Flotation using a Pico-nano Bubble Generator Flotation using a Pico-nano Bubble Generator
Yu Xiong West Virginia University
Follow this and additional works at: https://researchrepository.wvu.edu/etd
Recommended Citation Recommended Citation Xiong, Yu, "Bubble Size Effects in Coal Flotation and Phosphate Reverse Flotation using a Pico-nano Bubble Generator" (2014). Graduate Theses, Dissertations, and Problem Reports. 469. https://researchrepository.wvu.edu/etd/469
This Dissertation is protected by copyright and/or related rights. It has been brought to you by the The Research Repository @ WVU with permission from the rights-holder(s). You are free to use this Dissertation in any way that is permitted by the copyright and related rights legislation that applies to your use. For other uses you must obtain permission from the rights-holder(s) directly, unless additional rights are indicated by a Creative Commons license in the record and/ or on the work itself. This Dissertation has been accepted for inclusion in WVU Graduate Theses, Dissertations, and Problem Reports collection by an authorized administrator of The Research Repository @ WVU. For more information, please contact [email protected].
Bubble Size Effects in Coal Flotation and
Phosphate Reverse Flotation using
a Pico-nano Bubble Generator
Yu Xiong
Dissertation submitted to
Benjamin M. Statler College of Engineering and Mineral Resources
At West Virginia University
In partial fulfillment of the requirements
For the degree of
Doctor of Philosophy in Mining Engineering
Felicia F. Peng, Ph.D., Chair
Christopher Bise, Ph.D.
Yi Luo, Ph.D.
Lian-Shin Lin, Ph.D.
Yunqing Zhang, Ph.D.
Department of Mining Engineering
West Virginia University
2014
Keywords: pico-nano bubble, cavitation, coal flotation, phosphate reverse flotation

ABSTRACT
Bubble Size Effects in Coal Flotation and Phosphate Reverse
Flotation using a Pico-nano Bubble Generator
Yu Xiong
Froth flotation is widely used in minerals industry. However, it is effective in a narrow
size range, nominally 45–250 μm for coal and 10–150 μm for minerals. And the flotation
performance of coal and minerals beyond this size range is not quite satisfactory. It is
now recognized that the low-flotation efficiency of ultrafine particles is mainly due to the
low probability of bubble-particle collision while the main reason for poor flotation
recovery of coarse particles is the high probability of detachment of particles from the
bubble surface.
Pico-nano bubbles refer to tiny bubbles smaller than 0.5 μm, which can be produced
using ultrasonic or hydrodynamic cavitation method. A fundamental analysis has shown
that pico-nano bubbles will serve as a secondary collector, bridging between hydrophobic
particles and conventional sized bubbles, which can significantly improve the flotation
recovery of hydrophobic particles by increasing the probability of collision and
attachment and reducing the probability of detachment.
In order to obtain an optimal designed cavitation venturi tube for pico-nano bubbles’
generation, different designs of cavitation venturi tubes were fabricated and tested in this
study. The test results showed that maximum volume of pico-nano bubbles, 65% to 75%,
and minimum mean pico-nano bubble size, 150 to 240 nm, were achieved at the medium
ratio of the diameter of throat and outlet of the venturi tube (3 to 4), medium outlet angle
(11°to 13°), high inlet angle (26° to 27°) and high ratio of the length of the throat and the
diameter of throat (2.3 to 3).
The laboratory-scale coal flotation tests showed that, the combustible material recoveries
for coarse fractions, -700+355 μm, and ultrafines fraction, -75 μm, were remarkably
increased in the presence of pico-nano bubbles in coal flotation. The maximum
combustible recovery of 85 to 90% and minimum clean coal ash of 9.5 to 11% were
achieved from 29.6% ash content of Pittsburgh No. 8 seam coal. At a given flotation
combustible material recovery, more than half of the collector can be saved by using
pico-nano bubbles in the column flotation. The frother dosage was also reduced to half.
The laboratory-scale phosphate reverse flotation tests revealed that both the P2O5 grade
and P2O5 recovery had been greatly improved in the presence of pico-nano bubbles. The
column flotation using pico-nano bubble was capable of extending to float minus 75 m
and 355-700 m particle size ranges much more effectively than column flotation with
conventional sparger devices. The economic analysis performed in this study
demonstrated that the application of pico-nano bubbles in both phosphate reverse
flotation and coal flotation were economically feasible.

ii
Acknowledgements
The author would like to express his deep appreciation to his advisor, Dr. Felicia Peng,
for her guidance, motivation, and continual support throughout this work. The valuable
suggestions and comments by dissertation committee members, Dr. Christopher Bise,
Dr. Yi Luo, Dr. Lian-Shin Lin and Dr. Yunqing Zhang are greatly appreciated.
Special acknowledge is due to the financial support to this research projects provided by
West Virginia State Coal and Energy Research Bureau (CERB), and the Department of
Mining Engineering. The coal samples supplied by Alpha Natural Resources, and the
phosphate samples provided by the Mosaic Company are greatly appreciated.
The author would also like to express his sincere thanks to Dr. James Zhenxing Gu,
senior metallurgist at Arr-Maz Custom Chemicals, for providing flotation reagents, Dr.
Daniel Tao and Dr. Jack Groppo of the Center for Applied Energy Research, University
of Kentucky, for their willingness of utilizing their particle size analyzer are greatly
appreciated. Special thanks to late Mr. William Comstock for his assistance in making
venturi tubes, and his effort of ensuring that the laboratory equipment is as practical and
efficient as plausible.
Finally, the author wishes to give particular thanks to his wife, Shengjue Yang, and
family members in China for their consistant encouragement and moral support. The
author also wants to give special thanks to his seventy-seven year old grandmother,
Fengmei Liu, his father, Xiangsheng Xiong, his mother, Ling Yu, his aunt, Sanmei Yu
and parents-in-laws, Cheng Yang and Meilan Zhang, for their understanding and
unconditional support.

iii
Table of Content
Page
Abstract…………………………………………………………………………………….i
Acknowledgements ............................................................................................................. ii
Chapter 1 Introduction ....................................................................................................... ix
1.1 Coal ...................................................................................................................... 1
1.2 Phosphate ............................................................................................................. 2
1.3 Particle size limitation in froth flotation .............................................................. 4
1.4 Objectives ............................................................................................................ 6
1.5 Contributions........................................................................................................ 7
Chapter 2 Literature Review ............................................................................................... 8
2.1 Separation method of flotation ............................................................................. 8
2.2 Effects of particle and bubble size in flotation .................................................... 9
2.2.1 Effect of particle and bubble size on collision ....................................... 10
2.2.2 Effect of particle and bubble size on attachment ................................... 11
2.2.3 Effect of particle and bubble size on detachment .................................. 14
2.2.4 Effect of bubble size on gas holdup ....................................................... 16
2.2.5 Effect of nanobubble on flotation of coarse, fine and ultrafine particles
............................................................................................................ .17
2.3 Generation of nanobubble .................................................................................. 18
2.3.1 Cavitation effect ..................................................................................... 20

iv
2.3.2 Effect of design parameters of cavitation tube on nanobubble generation
............................................................................................................. 23
2.3.3 Effect of agitation on nanobubble generation ........................................ 24
2.3.4 Effect of dissolved gas on nanobubble generation ................................ 24
2.3.5 Effect of surfactant on nanobubble generation ...................................... 26
2.3.6 Effect of solid addition in solution on nanobubble generation .............. 27
2.3.7 Effect of flow superficial velocity on nanobubble generation ............... 28
2.3.8 Effect of saturation pressure on nanobubble generation ........................ 29
2.3.9 Effects of addition of mixer and air intake location on nanobubble
generation ............................................................................................ 30
2.4 Application of cavitation in flotation ................................................................. 31
Chapter 3 Materials and Methodology for Coal Flotation ................................................ 33
3.1 Characterization of coal sample ......................................................................... 33
3.2 Reagents for coal flotation ................................................................................. 34
3.3 Equipment and Design of Experiment for coal flotation ................................... 35
3.3.1 Bubble size analysis system ................................................................... 35
3.3.2 Effect of different designs of cavitation venturi tube on bubble
distribution .......................................................................................... 37
3.3.3 Effects of different types frother and frother dosage on pico-nano bubble
generation. ........................................................................................... 40
3.3.4 Design and set up a pico-nano bubble enhanced flotation column. ....... 40

v
3.3.5 Perform two-stage Design of Experiment and single factor test for coal
flotation. .............................................................................................. 41
3.3.5.1 Six-factor three-level experimental design ......................................... 41
3.3.5.2 Three-factor three-level central composite Design of Experiment ..... 45
3.3.5.3 Single factor experimental test ............................................................ 46
3.3.6 Study the effect of particle size on separation efficiency and combustible
material recovery. ............................................................................... 47
3.3.7 Compare the flotation results of pico-nano bubble column flotation with
that of release analysis. ....................................................................... 47
Chapter 4 Materials and Methodology for Phosphate Reverse Flotation ......................... 50
4.1 Materials ............................................................................................................ 50
4.1.1 Size distribution and chemical analysis ................................................. 51
4.1.2 Mineral liberation................................................................................... 54
4.1.3 Grinding ................................................................................................. 55
4.1.4 Characterization for phosphate reverse flotation feed ........................... 57
4.2 Reagents for phosphate reverse flotation reagents ............................................. 58
4.3 Equipment and Design of Experiment for Phosphate Reverse Flotation .......... 59
4.3.1 Spectrophotometric analysis .................................................................. 59
4.3.2 Atomic absorption analysis .................................................................... 59
4.3.3 Batch flotation experiments of phosphate sample ................................. 60
4.3.4 Pico-nano bubble column flotation ........................................................ 61

vi
4.3.5 Develop a method for domomitic phosphate flotation .......................... 62
4.3.6 Froth Stability Measurement .................................................................. 65
4.3.7 Study on the effects of different collectors in phosphate reverse flotation
............................................................................................................. 65
4.3.8 Perform two-stage Design of Experiment and single factor test of
phosphate reverse flotation. ................................................................ 66
4.3.8.1 Two-stage Design of Experiment ....................................................... 66
4.3.8.2 Single factor test ................................................................................. 68
4.3.9 Perform Denver mechanical cell flotation ............................................. 69
Chapter 5 Results and Discussions for Coal Flotation...................................................... 70
5.1 Effects of venturi tube design for pico-nano bubbles and nanobubbles
generation ........................................................................................................... 70
5.1.1 Design of venturi tube for pico-nano bubbles and nanobubbles
generation and measurement ............................................................... 70
5.1.2 Properties of pico-nano bubbles and nanobubbles ................................. 83
5.1.2.1 Effect of different configurations of pico-nano bubbles, nanobubbles
and microbubbles generators on bubble size distribution ................... 83
5.1.2.2 Effect of selected frother on pico-nano bubble size distribution ........ 87
5.2 Column flotation of bituminous coal using cavitation venturi tube for pico-nano
bubbles and nanobubbles generation ................................................................. 89
5.2.1 Design of Experiment and Statistical Analysis Method ........................ 89

vii
5.2.1.1 Six-factor three-level experimental design ......................................... 89
5.2.1.2 Three-factor three-level central composite experimental design ...... 102
5.2.2 Single factor experimental test .......................................................... 113
5.3 Effects of particle density and size distributions in coal flotation pico-nano
bubbles environment ........................................................................................ 116
5.3.1 Particle size and density frequencies ................................................... 116
5. 3.2 Pico-nano bubble Column Flotation Test ........................................... 118
5.3.2.1 Effect of pico-nano bubbles on flotation of coarse and ultrafine
fractions of coal particles .................................................................. 118
5.3.2.2 Effect of pico-nano bubbles on flotation particle size ranges ........... 122
5.3.2.3 Effect of pico-nano bubbles on flotation ash rejection ..................... 123
5.3.2.4 Effect of pico-nano bubbles on overall performance ........................ 125
5.3.2.5 Pico-nano bubbles and nanobubbles percent effect on separation
efficiency of column flotation for bituminous coal .......................... 129
5.3.2.6 Effect of particle size on separation efficiency and combustible
material recovery .............................................................................. 131
5.4 Economic evaluation of the application of pico-nano bubbles in coal flotation
.......................................................................................................................... 133
Chapter 6 Results and Discussions for Phosphate reverse Flotation .............................. 135
6.1 Measurement of frothability and froth stability ............................................... 135
6.1.1 Effect of selected surfactant on collector frothability .......................... 135

viii
6.1.2 Effect of selected surfactant on collector froth stability ...................... 136
6.1.3 Effect of different collector on dolomite flotation ............................... 137
6.2 Design of Experiment and Statistical Analysis Method .................................. 144
6.2.1 Seven-factor two-level fractional factorial experimental design ......... 144
6.2.2 Five-factor two-level fractional factorial experimental design ............ 153
6.2.3 Single factor experimental test ............................................................. 159
6.2.3.1 Collector dosage effect ..................................................................... 160
6.2.3.2 pH effect ............................................................................................ 162
6.2.4 Amine flotation to remove silica impurity ........................................... 164
6.2.5 Correlation between grade and recovery ............................................. 166
6.2.6 Effect of pico-nano bubbles on P2O5 recovery of varying sizes .......... 167
6.3 Economic evaluation of pico-nano bubble enhanced phosphate reverse flotation
.......................................................................................................................... 169
Chapter 7 Conclusions .................................................................................................... 170
Chapter 8 Recommendations for Future Work ............................................................... 175
References ………………………………………………………………………………177
Appendix A ..................................................................................................................... 188
Appendix B ..................................................................................................................... 191
Appendix C ..................................................................................................................... 204
VITA……………………………………………………………………………………214

ix
List of Tables
Page
Table 1-1 World Coal Production Reserve (2011)a. .......................................................... 2
Table 1-2 Domestic Coal Reserve of U.S. (2012)c. ........................................................... 2
Table 1-3 World Phosphate Production Reserve. ............................................................... 3
Table 3-1 Particle size and ash distributions for flotation feed of .................................... 33
Table 3-2 Flotation conditions for pico and nano bubble generation. .............................. 37
Table 3-3 Levels of variables for a four-factor three-level design of venturi-tube .......... 38
Table 3-4 Four-factor three-level experimental design of venturi-tube design tests. ....... 39
Table 3-5 Levels of variables for a six-factor three-level design for column flotation
using pico-nano bubbles. ................................................................................ 43
Table 3-6 Six-factor three-level experimental design for column flotation using
pico-nano bubbles. .......................................................................................... 44
Table 3-7 Levels of variables for a three-factor three-level design for column flotation
using pico-nano bubbles. ................................................................................ 45
Table 3-8 Three-factor three-level central composite design for column flotation using
pico-nano bubbles. .......................................................................................... 45
Table 3-9 Process parameters and operational conditions. ............................................... 46
Table 3-10 Size range of wet sieving. ............................................................................... 47
Table 4-1 Chemical analysis of the as-received dolomotic phosphate sample. ................ 51
Table 4-2 Size distribution and chemical analysis of as-received dolomitic phosphate
pebble sample. ................................................................................................. 52

x
Table 4-3 Size distribution and chemical analysis of as-received dolomitic phosphate
pebble sample. ................................................................................................. 53
Table 4-4 Percentage of liberated dolomitic phosphate sample ....................................... 54
Table 4-5 Stainless steel grinding media for rod mill. ...................................................... 55
Table 4-6 Size distribution at different grinding time for ................................................. 56
Table 4-7 Size distribution at different grinding time for ................................................. 56
Table 4-8 Size distribution and chemical analysis of dolomitic phosphate sample. ........ 57
Table 4-9 Summary of Processes Developed for Florida Dolomitic Phosphate. ............. 62
Table 4-10 Process parameters and operational conditions. ............................................. 66
Table 4-11 Experiment design for the first set of test runs. .............................................. 67
Table 4-12 Process parameters and operational conditions. ............................................. 67
Table 4-13 Experiment design for the second set of test runs. ........................................ 68
Table 4-14 Process parameters and operational conditions. ............................................. 68
Table 5-1 Estimated coefficients, t-ratios and p-values .................................................... 72
Table 5-2 ANOVA table derived for the Pico-nano bubble Volume and Mean Pico-nano
bubble Size models. ........................................................................................ 73
Table 5-3 Estimated coefficients, t-ratios and p-values. ................................................... 90
Table 5-4 ANOVA table derived for the combustible material recovery and clean coal
ash models. ...................................................................................................... 91
Table 5-5 Estimated coefficients, t-ratios and p-values. ................................................. 102
Table 5-6 ANOVA table derived for the recovery and clean coal ash models derived from
the results. ..................................................................................................... 103

xi
Table 5-7 Column flotation test conditions for bituminous coal using optimal designed
cavitation venturi tube................................................................................... 130
Table 6-1 Estimated coefficients, t-ratios and p-values. ................................................. 145
Table 6-2 Main Effects of the Factors for Factorial Design. .......................................... 151
Table 6-3 Estimated coefficients, t-ratios and p-values. ................................................. 153
Table 6-4 ANOVA table with SIp index as responses. .................................................. 153
Table 6-5 Main Effects of the Factors for Factorial Design. .......................................... 158
Table 6-6 Material balance of dolomite flotation followed by silica amine flotation. ... 165
Table A-1 Results of four-factor three-level experimental design of venturi-tube design
tests. .............................................................................................................. 189
Table B-1 Results of six-factor three-level experimental design for column flotation using
pico-nano bubbles. ........................................................................................ 192
Table B-2 Results of three-factor three-level central composite design for column
flotation using pico-nano bubbles. ................................................................ 194
Table B-3 Effect of collector dosage on clean coal and combustible material recovery. 195
Table B-4 Effect of solid Concentration on clean coal and combustible material recovery.
....................................................................................................................... 195
Table B-5 Effect of feed rate on clean coal and combustible material recovery. ........... 196
Table B-6 Effect of pico-nano bubbles and coal particle density on the coal flotation
performance. ................................................................................................. 196
Table B-7 Density and ash distributions of fine raw coal sample .................................. 197
Table B-8 Effect of pico-nano bubble on yield and combustible material recovery. ..... 198

xii
Table B-9 Effect of pico-nano bubbles on the flotation product particle size distributions
of -700+150 μm and -150 μm raw coal feed in the presence and absence of
pico-nano bubbles. ........................................................................................ 199
Table B-10 Effect of pico-nano bubble on flotation ash rejection for various particle sizes.
....................................................................................................................... 200
Table B-11 Effect of pico-nano bubbles on flotation yield. ........................................... 201
Table B-12 Effect of pico-nano bubble on combustible material recovery. ................... 202
Table B-13 Particle size effect on separation efficiency and combustible material
recovery with pico-nano bubbles. ................................................................. 203
Table C-1 Effect of CF 413 B on dolomite flotation. ..................................................... 205
Table C-2 Effect of CF 413 on dolomite flotation. ......................................................... 206
Table C-3 Effect of the mixture of CF 413 and MIBC on dolomite flotation. ............... 207
Table C-4 Effect of the mixture of CF 413B and MIBC on dolomite flotation. ............ 208
Table C-5 Results of seven-factor two-level fractional factorial experimental design. . 209
Table C-6 Results of five-factor two-level fractional factorial experimental design. .... 210
Table C-7 Effect of pH on dolomite flotation. ................................................................ 211
Table C-8 Effect of collector dosage on dolomite flotation. .......................................... 212
Table C-9 Effect of pico-nano bubbles on P2O5 recovery of varying sizes. ................... 213

xiii
List of Figures
Page
Figure 2-1 Particle-bubble collision, adhesion, and detachment. ....................................... 9
Figure 2-2 Collision probability as a function of bubble size. .......................................... 11
Figure 2-3 Role of nanobubbles in enlarging contact angle: ............................................ 12
Figure 2-4 Attachment probability as a function of bubble size. ...................................... 14
Figure 2-5 Different Forces as a function of bubble size by Fan et al. (2010a). .............. 15
Figure 2-6 Effect of pico-nano bubbles on coarse, fine and ultrafine particles. ............... 18
Figure 2-7 Effect of dissolved air on bubble generation without added air. ..................... 25
Figure 2-8 Bubble collapse behavior at different superficial velocity .............................. 28
Figure 2-9 Effect of liquid release velocity on bubble formation as evaluated by gas
holdup (note: the dotted lines connect the points with same saturation
pressures). ....................................................................................................... 30
Figure 3-1 Size and ash distribution for Pittsburgh No. 8 seam coal sample. .................. 34
Figure 3-2 Schematic diagram of the pico-nano bubble measurement system. ............... 35
Figure 3-3 Malvern Mastersizer 2000 laser particle size analyzer and the pico-nano
bubble measurement system ........................................................................... 36
Figure 3-4 Skematic diagram of cavitation venturi tube. ................................................. 38
Figure 3-5 Schematic diagram of flotation column with static mixer and venturi tube for
pico and nano bubble generation. ................................................................... 41
Figure 3-6 Schematic diagram of the reverse release analysis procedure. ....................... 48
Figure 4-1 Percent passing as a function of grinding time. .............................................. 57
Figure 4-2 The Spectronic 200 used for phosphorus and P2O5 content analysis. ............. 59

xiv
Figure 4-3 The AAnalyst 200 used for MgO and CaO content analysis. ......................... 60
Figure 4-4 Procedures for Processing Florida Dolomitic Phosphate Peddle Sample. ...... 63
Figure 5-1 Comparison of the observed responses and predicted .................................... 74
Figure 5-2 Effect of the ratio of the diameter of throat and outlet of the venturi tube
(Din/Dt) and the ratio of the length of the throat and the diameter of throat
(Lt/Dt) on the pico-nano bubble volume and mean pico-nano bubble size. .... 78
Figure 5-3 Effect of the ratio of the diameter of throat and outlet of the venturi tube
(Din/Dt) and the inlet angle on the pico-nano bubble volume and mean pico-
nano bubble size. ............................................................................................. 80
Figure 5-4 Effect of the ratio of the diameter of throat and outlet of the venturi tube
(Din/Dt) and the outlet angle on the Pico-nano bubble volume and mean pico-
nano bubble size. ............................................................................................. 83
Figure 5-5 Bubbles generated by static mixer –venturi tube, static mixer only and venturi
tube only with 20 ppm MIBC. ........................................................................ 86
Figure 5-6 Pico-nano Bubble generated at varying concentration of MIBC. ................... 87
Figure 5-7 Bubble size distribution curve in water solution with 20 ppm MIBC, and TTT
frother. ............................................................................................................. 89
Figure 5-8 Comparison of the observed responses and predicted responses with reduced
model............................................................................................................... 92
Figure 5-9 Effect of gas flow rate and collector dosages on CMR and clean coal ash. ... 94
Figure 5-10 Effect of gas flow rate and wash water rate on CMR and clean coal ash. .... 96
Figure 5-11 Effect of gas flow rate and frother dosage on CMR and clean coal ash. ...... 97

xv
Figure 5-12 Effect of gas flow rate and solids concentration on CMR and clean coal ash.
......................................................................................................................... 99
Figure 5-13 Effect of gas flow rate and feed rate on CMR and clean coal ash. ............. 100
Figure 5-14 Combustible material recovery versus clean coal ash for column flotation and
release analysis flotation results. ................................................................... 101
Figure 5-15 Effect of solids concentration and collector dosages on CMR and clean coal
ash. ................................................................................................................ 106
Figure 5-16 Effect of feed rate and collector dosages on CMR and clean coal ash. ...... 109
Figure 5-17 Effect of solids concentration and feed rate on CMR and clean coal ash. .. 111
Figure 5-18 Combustible material recovery versus clean coal ash content for column
flotation and release analysis flotation results. ............................................. 112
Figure 5-19 Combustible material recovery and clean coal ash content as a function of
collector dosage. ........................................................................................... 114
Figure 5-20 Combustible material recovery and clean coal ash content as a function of
solid concentration. ....................................................................................... 114
Figure 5-21 Combustible material recovery and clean coal ash content as a function of
feed rate. ........................................................................................................ 115
Figure 5-22 Density and ash distributions of fine raw coal sample. .............................. 118
Figure 5-23 Effect of pico-nano bubbles on coal flotation recovery. ............................. 120
Figure 5-24 Effect of pico-nano bubble on yield and combustible material recovery. .. 121
Figure 5-25 Cumulative particle size distributions of clean coal with and without pico-
nano bubbles. ................................................................................................ 123

xvi
Figure 5-26 Effect of pico-nano bubble on flotation ash rejection for various particle sizes.
....................................................................................................................... 125
Figure 5-27 Effect of pico-nano bubbles on flotation yield. ........................................... 127
Figure 5-28 Effect of pico-nano bubble on combustible material recovery. .................. 128
Figure 5-29 Combustible material recovery and clean coal ash content as a function of
Pico-nano and nanobubble percent. .............................................................. 130
Figure 5-30 Particle size effect on separation efficiency and combustible material
recovery. ........................................................................................................ 131
Figure 5-31 The photo shows the clean coal (left), middlings (middle) and tailings (right)
of pico-nano bubbles flotation for Pittsburgh No.8 seam coal. .................... 132
Figure 6-1 Froth height as a function of collector dosage with different surfactants. .... 136
Figure 6-2 Froth life time as a function of collector dosage with different surfactants. . 137
Figure 6-3 Effect of selected surfactants on the yield of the floats using different collector
with and without surfactant. .......................................................................... 138
Figure 6-4 Effect of selected surfactants on the MgO grade in the float using different
collector with and without surfactant. ........................................................... 140
Figure 6-5 Effect of selected surfactants on the MgO recovery in the float using different
collector with and without surfactant. ........................................................... 140
Figure 6-6 Effect of selected surfactants on the P2O5 grade in the float using different
collector with and without surfactant. ........................................................... 141
Figure 6-7 Effect of selected surfactants on the P2O5 loss in the float using different
collector with and without surfactant. ........................................................... 142
xvii
Figure 6-8 Effect of selected surfactants on the MgO grade in the sink using different
collector with and without surfactant. ........................................................... 143
Figure 6-9 Effect of selected surfactants on the MgO recovery in the sink using different
collector with and without surfactant. ........................................................... 144
Figure 6-10 Comparison of the observed responses and predicted responses. ............... 145
Figure 6-11 Effect of pH and collector dosages on SIp index. ....................................... 146
Figure 6-12 Effect of feed rate and collector dosages on SIp index. .............................. 147
Figure 6-13 Effect of feed solid concentration and collector dosages on SIp index. ..... 148
Figure 6-14 Effect of frother dosages and collector dosages on SIp index. ................... 149
Figure 6-15 Effect of gas flow rate and collector dosages on SIp index. ....................... 150
Figure 6-16 Effect of wash water flow rate and collector dosages on SIp index. .......... 150
Figure 6-17 Comparison of the observed responses and predicted responses. ............... 154
Figure 6-18 Effect of pH and feed rate on SIp index. ..................................................... 155
Figure 6-19 Effect of frother dosage and pH on SIp index. ............................................ 156
Figure 6-20 Effect of collector dosages and pH on SIp index. ....................................... 157
Figure 6-21 Effect of feed solid concentration and pH on SIp index. ............................ 157
Figure 6-22 MgO grade in the sink and MgO recovery in the dolomite flotation float as a
function of collector dosage. ......................................................................... 160
Figure 6-23 P2O5 grade and recovery in the dolomite flotation sink and the separation
selectivity index as a function of collector dosage. ...................................... 161
Figure 6-24 MgO grade in the sink and MgO recovery in the dolomite flotation float as a
function of pH. .............................................................................................. 162

xviii
Figure 6-25 P2O5 grade and recovery in the dolomite flotation sink and the separation
selectivity index as a function of pH............................................................. 163
Figure 6-26 Relationship between P2O5 grade and P2O5 recovery in the sink product of
dolomite flotation. ......................................................................................... 166
Figure 6-27 P2O5 grade and recovery in the dolomite flotation sink and the separation
selectivity index as a function of pH............................................................. 167
Figure 6-28 P2O5 grade vs. P2O5 recovery for -700 +150μm phosphate particles with and
without pico-nano bubbles. ........................................................................... 168
Figure 6-29 P2O5 grade vs. P2O5 recovery for -150 μm phosphate particles with and
without pico-nano bubbles. ........................................................................... 168

1
Chapter 1 Introduction
1.1 Coal
Coal is a nonrenewable resource formed from the decomposition of organic materials that
have been subjected to geologic heat and pressure over millions of years. It provides
30.3 % of global primary energy needs and generates 42% of the world's electricity. In
2011 coal was the fastest growing form of energy outside renewables. Its share in global
primary energy consumption increased to 30.3% - the highest since 1969. It can be seen
from Table 1-1 that the United States is the second largest coal producer in the world
with the largest coal reserves. Montana, Illinois, Wyoming, West Virginia and Kentucky
takes up 70.29% of the coal reserves in US. About 37.4% of the electricity was generated
by coal, more than any other source of electricity in 2013, and Coal’s share of electricity
generation increased to 40 percent during the first quarter of 2013, an 8.7 percent increase
over last year. As been reported by Energy Information Administration (EIA), coal is
projected to remain the dominant fuel for electricity generation in the U.S. through 2040.
It is never overstated that “Coal Keeps the Lights On”.
As more and more advanced mining methods been applied, more and more fine and
ultrafine coal particles has been produced in coal mining process, which now counts for
20% of coal shipments by weight. Coal companies needs more effective flotation
processes to remove mineral impurities from fine and ultra fine coal and recover the high
quality coal fractions which often lost during conventional separation processes. On the
other hand, when coal is ground to ultra fine (below 10 μm), almost all mineral impurities

2
are liberated from coal’s molecular matrix. The successful flotation of ultra fine coal will
greatly enhance energy conservation and environmental protection.
Table 1- 1 World Coal Production Reserve (2012)a.
Country Production
b
(million tonnes)
Share of total
production
(%)
Reserves
(million tones)
Share of total
Reserves
(%)
PR China 1825 47.5 114500 13.30
USA 515.9 13.4 237295 27.60
India 228.8 6.0 60600 7.00 a
Source: 2013 Edition of the IEA( INTERNATIONAL ENERGY AGENCY) Coal
Information, 2013 Edition of the BP Statistical Review of World Energy b
Commercial solid fuels only, i.e. bituminous coal and anthracite (hard coal), and lignite
and brown (sub-bituminous) coal.
Table 1- 2 Domestic Coal Reserve of U.S. (2012)c.
State Domestic reserves
(million tones)
Share of total reserve
(%)
Montana 74644 28.97
Illinois 37835 14.68
Wyoming 37413 14.52
West Virginia 17013 6.6
Kentucky 14213 5.52 c
Source: U.S. Energy Information Administration Form EIA-7A, Coal Production and
Preparation Report, and U.S. Department of Labor, Mine Safety and Health
Administration Form 7000-2, Quarterly Mine Employment and Coal Production Report,
2012.
1.2 Phosphate
Phosphate rock is a non-renewable, non-detrital sedimentary rock which contains high
amounts of phosphate bearing minerals (Gurr, 2001). It has been applied to the current
world agricultural system and for other uses. Major application of phosphate is the

3
production of phosphate fertilizers, which takes up almost 90% of the phosphate
produced. Other of them is used by other industries, such as manufacturing of detergents,
water softeners, cleaners, insecticides, dental products, animal food, and soft drink we
drink every day (Houot, 1982). It is no exaggeration to say that “every living thing on
this planet cannot live without it”. The increasing population results in the long term
growth in the world phosphate rock production. Table 1-3 shows the world phosphate
production and reserves. As shown in Table 1-3, the United States rank seventh in
phosphate reserves but ranked as the second largest country of phosphate production.
Florida and North Carolina accounted for more than 85% of total domestic output, the
remainder was produced in Idaho and Utah. During the phosphate beneficiation process,
about 20% to one third of the matrix phosphate value will be lost in the phosphatic clays
because of the low recovery of fine and ultrafine particles (Moudgil and Somasundaran,
1986). The reserves of phosphate will be depleted much sooner than other countries if
there is no significant improvement in the phosphate production.
Table 1- 3 World Phosphate Production Reserve.
(thousand metric tons)d
Country Phosphate production
Reserves 2011 2012
China 81,000 89,000 3,700,000
United States 28,100 29,200 1,400,000
Morocco 28,000 28,000 50,000,000
Algeria 1,500 1,500 2,200,000
Jordan 6,500 6,500 1,500,000
South Africa 2,500 2,500 1,500,000
Syria 3,100 2,500 1,800,000
World total (rounded) 198,000 210,000 67,000,000 d Source: U.S. Geological Survey, Mineral Commodity Summaries, January 2013.

4
The criteria of phosphate in fertilizer industry requires (1) P2O5 content larger than 30%,
and (2) MgO content less than 1%. If the phosphate ore doesn’t meet the criteria, certain
beneficiation process will be applied to reduce the impurities, such as quartz, mica,
dolomite, etc. Froth flotation is the most widely used phosphate beneficiation process
(Hernainz et al., 2004), which has been used in two-thirds of the phosphate ore
production in Florida and more than half of the world’s phosphate production (Sis and
Chander, 2003).
1.3 Particle size limitation in froth flotation
Froth Flotation process is hydrophobic surface-based particle separation technique. The
separation efficiency of column flotation is determined by raw coal feed or phosphate ore
feed characteristics, and operating parameters associated with feed slurry-reagent
conditioning, air-hydrophobic particles contacting, attachment, detachment, and size of
air bubbles. This process is known to be more efficient and cost effective than other fine
particle separation techniques such as tabling, high-gradient magnetic separation, oil
agglomeration. However, it is efficient only for particles within a narrow size range,
nominally from 10 to 150 μm for minerals and from 45 μm to 250 μm for coal (King et al.
1982; Feng, et al. 1999; Crozier, 1992). Fine particles are known to have low momentum
during the particle-air bubble collision due to low mass of fine particles. This resulted in
low attachment and thus low flotation rate (Trahar and Warren, 1976; Derjaguin et al.
1984). For coarser coal and mineral particles, since particles have higher mass, with weak
attachment force between the coarser particles and air bubbles, often resulted in high
detachment of particles from air bubbles, thus lower the flotation rate (Yoon, 2000; Tao,
2004). Research effort has been centered on the development of air bubbles sparger
5
design to generate the tiny bubbles for better attachment and lower detachment
probabilities during the flotation over past two-three decades. The recent development of
bubble generation through the use of properly and selective design of cavitation venturi
tube, make it possible, to produce pico-nano size range bubbles (Tao et al. 2006b; Fan, et
al. 2010b; Peng and Xiong, 2012, 2013).
Pico-nano bubbles refer to tiny bubbles smaller than 0.5 μm, which can be produced
using hydrodynamic cavitation method (Zhou et al. 1997b, Fan, et al. 2010b; Peng and
Xiong, 2012, 2013). Pico-nano bubbles preferentially nucleate at the surface of
hydrophobic particles (Zhou et la. 1997a). This is because work of adhesion Wa between
a solid particle and water, which is equal to γ1 (1 + Cos Ɵ), where γ1 is water surface
tension and Ɵ is contact angle, is always smaller than work of cohesion of water Wc or 2
γ1. Furthermore, Wa decreases with increasing solid surface hydrophobicity measured by
contact angle. In other words, ultrafine particles can adhere to pico-nano bubbles without
the need of collision, which is often the rate-determining step in froth flotation for
ultrafine particles (Weber and Paddock, 1983; Yoon and Luttrell, 1989; Tao et al. 2006c).
Pico-nano bubbles absorbed on particle surface also serve as a secondary collector,
improving the probability of adhesion and reducing the need for the hydrophobic
chemical (Zhou, 1997a; Luttrell and Yoon, 1992, Peng and Xiong, 2013). In addition,
particles are less likely to detach from smaller bubbles due to their lower upward velocity
and centrifugal force associated with the detachment process, reducing the probability of
detachment.
A selectively designed cavitaion venture tube can be used to generate very high numbers
of pico-nano bubbles to flotation column. Fully embraced by those high numbers of tiny

6
bubbles, hydrophobic particles are readily attracting those tiny bubbles to their surfaces,
after that, it will attach to larger bubbles, and eventually report to the froth zone. With the
connection of pico-nano bubbles as a bridge between fine/coarse particles and
conventional sized bubbles, the separation performance of flotation will be improved
comparing to that of conventional flotation.
1.4 Objectives
The objective of this study is to improve the separation efficiency of fine and coarse
particles in froth flotation by introducing pico-nano bubbles into the column flotation
system. The details of the objectives of this study are given below:
(1) To study the effectiveness of different designs of cavitation venturi tube on pico-nano
bubble generation, and determine the optimal design of cavitation venturi tube;
(2) To study the effectiveness of pico-nano bubbles in coal flotation of coarse (-700+355
μm) and ultrafine (-150 μm) particles;
(3) To study the effectiveness of pico-nano bubbles in phosphate reverse flotation
(dolomitic carbonates flotation and silica flotation) of coarse (-700+355 μm) and
ultrafine (-150 μm) particles.
To improve the essential flotation steps of collision and attachment, and reduce
detachment probabilities between air bubbles and hydrophobic particles, a specially
designed flotation column with a pico-nano bubble generator is developed for enhancing
the recovery of coarse (-700+355 μm) and ultrafine (-150 μm) coal particles and
phosphate particles are difficult to float with a conventional flotation process.
Pico-nano bubbles are produced by cavitation venturi tube based on the hydrodynamic
cavitation principle.

7
1.5 Contributions
This study is significant for five achievements.
1) This study identified effects of different designs of cavitation venturi tube on pico-
nano bubbles generation and determined the optimal venturi design for pico-nano
bubble generation. The optimal designed cavitation venturi tube were then used in
flotation column to generate pico-nano bubbles. This specially designed flotation
column were used to improve the flotation recovery of coarse (-700+355 μm) and
ultrafine (-150 μm) particles.
2) Successfully confirmed the existence of pico-nano bubbles and obtained size
distribution curve by using high precision particle size analyzer.
3) Further the understanding of the effects of different frother dosage necessary for the
generation of pico-nano bubbles, which helped focus on achieving the best flotation
recovery and product grade.
4) Provided the understanding of the discriminating effects of operation conditions in
coal column flotation and dolomitic phosphate reverse flotation on recovery and
product grade helped target the optimal operating conditions. Higher floatation
recovery for the coarse (-700+355 μm) and ultrafine (-150 μm) hydrophobic particles
were achieved. This will result in less energy used in the grinding process for the
middlings in direct coarse mineral flotation, and more fine/ultrafine valuable minerals
will be recovered by introducing pico-nano bubbles into flotation column.
5) Successfully applied this innovative column flotation with pico-nano bubble on coarse
and fine/ultrafine particles. This is expected to help coal/mineral industries improve
the recovery of coarse and fine/ultrafine valuable particles in their process plants.

8
Chapter 2 Literature Review
2.1 Separation method of flotation
Forth Flotation is a highly versatile method for physically separation particles based on
differences in the ability of air bubbles to selectively adhere to specific mineral surfaces
in a mineral /water slurry. The particles with attached air bubbles are then carried to the
surface and removed, while the particles that remain completely wetted stay in the liquid
phase. Froth flotation can be adapted to a broad range of mineral separations, ranging
from mineral separation to effluents de-oiling and soil remediation. Froth flotation, as one
of the outstanding achievements through continuous 100 years of development, has
contributed immeasurably to the vast expansion of raw material industry and gained a
significant success in cleaning fine coal and recovering valuable minerals from the most
complex ores. In coal and mineral processing industry, froth flotation also provides many
environmental benefits by removing varying amounts of ash-forming and sulfur-bearing
minerals, mercury and other hazardous air or water pollutant precursors (Taggart, 1927).
In general, flotation can be macroscopically divided into two processes; selective
collection of hydrophobic particles by bubbles, and separation of hydrophobic particle-
bubble aggregates from hydrophilic particles. In coal and minerals froth flotation, particle
size and surface hydrophobicity are two main parameters that affect three key
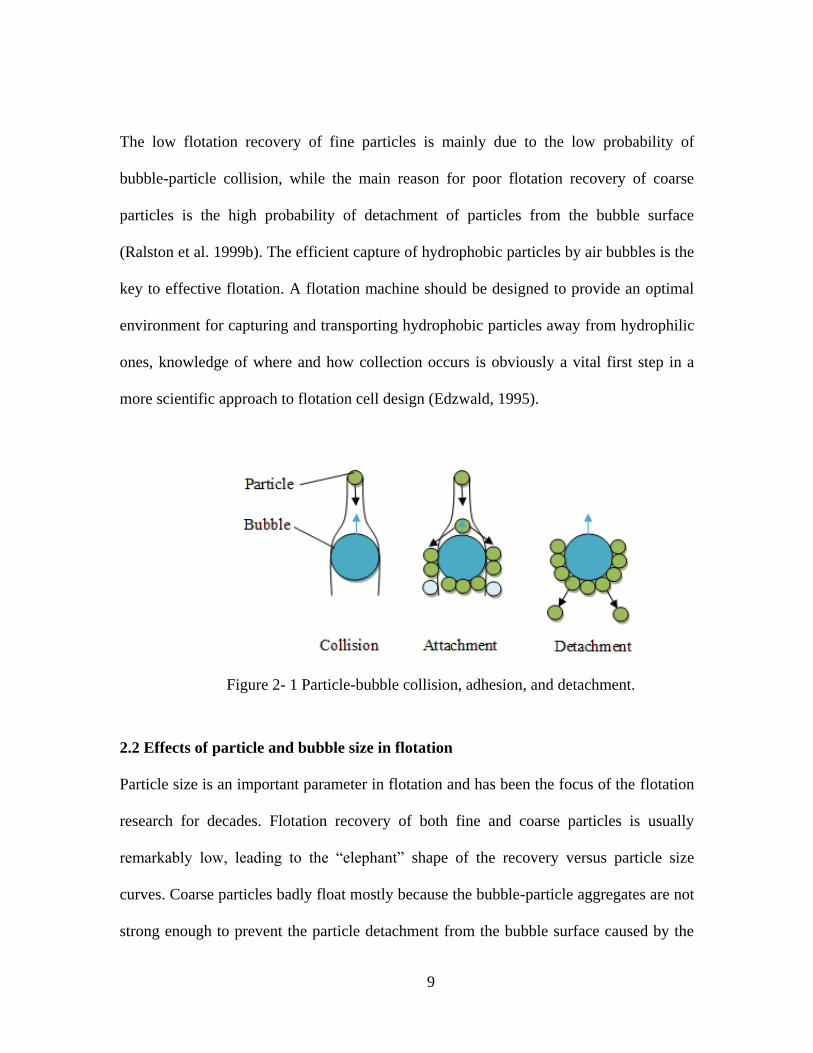
mechanisms in froth flotation process, which are particle-bubble collision, adhesion, and
detachment, as illustrated in Figure 2-1.
9
The low flotation recovery of fine particles is mainly due to the low probability of
bubble-particle collision, while the main reason for poor flotation recovery of coarse
particles is the high probability of detachment of particles from the bubble surface
(Ralston et al. 1999b). The efficient capture of hydrophobic particles by air bubbles is the
key to effective flotation. A flotation machine should be designed to provide an optimal
environment for capturing and transporting hydrophobic particles away from hydrophilic
ones, knowledge of where and how collection occurs is obviously a vital first step in a
more scientific approach to flotation cell design (Edzwald, 1995).
Figure 2- 1 Particle-bubble collision, adhesion, and detachment.
2.2 Effects of particle and bubble size in flotation
Particle size is an important parameter in flotation and has been the focus of the flotation
research for decades. Flotation recovery of both fine and coarse particles is usually
remarkably low, leading to the “elephant” shape of the recovery versus particle size
curves. Coarse particles badly float mostly because the bubble-particle aggregates are not
strong enough to prevent the particle detachment from the bubble surface caused by the

10
particle weight and turbulence eddies during the rise of the aggregates in the pulp phase
to the froth phase and then to the froth launder. Efficiency of the bubble-particle stability
depends on the particle size, particle hydrophobicity and external detaching forces. Even
in the flotation of fine particles, the bubble-particle detachment can significantly
influence the kinetics of flotation taking place in mechanical cells by intensive turbulent
agitation (Deglon et al., 1999). For these fine particles, the bubbles-particle detachment is
usually allegedly neglected.
2.2.1 Effect of particle and bubble size on collision
A particle is collided with a bubble as a result of a sufficiently close encounter, which is
determined by the hydrodynamics of flotation environment. Hydrodynamic interactions
are dominant in the collision efficiency while interfacial forces play a major role in the
attachment efficiency. The stability of the bubble-particle aggregate is a function of both
hydrodynamics and interfacial forces (Duan et al., 2003). The probability of collision (Pc)
can be calculated from stream functions for quiescent conditions. Figure 2-2, predicted by
Eq (2-1) (Yoon and Luttrell, 1989), shows that Pc increases with increasing particle size
and decreasing bubble size. Fine particles have low momentum, resulted in low
probabilities of collision with bubbles, thus difficult to be caught by conventional size
bubbles.
c 3
2+
e0.72
15 (
p
b)2
(2-1)
Where Db is the bubble size, Dp is the particle size, and Re is the Reynolds number.
The smaller particles have low momentum is the main reason for low flotation rate of
fine particles. Figure 2-2 also suggests that nanobubbles generated in the liquid will

11
increase the collision probability with particles. The existant of the dense distributed
nanobubbles is the reason why the collision probability with particles is higher.
Figure 2- 2 Collision probability as a function of bubble size.
2.2.2 Effect of particle and bubble size on attachment
The flotation of fine particles poses a major challenge to mineral processing engineers.
One of the key problems in flotation of fine particles is their low inertia, meaning they
tend to follow and be carried by liquid streamlines around a bubble, resulting in low
collision probabilities. Their low inertia also implies that fine particles may not have
sufficient kinetic energy to rupture the liquid film between particles and bubbles to form
three-phase contact, resulting in low attachment probabilities.
The attachment of a particle to a bubble is a very complex process, which is influenced
by the surface roughness, contact angle, particle size and surface forces of particles and
bubbles. The surfaces of mineral particles are heterogeneous in terms of chemistry
(Piantadosi et al., 2000) and roughness (Krasowska et al., 2009), resulting in differences

12
in wetting behaviour. The stability efficiency may be expected to be the same for
particles of the same mineral and size with the same contact angle (Muganda et al., 2010).
The contact angle and contact area between a bubble and a particle in the presence of
nanobubbles can be increased by using hydrodynamic cavitation-generated nanobubbles
as shown in Figure 2-3. Besides, the nanobubbles can also coat over the particles, thus
reducing collector consumption and expanding the range of floatable particle size. The
role of collector is to increase particle hydrophobicity, thereby accelerating liquid film
drainage and particle–bubble attachment. The increase in contact angle also increases the
attachment force of particles to bubbles, leading to a reduced probability of particle
detachment from the bubble, and recovery of coarser particles (Gontijo et al., 2007).
Figure 2- 3 Role of nanobubbles in enlarging contact angle:
(a) without nanobubbles coating on solid surface;
(b) with nanobubbles coating on solid surface.

13
If a particle is sufficiently hydrophobic, the liquid film between the bubble and the
particle thins and ultimately ruptures as a result of the attractive surface forces. This is
followed by the establishment of the three-phase contact line. Only those hydrophobic
particles, including particles coated over nanobubbles, whose induction time is smaller
than the sliding time can be attached to air bubbles. Obviously the attachment process is
selective and the difference in attachment probability of different particles determines the
selectivity of flotation.
The attachment process is also determined by hydrodynamic and surface forces of
particles and bubbles. Yoon (2000) has shown that the probability of adhesion can be
predicted using various surface chemistry parameters that determine the surface forces of
particles and bubbles, as shown in Eq (2-2).
a sin2 2 arctan exp (-
5+ e0.72 bti
15 b b p
+1 ) (2-2)
Where Vb is the bubble rise velocity and ti is the induction time. The contact time for a
particle colliding with a bubble is very short, usually about 10-2
s or less. In order to make
sure the flotation occurs, the induction time must be less than the contact time, which
includes the collision time and the sliding time.
Figure 2-4 shows the effect of bubble size on bubble-particle attachment probability
predicted by Eq (2-2), the attachment probability decreases with increasing bubble size
and particle size. Ralston et al. (1999a) studied the effect of particle size on attachment
efficiency both experimentally and analytically. They also found that probability
decreases with increasing particle size and increases with increasing particle
hydrophobicity.

14
Figure 2- 4 Attachment probability as a function of bubble size.
2.2.3 Effect of particle and bubble size on detachment
After collision and attachment, all particles attached to air bubbles do not report to the
froth phase. Some of them detach from bubble surface and fall back into the pulp phase.
The flotability of coarse particles are poor because the bubble-particle aggregates are not
strong enough to prevent the particle detachment from the bubble surface caused by the
particle weight and turbulence eddies during the rise of the aggregates in the pulp.
Particle detachment occurs when detachment forces exceed the maximum adhesive forces.
One potential source of excessive forces is bubble oscillations caused by particle-bubble
collisions. Kirchberg and Topfer (1964) showed that bubble collisions with large particles
resulted in detachment of many particles from the bubble surface. Cheng and Holtham
(1995) measured particle-bubble detachment forces by means of a vibration technique
and found that the amplitude of oscillations imposed on the bubble is the dominant factor
in the detachment process. There are many forces acting between a bubble and an
attached particle. These forces are usually classified into four categories, including

15
capillary force, Fp, excess force, Fe, which is the difference between the excess pressure
in the bubble (favorable to attachment) and the hydrostatic force (favorable to
detachment), real weight of particle in the liquid medium, Fw, and other forces such as
the hydrodynamic drag force, Fd (Fan et al., 2010b). Falutsu (1994) presented a
fundamental analysis of the stability of the bubble-particle aggregate in column froths.
The approach involved identifying forces acting on the bubble–particle system at
equilibrium, during detachment, and during reattachment. Forces involved at equilibrium
include: (a) the gravity force; (b) the static buoyancy of the immersed particle; (c) the
hydrostatic pressure of the liquid column of height on the contact area; (d) the capillary
force at the three-phase interface; and (e) the capillary pressure. Destructive forces
identified during detachment were: (a) liquid flow (drag force); (b) slippage (combination
of a centrifugal force and the gravity force); (c) bubble deceleration; and (d) bubble
oscillation. Figure 2-5 shows that Fw increases more significantly than the other three
forces with increasing the coal particle size, and becomes the dominant force among the
four forces when the particle size is larger than 3 mm.
Figure 2- 5 Different Forces as a function of bubble size by Fan et al. (2010a).

16
It is worth pointing out specifically that the excess force increases with decreasing bubble
size, which means that smaller bubbles can be used to reduce coarse particle detachment
and increase the upper flotation limit. This finding is significant since it proves from the
viewpoint of flotation fundamentals that flotation recovery of coarse particles can be
enhanced using smaller rather than larger bubbles. The existence of nanobubbles in
flotation slurry reduced the rinsing velocity of conventional size flotation bubbles. Thus it
can increase the bubble-particle sliding time, decrease the tangential velocities of particle
sliding on bubble surface, and increase the bubble-particle attachment probability and
decrease the detachment probability.
2.2.4 Effect of bubble size on gas holdup
Fine bubbles have significant effects on gas holdup, which is very essential in froth
floatation cell of mineral based process industries.
The gas holdup and gas-holdup-gas-rate relationship has been used to identify the flow
regime (Finch and Dobby, 1991). This work has shown, for example, that column
flotation is best conducted under bubbly flow conditions and that a maximum gas-
holdup-gas-rate combination can be defined based on transition from bubbly to
churn-turbulent flow (Xu et al., 1991; Finch and Dobby, 1991; Ityokumbul, 1993).
Most of the work on gas holdup, however, has been done on two phase water-air systems,
largely because of the difficulty of measuring gas holdup in the three-phase system. The
implicit assumption is that the presence of solids will not alter the gas holdup
substantially, while the effect of hydrophobic particles on the gas hold up investigated by
Banisi et al. (1995) using coal at a concentration of 15% v/v shows that the presence of
coal decreased the gas holdup, the reduction is similar in magnitude to that for

17
hydrophilic solids. In contrast to the hydrophilic particles, hydrophobic particles
become attached to bubbles which may alter their motion sufficiently to have an
additional effect on gas holdup (Yianatos et al., 1988; Tustsumi et al., 1991). Zhou et
al. (1998) also reported that increasing either the number of gas nuclei and nucleation
sites, or the quantity of gas molecules dissolved in water under dynamic conditions may
enhance bubble formation and lead to a higher gas holdup.
2.2.5 Effect of nanobubble on flotation of coarse, fine and ultrafine particles
Figure 2-6 shows that nanobubbles on particle surface activate flotation by promoting the
attachment of larger bubbles since attachment between nanobubbles or gas nuclei and
conventional size bubbles is more favored than bubble/solid attachment. That means
nanobubbles act as a secondary collector for particles, reducing flotation collector dosage,
enhancing particle attachment probability and reducing the detachment probability. This
leads to substantially improved flotation recovery of poorly floating fine and ultrafine
particles. The potential of cavitation generated picobubbles in improving fine particle
froth flotation recovery has been demonstrated by tests on fine silica (Zhou et al., 1997b),
inserting a cavitation tube with addition of small amount of air in the feed stream
(0.15 l/min) showed a significant increase in fine silica recovery from 30% to 52%. The
results were better than using a static mixer in the feed stream. A similar conclusion was
reached by Xu et al. (1996).
The advantage of cavitation generated pico-nano bubbles incorporating with conventional
size bubbles in flotation has been explained by two factors that contribute to the increased
flotation rate constant: a) the pico-nano bubbles formed in situ on hydrophobic particles
may cause flocculation by a bubble-bridging mechanism, resulting in increasing the

18
collision probability with the bubbles; b) particles frosted with pico-nano bubbles may
present a surface favorable attachment to flotation sized bubbles (Fan, 2008). Besides,
experiments on generating nanobubbles by hydrodynamic cavitation revealed that the
energy dissipation levels for cavity formation in a flowing liquid could be much lower
than predicted, depending on the content of dissolved gases, presence of free gas nuclei
and design of cavitation tubes (Zhou et al, 2009).
Figure 2- 6 Effect of pico-nano bubbles on coarse, fine and ultrafine particles.
2.3 Generation of nanobubble
For gas-supersaturated systems such as in dissolved air flotation or vacuum flotation, the
formation of bubbles occurs as a result of various interactions between the liquid, the
solid particles and dissolved gas. Bubble formation events are triggered by energy and
density fluctuations at the molecular level not readily predictable from the continuum
macroscopic equilibrium properties of the liquid-gas system (Hemmingsen, 1978). It is
generally accepted that water undergoes very rapid fluctuations in molecular density and
structural configurations due to the random motion of the water molecules individually or

19
in c1usters, leading to a continuous formation and collapse of molecular voids
(Hemmingsen, 1990). It is likely that such voids serve as the foci or nuclei for the initial
cavities. On the other hand, gas molecules dissolved in water may occupy some of these
structural voids. Successful bubble nucleation depends on the availability of a large
number of adjacent gas molecules, which must simultaneously obtain sufficient kinetic
energy to overcome the forces of attraction between them,to enter into and be retained
in the void to prevent its immediate collapse (Dean, 1944). This requires that the gas have
a higher tendency to transfer from the water to the "gas phase" by diffusion than in the
reverse direction. However, such voids rarely have radii greater than 10-20 Â, and their
lifetimes are in the order of 10-12
second or less (Walstra, 1989). If such voids could
survive, they will have to withstand a pressure of about 1440 atms (Walstra, 1989).
Therefore, spontaneous, homogenous nucleation of gas bubbles in a supersaturated liquid
should not occur under practical conditions (Walstra, 1989). However, samples of sea
water, tap water, or even distilled water form visible bubbles when subjected to tensile,
ultrasonic, or supersaturation pressures as small as 1 atm (Yount, 1976). In dissolved air
flotation, usually 3-5 atm pressures are used to generate a sufficient amount of tiny
bubbles (<100 μm) to float aggregates and fine minerals (Gochin and Solari, 1983). This
level of pressure is two orders of magnitude lower than the supersaturation required for
spontaneous nucleation of bubbles in bulk water (Hemmingsen, 1977), and it implies that
cavitation must be initiated by processes other than modest changes in pressure and the
random motion of water and gas molecules (Yount, 1975).

20
2.3.1 Cavitation effect
Cavitation is a process of in situ formation, growth and subsequent collapse of gas and/or
vapor-filled cavities (microbubbles) in a fluid, while the first stage of cavitation, i.e., the
creation or the birth of cavities is defined as nucleation (Knapp et al. 1970). Compared
with other particle-bubble attachment mechanisms, cavitation/gas nucleation is a rapid
process. Its` possible application in accelerating flotation rates is therefore attractive
(Hemmingsen, 1975). Generating a large quantity of gas nuclei in slurry should be
beneficial to flotation performance. Gas nuclei (cavities) and tiny bubbles can be
generated, according to cavitation principles, by strong shear or turbulence and high fluid
velocities which create the necessary pressure fluctuations in the bulk liquid so that at
some locations the pressure drops below a critical value. High dissolved gas content, the
presence of solid particles in the liquid and the surface roughness of the container and
particles facilitate the initiation of cavities. Whether the gas nuclei will stabilize, and
grow or collapse is determined by the mechanical strength of any surface film of
adsorbed surfactants and gas diffusion rates. High dissolved gas content in a liquid will
accelerate the rate of gas diffusion into and retention by the cavities thus preventing their
immediate collapse. The presence of surfactants on the bubble surface retards the gas
flow into or out of the bubble, thus reducing bubble growth/shrinkage rates and
increasing the life time of the bubble in the liquid. Increasing the adsorption rates of
surfactants, either by adding salts or increasing concentration, has a profound effect on
reducing the gas diffusion rate, thus generating smaller bubbles. At the same time, the
adsorbed surfactant film provides the mechanical strength to oppose shrinkage by
changes in the hydrostatic pressure, making gas nuclei more stable. It should be noted,

21
however, that gas nuclei alone may not induce flotation, due to their small size and
buoyancy (Pease and Blinks, 1947). Hydrodynamic cavitation caused by fast flow of
slurry (> 2m/s) in the presence of surfactants may convert a limited number of tiny gas
nuclei to bubbles large enough to levitate particles (Westwater, 1964). A more convenient
approach is to produce relatively large bubbles elsewhere and bring them into contact
with these gas nuclei frosted particles. These bubbles can be generated either by
mechanical means, sparging or by air aspiration. Therefore, both tiny gas nuclei and
flotation-sized bubbles are available for improving flotation performance.
To initiate cavitation, energy is needed since cavity formation involves creation of new
interfaces. The input energy causes a local pressure fluctuation (e.g., acoustic cavitation
by ultrasound), or through turbulence, creates velocity differences to reduce the local
pressure below the liquid vapor pressure (e.g., hydrodynamic cavitation by fast liquid
flow). Under such conditions vapor cavities form to counter-balance the local pressure
gradient (Young, 1989). When cavities are brought to a relatively high pressure region in
the liquid, they collapse, releasing high energy in a short time period (milli- or micro-
seconds). Research indicates that at the moment of cavity collapse, the local conditions
could reach 100–5000 atm and 1000–5000 atm (Flanngingan and Suslick, 2005). Such
high energy release produces intense shock waves (with velocities exceeding the speed of
sound (Prozorov et al., 2004), causing liquid micro jets and interfacial turbulence (Gogate
and Pandit, 2001) which in turn intervene chemical reactions (Didenko and Suslick,
2002). The high speed liquid micro jets disturb the boundary layer at the solid surface,
leading to the increased mass transfer and fragmentation of the particles (Momber, 2004;
Rykaart and Haarhoff, 1995). In devices such as propellers and pumps, collapsing cavity

22
bubbles causes a great deal of noise, damage to components, and a loss of efficiency
(Brennen, 1995).
The use of cavitation to produce nanobubble, enhancing the flotation of minerals and coal
has been studied for a long time. Nicol et al. (1986) reported that the use of a
superimposed acoustic field nucleated precipitation of extremely small air bubble,
nanobubble, on the surface of coal particles, resulting in an increase in the effective
hydrophobicity of particle in the same manner as the coating of hydrocarbon collector on
the coal surface. The work by Attalla et al. (2000) showed that cavitation, induced by an
acoustic field, can increase product yields and reduce collector additions for a given yield,
it was suggested that it may be better to induce cavitation by a mechanical means, and
Hart et al. (2002) proved that by using a statistically based test program to investigate the
effect of the generation of nanobubbles in flotation feed later on. Studies of Hampton and
Nguyen (2010) also reported that nanobubbles, generated by hydrodynamic cavitation,
were found to change the surface characters of minerals, increase contact angle of solids,
and hence attachment force, bridge fine particles to form aggregates, minimize slime
coating, remove oxidation layers on particle surfaces. In consequence utilizing
nanobubbles reduce reagents consumption, therefore the presence of nanobubble in
flotation pulp can widen the coal and minerals flotation particle size range, as well as
increase the particle surface hydrophobicity. Comparing to other cavitation methods,
hydrodynamic cavitation is the cheapest and most energy efficient method by using
simple equipment with low maintenance cost.

23
2.3.2 Effect of design parameters of cavitation tube on nanobubble generation
The factors affecting bubble formation by hydrodynamic cavitation include (Zhou,
1996a,b):
(1) Nozzle size. For a given length, higher liquid flow velocities through nozzle were
needed to initiate cavitation with the smaller orifices as compared with the larger ones,
probably due to a higher energy loss resulting from the flow contraction and friction in
the smaller orifice (Ponasse et al. 1998).
(2) Nozzle length. The nozzle with a shorter tip length and larger diameter produced
fewer bubbles. The same phenomenon was reported by Ross (1976).
Numerical analysis of hydrodynamics in a cavitation tube used for cavity bubble
generation was conducted to estimate the pressure changes inside the nozzle and energy
loss related to the ratio of throat-to-entrance diameter (Hu et al., 1998). By changing this
ratio and the length of the nozzle, it is possible to determine optimum configuration of the
lowest energy loss without sacrificing bubble formation by cavitation.
There are several designs of cavitation tube, such as orifice plate, nozzle and venturi, all
of which are capable of producing cavitation at a desired point of the flow, while the
venturi is chosen as the best option to generate pico-nano bubbles in this test, because the
gradual reduction and the subsequent gradual expansion of venturi reduced the possibility
of blockage. The venturi also has very low head loss characteristics resulting in minimal
impact on the pump capacity in a plant. The permanent head loss of the other two options
could be as high as 3-4 times greater than the venturi. Also, the ability to vary the throat
length, which is a very important factor of the design of cavitation tube, in the venturi is
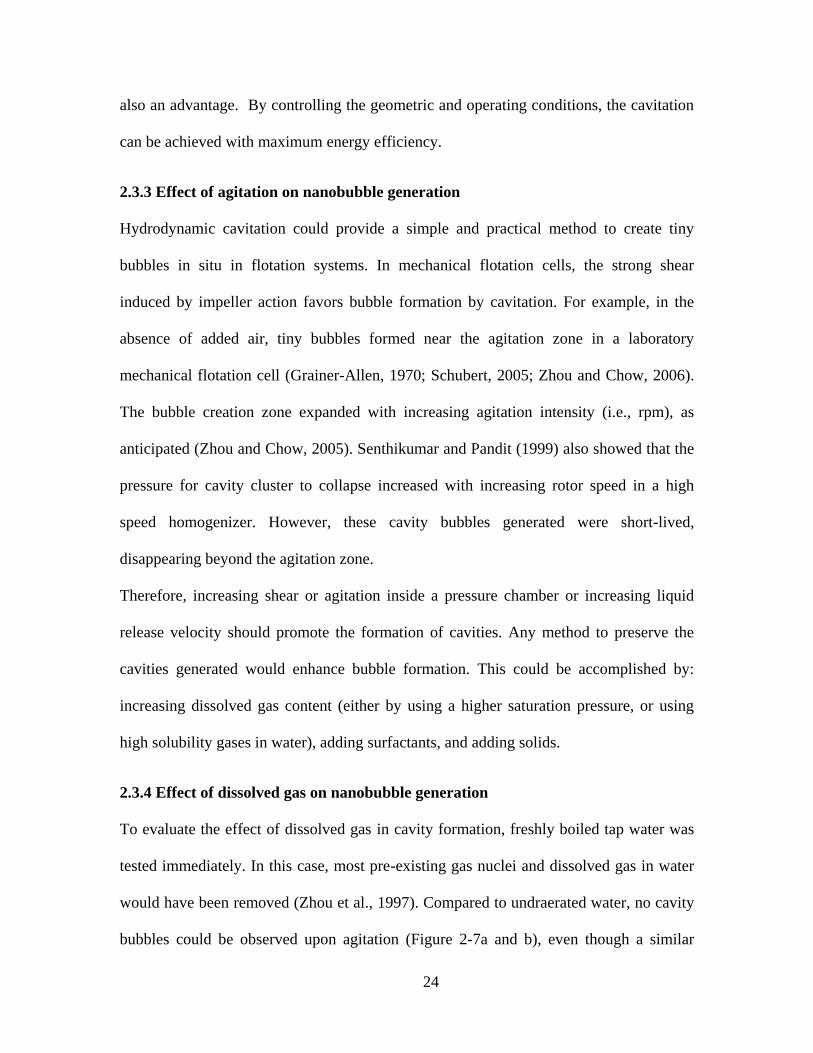
24
also an advantage. By controlling the geometric and operating conditions, the cavitation
can be achieved with maximum energy efficiency.
2.3.3 Effect of agitation on nanobubble generation
Hydrodynamic cavitation could provide a simple and practical method to create tiny
bubbles in situ in flotation systems. In mechanical flotation cells, the strong shear
induced by impeller action favors bubble formation by cavitation. For example, in the
absence of added air, tiny bubbles formed near the agitation zone in a laboratory
mechanical flotation cell (Grainer-Allen, 1970; Schubert, 2005; Zhou and Chow, 2006).
The bubble creation zone expanded with increasing agitation intensity (i.e., rpm), as
anticipated (Zhou and Chow, 2005). Senthikumar and Pandit (1999) also showed that the
pressure for cavity cluster to collapse increased with increasing rotor speed in a high
speed homogenizer. However, these cavity bubbles generated were short-lived,
disappearing beyond the agitation zone.
Therefore, increasing shear or agitation inside a pressure chamber or increasing liquid
release velocity should promote the formation of cavities. Any method to preserve the
cavities generated would enhance bubble formation. This could be accomplished by:
increasing dissolved gas content (either by using a higher saturation pressure, or using
high solubility gases in water), adding surfactants, and adding solids.
2.3.4 Effect of dissolved gas on nanobubble generation
To evaluate the effect of dissolved gas in cavity formation, freshly boiled tap water was
tested immediately. In this case, most pre-existing gas nuclei and dissolved gas in water
would have been removed (Zhou et al., 1997). Compared to undraerated water, no cavity
bubbles could be observed upon agitation (Figure 2-7a and b), even though a similar
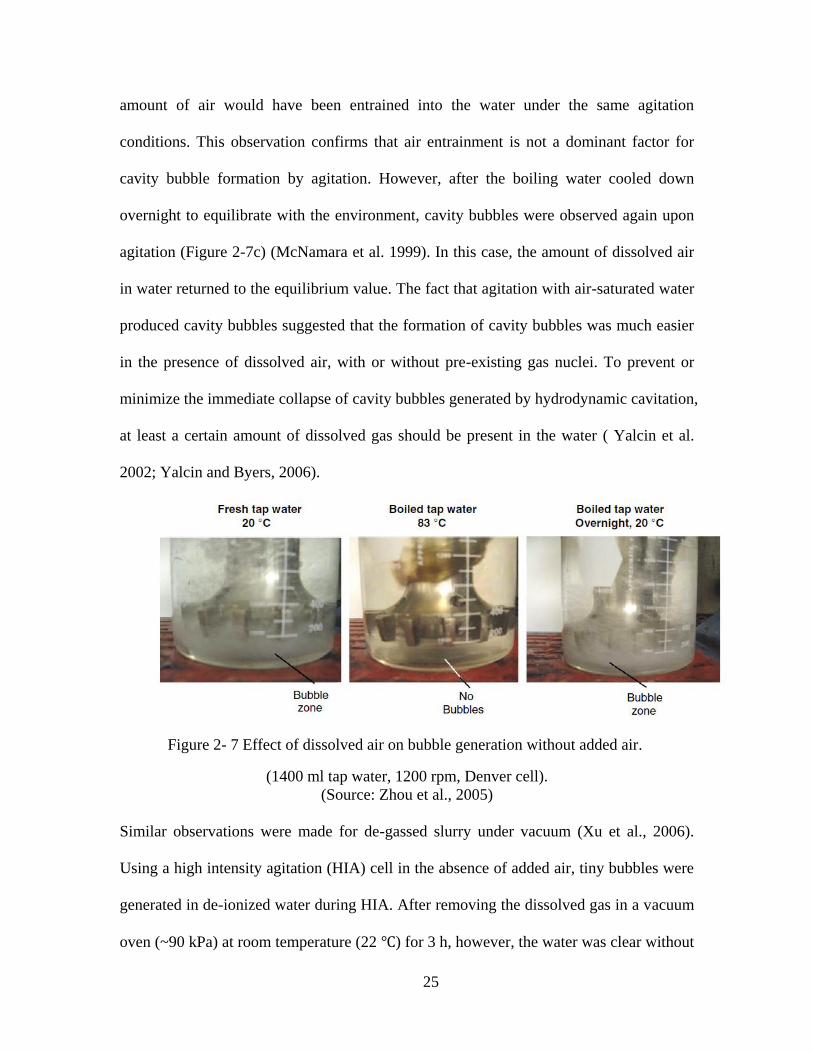
25
amount of air would have been entrained into the water under the same agitation
conditions. This observation confirms that air entrainment is not a dominant factor for
cavity bubble formation by agitation. However, after the boiling water cooled down
overnight to equilibrate with the environment, cavity bubbles were observed again upon
agitation (Figure 2-7c) (McNamara et al. 1999). In this case, the amount of dissolved air
in water returned to the equilibrium value. The fact that agitation with air-saturated water
produced cavity bubbles suggested that the formation of cavity bubbles was much easier
in the presence of dissolved air, with or without pre-existing gas nuclei. To prevent or
minimize the immediate collapse of cavity bubbles generated by hydrodynamic cavitation,
at least a certain amount of dissolved gas should be present in the water ( Yalcin et al.
2002; Yalcin and Byers, 2006).
Figure 2- 7 Effect of dissolved air on bubble generation without added air.
(1400 ml tap water, 1200 rpm, Denver cell).
(Source: Zhou et al., 2005)
Similar observations were made for de-gassed slurry under vacuum (Xu et al., 2006).
Using a high intensity agitation (HIA) cell in the absence of added air, tiny bubbles were
generated in de-ionized water during HIA. After removing the dissolved gas in a vacuum
oven (~90 kPa) at room temperature (22 ℃) for 3 h, however, the water was clear without

26
any visible bubbles during HIA. Increasing agitation intensity produced more and smaller
cavity bubbles. Cavity bubbles as small as 5 μm were detected using a visualization
system (Xu et al., 2006). Therefore in conventional mechanical flotation processes, at
least three types of bubbles exist in the agitation zone, namely: water vapor cavity
bubbles, bubbles containing both water vapor and dissolved gas, and air bubbles due to
breakup of the air stream. All these three types of bubbles will interact in some fashion
with suspended solids, contributing to the final particle–bubble attachment. The relative
importance of these bubbles in fine particle flotation remains to be determined.
2.3.5 Effect of surfactant on nanobubble generation
Systematic experiments were carried out to examine factors affecting hydrodynamic
cavitation by forcing water through a restriction (nozzle) in a flowing stream (Zhou et al.,
1999). The bubble formation was detected by a light transmission method. In the
presence of surfactant (Dowfroth 250 or DDA, dodecylamine), the critical liquid flow
velocity for cavity bubble inception did not change (Zhou et al., 1997a). Hemmingsen
(1978) also reported little effect of surfactant (and electrolyte) on the onset of cavitation.
The presence of surfactant, however, did reduce the transmittance, suggesting an increase
in the number of bubbles formed (or possibly a change in bubble size). An increase in the
number of bubbles could also be due to stabilization of cavities by the adsorption of
surfactant, which provide mechanical strength to resist the large pressure fluctuations
(Wu, 1969). The presence of surfactants at cavity/water interface could also reduce the
intensity of bubble bursts (Gogate and Pandit, 2001).
Klassen (1963) also observed that when frother was used, the quantity of gas released
from the air-supersaturated water under dynamic conditions, over a given time interval,

27
was higher than when no frother was added, the amount of released gas increasing with
the frother concentration. As discussed earlier, adding frothers protects the cavities or gas
nuclei formed from immediate collapse. These gas nuclei could have been crushed and
eliminated if there was no frother present. Therefore, there are relatively more gas
molecules in the form of gas aggregates or gas nuclei in the liquid. Such gas nuclei will
have a size much larger than the molecules, depending on the super saturation pressures
applied, typically in the range of about 1-10 μm (Flynn, 1964), and they will have higher
rise velocities (or gas transfer rates) in the liquid, thus giving higher evolution rates.
2.3.6 Effect of solid addition in solution on nanobubble generation
Harvey et al. (1947) found that the critical velocity for cavity bubble formation could be
less than 3 m/s if hydrophobic particles were present. However, this critical velocity
could be greater than 37 m/s if free of hydrophilic particles.
Zhou et al. (1998) reported that the presence of solids in water could lead to different
effects on bubble formation, depending on the surface properties of the solids. The
presence of naturally hydrophobic coal and chemically (dodecylamine, DDA) induced
hydrophobic silica enhanced bubble formation in gas-supersaturated water for a given
range of solids content. Adding hydrophilic silica, on the other hand, reduced bubble
formation in water. In gas-supersaturated systems, the rate of bubble evolution in the
presence of solids may be governed by the nucleation process, the rate at which nuclei
grow, or a combination of both, and/or the kinetics of detachment of bubbles from solid
surfaces (Carr et al., 1995; Gerth and Hemmingsen, 1980). Consequently, increasing
either the number of gas nuclei and nucleation sites, or the quantity of gas molecules

28
dissolved in water under dynamic conditions may enhance bubble formation and lead to a
higher gas holdup.
2.3.7 Effect of flow superficial velocity on nanobubble generation
Nomura et al. (2011) also found that different flow superficial velocity greatly affected
bubble formation.
Figure 2- 8 Bubble collapse behavior at different superficial velocity
(Nomura et al, 2011)
It can be seen from Figure 2-8 that when Jin = 1.67 m/s, the bubble flowing into the
diverging section break up into several small bubbles by shearing around the throat, when
Jin increases to 2.09 m/s, the bubbles passed the throat expand toward downstream. The
bubbles shrink rapidly and break into the tiny bubbles around z=10 mm. In the case of Jin
= 2.51 m/s, the tiny bubbles are suddenly generated drastic expansion and shrinkage as
same as in the case of Jin = 2.09 m/s. However the bubble breakup positions are around
z=20 mm, where more downstream than it in Jin = 2.09 m/s. The expanded bubbles seem

29
to coalesce and expand in the whole tube. The expanded bubbles change in a cloud of
tiny bubbles. Therefore, it is confirmed that more bubble would be generated by
increasing the superficial velocity in the inlet, and also the position where bubble breakup
occurs moves downstream. Both cavity formation and dissolved gas content in water,
therefore, determine the degree of bubble generation (Dupre et al. 1998; Soubiran and
Sherwood, 2000).
2.3.8 Effect of saturation pressure on nanobubble generation
The extent of bubble formation in gas supersaturated solution was evaluated using gas
holdup measurements (Zhou et al., 1995, 1998). (A similar method was recently used by
Sahu et al. (2006) to evaluate bubble formation in soft drinks by ultrasonic excitation.) A
sharp increase in gas holdup at CO2 super saturation pressures above ~170 kPa was
reported. The critical velocity of 10–15 m/s needed for cavitation of water without added
gas was reduced to 5–7 m/s by dissolving gas into the water. Stabilization provided by
diffusion of gas molecules into the cavities was likely responsible for this observation.
Both cavity formation and dissolved gas content in water, therefore, determine the degree
of bubble generation.
It can be seen from Figure 2-9 that higher saturation pressures (i.e., higher dissolved gas
content in solution), did not guarantee production of more bubbles and higher gas
holdups. This observation indicates that the generation and stabilization of bubbles are
controlled by the diffusion of dissolved gas molecules into pre-existing gas nuclei and
any cavities created. For example, the gas holdup was lower for a 1-mm release tube at a
higher saturation pressure (310 kPa) than that for a 1.5-mm release tube at a lower
saturation pressure (241 kPa), because of a lower release velocity in the smaller tube.

30
Figure 2-9 also shows that at the same super saturation pressure (e.g., 310 kPa), gas
holdup increases with liquid release velocity. This suggests that more cavities were
formed in the stream at higher release velocities, due to more turbulent flow conditions,
with sufficient dissolved gas being present to diffuse into the cavities to prevent their
collapse. The findings were consistent with the observations of Takahashi et al. (1979)
and Jackson (1994) that the number of bubbles produced was strongly influenced by air-
saturation pressure and increased with increasing liquid release rate.
Figure 2- 9 Effect of liquid release velocity on bubble formation as evaluated by
gas holdup (note: the dotted lines connect the points with same saturation pressures).
(Source: Zhou et al., 1996 b)
2.3.9 Effects of addition of mixer and air intake location on nanobubble generation
In dissolved air flotation, it was reported (Rees et al., 1980a, b;) that introducing the air
on the suction side of the recycle pump gave saturation levels (i.e ., the ratio of the

31
released amount of air from the supersaturated water to the theoretical value) from 60 to
80%, which could be increased to 90% by fitting a turbine type mixer in the saturation
vessel. From the earlier discussion on cavitation, it suggests: 1) injecting air and high
dissolved gas content in water facilitate cavitation; 2). mixers increase the turbulence in
the stream. And disperse the air more effectively; and the combination produces more
stable cavities, which increase the gas evolution rate or saturation level for a given time.
The above argument can also be justified from the measurements made by Klassen
(1963).
2.4 Application of cavitation in flotation
In the nano-bubble flotation columns (Yoon et al., 1988) and the bubble-injected
hydrocyclone flotation cells (Jordan and Susko, 1992), both high feed injection speeds
and static mixers are used. The frequent change of direction or a convergence of
streamlines and the pressure fluctuations in the bulk liquid caused by the mixers are
anticipated to promote cavitation and nucleation. Adding air further enhances this effect
and makes the cavitation easier. While it may be argued that the high flotation rates
obtained by using static mixers could be mainly caused by shearing to break the air
stream into small bubbles, the contact cell (Amelunxen, 1993) and Ken-float cell appear
to be two examples of direct exploitation of cavitation and gas nucleation. Basically,
these cells can be considered as a combination of dissolved air flotation with
conventional column flotation, the only main difference being that the contact cell does
not have air spargers in the column. Therefore, Ken-float cells may be considered as an
example of the application of two-stage attachment model, with gas nuclei and tiny

32
bubbles generated in the dissolved air flotation chamber, and flotation-sized bubbles
provided in a flotation column.
In mineral flotation, pneumatic cells (Bahr, 1985) and Jameson cells (Jameson, 1988) are
reported to give high flotation rates. A key feature of these cells is a high slurry velocity,
ranging from 6 to 12 m/s generated through an injection nozzle. One of the reasons for
the jet is to aspirate and disperse air into the receiving chamber (a similar mechanism to
that used in venturi tubes (Jackson and Collisions, 1964)). High slurry velocities with a
high concentration of solid particles could initiate cavitation in the stream and gas
nucleation on the particle surface. When the feed emerges from the feed nozzle, gas
nuclei in the slurry and those attached to hydrophobic particles expand, due to the sudden
reduction in pressure. These gas-nucleated particles then contact with relatively large
bubbles at high gas holdups (up to 50 - 60%), which ensures high collision and
attachment probabilities resulting in high flotation rates. This may be another example of
two-stage attachment process (Dziensiewicz and Pryor, 1950) in action.
It should be noted, however, that gas nuclei alone may not induce flotation, due to their
small size and buoyancy. Hydrodynamic cavitation caused by fast flow of slurry ( > 2m/s)
in the presence of surfactants may convert a limited number of tiny gas nuclei to bubbles
large enough to levitate particles. A more convenient approach is to produce relatively
large bubbles elsewhere and bring them into contact with these gas nuclei frosted
particles. These bubbles can be generated either by mechanical means, sparging or by air
aspiration. Therefore, both tiny gas nuclei and flotation-sized bubbles are available for
improving flotation performance.

33
Chapter 3 Materials and Methodology for Coal Flotation
3.1 Characterization of coal sample
Bituminous coal sample from Pittsburgh No. 8 seam was acquired from Green County,
Pennsylvania, USA. After a three-day air dry, the coal sample was crushed to 1/4-in size,
split and stored for further use. Prior to flotation test, portion of the minus 1/4-in size coal
sample was grounded and pulverized through Holms mill for the pico-nano bubble
flotation tests. The feed coal particle size and ash distributions are determined by the wet
sieving method and ash analysis following ASTM method. The results given in Figure 3-
1 are distributed over a wide size range with 28.25% particles being larger than 250 μm
and 28.16% particles being finer than 45 μm. The feed ash content is 30.6 %.
Table 3- 1 Particle size and ash distributions for flotation feed of
Pittsburgh No. 8 seam coal.
Size, μm Individual Cumulative
Wt, % Ash, % Wt, % Ash, %
-700+600 10.21 18.97 100 30.64
-600+355 11.82 18.94 89.79 31.97
-355+250 6.22 19.62 77.97 33.94
-250+150 9.16 19.92 71.75 35.18
-150+75 19.48 19.02 62.59 37.42
-75+45 14.95 26.03 43.11 45.73
-45 28.16 56.19 28.16 56.19

34
Figure 3- 1 Size and ash distribution for Pittsburgh No. 8 seam coal sample.
3.2 Reagents for coal flotation
The reagents used in this test are:
Kerosene was used as a collector. It was supplied by Sigma-Aldrich, Inc., (St. Louis,
MO).
Methyl Isobutyl Carbinol (MIBC, C6H14O) is a widely used frother in coal flotation. It
was supplied by Aldrich Chemical Company (Miwaukee, WI).
TTT frother is the blend of trimethyl pentanediol derivatives consists of trimethyl
pentanediol monoisobutyrate, trimethyl pentanediol diisobutyrate, trimethyl
pentanediol and surfactant such as fatty acid. These key ingredients are surface active
materials. It was obtained from Zinkan Enterprises Inc (Twinsburg,OH).
0
10
20
30
40
50
60
70
80
90
100
0
10
20
30
40
50
60
70
80
90
100
-700+600 -600+355 -355+250 -250+150 -150+75 -75+45 -45
Cu
mu
lati
ve
Wei
gh
t/A
sh, %
Ind
ivid
ua
l W
eig
ht/
Ash
, %
Particle Size, μm
Individual Weight
Individual Ash
Cumulative Weight
Cumulative Ash

35
3.3 Equipment and Design of Experiment for coal flotation
3.3.1 Bubble size analysis system
For bubble size distribution determination, a smaller scale of column made of acrylic
glass tubing with 5 cm in diameter and 67.3 cm in height was built. The lower section of
the column is 15.2 cm in diameter and 18.4 cm in height. The larger diameter of the
lower section of the column was to maintain a stability of the flow. The specially
designed venturi tube and the static mixer were used to generate pico-nano bubbles and
conventional sized bubbles, respectively. Figure 3-2 shows a schematic diagram of
nanobubble generating and sampling system for measuring the bubble sizes and volume.
Figure 3- 2 Schematic diagram of the pico-nano bubble measurement system.
V2
Venturi
tube
FM
V3
V4
V5 Static
mixer
FM
FM
P
Air
R
Frother
V1
P: Pump
R: Regulator
V: Valve
FM: Flow Meter
Laser Size
Analyzer

36
The recirculation flow rate through the static mix is 12 l/min, which split at a two-way
connector into the venturi tube and a pipe, directly connected to the lower section of the
column. Different configurations of static mixer and venture tube can be made by
controlling the valves. The pico-nano bubbles were generated from injecting air into the
mixture of the recirculating solid-water and frother solution through the venturi tube. In
the tests, MIBC and TTT were used as frothers. High purity silica in minus 20 μm was
treated with dodecylamine (DDA) to form a surface induced hydrophobic silica.
As shown in Figure 3-3, Malvern Mastersizer 2000 laser particle size analyzer was used
to measure the size distributions of bubbles generated by Venturi tube and static mixer.
The analysis is based on the principle of laser diffraction to analyze particles from 0.02 to
2000 μm in size in a time span of several minutes.
Figure 3- 3 Malvern Mastersizer 2000 laser particle size analyzer and the pico-
nano bubble measurement system
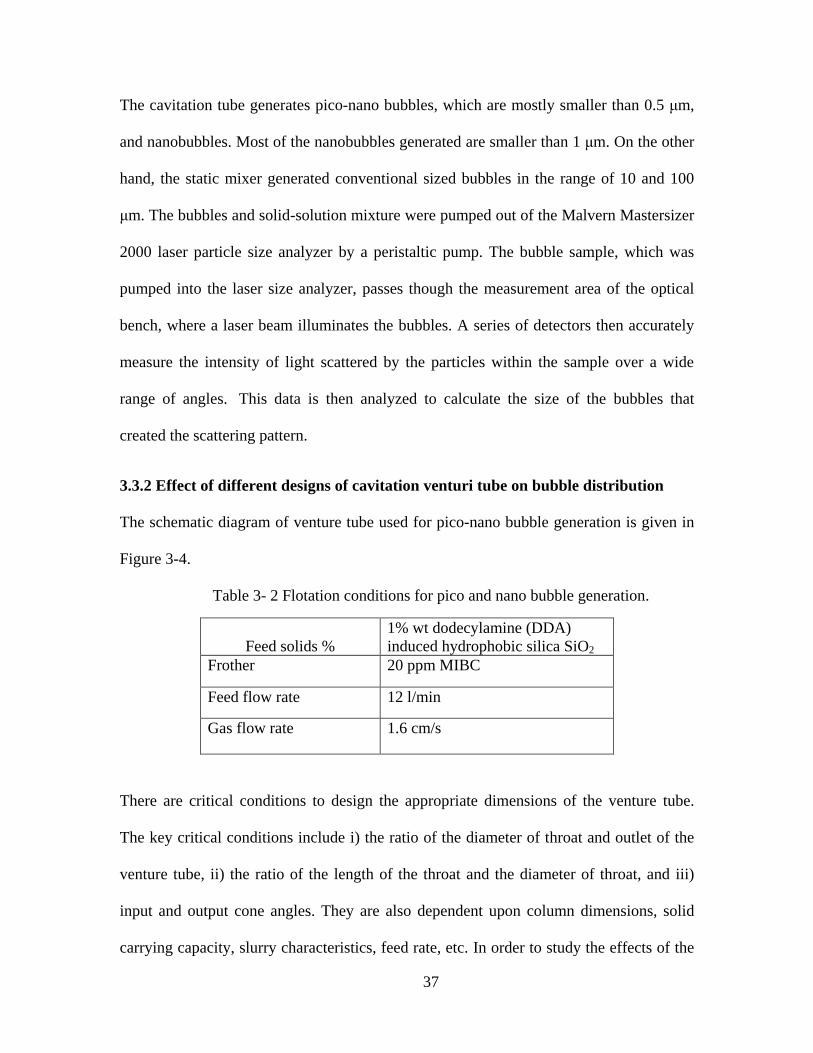
37
The cavitation tube generates pico-nano bubbles, which are mostly smaller than 0.5 μm,
and nanobubbles. Most of the nanobubbles generated are smaller than 1 μm. On the other
hand, the static mixer generated conventional sized bubbles in the range of 10 and 100
μm. The bubbles and solid-solution mixture were pumped out of the Malvern Mastersizer
2000 laser particle size analyzer by a peristaltic pump. The bubble sample, which was
pumped into the laser size analyzer, passes though the measurement area of the optical
bench, where a laser beam illuminates the bubbles. A series of detectors then accurately
measure the intensity of light scattered by the particles within the sample over a wide
range of angles. This data is then analyzed to calculate the size of the bubbles that
created the scattering pattern.
3.3.2 Effect of different designs of cavitation venturi tube on bubble distribution
The schematic diagram of venture tube used for pico-nano bubble generation is given in
Figure 3-4.
Table 3- 2 Flotation conditions for pico and nano bubble generation.
Feed solids %
1% wt dodecylamine (DDA)
induced hydrophobic silica SiO2
Frother 20 ppm MIBC
Feed flow rate 12 l/min
Gas flow rate 1.6 cm/s
There are critical conditions to design the appropriate dimensions of the venture tube.
The key critical conditions include i) the ratio of the diameter of throat and outlet of the
venture tube, ii) the ratio of the length of the throat and the diameter of throat, and iii)
input and output cone angles. They are also dependent upon column dimensions, solid
carrying capacity, slurry characteristics, feed rate, etc. In order to study the effects of the

38
dimensions of the venturi tube on bubbles distributions, a four-factor three-level Central
Composite Experimental Design was conducted. Unless otherwise specified, the tests
were performed under the conditions given in Table 3-2.
Figure 3- 4 Skematic diagram of cavitation venturi tube.
Table 3- 3 Levels of variables for a four-factor three-level design of venturi tube
design tests.
Variable Code
Level
Low Middle High
-1 0 1
Din/Dt A 2 4 6
Lt/Dt B 1 2 3
Inlet Angle ( Degree) C 15 21 27
Outlet Angle ( Degree) D 8 12 16
Note: Din is a constant with the value of 5 cm in this test.
Response surface methodology was used to analyze the four-factor three-level Central
Composite experiment data. Response surface and contours were generated for the pico-
nano bubble volume and mean pico-nano bubble size as a function of four key process
parameters include the ratio of the diameter of throat and outlet of the venture tube
(Din/Dt), the ratio of the length of the throat and the diameter of throat (Lt/Dt), and inlet
and outlet cone angles. The specific levels of individual variables are given in Table 3-3.
The details of designed experiments are shown in Table 3-4. The test data was analyzed

39
with the JUMP program (SAS Institute Inc., Cary, NC). The optimal designed venturi
tube will be at the maximum pico-nano bubble volume and minimum mean pico-nano
bubble size.
Table 3- 4 Four-factor three-level experimental design of venturi tube design tests.
Run A B C D
1 -1 -1 1 1
2 1 -1 1 1
3 -1 1 -1 1
4 1 -1 -1 1
5 1 1 -1 -1
6 1 -1 1 -1
7 -1 0 0 0
8 0 0 0 0
9 -1 1 -1 -1
10 0 0 0 0
11 0 1 0 0
12 1 0 0 0
13 -1 -1 -1 1
14 -1 1 1 1
15 0 -1 0 0
16 1 -1 -1 -1
17 0 0 1 0
18 -1 -1 1 -1
19 0 0 0 -1
20 1 1 -1 1
21 1 1 1 -1
22 0 0 0 1
23 1 1 1 1
24 -1 1 1 -1
25 -1 -1 -1 -1
26 0 0 -1 0
40
3.3.3 Effects of different types frother and frother dosage on pico-nano bubble
generation.
Two different types of frother, MIBC and TTT, were tested by using the optimal
designed venturi tube. The frother dosage will be changed from 10 ppm to 100 ppm in
order to study the effect of frother dosage on the pico-nano bubble distributions.
3.3.4 Design and set up a pico-nano bubble enhanced flotation column.
Figure 3-5 shows the schematic diagram of a 5 cm ID and 250 cm height open flotation
column which is equipped with static-mixer and cavitation venturi tube for nano and
picco bubble generating. The slurry feed is fed into a feed tank, and an appropriate
amount of collector and frother are then added with a circulating loop and pump for
preconditioning. The feed slurry is then fed into the upper part of the flotation column.
The fresh water, air, and recirculating tailings are passed through the static-mixer and
caviation venturi tube connected in a series before being injected into the lower part of
the flotation column. The wash water spraying device is also installed over the froth, to
flush down the entrained ultrafine mineral particles, prior to exit from flotation column.
A specially designed tailings separator and discharge unit is added at the bottom of the
column. This separator is used to improve the mixing and contacting of tiny bubbles and
solids by recirculating about one third of solids from outer funnel back into the flotation
column. The tailings from inner funnel of the separator are discharged from the column
as reject. The cavitation venturi tube is specifically designed for generating the pico and
nano bubbles as shown in Figure 3-4 (Young, 1989; ISO 5167-4:2003; Tao, 2004; Peng
and Xiong, 2013). Pico-nano bubbles have low mobility characteristic than larger bubbles
such as micro bubble and millimeter bubbles. The static mixer was used to produce the
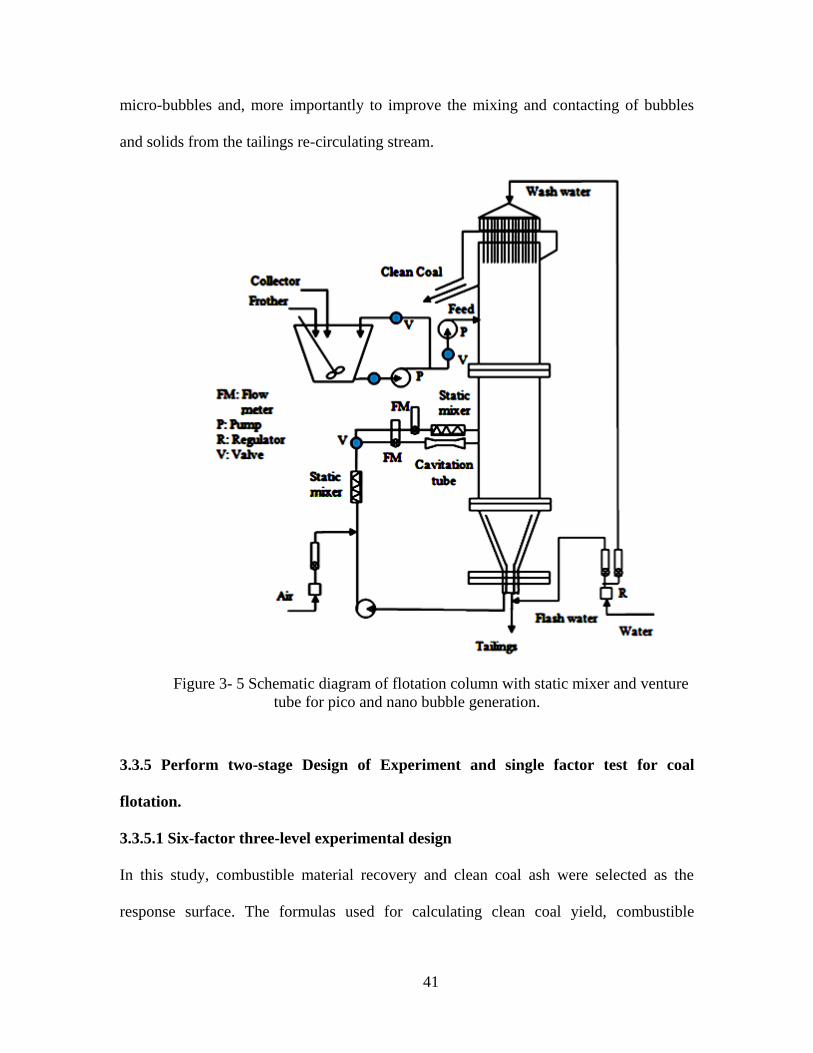
41
micro-bubbles and, more importantly to improve the mixing and contacting of bubbles
and solids from the tailings re-circulating stream.
Figure 3- 5 Schematic diagram of flotation column with static mixer and venture
tube for pico and nano bubble generation.
3.3.5 Perform two-stage Design of Experiment and single factor test for coal
flotation.
3.3.5.1 Six-factor three-level experimental design
In this study, combustible material recovery and clean coal ash were selected as the
response surface. The formulas used for calculating clean coal yield, combustible

42
material recovery, ash rejection, separation efficiency and pico-nano bubble and nano
bubble percent are defined as follows:
(3-1)
(3-2)
(3-3)
(3-4)
(3-5)
Where:
Ac % = Clean coal product ash, %
Af % = Feed ash, %
At % = Tailings ash, %
Arej % = Ash rejection, %
Esp % = Separation efficiency, %
Rc % = Combustible material recovery, %
Rp% = Pico-nano and nano bubbles percent, %
Vp% = Volume of Pico-nano and nano bubbles, %
Vo% = Volume of all the bubbles, %
Yc % = Clean coal yield, %
Yf % = Feed yield, %
Yt % = Tailings yield, %
The levels of variables used in this design are given in Table 3-5. The six process
parameters include collector dosage, frother concentration, gas flow rate, feed solids

43
concentration, feed rate, and superficial wash water rate. Each numeric factor is varied over
3 levels: plus and minus 1 (factorial points) and the center point. The levels of process
variables were coded as “–1”, “0” and “+1”, respectively, where “–” represents the low or
middle-low level, “0” represents the middle level and “+” represents the middle-high or
high level of the factors. The details of designed experiments are shown in Table 3-6.
Table 3- 5 Levels of variables for a six-factor three-level design for column
flotation using pico-nano bubbles.
Variable Code
Level
Low Middle High
-1 0 1
Gas flow rate( cm/s) A 0.5 1.5 2.5
Collector dosage (lb/ton) B 0.3 0.9 1.5
Frother dosage (ppm) C 5 20 40
Solids concentration (%) D 5 10 20
Feed rate (cm/s) E 0.2 0.6 1
Superficial wash water rate (cm/s) F 0.1 0.3 0.5
In running JM program, “Stepwise” analysis method was selected. The stepwise
regression procedure is applied by setting the probabilities (p-value) threshold for
statistical analysis, which uses p-values (significance levels) to enter and remove effects
from the model by setting the value of Probability to enter, which is the maximum p-
value that an effect must have to be entered into the model during a forward step, and
Probability to leave, which is the minimum p-value that an effect must have to be
removed from the model during a backward step. The value of the Probability to enter is
0.1 and the value of the Probability to leave is 0.05 in our experiment. The models will be
developed through “forward” and “backward” procedures to select significant parameters.

44
Table 3- 6 Six-factor three-level experimental design for column flotation using
pico-nano bubbles.
Run A B C D E F
1 0 1 -1 0 1 -1
2 -1 0 0 0 1 1
3 1 0 -1 1 1 0
4 1 1 0 -1 0 -1
5 0 -1 0 1 0 1
6 1 0 -1 1 0 -1
7 1 0 -1 1 -1 1
8 1 1 0 -1 1 0
9 -1 1 1 1 1 1
10 -1 -1 -1 -1 0 0
11 0 1 -1 0 0 1
12 0 0 1 -1 1 -1
13 -1 -1 -1 -1 -1 -1
14 -1 1 1 1 0 0
15 1 1 0 -1 -1 1
16 -1 1 1 1 -1 -1
17 0 0 1 -1 0 1
18 0 1 -1 0 -1 0
19 0 -1 0 1 -1 0
20 -1 0 0 0 0 0
21 1 -1 1 0 0 -1
22 -1 -1 -1 -1 1 1
23 1 -1 1 0 1 0
24 0 0 1 -1 -1 0
25 0 -1 0 1 1 -1
26 1 -1 1 0 -1 1
27 -1 0 0 0 -1 -1
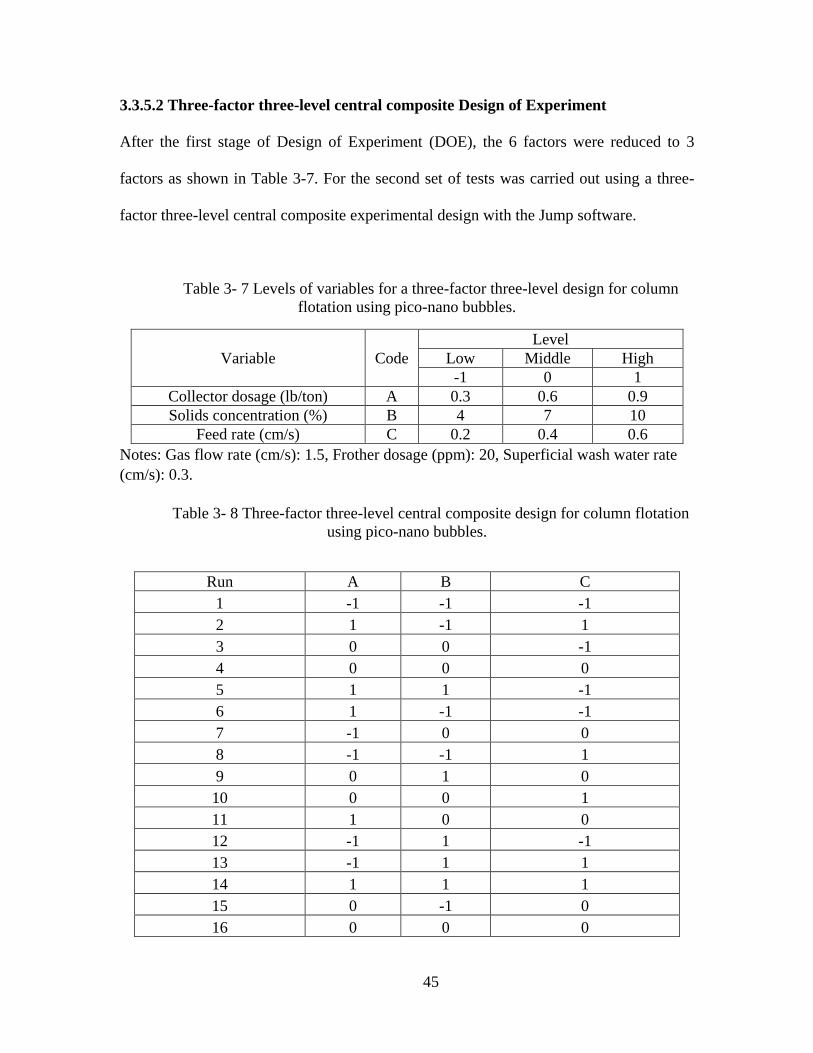
45
3.3.5.2 Three-factor three-level central composite Design of Experiment
After the first stage of Design of Experiment (DOE), the 6 factors were reduced to 3
factors as shown in Table 3-7. For the second set of tests was carried out using a three-
factor three-level central composite experimental design with the Jump software.
Table 3- 7 Levels of variables for a three-factor three-level design for column
flotation using pico-nano bubbles.
Variable Code
Level
Low Middle High
-1 0 1
Collector dosage (lb/ton) A 0.3 0.6 0.9
Solids concentration (%) B 4 7 10
Feed rate (cm/s) C 0.2 0.4 0.6
Notes: Gas flow rate (cm/s): 1.5, Frother dosage (ppm): 20, Superficial wash water rate
(cm/s): 0.3.
Table 3- 8 Three-factor three-level central composite design for column flotation
using pico-nano bubbles.
Run A B C
1 -1 -1 -1
2 1 -1 1
3 0 0 -1
4 0 0 0
5 1 1 -1
6 1 -1 -1
7 -1 0 0
8 -1 -1 1
9 0 1 0
10 0 0 1
11 1 0 0
12 -1 1 -1
13 -1 1 1
14 1 1 1
15 0 -1 0
16 0 0 0

46
The three process parameters include collector dosage, feed solids concentration, and
feed rate. Response surface methodology was used to analyze the three-factor three-level
central composite experiment data. Response surface and contour curves were generated
for the clean coal ash content and combustible material recovery as a function of the
operating three process parameters. The three process parameters include collector
dosage, feed solids concentration and Feed rate. Each numeric factor is varied over 3
levels: plus and minus 1 (factorial points) and the center point. The levels of process
variables were coded as “–1”, “0” and “+1”, respectively, where “–” represents the low or
middle-low level, “0” represents the middle level and “+” represents the middle-high or
high level of the factors. The details of designed experiments are shown in Table 3-8.
3.3.5.3 Single factor experimental test
In order to further determine the optimization of process parameters, single factor
experimental test was conducted by varying the collector dosage and feed rate.
Table 3- 9 Process parameters and operational conditions.
Process parameters Operation conditions
Gas flow rate( cm/s) 1.5
Collector dosage (kerosene) (lb/ton) 0.1 to 0.9
Frother dosage (ppm) 20
Solids concentration (%) 4
Feed rate (cm/s) 0.2 to 0.5
Superficial wash water rate (cm/s) 0.3
The operation conditions of feed coal slurry, solids concentration and reagent dosages
were kept constant, as given in Table 3-9. The optimal operation conditions will be

47
achieved by maximizing the recovery of combustible materials with high quality of clean
coal, at the same time, minimizing the clean coal ash content.
3.3.6 Study the effect of particle size on separation efficiency and combustible
material recovery.
The clean coal and tailing obtained from column flotation with/without pico-nano bubble
were used in this study. The particle size distribution of the tested samples was
determined by wet sieve: the separation of fines from the coarse portion of the sample
while suspended in water solution introduced to a testing sieve. The water medium was
used to negate static charges, break down agglomerates and lubricate near-size particles.
After the fines have been washed through the sieve, the residue was oven-dried and
reweighed. The combustible material recovery and separation efficiency will be
calculated based on the sieving results.
Table 3- 10 Size range of wet sieving.
US sieve No. Size (μm)
28 700
30 600
45 355
60 250
100 150
200 75
325 45
3.3.7 Compare the flotation results of pico-nano bubble column flotation with that
of release analysis.
Release analysis test was conducted in order to determine the ultimate recovery-grade
relationship that can be achieved by any flotation process for the treatment of a given
coal. Among all the existing procedures of release analysis, the reverse release analysis is

48
shown to combine the best features of simplified release analysis and timed release
analysis in terms of locating the elbow of the yield vs. ash curve and extending the curve
into the low ash, low yield region (Randolph, 1997). So the reverse release analysis
procedure was used in this study. The detailed procedure is illustrated schematically in
Figure 3-6.
Stage 1 Stage 2
1700 rpm 1700 rpm 1500 rpm 1300 rpm 1100 rpm
100% air 100% air 75% air 50% air 25% air
Figure 3- 6 Schematic diagram of the reverse release analysis procedure.
Reverse release analysis test procedure was carried out using a Denver D-12 model
flotation machine in 2 liter cell. Two hundred grams coal sample was ground to a given
particle size distribution for sufficient liberation, then mixed with distilled water to make
2 liter pulp with 10% solid concentration. The slurry was then conditioned for five
minutes at 1700 rpm with 1 lb/ton MIBC. After that, the first phase of the simplified
release analysis procedure was followed by adding in 2 lb/ton kerosene to separate the
Combined tailings
Tailings 1 Tailings 2 Tailings 3 Tailings 4
Feed
Concentrate

49
floatable material from the non-floatable material. The tailings from the first phase were
saved for analysis while the concentrate was reconditioned in order to begin the second
phase of the test. A concentrate was then collected until the froth was barren at an
impeller speed of 1700 rpm and an aeration rate of 100%. The tails were saved for
analysis and the concentrate was refloated at 1500 rpm and 75% air. This procedure was
repeated two additional times, each time at a lower aeration rate and impeller speed, to
produce five tailings fractions (including tails from the first phase) and one concentrate
fraction. These fractions were then filtered, dried, weighed, and assayed to produce a
release curve.

50
Chapter 4 Materials and Methodology for
Phosphate Reverse Flotation
4.1 Materials
The dolomitic phosphate peddle (DDP) sample with high dolomite content was collected
from Lakeland, Pork County, Florida. For phosphate production in Florida, the phosphate
matrix is mined by high capacity dragline. The matrix mined is made into slurry using
high pressure water jet and then pumped to the phosphate beneficiation plant for washing
operation using spiral classifier. After washing, the matrix is split by screens and
cyclones into three streams, usually +1 mm, -1+0.1 mm and –0.1 mm size fractions. The
minus 0.1 mm (- U.S. Sieve No.140) fines as phosphatic slimes, which is discarded into
tailings ponds due to its high impurities and low P2O5 content. The size fraction of –1+0.1
mm is fed to conventional two stage “Crago” flotation process to recover phosphate
concentrate by rejecting silica (Zhang, 1995; El-Shall, 2001). The plus 1 mm coarse size
fraction is known as phosphate pebble. This fraction is usually mixed with flotation
concentrate to form a composite product for downstream production, if its MgO content
is lower than a certain limit, such as 1.0~1.5%. If the MgO content is higher than certain
amount, it is considered as dolomitic phosphate pebble (DPP) and will be discarded as
waste. In Florida, there is a three-one-third principle, namely one third of the phosphate
mineral is bound with slimes, one third is recovered with the “Crago” flotation process
and another one third is contained in phosphate pebble. The Crago “ ouble Float”
process is inefficient, as it floats about 30-40% of the sands in the flotation feed twice

51
and requires a deoiling step (El-Shall et al., 1999; Anazia and Hanna, 1988; Lawendy and
Mcclellan, 1993).
4.1.1 Size distribution and chemical analysis
Chemical analysis of the DPP sample is given in Table 4-1. It can be seen that the DPP
sample contains 25.92% P2O5, 3.47% MgO and 14.46% SiO2. The beneficiation process
should be capable of rejecting both dolomite and silica for obtaining an acceptable
phosphate concentrate containing over 30% P2O5 and less than 1% MgO at the P2O5
recovery as high as possible.
Table 4- 1 Chemical analysis of the as-received dolomotic phosphate sample.
Component P2O5 MgO Fe2O3 CaO Insoluble
% 25.92 3.47 0.96 38.58 14.46
Size distribution analysis of the as-received DPP sample is given in Table 4-2. As shown
in the analysis results that plus 6.3 mm coarse fraction contains 3.97% MgO content, and
minus 0.1 mm fine fraction contains greater than 8% MgO content. These size fractions
have much higher MgO compared with other size fractions. Particularly the P2O5 grade in
minus 0.1 mm size fraction is much lower than in plus 0.1 mm size fraction. This is
mainly because the carbonate minerals such as dolomite and limestone are more fragile
than apatite and easily to be fractured (Clerici, 1984). These data indicates that the minus
0.1 mm size fraction can be deslimed and discarded with very low P2O5 loss. Although
the coarse size fraction also contains high MgO content, it is not economical to eliminate
this fraction because it contains high P2O5 content (Rao, 1979). Table 4-3 shows the size
distribution and chemical analysis after the rejection of minus 0.1 mm size fraction. This
deslimed DDP sample is then used to prepare the flotation feed for this study.

52
Table 4- 2 Size distribution and chemical analysis of as-received dolomitic phosphate pebble sample.
Size
(mm)
Wt%
Grade, % Recovery, %
P2O5 MgO Fe2O3 CaO Insol. P2O5 MgO Fe2O3 CaO Insol.
+6.3 40.84 22.3 3.97 0.91 40.1 11.03 37.22 44.85 41.21 40.81 36.85
-6.3+4.0 29.54 26.82 3.90 0.87 42.01 10.89 32.38 31.87 28.50 30.92 26.31
-4.0+2.38 12.75 27.54 2.63 0.85 40.62 9.65 14.35 9.27 12.02 12.91 10.06
-2.38+1.0 8.62 28.1 1.46 0.76 40.34 14.32 9.90 3.48 7.26 8.67 10.10
-1.0+0.5 2.38 26.2 1.63 0.79 39.24 17.69 2.55 1.07 2.08 2.33 3.44
-0.5+0.1 2.14 18.9 1.22 0.61 24.61 48.03 1.65 0.72 1.45 1.31 8.41
-0.1 3.73 12.8 8.47 1.81 32.85 15.82 1.95 8.74 7.49 3.05 4.83
Total 100 24.47 3.62 0.90 40.13 12.23 100.00 100.00 100.00 100.00 100.00

53
Table 4- 3 Size distribution and chemical analysis of as-received dolomitic phosphate pebble sample.
Size
(mm)
Wt%
Grade, % Recovery, %
P2O5 MgO Fe2O3 CaO Insol. P2O5 MgO Fe2O3 CaO Insol.
+6.3 42.42 22.3 3.97 0.91 40.1 11.03 37.96 49.14 44.54 42.10 38.69
-6.3+4.0 30.68 26.82 3.90 0.87 42.01 10.89 33.02 34.91 30.80 31.90 27.63
-4.0+2.38 13.24 27.54 2.63 0.85 40.62 9.65 14.63 10.16 12.99 13.31 10.57
-2.38+1.0 8.95 28.1 1.46 0.76 40.34 14.32 10.09 3.81 7.85 8.93 10.60
-1.0+0.5 2.47 26.2 1.63 0.79 39.24 17.69 2.60 1.17 2.25 2.40 3.61
-0.5+0.1 2.24 18.9 1.22 0.61 24.61 48.03 1.70 0.80 1.58 1.36 8.90
Total 100 24.92 3.43 0.87 40.41 12.09 100.00 100.00 100.00 100.00 100.00

54
4.1.2 Mineral liberation
A small representative dolomitic phosphate pebble sample was taken and milled to minus
0.71 mm (- 25 mesh). Microscopic observation was made on different size fractions of
the milled sample to determine the percentage of liberated phosphate mineral in each size
range. The results of the microscopic observation are presented in Table 4-4. It can be
seen that the percentage of liberated phosphate particles increased as the particle size
became finer, but there was no significant change after minis 150 m (- 100 mech). In
order to achieve high quality phosphate concentrate, the sample should be ground to
minus 700 m (- 25 mesh) for liberating phosphate from gangue minerals.
Table 4- 4 Percentage of liberated dolomitic phosphate sample
with different size fractions.
US sieve No. Size range
( m) Liberated phosphate, %
-28+30 -700+600 79
-30+40 -600+425 82
-40+45 -425+355 84
-45+100 -355+150 86
-100+140 -150+106 95
-140+200 -106+75 95
-200 -75 95

55
4.1.3 Grinding
A laboratory sparser rod mill was employed to grind the sample to 700 m (- 25 mesh)
for satisfactory liberation of phosphate from gangue minerals, particularly liberation of
dolomite. The dimension of the rod mill is 200 mm ID and 250 mm length. The size,
quatity, weight and percentage of the stainless steel rods used as grinding media are
presented in Table 4-5.
Table 4- 5 Stainless steel grinding media for rod mill.
Rod diameter
(mm)
Quantity
(No. of rods)
Weight
(g)
Weight
(%)
16 14 6732 50.51
12 12 4283 32.14
10 10 2313 17.35
Total 36 13328 100.00
A series of grinding tests were conducted to determine the grinding time to achieve
sufficient liberation using 1000 g and 1500 g sample size for each batch, respectively.
The particle size distribution at different grinding time is presented in Table 4-6 and 4-7,
and also plotted in Figure 4-1.
It can be seen from Figure 4-1 that the steeper slope in the relationship between the
percent passing for a given particle size, the shorter the grinding time to prepare the 100%
passing 700 m size. 50 minutes is required to produce 100% passing 700 m size

56
fraction for 1000 g sample, while 90 minutes is needed to generate 100% passing 700 m
size fraction for 1500 g sample.
Table 4- 6 Size distribution at different grinding time for
1000 g dolomitic phosphate pebble sample.
Grinding time
(min)
Wt. % Passing
-700 m -150 m -75 m
10 45.83 21.01 14.53
20 64.74 33.37 20.26
30 88.92 41.69 25.93
40 95.07 56.81 36.47
50 100.00 72.96 43.23
Table 4- 7 Size distribution at different grinding time for
1500 g dolomitic phosphate pebble sample.
Grinding time
(min)
Wt. % Passing
-700 m -150 m -75 m
50 68.35 37.01 18.72
60 75.62 58.13 36.61
70 83.61 68.92 39..53
80 96.87 75.68 43.36
90 100.00 79.04 45.64
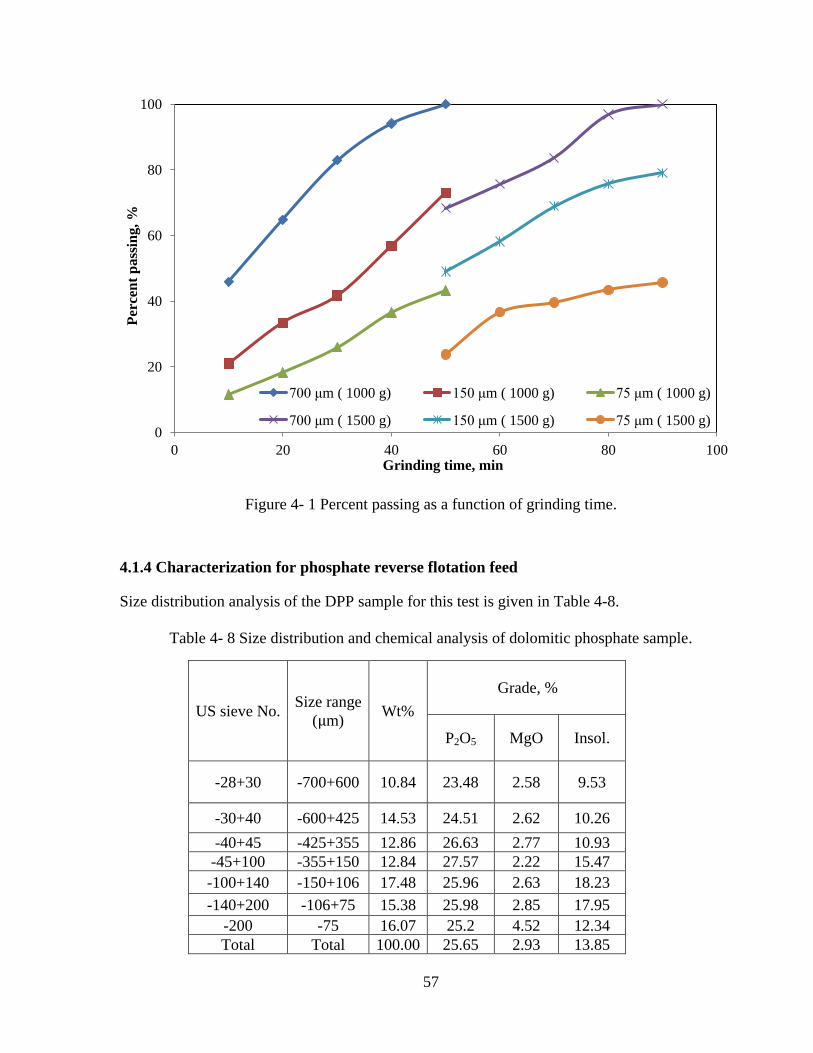
57
Figure 4- 1 Percent passing as a function of grinding time.
4.1.4 Characterization for phosphate reverse flotation feed
Size distribution analysis of the DPP sample for this test is given in Table 4-8.
Table 4- 8 Size distribution and chemical analysis of dolomitic phosphate sample.
US sieve No. Size range
( m) Wt%
Grade, %
P2O5 MgO Insol.
-28+30 -700+600 10.84 23.48 2.58 9.53
-30+40 -600+425 14.53 24.51 2.62 10.26
-40+45 -425+355 12.86 26.63 2.77 10.93
-45+100 -355+150 12.84 27.57 2.22 15.47
-100+140 -150+106 17.48 25.96 2.63 18.23
-140+200 -106+75 15.38 25.98 2.85 17.95
-200 -75 16.07 25.2 4.52 12.34
Total Total 100.00 25.65 2.93 13.85
0
20
40
60
80
100
0 20 40 60 80 100
Per
cen
t p
ass
ing
, %
Grinding time, min
700 μm ( 1000 g) 150 μm ( 1000 g) 75 μm ( 1000 g)
700 μm ( 1500 g) 150 μm ( 1500 g) 75 μm ( 1500 g)

58
As shown in the analysis results that fine fraction -150 μm (US sieve No.100) of the
flotation feed contains high MgO content. For example, the MgO grade in minus 75 μm
particle size is up to 4.52%, much higher than that of feed which is only 2.93%. The
weight percentage of the sample is quite evenly distributed in all other size fractions.
About 38.23% particles are larger than 355 μm, and 31. 5% particles finer than 106 μm,
these will be the size range being tested in this experiment.
4.2 Reagents for phosphate reverse flotation reagents
The reagents used in phosphate reverse flotation are given below:
CF 413B: Sulfonated fatty acid collectors were provided by ARR-MAZ Products
(Division of Process Chemicals, Winter Haven, Florida). It was used for dolomite
flotation in acidic pH, water solubale, it can be diluted with water.
CF 413: Sulfonated fatty acid collectors were provided by ARR-MAZ Products
(Division of Process Chemicals, Winter Haven, Florida). It was used for dolomite
flotation in acidic pH, water solubale, it can be diluted with water.
Methyl Isobutyl Carbinol (MIBC, C6H14O) is a widely used frother in coal flotation. It
was supplied by Aldrich Chemical Company (Miwaukee, WI).
CA 1250: Oil based amine was used for silica flotation, water soluble, it can be diluted
with water. It was provided by ARR-MAZ Products (Division of Process Chemicals,
Winter Haven, Florida).
Phosphoric acid: H3PO4 was with chemical analysis grade having the purity of 85%
P2O5 from Fisher Scientific (Pittsburgh, PA). It was used as both pH modifier and
depressant of phosphate minerals in dolomitic phosphate reverse flotation. A five
percent solution was prepared for use in the experiment.

59
Kerosene: Kerosene was used as a collector added in amine flotation for separating
silica from phosphate. It was supplied by Sigma-Aldrich, Inc., (St. Louis, MO).
4.3 Equipment and Design of Experiment for Phosphate Reverse Flotation
4.3.1 Spectrophotometric analysis
Determination of phosphorus and P2O5 content in Florida phosphate reverse flotation
sample was performed using the Spectronic 200 from Thermo Scientific, as shown in
Figure 4-2.
Figure 4- 2 The Spectronic 200 used for phosphorus and P2O5 content analysis.
4.3.2 Atomic absorption analysis
The magnesium oxide (MgO) and calcium oxide (CaO) contents were analyzed using
AAnalyst 200 from PerkinElmer Instruments.
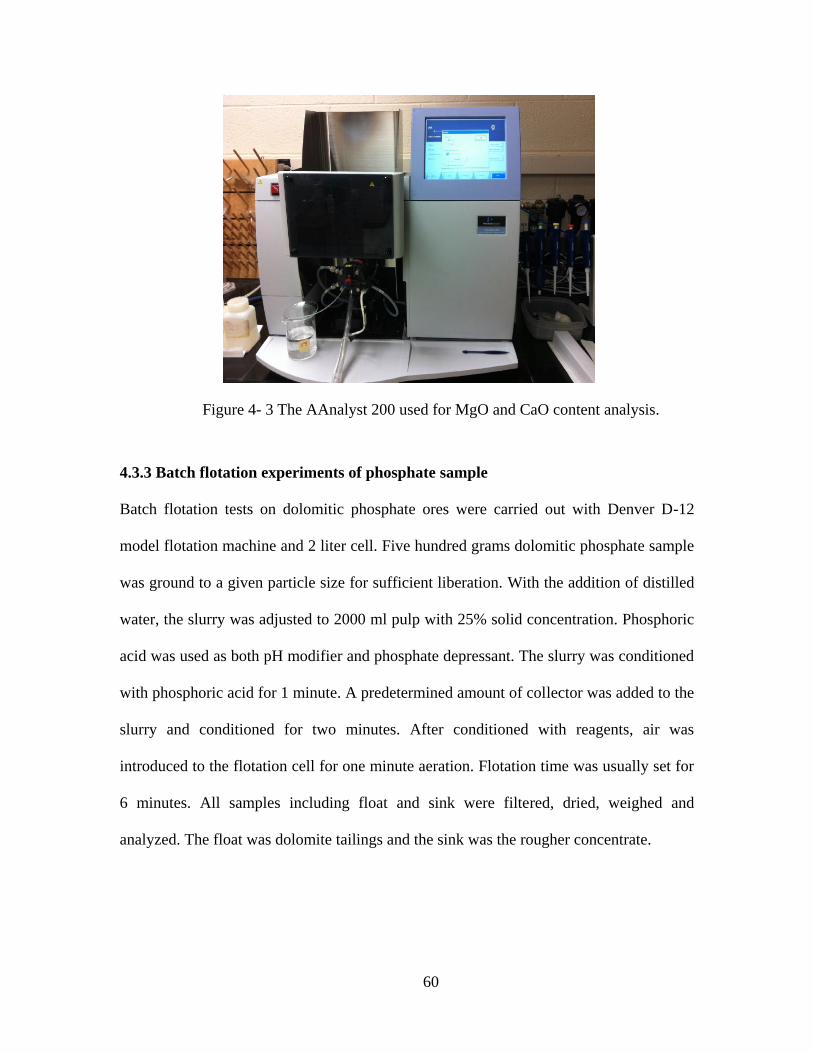
60
Figure 4- 3 The AAnalyst 200 used for MgO and CaO content analysis.
4.3.3 Batch flotation experiments of phosphate sample
Batch flotation tests on dolomitic phosphate ores were carried out with Denver D-12
model flotation machine and 2 liter cell. Five hundred grams dolomitic phosphate sample
was ground to a given particle size for sufficient liberation. With the addition of distilled
water, the slurry was adjusted to 2000 ml pulp with 25% solid concentration. Phosphoric
acid was used as both pH modifier and phosphate depressant. The slurry was conditioned
with phosphoric acid for 1 minute. A predetermined amount of collector was added to the
slurry and conditioned for two minutes. After conditioned with reagents, air was
introduced to the flotation cell for one minute aeration. Flotation time was usually set for
6 minutes. All samples including float and sink were filtered, dried, weighed and
analyzed. The float was dolomite tailings and the sink was the rougher concentrate.

61
4.3.4 Pico-nano bubble column flotation
Several equations were used to evaluate the effectiveness of the separation process of
phosphate reverse flotation. And they have been defined as follows:
(4-1)
(4-2)
(4-3)
(4-4)
(4-5)
(4-6)
Where:
Yf = Yield of float, %
Wf = Weight of float or overflow, g
Ws = Weight of sink or underflow, g
Ys = Yield of sink, %
Rdf = Dolomite recovery in float, %
Yf = Yield of float, %
βd = MgO grade in float, %
αd = MgO grade in feed, %
Rds = Dolomite recovery in the sink, %
Rps = Phosphate recovery in the sink, %
βp = P2O5 grade in the sink, %

62
αp = P2O5 grade in the feed, %
Rpf = Phosphate recovery in the float, %
4.3.5 Develop a method for domomitic phosphate flotation
Different flotation methods have been developed since 1970s, such as International
Mineral and Chemical Company (IMC) cationic process, Tennessee Valley Authority
(TVA) diphosphonic acid process, University of Florida (UF) two stage conditioning
process, University of Alabama (UA) no conditioning process, US Bureau of Mines
(USBM) scrubbing and flotation process and so on. In 1995, Florida Institute of
Phosphate Research conducted an in-house comprehensive evaluation on those processes
with the results summarized in Table 4-9 (Gu et al., 2002).
Table 4- 9 Summary of Processes Developed for Florida Dolomitic Phosphate.
Process Feed Size
(μm)
Concentrate, %
P2O5 MgO P2O5 Recovery
IMC -425+106 31.66 0.84 58.4
USBM -600+106 31.73 1.22 27.4
UF -425+106 28.97 0.97 27.7
TVA -300+45 30.73 1.51 66.0
UA -425+106 26.20 1.19 87.1
The most promising process is IMC cationic flotation process among those five
beneficiation processes, a combination of silica flotation and phosphate flotation. Only
the product of IMC meets the criteria of phosphate in fertilizer industry, containing 31.66%
P2O5 and 0.84% MgO at 58.4% P2O5 recovery in the phosphate concentrate product.
Other processes, generating either low P2O5 grade or high MgO content products, are all
failed to produce an acceptable phosphate concentrate.

63
Figure 4- 4 Procedures for Processing Florida Dolomitic Phosphate Peddle
Sample.
However, there are three disadvantages with the IMC cationic process. 1) Two types of
amine collectors were used for both silica flotation and phosphate flotation, which will
- 140 mesh
(106 μm)
Float
Float
S
ink - 38 μm
+ 38 μm
Silica Tailings
Phosphate concentrate Dolomite Tailings
Sink
Dolomite Phosphate Pebble
Washing and Desliming
Crushing to 1.4 mm
Grinding to -700 μm
Conditioning
Dolomite Flotation
Sizing at 400 mesh (38 μm)
Acids
Fatty acid
Silica Flotation
Amine
Kerosene
To Waste To acid plant and/or market To Waste
To Waste

64
increase the cost of the process, because the price of cationic collector is much higher
than fatty acid. 2) Most of the materials, about 90%, were floated as concentrate in the
second cationic flotation stage, and only 10% were kept in sink as tailings which might
require higher reagent consumption. 3) Significant loss of phosphate values due to
desliming after grinding, which is also one of the major problems with the previously
developed phosphate flotation processes (Wiegel, 1999; Zhang and Bogan, 1997; Raden,
1979).
A flotation process was developed by China Lianyungang Design and Research Institute
known as CLDRI fine particle flotation process had been developed and tested on Florida
dolomitic phosphate ores at the size range of minus 150 μm (Gu et al., 1999a), which
makes up the shortcomings of IMC by using two-stage reverse flotation, dolomite
flotation and silica flotation.
The CLDRI process has been made relatively simple by elimilating the desliming step
after grinding, but prior to dolomite flotation. This improves flotation recovery and
lowers production costs relative to other flotation processes. In this technique, high
quality phosphate concentrates are achieved by rejecting both carbonates and silicates
(Gu et al., 1999b).
High phosphate recovery is maintained since desliming losses are minimized and
flotation performance is high. However, the CLDRI flotation process is efficient only for
particles finer than 150 μm, in order to process coarse particles (-700+355 μm), a
specially designed flotation column with a pico-nano bubble generator will be used in the
CLDRI flotation process. As shown in Figure 4-4, the modified CLDRI phosphate

65
reverse flotation process is expected to float fine (-150 μm) and coarse particles
(-700+355 μm), which includes reverse flotation of dolomite and silica.
4.3.6 Froth Stability Measurement
A laboratory column with 5 cm ID and 165 cm height equipped with static mixer and
venturi tube was used as the experimental apparatus for the froth stability measurement.
CF 413, CF 413B alone and its mixture with selected frother were studied as the frothing
agents with the reagent concentration varied from 0.4 to 2.0 lb/ton. The experiments were
carried out in the two phase system. i.e. air and water involved only. The pico-nano
bubbles were produced using venturi tube. The pico-nano bubble generating circuit will
keeping running for 15 minutes, and then air and the pump were completely shut off. The
time period from shutting-off air until all bubbles disappeared was recorded as the
lifetime of the froth which was used to express the froth stability.
4.3.7 Study on the effects of different collectors in phosphate reverse flotation
Investigate the effects of two different collectors (CF 413 and CF 413B), collector dosage
and pH on dolomitic carbonates flotation by using pico-nano bubble column flotation.
Keep collector dosage or pH value constant while the other one changed at different
levels for two collectors. The optimal collector and operation conditions will be achieved
by maximizing the recovery and grade of P2O5, at the same time, minimizing the MgO
grade in the sink.
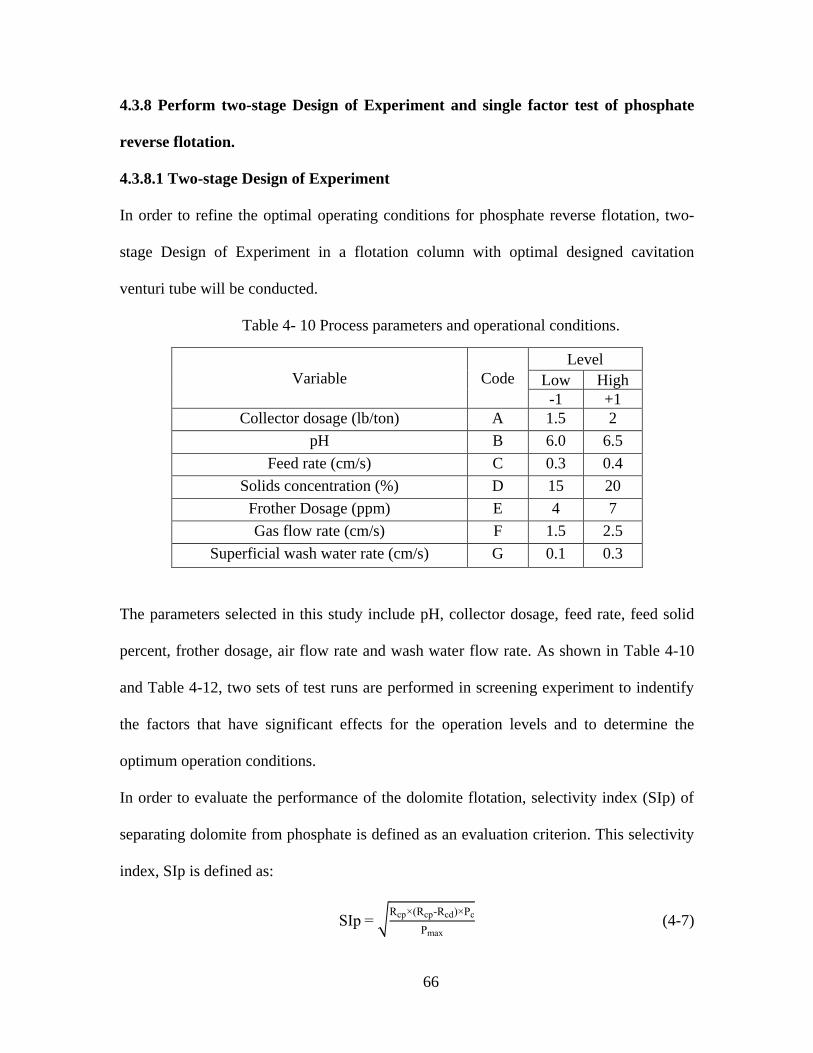
66
4.3.8 Perform two-stage Design of Experiment and single factor test of phosphate
reverse flotation.
4.3.8.1 Two-stage Design of Experiment
In order to refine the optimal operating conditions for phosphate reverse flotation, two-
stage Design of Experiment in a flotation column with optimal designed cavitation
venturi tube will be conducted.
Table 4- 10 Process parameters and operational conditions.
Variable Code
Level
Low High
-1 +1
Collector dosage (lb/ton) A 1.5 2
pH B 6.0 6.5
Feed rate (cm/s) C 0.3 0.4
Solids concentration (%) D 15 20
Frother Dosage (ppm) E 4 7
Gas flow rate (cm/s) F 1.5 2.5
Superficial wash water rate (cm/s) G 0.1 0.3
The parameters selected in this study include pH, collector dosage, feed rate, feed solid
percent, frother dosage, air flow rate and wash water flow rate. As shown in Table 4-10
and Table 4-12, two sets of test runs are performed in screening experiment to indentify
the factors that have significant effects for the operation levels and to determine the
optimum operation conditions.
In order to evaluate the performance of the dolomite flotation, selectivity index (SIp) of
separating dolomite from phosphate is defined as an evaluation criterion. This selectivity
index, SIp is defined as:
SIp cp ( cp- cd) c
max (4-7)

67
where Rcp is recovery of phosphate in concentrate, Rcd is the recovery of dolomite in
concentrate, Pc is P2O5 grade in concentrate, and Pmax is theoretical P2O5 grade of the
phosphate mineral in the sample. The mineralogical study determined the value of
Pmax = 36% for the dolomitic phosphate sample used in this study.
Table 4- 11 Experiment design for the first set of test runs.
Run A B C D E F G
1 1 -1 -1 1 1 1 -1
2 -1 1 -1 -1 1 1 1
3 -1 -1 -1 1 -1 -1 1
4 1 1 -1 -1 -1 -1 -1
5 1 1 1 1 1 -1 1
6 -1 -1 1 -1 1 -1 -1
7 -1 1 1 1 -1 1 -1
8 1 -1 1 -1 -1 1 1
Table 4- 12 Process parameters and operational conditions.
Factors Code
Level
Low High -1 1
pH A 5.5 6
Collector dosage (lb/ton) B 1 1.5
Feed rate (cm/s) C 0.2 0.3 Solids concentration (%) D 20 25
Frother Dosage (ppm) E 7 10
The fractional factorial design is one of the Experimental Design for screening
experiment. In fractional factorial design, the resolution III designs could be constructed
for investigating up to k= N-1 factors in only N runs, where N is a multiple of 4. For the
first set of test run, the screening experiment similar to the two-level fractional factorial
design will be made. This design is quite similar to a 27-4
III fractional factorial design.
The combination is a one-sixteenth fraction of the 27 and a resolution III design with

68
which only main effect can be estimated and all main effects are aliased with two-factor
interactions.
Table 4- 13 Experiment design for the second set of test runs.
Run A B C D E
1 -1 1 1 1 1
2 -1 1 -1 1 -1
3 1 1 -1 -1 1
4 1 1 1 -1 -1
5 1 -1 1 1 1
6 -1 -1 1 -1 -1
7 1 -1 -1 1 -1
8 -1 -1 -1 -1 1
After completion of the first set of test runs and effect analysis, the 7 factors will be
reduced. For the second set of test runs with 5 factors, the JUMP statistics program is
used to design the test conditions and only main effects can be analyzed and estimated.
4.3.8.2 Single factor test
In order to further determine the optimization of process parameters, single factor
experimental test was conducted by varying the collector dosage and pH. The operation
conditions of feed slurry, solids concentration and reagent dosages were kept constant, as
given in Table 4-14. The optimal operation conditions will be achieved by maximizing
the recovery and grade of P2O5, at the same time, minimizing the MgO grade in the sink.
Table 4- 14 Process parameters and operational conditions.
Process parameters Operation conditions
Collector dosage (lb/ton) 0.5 to 1.5
Solids concentration (%) 25%
pH 4.5 to 6.0
Feed rate (cm/s) 0.2
Gas flow rate (cm/s) 1.5
Wash water rate (cm/s) 0.1
Frother (ppm) 15

69
4.3.9 Perform Denver mechanical cell flotation
Amine flotation tests were conducted using the Denver D-12 model flotation machine
and 1.2 liter mechanical flotation cell. The sink discharge was collected from dolomitic
phosphate flotation in pico-nano bubble flotation column. The sink sample was sized at
38 um (400 mesh), and plus 38 um was subject to amine flotation to separate silica from
phosphate. The silica was collected as froth product, while the phosphate product was
remained in the cell.

70
Chapter 5 Results and Discussions for Coal Flotation
5.1 Effects of venturi tube design for pico-nano bubbles and nanobubbles generation
5.1.1 Design of venturi tube for pico-nano bubbles and nanobubbles generation and
measurement
Cavitation is defined as the formation of bubbles(either gas or vapour filled cavities) in a
flowing liquid due to the rupture of a liquid-liquid or a liquid- solid interface caused by
reduction of local pressure to a critical value (Ross, 1976). Bernoulli’s equation states
that if the localized velocity increases, then, by conservation of energy, there must be a
reduction in the absolute pressure at that point. If the pressure is reduced below a critical
value, then the liquid will vaporize or boil at that point. The vaporization pressure is
dependent upon both the properties and temperature of the working fluid.
Bernoulli’s equation applied between two points (1 and 2) in the system can be written as:
(5-1)
Where P is static pressure, is density, V is linear velocity, g is gravity and z is height
above an arbitrary horizontal datum line.
Cavitation results in the formation of large quantities of bubbles, which, as they move to
a region of higher pressure, collapse as the vapour condenses.
There are several designs of cavitation tube, such as orifice plate, nozzle and venturi, all
of which are capable of producing cavitation at a desired point of the flow, while the
venturi is chosen as the best option to generate pico-nano bubbles in this test, because the
gradual reduction and the subsequent gradual expansion of venturi reduced the possibility
of blockage. The venturi also has very low head loss characteristics resulting in minimal

71
impact on the pump capacity in a plant. The permanent head loss of the other two options
could be as high as 3-4 times greater than the venturi. Also, the ability to vary the throat
length, which is a very important factor of the design of cavitation tube, in the venturi is
also an advantage. By controlling the geometric and operating conditions, the cavitation
can be achieved with maximum energy efficiency.
A dimensionless number known as cavitation number (Cv) has generally been used to
relate the flow conditions with the cavitation intensity.
(5-2)
Where P2 is the fully recovered downstream pressure, Pv is the vapor pressure of the
liquid and Vth is the velocity of the liquid at the throat of the constriction. With the
presence of dissolved gases or some impurities in the liquid medium, cavitation has been
found to occur at a higher cavitation number (for Cv >1) (Harrison and Pandit, 1992).
As long as the liquid speed is sufficiently subsonic (V<mach 0.3), assume that the venturi
tube is placed horizontally, which means the height is the same, then the incompressible
bernoulli’s equation (5-1) can be written as:
(5-3)
Where Pinlet is the pressure in the inlet of the venturi tube, Pth is the pressure at the throat
of the venturi tube, Vinlet is the fluid velocity at the inlet of the venturi tube.
Using equation (5-2), the following equation can be derived for Cv :
(5-4)
Vinlet, Pv, Pin and are all set to be constants in the tests.

72
Table 5- 1 Estimated coefficients, t-ratios and p-values
Term Pico-nano bubble Volume model
Mean Pico-nano bubble Size
model
Estimate t Ratio Prob.>|t| Estimate t Ratio Prob.>|t|
Intercept -317.73 -11.21 <0.0001* 4398.48 7.97 <0.0001*
A 45.05 8.45 <0.0001* -301.41 -2.91 0.0174*
B -119.30 -11.18 <0.0001* 1132.43 5.15 0.0006*
C 19.83 6.96 <0.0001* -151.79 -2.96 0.0160*
D 30.23 8.12 <0.0001* -424.05 -6.22 0.0002*
A× B 4.18 8.81 <0.0001* -54.40 -4.69 0.0011*
A× C -1.07 -13.53 <0.0001* 9.77 5.05 0.0007*
A× D -0.10 -0.88 0.3983 -1.17 -0.40 0.6968
B× C 1.46 9.22 <0.0001* -1.56 -0.40 0.6954
B× D 0.92 3.87 0.0026* -12.42 -2.14 0.0610
C× D -0.30 -7.62 <0.0001* 2.82 2.91 0.0173*
A× A -4.11 -6.93 <0.0001* 32.40 3.13 0.0122*
B× B 17.35 7.31 <0.0001* -210.88 -5.09 0.0007*
C× C -0.29 -4.45 0.0010* 1.06 0.92 0.3793
D× D -1.06 -7.14 <0.0001* 15.69 6.06 0.0002*
Note: * means significant factors.
The main and interaction coefficients are evaluated and tested for significance as shown
in Table 5-1. The main effects include the ratio of the diameter of throat and outlet of the
venturi tube (Din/Dt), the ratio of the length of the throat and the diameter of throat (Lt/Dt),
and input and output cone angles on pico-nano bubble volume and mean pico-nano
bubble size are significant at 99.99% confidence level, as indicated by the Prob. > |t|
values less than 0.0001 when assessing the estimated coefficient.
As shown in Table 5-2, we split our ANOVA table into rows for Model and Error in
order to examine how much error we have when we use our predictive equation, and to
determine how much error has disappeared because we used our predictive equation. All
major statistics analysis results in Table 5-2 shows that the models for pico-nano bubble

73
volume and mean pico-nano bubble size models can adequately describe the effects of
dimensions of the venturi design on the response variables. It can be seen from Table 5-2
that the adjusted R2 value of 0.98 and 0.95 imply that the model is significant. There is
only a 0.01% chance that the error would occur due to the noise.
Table 5- 2 ANOVA table derived for the pico-nano bubble volume and mean
pico-nano bubble size models.
Pico-nano bubble Volume model
Source SS F F value Prob. > F R2 Adjusted
R2
Model 16685.87 4 82.55 <0.0001* 0.99 0.98
Lack of fit 154.21 0 3.35 0.40
Mean Pico-nano bubble Size model
Source SS F F value Prob. > F R2 Adjusted
R2
Model 1879892.10 4 30.99 <0.0001* 0.98 0.95
Lack of fit 38971.05 8 215.11 0.053
Note: DF = Degree of freedom, SS = Sum of squares.
Based on the statistical analysis results, the models in terms of the factor levels is:
Pico-nano bubble Volume (%) = (-317.73) + 45.05 × A ± 119.30 × B + 19.83 × C +
30.23 ×D + 4.18×A×B + (-1.07) ×A×C + (-0.10) ×A×D + 1.46 ×B×C + 0.92 ×B×D + (-
0.30)×C×D+(-4.11)×A2+17.35×B
2+(-0.29)×C
2+(-1.06)×D
2 (5-5)
Mean Pico-nano bubble Size (nm) = 4398.48 ± 301.41 × A + 1132.43 × B ± 151.79 × C ±
424.05 ×D + (-54.40) ×A×B + 9.77 ×A×C + (-1.17) ×A×D + (-1.56) ×B×C + (-12.42)
×B×D+2.82×C×D+32.40×A2+(-210.88)×B
2+1.06×C
2+15.69×D
2 (5-6)
Where A means the ratio of the diameter of throat and outlet of the venture tube (Din/Dt);
B the ratio of the length of the throat and the diameter of throat (Lt/Dt); C input cone
angles; and D output cone angles.

74
(a) Piconanobubble volume model
(b) Mean pico-nano bubble size model
Figure 5- 1 Comparison of the observed responses and predicted
responses with models.

75
The comparison of the observed responses and predicted responses are shown in Figure
5-1. The plot indicates that the models for pico-nano bubble volume and mean pico-nano
bubble size can precisely predict the pico-nano bubble volume and mean pico-nano
bubble size.
Figure 5-2 indicates the effects the ratio of the diameter of throat and outlet of the venture
tube (Din/Dt) and the ratio of the length of the throat and the diameter of throat (Lt/Dt) on
the pico-nano bubble volume and mean pico-nano bubble size when the inlet and outlet
angles were 21°and 12°, respectively. It can be clearly seen from the response surface
and the contours of the pico-nano bubble volume shown in Figure 5-2a that the pico-nano
bubble volume considerably increases from 60% to about 75% when the Din/Dt value
ranges from 2 to 4, after that, the pico-nano bubble volume decreases to 45% as
increasing the Din/Dt value from 4 to 6. The pico-nano bubble volume reduced about 10%
as increasing the Lt/Dt value from 1 to 2, then slightly increases with increasing Lt/Dt
value. At the Din/Dt value of 4, the pico-nano bubble volume increases from 62% to 80%
as Lt/Dt value increases from 1 to 3. It can be clearly observed from the contours of the
pico-nano bubble volume shown in Figure 5-2a that the highest volume of pico-nano
bubble was achieved at the medium level of Din/Dt value and the high level of Lt/Dt value.
It can be observed from the response surface and the contours of the mean pico-nano
bubble size shown in Figure 5-2b that the mean pico-nano bubble size increases with
increasing the Lt/Dt value from 1 to 2, and then decreases as increasing the Lt/Dt value
further to 3. The opposite trend of the mean pico-nano bubble size was observed with
varying the Din/Dt value. The smallest mean size, which is about 200 nm, of pico-nano
bubbles can be achieved at medium level of Din/Dt value and high level of Lt/Dt value.
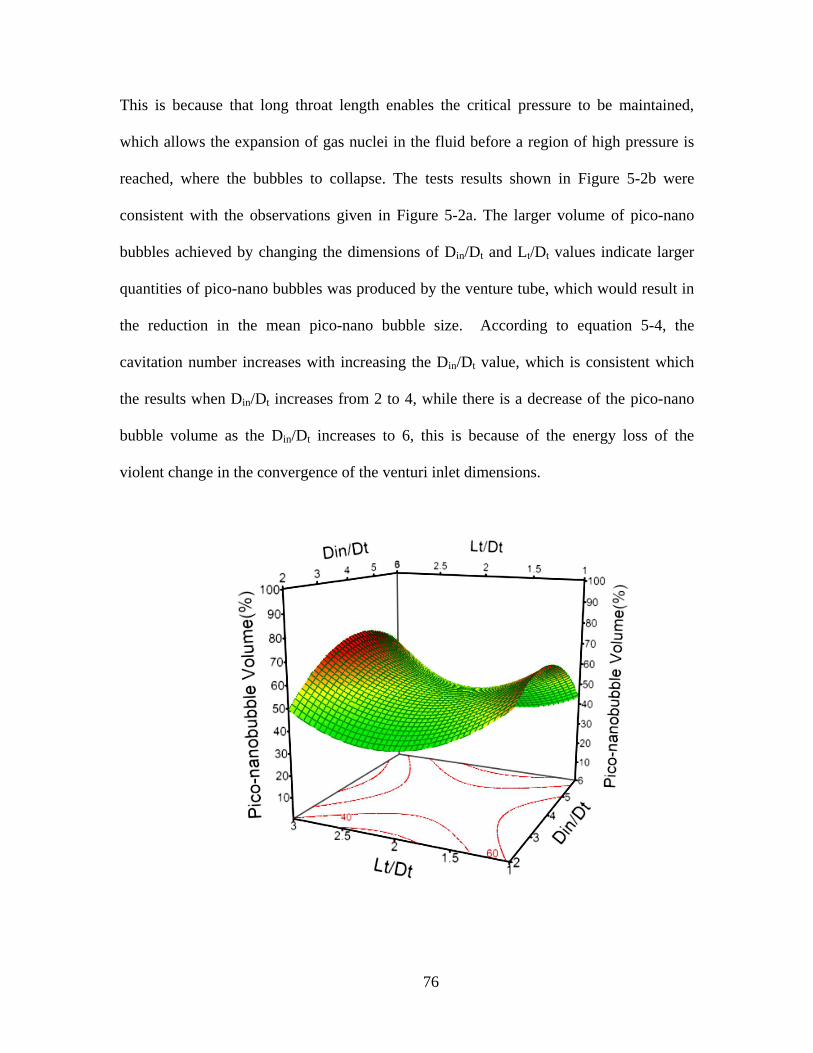
76
This is because that long throat length enables the critical pressure to be maintained,
which allows the expansion of gas nuclei in the fluid before a region of high pressure is
reached, where the bubbles to collapse. The tests results shown in Figure 5-2b were
consistent with the observations given in Figure 5-2a. The larger volume of pico-nano
bubbles achieved by changing the dimensions of Din/Dt and Lt/Dt values indicate larger
quantities of pico-nano bubbles was produced by the venture tube, which would result in
the reduction in the mean pico-nano bubble size. According to equation 5-4, the
cavitation number increases with increasing the Din/Dt value, which is consistent which
the results when Din/Dt increases from 2 to 4, while there is a decrease of the pico-nano
bubble volume as the Din/Dt increases to 6, this is because of the energy loss of the
violent change in the convergence of the venturi inlet dimensions.

77
(a) Pico-nano bubble volume

78
(b) Mean pico-nano bubble size
Figure 5- 2 Effect of the ratio of the diameter of throat and outlet of the venture
tube (Din/Dt) and the ratio of the length of the throat and the diameter of throat (Lt/Dt) on
(a) the pico-nano bubble volume and (b) mean pico-nano bubble size.
Figure 5-3 indicates the effects the ratio of the diameter of throat and outlet of the venture
tube (Din/Dt) and the inlet angle on the pico-nano bubble volume and mean pico-nano
bubble size when the ratio of the length of the throat and the diameter of throat (Lt/Dt)
and outlet angle were 3 and 12°, respectively. It can be seen from the response surface
and the contours of pico-nano bubble volume shown in Figure 5-3a that the increasing of
the inlet angle, from 15 to 27, had significantly positive effect on the pico-nano bubble
volume at the low level of Din/Dt value, however, at high level of Din/Dt value, the
increasing of the inlet angle reduced the pico-nano bubble volume. As can be obviously
observed in Figure 5-3b, the mean size of the pico-nano bubble decreases as increasing
the inlet angle, which can be explained that the increases of the inlet angle lead to the
increase of the pressure drop, resulting to the enhancement of cavitation.

79
(a) Pico-nano bubble volume
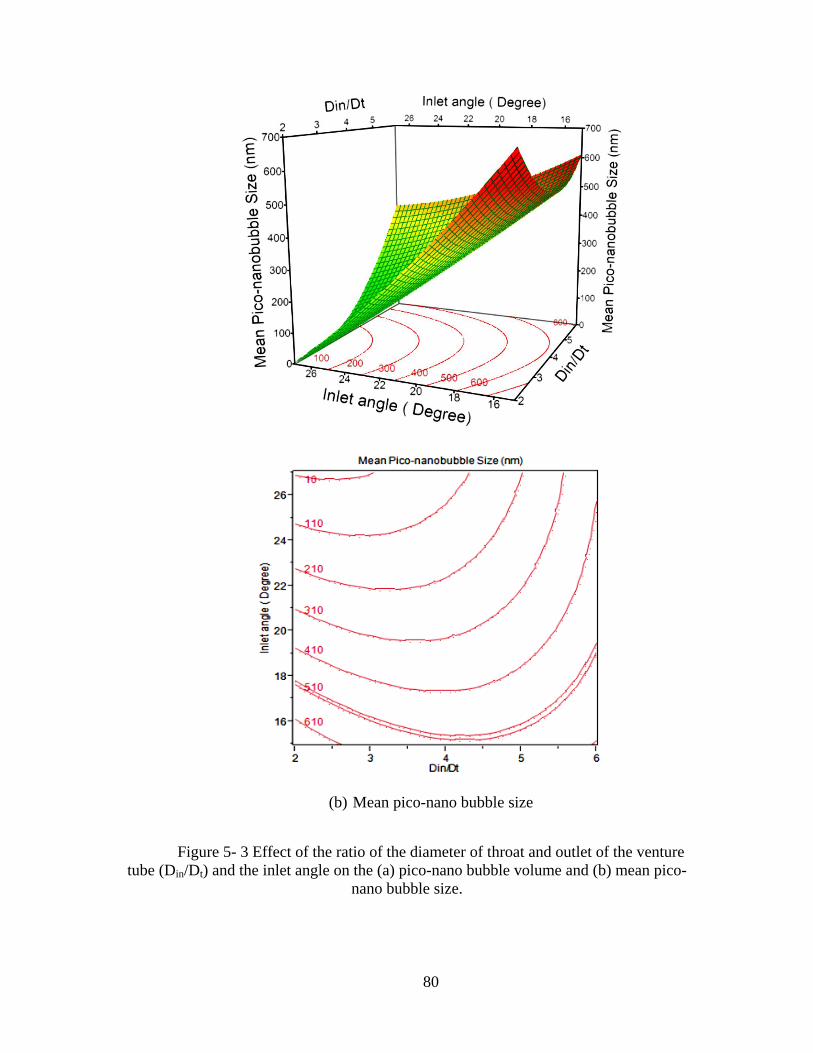
80
(b) Mean pico-nano bubble size
Figure 5- 3 Effect of the ratio of the diameter of throat and outlet of the venture
tube (Din/Dt) and the inlet angle on the (a) pico-nano bubble volume and (b) mean pico-
nano bubble size.
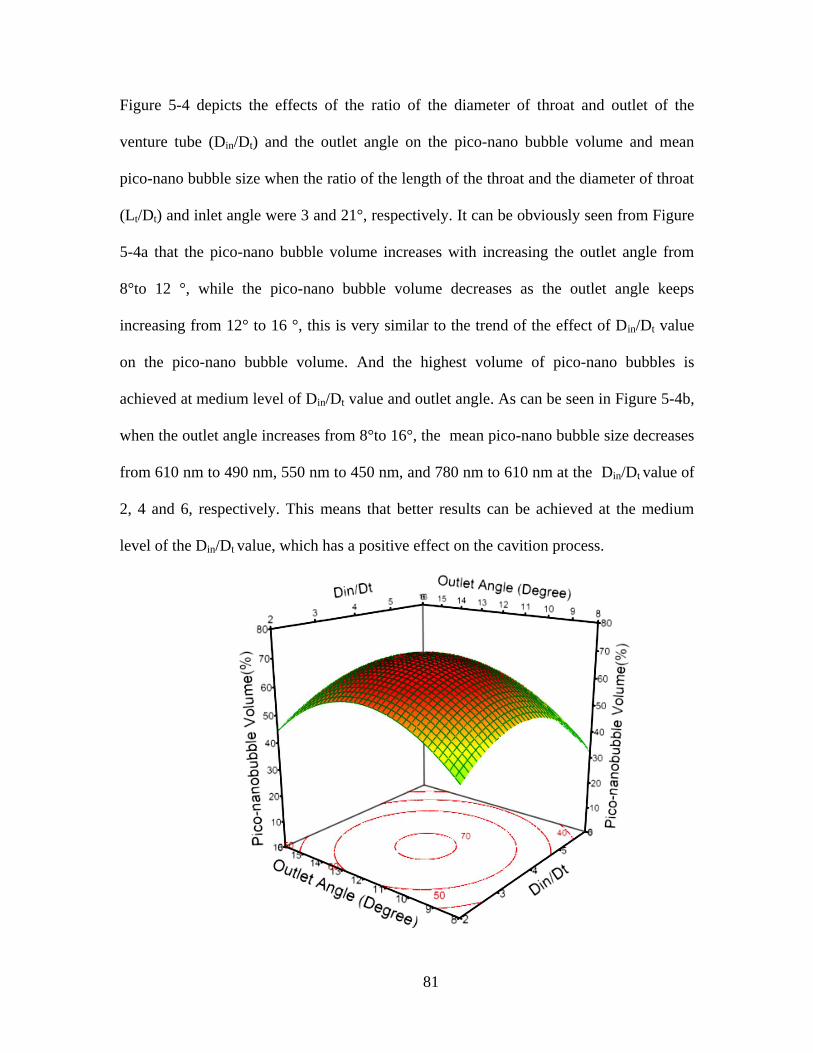
81
Figure 5-4 depicts the effects of the ratio of the diameter of throat and outlet of the
venture tube (Din/Dt) and the outlet angle on the pico-nano bubble volume and mean
pico-nano bubble size when the ratio of the length of the throat and the diameter of throat
(Lt/Dt) and inlet angle were 3 and 21°, respectively. It can be obviously seen from Figure
5-4a that the pico-nano bubble volume increases with increasing the outlet angle from
8°to 12 °, while the pico-nano bubble volume decreases as the outlet angle keeps
increasing from 12° to 16 °, this is very similar to the trend of the effect of Din/Dt value
on the pico-nano bubble volume. And the highest volume of pico-nano bubbles is
achieved at medium level of Din/Dt value and outlet angle. As can be seen in Figure 5-4b,
when the outlet angle increases from 8°to 16°, the mean pico-nano bubble size decreases
from 610 nm to 490 nm, 550 nm to 450 nm, and 780 nm to 610 nm at the Din/Dt value of
2, 4 and 6, respectively. This means that better results can be achieved at the medium
level of the Din/Dt value, which has a positive effect on the cavition process.

82
(a) Pico-nano bubble volume

83
(b) Mean pico-nano bubble size
Figure 5- 4 Effect of the ratio of the diameter of throat and outlet of the venture
tube (Din/Dt) and the outlet angle on the (a) Pico-nano bubble volume and (b) mean pico-
nano bubble size.
Maximum volume of pico-nano bubbles, 65% to 75%, and minimium mean pico-nano
bubble size, 150 to 240 nm, were achieved at the medium ratio of the diameter of throat
and outlet of the venture tube (3 to 4), medium outlet angle ( 11°to 13°), high inlet angle
( 26° to 27°) and high ratio of the length of the throat and the diameter of throat (2.3 to 3).
5.1.2 Properties of pico-nano bubbles and nanobubbles
5.1.2.1 Effect of different configurations of pico-nano bubbles, nanobubbles and
microbubbles generators on bubble size distribution
The size distribution of pico-nano bubbles, nanobubbles and microbubbles generated by
the venture tube of the optimal design and static mixer are shown in Figure 5-5. Figure 5-
5a shows the pico-nano bubbles, nanobubbles and microbubbles generated by the static

84
mixer-venturi tube which were installed in the series configuration. There are three
distinct modes observed on each population frequency curve, which are 0.08 μm, 0.7 μm
and 11 μm, respectively, representing pico-nano bubbles and nanobubbles genetated by
the venture tube and microbubbles produced by static mixer. Two modes are observed in
the bubble frequency curve produced by venturi tube, as shown in Figure 5-5d, because
of the formation of the bubble clusters (Ata, et al., 2005), which are held together by
pico-nano bubbles that attach to two or more bubbles and form stable bridges between
them.
(a) By static mixer and venturi tube which were installed in the series configuration.
0
10
20
30
40
50
60
70
80
90
100
0
2
4
6
8
10
12
14
16
18
20
0.01 0.1 1 10 100 1000
Pop
ula
tion
Fre
qu
ency
(%
)
Cu
mu
lati
ve
Fre
qu
ency
(%
)
Bubble Diameter, µm
Population frequency
Cumulative frequency under
size

85
(b) By static mixer and venturi tube which were installed in the parallel configuration.
(c) By static mixer only
0
10
20
30
40
50
60
70
80
90
100
0
2
4
6
8
10
12
14
16
18
20
0.01 0.1 1 10 100 1000
Pop
ula
tion
Fre
qu
ency
(%
)
Cu
mu
lati
ve
Fre
qu
ency
(%
)
Bubble Diameter, µm
Population frequency
Cumulative frequency under
size
0
10
20
30
40
50
60
70
80
90
100
0
2
4
6
8
10
12
14
16
18
20
0.01 1 100
Pop
ula
tion
Fre
qu
ency
(%
)
Cu
mu
lati
ve
Fre
qu
ency
(%
)
Bubble Diameter, µm
Population frequency
Cumulative frequency under
size

86
(d) By venturi tube only
Figure 5- 5 Bubbles generated by static mixer –venturi tube, static mixer only
and venturi tube only with 20 ppm MIBC.
Figure 5-5b shows that the nanobubbles and microbubbles generated by static mixer-
venturi tube which were connected in the parallel configuration. No pico-nano bubbles
are generated when the static mixer and the venturi tube are connected in parallel, this is
because the flowrate through the static mixer and the venturi tube are reduced by 50%
after splitting into two streams, resulting in the reduction of the pressure drop through the
venturi tube and static mixer. Figure 5-5c shows that the bubbles generated by static
mixer only, which mainly existing as microbubbles. All tests were measured after 10
minutes after the bubble generation process, in order to eliminate the effect of bubble
0
10
20
30
40
50
60
70
80
90
100
0
2
4
6
8
10
12
14
16
18
20
0.01 0.1 1 10 100 1000
Pop
ula
tion
Fre
qu
ency
(%
)
Cu
mu
lati
ve
Fre
qu
ency
(%
)
Bubble Diameter (micrometer)
Population frequency
Cumulative frequency under size

87
rising on measurement, the pico-nano bubbles and nanobubbles solutions were recycled
slowly without flowing through the venturi tube.
5.1.2.2 Effect of selected frother on pico-nano bubble size distribution
Figure 5-6 shows the size distribution of pico-nano bubbles and nanobubbles generated
from air naturally dissolved in water with varying MIBC (Methyl Isobutyl Carbinol)
concentration.
Figure 5- 6 Pico-nano bubbles generated at varying concentration of MIBC.
It can be clearly seen from Figure 5-6 that the bubble size decreases with increasing
frother concentration from 10 ppm to 100 ppm. This is because the addition of frother up
0
1
2
3
4
5
6
7
8
9
10
0.01 0.1 1 10 100
Po
pu
lati
on
Fre
qu
ency
(%
)
Bubble Diameter (micrometer)
10 ppm
20 ppm
40 ppm
60 ppm
80 ppm
100 ppm

88
to a given amount reduces the surface tension, γ. Fundamentally, the role of frother can
be understood by the Laplace equation:
γ
(5-7)
where P1, P2 and r are the pressure inside the bubble, the pressure outside the bubble, and
the radius of the bubble, respectively.
Under typical flotation conditions of frother addition, the reduction in surface tension of
the liquid/vapor interface is achieved and can result in increasing in surface area and
correspondingly reduction s in bubble size. Frother molecules increase the stability of the
hydrated layer surrounding the bubble by absorbing on the air bubbles. The hydrophilic
groups of absorbed frother molecules are directed to the liquid phase and actively interact
with water molecules. This enhances the mechanical strength of the water film around the
bubble and preventing its coalescence/breakup on collision with other bubbles (Finch, et
al. 2008).
Figure 5-7 gives the size distribution curve for bubbles in water solution inside the testing
column with 20 ppm MIBC (Methyl Isobutyl Carbinol) or TTT frother. It can be seen
that both curves have two peaks. On the population frequency curve with TTT frother,
two peaks are located at 0.065 and 0.7 μm, representing pico-nano bubbles and
nanobubbles generated by the venturi tube. With frother MIBC, the modes of the pico-
nano bubble and nanobubble size distribution are 0.08 and 0.7 μm, respectively. The
pico-nano bubble size is smaller than the microbubble size by about three orders of
magnitude. Figure 5-7 also shows that the pico-nano bubbles and nanobubbles produced
with TTT frother are finer than those formed with MIBC. This is because TTT frother is

89
stronger than MIBC and the surface tension reduction by TTT frother is more significant
than by MIBC.
Figure 5- 7 Bubble size distribution curve in water solution with 20 ppm MIBC,
and TTT frother.
5.2 Column flotation of bituminous coal using cavitation venturi tube for pico-nano
bubbles and nanobubbles generation
5.2.1 Design of Experiment and Statistical Analysis Method
5.2.1.1 Six-factor three-level experimental design
The main and interaction coefficients are evaluated and tested for significance as shown
in Table 5-3.
0
10
20
30
40
50
60
70
80
90
100
0
2
4
6
8
10
12
14
16
18
20
0.01 0.1 1 10 100 1000
Po
pu
lati
on
Fre
qu
ency
, %
Cu
mu
lati
ve
Fre
qu
ency
, %
Bubble Diameter (micrometer)
Population frequency with TTT frother
Population frequency with MIBC
Cumulative frequency under size with TTT
frother
Cumulative frequency under size with
MIBC

90
Table 5- 3 Estimated coefficients, t-ratios and p-values.
Term Combustible material recovery model Clean coal ash model
Estimate t Ratio Prob.>|t| Estimate t Ratio Prob.>|t|
Intercept 95.21 25.55 <0.0001* 9.05 8.19 <0.0001*
A 1.07 1.46 0.16 -0.48 -1.4 0.18
B 4.73 4.11 0.0009* -0.006 -2.41 0.03*
C -0.10 -1.23 0.24 0.03 1.14 0.27
D -1.07 -5.67 <0.0001* 2.5 2.53 0.02*
E -10.18 -6.10 <0.0001* -0.99 -2.78 0.01*
F -4.56 -0.61 0.55 0.68 0.45 0.66
A× B -6.00 -1.5 0.15 0.11 1.37 0.19
B× C 3.86 2.15 1.88 -6.00 -1.5 0.15
C× D -0.0001 -0.01 0.99 1.07 1.46 0.16
D× E 0.007 0.03 0.98 -9.08 -0.67 0.51
E× F -9.08 -0.67 0.51 -0.06 -1.13 0.28
Note: * means significant factors.
The main effects of collector dosage, Feed solids concentration and Feed rate on recovery
of combustible material and clean coal ash content are significant at 95% confidence
level, as indicated by the Prob. > |t| values less than 0.05 when assessing the estimated
coefficient. These findings indicate that feasibility of the pico-nano bubbles plays an
important role in determining flotation performance, high solids concentration and feed
rate would lead to the lack of pico-nanno bubbles in the flotation process, which would
affect the product grade. Besides, similar to previous findings, collector dosage is also
very important in determining the clean coal grade, by using optimal dosage of collector,
we can get clean coal product with low ash content and high combustible material
recovery. The orders of main effects are:
Feed rate > Feed solids concentration > Collector dosage > Gas flow rate > Frother
dosage> Superficial wash water rate.

91
As shown in Table 5-4, we split our ANOVA table into rows for Model and Error in
order to examine how much error we have when we use our predictive equation, and to
determine how much error has disappeared because we used our predictive equation. All
major statistics analysis results in Table 5-3 show that the models for the combustible
material recovery and clean coal ash models can adequately describe the effects of
operating parameter on the response variables.
Based on the statistical analysis results, the reduced model in terms of the factor levels is:
Combustible Material Recovery (%) = 95.21+1.07× A + 4.73× B + (-0.1) × C ± (-1.07)
×D ± (-10.18) ×E ± (-6.81) ×F + (-6) ×A×B + 3.86×B×C + (-0.0001) ×C×D + 0.007
×D×E + (-9.08) ×E×F (5-8)
Clean Coal Ash (%) = 9.05 ± (-0.48) ×A ± (-0.006) × B + 0.03× C + (-0.99) × D + 0.91 ×
E + 2.50× F + 0.11 ×A×B + (-6.00) ×B×C + (1.07) ×C×D + (-9.08) ×D×E + (-0.06)
×E×F (5-9)
The comparison of the observed responses and predicted responses with reduced model
are shown in Figure 5-8.
Table 5- 4 ANOVA table derived for the combustible material recovery and clean
coal ash models.
Combustible material recovery model
Source SS DF F value Prob. > F R2 Adjusted
R2
Model 1179.66 11 13.36 < 0.0001* 0.93 0.89
Error 120.41 15
Clean coal ash model
Source SS DF F value Prob. > F R2 Adjusted
R2
Model 31.21 8 4.02 < 0.0001 * 0.89 0.82
Error 10.59 18
Notes: DF= Degree of freedom, SS= Sum of squares.

92
Figure 5- 8 Comparison of the observed responses and predicted responses with
reduced model.

93
Figure 5-9a depicts the effect of gas flow rate and collector dosages with the combustible
material recovery as separation responses. The response surface and contour curves
suggest that the effect of collector dosage is much more significant than gas flow rate and
the area of the highest combustible efficiency was at the high level of collector dosage.
The combustible material recovery increased by about 6% as the collector dosage
increased from 0.5 to 1.5 lb/ton. Figure 5-9b depicts the effect of gas flow rate and
collector dosages with the clean coal ash content as separation responses. It can be seen
from the response surface and contour curves that the effect of collector dosage is much
more significant than gas flow rate, and clean coal ash increases with increasing collector
dosage. Maximum recovery was predicted at the highest collector dosage and gas flow
rate while the minimum clean coal ash content is realized at the opposite end of the
parameter value ranges, when gas flow rate increases from 0.5 to 2.5 cm/s, combustible
material recovery increases from 78 to 79%, 81 to 83%, 83 to 83.5% with clean coal ash
decreases from 10.5 to 10.2%, 11 to 10.5% and 11.5 to 11.3%, respectively at collector
dosage of 0.3, 0.9 and 1.5 lb/ton, this means that nanobubbles have more significant
effect on the combustible material recovery at medium collector dosage.

94
(a) Combustible material recovery.
(b) Clean coal ash.
Figure 5- 9 Effect of gas flow rate and collector dosages on (a) CMR and (b) clean coal
ash.

95
Figure 5-10a shows the effect of gas flow rate and wash water rate with the combustible
material recovery as separation responses. The response surface and contour curves
suggest that the area of the highest combustible efficiency was at the low level of wash
water rate. The gas flow rate had no significant effects on the combustible material
recovery. The combustible material recovery increased by about 5% as the wash water
rate decreased from 0.5 to 0.l cm/s. Figure 5-10b shows the effect of gas flow rate and
wash water rate with clean coal ash content as separation responses. The response surface
and contours suggest that the area of the lowest clean coal ash content was at the low
level of wash water rate and gas flow rate. As the wash water rate increased from 0.1 to
0.5 cm/s, the clean coal ash content increased from 10.2 to 10.4%, 10.4 to 10.6% and
10.7 to 10.9% at gas flow rate of 0.5 cm/s, 1.5 cm/s and 2.5 cm/s, respectively.
(a) Combustible material recovery.
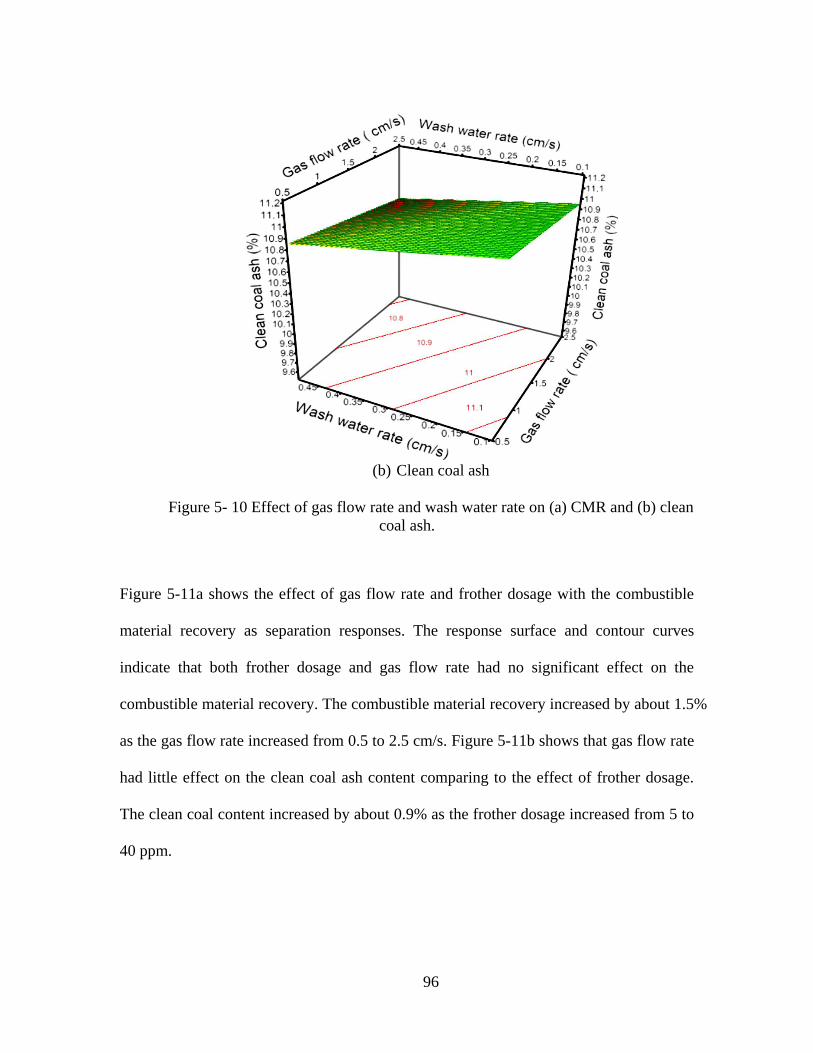
96
(b) Clean coal ash
Figure 5- 10 Effect of gas flow rate and wash water rate on (a) CMR and (b) clean
coal ash.
Figure 5-11a shows the effect of gas flow rate and frother dosage with the combustible
material recovery as separation responses. The response surface and contour curves
indicate that both frother dosage and gas flow rate had no significant effect on the
combustible material recovery. The combustible material recovery increased by about 1.5%
as the gas flow rate increased from 0.5 to 2.5 cm/s. Figure 5-11b shows that gas flow rate
had little effect on the clean coal ash content comparing to the effect of frother dosage.
The clean coal content increased by about 0.9% as the frother dosage increased from 5 to
40 ppm.

97
(a) Combustible material recovery.
(b) Clean coal ash.
Figure 5- 11 Effect of gas flow rate and frother dosage on (a) CMR and (b) clean coal ash.

98
Figure 5-12a shows the effect of gas flow rate and solids concentration with the
combustible material recovery as separation responses. The response surface and
contours depict that the area of the highest combustible efficiency was at the low level of
solids concentration. The combustible material recovery increased by about 14% as the
solids concentration decreased from 20 to 5 %. Figure 5-12a indicates the presence of
pico-nano bubble had significant effects on the separation efficiency. Figure 5-12b shows
that the area of lowest clean coal ash content was at the low level of solids concentration.
The clean coal ash content increased by about 2% as the solids concentration increased
from 5 to 20 %, while better combustible material recovery and product grade are
achieved at lower solids concentration.
(a) Concentration on combustible material recovery.

99
(b) Clean coal ash.
Figure 5- 12 Effect of gas flow rate and solids concentration on (a) CMR and
(b) clean coal ash.
Figure 5-13a shows the effect of gas flow rate and feed rate with the combustible material
recovery as separation responses. The response surface and contours depict that the area
of the highest combustible efficiency was at the low level of feed rate. The combustible
material recovery increased by about 8% as the feed rate decreased from 1 to 0.2 cm/s.
The presence of pico-nano bubble had more significant effects on the separation
efficiency. Figure 5-13b shows the effect of gas flow rate and feed rate with the clean
coal ash content as separation responses. The clean coal content increases about 1 % as
increasing the feed rate from 0.2 cm/s to 1 cm/s, and the gas flow rate had no significant
effect on the clean coal ash, which only increased about 0.2% as decreasing gas flow rate
from 2.5 cm/s to 0.5 cm/s. Maximum recovery was predicted at the lowest feed rate, the
minimum clean coal ash content is realized at same value ranges of the parameter.

100
(a) Combustible material recovery.
(b) Clean coal ash.
Figure 5- 13 Effect of gas flow rate and feed rate on
(a) CMR and (b) clean coal ash.

101
The experimental program provided a narrow range of clean coal ash values as shown in
Figure 5-14. The flotation column using pico-nano bubbles provided a reduction in ash
content from 12.25% to a minimum of 7.5%, while recovering 65.79% of the
combustible material. The separation performances are around, some of which even
significantly higher than, the theoretical best performance predicted for froth flotation
(release analysis data), that is to say the presence of pico-nano bubbles enhanced flotation
performance.
Figure 5- 14 Combustible material recovery versus clean coal ash for column
flotation and release analysis flotation results.

102
5.2.1.2 Three-factor three-level central composite experimental design
The statistic analysis data in Table 5-5 shows that statistically significant factors include
collector dosage, feed solids concentration and feed rate. The data clearly shows the
importance of feed rate in determining the combustible material recovery and clean coal
ash content, as indicated by the Probability > |t| values less than 0.05 when assessing the
estimated coefficient.
Table 5-6 is the ANOVA for the combustible material recovery and clean coal ash
models. All major statistics indicate that the models can adequately describe the
operating parameters` effects on the response variables since the models do not have a
significant lack of fit (the Probability > F greater than 0.1). In order to improve model
prediction as indicated by higher R2 and adjusted R
2 values, two terms are removed (i.e.
interaction between Solids concentration and feed rate (BC), and double interaction of
solids concentration (B2)) based on lack of significance evaluation.
Table 5- 5 Estimated coefficients, t-ratios and p-values.
Term
Combustible material recovery
model Clean Coal ash model
Estimate t Ratio Prob>|t| Estimate t Ratio Prob>|t|
Intercept 83.04 3.83 0.0087* 24.08 4.70 0.0033*
A -64.47 -1.3 0.24 19.2 2.44 0.05
B 126.49 1.70 0.14 12.07 2.03 0.9
C -221 -2.63 0.04* -2.82 -8.25 0.0002*
A× B -4.73 -2.20 0.07 9.96 1.84 0.11
A× C 57.08 1.77 0.13 22.40 0.92 0.39
B× C 0.66 0.20 0.85 - - -
A× A 73.02 1.95 0.10 -10.20 -1.66 0.15
B× B -0.01 -0.05 0.96 - - -
C× C -18.48 -1.38 0.22 -19.92 -1.26 0.25
Note: * means significant factors.

103
Table 5- 6 ANOVA table derived for the recovery and clean coal ash models
derived from the results.
Combustible material
recovery model
Source SS DF F
value
Prob. >
F
R2 Adjusted R
2
Model 1290.4
1
9 4.78 0.04* 0.95 0.89
Lack of fit 154.45 5 1.22 0.59
Clean coal ash model
Source SS DF F
value
Prob. >
F
R2 Adjusted R
2
Model 117.25 7 8.17 0.0041* 0.93 0.88
Lack of fit 15.44 7 2.28 0.47
Note: DF= Degree of freedom, SS= Sum of squares.
Based on the statistical analysis results, the reduced model in terms of the factor levels is:
Combustible Material Recovery (%) = 83.04±64.47× A + (-221) × B + 126.49× C + A ×
B × (-4.73) + A × C × 57.08 + B × C × 0.66 + A × A × 73.02 + B × B × (-0.01) + C × C
× (-18.48) (5-10)
Clean Coal Ash (%) = 24.08 + 19.20 × A + (-2.82) × B + 12.07 × C + A × B × 9.96 + A
× C × 22.4 + A × A × (-10.2) + C × C × (-19.92) (5-11)
Figure 5-15 indicates the effects of the feed solids concentration and the collector dosage
on the combustible material recovery and clean coal ash content when the gas flow rate,
frother concentration, Superficial wash water rate, and feed rate were 1.6 cm/s, 20 ppm, 0.2
cm/s, and 0.2 cm/s, respectively. It can be clearly seen from the response surface and the
contours of the combustible material recovery shown in Figure 5-15a that the
combustible material recovery considerably decreases with increasing the feed solids
concentration and slightly increases with increasing the collector dosage. At the collector

104
dosage of 0.3 lb/ton, the combustible material recovery increased from 75% up to 85% as
the feed solids concentration decreased from 10 to 4 %. It can be clearly observed from
the contours of the combustible material recovery shown in Figure 5-15a that when the
solids concentration decreases from 10 to 4 %, the combustible material recovery
increases from 75% to 85%, 65% to 87%, and 74% to 93% at the collector dosages of 0.3,
0.6 and 0.9 lb/t, respectively. This means that nanobubbles have more significant effect
on the combustible material recovery at the medium collector dosage than at the higher
collector dosage. It can be observed from the response surface and the contours of the
clean coal ash content shown in Figure 5-15b that the clean coal ash content increases
with increasing the solids concentration and the collector dosage. Probably the
overdosing of the collector caused a decrease in clean coal ash content at the high
collector dosage and the high solids concentration. Figure 5-15b depicts that when the
solids concentration increases from 4 to 10 %, the clean coal ash content changes from
9.0% to 10.5 %, 11% to 10.3% and 15.0% to 9.8% at the collector dosages of 0.3, 0.6 and
0.9 lb/t, respectively, the optimal operation condition would be obtained at medium
collector dosage and low level of solids concentration with 85 to 90% combustible
material recovery and 10 to 11% clean coal ash.

105
(a) Combustible material recovery.

106
(b) Clean coal ash.
Figure 5- 15 Effect of solids concentration and collector dosages on (a) CMR and
(b) clean coal ash.
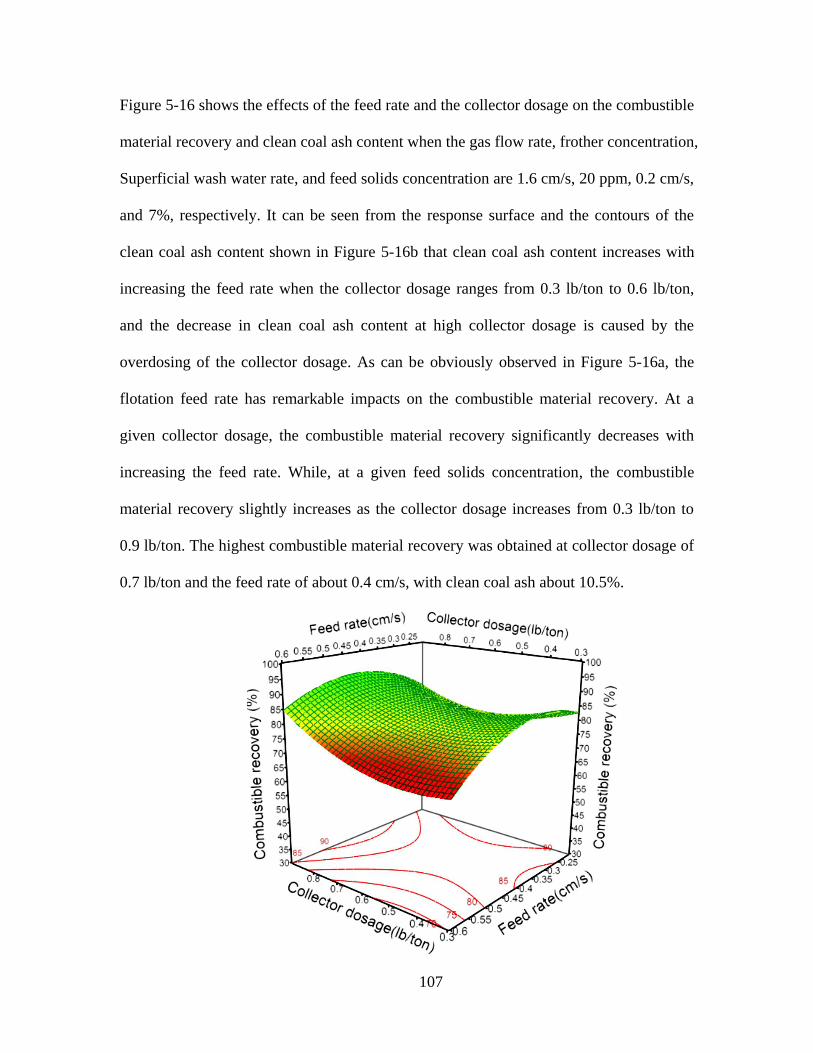
107
Figure 5-16 shows the effects of the feed rate and the collector dosage on the combustible
material recovery and clean coal ash content when the gas flow rate, frother concentration,
Superficial wash water rate, and feed solids concentration are 1.6 cm/s, 20 ppm, 0.2 cm/s,
and 7%, respectively. It can be seen from the response surface and the contours of the
clean coal ash content shown in Figure 5-16b that clean coal ash content increases with
increasing the feed rate when the collector dosage ranges from 0.3 lb/ton to 0.6 lb/ton,
and the decrease in clean coal ash content at high collector dosage is caused by the
overdosing of the collector dosage. As can be obviously observed in Figure 5-16a, the
flotation feed rate has remarkable impacts on the combustible material recovery. At a
given collector dosage, the combustible material recovery significantly decreases with
increasing the feed rate. While, at a given feed solids concentration, the combustible
material recovery slightly increases as the collector dosage increases from 0.3 lb/ton to
0.9 lb/ton. The highest combustible material recovery was obtained at collector dosage of
0.7 lb/ton and the feed rate of about 0.4 cm/s, with clean coal ash about 10.5%.

108
(a) Combustible material recovery.

109
(b) Clean coal ash.
Figure 5- 16 Effect of feed rate and collector dosages on (a) CMR and (b) clean
coal ash.
Figure 5-17 depicts the effects of the feed solids concentration and feed rate on the
combustible material recovery and clean coal ash content when the gas flow rate, frother
concentration, Superficial wash water rate, and collector dosage were 1.6 cm/s, 20 ppm,
0.2 cm/s, and 0.3 lb/ton, respectively. It can be obviously seen from Figure 5-17a that the
combustible material recovery increases considerably with decreasing the feed rate from
0.6 to 0.4 cm/s and slightly increases with decreasing the solids concentration. As can be
seen in Figure 5-17b, the clean coal ash content increases with increasing the flotation
feed rate from 0.2 to 0.6 cm/s and decreasing the solids concentration from 10 to 4%.
After that, there is a slight decrease in the clean coal ash content.

110
(a) Combustible material recovery.

111
(b) Clean coal ash
Figure 5- 17 Effect of solids concentration and feed rate on (a) CMR and (b) clean
coal ash.

112
The experimental program provided a broad range of clean coal ash values as shown in
Figure 5-18. The flotation column using pico-nano bubbles provided a reduction in ash
content from 17.05% to a minimum of 7.25%, while recovering 66.13% of the
combustible material. The separation performances are around, some of which even
significantly higher than, the theoretical best performance predicted for froth flotation
(release analysis data), which means the presence of pico-nano bubbles enhanced
flotation performance.
Figure 5- 18 Combustible material recovery versus clean coal ash content for
column flotation and release analysis flotation results.

113
5.2.2 Single factor experimental test
The effect of collector dosage on the combustible material recovery and clean coal ash
content is given in Figure 5-19. Over the tested range of collector dosage range of 0.1 to
0.9 lb/ton feed coal, the combustible material recovery is 76 to 85%, and clean coal
product ash content is 7 to 14%. The combustible recovery and clean coal ash content
increase with increasing the collector dosage. In order to maximize the combustible
recovery and minimise clean coal ash, the optimal collector dosage has been found at 0.7
lb/ton, with combustible recovery of 83.5% and clean coal ash of 9.31%.
The effect of feed solid concentration in feed on the clean coal product ash content is
given in Figure 5-20. It can be seen that, the clean coal product quality deteriorated as the
percent of feed solid concentration increased. Figure 5-20 also shows the results of
combustible material recovery as a function of solid concentration. The results indicate
that the combustible recovery decreases with increasing the solid concentration. It can be
due to the fact that the availability of the bubble surfaces become less as the increasing of
fine coal particles surfaces when the concentration of the feed fine coal particles increase.
It is noted that the clean coal product ash contents ranges from 8.15% to 11.44%, and the
combustible recovery ranges from 90.31% to 71.31%, while the feed solid concentration
ranges from 2% to 10%. The optimal solid concentration is found at 3.5%, with the
optimal combustible recovery and clean coal ash at 89.92% and 8.15%, respectively.

114
Figure 5- 19 Combustible material recovery and clean coal ash content as a
function of collector dosage.
Figure 5- 20 Combustible material recovery and clean coal ash content as a
function of solid concentration.
6
8
10
12
14
16
18
20
40
45
50
55
60
65
70
75
80
85
90
0 0.2 0.4 0.6 0.8 1
Cle
an
Coa
l A
sh,
%
Cu
mb
ust
ible
Rec
ov
ery, %
Collector Dosage, lb/ton
0
2
4
6
8
10
12
14
65
67
69
71
73
75
77
79
81
83
85
87
89
91
93
95
0 2 4 6 8 10 12
Cle
an
Coa
l A
sh,
%
Co
mb
ust
ible
Rec
over
y,
%
Solid Concentration, %

115
Figure 5- 21 Combustible material recovery and clean coal ash content as a
function of feed rate.
Figure 5-21 shows the combustible material recovery and clean coal product ash content
as a function of feed rate. Over the tested feed rate range of 0.2 to 0.5 cm/s, the
combustible material recovery is 78.05 % to 88.07 %, and clean coal product ash is 9.6 %
to 12.57 %. It can be seen from Figure 5-21 that the combustible material recovery
decreases as increasing the feed rate. The clean coal ash decreases from 11.5% to 9.6%
when feed rate increases from 0.2 cm/s to 0.4 cm/s, and it increases to 12.57% as the feed
rate continue increasing to 0.6 cm/s. The optimal clean coal ash content of 9.6%, and
highest combustible recovery of 88.07% can be achieved at the feed rate of 0.4 cm/s.
0
2
4
6
8
10
12
14
16
18
20
0
10
20
30
40
50
60
70
80
90
100
0 0.2 0.4 0.6 0.8
Cle
an
Coa
l A
sh,
%
Com
bu
stib
le R
ecover
y,
%
Feed Rate, cm/s

116
5.3 Effects of particle density and size distributions in coal flotation pico-nano
bubbles environment
5.3.1 Particle size and density frequencies
Washability data were obtained for feed coal, clean coal, and tailings of pico-nanobulle
column flotation of bituminous coal. Heavy liquid, Lithium Meta-Tungstate (LMT, LMT
Liquid, LLC, ID) having 2.95 g/cm3 density was diluted by de-ionized/distilled water to
prepare a series of heavy mediums with various densities. The densities of the heavy
medium are: 1.30, 1.40, 1.50, 1.60, 1.70, 1.80, 2.00, 2.10, and 2.20 g/cm3. Float-sink test
were conducted in a 2000 ml squib shape separatory funnel with stopcocks. Coal slurry
sample was prepared in a beaker by mixing the coal sample in a heavy medium with
lowest density specified. The prepared coal slurry sample is poured into separatory funnel
and let it stands for a designated time for particle separation by density. After separation,
the sink particles are drained out through stopcock for filtration. The float particles
remained in the sparator are poured out for filtration, drying, weighing and ash content
determination. The sink particles are then used to prepared coal slurry sample by mixing
with next heavier density heavy medium (1.40 g/cm3). This process are repeated from the
lowest density to the highest density of heavy medium following the sequence stated
above. To obtain the accurate measurement results of the tests for fine and ultrafine
particles, the solids concentrations of the slurry must be maintained at 10% by volume or
lower. Pre-wetting the fine and ultrafine coal particles by heavy medium prior to the
float-sink test must also be completed by gentle stirring the coal slurry sample using a
glass bar for 5-10 minutes, to obtain the true float-sink separation results.

117
The coal particle size and ash distributions of fine raw coal sample of Pittsburgh No. 8
seam are given in Table 3-1 and Figure 3-2. It can be seen from Figure 5-22 that, the ash
contents of coal sample decrease as the particle size increases. The significant increase in
ash content at finer particle size fractions can be resulted from the high clay mineral
components and can be the indicative of well liberation of the sample. The fine coal
sample is distributed over a wide size range as showed by 10.22% particles being larger
than 250 μm and 28.16% particles being finer than 45 μm. The feed coal ash content is
30.64%. From Figure 5-22, the fine raw coal ash increases with increasing density, the
coal is composed of macerals and ash-forming minerals, and density of ash-forming
minerals are usually higher than those of the combustible matter. Also, the liberation of
the intermediate-density particles, ranging from 1.5 to 1.9 g/cm3, is not completely
liberated (middlings), making it very difficult to separate.
(a) -700+355 and -355+150 μm
0
20
40
60
80
100
1.2 1.4 1.6 1.8 2 2.2 2.4
Wei
gh
t or
Ash
, %
Density, g/cm3
-700+355 μm individual ash
-355+150 μm individual ash
-700+355 μm individual weight
-355+150 μm individual weight
-700+355 μm cumulative weight
-355+150 μm cumulative weight
-700+355 μm cumulative ash
-355+150 μm cumulative ash

118
(b) -150+75 and -75 μm
Figure 5- 22 Density and ash distributions of fine raw coal sample.
5. 3.2 Pico-nano bubble Column Flotation Test
5.3.2.1 Effect of pico-nano bubbles on flotation of coarse and ultrafine fractions of
coal particles
Figure 5-23 shows the effect of pico-nano bubbles and coal particle density on the coal
flotation performance of -700+355 and -75 μm coal particle size ranges, respectively. The
figure shows the combustible material recovery decreases significantly with increasing
particle density. Since as inorganic mineral components increase, resistance to the bubble
attachment increase. It has been demonstrated, organic carbonaceous components are the
most amenable to bubble attachment, deceasing as the coal particle density increases. The
total bubble volume or the bubble quantity required for floating a lower density coal
0
10
20
30
40
50
60
70
80
90
1.20 1.40 1.60 1.80 2.00 2.20 2.40
Wei
gh
t or
Ash
, %
Density, g/cm3
-150+75 μm individual ash
-75μm individual ash
-150+75 μm individual weight
-75μm individual weight
-150+75 μm cumulative weight
-75μm cumulative weight
-75μm cumulative ash
-150+75 μm cumulative ash

119
particles of a given particle size is smaller than that required for floating a higher density
coal particle. In other words, the increase in coal particle density (mass) of a given
particle size results in a decrease of the amount of coal surface area available for bubble
attachment which reduces coal particle/bubble attachment probability and increases the
coal particle detachment probability. Figure 5-23 also shows that the use of pico-nano
bubbles increases the combustible material recoveries with the various densities of -
700+355 and -75 μm particles. Figure 5-23(a) reveals that the presence of pico-nano
bubbles increases the -700+355 μm coal particles combustible recoveries of the various
density fractions: minus 1.3, 1.3-1.4, 1.4-1.5, 1.5-1.6, and 1.6-1.8 g/cm3 by 20.1%, 21.9%,
25.4%, 19.8%, and 15.9%, respectively. Thus, pico-nano bubbles have more effect on the
medium density fractions than on the low and high density fractions. Figure 5-23(b)
depicts that the presence of pico-nano bubbles increases -75 µm coal combustible
material recovery of the various densities ranges: minus 1.3, 1.3-1.4, 1.4-1.5, 1.5-1.6, 1.6-
1.8, and 1.8-2.0 g/cm3 by 18.2%, 26.3%, 28.3%, 30.15%, 30.6% and 10.1%, respectively.
It can be seen from Figure 5-23 the pico-nano bubble has more effect on -75 μm ultrafine
particles than the -700+355 μm coarse particles. More higher density fraction of -75 μm
ultrafine particles were floated than that of -700+355 μm coarse particles.
Figure 5-24 compares the clean coal yield with and without pico-nano bubbles for the
particle size ranges of -700+355 μm and -75 μm respectively. At a given clean coal
product ash content, Figure 5-24 (a) shows that the presence of pico-nano bubbles
increases the -700+355 μm coal particles clean coal yield by 14%. Figure 5-24 (b) shows
that the presence of pico-nano bubble increases the -75 μm coal particles clean coal yield
by 11%. Existing of pico-nano bubbles have significant effect on the clean coal yield of

120
-700+355 μm coarse coal range and -75 μm fine coal range in the medium clean coal ash
content than in the lower or higher product ash range.
(a) -700+355 μm
(b) -75 μm
Figure 5- 23 Effect of pico-nano bubbles on coal flotation recovery.
0
20
40
60
80
100
1.28 1.35 1.45 1.55 1.65 1.75 1.90 2.20
Com
bu
stib
le M
ate
rial
Rec
over
y, %
Density, g/cm3
With pico-nanobubble
Without pico-nanobubble
0
20
40
60
80
100
1.28 1.35 1.55 1.75 1.90 2.20
Com
bu
stib
le M
ate
rial
Rec
over
y, %
Density, g/cm3
With pico-nanobubble
Without pico-nanobubble

121
(a) -700+355 μm
(b) -75 μm
Figure 5- 24 Effect of pico-nano bubble on yield and combustible material
recovery.
0
10
20
30
40
50
60
70
80
90
100
4.62 6.12 8.56 12.11 22.22 28.87 29.05
Cle
an
Coal Y
ield
, %
Clean Coal Ash, %
Clean coal yield with pico-nanobubble
Clean coal yield without pico-nanobubble
0
10
20
30
40
50
2.41 3.53 4.19 5.91 7.09 7.53 8.13
Cle
an
Coal Y
ield
, %
Clean Coal Ash, %
Clean coal yield with pico-nanobubble
Clean coal yield without pico-nanobubble

122
5. 3. 2. 2 Effect of pico-nano bubbles on flotation particle size ranges
Figure 5-25 reveals the effect of pico-nano bubbles on the flotation product particle size
distributions of -700+150 μm and -150 μm raw coal feed in the presence and absence of
pico-nano bubbles. From the cumulative particle size distribution curves in Figure 5-25
(a), the use of pico-nano bubbles increased the -700+150 μm coarse coal flotation product
particle size from 250 μm to 355 μm, which means that pico-nano bubbles greatly
improved the coarse coal particle flotation recovery. Figure 5-25 (b) depicts that the
presence of pico-nano bubbles decreased -150 μm fine/ultrafine coal flotation product
particle size from 38 to 125 μm significantly improved the fine/ultrafine coal particle
flotation recovery.
(a) -700+150 μm
0
20
40
60
80
100
150 212 250 300 355 425 500 700
Cu
mu
lati
ve
Wei
gh
t, %
Particle size, μm
-700+150 μm without
pico-nanobubble
-700+150 μm with
pico-nanobubble

123
(b) -150 μm
Figure 5- 25 Cumulative particle size distributions of clean coal with and without
pico-nano bubbles.
5.3.2.3 Effect of pico-nano bubbles on flotation ash rejection
Rejecting ash is one of the main goals in coal froth flotation. Figure 5-26 reveals the
flotation ash rejection as a function of the combustible material recovery with and
without pico-nano bubble for -700+355, -355+150, -150+75, and -75 μm size coal
particles. From Figure 5-26, the flotation ash rejection without pico-nano bubble
decreases rapidly with further increasing of the combustible material recovery after the
combustible material recovery reaches about 75%, 80%, 90%, and 90% for -700+355, -
355+150, -150+75, and -75 μm size ranges, respectively. The combustible material
recovery at the “inflection point” is 5% -10% higher in the presence of pico-nano bubbles
0
20
40
60
80
100
38 45 62 75 86 106 125 150
Cu
mu
lati
ve
Wei
gh
t, %
Particle size, μm
-150μm with pico-nanobubble
-150μm without pico-nanobubble
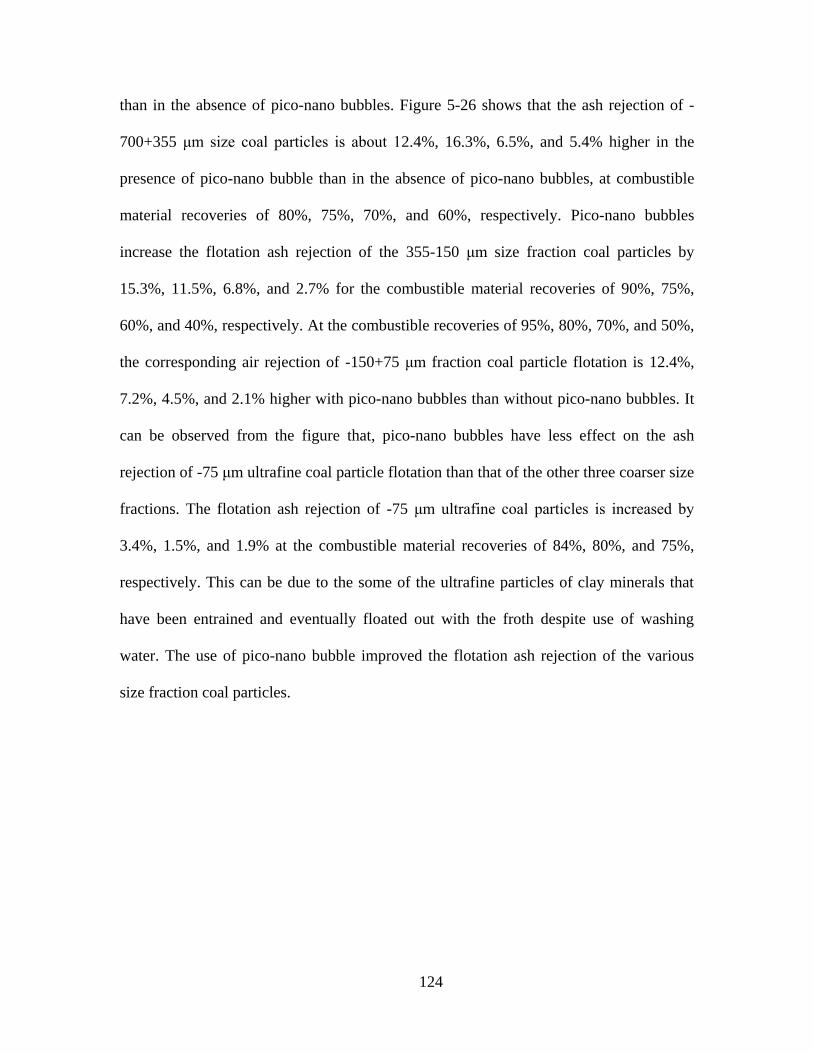
124
than in the absence of pico-nano bubbles. Figure 5-26 shows that the ash rejection of -
700+355 μm size coal particles is about 12.4%, 16.3%, 6.5%, and 5.4% higher in the
presence of pico-nano bubble than in the absence of pico-nano bubbles, at combustible
material recoveries of 80%, 75%, 70%, and 60%, respectively. Pico-nano bubbles
increase the flotation ash rejection of the 355-150 μm size fraction coal particles by
15.3%, 11.5%, 6.8%, and 2.7% for the combustible material recoveries of 90%, 75%,
60%, and 40%, respectively. At the combustible recoveries of 95%, 80%, 70%, and 50%,
the corresponding air rejection of -150+75 μm fraction coal particle flotation is 12.4%,
7.2%, 4.5%, and 2.1% higher with pico-nano bubbles than without pico-nano bubbles. It
can be observed from the figure that, pico-nano bubbles have less effect on the ash
rejection of -75 μm ultrafine coal particle flotation than that of the other three coarser size
fractions. The flotation ash rejection of -75 μm ultrafine coal particles is increased by
3.4%, 1.5%, and 1.9% at the combustible material recoveries of 84%, 80%, and 75%,
respectively. This can be due to the some of the ultrafine particles of clay minerals that
have been entrained and eventually floated out with the froth despite use of washing
water. The use of pico-nano bubble improved the flotation ash rejection of the various
size fraction coal particles.

125
Figure 5- 26 Effect of pico-nano bubble on flotation ash rejection for various
particle sizes.
5.3.2.4 Effect of pico-nano bubbles on overall performance
Figure 5-27 reveals the effect of pico-nano bubbles on the flotation product yield of four
coal particle size ranges of -700+355, -355+150, -150+75, and -75 μm. It can be observed
from the figure that the effect of pico-nano bubbles on the yield of coal particle flotation
decreases with decreasing feed particle size and increasing clean coal ash. Figure 5-27 (a)
shows the presence of pico-nano bubbles increases the -700+355 μm coal flotation
product yield by about 14.3%, 16.1%, 13.12%, 10.2% and the clean coal ash of 5.5%,
7.5%, 10%, and 13%, respectively. The pico-nano bubbles increases the -355+150 μm
clean coal yields by 14.2%, 10.3%, 10.1%, 7.6% and ash contents of 5.5%, 7.5%, 10%,
and 13%, respectively. Figure 5-27 (b) depicts that the overall product yield of -150+75
50
55
60
65
70
75
80
85
90
95
100
0 20 40 60 80 100
Ash
Rej
ecti
on
, %
Combustible Material Recovery, %
-700+355 μm with pico-nanobubble
-700+355 μm without pico-nanobubble
-355+150 μm with pico-nanobubble
-355+150 μm without pico-nanobubble
-150+75 μm with pico-nanobubble
-150+75 μm without pico-nanobubble
-75μm with pico-nanobubble
-75μm without pico-nanobubble

126
μm particle size fraction is higher than that of -75 μm particle size fraction The flotation
yield of -150+75 μm particle size fraction coal are 19.3%, 12.2%, 4.2%, and 2.8% higher
in the presence of pico-nano bubbles than in the absence of pico-nano bubbles at the
clean coal ash of 3%, 4%, 6%, and 7.5%, respectively. The use of pico-nano bubbles
increases -75 μm flotation yield by 2.4%, 8.3%, 12.3%, and 13.2%, and the clean coal ash
of 3%, 5%, 7.5%, and 10%, respectively. It can be concluded from Figure 5-27 that the
use of pico-nano bubbles increases clean coal yields at a given ash content.
Figure 5-28 (a) shows the presence of pico-nano bubble increases combustible material
recovery for -700+355μm size range of coal particles by 19.2%, 26.4%, 21.5%, 16.1%,
and clean coal ash of 5.5%, 7.5%, 10%, and 13%, respectively. The use of pico-nano
bubble increases combustible material recovery for -355+150 μm size range of coal
particle by about 23.9%, 21.3%, 19.4%, 11.7%, and clean coal ash of 5.5%, 7.5%, 10%,
and 13%, respectively. Figure 5-28 (b) shows that the combustible material recovery of -
150+75 μm particle size range of coal particle are 22.1%, 19.4%, 12.5%, and 8.9% higher
in the presence of pico-nano bubble than in the absence of pico-nano bubble, and the
clean coal ash of 3%, 4%, 6%, and 7.5%, respectively. Pico-nano bubble increase the -75
μm coal particle combustible material recovery by 23.2%, 15.4%, 8.2%, and 2.3% at the
clean coal ash content of 3%, 5%, 7.5%, and 10%, respectively. It can be seen from the
results shown above that the most significant improvement in flotation performance can
be seen in the -355+700 μm coarse coal flotation. This is because the presence of pico-
nano bubble on the coarse coal particle surfaces facilitates particle attachment to
conventional-sized bubbles.

127
(a) -700+355 and -355+150 μm
(b) -150 +75 and -75 μm
Figure 5- 27 Effect of pico-nano bubbles on flotation yield.
0
10
20
30
40
50
60
70
80
90
100
0 5 10 15 20 25 30
Cle
an
Coal Y
ield
, %
Clean Coal Ash, %
-700+355 μm with pico-nanobubble
-700+355 μm without pico-nanobubble
-355+150 μm with pico-nanobubble
-355+150 μm without pico-nanobubble
0
10
20
30
40
50
60
70
80
0 2 4 6 8 10 12 14
Cle
an
Coa
l Y
ield
, %
Clean Coal Ash, %
-75μm with pico-
nanobubble
-75μm without
pico-nanobubble
-150+75 μm
without pico-
nanobubble -150+75 μm with
pico-nanobubble

128
(a) -700+355 and -355+150 μm
(b) -150+75 and -75 μm
Figure 5- 28 Effect of pico-nano bubble on combustible material recovery.
0
10
20
30
40
50
60
70
80
90
100
0 5 10 15 20
Com
bu
stib
le M
ate
rial
Rec
over
y, %
Clean Coal Ash, %
-700+355 μm with pico-nanobubble
-700+355 μm without pico-nanobubble
-355+150 μm with pico-nanobubble
-355+150 μm without pico-nanobubble
0
10
20
30
40
50
60
70
80
90
100
0 5 10 15 20
Co
mb
ust
ible
Ma
teri
al
Rec
ov
ery, %
Clean Coal Ash, %
-75μm with pico-nanobubble
-150+75 μm with pico-nanobubble
-150+75 μm without pico-nanobubble
-75μm without pico-nanobubble

129
The pico-nano bubble on the coarse coal particles does not have sufficient buoyancy to
float the particle by themselves, but the surface of a coarse coal particle coated with pico-
nano bubble is more hydrophobic than without pico-nano bubble. The wetting film
separating the colliding convention-sized bubbles and pico-nano bubble is more unstable
than the film between the convention-sized bubbles and coarse coal particles. The
significant difference in diameter between the convention-sized bubble and pico-nano
bubble leads to a huge differential capillary pressure, which facilitates the rupture of
water films separating conventional size bubbles and pico-nano bubbles. Thus, the
presence of pico-nano bubble on coal particles surfaces accelerates the water film rupture
and bubble-particle collision. In other words, pico-nano bubbles on the surface of coal
particle act as a secondary hydrophobizing agent to enhance the flotation rate constant.
5.3.2.5 Pico-nano bubbles and nanobubbles percent effect on separation efficiency of
column flotation for bituminous coal
In order to investigate the effectiveness of pico-nano and nano bubble (bubbles smaller
than 1 μm) percent in column flotation, a specially designed flotation with static mixer
connected in series with the optimal designed venturi tube was developed for enhancing
the recovery of ultrafine (-45 μm) and coarse coal particles (-700+355 μm), which are
difficult to float with conventional flotation process. The column flotation tests were
performed under the conditions shown in Table 5-7. MIBC is used as frother in this series
of tests to adjust generation of pico-nano bubble and nano bubble percent. Various
dosage of frother was used in the tests to stabilize the bubbles and adjust pico-nano and
nanobubble percent to be generated.

130
Table 5- 7 Column flotation test conditions for bituminous coal using optimal
designed cavitation venturi tube.
Feed solids percentage 5% wt
Collector dosage 0.7 lb/ton Kerosene
Feed rate 0.4 cm/s
Gas flow rate 1.6 cm/s
Wash water rate 0.2 cm/s
The effect of pico-nano and nano bubble percent on combustible material recovery and
clean coal ash content was shown in Figure 5-29. It can be clearly seen that the
combustible material recovery increases from 82% to 90% with increasing pico-nano and
nano bubble percent from 65% to 83%, and there is a slightly decrease of combustible
material recovery after that as pico-nano and nano bubble percent increases to 100%. The
clean coal ash content, on the other hand, increases with increasing pico-nano and nano
bubble percent. The optimal percentage of pico-nano and nano bubble is about 70%, with
the minimum clean coal ash content of 11.7% and maximum combustible material
recovery of 86%.
Figure 5- 29 Combustible material recovery and clean coal ash content as a
function of Pico-nano and nano bubble percent.

131
5.3.2.6 Effect of particle size on separation efficiency and combustible material
recovery
Figure 5-30 clearly indicates that use of pico-nano bubble expanded the particle size
range for effective flotation separation.
Figure 5- 30 Particle size effect on separation efficiency and combustible material
recovery.
The most significant improvement in separation efficiency was observed with particles
smaller than 0 μm and larger than 600 μm. For example, separation efficiency was
increased by about 10% with 30 μm particles and 20% with 600 μm particles. . As for the
froth flotation of ultrafine particles, since the work of adhension Wa between a solid
particle and water, which is γ1(1 + Cosθ) (γ1 is water surface tension and θ is contact
angle), is always smaller than the work of cohension of water Wc or 2 γ1, the pico-nano
132
and nano bubble would preferentially nucleate on the surface of ultrafine particles
without collision, especially hydrophobic particles with higher contact angle (θ), which is
the most important parameter in the froth flotation of ultrafine particles (Yoon, et al. 1989;
Tao, et al. 2006a; Weber, et al. 1983).
Furthermore, the pico-nano and nano bubbles acts like a secondary collector on the
surface of coal particles, which increases the probability of adhension and reduces the
probably of detachment as a result of their lower upward velocity (Tao, et al. 2008),
that’s why the pico-nano and nano bubbles could improve the froth flotation efficiency.
But for coarse particle froth flotation, only the presence of pico-nano and nano bubbles
are not enough, and conventional sized bubbles are also needed to provide enough
levitation force for the coarse particles, which are surrounded by pico-nano and nano
bubbles, to be lift to the froth zone, eventually float out as product. , this also explains
why there is a decrease in combustible material recovery as the pico-nano and nano
bubble percent increases from 80% to 100% in Figure 5-29.
Figure 5- 31 The photo shows the clean coal (left), middlings (middle) and
tailings (right) of pico-nano bubbles flotation for Pittsburgh No.8 seam coal.

133
An example of the products of column flotation using pico-nano and nano bubbles is
given in the Figure 5-31. The photo shows that the color change dramatically from left,
the deep black color of clean coal product, to the right, which represents the tailings with
the light gray color.
5.4 Economic evaluation of the application of pico-nano bubbles in coal flotation
The main cost of applying the pico-nano bubble into the flotation system includes the
operational and capital costs. The assumptions for the economic evaluation include :
1) Assuming the average ash content of the feed is 35%.
2) The flotation feed rate is 100 ton/hour.
3) 10% solid concentration of the flotation feed.
4) In order to avoid congestion and maintain the separation efficiency, 6 venturi
tubes would be installed in parallel to process the recirculating tailings.
5) For the Pittsburgh No. 8 bituminous coal sample tested, the combustible material
recovery improvement can be as good as 25% with column flotation. To make a
conservative estimation, the recovery improvement is assumed to be 10% for
industrial application.
With all those assumptions, the calculation of cost for the pico-nano bubble application
would consist of the followings:
1) Venturi cost: the cost for one venturi tube is around $8,000 , assume it would last
about six months, so the annual cost should be $96,000.
2) Cavitation pump cost: Additional pump would be needed in the tailing
recirculation loop, and the flow rate of the pump should be 4000 GPM or 910
m3/h. A Goulds model HSU, HSUL or JCU submersible slurry pump can be used

134
to meet the requirement. And the cost for this model is about $16,000. Assume
the pump would last 4 years, then the annual cost for the pump should be $4,000.
3) Additional electricity cost: Based on our laboratory measurement, the additional
energy consumption caused by the pump should be less than 4 kwh/ton of solids
is the efficiency of the pump is 60%. Assume the unit price of the electricity if
$ 0.1/kwh, the annual cost of the electricity should be 0.1 /kwh x 4 kwh/ton x 100
ton/hour x 4320 hours/year = $172,800.
Therefore, the total annual cost of the equipment will be: $96,000 + $4,000 = $100,000.
Consider a factor of 1.1 for the miscellaneous accessories, which include valves and flow
meters, and a factor of 1.2 for the installation fees, the total capital cost becomes
$132,000. With the operational cost, the total cost for pico-nano bubble application
should be $132,000 + $172,800 = $304,800 a year.
If the flotation product of 10% clean coal ash needed to be produced, the total increase of
the flotation product by using pico-nano bubble should be: 100 ton/hour x (1-35%) x
10%/ (1-10%) = 7.2 ton/hour. At current price for clean coal of about $62/ton, the annual
revenue by pico-nano bubble application should be: 7.2 ton/hour x 4320 hours/ year x
$62/ton = $1,928,448.
Then, the net annual profit generated by pico-nano bubble application should be:
$1,928,448 - $304,800 = $ 1,623,648.

135
Chapter 6 Results and Discussions for Phosphate reverse Flotation
6.1 Measurement of frothability and froth stability
6.1.1 Effect of selected surfactant on collector frothability
In this study, pico-nano bubbles were introduced into the flotation system to improve the
flotation efficiency for coarse and fine particles. Based on previous study, it’s believed
that certain amount of frother is needed in order to generate and maintain pico-nano
bubbles in the solution. However, in phosphate industry, fatty acid plays dual functions
and works as frother and colletor for either phosphate or carbonate flotation. There is no
frother applied separately to control the bubble generation. The effects of the selected
frother (Methyl Isobutyl Carbinol) on the frothability of two selected fatty acid (CF413
and CF413B) were evaluated by measuring the froth height and froth lifetime at different
reagent dosages.
Figure 4-1 shows the frothability of fatty acid collector (CF413 and CF413B) with
selected frother (Methyl Isobutyl Carbinol) at different dosages. It can be seen that the
froth height of CF413 and CF413B alone increases with reagent dosage at gas flow rate
of 1.5 cm/s. And the frothability of CF413 is better than CF413B without the addition of
frother (MIBC). It also can be observed from Figure 4-1 that the increase of MIBC from
5 ppm to 15 ppm of the fatty acid collector in the mixture results in increasing the froth
height. The results show that the addition of surfactant can improve the frothability of the
fatty acid collector. However, it should be noted that when MIBC is mixed with CF413
or CF413B at the dosage of 10 ppm, the frothability can be significantly improved
compared to other dosages of MIBC. By adding in the frother (MIBC), the frothability
difference between CF413 and CF413B has been reduced to almost negligible level when

136
the dosage of MIBC is higher than 10 ppm. During this test, the overall flotation column
is almost filled up with pico-nano and nanobubbles when the collector dosage is greater
than 1 lb/ton. It indicates that a large number of pico-nano bubbles and nanobubbles have
been generated which would greatly increase the possibility of collision, and eventually
improve the flotation separation efficiency.
Figure 6- 1 Froth height as a function of collector dosage with different
surfactants.
6.1.2 Effect of selected surfactant on collector froth stability
The froth lifetime as a function of collector dosage with selected surfactant is shown in
Figure 6-2. It shows that the froth lifetime increases with increasing the collector dosage.
0
20
40
60
80
100
120
140
160
180
0.4 0.6 0.8 1 1.2 1.4 1.6 1.8 2
Fro
th h
eig
ht,
cm
Collector dosage, lb/ton
CF 413
CF 413 B
CF 413 + 5 ppm MIBC
CF 413B + 5 ppm MIBC
CF 413 + 10 ppm MIBC
CF 413B + 10 ppm MIBC
CF 413 + 15 ppm MIBC
CF 413B + 15 ppm MIBC

137
Without the addition of MIBC, the froth stability of CF413 is better than CF413B. With
the addition of MIBC, the froth lasts longer than that without any frother. It can also be
seen from Figure 6-2 that there is a significant increase of the froth lifetime when CF413
or CF 413B is mixed with MIBC at the dosage of 10 ppm or higher. With the increasing
of the dosage of frother (MIBC), the froth lifetime difference reduces significantly,
especially when the dosage of MIBC increases from 5 ppm to 10 ppm.
Figure 6- 2 Froth life time as a function of collector dosage with different
surfactants.
6.1.3 Effect of different collector on dolomite flotation
In order to select better reagents for phosphate reverse flotation study, single factor
experiment tests were conducted in the pico-nano bubble column flotation system by
0
2
4
6
8
10
12
14
0 0.5 1 1.5 2 2.5
Fro
th l
ife
tim
e, m
in
Collector dosage, lb/ton
CF 413
CF 413 B
CF 413 + 5 ppm MIBC
CF 413B + 5 ppm MIBC
CF 413 + 10 ppm MIBC
CF 413B + 10 ppm MIBC
CF 413 + 15 ppm MIBC
CF 413B + 15 ppm MIBC

138
varying dosage of collector and collector-surfactant mixtures. Figure 6-3 shows the effect
of the different collector and selected surfactant on the yield of the float in dolomite
flotation.
Figure 6- 3 Effect of selected surfactants on the yield of the floats using different
collector with and without surfactant.
It shows that the yields for both CF413 and CF413B do not have much difference with or
without surfactant when the dosages are in the range of 0.8 to 1.2 lb/ton. At low collector
dosage in the range of 0.4 to 0.8 lb/ton, the yield has been significantly increased by
using CF413 mixed with 10 ppm MIBC. However, when the collector dosage improves
to high collector dosage, an opposite trend has been found. At collector dosage of 1 lb/ton,
the weight percentage of the floated dolomite was the same for the mixture of 10 ppm
MIBC and CF413/CF 413B. However, the yield of dolomite is significantly increased
5
7
9
11
13
15
17
19
21
23
25
0.4 0.6 0.8 1 1.2 1.4 1.6 1.8 2
Wt.
%
Collector dosage, lb/ton
CF 413
CF 413 B
CF 413 + 10 ppm MIBC
CF 413B + 10 ppm MIBC
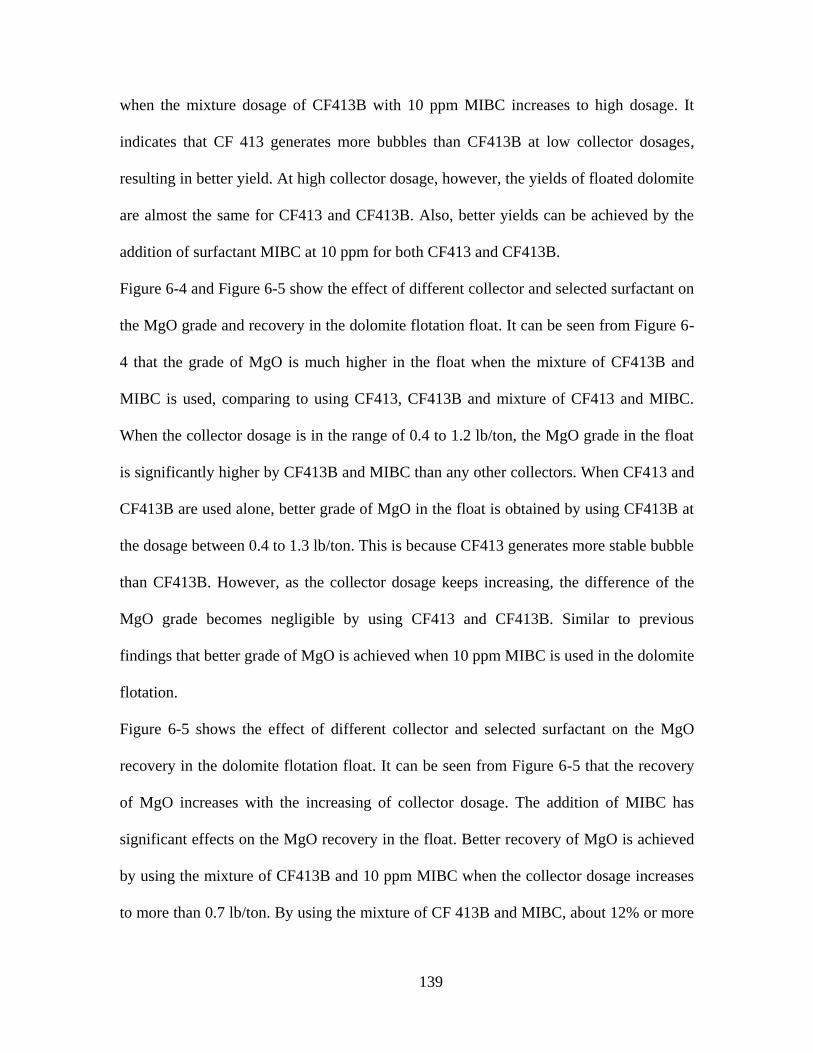
139
when the mixture dosage of CF413B with 10 ppm MIBC increases to high dosage. It
indicates that CF 413 generates more bubbles than CF413B at low collector dosages,
resulting in better yield. At high collector dosage, however, the yields of floated dolomite
are almost the same for CF413 and CF413B. Also, better yields can be achieved by the
addition of surfactant MIBC at 10 ppm for both CF413 and CF413B.
Figure 6-4 and Figure 6-5 show the effect of different collector and selected surfactant on
the MgO grade and recovery in the dolomite flotation float. It can be seen from Figure 6-
4 that the grade of MgO is much higher in the float when the mixture of CF413B and
MIBC is used, comparing to using CF413, CF413B and mixture of CF413 and MIBC.
When the collector dosage is in the range of 0.4 to 1.2 lb/ton, the MgO grade in the float
is significantly higher by CF413B and MIBC than any other collectors. When CF413 and
CF413B are used alone, better grade of MgO in the float is obtained by using CF413B at
the dosage between 0.4 to 1.3 lb/ton. This is because CF413 generates more stable bubble
than CF413B. However, as the collector dosage keeps increasing, the difference of the
MgO grade becomes negligible by using CF413 and CF413B. Similar to previous
findings that better grade of MgO is achieved when 10 ppm MIBC is used in the dolomite
flotation.
Figure 6-5 shows the effect of different collector and selected surfactant on the MgO
recovery in the dolomite flotation float. It can be seen from Figure 6-5 that the recovery
of MgO increases with the increasing of collector dosage. The addition of MIBC has
significant effects on the MgO recovery in the float. Better recovery of MgO is achieved
by using the mixture of CF413B and 10 ppm MIBC when the collector dosage increases
to more than 0.7 lb/ton. By using the mixture of CF 413B and MIBC, about 12% or more

140
dolomite can be floated at the collector dosage of 2 lb/ton, comparing with using CF413,
CF413B or the mixture of CF413 and MIBC.
Figure 6- 4 Effect of selected surfactants on the MgO grade in the float using
different collector with and without surfactant.
Figure 6- 5 Effect of selected surfactants on the MgO recovery in the float using
different collector with and without surfactant.
8
8.4
8.8
9.2
9.6
10
10.4
10.8
11.2
11.6
12
0.4 0.6 0.8 1 1.2 1.4 1.6 1.8 2
Mg
O g
rad
e in
flo
at,
%
Collector dosage, lb/ton
CF 413
CF 413 B
CF 413 + 10 ppm MIBC
CF 413B + 10 ppm MIBC
10
20
30
40
50
60
70
80
90
100
0.4 0.6 0.8 1 1.2 1.4 1.6 1.8 2
Mg
O r
ecov
ery i
n f
loa
t, %
Collector dosage, lb/ton
CF 413
CF 413 B
CF 413 + 10 ppm MIBC
CF 413B + 10 ppm MIBC

141
Figure 6-6 shows the effect of different collector and selected surfactant on the P2O5
grade in the dolomite flotation float. The P2O5 grade decreases with the increasing of
collector dosage from 0.4 lb/ton to 1.2 lb/ton. After which the P2O5 grade remain
essentially constant except for the mixture of CF413B/CF413 and MIBC. The product of
dolomite flotation contains much lower P2O5 grade by using the mixture of CF413B and
MIBC than using any other collectors.
Figure 6-7 shows the tendency of P2O5 loss in the dolomite flotation float with and
without surfactant. At collector dosage less than 1.4 lb/ton, P2O5 loss is higher by using
CF413. It should be noted that CF413 improves the selectivity in dolomite flotation,
however, it has little effect on the collecting ability. When the mixture of CF413B and
MIBC is used, the float of dolomite flotation contains less P2O5, resulting in less P2O5
loss in the tailings.
Figure 6- 6 Effect of selected surfactants on the P2O5 grade in the float using
different collector with and without surfactant.
5
6
7
8
9
10
11
12
13
14
15
16
17
18
19
20
0.4 0.6 0.8 1 1.2 1.4 1.6 1.8 2
P2O
5 g
rad
e in
flo
at,
%
Collector dosage, lb/ton
CF 413
CF 413 B
CF 413 + 10 ppm MIBC
CF 413B + 10 ppm MIBC

142
Figure 6- 7 Effect of selected surfactants on the P2O5 loss in the float using
different collector with and without surfactant.
Figure 6-8 shows the effect of different collector and selected surfactant on the MgO
grade in the dolomite flotation sink. It can be seen from the curves that MgO grade
decreases with increasing the collector dosage. At collector dosage less than 0.8 lb/ton,
the lowest grade of MgO in the tailings is obtained by using the mixture of CF413 and
MIBC. As the collector dosage keeps increasing from 0.8 to 1.6 lb/ton, the MgO grade in
the tailings decreases significantly and reduces to the lowest grade of MgO by using the
mixture of CF413B and MIBC. When the collector dosage is higher than 1.6 lb/ton, all
the curves level off. It implies that there is no significant effect on MgO grade by further
increasing the collector doage above this dosage.
0
2
4
6
8
10
12
14
16
18
0.4 0.6 0.8 1 1.2 1.4 1.6 1.8 2
P2O
5 lo
ss i
n f
loa
t, %
Collector dosage, lb/ton
CF 413
CF 413 B
CF 413 + 10 ppm MIBC
CF 413B + 10 ppm MIBC

143
Figure 6- 8 Effect of selected surfactants on the MgO grade in the sink using
different collector with and without surfactant.
Figure 6-9 shows the effect of different collector and selected surfactant on the MgO
recovery in the dolomite flotation sink. There is a general trend that MgO recovery in the
sink decreases with increasing the collector dosage for all the collectors with or without
MIBC. As the collector dosage keeps increasing, the MgO recovery in the tailings
decreases significantly and reduces to the lowest recovery of MgO when the mixture of
CF413B and MIBC is used. It can be seen from the figure that the significance of the
collector with or without MIBC in improving dolomite flotation is in the order as follows:
Mixture of CF413B and MIBC > Mixture of CF413 and MIBC > CF413 > CF413B.
1
1.25
1.5
1.75
2
2.25
2.5
2.75
3
0.4 0.6 0.8 1 1.2 1.4 1.6 1.8 2
Mg
O g
rad
e in
sin
k, %
Collector dosage, lb/ton
CF 413
CF 413 B
CF 413 + 10 ppm MIBC
CF 413B + 10 ppm MIBC

144
Figure 6- 9 Effect of selected surfactants on the MgO recovery in the sink using
different collector with and without surfactant.
6.2 Design of Experiment and Statistical Analysis Method
6.2.1 Seven-factor two-level fractional factorial experimental design
The operation parameters for pico-nanbubble column flotation being tested include pH,
collector dosage, frother dosage, feed rate, feed solid percentage, air flow rate and wash
water flow rate. The experiment designs method is described in section 4.3.8. The main
factors are evaluated and tested for significance as shown in Table 6-1. The main effects
of collector dosage, frother dosage, feed rate, solids concentration and pH on SIp index
are more significant than gas flow rate and superficial wash water rate, which is similar to
previous findings. The orders of main effects are:
Collector dosage > Frother dosage > pH > Feed solids concentration > Feed rate > Gas
flow rate > Superficial wash water rate.
1
6
11
16
21
26
31
36
41
46
51
56
61
66
0.4 0.6 0.8 1 1.2 1.4 1.6 1.8 2
Mg
O r
eco
ver
y i
n s
ink
, %
Collector dosage, lb/ton
CF 413
CF 413 B
CF 413 + 10 ppm MIBC
CF 413B + 10 ppm MIBC

145
Table 6- 1 Estimated coefficients, t-ratios and p-values.
Term
SIp model
Estimate
Pseudo
t-Ratio
Pseudo
p-Value
Intercept 63.935 - -
A 3.825 5.02 0.0270*
B 2.39 3.14 0.0723
C 0.5075 0.67 0.5649
D -0.9375 -1.23 0.3277
E -3.9975 -5.25 0.0245*
F -0.3 -0.39 0.7267
G -0.1425 -0.19 0.8666
Note: * means significant factors.
Figure 6- 10 Comparison of the observed responses and predicted responses.
Based on the statistical analysis results, the reduced model in terms of the factor levels is:
SIp Index (%) = 63.935 ±3.825× A ± 2.39× B ± 0.5075 × C ± (-0.9375) ×D ± (-3.9975)
×E ± (-0.3) ×F ± (-0.1425) ×G (6-1)

146
The comparison of the observed responses and predicted responses with reduced model
are shown in Figure 6-10. It shows that the model for SIp index can adequately describe
the effects of operating parameter on the response variables.
Figure 6-11 depicts the effect of pH and collector dosages with SIp index as separation
responses. The response surface suggests that the effect of collector dosage is more
significant than pH and the area of the highest SIp index value was at the low level of
collector dosage and pH value. The SIp index decreased by about 6% as the collector
dosage increased from 1.5 to 2.0 lb/ton. Also, the selectivity index decreased sharply with
the increase of pH value.
Figure 6- 11 Effect of pH and collector dosages on SIp index.
Figure 6-12 depicts the effect of feed rate and collector dosages with SIp index as
separation responses. The response surface suggests that the area of the highest SIP index

147
was at the low level of feed rate. The SIp index increased by about 2% as the feed rate
decreased from 0.4 to 0.3 cm/s.
Figure 6- 12 Effect of feed rate and collector dosages on SIp index.
Figure 6-13 depicts the effect of feed solid concentration and collector dosages with SIp
index as separation responses. The response surface depicts that the area of the highest
SIp index was obtained at the high level of solids concentration. The SIp index increased
by about 5% as the solids concentration increased from 15 to 20 % at high level of
collector dosage, and the SIp index increasement reduced to about 2% at low level of
collector dosage. However, the SIp index was much higher at low level of collector
dosage than which at high level.

148
Figure 6- 13 Effect of feed solid concentration and collector dosages on SIp index.
Figure 6-14 depicts the effect of frother dosages and collector dosages with SIp index as
separation responses. The SIp index increased by about 7% as the frother dosages
increased from 4 to 7 ppm. It is not surprising to find that the best separation selectivity
index is observed at high level of frother dosage. In order to maintain the pico-nano
bubbles in the solution, certain amount of frother must be applied. According to the
results, 4 ppm of frother is not enough to reduce the surface tension and keep the
generated pico-nano buble in the solution. So, for the next step of design of experiment,
the frother dosages should be increased.

149
Figure 6- 14 Effect of frother dosages and collector dosages on SIp index.
Figure 6-15 and 6-16 depict the effect of air flow rate, wash water rate and collector
dosages with SIp index as separation responses. The response surface suggests that The
gas flow rate and wash water rate had no significant effects on the separation selectivity
(SIp ) index. The separation selectivity index barely changes according to wash water rate
and air flow rate. So, for the next step of design of experiment, these two factors can be
eliminated and keep them constant during the test.

150
Figure 6- 15 Effect of gas flow rate and collector dosages on SIp index.
Figure 6- 16 Effect of wash water flow rate and collector dosages on SIp index.

151
The significance of each factor can also be calculated by multiplying each column of plus
and minus signs in the original experimental design shown in Table 4-10, adding them up
and then dividing by [( No. of runs)/2]. For example, the significance of collector dosage,
Ec, in fractional factorial design can be calculated as follows:
Ec = (SI1 – SI2 – SI3 + SI4 + SI5 –SI6 – SI7 + SI8) / (8/2)
= (68.1 – 69.38 – 67.44 + 52.85 + 61.99 – 72.26 – 61.96 + 57.5) / 4
= - 7.65
Table 6-2 shows the significance of the each factor using SIp index as response surface in
factorial factor design. Due to minimum runs were conducted, only the main effects can
be estimated. It can be seen from table 6-2 that five factors are more significant because
the estimates effect values are relatively large.
Table 6- 2 Main Effects of the Factors for Factorial Design.
Factors Effect
Collector dosage -7.65
pH -4.78
Feed rate -1.02
Feed solid concentration 1.87
Frother dosage 7.99
Air flow rate 0.60
Wash water rate 0.29
The significance of the main effects are as follows:
(1) Effect of collector dosage: The low level of collector dosage yields an effect of
SIp value 7.65 higher than the high level of collector dosage. This effect is
relatively larger than others. It means collector dosage should be decreased.

152
(2) Effect of pH: The low level of pH value yields an effect of SIp value 4.78 higher
than the high level of pH value. It indicates that the pH value should be decreased
for next set of experiment.
(3) Effect of feed rate: 0.3 cm/s feed rate yields an effect of SIp value 1.02 higher
than a feed rate of 0.4 cm/s. It shows that the feed rate should be decreased.
(4) Effect of feed solid concentration: 20% feed solid concentration yields an effect
of SIp value 1.87 higher than 15% feed solid concentration. It indicates that the
feed solid concentration should be increased further.
(5) Effect of frother dosage: 7 ppm frother dosage yields an effect of SIp value 7.99
higher than the frother dosage of 4 ppm. This effect is the largest relatively to
others. It means that the frother dosage should be further increased for next set of
experiment.
(6) Effect of air flow rate: 2.5 cm/s air flow rate yields an effect of SIp value similar
to that of 1.5 cm/s air flow rate. There is no significant effect when the air flow
rate is changing from 1.5 cm/s to 2.5 cm/s.
(7) Effect of wash water rate: 0.1 cm/s wash water rate yields an effect of SIp value
close to that of 0.3 cm/s wash water rate. There is no much difference when the
wash water rate changed from 0.1 cm/s to 0.3 cm/s.
The analysis results from the graphical method and the calculation results are almost the
same. Based on the first stage fractional factorial design, step-two experiment was
conducted by selecting the most significant factors, including collector dosage, frother
dosage, pH value, feed solid concentration and feed rate.

153
6.2.2 Five-factor two-level fractional factorial experimental design
The statistic analysis data in Table 6-3 shows that statistically significant factors include
pH, collector dosage, frother dosage, feed solids concentration and feed rate. The data
clearly shows the importance of pH in determining SIp, as indicated by the Probability >
|t| values less than 0.0378 when assessing the estimated coefficient. The orders of main
effects are:
pH > Collector dosage > Frother dosage > Feed rate > Feed solids concentration .
Table 6- 3 Estimated coefficients, t-ratios and p-values.
Term SIp model
Estimate t Ratio Prob>|t|
Intercept 68.815 177.49 <0.0001*
A 1.9375 5.00 0.0378*
B -1.4925 -3.85 0.0613
C -0.7575 -1.95 0.1899
D 0.255 0.66 0.5783
E -0.9325 -2.41 0.1380
Note: * means significant factors.
Table 6-4 shows the analysis of variance (ANOVA). DF is the degree of freedom, SS is
the sum of squares and MS is the mean square. The F-statistic also known as the F-ratio,
is a measure for the strength of the regression. The F-ratios are calculated by comparing
the model mean square (MSR) with the error mean square (MSE), F = MSR / MSE =
( SSR /1)/(s2e). Here MSR is the predicted mean-suqared-anomaly and MSE is the mean-
squared-error. A strong relationship between responses and independent parameters gives
a high F-ratio.
Table 6- 4 ANOVA table with SIp index as responses.
Source DF SS MS F- Ratio
Model 5 59.9188 11.9838 9.9657
Error 2 2.4050 1.2025 Prob. > F
C. Total 7 62.3238 --- 0.0937

154
Based on the statistical analysis results, the reduced model in terms of the factor levels is:
SIp index (%) = 68.815 ± 1.9375 × A ± -1.4925) × B ± (-0.7575) × C ± D × 0.255 ± E ×
(-0.9325) (6-2)
The coefficient of determination (R2) is other measures for expressing the goodness-of-fit
of the regression model. R2 is 1 for a perfect regression and zero for a completely useless
fit (no correlation between responses and independent parameters). The comparison of
the observed responses and predicted responses are shown in Figure 6-17. The coefficient
of determination (R2) for this test is 0.96, which shows that the model for SIp index can
adequately describe the effects of operating parameter on the response variables.
Figure 6- 17 Comparison of the observed responses and predicted responses.
Figure 6-18 depicts the effect of pH and feed rate with SIp index as separation responses.
The response surface suggests that the effect of pH is more significant than feed rate and
the area of the highest SIp index value was obtained at the high level of feed rate and low

155
level of pH value. The SIp index decreased by about 3.5% as the pH increased from 5.5
to 6.0. However, the selectivity index increased with the increase of feed rate value.
Figure 6- 18 Effect of pH and feed rate on SIp index.
Figure 6-19 depicts the effect of frother dosages and pH with SIp index as separation
responses. the area of the highest SIp index value was achieved at the low level of frother
dosage and low level of pH value. The SIp index decreased by about 1.5% as the frother
dosages increased from 7 to 10 ppm. This is because the overdose of the frother
deteriorates the selectivity of the pico-nano bubbles flotation by generating too many
bubbles in the flotation system. In order to maintain the selectivity of pico-nano bubble in
the flotation system, low level of frother dosage should be used.

156
Figure 6- 19 Effect of frother dosage and pH on SIp index.
Figure 6-20 depicts the effect of collector dosage and pH with SIp index as separation
responses. The response surface depicts that the area of the highest SIp index was
obtained at the high level of collector dosage. The SIp index increased by about 4.5% as
the collector dosage increased from 1 to 1.5 lb/ton at low level of pH value, and the SIp
index increasement reduced to about 3% at high level of pH value. However, the SIp
index was much higher at low level of pH value than which at high level.

157
Figure 6- 20 Effect of collector dosages and pH on SIp index.
Figure 6- 21 Effect of feed solid concentration and pH on SIp index.

158
Figure 6-21 depicts the effect of feed solids concentration and pH value with SIp index as
separation responses. The response surface suggests that the feed solids concentration had
no significant effects on the separation selectivity (SIp) index. The separation selectivity
index (SIp) barely changes when the feed solids concentration is changing.
Table 6-5 shows the significance of the each factor using SIp index as response surface in
factorial factor design. The results of main effects from step-two are much smaller than
those of step-one experiment. It can be seen from table 6-5 that two factors, pH value and
collector dosage, are more significant because the estimates effect values are relatively
larger.
Table 6- 5 Main Effects of the Factors for Factorial Design.
Factors Effect
Collector dosage 2.99
pH -3.87
Feed rate 1.52
Feed solid concentration -0.51
Frother dosage -1.87
The significance of the main effects are as follows:
(1) Effect of collector dosage: The high level of collector dosage yields an effect of
SIp value 2.99 higher than the low level of collector dosage. This effect is
relatively larger than others. It means collector dosage should be increased.
(2) Effect of pH: The low level of pH value yields an effect of SIp value 3.87 higher
than the high level of pH value. This effect is the largest relatively to others. It
indicates that the pH value should be decreased for next set of experiment.

159
(3) Effect of feed rate: 0.3 cm/s feed rate yields an effect of SIp value 1.52 higher
than a feed rate of 0.2 cm/s.
(4) Effect of feed solid concentration: 20% feed solid concentration yields an effect
of SIp value 0.51 higher than 25% feed solid concentration. It indicates that the
feed solid concentration should be increased further. There is no much difference
when the wash water rate changed from 20% to 25%.
(5) Effect of frother dosage: 7 ppm frother doosage yields an effect of SIp value 7.99
higher than the frother dosage of 10 ppm. It means that the frother dosage should
be further increased for next set of experiment.
The analysis results from the graphical method and the calculation results are almost the
same. Based on the second stage fractional factorial design, the optimum operation
conditions could be achieved at high level of collector, within 1 and 2 lb/ton, low level
of pH, around 5.5, high level of feed rate, 0.3 cm/s, low level of feed solid concentration,
20%, and low level of frother dosage, 7 ppm. Besides, the less significant factors of air
flow rate should be set at 1.5 cm/s, and the wash water rate should be set at 0.1 cm/s.
6.2.3 Single factor experimental test
In order to refine the optimum operation conditions, single factor experiments are
conducted based on the results from two stages of design of experiment. The factors
being tested are pH and collector dosage, while the other factors are fixed as follows:
Feed rate 0.3 cm/s, feed solid concentration 20%, frother dosage 7ppm, air flow rate 1.5
cm/s, and the wash water rate 0.1 cm/s.

160
6.2.3.1 Collector dosage effect
The effect of collector dosage on the combustible material recovery and clean coal ash
content is given in Figure 6-22. It can be seen that, the MgO product quality deteriorated
as the collector dosage increased. Figure 6-22 also shows the results of MgO recovery as
a function of collector dosage. The results indicate that the MgO recovery increases with
increasing the collector dosage. It is noted that the MgO grade in the sink decreases from
1.3% to 0.94%, and the MgO recovery in the float increases from 68.26% to 81.17%,
while the collector dosage increases from 1 lb/ton to 1.8 lb/ton. No significantly
increasing in MgO grade and recovery as the collector dosage keeps increasing from 1.8
to 2.0. The optimal collector dosage is found at 1.8 lb/ton, with the optimal MgO grade
and recovery at 0.94% and 81.17%, respectively.
Figure 6- 22 MgO grade in the sink and MgO recovery in the dolomite flotation
float as a function of collector dosage.
0
0.2
0.4
0.6
0.8
1
1.2
1.4
1.6
1.8
2
50
54
58
62
66
70
74
78
82
86
0.8 1.0 1.2 1.4 1.6 1.8 2.0 2.2
Mg
O g
rad
e in
th
e si
nk
, %
Mg
O r
eco
ver
y i
n t
he
flo
at,
%
Collector dosage, lb/ton
MgO recovery
MgO grade

161
The effects of collector dosage on the P2O5 grade and recovery in the dolomite flotation
sink and the separation selectivity index (SIp) are given in Figure 6-23. Over the tested
range of collector dosage range of 1.0 to 2.0 lb/ton, P2O5 recovery is 89.61% to 91.80%,
P2O5 grade is 28.82% to 29.89% and separation selectivity index content is 66.06 to 74.02.
The P2O5 grade and separation selectivity index increase as the collector dosage increases
from 1.0 lb/ton to 1.8 lb/ton. The SIp keeps almost level during this collector dosage
range. As the collector dosage keeps increasing from 1.8 lb/ton to 2.0 lb/ton, the P2O5
recovery and SIp decreases while the P2O5 grade keeps unchanged. In order to maximize
the separation selectivity index, P2O5 grade and P2O5 recovery, the optimal collector
dosage has been found at 1.8 lb/ton, with SIp of 74.02%, P2O5 grade of 29.89 % and P2O5
recovery of 91.20%.
Figure 6- 23 P2O5 grade and recovery in the dolomite flotation sink and the
separation selectivity index as a function of collector dosage.
20
22
24
26
28
30
32
34
50
55
60
65
70
75
80
85
90
95
0.8 1.0 1.2 1.4 1.6 1.8 2.0 2.2
P2O
5 g
rad
e in
th
e si
nk
, %
P2O
5 r
ecov
ery
in
th
e si
nk
(%
) a
nd
SIP
Collector dosage, lb/ton
SIp
P2O5 recovery
P2O5 grade

162
6.2.3.2 pH effect
The optimum pH for dolomite flotation should be around 5.5 according to previous
experiments, which is similar to the findings reported by Somasundaran et al. (1987).
Figure 6-24 presents the MgO grade in the sink and MgO recovery in the dolomite
flotation float as a function of pH. It shows that both MgO grade and recovery deteriorate
with the increase of flotation pH. At pH 5.0, MgO grade in the sink is 1.23%. When the
pH is increased from 5.0 to 5.4, MgO grade is decreased to 0.98%. However, the MgO
recovery almost keeps constant at 76.4% within this pH range. It drops to 71.48% as the
pH increases to 5.7. In order to maximize the MgO recovery and minimize the MgO
grade in the sink as well, the optimal value for pH should be fixed at 5.4.
Figure 6- 24 MgO grade in the sink and MgO recovery in the dolomite flotation
float as a function of pH.
0
0.2
0.4
0.6
0.8
1
1.2
1.4
1.6
1.8
2
50
54
58
62
66
70
74
78
82
4.9 5.0 5.1 5.2 5.3 5.4 5.5 5.6 5.7 5.8
Mg
O g
rad
e in
th
e si
nk
, %
Mg
O r
eco
ver
y i
n t
he
flo
at,
%
pH
MgO recovery
MgO grade
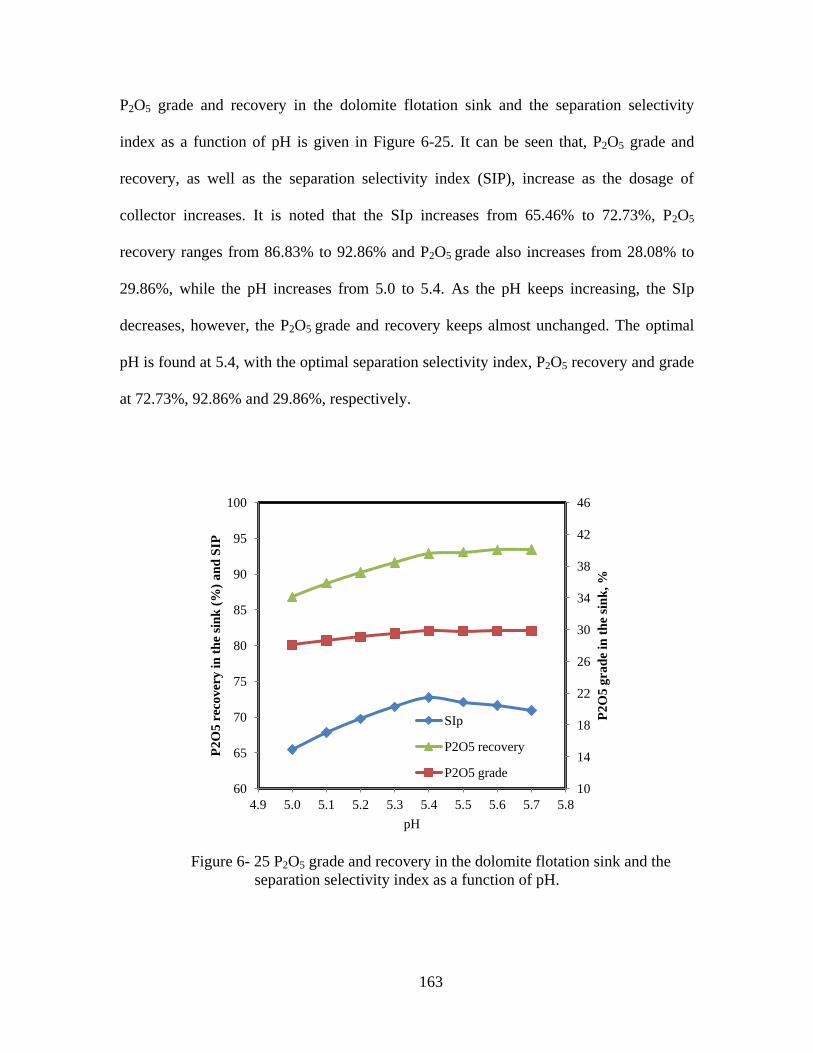
163
P2O5 grade and recovery in the dolomite flotation sink and the separation selectivity
index as a function of pH is given in Figure 6-25. It can be seen that, P2O5 grade and
recovery, as well as the separation selectivity index (SIP), increase as the dosage of
collector increases. It is noted that the SIp increases from 65.46% to 72.73%, P2O5
recovery ranges from 86.83% to 92.86% and P2O5 grade also increases from 28.08% to
29.86%, while the pH increases from 5.0 to 5.4. As the pH keeps increasing, the SIp
decreases, however, the P2O5 grade and recovery keeps almost unchanged. The optimal
pH is found at 5.4, with the optimal separation selectivity index, P2O5 recovery and grade
at 72.73%, 92.86% and 29.86%, respectively.
Figure 6- 25 P2O5 grade and recovery in the dolomite flotation sink and the
separation selectivity index as a function of pH.
10
14
18
22
26
30
34
38
42
46
60
65
70
75
80
85
90
95
100
4.9 5.0 5.1 5.2 5.3 5.4 5.5 5.6 5.7 5.8
P2
O5
gra
de
in t
he
sin
k, %
P2O
5 r
eco
ver
y i
n t
he
sin
k (
%)
an
d S
IP
pH
SIp
P2O5 recovery
P2O5 grade

164
6.2.4 Amine flotation to remove silica impurity
Under the operation conditions of pH 5.4, collector dosage 1.8 lb/ton of feed, feed rate
0.3 cm/s, feed solid concentration 20%, frother dosage 7 ppm, air flow rate 1.5 cm/s, and
the wash water rate 0.1 cm/s. The underflow of column or mechanical cell flotation after
dolomite flotation is collected for silica amine flotation. The procedure is described in
section 4.3.9. Three column flotation tests are conducted with and without pico-nano
bubble flotation column/ regular mechanical cell and the underflow of the flotation is
collected for silica flotation tests in order to compare the difference of the test results
with and without pico-nano bubble. The amine flotation is carried out by using CA 1250
of 1 lb/ton and Kerosene of 0.2 lb/ton as collector. The material balance is given in
Table 6-6. It can be seen that, in the presence of pico-nano bubble, more dolomite has
been removed in the float of dolomite flotation, reducing the MgO content in the final
phosphate concentrate. The final composite phosphate concentrate contains 33.15%
P2O5, 0.87% MgO and 4.25% acid insoluble with the overall P2O5 recovery of 93.76%
when Pico-nano bubble flotation column is used. In the absence of pico-nano bubble, the
product of column flotation would only produce the composite phosphate concentrate
with 27.86% of P2O5, 1.55% MgO and 5.00% acid insoluble with the overall P2O5
recovery of 82.68%. Also, the product of mechanical cell flotation is not as good as that
of pico-nano bubble column flotation. The test results indicate that the separation
selectivity of dolomite flotation has been greatly improved by introducing pico-nano
bubble into flotation system.

165
Table 6- 6 Material balance of dolomite flotation followed by silica amine flotation.
Condition Product Wt., % Grade, % Recovery, %
P2O5 Mg A.I. P2O5 MgO A.I.
With pico-nano bubble flotation
column for dolomite flotation
Dolomite float 19.13 6.90 13.98 8.25 5.24 81.03 11.66
silica float 9.65 2.61 0.04 92.53 1.00 0.12 65.98
sink 58.35 33.88 0.85 3.59 78.50 15.03 15.48
- 38 um fines 12.87 29.86 0.98 7.23 15.26 3.82 6.88
Composite conc. 71.22 33.15 0.87 4.25 93.76 18.85 22.36
Head 100.00 25.18 3.30 13.53 100.00 100.00 100.00
Without pico-nano bubble flotation
column for dolomite flotation
Dolomite float 18.13 21.92 12.35 10.59 15.90 66.61 14.11
silica float 9.86 3.61 0.07 82.03 1.42 0.21 59.43
sink 58.99 28.88 1.52 4.29 68.16 26.68 18.59
- 38 um fines 13.02 27.86 1.68 8.23 14.51 6.51 7.87
Composite conc. 72.01 28.70 1.55 5.00 82.68 33.18 26.47
Head 100.00 24.99 3.36 13.61 100.00 100.00 100.00
Without pico-nano bubble mechanical
cell for dolomite flotation
Dolomite float 13.13 28.92 13.58 12.72 15.18 53.57 12.30
silica float 8.85 4.05 0.11 78.53 1.43 0.29 51.20
sink 67.15 26.88 1.95 5.78 72.15 39.34 28.60
- 38 um fines 10.87 25.86 2.08 9.86 11.24 6.79 7.90
Composite conc. 78.02 26.74 1.97 6.35 83.39 46.14 36.49
Head 100.00 25.02 3.33 13.57 100.00 100.00 100.00

166
6.2.5 Correlation between grade and recovery
The relationship between P2O5 grade and P2O5 recovery are plotted in Figure 6-26. It
shows that the phosphate concentrate with much higher P2O5 recovery is obtained at the
same P2O5 grade. Both the P2O5 grade and P2O5 recovery have been greatly improved in
the presence of pico-nano bubbles. Not only the collecting ability but also the selectivity
of dolomite flotation has been improved significantly by using pico-nano bubble in the
flotation system. It acts as a secondary collector, bridging between hydrophobic and
conventional bubbles, which can significantly improve the flotation recovery of
hydrophobic particles by increasing the probability of collision and attachment, reducing
the probability of detachment at the meanwhile.
Figure 6- 26 Relationship between P2O5 grade and P2O5 recovery in the sink
product of dolomite flotation.
70
75
80
85
90
95
23 26 29 32 35
P2O
5 r
eco
ver
y
P2O5 grade
With pico-nanobubble
Without pico-nanobubble

167
6.2.6 Effect of pico-nano bubbles on P2O5 recovery of varying sizes
The effect of pico-nanobubles on the flotation recovery of different size phosphate
particles of different sizes are shown in Figure 6-27. The data indicates that pico-nano
bubbles not only improved the flotation recovery of all phosphate particles but also
increased the corresponding product grade. The flotation recovery increases from 5% up
to 14% as the particles size increases from 75 μm to 700 μm, which indicates that pico-
nano bubbles have more significant effect on coarser phosphate particles than on finer
particles.
Figure 6- 27 P2O5 grade and recovery in the dolomite flotation sink and the
separation selectivity index as a function of particle size.
Figure 6-28 – 6-29 show P2O5 recovery as a function of P2O5 grade for -700 +150 μm
and - 150 μm phosphate particles, respectively. The P2O5 content in flotation product of
all size fractions in the presence of pico-nano bubbles are much higher than that in the
10
15
20
25
30
35
40
45
50
70
74
78
82
86
90
94
98
0 100 200 300 400 500 600 700 800
P2O
5 g
rad
e, %
P2O
5 r
eco
ver
y, %
Particle size, μm
P2O5 recovery with pico-nanobubble
P2O5 recovery without pico-nanobubble
P2O5 grade with pico-nanobubble
P2O5 grade without pico-nanobubble

168
sbsence of pico-nano bubbles. It can be seen from the figures that the flotation recovery
of P2O5 has been greatly improved, meanwhile, the grade of the flotation product has
been significantly increased with pico-nano bubbles.
Figure 6- 28 P2O5 grade vs. P2O5 recovery for -700 +150μm phosphate particles
with and without pico-nano bubbles.
Figure 6- 29 P2O5 grade vs. P2O5 recovery for -150 μm phosphate particles with
and without pico-nano bubbles.
70
75
80
85
90
95
26 29 32 35
P2O
5 r
eco
ver
y
P2O5 grade
With pico-nanobubble
Without pico-nanobubble
70
75
80
85
90
95
26 29 32 35
P2O
5 r
ecov
ery
P2O5 grade
With pico-nanobubble
Without pico-nanobubble

169
6.3 Economic evaluation of pico-nano bubble enhanced phosphate reverse flotation
The main cost of applying the pico-nano bubble into the phosphate reverse flotation
system includes the operational and capital costs. The assumptions for the economic
evaluation include:
1) Assuming the P2O5 of the feed is 25%.
2) The flotation feed rate is 100 ton/hour.
3) 20% solid concentration of the flotation feed.
4) In order to avoid congestion and maintain the separation efficiency, 8 venturi
tubes would be installed in parallel to process the recirculating tailings.
5) Based on the tests results, the P2O5 recovery improvement can be as good as 15%
with column flotation. To make a conservative estimation, the recovery
improvement is assumed to be 5% for industrial application.
Similar to the calculation for the application of pico-nano bubbles in coal flotation, the
total cost for the application of pico-nano bubbles in phosphate reverse flotation system
should be $347,040 a year.
If the flotation product of 30% P2O5 grade needed to be produced, the total increase of the
flotation product by using pico-nano bubble should be : 100 ton/hour x 25% x 5%/ 30% =
4.2 ton/hour. At current price for phosphate rock of about $108/ton, the annual revenue
by pico-nano bubble application should be: 4.2 ton/hour x 4320 hours/ year x $108/ton =
$1,959,552.
Then, the net profit generated by pico-nano bubble application should be: $1,959,552 -
$347,040 = $ 1,612,512.

170
Chapter 7 Conclusions
The recovery improvement of coal flotation and phosphate reverse flotation demonstrated
that pico-nano bubbles would significantly improve the flotation recovery of hydrophobic
particles by increasing the probability of collision and attachment and reducing the
probability of detachment.
The following conclusions can be drawn based on the experimental results and findings
presented and discussed for the application of pico-nano bubbles in coal flotation.
1) Flotation efficiency of fine to coarser coal has been enhanced in the presence of pico-
nano and nano bubbles. Maximum volume of pico-nano bubbles, 65% to 75%, and
minimum mean pico-nano bubble size, 150 to 240 nm, were achieved at the medium
ratio of the diameter of throat and outlet of the venture tube (3 to 4), medium outlet
angle (11°to 13°), high inlet angle (26° to 27°) and high ratio of the length of
the throat and the diameter of throat (2.3 to 3). The optimal percentage of pico-nano
bubbles and nano bubbles is about 70%, which produces maximum combustible
material recovery of 86% and clean coal ash content of 11.7%.
2) Use of pico-nano bubbles in column flotation, the maximum combustible recovery of
85 to 90% and minimum clean coal ash of 9.5 to 11% are achieved at solids
concentration of 4%, collector dosage of 0.7 lb/tom , feed rate of 0.4 cm/s, the gas
flow rate of 1.6 cm/s, frother concentration of 20 ppm, superficial wash water rate of
0.2 cm/s, and feed rate of 0.2 cm/s from 29.6% ash content of Pittsburgh No. 8 seam
coal. At a given flotation combustible material recovery, more than half of the

171
collector can be saved by using pico-nano bubbles in the column flotation. The
frother dosage is also reduced up to one half of the dosage.
3) The column flotation using pico-nano bubles is capable of extending to float minus
75 m and 300-700 m particle size ranges more effectively than column flotation
with conventional sparger devices. Use of pico-nano bubbles in the flotation column,
remarkably increases the combustible material recoveries for coarse fractions, -
700+325 μm, and ultrafines fraction, -75 μm. The presence of pico-nano bubbles
enhances the effective separation density of 1.40 to 1.60 g/cm3. The presence of pico-
nano bubbles also has more considerable effect on minus 75 μm fine fraction than on
-700+355 μm coarse fraction. More high density particles of minus 75 μm fraction
were floated than that of -700+355 μm coarse particles. The presence of pico-nano
bubble has more considerable effects on improvement of combustible material
recovery than on that of flotation yield, especially for the -75 μm ultrafines and
ultrafines fractions.
4) The use of pico-nano bubble increases combustible material recovery at the
“inflection point” of the curve of flotation ash rejection versus combustible material
recovery of varying size by 5%-10%.
5) The economic analysis demonstrates that the application of pico-nano bubbles in coal
flotation is economically feasible. For a coal preparation plant with 100 ton/hour feed
rate, the annual profit of $1.62 million can be achieved with the application of pico-
nano bubbles.
The following conclusions can be drawn for the application of pico-nano bubbles in
phosphate reverse flotation.

172
1) The froth stability of CF413 is better than CF413B without the addition of MIBC.
With the addition of MIBC, the froth lasts longer than that without any frother. There
is a significant increase of the froth lifetime when CF413 or CF 413B is mixed with
MIBC at the dosage of 10 ppm or higher. With the increasing of the dosage of frother
(MIBC), the froth lifetime difference reduces significantly, especially when the
dosage of MIBC increases from 5 ppm to 10 ppm.
2) The addition of surfactant can improve the frothability of the fatty acid collector.
When MIBC is mixed with CF413 or CF413B at the dosage of 10 ppm, the
frothability can be significantly improved compared to other dosages of MIBC. By
adding in the frother (MIBC), the frothability difference between CF413 and CF413B
has been reduced to almost negligible level when the dosage of MIBC is higher than
10 ppm.
3) CF 413 generates more bubbles than CF413B at low collector dosages, resulting in
better yield. At high collector dosage, however, the yields of floated dolomite are
almost the same for CF413 and CF413B. Also, better yields can be achieved by the
addition of surfactant MIBC at 10 ppm for both CF413 and CF413B. The significance
of the collector with or without MIBC in improving dolomite flotation is in the order
as follows:
Mixture of CF413B and MIBC > Mixture of CF413 and MIBC > CF413 > CF413B.
4) The optimum operation conditions could be achieved at high level of collector, within
1.8 lb/ton, low level of pH, around 5.4, high level of feed rate, 0.3 cm/s, low level of
feed solid concentration, 20%, and low level of frother dosage, 7 ppm. Besides, the
less significant factors of air flow rate should be set at 1.5 cm/s, and the wash water

173
rate should be set at 0.1 cm/s with the optimal separation selectivity index, P2O5
recovery and grade at 72.73%, 92.86% and 29.86%, respectively.
5) The final composite phosphate concentrate contains 33.15% P2O5, 0.87% MgO and
4.25% acid insoluble with the overall P2O5 recovery of 93.76% when Pico-nano
bubble flotation column is used. In the absence of pico-nano bubble, the product of
column flotation would only produce the composite phosphate concentrate with 28.70%
of P2O5, 1.55% MgO and 5.00% acid insoluble with the overall P2O5 recovery of
82.68%. The product of mechanical cell flotation is also not as good as that of pico-
nano bubble column flotation. The separation selectivity of dolomite flotation has
been greatly improved by introducing pico-nano bubble into flotation system.
6) Both the P2O5 grade and P2O5 recovery have been greatly improved in the presence of
pico-nano bubbles. Not only the collecting ability but also the selectivity of dolomite
flotation has been improved significantly by using pico-nano bubble in the flotation
system. It acts as a secondary collector, bridging between hydrophobic and
conventional bubbles, which can significantly improve the flotation recovery of
hydrophobic particles by increasing the probability of collision and attachment,
reducing the probability of detachment at the meanwhile.
7) Pico-nano bubbles not only improved the flotation recovery of all phosphate particles
but also increased the corresponding product grade. The flotation recovery increases
from 5% up to 1 % as the particles size increases from 75 μm to 700 μm, which
indicates that pico-nano bubbles have more significant effect on coarser phosphate
particles than on finer particles.
174
8) The P2O5 content in flotation product of all size fractions, -700 +150μm and -150 μm,
in the presence of pico-nano bubbles are much higher than that in the sbsence of pico-
nano bubbles. The flotation recovery of P2O5 has been greatly improved, and the
grade of the flotation product has been significantly increased in the presence of pico-
nano bubbles as well.
9) The economic analysis demonstrates that the application of pico-nano bubbles in
phosphate reverse flotation is economically feasible. For a phosphate processing plant
with 100 ton/hour feed rate, the annual profit of $1.61 million can be achieved with
the application of pico-nano bubbles.

175
Chapter 8 Recommendations for Future Work
The results obtained from the present investigation showed that pico-nano bubbles
significantly improved phosphate and coal separation performance. It also demonstrated
the potential of improving the flotation recovery of coarse phosphate and coal by using
pico-nano bubbles in the flotation system. However, additional research work in the
following areas is recommended for the successful application of the pico-nano bubbles
in the flotation industry:
1) The design of cavitation venturi tube has been investigated in this study. It is only
discussed the significant of different designs from the construction point of view. In
order to better understand the generation of pico-nano bubbles, more fundamental
studies that associated with the hydrodynamic conditions of the pico-nano bubbles’
generation should be further studied. Computational fluid dynamics (CFD) should be
introduced to help with the simulation of the generation of pico-nano bubbles under
different hydrodynamic conditions, which will provide useful information on the
formation of pico-nano bubbles during the hydrodynamic cavitation process.
2) In order to verify the test results obtained from the laboratory scale flotation column,
a pilot and industrial scale column with pico-nano bubbles cavitation venturi tube
should be fabricated and tested.

176
3) In this study, phosphate and coal were selected as the materials being tested with
pico-nano bubbles flotation column. It is recommended that more minerals, including
metallic and non-metallic minerals, should be tested in the future.
4) Pico-nano bubbles should be applied to other flotation equipment, not only in open
flotation column.
5) A detailed technical performance and economic feasibility study should be performed
using the data generated from the pilot and industrial scale testing program.

177
References
Anazia, I., and Hanna, J., 19 , “Innovative process for beneficiation of dolomite phosphate
ores”, Int. J. Miner. rocess., ol.23, No.3-4, pp.311-314.
Amelunxen, R.L., 1993. The contact cell: a future generation of flotation machines.
Engineering and Mining Journal (April), pp. 36–37.
Ata, S., Jameson, G. J., 2005. “The Formation of bubble clusters in flotation cells”, Int. J.
Miner. Process., Vol. 76, pp. 123-139.
Attalla, M., Chao, C., and Nicol, S.K., 2000, “The role of cavitation in coal flotation”, In:
Pro.of the 8th Australian Coal preparation Conference, Port Stephens, 12–16 November.
Australian Coal Preparation Society, pp. 337–350.
Bahr, A., Imhof, R.M., Ludke, H., 1985, “Application and sizing of a pneumatic flotation
cell”, Min.Proc.Congress, Cannes, France.
Banisi, S., Finch, J. A., and Laplante, A. ., 1995, “Effect of solid particles on gas holdup
in flotation columns-I. measurement”, Chem. Engng Sci., ol. 50 No. 1 , pp. 2329-2334.
BP Statistical Review of World Energy, 2012.
Brennen, C.E., 1995, “Cavitation and Bubble Dynamics”, Oxford Univ. Press, New York.
Carr, M.W., Hillman, A.R., and Lubetkin, S.D., 1995, “Nucleation rate dispersion in bubble
evolution kinetics”, J. Colloid. Interf. Sci., Vol. 169, pp. 135–142.
Cheng, T. W., and Holtham, . N., 1995, “The particle detachment process in flotation”,
Minerals Engineering, Vol. 8, No. 8, pp. 883-891.
Cleric, C., 19 , “Flotation of a phosphate rock with carbonate-quartz gangue”, eagents in
the Mineral Industry, Jones, M.J. and Oblatt, R., eds., IMM, London, pp. 221-225.
Crozier. R.D., 1992, “Flotation: theory, reagents and ore testing”, Oxford, New York,
Pergamon.
Dean, R.B., 1944, The formation of bubbles. J. Appl. Sci., Vol. 15, pp. 446–451.
Deglon, D.A., Sawyerr, F., O’Connor, C.T., 1999, “A model to relate the flotation rate
constant and the bubble surface area flux in mechanical flotation cells”, Miner. Eng., Vol.
12, No. 6, pp. 599 – 608.

178
Derjaguin, B.V., S.S. Dukhin, and N.N. Rulyov, 1984, “Kinetic theory of flotation of small
particles”, Surface and Colloid Science, Vol. 13, pp. 71–113.
Didenko, Y.T., and Suslick, K.S., 2002, “The energy efficiency of formation of photons,
radicals and ions during single-bubble cavitation”, Nature, Vol. 418 (July), pp. 394–397.
uan, J., Fornasiero, ., and alston, J., 2003, “Calculation of the flotation rate constant of
chalcopyrite particles in an ore”, Int’l. J. Miner. Process., Vol. 72, pp. 227-237.
Dupre, V., Ponasse, M., Aurelle, Y., Secq, A., 1998, “Bubble formation by water release in
nozzles – I. Mechanisms”, Water Research, Vol.32, No. 8, pp. 2491–2497.
Dzienisiewicz, J., Pryor, E.J., 1950, “An investigation into the action of air in froth flotation”,
Trans. IMM, London, Vol.59, pp. 455–491.
Edzwald, J.K., 1995, “Principles and applications of dissolved air flotation”, Water Sci.
Technol., Vol. 31, No.3, pp. 1–23.
El-Shall, , H., Cheng, Y.H., Abdel-Khalek, N.A. and Gupta, S., 1999, “ A parametric study
of column flotation of florida phosphates”, Beneficiation of hosphates: “Advance in
research and practice”, Zhang, ., El-Shall, H., Wiegel, R., eds., SME, Littleton, CO.,
pp.75-86.
El-Shall, H., 2001, “Bubble generation, design, modeling and optimization of novel flotation
columns for phosphate beneficiation”, Final Report to Florida Institute of Phosphate
Research, FIPR, Publication No.02-111-175.
Falutsu, M., 1994, “Column flotation froth characteristics—stability of the bubble–particle
system”, Int’l. J. Miner. Process., Vol. 40 , pp. 225- 243.
Fan, M., 2008, “Picobubble enhanced flotation of coarse phosphate particles” (Ph.D.
dissertation), Kentucky: University of Kentucky.
Fan, M., Tao, D., Honaker, R. Q., and Luo, Z., 2010a, “Nanobubble generation and its
applications in froth flotation (part II): fundamental study and theoretical analysis”,
Mining Sci. & Tech., Vol. 20, No. 2, pp. 0159-0177.
Fan, M., Tao, D., Honaker, R. Q., and Luo, Z., 2010b, “Nanobubble generation and its
applications in froth flotation (part IV): mechanical cells and specially designed column
flotation of coal”, Mining Sci. & Tech., Vol. 20, No. 4, pp. 0641-0671.
Feng, D., and Aldrich, C.,1999, “Effect of particle size on flotation performance of complex
sulfide ores”, Minerals Engineering, Vol. 12, pp. 721-731.

179
Finch, J. A. and Dobby, G. S., 1991, “Column flotation: a selected review- 1”, Int. J.
Min. Proc., Vol. 33, pp. 343-354.
Finch, J. A., Nesset, J. E., Acuna, C., 2008, “ ole of frother on bubble production and
behaviour in flotation”, Minerals Engineering, Vol. 21, pp. 949-957.
Flanngingan, D.J., and suslick, K.S., 2005, “Plasma formation and temperature measurement
during single-bubble cavitation”, Nature, Vol. 434 (March), pp. 52–55.
Flynn, H.G., 1964, “Physics of acoustic cavitation in liquids”, In: Mason, W.P. (Ed.),
Physical Acoustics, Principles and Methods, part B, vol. 1. Academic Press, New York,
pp. 57–172.
Gerth, W.A., Hemmingsen, E.A., 1980, “Heterogeneous nucleation of bubbles at solid
surfaces in gas-supersaturate aqueous solutions”, J. Colloids Interf. Sci. 74, pp. 80–89.
Gochin, R.J., and Solari, J.A., 1983, “ issolved air flotation for recovery of fine cassiterite”,
Transactions of the Institute of Mining and Metallurgy, Sect. C 92, C52–58.
Gogate, P.R., and Pandit, A.B., 2001, “Hydrodynamic cavitation reactors: a state of the art
review”, Reviews in Chemical Engineering, Vol. 17, No. 1, pp. 1–85.
Gontijo, C., Fornasiero, D., and Ralston, J., 2007, “The limits of fine and coarse particle
flotation”, Can. J. Chem. Eng., Vol. 85, pp. 739–747.
Grainer-Allen, T.J.N., 1970, “Bubble generation in froth flotation machines”, Trans. IMM,
London, C15–C22.
Gu, Z. X., 2002, “Fine particle flotation for florida dolomitic phosphate pebbles” (Master
thesis), West Virginia: West Virginia University.
Gu, Z. X., Gao, Z. Z., and Hwang C. L., 1999a, “ evelopment of new technology for
beneficiation of florida dolomitic phosphate resources”, Final report submitted to Florida
Institute of Phosphate Research, publication No. 02-129-167.
Gu, Z. X., Gao, Z. Z., and Zheng S. B., 1999b, “Beneficiation of florida dolomitic phosphate
pebble with a fine particle flotation process”, Beneficiation of hsphate: “Advance in
research and practice”, Zhang, ., El-Shall, H., Wiegel, R., eds., SME, Littleton, CO., pp.
155-162.
Gurr, T.M., 2001, “Industrial minerals 2000- phosphate rock”, Mining Engineering, Vol.53,
No.6, pp. 51-52.

180
Hampton, M. A., and Nguyen, A. ., 2010, “Nanobubbles and the nanobubble bridging
capillary force”, Advances in Colloid and Interface Sci., ol. 15 No. 1, pp. 30-55.
Harrison, S. T. L., and Pandit, A. B., 1992,”The disruption of microbial cells by
hydrodynamic cavitation”, 9th
International Biotechnology Symposium, Washington, DC.
Hart, G., Morgan, S., and Bramall, N., 2002, “Generation of pico bubbles in flotation feed –
a means to reduce collector use”, roceedings of Ninth Australian Coal reparation
Conference, Yeppoon, pp. 136-148.
Harvey, E.N., McElroy, W.D., and Whiteley, A.H., 1947, “Cavity formation in water”, J.
Appl. Phys., Vol. 18, pp. 162–172.
Hemmingsen, E.A., 1975, “Cavitation in gas-supersaturated solutions”, J. Appl. Phys., Vol.
46, pp. 213- 218.
Hemmingsen, E.A., 1977, “Spontaneous formation of bubbles in gas-supersaturated water”,
Nature, Vol. 267 (May), pp. 141–142.
Hemmingsen, E.A., 1978, “Effects of surfactants and electrolytes on the nucleation of
bubbles in gas-supersaturated solutions”, Z. Naturforsch. Vol. 33, pp. 164–171.
Hemmingsen, E.A., Hemmingsen, B.B., 1990, “Bubble formation properties of hydrophobic
particles in water and cells of Tetrahymena”, Undersea Biomed. Res., Vol. 17, pp. 67–78.
Hernainz, F., Calero, M. and Blazquez, G., 2004, “Flotation of low-grade phosphate ore”,
Advanced powder technology, Vol. 15, No. 4, pp. 421-433.
Houot, ., 19 2, “Benificiation of phosphate ores through flotation: review of industrial
applications and potencial developments”, Intl. J. of mineral rocess., ol. 9, pp.353-384.
Hu, H., Zhou, Z.A., Xu, Zhenghe, and Finch, J.A., 1998, “Numerical and experimental study
of a cavitation tube”, Metallurgical and Materials Trans. B., Vol. 29, pp. 911–917.
IEA ( International Energy Agency) Coal Information, 2012.
International Standard, ISO 5167-4: 2003 (E), 2003, Measurement of fluid flow by means of
pressure differential devices inserted in circular cross-section conduits running full - Part
4: Venturi tubes. First ed. Geneva, Switzerland.
Ityokumbul, M. T., 1993, “Maximum gas velocity in column flotation”, Minerals Engng,
Vol. 6, pp. 1279-1286.

181
Jackson, M.L., 1994, “Energy effects in bubble nucleation”, I&EC Research, Vol. 33, No. 4,
pp. 929-933.
Jackson, M.L. and Collins, W., 1964, “Scale-Up of a venturi aerator”, Ind. Eng. Chem.
Process Des. Dev.,Vol.3, No.4, pp. 386-393.
Jameson, GJ, 1988, “A new concept in flotation column design”, Column ’ –
Proceedings of an International Symposium on Column Flotation, SME, Phoenix Az,
1988. Sastry, KV, ed., pp. 281-289.
JMP, Version 7. SAS Institute Inc., Cary, NC, 1989-2007.
Jordan, C. E. and Susko, F. J., 1992, “Rapid flotation using a modified bubble-injected
hydrocyclone and a shallow-depth froth separator for improved flotation kinetics”,
Minerais Eng., Vol.5, pp. 1239-1257.
King . ., 19 2, “Flotation of fine particles, in principles of flotation ( . . King,ed.)”,
South African Institute of Mining and Metallurgy, Johannesburg, pp. 217–219.
Kirchberg, H., and Topfer, E., 196 , “The mineralization of air bubbles in flotation”, roc.
7th Int’l. Min. Processing Congress, N. A. Arbiter, ed., pp. 157-168.
Klassen, V.I., and Mokrousov, V.A., 1963, “An Introduction to the Theory of Flotation”,
Butterworths, London.
Knapp, R.T., Daily, J.W., Hammitt, F.G., 1970, “Cavitation”, McGraw-Hill, New York.
Krasowska, M., Zawala, J., and Malysa, K., 2009, “Air at hydrophobic surfaces and kinetics
of three phase contact formation”, Advances in Colloid and Interface Sci., Vol. 147-148,
pp. 155-169.
Lawendy, T.A.B., and McClellan, G.H., 1993, “Flotation of dolomitic and calcareous
phosphate ores”, 1993, Beneficiation of hosphates: Theory and ractise, El-Shall, H.,
Moudgil, B., Wiegel, R., eds., SME, Littleton, CO., pp.231-244.
Luttrell, G. H., and Yoon, R.-H., 1992, “A hydrodynamic model for bubble-particle
attachment”, J. Colloid Interface Sci, Vol. 154, pp. 129-137.
McNamara III, W.B., Didenko, Y.T., Suslick, K.S., 1999, “Sonoluminescence temperatures
during multi-bubble cavitation”, Nature 401 (October), pp. 772–775.
Momber, A.W., 2004, “Aggregate liberation from concrete by flow cavitation”, Int’l. J.
Miner. Process., Vol. 74, pp. 177–187.

182
Moudgil, B. M., and Somasundaran, ., 19 6, “Advances in phosphate beneficiation”,
Advances in Mineral Processing, Arbiter Symposium, SME, pp.426.
Muganda, S., Zanin, M., and Grano, S. ., 2010, “Influence of particle size and contact angle
on the flotation of chalcopyrite in a laboratory batch flotation cell”, Int’l. J. Miner.
Process., Vol. 98, pp. 150-162.
Nicol, S.K., Engel, M.D., Teh, K.C., 1986, “Fine particle flotation in an acoustic field”. Int’l.
J. Miner. Process., Vol. 17, pp. 143–150.
Nomura, Y., Uesawa, S., Kaneko, A., and Abe, Y., 2011 “Study on bubble breakup
mechanism in a venturi tube”, roceedings of the ASME-JSME-KSME 2011 Joint Fluids
Engineering Conference, Japan , pp. 2527-2534.
Pease, D.C., Blinks, L.R., 1947, “Cavitation from solid surfaces in the absence of gas nuclei”,
J. Phys. Colloid Chem, Vol.51, pp. 556–567.
Peng, F. F. and Xiong, Y., 2012, “Flotation of fine coal using cavitation venturi tube for
pico and nanobubble generation to improve collision/attachment”, Int’l. Pittsburgh
Coal Conference, Pittsburgh, PA, October 15-18, 2012.
Peng, F. F., and Xiong, Y., 2013, “ ico-Nano Bubble Flotation Using Static Mixer-Venturi
Tube For ittsburgh No. Seam Coal”, reprint, 2013 SME Annual Meeting, Denver,
CO, Feb. 24-27.
iantadosi, C., Jasieniak, M., Skinner, W. M., and Smart, . S. C., 2000, “Statistical
comparison of surface species in flotation concentrates and tails from ToF-SIMS
evidence”, Minerals Engineering, Vol. 13, pp. 1377-1394.
Ponasse, M., Dupre, V., Aurelle, Y., Secq, A., 1998, “Bubble formation by water release in
nozzle-II. Influence of various parameters on bubble size”, Water Research, Vol. 32,
No.8, pp. 2498–2506.
Prozorov, T., Prozorov, R., and Suslick, K.S., 2004, “High velocity interparticle collisions
driven by ultrasound”, J. Am. Chem. Soc., Vol. 126, pp. 13890–13891.
a EN, .J., 1979, “Current problems in beneficiation of phosphate fines”, In:Beneficiation
of Mineral Fines- Problems and Research Needs, Somasundaran, P., and Arbiter, N., eds.,
AIME, pp.79-93.
Ralston, J., Dukhin, S.S., 1999, “The interaction between particles and bubbles”, Colloids
and Surfaces, Vol.151, No.1, pp. 3–14.

183
Ralston, J., Fornasiero, D., Hayes, R., 1999 a, “Bubble–particle attachment and detachment
in flotation”, Int’l. J. Miner. Process., Vol56, No. 1–4, pp. 133–164.
andolph, J. M., 1997, “Characterizing flotation response: a theoretical and experimental
comparison of techniques”, Master Thesis, irginia olytechnic Institute and State
University, VA.
ao, . ., 1979, “Flotation of low grade phosphate ore”, Int. Symp. on esources Eng. And
Tech., Jan. 8-11, pp.1-7.
Rees, A. J., Rodmail, D. 1. and label, T. F., 1980a, “Dissolved air flotation for solid/ liquid
separation”, J. Separ. Proc. Technol., Vol. 1, No.3, pp. 19-23.
Rees, A.J., Rodman, D.J. and label, T.F., 1980b, “Evaluation of dissolved air tlotation
saturator performance”, Technical eport T 1 3, Water esearch Centre, Report TM
106.
Ross, D., 1976, “Cavitation”, Pergamon Press, New York, pp. 203-251.
Rykaart, E.M., Haarhoff, J., 1995, “Behavior of air injection nozzles in dissolved air
flotation”, Wat. Sci. Tech., Vol. 31, No. 3, pp. 25–35.
Sahu, K.K., Hazama, Y., Ishihara, K.N., 2006, “Gushing in canned beer: the effect of
ultrasonic vibration”, J. Colloid Interface Sci., Vol. 302, pp. 356–362.
Schubert, H., 2005, “Nanobubbles, hydrophobic effect, heterocoagulation and
hydrodynamics in flotation”, Int. J. Miner. Process.. Vol. 78, pp. 11–21.
Senthikumar, P., Pandit, A.B., 1999, “Modelling hydrodynamic cavitation”, Chem. Eng.
Tech., Vol.22, No.12, pp. 1017–1027.
Sis, H. and Chander, S., 2003, “Improving froth characteristics and flotation recovery of
phosphate ores with nonionic surfactants”, Minerals Engineering, Vol. 16, No. 7, pp.
587-595.
Somasundaran, ., Xiao, L., and iswanathan, K. ., 19 7, “Interactions between dissolved
mineral species and surfactants in the fracolite/dolomite flotation”, roceedings of
International Symposium organized by Central-South University of Technology and
Technical University of Clausthal, Changsha, China, Sept. 21-24.
Soubiran, J., and Sherwood, J. D., 2000, “Bubble motion in a potential flow within a
venturi”, International Journal of Multiphase Flow, Vol.26, pp. 1771-1796.

184
Taggart, A.F., 1927, “Handbook of Ore ressing”, John Wiley & Sons, New York, pp. 945.
Takahashi, T., Miyahara, T., Mochizuki, H., 1979, “Fundamental study of bubble formation
in dissolved air flotation”, J. Chem. Eng. Japan, Vol. 12, No. 4, pp. 275–280.
Tao, D., 2004, “Role of bubble size in flotation of coarse and fine particles – a review”,
Separation Sci. Technol., Vol. 39, pp. 741–760.
Tao, D., Fan, M., Honaker, R., Parekh, B.K., 2006a, “Picobubble enhanced flotation of
coarse phosphate particles”, In: Proceedings of the Twenty-Third International Mineral
Processing Congress, Istanbul, Turkey, pp. 3–8.
Tao, D., Honaker, R., Parakh, B.K., Fan, M., 2006b, “Development of picobubble flotation
for enhanced recovery of coarse phosphate particles”, Final report for Florida Institute of
Phosphate Research, FIPR Contract #02-02-154R.
Tao, Y., Liu, J., Yu, S., Tao, D., 2006c, “Picobubble enhanced fine coal flotation”,
Separation Science and Technology, Vol.41, No.16, pp. 3597–3607.
Tao, D., Yu, S., Zhou, X.H., Honaker, R. Q., Parekh, B. K., 2008, “Picobubble column
flotation of fine coal,” International Journal of Coal Preparation and Utilization, Vol. 28,
pp. 1-14.
Trahar W. J. and Warren L. J., 1976, “The floatability of very fine particles—a review”,
International Journal of Mineral Processing, Vol. 3, pp. 103–131.
Tustsumi, A., Nieh, J.-Y., and Fan, L.-S., 1991, “ article wettability effect on bubble
wake dynamics in gas-liquid-solid fluidization”, Chem. Engng Sci. ol. 6, pp. 23 1-
2384.
U.S. Energy Information Administration Form EIA-7A, Coal Production and Preparation
Report, and U.S. Department of Labor, Mine Safety and Health Administration Form
7000-2, Quarterly Mine Employment and Coal Production Report, 2012.
U.S. Geological Survey, Mineral Commodity Summaries, January 2013.
Walstra, P., 1989, “Principles of foam formation and stability”, In: Wilson, A.J. (Ed.), Foams:
Physics Chemistry and Structure. Springer-Verlag, Berlin Heidelberg.
Weber M. E. and addock ., 19 3, “Interceptional and Gravitational Collision Efficiencies
for Single Collectors at Intermediate eynolds Numbers”, J. Colloid. Interface Sci., Vol.
94, pp. 328–335.

185
Westwater, J.W., 1964, “Measurement of bubble growth during mass transfer”, In: Davis, R.,
Ed., Cavitation in Real Liquids. Elsevier Publishing Company, Amsterdam, pp. 34–54.
Wiegel ., 1999, “ hosphate rock beneficiation practice in florida”, Beneficiation of
hosphates: “Advance in research and practice”, Zhang, ., El-Shall, H., Wiegel, R., eds.,
SME, Littleton, CO., pp.271-5.
Wu, T.Y., 1969, “Cavity flow analysis: a review of the state of knowledge”, In: Robertson,
J.M., Wislicenus, G.F. (Eds.), Cavitation State of Knowledge, ASME, New York, pp.
106–137.
Xu, M., Finch, J. A., and Uribe-Salas, A., 1991, “Maximum gas and bubble surface rates
in flotation columns”, Int. J. Miner. rocess., ol. 32, pp. 233-250.
Xu, M., Quinn, P., and Stratton-Crawly, R., 1996, “A feed-line aerated flotation colum, Part
1: Batch and continuous test work”, Minerals Engineering, Vol. 9, No. 5, pp. 499–508.
Xu, Z., Choung, J., Sun, W., Cui, Z., 2006, “Visualization of fine bubbles and their role in
fine particle flotation”, In: 38th Annual Canadian Mineral Processors Operators
Conference, Ottawa, January 17–19.
Yalcin, T., Byers, A., Ughadpaga, K., 2002, “Dissolved gas method of generating bubbles
for potential use in ore flotation”, Mineral Processing and Extractive Metallurgy Review,
Vol. 27, pp. 181–197.
Yalcin, T., Byers, A., 2006, “Dissolved gas flotation in mineral processing”, Mineral
Processing and Extractive Metallurgy Review, Vol. 27, pp. 1–11.
Yianatos, J. B., Finch, J. A., obby, G. S., and Xu, M., 19 , “Bubble size estimation in a
bubble swarm”, J. Coll. Int. Sci., ol. 126 No.1, pp. 37-44.
Yoon, R.-H., 2000, “The role of hydrodynamic and surface forces in bubble-particle
interaction”, Inter. J. Miner. rocess., Vol. 58, pp. 128-143.
Yoon. R. H.. Adel. G. T. and Luttrell. G. H., 1988. V.S. patent appl. no. 5761008, “A
process and apparatus for separating fine particles by microbubble flotation together with
a process and apparatus for generation of microbubbles”.
Yoon, R.-H., and Luttrell, G. H., 19 9, “The effect of bubble size on fine particle flotation”,
Miner Process Extr Metall Rev, Vol. 5, pp. 101-122.
Young, F.R., 1989, “Cavitation”, McGraw-Hill Book Company, London.

186
Yount, D.E., Kunkle, T.D., 1975, “Gas nucleation in the vicinity of solid hydrophobic
spheres”, J. Appl. Phys., Vol.46, No. 10, pp. 4484–4486.
Yount, D.E., and Strauss, R.H., 1976, “Bubble formation in gelatin: a model for
decompression sickness”, J. Appl. Phys., Vol. 47, No. 11, pp. 5081–5089.
Zhang, J., 1995, “ hosphate beneficiation-challenges and opportunities”, In: Misra M., editor.
Separation processes: heavy metals, ions and minerals: proceedings of a symposium; Las
Vegas, NV, Warrendale (PA): The Minerals, Metals & Materials Society, pp. 167-183.
Zhang, ., Yu, Y. and Bogan, M., 1997, “Challenging the Crago double float process.
Ⅱamine-fatty acid flotation of siliceous phosphates”, Minerals Engineering, Vol. 10, No.
9, pp. 983-94.
Zhou, Z.A., Xu, Zhenghe, Finch, J.A., 1995, “Fundamental study of cavitation in flotation”,
In: XIX International Mineral Processing Congress, vol. 3. San Francisco, pp. 93–97.
Zhou, Z.A., Xu, Zhenghe, Finch, J.A., 1996a, “Effect of gas nuclei on hydrophobic
coagulation”, J. Colloid. Interface Sci. 179, pp. 311–314.
Zhou, Z.A., Xu, Zhenghe, Finch, J.A., Liu, Q., 1996b, “Effect of gas nuclei on the filtration
of fine particles with different surface properties”, Colloids & Surfaces, Vol.113, pp. 67–
77.
Zhou, Z. A., Hu, H., Xu, Zhenghe, and Finch, J.A., Rao, S.R., 1997a, “ ole of
hydrodynamic cavitation in fine particle flotation”, Int’l. J. Miner. Process., Vol. 51, pp.
139-149.
Zhou, Z.A., Langlois, R., Xu, Zhenghe, Finch, J.A., Agnew, R., 1997b, “In-plant testing of a
hydrodynamic reactor in flotation”, In: Finch, J.A., Rao, S.R., Huang, L.M. (Eds.),
Processing of Complex Ores. CIM, Sudbury, Canada, pp. 185–193.
Zhou, Z.A., Xu, Zhenghe, and Finch, J.A., 1998, “Effect of surface properties of solids on
dynamic bubble formation in gas-supersaturated systems”, Ind. Eng. Chem. Res., vol. 37,
pp. 1998–2004.
Zhou, Z.A., Xu, Zhenghe, and Finch, J.A., 1999, “Generation of small bubbles by
hydrodynamic cavitation”, Trans. IMM, Vol. 108, pp. 55–58.
Zhou, Z.A., Chow, R.S., Su, N., 2005, “Spontaneous bubble nucleation on bitumen surfaces”,
Report for CONRAD Extraction Technology Group, Alberta Research Council.

187
Zhou, Z.A., Chow, R.S., 2006, “Effect of shear on bitumen–bubble attachment in model
systems”, Final Report for CONRAD Bitumen Production Technical Group, Alberta
Research Council.
Zhou, Z. A., Hu, H., Xu, Zhenghe, and Finch, J.A., ao, S. ., 1997, “ ole of hydrodynamic
cavitation in fine particle flotation”, Int. J. Miner. rocess, ol. 51, pp. 139-149.
Zhou, Z. A., Xu, Z. H., Finch, J. A., Masliyah, J. H., and Chow, . S., 2009, “On the role of
cavitation in particle collection in flotation – A critical review II”, Minerals Engineering,
Vol. 22, pp. 419-433.

188
Appendix A
Effect of different designs of cavitation venturi tube on bubble
distribution data

189
Table A- 1 Results of four-factor three-level experimental design of venturi tube design tests.
Run Din/Dt Lt/Dt Inlet Angle Outlet Angle
Pico-nano bubble
Volume(%)
Mean Pico-nano bubble
Size (nm)
1 2 1 27 16 60.15 112.21
2 6 1 27 16 0.94 723.83
3 2 3 15 16 28.38 520.74
4 6 1 15 16 33.92 764.50
5 6 3 15 8 37.77 630.88
6 6 1 27 8 28.30 657.50
7 2 2 21 12 62.81 291.00
8 4 2 21 12 70.65 181.73
9 2 3 15 8 0.58 941.88
10 4 2 21 12 73.68 175.00
11 4 3 21 12 94.89 23.50
12 6 2 21 12 44.68 543.65
13 2 1 15 16 32.74 648.90

190
14 2 3 27 16 82.76 20.20
15 4 1 21 12 80.23 130.20
16 6 1 15 8 21.73 935.50
17 4 2 27 12 74.58 72.50
18 2 1 27 8 78.92 10.28
19 4 2 21 8 56.25 588.59
20 6 3 15 16 49.60 240.00
21 6 3 27 8 68.06 268.98
22 4 2 21 16 50.23 488.90
23 6 3 27 16 65.17 112.50
24 2 3 27 8 91.15 68.50
25 2 1 15 8 27.75 826.00
26 4 2 15 12 44.68 579.58

191
Appendix B
Application of pico-nano bubbles in coal flotation data
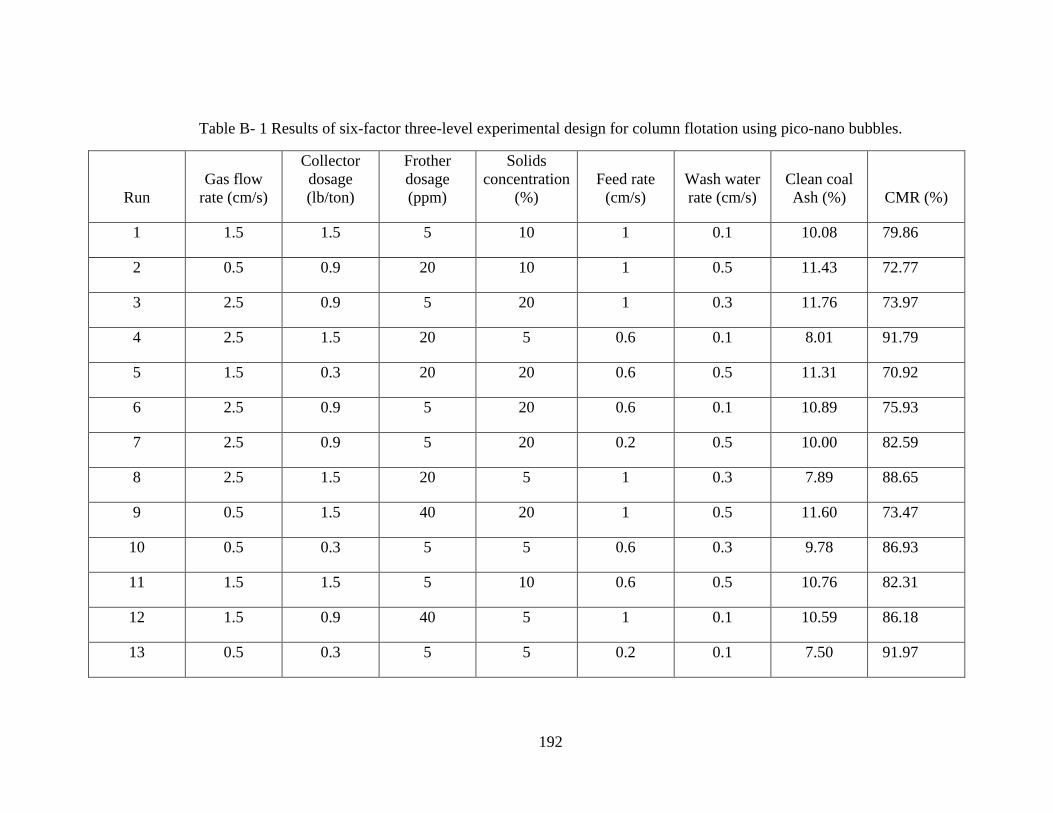
192
Table B- 1 Results of six-factor three-level experimental design for column flotation using pico-nano bubbles.
Run
Gas flow
rate (cm/s)
Collector
dosage
(lb/ton)
Frother
dosage
(ppm)
Solids
concentration
(%)
Feed rate
(cm/s)
Wash water
rate (cm/s)
Clean coal
Ash (%) CMR (%)
1 1.5 1.5 5 10 1 0.1 10.08 79.86
2 0.5 0.9 20 10 1 0.5 11.43 72.77
3 2.5 0.9 5 20 1 0.3 11.76 73.97
4 2.5 1.5 20 5 0.6 0.1 8.01 91.79
5 1.5 0.3 20 20 0.6 0.5 11.31 70.92
6 2.5 0.9 5 20 0.6 0.1 10.89 75.93
7 2.5 0.9 5 20 0.2 0.5 10.00 82.59
8 2.5 1.5 20 5 1 0.3 7.89 88.65
9 0.5 1.5 40 20 1 0.5 11.60 73.47
10 0.5 0.3 5 5 0.6 0.3 9.78 86.93
11 1.5 1.5 5 10 0.6 0.5 10.76 82.31
12 1.5 0.9 40 5 1 0.1 10.59 86.18
13 0.5 0.3 5 5 0.2 0.1 7.50 91.97

193
14 0.5 1.5 40 20 0.6 0.3 11.33 80.84
15 2.5 1.5 20 5 0.2 0.5 9.94 90.88
16 0.5 1.5 40 20 0.2 0.1 8.77 82.66
17 1.5 0.9 40 5 0.6 0.5 12.25 85.91
18 1.5 1.5 5 10 0.2 0.3 9.11 92.51
19 1.5 0.3 20 20 0.2 0.3 11.86 75.29
20 0.5 0.9 20 10 0.6 0.3 10.38 77.27
21 2.5 0.3 40 10 0.6 0.1 10.93 82.32
22 0.5 0.3 5 5 1 0.5 10.40 77.45
23 2.5 0.3 40 10 1 0.3 9.97 77.75
24 1.5 0.9 40 5 0.2 0.3 10.07 94.04
25 1.5 0.3 20 20 1 0.1 12.10 68.79
26 2.5 0.3 40 10 0.2 0.5 11.09 80.45
27 0.5 0.9 20 10 0.2 0.1 10.90 81.78

194
Table B- 2 Results of three-factor three-level central composite design for column flotation using pico-nano bubbles.
Run
Collector dosage
(lb/ton)
Solids concentration
(%) Feed rate (cm/s) Clean coal Ash (%) CMR (%)
1 0.3 4 0.2 7.25 87.66
2 0.9 4 0.6 13.94 96.43
3 0.6 7 0.2 9.02 69.05
4 0.6 7 0.4 12.74 78.76
5 0.9 10 0.2 8.20 74.24
6 0.9 4 0.2 17.05 96.20
7 0.3 7 0.4 12.06 88.21
8 0.3 4 0.6 10.16 69.45
9 0.6 10 0.4 12.27 73.83
10 0.6 7 0.6 13.52 78.04
11 0.9 7 0.4 13.13 89.75
12 0.3 10 0.2 9.79 78.02
13 0.3 10 0.6 10.60 66.13
14 0.9 10 0.6 9.47 71.31
15 0.6 4 0.4 9.98 90.68
16 0.6 7 0.4 10.45 85.89

195
Table B- 3 Effect of collector dosage on clean coal and combustible material recovery.
Kerosene, lb/ton Clean Coal Ash, % Combustible Recovery, % Clean Coal Yield, %
0.1 6.94 70.98 57.17
0.3 7.52 74.9 59.91
0.5 8.21 76.7 60.03
0.6 8.69 78.07 64.85
0.7 9.31 83.5 64.97
0.9 13.12 86.89 72.38
Table B- 4 Effect of solid Concentration on clean coal and combustible material recovery.
Solid Concentration, % Reject Ash, % Combustible Recovery, % Clean Coal Yield, %
2 64.68 90.31 79.36
3.5 65.98 89.92 75.81
4.5 70.78 88.33 69.5
5 75.71 79.33 64.85
5.5 77.45 77.43 60.28
10 79.44 71.31 55.62

196
Table B- 5 Effect of feed rate on clean coal and combustible material recovery.
Feed Rate, % Combustible Recovery, % Clean Coal Ash, %
0.2 86.32 11.5
0.3 87.56 10.25
0.4 88.07 9.6
0.5 84.51 10.84
0.6 78.05 12.57
Table B- 6 Effect of pico-nano bubbles and coal particle density on the coal flotation performance.
Density
-700+355 μm -75 μm
With pico-nano bubble Without pico-nano bubble With pico-nano bubble Without pico-nano bubble
CMR CMR CMR CMR
1.28 100 80.91 100.00 81.23
1.35 94.00 70.59 94.96 68.64
1.55 57.23 39.78 64.69 36.36
1.75 22.57 10.52 47.05 16.9
1.90 0.21 0.52 20.65 10.52
2.20 0.00 0.18 1.14 0.18

197
Table B- 7 Density and ash distributions of fine raw coal sample
Specific
gravity
700-355 μm 355-150 μm 150-75 μm 75-0 μm
Individual Cumulative Individual Cumulative Individual Cumulative Individual Cumulative
Wt,
% Ash, % Ash, % Wt,%
Ash,
% Ash, % Wt, %
Ash,
% Ash, % Wt,%
Ash,
% Ash, %
1.3 4.63 3.24 3.24 4.82 3.22 3.21 5.17 3.15 3.15 3.24 3.08 3.08
1.35 10.15 5.38 4.57 13.69 4.36 4.53 15.25 4.75 4.63 6.32 4.63 3.69
1.45 13.24 10.29 5.22 16.17 10.27 5.2 17.24 10.42 5.31 7.59 10.03 4.33
1.55 15.19 27.62 6.41 18.04 27.6 6.39 17.95 28.52 6.44 9.05 27.84 6.07
1.65 16.85 32.69 7.59 19.55 32.7 7.02 18.06 40.33 7.72 10.17 40.14 8.84
1.75 17.47 43.92 9.83 20.31 43.91 8.64 18.93 42.76 9.79 11.24 42.75 11.82
1.9 17.92 51.36 10.46 20.83 51.34 9.16 19.05 53.92 10.36 11.46 55.8 12.38
2.2 20.15 87.54 27.81 23.42 87.55 27.78 25.69 88.28 28.04 27.34 90.25 60.05

198
Table B- 8 Effect of pico-nano bubble on yield and combustible material recovery.
-700+355 μm -75 μm
With pico-nano bubble Without pico-nano bubble With pico-nano bubble Without pico-nano bubble
Clean coal
yield, %
Clean coal
ash, %
Clean coal
yield, %
Clean coal
ash, %
Clean coal
yield, %
Clean coal
ash, %
Clean coal
yield, %
Clean coal
ash, %
20.72 4.37 27.21 4.41 12.51 2.41 10.92 2.21
30.18 5.85 43.03 5.90 23.14 3.53 18.82 3.50
46.37 7.69 58.05 7.71 28.59 4.19 21.52 4.13
57.64 11.90 68.53 11.95 32.96 5.91 23.04 4.95
78.92 20.35 86.36 20.28 33.53 7.09 23.68 6.82
96.53 27.62 99.89 27.84 33.62 7.53 23.79 7.13
100.00 29.05 100.00 29.45 34.51 8.13 23.98 7.73

199
Table B- 9 Effect of pico-nano bubbles on the flotation product particle size distributions of -700+150 μm and -150 μm raw
coal feed in the presence and absence of pico-nano bubbles.
Size, μm Without pico-nano bubble With pico-nano bubble
Cumulative wt, % Cumulative wt, %
-700+150
150 5.86 5.79
212 28.79 17.86
250 51.92 31.37
300 68.39 46.93
355 78.94 58.96
425 87.69 69.28
500 92.35 84.62
700 100 100
Size, μm Cumulative weight Cumulative weight
-150
38 2.45 12.38
45 8.93 22.58
62 24.71 41.3
75 34.31 55.48
86 55.36 68.97
106 68.74 75.83
125 82.37 84.52
150 100 100

200
Table B- 10 Effect of pico-nano bubble on flotation ash rejection for various particle sizes.
150-75 μm 700-355 μm
Without pico-nano bubble With pico-nano bubble Without pico-nano bubble With pico-nano bubble
CMR, % Ash Rejection, % CMR, % Ash Rejection, % Ash Rejection, % CMR, % CMR, % Ash Rejection, %
96.8 30.62 52.66 93.61 96.6 25.32 42.65 92.78
91.64 59.93 79.03 91.55 91.69 38.04 69.82 83.98
87.36 75.9 87.21 87.66 85.37 52.83 78.23 79.8
82.66 86.24 91.57 80.11 78.91 68.92 88.54 72.51
73.51 92.02 94.6 73.05 72.54 78.42 91.53 67.22
58.18 96.39 97.62 65.18 65.12 81.15 92.24 57.83
75-0 μm 355-150 μm
Without pico-nano bubble With pico-nano bubble Without pico-nano bubble With pico-nano bubble
CMR, % Ash Rejection, % CMR, % Ash Rejection, % Ash Rejection, % CMR, % CMR, % Ash Rejection, %
99.51 35.69 65.66 99.54 96.8 30.55 45.16 93.55
98.95 60.34 75.09 98.82 92.03 43.69 72.5 87.09
98.02 73.64 89.91 98.31 86.54 60.01 82.63 83.41
97.8 90.14 92.86 97.53 76.38 77.81 93.52 70.11
96.6 92.11 93.05 96.08 68.9 85.49 95.21 65.14
95.4 92.49 93.11 94.96 61.55 87.73 95.59 57.85

201
Table B- 11 Effect of pico-nano bubbles on flotation yield.
-355+150 μm -150+75 μm
Without pico-nano bubble With pico-nano bubble Without pico-nano bubble With pico-nano bubble
Clean coal
ash, %
Clean coal
yield, %
Clean coal
yield, %
Clean coal
ash, %
Clean coal
ash, %
Clean coal
yield, %
Clean coal
yield, %
Clean coal
ash, %
5.56 32.69 20.07 5.66 4.56 43.71 28.49 4.59
6.17 37.82 26.63 6.15 5.17 61.23 44.32 5.37
7.64 49.89 39.74 7.66 6.34 70.35 59.15 6.3
10.05 60.38 49.36 10.1 8.04 73.64 71.05 8.14
12.95 65.14 57.51 12.9 9.65 75.27 73.55 9.68
14.13 67.92 60.24 14.15 12.13 78.42 76.82 12.23
-700+355 μm -75 μm
Without pico-nano bubble With pico-nano bubble Without pico-nano bubble With pico-nano bubble
Clean coal
ash, %
Clean coal
yield, %
Clean coal
yield, %
Clean coal
ash, %
Clean coal
ash, %
Clean coal
yield, %
Clean coal
ash, %
Clean coal
yield, %
4.62 27.21 4.37 20.72 2.41 12.51 2.21 10.92
6.12 43.03 5.85 30.18 3.53 23.14 3.50 18.82
8.56 58.05 7.69 46.37 4.19 28.59 4.13 21.52
12.11 68.53 11.90 57.64 5.91 32.96 4.95 23.04
22.22 86.36 20.35 78.92 7.09 33.53 6.82 23.68
28.87 99.89 27.62 96.53 7.53 33.62 7.13 23.79
29.05 100.00 29.05 100.00 8.13 34.51 7.73 23.98

202
Table B- 12 Effect of pico-nano bubble on combustible material recovery.
700-355 μm 150-75 μm
Without pico-nano bubble With pico-nano bubble Without pico-nano bubble With pico-nano bubble
Clean coal ash, % CMR, % CMR, % Clean coal ash, % Clean coal ash, % CMR, % CMR, % Clean coal ash, %
5.56 25.32 42.65 5.26 2.83 30.62 52.66 2.83
6.17 38.04 69.82 6.37 4.79 59.93 79.03 4.82
7.64 52.83 78.23 7.64 6.12 74.9 87.21 6.02
10.05 68.92 88.54 10.05 7.2 79.24 88.57 7.2
12.95 78.42 91.53 12.95 7.95 80.02 88.6 7.98
14.13 81.15 92.24 14.13 9.31 81.39 88.62 9.29
355-150 μm 75-0 μm
Without pico-nano bubble With pico-nano bubble Without pico-nano bubble With pico-nano bubble
Clean coal ash, % CMR, % CMR, % Clean coal ash, % Clean coal ash, % CMR, % CMR, % Clean coal ash, %
4.56 30.55 45.16 4.5 3.86 35.69 65.66 3.97
5.69 43.69 72.5 5.73 4.35 60.34 75.09 4.08
6.35 60.01 82.63 6.38 4.88 73.64 89.91 4.92
10.09 77.81 93.52 10.11 6.17 90.14 92.86 6.23
13.04 85.49 95.21 13.01 8.33 92.11 93.05 8.51
14.1 87.73 95.59 14.13 11.25 92.49 93.11 11.44

203
Table B- 13 Particle size effect on separation efficiency and combustible material recovery with pico-nano bubbles.
With Pico-nano bubbles
Size ange, μm Yield, % Ash, %
CMR, % Ash Rejection, % Separation Efficiency, % Clean Coal Tailing Feed Clean Coal Tailing
> 600 52.19 47.81 39.50 8.33 73.54 79.09 89.00 68.09
425 600 60.73 39.27 35.82 9.95 75.83 85.21 83.14 68.35
300 425 68.88 31.12 31.04 8.56 80.81 91.34 81.01 72.35
212 300 83.14 16.86 18.31 5.32 82.37 96.36 75.86 72.22
90 212 88.70 11.30 14.12 5.34 83.00 97.76 66.45 64.21
45 90 92.47 7.53 9.58 5.22 63.20 96.94 49.65 46.59
0 45 71.22 28.78 29.06 10.48 75.04
89.87 74.31 64.18
Without Pico-nano bubbles
Size ange, μm Yield, % Ash, %
CMR, % Ash Rejection, % Separation Efficiency, % Clean Coal Tailing Feed Clean Coal Tailing
> 600 38.23 61.77 40.40 5.46 62.03 60.64 94.83 55.47
425 600 39.66 60.34 41.09 5.67 64.37 63.51 94.52 58.03
300 425 60.61 39.39 31.63 10.36 64.37 79.47 80.15 59.62
212 300 85.73 14.27 15.71 6.50 71.05 95.10 64.53 59.63
90 212 92.92 7.08 9.25 5.76 54.92 96.48 42.08 38.56
45 90 78.38 21.62 13.88 5.15 45.55 86.33 70.94 57.27
0 45 50.42 49.58 34.53 9.09 60.39 70.01 86.72 56.73

204
Appendix C
Application of pico-nano bubbles in phosphate reverse flotation data

205
Table C- 1 Effect of CF 413 B on dolomite flotation.
Reagent Dosage, lb/ton Product Wt, % Grade, % Recovery, %
SI P2O5 MgO P2O5 MgO
CF 413 B
0.4
Float 12.04 12.63 9.43 11.18 38.75
41.97 Sink 87.96 25.9 2.31 88.82 61.25
Feed 100 24.30 3.17 100.00 100.00
0.8
Float 13.85 12.63 9.76 11.83 46.14
46.96 Sink 86.15 25.9 2.03 88.17 53.86
Feed 100 24.06 3.10 100.00 100.00
1.2
Float 18.04 10.52 9.83 12.06 60.52
57.07 Sink 81.96 27.52 1.84 87.94 39.48
Feed 100 24.45 3.28 100.00 100.00
1.6
Float 19.92 11.02 9.87 13.96 67.10
59.17 Sink 80.08 27.56 1.61 86.04 32.90
Feed 100 24.27 3.26 100.00 100.00
2
Float 20.31 11.42 9.82 14.66 68.07
58.98 Sink 79.69 27.47 1.57 85.34 31.93
Feed 100 24.21 3.25 100.00 100.00

206
Table C- 2 Effect of CF 413 on dolomite flotation.
Reagent Dosage,
lb/ton Product Wt, %
Grade, % Recovery, % SI
P2O5 MgO P2O5 MgO
CF 413
0.4
Float 13.76 13.6 7.64 12.92 45.27
45.02 Sink 86.24 25.8 2.68 87.08 54.73
Feed 100 24.12 3.36 100.00 100.00
0.8
Float 15.24 12.8 9.79 12.76 50.92
49.41 Sink 84.76 26.4 2.02 87.24 49.08
Feed 100 24.33 3.20 100.00 100.00
1.2
Float 17.88 11.87 9.85 13.88 60.11
54.54 Sink 82.12 26.9 1.89 86.12 39.89
Feed 100 24.21 3.31 100.00 100.00
1.6
Float 19.42 10.92 9.76 13.61 64.69
58.06 Sink 80.58 27.5 1.69 86.39 35.31
Feed 100 24.28 3.26 100.00 100.00
2
Float 19.93 11.2 9.69 13.22 65.91
59.42 Sink 80.07 27.8 1.63 86.78 34.09
Feed 100 24.49 3.24 100.00 100.00

207
Table C- 3 Effect of the mixture of CF 413 and MIBC on dolomite flotation.
Reagent Dosage,
lb/ton
Pr
oduct Wt, %
Grade, % Recovery, % SI
P2O5 MgO P2O` MgO
CF 413
+
10 ppm MIBC
0.4
Float 15.48 11.3 9.89 9.38 52.25
54.47 Sink 84.52 27.5 2.21 90.62 47.75
Feed 100 24.99 3.40 100.00 100.00
0.8
Float 17.7 10.8 10.25 10.80 61.92
59.34 Sink 82.3 27.8 1.92 89.20 38.08
Feed 100 24.79 3.39 100.00 100.00
1.2
Float 19.38 9.3 10.33 11.37 68.33
62.89 Sink 80.62 28.2 1.66 88.63 31.67
Feed 100 24.54 3.34 100.00 100.00
1.6
Float 21.8 8.4 10.11 11.89 75.22
66.93 Sink 78.2 28.9 1.51 88.11 24.78
Feed 100 24.43 3.38 100.00 100.00
2
Float 21.67 9.5 9.98 12.36 73.81
65.53 Sink 78.33 28.7 1.48 87.64 26.19
Feed 100 24.54 3.32 100.00 100.00

208
Table C- 4 Effect of the mixture of CF 413B and MIBC on dolomite flotation.
Reagent Dosage,
lb/ton Product Wt, %
Grade, % Recovery, % SI
P2O5 MgO P2O5 MgO
CF 413B
+
10 ppm MIBC
0.4
Float 14.08 9.17 10.46 5.54 50.27
57.53 Sink 85.92 28.2 2.18 94.46 49.73
Feed 100 25.52 3.35 100.00 100.00
0.8
Float 17.19 7.84 9.86 6.70 63.71
65.35 Sink 82.81 28.9 1.95 93.30 36.29
Feed 100 25.28 3.31 100.00 100.00
1.2
Float 19.66 6.03 10.76 7.60 73.54
70.66 Sink 80.34 29.5 1.51 92.40 26.46
Feed 100 24.89 3.33 100.00 100.00
1.6
Float 22.64 7.26 10.25 10.73 82.29
72.48 Sink 77.36 29.6 1.36 89.27 17.71
Feed 100 24.54 3.37 100.00 100.00
2
Float 23.03 7.81 9.72 10.58 84.26
73.85 Sink 76.97 29.8 1.33 89.42 15.74
Feed 100 24.74 3.26 100.00 100.00

209
Table C- 5 Results of seven-factor two-level fractional factorial experimental design.
Run Product Wt, % Grade, % Recovery, %
SI P2O5 MgO P2O5 MgO
1
Float 18.78 7.83 10.94 7.86 70.12
68.10 Sink 81.22 29.1 1.59 92.14 29.88
Feed 100 25.11 3.35 100.00 100.00
2
Float 20.1 7.83 10.94 9.35 75.05
69.38 Sink 79.9 29.1 1.39 90.65 24.95
Feed 100 24.82 3.31 100.00 100.00
3
Float 19.56 7.84 10.88 9.68 72.63
67.44 Sink 80.44 28.8 1.48 90.32 27.37
Feed 100 24.70 3.32 100.00 100.00
4
Float 11.62 7.59 16.43 3.87 41.36
52.85 Sink 88.38 27.9 1.41 96.13 58.64
Feed 100 25.54 3.16 100.00 100.00
5
Float 16.37 8.02 12.77 6.43 57.94
61.99 Sink 83.63 28.7 1.35 93.57 42.06
Feed 100 25.31 3.22 100.00 100.00
6
Float 20.19 8.91 11.04 7.59 76.07
72.26 Sink 79.81 29.7 1.37 92.41 23.93
Feed 100 25.50 3.32 100.00 100.00
7
Float 16.34 8.02 12.37 6.39 57.83
61.96 Sink 83.66 28.7 1.45 93.61 42.17
Feed 100 25.32 3.23 100.00 100.00
8
Float 13.32 7.85 14.98 3.69 47.05
57.50 Sink 86.68 28.5 1.33 96.31 52.95
Feed 100 25.75 3.15 100.00 100.00

210
Table C- 6 Results of five-factor two-level fractional factorial experimental design.
Run Product Wt, % Grade, % Recovery, %
SI P2O5 MgO P2O5 MgO
1
Float 20.61 6.79 11.05 8.57 77.73
72.03 Sink 79.39 29.54 1.17 91.43 22.27
Feed 100 24.85 3.21 100.00 100.00
2
Float 18.84 6.84 13.12 5.49 71.50
71.95 Sink 81.16 29.87 1.04 94.51 28.50
Feed 100 25.53 3.32 100.00 100.00
3
Float 18.81 7.52 12.25 8.27 70.30
67.68 Sink 81.19 28.98 1.2 91.73 29.70
Feed 100 24.94 3.28 100.00 100.00
4
Float 20.85 7.03 11.87 10.39 77.35
69.57 Sink 79.15 29.04 1.12 89.61 22.65
Feed 100 24.45 3.36 100.00 100.00
5
Float 16.62 6.95 13.68 6.17 61.67
64.74 Sink 83.38 28.97 1.15 93.83 38.33
Feed 100 25.31 3.23 100.00 100.00
6
Float 19.71 6.73 12.09 7.06 74.60
71.95 Sink 80.29 29.69 1.03 92.94 25.40
Feed 100 25.16 3.21 100.00 100.00
7
Float 17.85 6.59 13.54 6.99 64.21
65.52 Sink 82.15 29.04 0.98 93.01 35.79
Feed 100 25.03 3.22 100.00 100.00
8
Float 18.91 7.12 11.82 8.57 69.83
67.08 Sink 81.09 28.92 1.18 91.43 30.17
Feed 100 24.80 3.19 100.00 100.00

211
Table C- 7 Effect of pH on dolomite flotation.
pH Product Wt, % Grade, % Recovery, %
SI P2O5 MgO P2O5 MgO
5
Float 20.68 6.63 10.83 13.17 76.44
65.46 Sink 79.32 28.48 1.23 86.83 23.56
Feed 100 23.96 3.22 100.00 100.00
5.1
Float 20.56 6.68 10.89 11.27 76.42
67.83 Sink 79.44 28.65 1.18 88.73 23.58
Feed 100 24.13 3.18 100.00 100.00
5.2
Float 20.51 6.73 10.92 9.79 76.44
69.73 Sink 79.49 29.11 1.11 90.21 23.56
Feed 100 24.52 3.12 100.00 100.00
5.3
Float 20.44 6.77 11.94 8.41 76.32
71.43 Sink 79.56 29.53 1.02 91.59 23.68
Feed 100 24.88 3.25 100.00 100.00
5.4
Float 20.23 6.81 11.98 7.14 75.81
72.73 Sink 79.77 29.86 0.98 92.86 24.19
Feed 100 25.20 3.21 100.00 100.00
5.5
Float 19.95 6.92 11.92 6.94 74.35
72.09 Sink 80.05 29.82 0.99 93.06 25.65
Feed 100 25.25 3.17 100.00 100.00
5.6
Float 19.74 7.09 11.82 6.63 72.90
71.61 Sink 80.26 29.84 1.01 93.37 27.10
Feed 100 25.35 3.14 100.00 100.00
5.7
Float 19.72 7.21 11.62 6.57 71.48
70.91 Sink 80.28 29.85 1.03 93.43 28.52
Feed 100 25.39 3.12 100.00 100.00

212
Table C- 8 Effect of collector dosage on dolomite flotation.
Collector Dosage, lb/ton Product Wt, % Grade, % Recovery, %
SI P2O5 MgO P2O5 MgO
1
Float 18.64 7.91 11.73 8.58 68.26
6.09 Sink 81.36 28.82 1.3 91.42 31.74
Feed 100 24.92 3.24 100.00 100.00
1.2
Float 19.53 7.9 11.82 8.20 72.12
9.06 Sink 80.47 29.26 1.23 91.80 27.88
Feed 100 25.09 3.30 100.00 100.00
1.4
Float 20.65 8.06 11.91 8.31 76.89
1.96 Sink 79.35 29.64 1.12 91.69 23.11
Feed 100 25.18 3.35 100.00 100.00
1.6
Float 21.21 8.14 11.69 8.40 78.83
3.10 Sink 78.79 29.82 1.02 91.60 21.17
Feed 100 25.22 3.28 100.00 100.00
1.8
Float 21.74 8.21 11.94 8.80 81.17
4.02 Sink 78.26 29.89 0.94 91.20 18.83
Feed 100 25.18 3.33 100.00 100.00
2
Float 22.95 8.32 11.52 10.39 82.40
3.12 Sink 77.05 29.83 0.95 89.61 17.60
Feed 100 24.89 3.38 100.00 100.00

213
Table C- 9 Effect of pico-nano bubbles on P2O5 recovery of varying sizes.
Size range
(um)
With pico-nano bubbles Without pico-nano bubbles
Wt., % P2O5, % P2O5, % P2O5 recovery, % Wt. , % P2O5, % P2O5, % P2O5 recovery, %
-700+600 67.62 31.83 6.04 91.67 68.06 26.83 16.34 77.78
-600+425 68.83 32.72 6.38 91.89 71.94 27.72 16.28 81.36
-425+355 73.23 33.58 7.62 92.34 77.75 28.98 18.42 84.61
-355+150 75.81 33.67 8.45 92.59 79.84 29.57 19.65 85.63
-150+106 71.42 33.82 6.32 93.04 76.46 29.82 13.42 87.83
-106+75 71.46 33.59 6.93 92.39 79.70 28.59 15.73 87.71
-75 71.10 32.43 7.41 91.50 79.58 27.43 16.51 86.62

214
VITA
Yu Xiong was born on February 19, 1985 in Pingjiang County, Hunan province, P.R. China. He
joined W U’s epartment of Mining Engineering in August 2010. Prior to joining WVU, Yu
earned his B.S. in Mineral Processing Engineering and M.S. degrees in Minerals & Materials
Engineering from China University of Mining and Technology (Beijing) in July 2007 and 2010,
respectively. Yu’s current research has focused on the study of pico-nano bubble enhanced
column flotation system. He currently holds two patents for the preparation methods of
environmental friendly material.