budget of the asian development bank for 2017 · budget of the asian development bank for 2017 ......
TRANSCRIPT
ASIAN DEVELOPMENT BANK
NOVEMBER 2016
BUDGET OF THE ASIAN DEVELOPMENT BANK FOR 2017

Asian Development Bank
November 2016
Budget of the Asian Development Bank for 2017 Distribution of this document is restricted until it has been approved by the Board of Directors. Following such approval, ADB will disclose the document to the public after excluding information subject to the exceptions to disclosure set forth in ADB's Public Communications Policy 2011.


ABBREVIATIONS
ADB – Asian Development Bank ADF – Asian Development Fund ATF – advisory task force CPS – country partnership strategy CRP – Compliance Review Panel DMC – developing member country ESP – Early Separation Program FCAS – fragile and conflict-affected situations GMIP – Group Medical Insurance Plan IAE – internal administrative expenses IED – Independent Evaluation Department ISTS IT
– –
Information Systems and Technology Strategy information technology
ITC – Information Technology Committee JFPR – Japan Fund for Poverty Reduction OCR – ordinary capital resources OPPP – Office of Public–Private Partnership PPP – public–private partnership PRC – People’s Republic of China PRGMIP – Post-Retirement Group Medical Insurance Plan SDCC – Sustainable Development and Climate Change Department SRP – Staff Retirement Plan TA – technical assistance TASF – Technical Assistance Special Fund US – United States WPBF – work program and budget framework
NOTE
In this report, "$" refers to US dollars. In preparing any country program or strategy, financing any project, or by making any designation of or reference to a particular territory or geographic area in this document, the Asian Development Bank does not intend to make any judgments as to the legal or other status of any territory or area.


CONTENTS
Page
EXECUTIVE SUMMARY i I. OVERVIEW 1
A. Strategic and Institutional Context 1
B. Financial Outlook and Approach to 2017 Budget 3
II. THE 2017 WORK PROGRAM DELIVERABLES 5
A. Operations 5
B. Knowledge Program 12
C. Organizational Resilience 13
D. Information Technology Reforms 14
E. Nonoperations 15
III. INDEPENDENT EVALUATION AND ACCOUNTABILITY MECHANISM 16
A. Independent Evaluation Department 16
B. Accountability Mechanism 18
IV. FINANCIAL RESOURCES 19
A. Combination of Asian Development Fund Lending Operations with Ordinary Capital Resources Balance Sheet 19
B. Asian Development Fund Replenishment 19
C. Allocation of 2015 Net Income 20
D. Borrowing Program 20
E. Technical Assistance Funding 20
F. External Funds 21
V. 2017 BUDGETARY RESOURCES 21
A. Institutional Efficiency and Cost-Saving Measures 22
B. Workforce Analysis 24
C. Internal Administrative Expenses for 2017 27
D. Summary of Resources Provided to Resident Missions 38
E. Operational Expenses by Program Category 39
VI. CAPITAL EXPENDITURES 40
A. Annual Capital Expenditures 40
B. Ongoing Special Capital Expenditure Programs 41
VII. RECOMMENDATIONS 43
APPENDIXES
1. 2017 Budget: Internal Administrative Expenses 44 2. Summary of Annual Capital Expenditures 45 3. Summary of Selected Operational Outputs by Departments 46 4. Impacts from Information Technology Reforms and Organizational Resilience 48 5. Summary of ADB Efficiency 53 6. Staff Positions by Department and Office 57 7. Price and Volume Growth 59 8. Distribution of Operational Expenses by Department and Office 62 9. Cross-Year Comparison of Internal Administrative Expenses 63
10. Board of Directors 64 11. Compliance Review Panel and Office of the Compliance Review Panel 65 12. Independent Evaluation Department 66 13. Operational Expenses 67 14. Administrative Expenses 68 15. 2017 Annual Capital Budget and 2018–2019 Indicative Annual Capital
Expenditure Programs 69 16. Summary of Special Capital Expenditures 70 17. Highlights of the Staff Retirement Plan 71 18. Highlights of 2016 Annual Review of Salary and Benefits 72 19. ADB Actions to Improve Institutional Gender Equality 76

BOXES
1. Scaling Up in the Office of Public–Private Partnership 7 2. Results of 10-Point Procurement Reform Action Plan 9 3. Summary of Second Generation of Procurement Reforms 10 4. Highlights of 2017 Independent Evaluation Department Work Program 17
TABLES
1. Approvals, 2013–2017 5 2. Deliverables in Strategic Operational Priorities, 2017 6 3. Contract Award and Disbursement Ratios, 2013–2017 8 4. Technical Assistance Program, 2013–2017 11 5. Country Partnership Strategies and Operations Business Plans, 2013–2017 11 6. Knowledge Products and Services, 2015–2017 13 7. Organizational Resilience Implementation Plan, 2016–2021 14 8. Real-Time ADB Implementation Plan, 2016–2019 15 9. Independent Evaluation Department’s Work Program, 2013–2017 17
10. Complaints Received by the Special Project Facilitator under the 2012 Accountability Mechanism Policy, 2012–2016
18
11. Case Load of the Compliance Review Panel, 2012–2016 18 12. Asian Development Fund 12 Replenishment 19 13. Technical Assistance Resources, 2014–2017 20 14. Estimated Incremental Savings from Efficiency Measures, 2017 22 15. Indicative Scope for Further Optimization, 2017–2019 25 16. Indicative Staffing Requirements, 2017–2019 26 17. Allocation of New Positions, 2017 26 18. Allocation of New Positions by Location, 2017 26 19. Indicative New Staff Outposting to Resident Missions for Implementation of
the Midterm Review of Strategy 2020, 2015–2017
27 20. Comparative Budget Growth, 2016–2017 28 21. Income and Expense Outlook, 2016–2017 30 22. Budget and Overall Administrative Expenses, 2016–2017 31 23. Board of Governors, 2016–2017 32 24. Operational Expenses, 2016–2017 33 25. Contribution to Staff Retirement Plan, 2016–2017 34 26. Administrative Expenses, 2016–2017 36 27. Resident Mission Number and Expenses, 2015–2017 39 28. Operational Expenses by Program Category, 2016–2017 39 29. 2017 Annual Capital Expenditure Budget 40

FIGURES
1. Approvals, Contract Awards, and Disbursements, 2013–2017 4 2. Budget Volume Growth, 2013–2016 4 3. Approvals and Projects under Administration, 2013–2017 4 4. Approvals and Technical Assistance under Administration, 2013–2017 10 5. Cofinancing Approvals, 2013–2017 12 6. Useable Equity, 2013–2017 19 7. Financing Framework for ADF XI and ADF 12 19 8. Share of Staff Consultant Budget to Net Internal Administrative Expenses,
2013–2017 35 9. Distribution of Staff Consultant Budget by Department, 2013–2017 35
10. Share of Business Travel Budget to Net Internal Administrative Expenses, 2013–2017 35
11. Distribution of Business Travel Budget by Department, 2013–2017 35

2017 BUDGET MEMORANDUM

EXECUTIVE SUMMARY
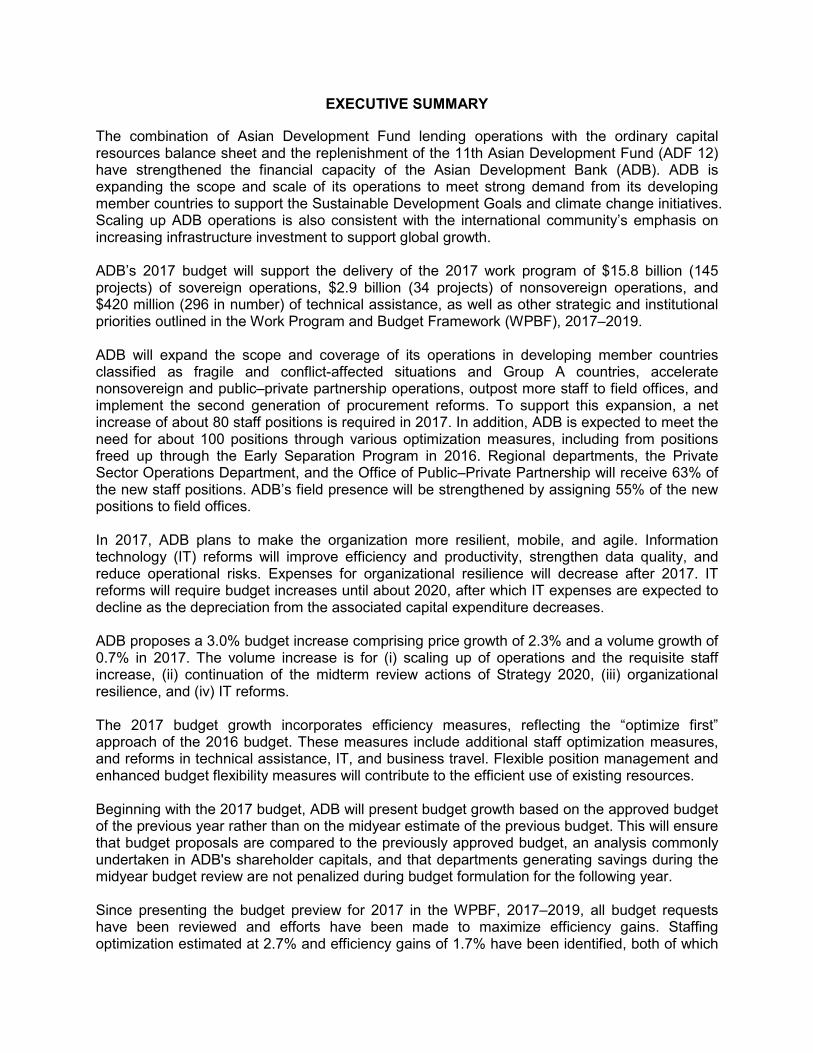
The combination of Asian Development Fund lending operations with the ordinary capital resources balance sheet and the replenishment of the 11th Asian Development Fund (ADF 12) have strengthened the financial capacity of the Asian Development Bank (ADB). ADB is expanding the scope and scale of its operations to meet strong demand from its developing member countries to support the Sustainable Development Goals and climate change initiatives. Scaling up ADB operations is also consistent with the international community’s emphasis on increasing infrastructure investment to support global growth.
ADB’s 2017 budget will support the delivery of the 2017 work program of $15.8 billion (145 projects) of sovereign operations, $2.9 billion (34 projects) of nonsovereign operations, and $420 million (296 in number) of technical assistance, as well as other strategic and institutional priorities outlined in the Work Program and Budget Framework (WPBF), 2017–2019.
ADB will expand the scope and coverage of its operations in developing member countries classified as fragile and conflict-affected situations and Group A countries, accelerate nonsovereign and public–private partnership operations, outpost more staff to field offices, and implement the second generation of procurement reforms. To support this expansion, a net increase of about 80 staff positions is required in 2017. In addition, ADB is expected to meet the need for about 100 positions through various optimization measures, including from positions freed up through the Early Separation Program in 2016. Regional departments, the Private Sector Operations Department, and the Office of Public–Private Partnership will receive 63% of the new staff positions. ADB’s field presence will be strengthened by assigning 55% of the new positions to field offices. In 2017, ADB plans to make the organization more resilient, mobile, and agile. Information technology (IT) reforms will improve efficiency and productivity, strengthen data quality, and reduce operational risks. Expenses for organizational resilience will decrease after 2017. IT reforms will require budget increases until about 2020, after which IT expenses are expected to decline as the depreciation from the associated capital expenditure decreases.
ADB proposes a 3.0% budget increase comprising price growth of 2.3% and a volume growth of 0.7% in 2017. The volume increase is for (i) scaling up of operations and the requisite staff increase, (ii) continuation of the midterm review actions of Strategy 2020, (iii) organizational resilience, and (iv) IT reforms.
The 2017 budget growth incorporates efficiency measures, reflecting the “optimize first” approach of the 2016 budget. These measures include additional staff optimization measures, and reforms in technical assistance, IT, and business travel. Flexible position management and enhanced budget flexibility measures will contribute to the efficient use of existing resources.
Beginning with the 2017 budget, ADB will present budget growth based on the approved budget of the previous year rather than on the midyear estimate of the previous budget. This will ensure that budget proposals are compared to the previously approved budget, an analysis commonly undertaken in ADB's shareholder capitals, and that departments generating savings during the midyear budget review are not penalized during budget formulation for the following year. Since presenting the budget preview for 2017 in the WPBF, 2017–2019, all budget requests have been reviewed and efforts have been made to maximize efficiency gains. Staffing optimization estimated at 2.7% and efficiency gains of 1.7% have been identified, both of which

are larger than those in the 2016 budget. Consequently, the proposed 2017 volume growth is 0.7% as shown in the table below. The volume growth includes depreciation estimated from capital investments in organizational resilience and IT reforms, equivalent to 0.8%. The volume growth minus this depreciation (needed for the next 4 years) is –0.1% in 2017.
Comparative Budget Growth, 2016–2017
(%)
L = not applicable or not calculated, ( ) negative, ESP = Early Separation Program, IT = information technology, OR = organizational resilience, SRP = Staff Retirement Plan, WPBF = work program and budget framework. Note: Numbers may not sum precisely because of rounding. a
Budget preview is based on the WPBF, 2017–2019, circulated to the Board of Directors on 9 November 2016. b
Identified savings of $3.8 million during the midyear review of the 2015 budget. Source: Asian Development Bank.
The proposed internal administrative expenses budget for 2017 is $647.0 million, an increase of $18.6 million over the 2016 original budget. The salary increase proposal was circulated separately for Board approval. The budget impact of the salary proposal is $6.9 million. In addition, the proposed 2017 budget includes $9.7 million for annual capital expenditures to fund the cyclical capital requirements of headquarters and the field offices. ADB will continue to promote efficiency and focus on prudent resource planning and management to provide the appropriate budgetary support for the growing volume and increasing complexity of its operations.
Budget over
2015
Midyear
Estimate
Budget over
2015 Budget
Price 1.7 1.7 2.2 2.3
Adjustment to SRP contribution rate 0.8 0.8 L L Price 2.5 2.5 2.2 2.3 Volume Scaling up of operations 2.4 2.4 2.2 3.7 Midterm review actions 0.3 0.3 L 0.1 Staffing optimization (1.5) (1.5) (2.7) Efficiency gains (1.4) (1.4) (1.0) (1.7)
Adjustmentb
L (0.6) L L
Subtotal (0.2) (0.8) 1.2 (0.6) Organizational resilience L L 0.7 0.5 IT Reforms L L 0.8 0.8
Subtotal 4 0.0 1.5 1.3 Volume (0.2) (0.8) 2.8 0.7
Depreciation of OR and IT reforms L L (0.8) (0.8)
Volume less depreciation L L 2.0 (0.1) Budget growth 2.3 1.7 5.0 3.0
ESP 1.2 1.2 (1.2) (1.2)Volume with ESP 1.0 0.4 1.6 (0.5)
Budget growth after ESP 3.5 2.9 3.8 1.8
Item
2016
Budget
2017 Budget
Previewa
Proposed
2017 Budget
Budget over
2016 Budget
Budget over
2016 Budget
Price before adjustment to SRP contribution
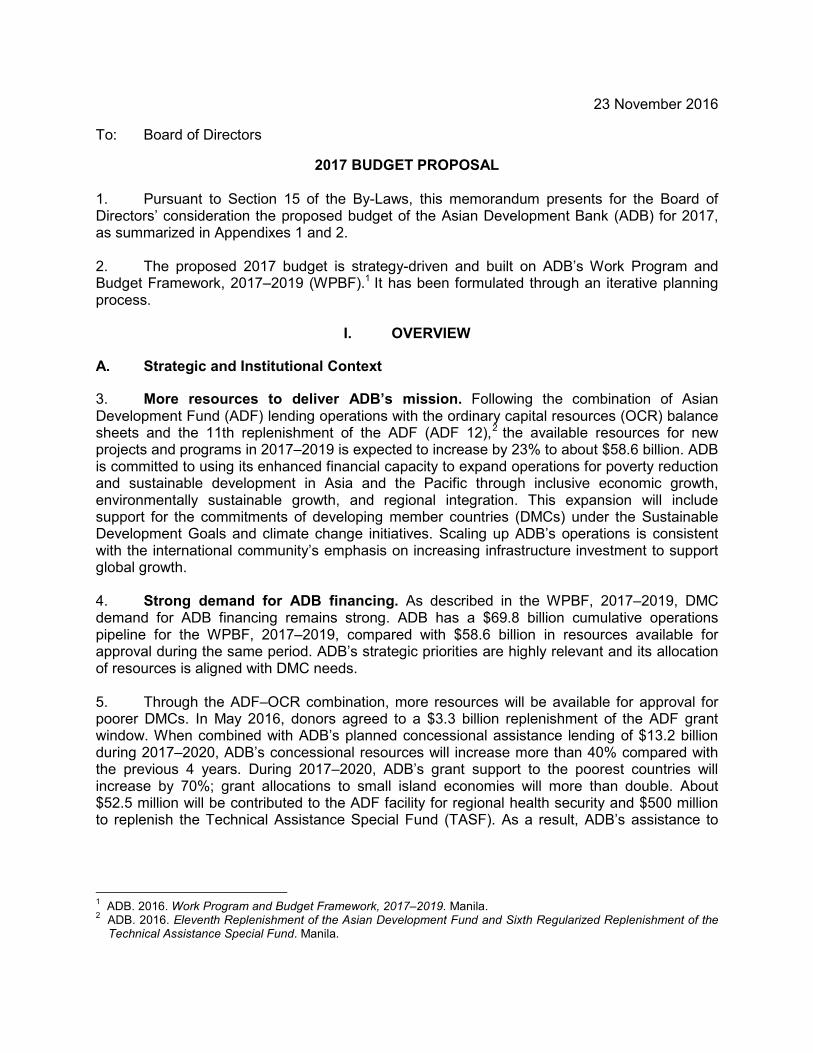
23 November 2016
To: Board of Directors
2017 BUDGET PROPOSAL 1. Pursuant to Section 15 of the By-Laws, this memorandum presents for the Board of Directors’ consideration the proposed budget of the Asian Development Bank (ADB) for 2017, as summarized in Appendixes 1 and 2. 2. The proposed 2017 budget is strategy-driven and built on ADB’s Work Program and Budget Framework, 2017–2019 (WPBF).1 It has been formulated through an iterative planning process.
I. OVERVIEW
A. Strategic and Institutional Context
3. More resources to deliver ADB’s mission. Following the combination of Asian Development Fund (ADF) lending operations with the ordinary capital resources (OCR) balance sheets and the 11th replenishment of the ADF (ADF 12),2 the available resources for new projects and programs in 2017–2019 is expected to increase by 23% to about $58.6 billion. ADB is committed to using its enhanced financial capacity to expand operations for poverty reduction and sustainable development in Asia and the Pacific through inclusive economic growth, environmentally sustainable growth, and regional integration. This expansion will include support for the commitments of developing member countries (DMCs) under the Sustainable Development Goals and climate change initiatives. Scaling up ADB’s operations is consistent with the international community’s emphasis on increasing infrastructure investment to support global growth.
4. Strong demand for ADB financing. As described in the WPBF, 2017–2019, DMC demand for ADB financing remains strong. ADB has a $69.8 billion cumulative operations pipeline for the WPBF, 2017–2019, compared with $58.6 billion in resources available for approval during the same period. ADB’s strategic priorities are highly relevant and its allocation of resources is aligned with DMC needs.
5. Through the ADF–OCR combination, more resources will be available for approval for poorer DMCs. In May 2016, donors agreed to a $3.3 billion replenishment of the ADF grant window. When combined with ADB’s planned concessional assistance lending of $13.2 billion during 2017–2020, ADB’s concessional resources will increase more than 40% compared with the previous 4 years. During 2017–2020, ADB’s grant support to the poorest countries will increase by 70%; grant allocations to small island economies will more than double. About $52.5 million will be contributed to the ADF facility for regional health security and $500 million to replenish the Technical Assistance Special Fund (TASF). As a result, ADB’s assistance to
1 ADB. 2016. Work Program and Budget Framework, 2017–2019. Manila.
2 ADB. 2016. Eleventh Replenishment of the Asian Development Fund and Sixth Regularized Replenishment of the
Technical Assistance Special Fund. Manila.

2
Group A countries3 is projected to rise by 50%, while the increase for countries classified as fragile and conflict-affected situations4 (FCAS) will be 87% during WPBF, 2017–2019.
6. Knowledge transfer underpins all ADB operations. DMCs expect ADB to combine advanced knowledge and ideas effectively—including the use of high-level technologies in projects and programs—with finance. As such, ADB is working to substantially improve its ability to provide knowledge solutions to its DMCs. DMCs will have better access to ADB’s knowledge through projects and programs as well as knowledge products and services.
7. ADB will also step up support for infrastructure development in lagging areas,5 education, and health. In 2017, ADB plans to meet or exceed the annual targets for food security ($2 billion) and clean energy ($2 billion). ADB’s own climate financing for 2017 is estimated to be $5.5 billion. ADB plans to issue long-term climate change strategic directions in 2017 to build resilience and strengthen climate action across the region. ADB will continue to meet the 45% target, by number of operations, for gender equity and mainstreaming.
8. ADB is committed to increasing its nonsovereign and public–private partnership (PPP) operations, targeting frontier markets and countries where ADB has yet to support nonsovereign and PPP operations. ADB will also respond to the calls by many middle- and upper middle-income countries for more PPPs and private sector participation, as well as a greater role for ADB in supporting new or high-level technologies, exploring new sectors, and supporting new business models. More details on ADB’s strategic nonsovereign and PPP priorities are in the WPBF, 2017–2019.
9. New long-term strategy. ADB is preparing a new long-term strategy leading to 2030. ADB will consult with relevant stakeholders throughout 2017. ADB plans to prepare a zero draft of the strategy by the end of 2016. This draft will provide the basis for convening a series of roundtable workshops with independent experts, policy think tanks, and other professionals to obtain their feedback on the proposals. A first draft of the strategy will be ready in mid-2017, and formal Board consideration of the strategy will be in 2018. The strategy will help align ADB’s support with the Sustainable Development Goals and the climate agreement of the Conference of the Parties. It will take into account the fast-transforming development landscape of Asia and the Pacific, the changing expectations of ADB clients, and the increased diversity of financing resources available to them. 10. Policy reviews. ADB has been reviewing a number of financial and operations-related policies to enhance operations growth and to manage the risks in scaling up operations from the ADF–OCR combination. ADB initiated reviews of its financing products and business processes6 to meet the growing complexity of the operating environment and the diverse needs of DMCs in different stages of development—from direct poverty interventions in FCAS and Group A countries to inclusive growth support and knowledge solutions in some of the larger
3 Group A countries are defined as countries having access to concessional assistance only, while Group B countries have access to both concessional and regular OCR assistance. Group C countries have access to regular OCR only.
4 The nine DMCs classified as FCAS in 2016 are Afghanistan, Kiribati, Marshall Islands, Federated States of
Micronesia, Myanmar, Nauru, Papua New Guinea, Solomon Islands, and Tuvalu. 5 A lagging area is defined as an area that is behind other areas when comparing socioeconomic characteristics.
Specification of a lagging area requires a comparison within a DMC to determine which areas are behind others. 6 Business processes under review include loan processing under sovereign operations, additional financing, and
technical assistance.
3
middle-income countries. ADB will accelerate the policy reviews and substantially complete them by the end of 2017 in order to support the scale up in operations. 11. Institutional priorities. ADB has been preparing for a higher and more efficient level of operations. The Midterm Review of Strategy 2020 Action Plan,7 launched in July 2014, is an institutional reform agenda to make ADB stronger, better, and faster. At the end of September 2016, 71% of 192 actions had been fully implemented, 14% largely implemented, 12% partially implemented, and 3% not yet implemented.8 ADB will continue working on the remaining actions in 2017, including (i) strengthening field offices, (ii) improving portfolio management, and (iii) investing in ADB’s information technology (IT) systems. Organizational resilience9 is another institutional priority of 2017 that was not covered by the midterm review. These areas will account for an increasing share of ADB’s internal administrative expenses (IAE) budget from 2017.
12. The key features of the planned human resources reforms in 2017 will include strengthening performance management, more strategic staffing, strengthening recruitment, increased mobility across the organization, flexible position management, and career and talent management. To support institutional gender equality, ADB will implement new actions in 2017, including increased gender targets to be achieved by 2022. Reforms to the Staff Retirement Plan (SRP) and Group Medical Insurance Plan (GMIP) will be implemented in 2017.
13. ADB continues to explore opportunities to streamline operations and adjust organizational units to operate more effectively. Efficiency and productivity gains are expected to offset volume growth in the 2017 budget. Additional staff optimization measures will support scaling up and expanding the scope of ADB operations.
14. To ensure the timely availability of budgetary resources for priority areas and to optimize resources, ADB introduced enhanced budget management flexibility measures in mid-2016. These measures will facilitate the timely redeployment of resources within the approved budget envelope. B. Financial Outlook and Approach to 2017 Budget
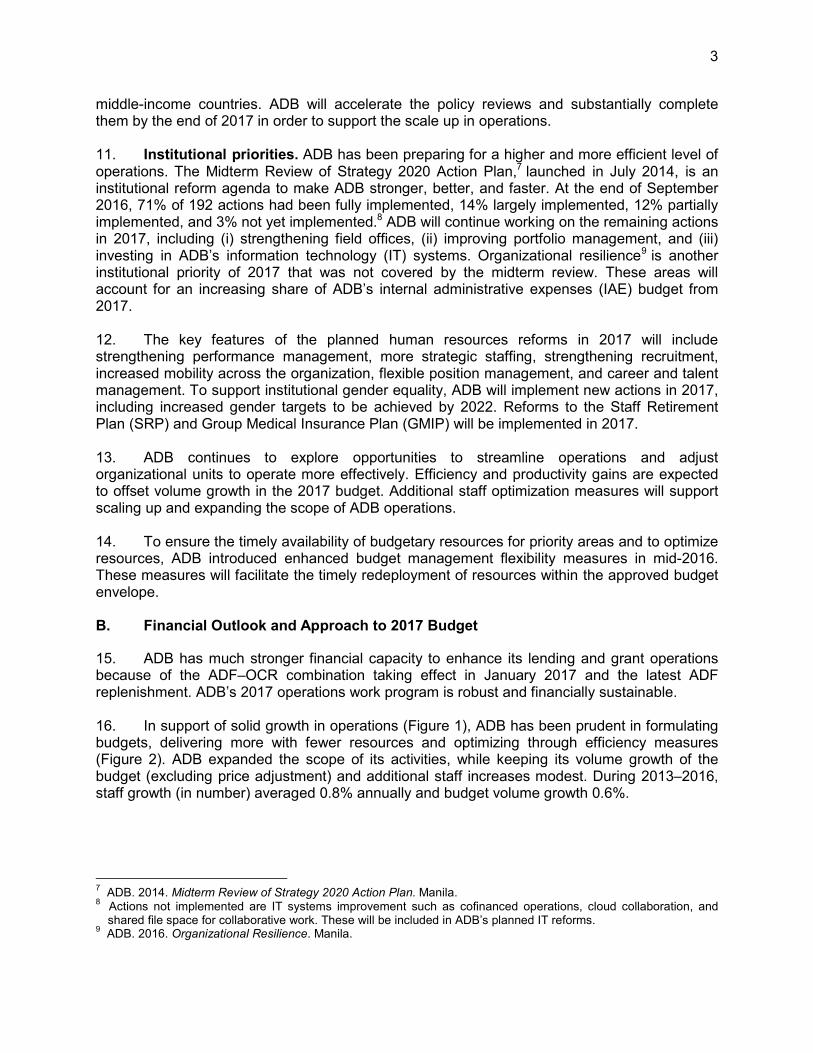
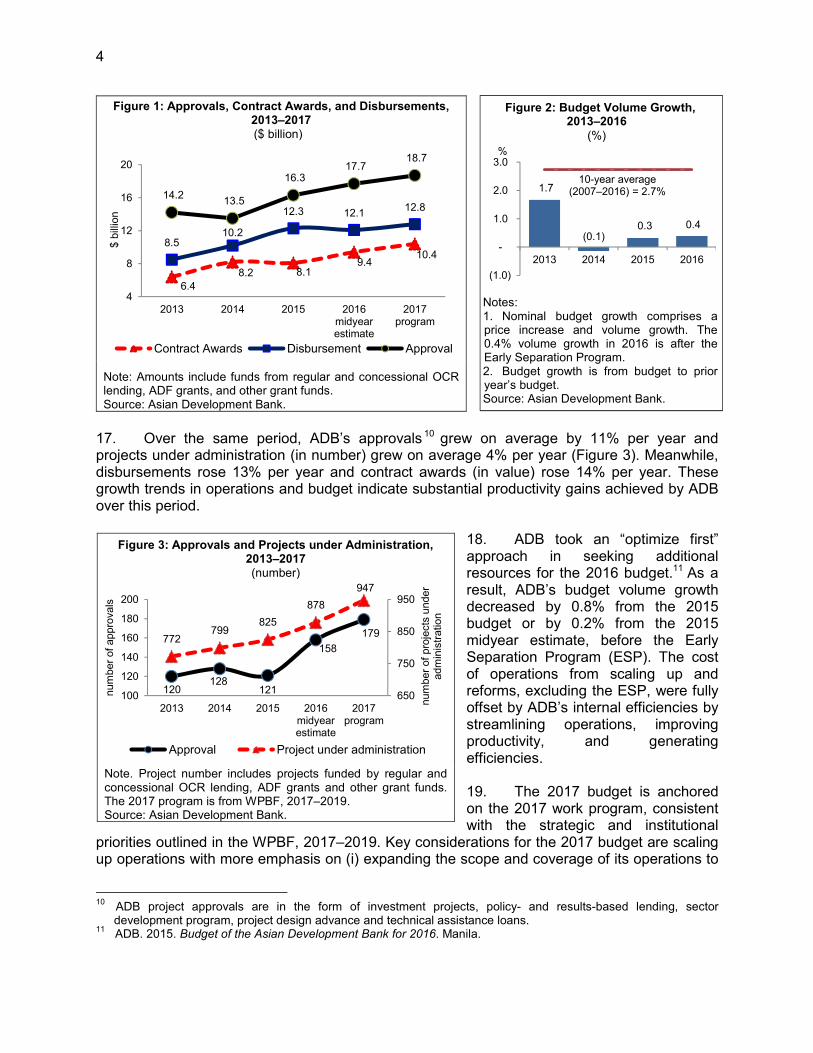
15. ADB has much stronger financial capacity to enhance its lending and grant operations because of the ADF–OCR combination taking effect in January 2017 and the latest ADF replenishment. ADB’s 2017 operations work program is robust and financially sustainable. 16. In support of solid growth in operations (Figure 1), ADB has been prudent in formulating budgets, delivering more with fewer resources and optimizing through efficiency measures (Figure 2). ADB expanded the scope of its activities, while keeping its volume growth of the budget (excluding price adjustment) and additional staff increases modest. During 2013–2016, staff growth (in number) averaged 0.8% annually and budget volume growth 0.6%.
7 ADB. 2014. Midterm Review of Strategy 2020 Action Plan. Manila.
8 Actions not implemented are IT systems improvement such as cofinanced operations, cloud collaboration, and
shared file space for collaborative work. These will be included in ADB’s planned IT reforms. 9 ADB. 2016. Organizational Resilience. Manila.
4
Figure 1: Approvals, Contract Awards, and Disbursements, 2013–2017
($ billion)
Note: Amounts include funds from regular and concessional OCR lending, ADF grants, and other grant funds. Source: Asian Development Bank.
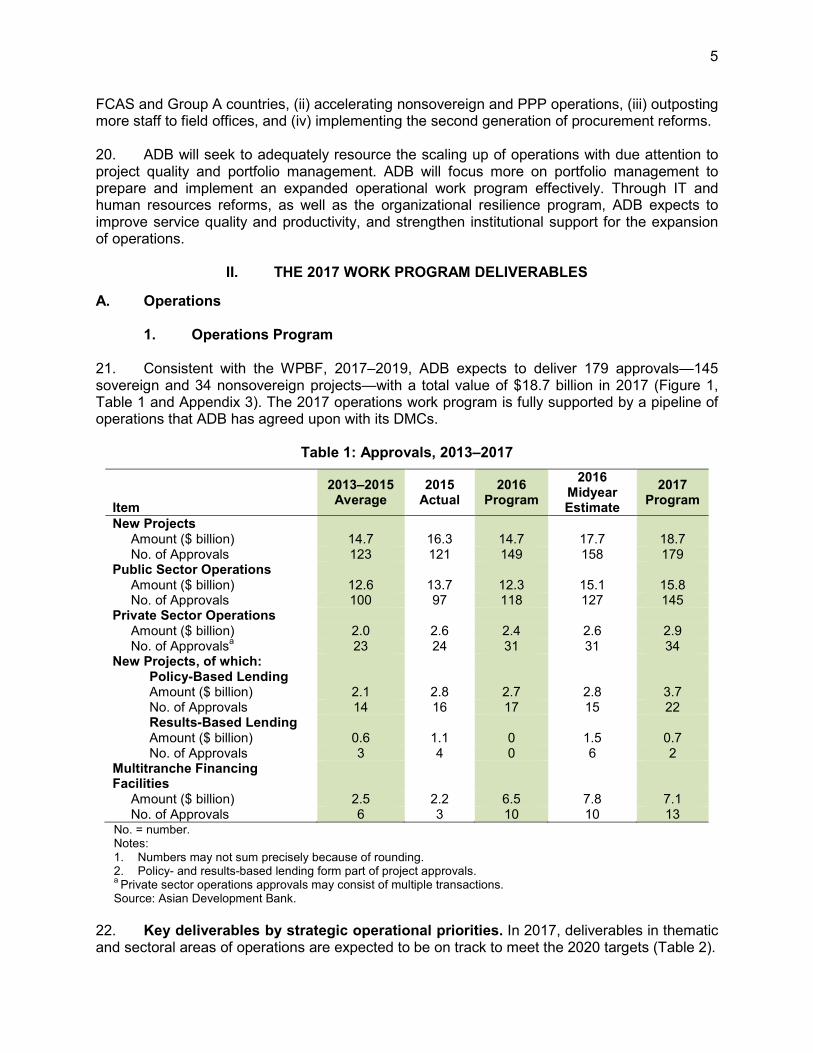
17. Over the same period, ADB’s approvals 10 grew on average by 11% per year and projects under administration (in number) grew on average 4% per year (Figure 3). Meanwhile, disbursements rose 13% per year and contract awards (in value) rose 14% per year. These growth trends in operations and budget indicate substantial productivity gains achieved by ADB over this period.
18. ADB took an “optimize first” approach in seeking additional resources for the 2016 budget.11 As a result, ADB’s budget volume growth decreased by 0.8% from the 2015 budget or by 0.2% from the 2015 midyear estimate, before the Early Separation Program (ESP). The cost of operations from scaling up and reforms, excluding the ESP, were fully offset by ADB’s internal efficiencies by streamlining operations, improving productivity, and generating efficiencies. 19. The 2017 budget is anchored on the 2017 work program, consistent with the strategic and institutional
priorities outlined in the WPBF, 2017–2019. Key considerations for the 2017 budget are scaling up operations with more emphasis on (i) expanding the scope and coverage of its operations to
10
ADB project approvals are in the form of investment projects, policy- and results-based lending, sector development program, project design advance and technical assistance loans.
11 ADB. 2015. Budget of the Asian Development Bank for 2016. Manila.
Figure 3: Approvals and Projects under Administration, 2013–2017
(number)
Note. Project number includes projects funded by regular and concessional OCR lending, ADF grants and other grant funds. The 2017 program is from WPBF, 2017–2019. Source: Asian Development Bank.
6.4
8.2 8.19.4
10.48.5
10.2
12.3 12.112.8
14.2 13.5
16.3 17.7
18.7
4
8
12
16
20
2013 2014 2015 2016midyearestimate
2017program
$ b
illio
n
Contract Awards Disbursement Approval
120128
121
158
179772
799825
878
947
650
750
850
950
100
120
140
160
180
200
2013 2014 2015 2016midyearestimate
2017program
num
ber
of pro
jects
under
adm
inis
tration
num
ber
of appro
vals
Approval Project under administration
Figure 2: Budget Volume Growth, 2013–2016
(%)
Notes: 1. Nominal budget growth comprises a price increase and volume growth. The 0.4% volume growth in 2016 is after the Early Separation Program. 2. Budget growth is from budget to prior year’s budget. Source: Asian Development Bank.
1.7
(0.1)0.3 0.4
(1.0)
-
1.0
2.0
3.0
2013 2014 2015 2016
%
10-year average(2007–2016) = 2.7%
5
FCAS and Group A countries, (ii) accelerating nonsovereign and PPP operations, (iii) outposting more staff to field offices, and (iv) implementing the second generation of procurement reforms. 20. ADB will seek to adequately resource the scaling up of operations with due attention to project quality and portfolio management. ADB will focus more on portfolio management to prepare and implement an expanded operational work program effectively. Through IT and human resources reforms, as well as the organizational resilience program, ADB expects to improve service quality and productivity, and strengthen institutional support for the expansion of operations.
II. THE 2017 WORK PROGRAM DELIVERABLES
A. Operations
1. Operations Program 21. Consistent with the WPBF, 2017–2019, ADB expects to deliver 179 approvals—145 sovereign and 34 nonsovereign projects—with a total value of $18.7 billion in 2017 (Figure 1, Table 1 and Appendix 3). The 2017 operations work program is fully supported by a pipeline of operations that ADB has agreed upon with its DMCs.
Table 1: Approvals, 2013–2017
Item
2013–2015 Average
2015 Actual
2016 Program
2016 Midyear Estimate
2017 Program
New Projects Amount ($ billion) 14.7 16.3 14.7 17.7 18.7
No. of Approvals 123 121 149 158 179 Public Sector Operations
Amount ($ billion) 12.6 13.7 12.3 15.1 15.8 No. of Approvals 100 97 118 127 145 Private Sector Operations
Amount ($ billion) 2.0 2.6 2.4 2.6 2.9 No. of Approvals
a 23 24 31 31 34
New Projects, of which: Policy-Based Lending
Amount ($ billion) 2.1 2.8 2.7 2.8 3.7 No. of Approvals 14 16 17 15 22 Results-Based Lending
Amount ($ billion) 0.6 1.1 0 1.5 0.7 No. of Approvals 3 4 0 6 2 Multitranche Financing Facilities
Amount ($ billion) 2.5 2.2 6.5 7.8 7.1 No. of Approvals 6 3 10 10 13 No. = number. Notes: 1. Numbers may not sum precisely because of rounding. 2. Policy- and results-based lending form part of project approvals. a
Private sector operations approvals may consist of multiple transactions. Source: Asian Development Bank.
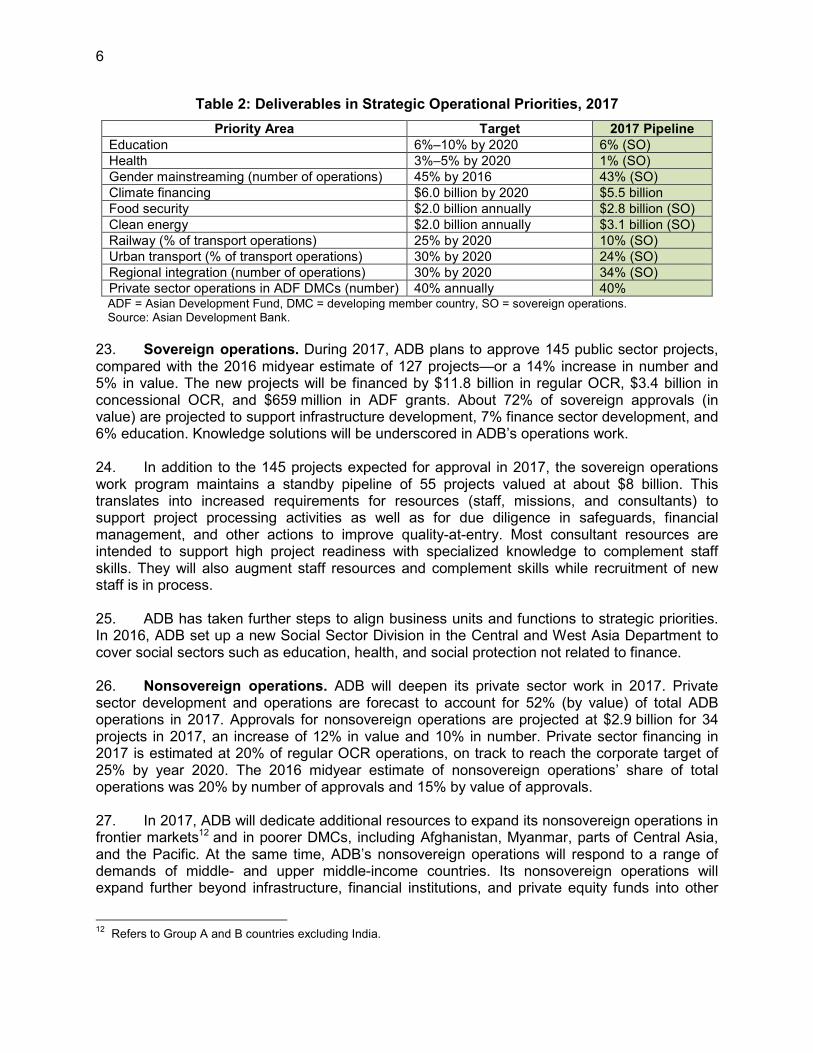
22. Key deliverables by strategic operational priorities. In 2017, deliverables in thematic and sectoral areas of operations are expected to be on track to meet the 2020 targets (Table 2).
6
Table 2: Deliverables in Strategic Operational Priorities, 2017
Priority Area Target 2017 Pipeline
Education 6%–10% by 2020 6% (SO) Health 3%–5% by 2020 1% (SO) Gender mainstreaming (number of operations) 45% by 2016 43% (SO) Climate financing $6.0 billion by 2020 $5.5 billion Food security $2.0 billion annually $2.8 billion (SO) Clean energy $2.0 billion annually $3.1 billion (SO) Railway (% of transport operations) 25% by 2020 10% (SO) Urban transport (% of transport operations) 30% by 2020 24% (SO) Regional integration (number of operations) 30% by 2020 34% (SO) Private sector operations in ADF DMCs (number) 40% annually 40% ADF = Asian Development Fund, DMC = developing member country, SO = sovereign operations. Source: Asian Development Bank.
23. Sovereign operations. During 2017, ADB plans to approve 145 public sector projects, compared with the 2016 midyear estimate of 127 projects—or a 14% increase in number and 5% in value. The new projects will be financed by $11.8 billion in regular OCR, $3.4 billion in concessional OCR, and $659 million in ADF grants. About 72% of sovereign approvals (in value) are projected to support infrastructure development, 7% finance sector development, and 6% education. Knowledge solutions will be underscored in ADB’s operations work. 24. In addition to the 145 projects expected for approval in 2017, the sovereign operations work program maintains a standby pipeline of 55 projects valued at about $8 billion. This translates into increased requirements for resources (staff, missions, and consultants) to support project processing activities as well as for due diligence in safeguards, financial management, and other actions to improve quality-at-entry. Most consultant resources are intended to support high project readiness with specialized knowledge to complement staff skills. They will also augment staff resources and complement skills while recruitment of new staff is in process.
25. ADB has taken further steps to align business units and functions to strategic priorities. In 2016, ADB set up a new Social Sector Division in the Central and West Asia Department to cover social sectors such as education, health, and social protection not related to finance.
26. Nonsovereign operations. ADB will deepen its private sector work in 2017. Private sector development and operations are forecast to account for 52% (by value) of total ADB operations in 2017. Approvals for nonsovereign operations are projected at $2.9 billion for 34 projects in 2017, an increase of 12% in value and 10% in number. Private sector financing in 2017 is estimated at 20% of regular OCR operations, on track to reach the corporate target of 25% by year 2020. The 2016 midyear estimate of nonsovereign operations’ share of total operations was 20% by number of approvals and 15% by value of approvals.
27. In 2017, ADB will dedicate additional resources to expand its nonsovereign operations in frontier markets12 and in poorer DMCs, including Afghanistan, Myanmar, parts of Central Asia, and the Pacific. At the same time, ADB’s nonsovereign operations will respond to a range of demands of middle- and upper middle-income countries. Its nonsovereign operations will expand further beyond infrastructure, financial institutions, and private equity funds into other
12
Refers to Group A and B countries excluding India.

7
areas of private sector need in DMCs. This includes building the agribusiness focus across Asia with a strong emphasis on (i) underserved markets, (ii) food security and safety, (iii) productivity upgrades, and (iv) farmer support, as well as health and education. ADB will substantially increase its direct equity investments, estimated to grow to some 10% of annual nonsovereign commitments by the end of 2019.
28. Substantial additional costs and challenges of doing nonsovereign operations are expected, such as (i) working on smaller and riskier deals in frontier countries, (ii) undertaking more equity investments, (iii) exercising heightened integrity due diligence, and (iv) monitoring more complex and riskier deals. 29. Public–private partnerships. In 2016, ADB realigned the Office of Public–Private Partnership (OPPP) to provide more focus on each business function and to scale up operations to respond to client needs (Box 1). Staff instructions on transaction advisory services (TAS) are being developed to clarify the governing rules and procedures. The instructions are expected to be finalized in early 2017.
30. From May 2015 to July 2016, four TAS mandates were secured from DMC clients, each having started implementation with OPPP advisory teams; the 2016 year-end target is five mandates. By the end of 2017, ADB aims to secure four additional TAS mandates, increasing to nine the number of mandates being implemented by OPPP.
31. The Asia Pacific Project Preparation Facility began operations in January 2016 after donors approved the implementation guidelines. As of September 2016, two applications had been approved and 28 applications and expressions of interest were being pursued. In 2017, ADB is targeting approval of at least six applications, which doubles the target set for 2016. 32. To successfully scale up the TAS function and ensure timely and effective delivery of services in response to growing DMC demand, more staff and consultant resources are needed. To secure new mandates, ADB normally pursues three times the number of targeted mandates. Implementation of a mandate is resource intensive and can span several years. As the business stabilizes in the medium-term, ADB expects to recover its internal administrative costs through fees. Strong follow-up activity with DMC clients and targeted hands-on assistance is also necessary to expand DMCs’ utilization of the Asia Pacific Project Preparation Facility.
33. Efficiency in operations. To meet the expanded operations work program, ADB rolled out the enhancing operational efficiency initiative13 and reforms in country partnership strategy
13
ADB. 2015. Enhancing Operational Efficiency of the Asian Development Bank. Manila.
Box 1: Scaling Up in the Office of Public–Private Partnership
Transaction advisory services team. In addition to ramping up of transaction advisory services (TAS) serving public sector clients, the Office of Public–Private Partnership established a second TAS team in May 2016 to serve private sector sponsors on a pilot basis. The private sector TAS team immediately began marketing efforts by reaching out to key sponsors active in the region. Public–private partnership operations and resources team. This team was created in January 2016 to manage and oversee the pan-regional Asia Pacific Project Preparation Facility, conduct market research on public–private partnerships, and coordinate with external project preparation facilities such as the Global Infrastructure Facility. Source: Asian Development Bank.
8
(CPS) 14 preparations in 2015—all with elements of simplified and streamlined business processes, procedures, and delegated decision making. Although the savings from these efficiency measures helped to contain volume growth in the 2016 budget, the work is ongoing and further efficiencies are expected. ADB’s Operations Manual and related staff instructions dealing with business processes for sovereign and nonsovereign operations are still being updated. 34. To further improve operational efficiency and ensure project quality, ADB is working on alleviating the concentration of matters requiring Board approval in the fourth quarter. The task force has finalized its recommendations, which will be implemented in 2017.15
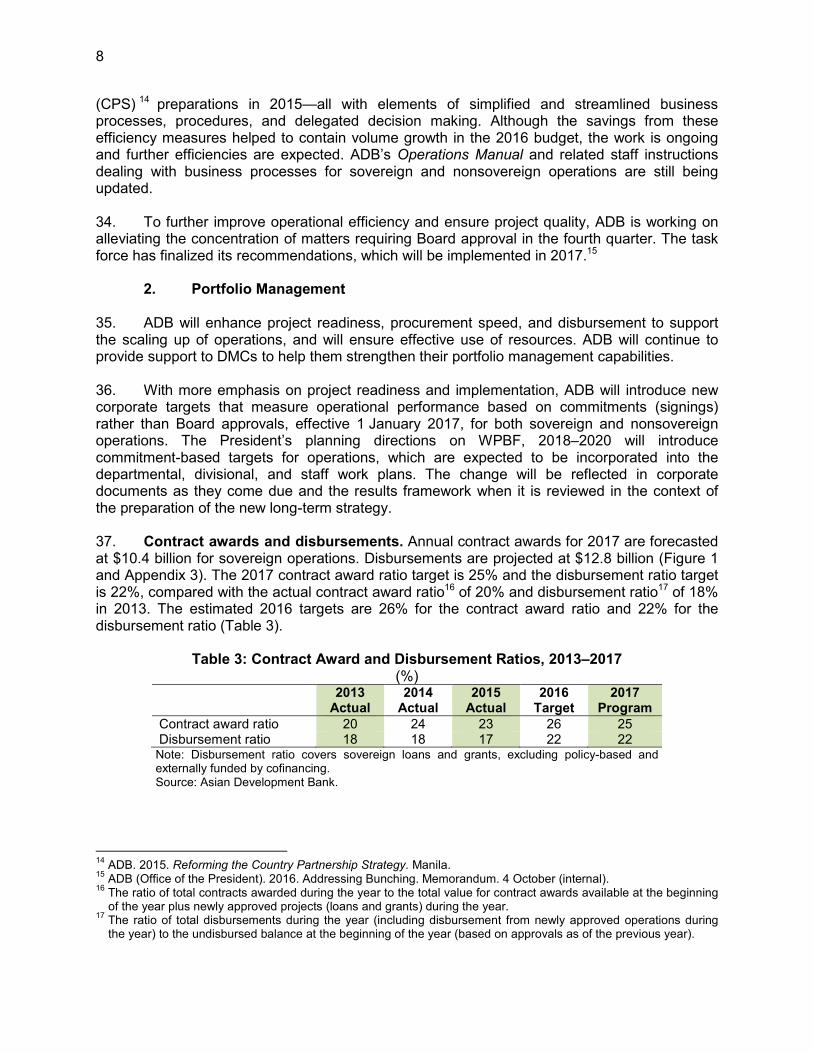
2. Portfolio Management 35. ADB will enhance project readiness, procurement speed, and disbursement to support the scaling up of operations, and will ensure effective use of resources. ADB will continue to provide support to DMCs to help them strengthen their portfolio management capabilities. 36. With more emphasis on project readiness and implementation, ADB will introduce new corporate targets that measure operational performance based on commitments (signings) rather than Board approvals, effective 1 January 2017, for both sovereign and nonsovereign operations. The President’s planning directions on WPBF, 2018–2020 will introduce commitment-based targets for operations, which are expected to be incorporated into the departmental, divisional, and staff work plans. The change will be reflected in corporate documents as they come due and the results framework when it is reviewed in the context of the preparation of the new long-term strategy. 37. Contract awards and disbursements. Annual contract awards for 2017 are forecasted at $10.4 billion for sovereign operations. Disbursements are projected at $12.8 billion (Figure 1 and Appendix 3). The 2017 contract award ratio target is 25% and the disbursement ratio target is 22%, compared with the actual contract award ratio16 of 20% and disbursement ratio17 of 18% in 2013. The estimated 2016 targets are 26% for the contract award ratio and 22% for the disbursement ratio (Table 3).
Table 3: Contract Award and Disbursement Ratios, 2013–2017
(%) 2013
Actual 2014
Actual 2015
Actual 2016
Target 2017
Program
Contract award ratio 20 24 23 26 25 Disbursement ratio 18 18 17 22 22
Note: Disbursement ratio covers sovereign loans and grants, excluding policy-based and externally funded by cofinancing. Source: Asian Development Bank.
14
ADB. 2015. Reforming the Country Partnership Strategy. Manila. 15
ADB (Office of the President). 2016. Addressing Bunching. Memorandum. 4 October (internal). 16
The ratio of total contracts awarded during the year to the total value for contract awards available at the beginning of the year plus newly approved projects (loans and grants) during the year.
17 The ratio of total disbursements during the year (including disbursement from newly approved operations during the year) to the undisbursed balance at the beginning of the year (based on approvals as of the previous year).

9
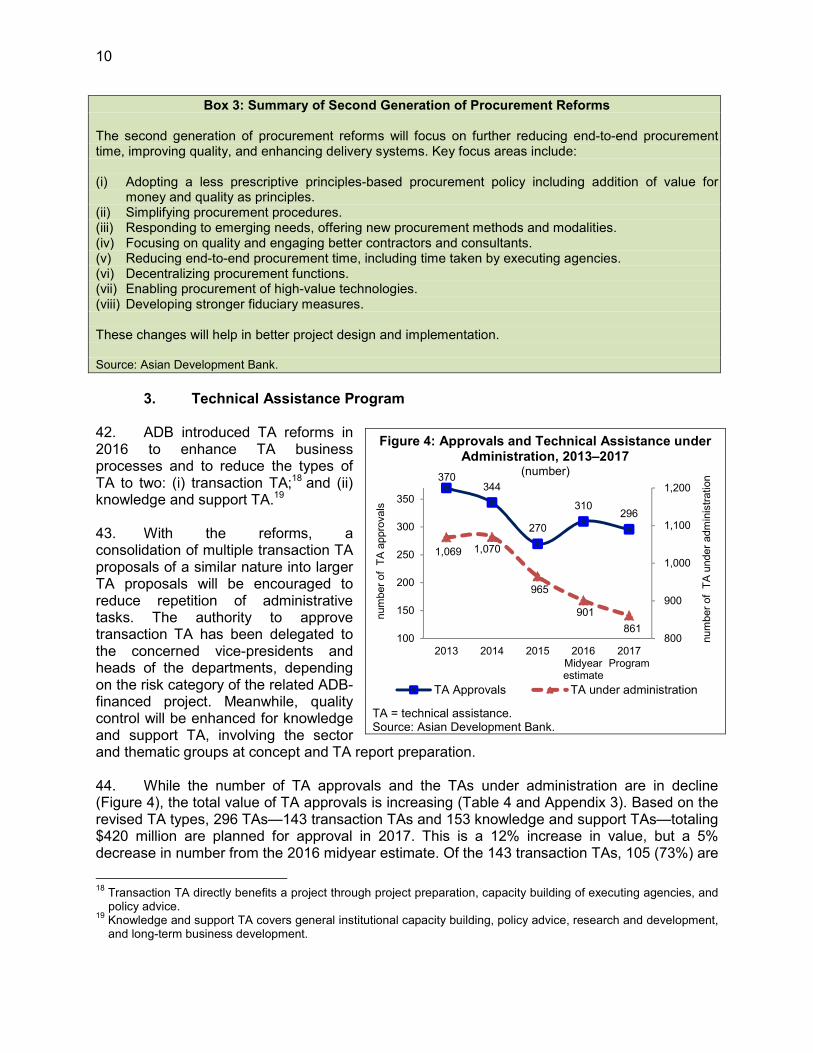
38. Projects under administration. The size of the portfolio continues to grow. By the end of 2017, ADB estimates an active portfolio of 947 projects under administration (Figure 3 and Appendix 3). The sovereign portfolio (or public sector projects under administration), financed from ADF and OCR, is expected to increase by 7% to 731 projects in 2017 from 684 in 2016. The nonsovereign portfolio is expected to increase by 11% to 216 projects in 2017 from 194 in 2016. As part of technical assistance (TA) reforms, ADB plans to reduce the number of TAs under administration by 4% from 901 in 2016 to 861 in 2017 (Figure 4).
39. Operations departments will dedicate more resources to advancing portfolio management actions, including enhancing project readiness, intensifying portfolio oversight, and promoting timely procurement and disbursement. More staff will be outposted to the field to provide more direct client service and development impact. Some field offices will review space planning to accommodate outposted staff. In 2017, three procurement specialists are expected to be outposted to field offices and about nine will be placed in key sector divisions in headquarters to provide support for the second generation of procurement reforms. 40. Procurement efficiency. Box 2 summarizes the results of the 10-point procurement reform action plan instituted in 2015.
41. The second generation of procurement reforms is planned for approval in the first quarter of 2017 and implementation in the second half of 2017 to reduce end-to-end procurement time, enhance quality, and improve delivery systems (Box 3).
Box 2: Results of 10-Point Procurement Reform Action Plan
The 10-point procurement reform action plan under the Midterm Review of Strategy 2020 Action Plan has achieved the following results: (i) 12 country risk assessments have been completed. (ii) 26 developing member countries have adopted the revised thresholds for international competitive
bidding. (iii) All regional departments have implemented new Procurement Committee and regional
department decision authorities. (iv) A procurement review system based on information technology has been mainstreamed and 272
transactions have used it in 2016. (v) Risk-based post review (sampling) has been adopted in five projects in four countries. (vi) 47 projects were classified as category A
a for hands-on support by procurement specialists.
(vii) 32 projects have adopted master bidding documents. (viii) Recruitment time for technical assistance consulting firms has been reduced from 263 days in
2014 to 237 days in 2015. (ix) Overall time for procurement decision has reduced by 16% in the first 6 months of 2016, and time
taken by the Asian Development Bank has been reduced by 28%. (x) Contract awards and disbursements have increased year-on-year in the first half of 2016, on track
to meet the targets. a Category A refers to a project that is likely to have significant adverse environmental impacts that are irreversible,
diverse, or unprecedented; or, significant involuntary resettlement impacts; or, significant impacts on indigenous peoples.
10
370344
270
310296
1,069 1,070
965
901
861 800
900
1,000
1,100
1,200
100
150
200
250
300
350
2013 2014 2015 2016Midyearestimate
2017Program
num
ber
of T
A u
nder
adm
inis
tration
num
ber
of T
A a
ppro
vals
TA Approvals TA under administration
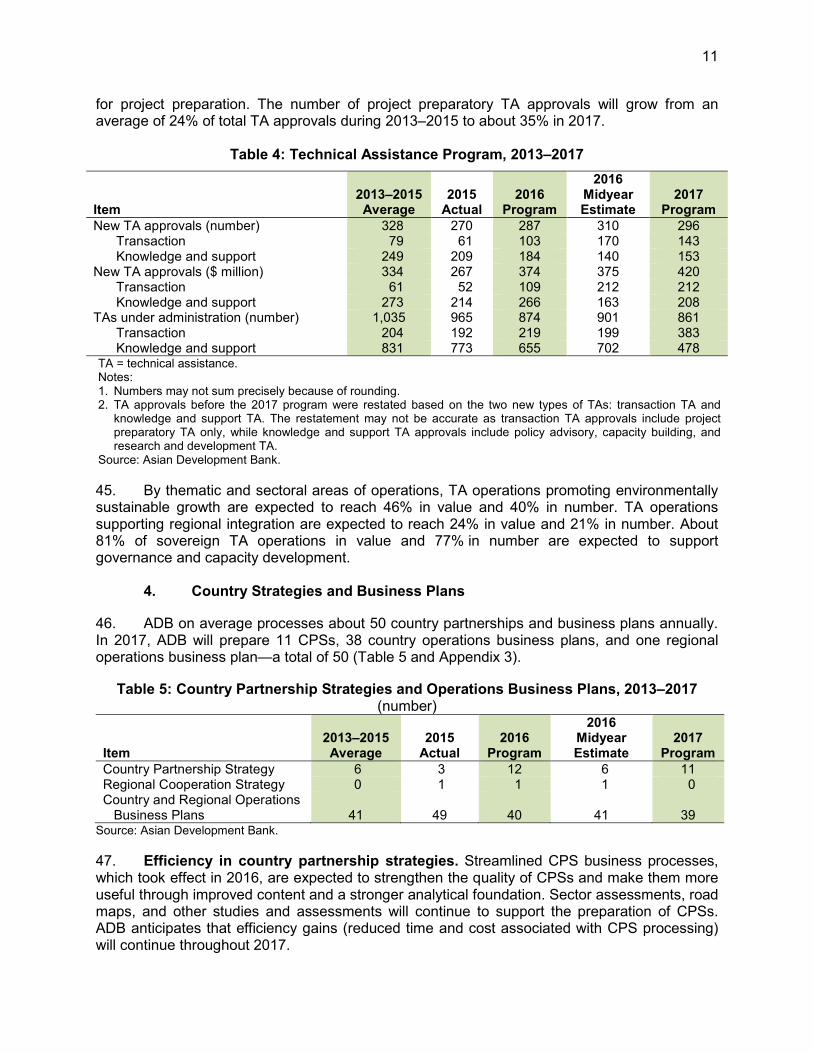
Box 3: Summary of Second Generation of Procurement Reforms
The second generation of procurement reforms will focus on further reducing end-to-end procurement time, improving quality, and enhancing delivery systems. Key focus areas include: (i) Adopting a less prescriptive principles-based procurement policy including addition of value for
money and quality as principles. (ii) Simplifying procurement procedures. (iii) Responding to emerging needs, offering new procurement methods and modalities. (iv) Focusing on quality and engaging better contractors and consultants. (v) Reducing end-to-end procurement time, including time taken by executing agencies. (vi) Decentralizing procurement functions. (vii) Enabling procurement of high-value technologies. (viii) Developing stronger fiduciary measures. These changes will help in better project design and implementation. Source: Asian Development Bank.
3. Technical Assistance Program
42. ADB introduced TA reforms in 2016 to enhance TA business processes and to reduce the types of TA to two: (i) transaction TA;18 and (ii) knowledge and support TA.19 43. With the reforms, a consolidation of multiple transaction TA proposals of a similar nature into larger TA proposals will be encouraged to reduce repetition of administrative tasks. The authority to approve transaction TA has been delegated to the concerned vice-presidents and heads of the departments, depending on the risk category of the related ADB-financed project. Meanwhile, quality control will be enhanced for knowledge and support TA, involving the sector and thematic groups at concept and TA report preparation. 44. While the number of TA approvals and the TAs under administration are in decline (Figure 4), the total value of TA approvals is increasing (Table 4 and Appendix 3). Based on the revised TA types, 296 TAs—143 transaction TAs and 153 knowledge and support TAs—totaling $420 million are planned for approval in 2017. This is a 12% increase in value, but a 5% decrease in number from the 2016 midyear estimate. Of the 143 transaction TAs, 105 (73%) are
18
Transaction TA directly benefits a project through project preparation, capacity building of executing agencies, and policy advice.
19 Knowledge and support TA covers general institutional capacity building, policy advice, research and development, and long-term business development.
Figure 4: Approvals and Technical Assistance under Administration, 2013–2017
(number)
TA = technical assistance. Source: Asian Development Bank.
11
for project preparation. The number of project preparatory TA approvals will grow from an average of 24% of total TA approvals during 2013–2015 to about 35% in 2017.
Table 4: Technical Assistance Program, 2013–2017
Item
2013–2015 Average
2015 Actual
2016 Program
2016 Midyear Estimate
2017 Program
New TA approvals (number) 328 270 287 310 296 Transaction 79 61 103 170 143 Knowledge and support 249 209 184 140 153
New TA approvals ($ million) 334 267 374 375 420 Transaction 61 52 109 212 212 Knowledge and support 273 214 266 163 208
TAs under administration (number) 1,035 965 874 901 861 Transaction 204 192 219 199 383 Knowledge and support 831 773 655 702 478
TA = technical assistance. Notes: 1. Numbers may not sum precisely because of rounding. 2. TA approvals before the 2017 program were restated based on the two new types of TAs: transaction TA and
knowledge and support TA. The restatement may not be accurate as transaction TA approvals include project preparatory TA only, while knowledge and support TA approvals include policy advisory, capacity building, and research and development TA.
Source: Asian Development Bank.
45. By thematic and sectoral areas of operations, TA operations promoting environmentally sustainable growth are expected to reach 46% in value and 40% in number. TA operations supporting regional integration are expected to reach 24% in value and 21% in number. About 81% of sovereign TA operations in value and 77% in number are expected to support governance and capacity development.
4. Country Strategies and Business Plans
46. ADB on average processes about 50 country partnerships and business plans annually. In 2017, ADB will prepare 11 CPSs, 38 country operations business plans, and one regional operations business plan—a total of 50 (Table 5 and Appendix 3).
Table 5: Country Partnership Strategies and Operations Business Plans, 2013–2017 (number)
Item
2013–2015 Average
2015 Actual
2016 Program
2016 Midyear Estimate
2017 Program
Country Partnership Strategy 6 3 12 6 11 Regional Cooperation Strategy 0 1 1 1 0 Country and Regional Operations
Business Plans 41 49 40 41 39 Source: Asian Development Bank.
47. Efficiency in country partnership strategies. Streamlined CPS business processes, which took effect in 2016, are expected to strengthen the quality of CPSs and make them more useful through improved content and a stronger analytical foundation. Sector assessments, road maps, and other studies and assessments will continue to support the preparation of CPSs. ADB anticipates that efficiency gains (reduced time and cost associated with CPS processing) will continue throughout 2017.

12
5. Cofinancing and Credit Enhancement Operations
48. In 2017, about $14.3 billion in cofinancing is expected for investment projects or 76% of the total value of ADB’s stand-alone project financing; TA cofinancing of $240.0 million is estimated for about 55 TAs (Figure 5 and Appendix 3). ADB expects an increase in cofinancing activities in Central and West Asia and the Pacific.
49. In 2016, ADB signed a number of institutional memorandums of understanding and partnership frameworks with development organizations such as the Asian Infrastructure Investment Bank, Eurasian Development Bank, and Australian Department of Foreign Affairs and Trade. Under these arrangements, ADB will strengthen complementary strategic and technical cooperation with cofinanciers. ADB will continue to seek new cofinancing partnerships and expand existing ones, both in the public and private sector. ADB will continue exploring new instruments for leveraging cofinancing.
50. Requirements and demands from cofinancing partners are getting more stringent and complicated, especially in reporting and monitoring. ADB will continue the enhancements of the cofinancing management system for automatic report generation of trust funds to comply with cofinanciers’ reporting requirements. In early 2017, ADB will commence the assessment of the design and development of a donor fund management system—an integrated database of financing partner data, fund commitments, allocation, investment and usage, and cofinancing portfolio reporting. B. Knowledge Program
51. In 2016, the Sustainable Development and Climate Change Department (SDCC) was realigned into three clusters: (i) the Sector Advisory Service Cluster; (ii) the Thematic Advisory Service Cluster; and (iii) the Environment and Safeguards Cluster. This created a unified platform for coordinated thematic service delivery and facilitated integrated cross-sector and thematic solution delivery. Technical advisors of the sector and thematic groups in SDCC, the Economic Research and Regional Cooperation Department, and OPPP will continue to promote knowledge sharing, provide knowledge and expertise to operations departments, and strengthen partnerships with knowledge centers of excellence around the world.
52. In 2017, the Knowledge Sharing and Services Center will be revitalized to improve knowledge management across ADB. ADB will establish new governance standards for knowledge to promote orderly classification and storage of content, and to facilitate the search for, and sharing of, such content. Online knowledge platforms, such as k-Portal and k-Nexus dabatase, will be appropriately funded to ensure ease of access is strengthened and operationally relevant content, both current and historic, is expanded in 2017.
Figure 5: Cofinancing Approvals, 2013–2017 ($ billion)
TA = technical assistance. Source: Asian Development Bank.
2.8 4.8 4.6 5.2 5.83.6
4.3 6.0 7.1
8.5 0.3
0.1 0.1
0.2 0.2
0
5
10
15
20
2013 2014 2015 2016MidyearEstimate
2017Program
TA Official and Other Concessional Commercial
13
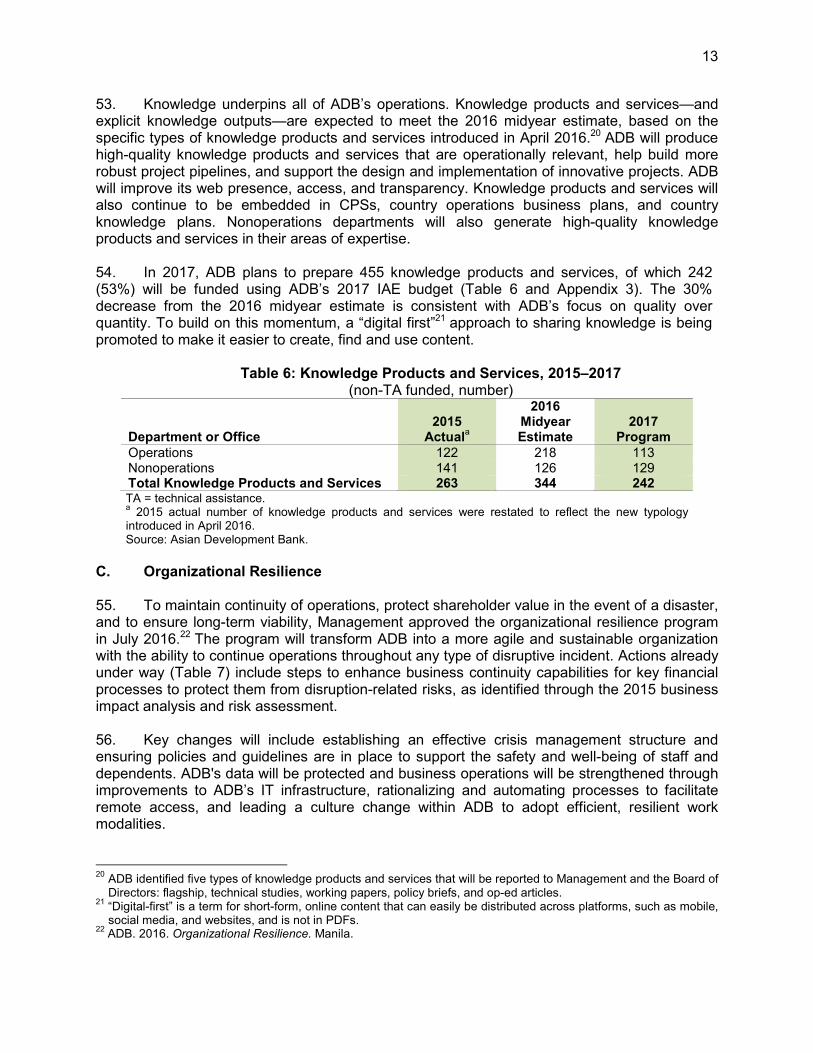
53. Knowledge underpins all of ADB’s operations. Knowledge products and services—and explicit knowledge outputs—are expected to meet the 2016 midyear estimate, based on the specific types of knowledge products and services introduced in April 2016.20 ADB will produce high-quality knowledge products and services that are operationally relevant, help build more robust project pipelines, and support the design and implementation of innovative projects. ADB will improve its web presence, access, and transparency. Knowledge products and services will also continue to be embedded in CPSs, country operations business plans, and country knowledge plans. Nonoperations departments will also generate high-quality knowledge products and services in their areas of expertise.
54. In 2017, ADB plans to prepare 455 knowledge products and services, of which 242 (53%) will be funded using ADB’s 2017 IAE budget (Table 6 and Appendix 3). The 30% decrease from the 2016 midyear estimate is consistent with ADB’s focus on quality over quantity. To build on this momentum, a “digital first”21 approach to sharing knowledge is being promoted to make it easier to create, find and use content.
Table 6: Knowledge Products and Services, 2015–2017
(non-TA funded, number)
Department or Office
2015 Actual
a
2016 Midyear Estimate
2017 Program
Operations 122 218 113 Nonoperations 141 126 129 Total Knowledge Products and Services 263 344 242 TA = technical assistance. a 2015 actual number of knowledge products and services were restated to reflect the new typology
introduced in April 2016. Source: Asian Development Bank.
C. Organizational Resilience 55. To maintain continuity of operations, protect shareholder value in the event of a disaster, and to ensure long-term viability, Management approved the organizational resilience program in July 2016.22 The program will transform ADB into a more agile and sustainable organization with the ability to continue operations throughout any type of disruptive incident. Actions already under way (Table 7) include steps to enhance business continuity capabilities for key financial processes to protect them from disruption-related risks, as identified through the 2015 business impact analysis and risk assessment. 56. Key changes will include establishing an effective crisis management structure and ensuring policies and guidelines are in place to support the safety and well-being of staff and dependents. ADB's data will be protected and business operations will be strengthened through improvements to ADB’s IT infrastructure, rationalizing and automating processes to facilitate remote access, and leading a culture change within ADB to adopt efficient, resilient work modalities.
20
ADB identified five types of knowledge products and services that will be reported to Management and the Board of Directors: flagship, technical studies, working papers, policy briefs, and op-ed articles.
21 “Digital-first” is a term for short-form, online content that can easily be distributed across platforms, such as mobile, social media, and websites, and is not in PDFs.
22 ADB. 2016. Organizational Resilience. Manila.

14
Table 7: Organizational Resilience Implementation Plan, 2016–2021
Enhanced Business Continuity Full Organizational
Resilience
Immediate Actions Short-Term Actions Medium-Term Actions
2016 2017–2018 2019–2021
• Establishment of governance and oversight
• Offshore warm site
• Online data replication of IT financial systems with minimal data loss (less than 12 hours)
• Preparation and finalization of short-term staff outposting
• Automation of financial transaction processes and digitization of other essential files
• Protection of key financial processes
• Availability of backup for nonfinancial systems outside of the headquarters
• Implementation of cloud technologies
• Short-term outposting of OIST and Treasury Department staff
• Setup of SDPC for CTL and recruitment (in future) of local staff (budget neutral) for SDPC operations
• Automation of financial transaction processes and digitization of other essential files
• Business continuity plans for operations departments, OCO, OGC, and OSFMD
• Review of policies, processes, and procedures
• Establishment of interim spending arrangements during a disruption
• Design of organizational resilience communication plan details
• General awareness and training programs
• Extension of cloud technologies
• Long-term resilience plan for critical business processes (CTL, ORM, Treasury) including decentralization and setup of new processing hubs
• Automation of financial transaction processes and digitization of other essential files
• Business continuity plans for all departments
• Ongoing staff awareness and training
CTL = Controller’s Department, IT = information technology, OCO = Office of Cofinancing Operations, OGC = Office of the General Counsel, OIST = Office of Information Systems and Technology, ORM = Office of Risk Management, OSFMD = Operations Services and Financial Management Department, SDPC = secondary disbursement processing center. Source: Asian Development Bank.
57. ADB established the Organizational Resilience Unit in the Office of Administrative Services to lead and manage the organizational resilience program and to coordinate the transition from the 2005 Business Continuity Strategy to a comprehensive organizational resilience framework. The unit will be working with all the departments in charting out and implementing plans to ensure that the systems and processes are robust and can continue to function throughout any disaster or disruption. D. Information Technology Reforms
58. Transforming IT systems is central to ADB’s goal to become a better, stronger, and faster organization. ADB will modernize and integrate its IT systems through its IT reform program called Real-Time ADB. The program covers the automation, simplification, and integration of key systems including (i) operations (nonsovereign and sovereign); (ii) financial (treasury, risk management, and donor fund management); (iii) institutional procurement; and (iv) human resources. This will be supported by modern knowledge management and collaboration tools; faster and more user-friendly reports and dashboards; greater organizational resilience through cloud and mobility services that allow staff to work anywhere, anytime; stronger cyber security; and improved IT services and support to the field offices. Effective data governance and change management will facilitate this reform program. The Real-Time ADB implementation plan is in Table 8.

15
Table 8: Real-Time ADB Implementation Plan, 2016–2019
Projects to Be Initiated
2016 2017 2018–2019
• Establish offshore warm site
• Increase internet bandwidth in headquarters
• Mobility: better data roaming, replace Blackberry with iPhone, introduce iPads, and increase notebook users
• Provide easier and expanded remote access of staff to ADB systems and email
• Institutional eProcurement: sourcing to contract management
• IT security: single password facility and identity management
• NSO: business process reengineering
• Human resources core services and performance management
• Treasury pricing solution
• 10% of IT in the cloud (e-recruit)
• NSO: Credit origination, client relationship, banking solution
• Donor fund management system
• Disbursement system modernization for TA, loans, and grants
• Risk management operations improvement: credit risks, treasury risks, and data enhancements
• Strengthen analytics and reporting: financial, sovereign, and nonsovereign
• Institutional eProcurement: procure to pay solution
• Improve IT security responsiveness, governance, and controls
• Sovereign: eOperations replacement
• Mobility: backend infrastructure and more mobile applications for ADB staff
• Implementation of Office 365 cloud-based collaboration and productivity suite
• Improve IT service delivery model
• 40% of IT in the cloud
• Human resources learning management
• Strengthen IT security: detective and preventive systems
• Institutional eProcurement: rollout to field offices
• Mobility: additional mobile applications
• Treasury collateral management
• 60%–80% of IT in the cloud
IT = information technology, NSO = nonsovereign operations, TA = technical assistance. Source: Asian Development Bank.
59. The capital expenditure necessary to implement the IT reform projects under the Real-Time ADB will be funded mostly from the Information Systems and Technology Strategy III (ISTS III).23 The expanded use of IT and cloud-based services, as well as resulting productivity gains from improved IT systems, will place additional demands on ADB’s IAE budget. In recent years, ADB has been spending a declining percentage of administrative expenses on IT, and there is now a need to catch-up. Greater automation through IT will also drive an increase in support and maintenance costs. Functional and technical enhancements and improvements will be delivered through regular software releases agreed on with ADB business stakeholders. Hub training programs in field offices will continue.
E. Nonoperations 60. Staff Retirement Plan and Group Medical Insurance Plan. Following the comprehensive compensation and benefits review in 2015, two advisory task forces (ATFs) were established to evaluate options for Management’s consideration to strengthen the (i) financial sustainability of the SRP, and (ii) effectiveness and sustainability of GMIP.
23
ADB. 2013. Information Systems and Technology III. Manila.

16
61. Detailed design of the retirement and pension reforms is under way and will be submitted for Board approval in the second quarter of 2017 for implementation on 1 October 2017, the start of the SRP fiscal year. These reforms are intended to place the plan on a more sustainable footing especially by reducing the risk to ADB. 62. Management regards the GMIP as an important part of a competitive benefits package, which allows ADB to continue to attract and retain the best talent. Management has agreed with all of the ATF’s recommendations. Many of the actionable recommendations will be implemented starting 1 January 2017; others will be implemented during 2017–2018.
63. Human resources reforms. ADB plans to undertake human resources reforms in 2017. The reforms include:
(i) strengthened performance management;
(ii) more strategic staffing, a new mobility framework, the introduction of flexible position management, and mainstreaming of workforce analysis;
(iii) new recruitment initiatives, hiring a pool of experts, and streamlined recruitment processes;
(iv) enhanced career and talent management to facilitate strategic and more mobile staffing, as well as building up line managers’ capacity in talent development and management; and
(v) improved diversity and inclusion, including through the implementation of an action plan to increase recruitment and retention of female international staff (Appendix 19). New targets for international staff (IS) women representation by end-2022: 40% IS women overall; 35% IS 9–10; 35% IS 7–8; and 40% IS 4–6.
64. In 2017, ADB plans to complete the review of administrative orders to support human resources reforms such as recruitment, mobility, promotion, position management, and career and performance management. 65. Respectful workplace. In 2016, ADB established the Respectful Workplace Unit in the Office of Anticorruption and Integrity, which will become operational in 2017. This will enhance ADB’s ability to appropriately address bullying and harassment. Additional resources will be provided in 2017 for this initiative.
III. INDEPENDENT EVALUATION AND ACCOUNTABILITY MECHANISM
A. Independent Evaluation Department
66. The priorities of the Independent Evaluation Department (IED) revolve around achieving a more manageable work program while keeping content strategically relevant and operationally useful. The work program of IED is aligned with ADB’s corporate priorities, giving inputs for its strategies, policies, and operations, while striking a balance between accountability and learning.24 Evaluation topics are selected in a way that ensures higher effectiveness and impact.
24
IED’s role includes (i) providing timely input to the formulation of ADB policies, strategies, and programs; (ii) providing real-time feedback during loan processing and implementation; (iii) building the evaluation capacity of regional departments and member countries; and (iv) producing strategically relevant knowledge on emerging regional development issues to inform operations and development policies of ADB in its member countries.

17
67. IED’s 2017 work program (Table 9) is anchored on priorities arising from the ADF–OCR merger and preparation of Strategy 2030. Core activities include (i) knowledge work consisting of high-level evaluations and topical papers, (ii) country and project evaluations and validations, (iii) knowledge management and outreach, and (iv) evaluation capacity development.
Table 9: Independent Evaluation Department Work Program, 2013–2017 (number)
2013–2015 Average
2015 Actual
2016 Program
2016 Midyear Estimate
2017 Program Item
Thematic and Corporate Evaluation Program 9 8 9 10 8
Annual Evaluation Review 1 1 1 1 1 Country, Project, Program, and TA 101 91 103 76 85 Synthesis Papers on Evaluation Lessons 0 0 0 0 2
TA = technical assistance. Source: Independent Evaluation Department.
68. In the next 3 years, IED will close a strong evaluation cycle anchored on supporting ADB’s strategic agendas and begin a new one that is more responsive to operational concerns arising from ADB’s expanding portfolio. Beginning in 2017, this will involve (i) scaling up project evaluations, (ii) providing more resources to project evaluations to further strengthen their contributions to high-level evaluations, and (iii) keeping the number of high-level evaluations at manageable levels to ensure the optimum use of limited human resources. Key deliverables for 2017 are summarized in Box 4.
Box 4: Highlights of 2017 Independent Evaluation Department Work Program
A. Thematic and Corporate Evaluation Program (8) (i) 4 corporate or thematic evaluations (ADB Support to Gender and Development; Credit
Enhancement Products; Results-Based Lending Pilot; Review of Policy-Based Lending) (ii) 1 impact evaluation (urban water supply and sanitation projects in Nepal) (iii) 3 topical papers (Directions for Strategy 2030: An Evaluative Perspective; ADB’s Support for
Livable Cities; Water Supply and Sanitation Projects in Sri Lanka: Lessons from ADB, World Bank Group, and Japan International Cooperation Agency)
B. Annual Report (1) Annual Evaluation Review
C. Country, Project, Program, and Technical Assistance (85)
(i) 1 country assistance program evaluation for India (including associated sector assessments)
(ii) 7 validations of country partnership strategy final reviews (Kazakhstan, Mongolia, Philippines, Solomon Islands, Thailand, Turkmenistan, and Uzbekistan)
a
(iii) 12 project or program performance evaluation reports on sovereign operations (iv) 3 project performance evaluation reports on nonsovereign operations (v) 2 technical assistance performance evaluation reports (vi) Validations of 80% of circulated project and program completion reports and 100% of
circulated extended annual review reports (estimated at 60 validations)a
D. Outreach (2) At least 2 synthesis papers on evaluation lessons (on-demand)
a Subject to timely availability of country strategy final review and project and program completion reports.
Source: Independent Evaluation Department.
18
B. Accountability Mechanism
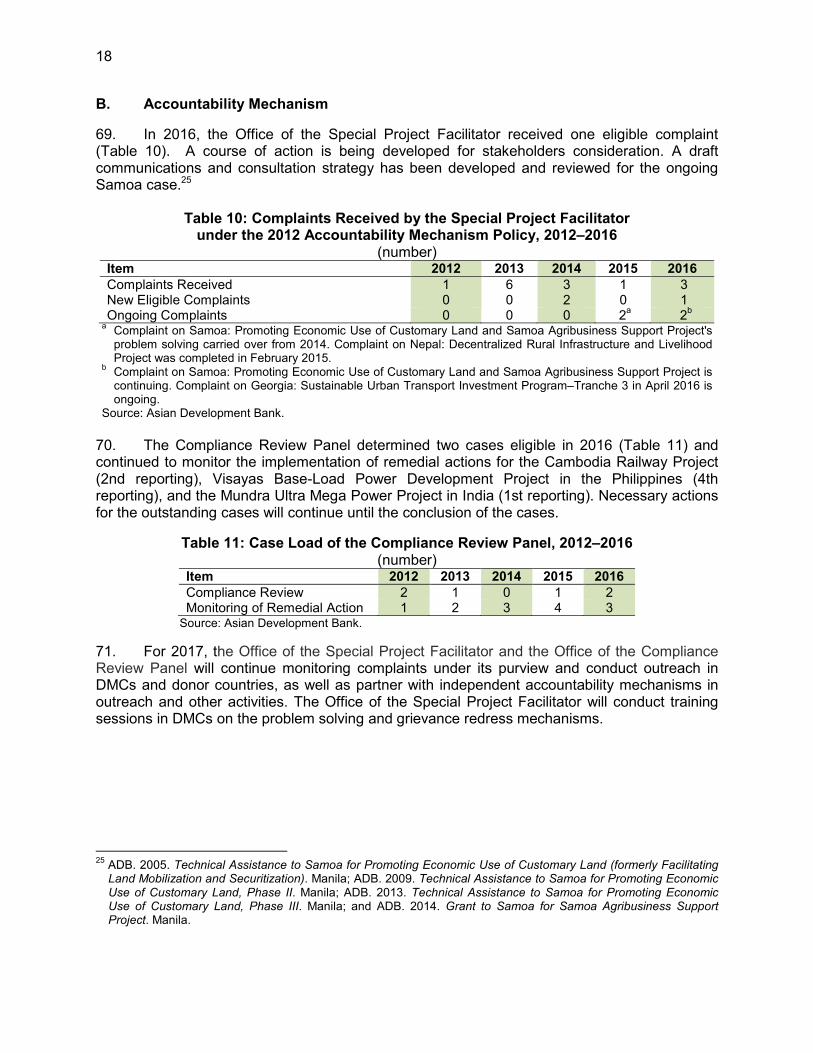
69. In 2016, the Office of the Special Project Facilitator received one eligible complaint (Table 10). A course of action is being developed for stakeholders consideration. A draft communications and consultation strategy has been developed and reviewed for the ongoing Samoa case.25
Table 10: Complaints Received by the Special Project Facilitator under the 2012 Accountability Mechanism Policy, 2012–2016
(number) Item 2012 2013 2014 2015 2016
Complaints Received 1 6 3 1 3 New Eligible Complaints 0 0 2 0 1 Ongoing Complaints 0 0 0 2
a 2
b
a Complaint on Samoa: Promoting Economic Use of Customary Land and Samoa Agribusiness Support Project's problem solving carried over from 2014. Complaint on Nepal: Decentralized Rural Infrastructure and Livelihood Project was completed in February 2015.
b Complaint on Samoa: Promoting Economic Use of Customary Land and Samoa Agribusiness Support Project is continuing. Complaint on Georgia: Sustainable Urban Transport Investment Program–Tranche 3 in April 2016 is ongoing.
Source: Asian Development Bank.
70. The Compliance Review Panel determined two cases eligible in 2016 (Table 11) and continued to monitor the implementation of remedial actions for the Cambodia Railway Project (2nd reporting), Visayas Base-Load Power Development Project in the Philippines (4th reporting), and the Mundra Ultra Mega Power Project in India (1st reporting). Necessary actions for the outstanding cases will continue until the conclusion of the cases.
Table 11: Case Load of the Compliance Review Panel, 2012–2016 (number)
Item 2012 2013 2014 2015 2016
Compliance Review 2 1 0 1 2 Monitoring of Remedial Action 1 2 3 4 3
Source: Asian Development Bank.
71. For 2017, the Office of the Special Project Facilitator and the Office of the Compliance Review Panel will continue monitoring complaints under its purview and conduct outreach in DMCs and donor countries, as well as partner with independent accountability mechanisms in outreach and other activities. The Office of the Special Project Facilitator will conduct training sessions in DMCs on the problem solving and grievance redress mechanisms.
25
ADB. 2005. Technical Assistance to Samoa for Promoting Economic Use of Customary Land (formerly Facilitating Land Mobilization and Securitization). Manila; ADB. 2009. Technical Assistance to Samoa for Promoting Economic Use of Customary Land, Phase II. Manila; ADB. 2013. Technical Assistance to Samoa for Promoting Economic Use of Customary Land, Phase III. Manila; and ADB. 2014. Grant to Samoa for Samoa Agribusiness Support Project. Manila.
19
IV. FINANCIAL RESOURCES
A. Combination of Asian Development Fund Lending Operations with Ordinary Capital Resources Balance Sheet
72. In April 2015, the ADB Board of Governors approved the combination of ADF lending operations with the OCR balance sheet and retention of the ADF as a grants-only operation, effective 1 January 2017. The combination will roughly triple ADB’s equity base and increase ADB’s lending capacity substantially (Figure 6). B. Asian Development Fund
Replenishment
73. The negotiations for ADF 12 and the sixth replenishment of the TASF covering 2017–2020 were concluded on 1 May 2016 on the sideline of the ADB Annual Meeting of the Board of Governors in Frankfurt, Germany.
ADF = Asian Development Fund, OCR = ordinary capital resources, TASF = Technical Assistance Special Fund. Source: Asian Development Bank.
74. To implement ADB’s development priorities and match the increase in concessional lending, donors agreed to a replenishment of $3.8 billion—to be funded by new donor contributions, net income transfers from OCR (subject to annual approvals by the Board of Governors), and liquidity investment income––comprising $3.3 billion for ADF grant operations and $0.5 billion for TASF (Table 12). Of the $3.3 billion for ADF grants, about $2.5 billion would be allocated to the ADF grant operational program (Figure 7).
75. The enhanced grant support will help address development challenges in DMCs that only have access to concessional assistance, while the increase in the TA allocation will help
Item Amount
Total Replenishment Size 3.8
A. Sources of Funding1. Donor contributions 2.62. OCR net income transfer 1.03. Liquidity investment income 0.2
Subtotal 3.8
B. Financing ADF 12 and TASF 61. ADF 12 3.32. TASF 6 0.5
Subtotal 3.8
C. ADF 12 Grant Operations1. ADF grant operational program 2.52. 0.8
Subtotal 3.3
Other ADF facilities and
administrative expenses
($ billion equivalent)
Table 12: Asian Development Fund 12
Replenishment
Figure 6: Useable Equity, 2013–2017 ($ billion)
[The figure has been removed in accordance with para. 97 (i and viii) of ADB‘s Public Communications Policy (2011).]
Figure 7: Financing Framework for ADF XI and ADF 12 ($ billion)
[The figure has been removed in accordance with para. 97 (i and viii) of ADB‘s Public Communications Policy (2011).]

20
countries build institutional capacity and support the preparation and execution of development projects. The resources for concessional lending will be funded from OCR as a result of the ADF–OCR combination. 76. Demand for TA is expected to rise during the ADF 12 period, driven by an increase in overall assistance levels and support for key priorities. Of the $2.6 billion in new donor contributions, $0.5 billion will be allocated to the TASF, a 23% increase from the $0.4 billion allocation in ADF XI. C. Allocation of 2015 Net Income
77. In April 2016, ADB reviewed the allocation of 2015 net income.26 Based on ADB’s medium-term capital adequacy and the net income outlook, the 2015 OCR allocable income of $367.7 million was allocated as follows: (i) $207.7 million to the ordinary reserve, (ii) $120.0 million to the ADF, and (iii) $40.0 million to the TASF. D. Borrowing Program
78. [Information in this para. has been removed in accordance with para. 97 (i and viii) of ADB‘s Public Communications Policy (2011).] 79. [Information in this para. has been removed in accordance with para. 97 (i and viii) of ADB‘s Public Communications Policy (2011).] E. Technical Assistance Funding
80. The major sources of TA funding are the TASF, the Japan Fund for Poverty Reduction (JFPR), and other funds (primarily thematic or country-specific trust funds). The TA program for 2017 is estimated at $420 million. Table 13 presents the actual and planned TA resource for 2014–2017.
Table 13: Technical Assistance Resources, 2014–2017 ($ million)
Actual 2016
Program
2016 Midyear Estimate
2017 Program
Item 2014 2015
Technical Assistance Special Fund 152 139 158 158 171 Japan Fund for Poverty Reduction 41 28 40 45 40 Other Sources
a 110 100 176 172 209
Total Technical Assistance Resources 303 267 374 375 420 Note: Numbers may not sum precisely because of rounding.
a Other sources include special funds and other external sources.
Source: Asian Development Bank.
26
ADB. 2016. Review of the Asian Development Bank’s Allocation of 2015 Net Income. Manila.

21
81. TASF funding comes from donor countries, TASF portions of ADF replenishments, OCR net income allocations, savings and cancellations, and internal resources. As of 30 September 2016, cumulative TASF resources totaled $2.4 billion, comprising (i) direct voluntary contributions ($90.7 million); (ii) TASF portions of ADF V ($72.3 million), ADF VI ($140.8 million), ADF IX ($221.3 million), ADF X ($339.3 million), and ADF XI ($376.2 million); (iii) allocations from OCR net income ($989.0 million); (iv) income from loan recoveries and TASF investments ($211.1 million); and (v) transfers out of TASF to ADF ($3.5 million). TASF resources utilized as of 30 September 2016 totaled $2.3 billion, leaving an unutilized balance of $112.8 million. F. External Funds
82. Effective partnerships with bilateral and multilateral agencies, as well as with philanthropic aid providers, contributed to cumulative TA cofinancing of around $2.0 billion as of 30 September 2016. ADB continues to streamline approaches to partnerships through financing partnership facilities and trust funds, global funding initiatives, and project-specific cofinancing. 83. Financing partnership facilities and its trust funds. Financing partnership facilities—umbrella facilities with a holistic approach to supporting priority sectors and themes—represent a move from “adding cash” to “adding value” in genuine partnership. Further, they pool assistance for targeting cumulative results. ADB has five operational financing partnership facilities covering water, clean energy, regional cooperation and integration, urban sector, and health. Within these priority areas, there are five single- and six multi-partner trust funds as of 30 September 2016, with $575.5 million in fund contributions for grants. 84. Thematic trust funds. Trust funds continue to be an important vehicle for delivering effective development solutions and complement ADB’s TA resources to meet project preparatory, capacity development, and other requests from DMCs. As of 30 September 2016, ADB was administering 22 single- and 10 multi-partner trust funds financing activities in multiple sectors or for specific themes, e.g., disaster risk management, gender and development, good governance, information and communication technology, managing for development results, poverty reduction, and regional trade. 85. Japan Fund for Poverty Reduction. Established in 2000, the JFPR is ADB’s largest single-donor fund. It has supported capacity development, policy and advisory, research and development, and project preparation TAs since 2010. Total contributions for the JFPR reached $742.0 million by 30 September 2016, of which ADB has approved 173 project grants and 209 TA grants. 86. Global Funds. ADB administers resources for six global funds: (i) Climate Investment Funds–Clean Technology Fund; (ii) Climate Investment Funds–Strategic Climate Fund; (iii) Global Environment Facility; (iv) Global Agriculture and Food Security Program; (v) Green Climate Fund; and (vi) Global Partnership for Education Fund.
V. 2017 BUDGETARY RESOURCES
87. The four key cost drivers in formulating the 2017 budget proposal are (i) scaling up operations to meet the strategic priorities of the WPBF, 2017–2019, such as nonsovereign operations and PPP, and operations in FCAS countries and lagging areas; (ii) strengthening project and portfolio quality, and bolstering field office operations to support the Midterm Review Action Plan; (iii) building organizational resilience; and (iv) implementing IT reforms. Expenses for organizational resilience are projected to decline after 2017. IT reforms will require budget

22
increases until 2020, after which ADB expects a decline in IT expenses as depreciation from capital expenditures decreases. IT investments will generate resource savings in future years from productivity gains and cost avoidance. A. Institutional Efficiency and Cost-Saving Measures
88. ADB plans to offset additional resource requirements through efficiency and cost-saving measures implemented across ADB. The additional efficiency measures, such as savings in staff optimization, IT, budget management, business travel, and TA reforms, are estimated to reduce volume growth by $27.8 million in 2017 (Table 14)—equivalent to a 4.4% reduction in budget growth (Table 20). The summary of ADB efficiencies is in Appendix 5.
Table 14: Estimated Incremental Savings from Efficiency Measures, 2017
($ million) Efficiency Measures Estimated Incremental Savings
Staff optimization 17.3 Other efficiency measures Information technology efficiencies 3.6 Review of overseas duty station allowances 1.9 Operations efficiency in planning discretionary expenses 1.6
Budget management and flexibility measures 1.5 Business travel reforms 1.4 Other efficiency improvements 0.5
Total other efficiency measures 10.5 Total savings expected due to improved efficiency 27.8
Source: Asian Development Bank estimates.
89. Staff optimization. ADB will expedite human resources reforms (para. 63) and staff optimization measures (para. 102). In 2017, about $17.3 million in savings are expected from staff optimization. Recruitment assumptions were revised to more closely reflect actual staff years.28 This should result in a more accurate estimate of staffing costs, which in turn will improve utilization rates.
90. Information technology efficiencies. ADB has worked to reduce the underlying administrative expenses supporting IT. The rebidding of wide area network services in 2016 has resulted in a bandwidth improvement between field offices and headquarters of about 450%, with a 40% reduction in cost. This equates to an estimated annual savings of $2.0 million, beginning in 2017. The new wide area network arrangement will significantly increase the resiliency of communications, with field offices now able to communicate with each other, if communications with headquarters is down. Further efficiencies from IT are expected to result in annual savings of $1.6 million. These include IT improvements in institutional procurement and human resource systems, better negotiations with large IT vendors, improved mobility, integration and automation of the website, and improvements to other administrative systems.
91. Review of overseas duty station allowances. In 2016, ADB conducted a review of the overseas duty station allowances, which included changes to the cost of living allowances. This resulted in an increase in the cost of living allowance in 1 location and decreases in 18 locations. These revisions will reduce the budget for overseas duty station allowances by 25% for savings of about $1.9 million annually.
28
A staff year is a unit of time measurement used to estimate staff costs. It refers to the actual fraction of time spent by a staff in a department during the budget year.
23
92. Operations efficiency in planning discretionary expenses. ADB’s efficiency awareness has increased significantly in recent years. During the 2017 budget request cycle, departments conducted detailed internal reviews of requests and applied measures to ensure requests were well substantiated and well planned. Initiatives include increasing the use of videoconference facilities, planning back-to-back missions, and preferred use of national consultants. In 2017, the budget requirements for the operations departments would have been about $1.6 million greater for business travel and staff consultants without this rationalization. 93. Budget management and flexibility measures. ADB is introducing initiatives to improve budgeting with the aim of reducing the gap between the budget and actual expenses. The budget utilization ratio was 90% in 2014 and 89% in 2015. Although utilization for 2016 indicates that full year utilization will be stronger, measures have been introduced to improve performance further. 94. In July 2016, ADB implemented the following measures to increase the flexibility of budgetary resources and the transparency of resource use by departments: (i) delegating authority to transfer budget funds between and across select expense items; (ii) introducing incentives for prudent budget planning, ensuring departments that generate savings through efficiency are not penalized; and (iii) improving budget monitoring through automated monthly and quarterly system notifications on budget utilization. These measures will improve accountability and budget utilization, saving about $1.5 million in 2017. 95. Business travel reforms. ADB implemented travel reforms in 2014, which resulted in greater efficiency in the use of the travel budget and a significant reduction in the average cost of travel. In 2016, ADB initiated additional travel reforms to (i) improve the administrative burden of travel, (ii) simplify policies, and (iii) enhance the eTrip system. These reforms will result in estimated staff time savings of 1,000 working days per year. Policy updates and system changes are under way and expected to be effective in early 2017. Business travel reforms are expected to save about $1.4 million in 2017.
96. Other efficiency improvements. These include business process streamlining in the Office of the General Counsel and the Treasury Department, as well as information resource improvements, efficient use of office space, savings through International Organization for Standardization initiatives, and improvements in ADB’s energy efficiency by the Office of Administrative Services. The combined impact of these improvements is about $0.5 million in 2017. 97. Technical assistance reforms. ADB initiated TA reforms in 201529, which include (i) a revised TA resource allocation process, (ii) a management process to reduce the number of active TAs, (iii) introduction of new and simplified categorizations of TA, (iv) further delegation of authority for TA approvals, and (v) bundling of multiple transaction TA proposals of similar nature into larger TA proposals. Savings from TA reforms have been incorporated into the staff optimization.
29
TA reforms were planned for implementation in three phases. Phase 1 reviewed the allocation process and was completed in January 2015. Phase 2 focused on operations efficiency and resulted in changes to approval authority and policies, completed in December 2015. Phase 3 focuses on process changes and is planned for approval in December 2016.
24
B. Workforce Analysis
98. 2016 workforce analysis and key findings. 2016 workforce analysis estimated the staffing requirements for the scaled-up 2017–2018 operations pipeline. For operations and direct operations support departments, staff coefficients30 were multiplied with the operational deliverables for 2017–2019, while taking into account the country categories (Groups A, B, and C, as well as FCAS). In addition, the analysis took into account the needs of important ongoing and planned initiatives that may not be directly linked with the scaling up of operations. Key findings of the analysis include the following: (i) the trajectory for the scaling up of operations is higher than anticipated by the WPBF, 2016–2018 base case scenario—9% higher for 2017 and 17% higher for 2018–2019; (ii) most sector divisions will have a heavy processing and implementation workload in 2017–2019, in the absence of additional staff resources; and (iii) the anticipated heavy workload for individual departments in 2017–2019 leaves little scope for further redeployments across the operations departments. The higher growth trajectory has implications for the workload of direct operations support departments, such as Controller’s Department, Economic Research and Regional Cooperation Department, Office of the General Counsel, Operations Services and Financial Management Department, and SDCC. 99. Gross staff requirements for 2017–2019. A review of the demand-driven WPBF operational pipelines and the scaling up trajectory—together with the increased focus on project, program, and TA implementation—indicates that more staff will be needed than was envisaged to implement the WPBF, 2016–2018 base case scenario. During the preparation of the WPBF, 2016–2018, the staffing requirements of new initiatives, such as the second generation of procurement reforms and further scaling up of PPP operations (particularly TAS), were not considered. Additional staffing needs have also been identified to strengthen tax integrity and anti-money-laundering due diligence, and for implementing the organizational resilience plan. Capacities in the Budget, Personnel and Management Systems Department will also need strengthening to support human resources reforms including performance management and the surge in recruitment for new positions (para. 63).
100. Other priority staffing needs identified in the WPBF, 2016–2018 include (i) strengthening resident missions (including small resident missions) and resourcing the extended missions; (ii) fully staffing the Myanmar Resident Mission, in accordance with the approved board paper;31 (iii) delivering on the climate change commitments; (iv) strengthening disaster and risk management capacities; (v) strengthening support to FCAS countries; (vi) scaling up the experts pool; and (vii) strengthening the Treasury Department’s operations capacity to support scaling up of operations, including local currency operations.
101. Taking into account the scaling up in operations and other priority needs, gross staffing requirements for 2017–2019 have been estimated at 360. Of these, about 290 positions have been estimated for the scaling up in operations, using the staff time coefficients and the projected growth in the project/program processing and implementation workloads.32 Remaining staff requirements pertain to other priority needs as outlined in paras. 99–100.
30
Each financing modality represents a different level of effort for processing and implementation. As such, coefficients were developed for each major financing modality, including investment projects, sector projects, multitranche financing facilities, sector development programs, policy-based loans, and results-based loans.
31 ADB. 2013. Establishment of a Resident Mission in Myanmar. Manila.
32 Staff time coefficients are the ideal staff time requirements for processing and implementing a project or a program. Staff time coefficients for projects and programs with cofinancing or in FCAS are higher to account for additional effort required in such cases.
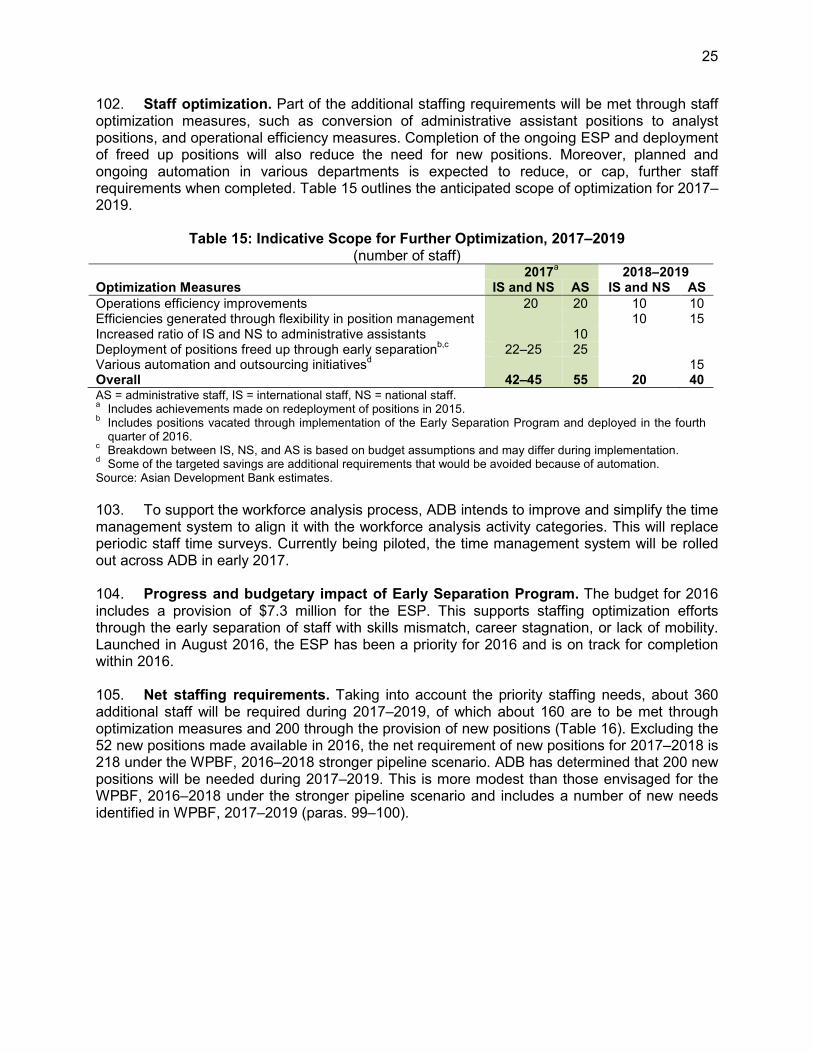
25
102. Staff optimization. Part of the additional staffing requirements will be met through staff optimization measures, such as conversion of administrative assistant positions to analyst positions, and operational efficiency measures. Completion of the ongoing ESP and deployment of freed up positions will also reduce the need for new positions. Moreover, planned and ongoing automation in various departments is expected to reduce, or cap, further staff requirements when completed. Table 15 outlines the anticipated scope of optimization for 2017–2019.
Table 15: Indicative Scope for Further Optimization, 2017–2019
(number of staff)
Optimization Measures 2017
a 2018–2019
IS and NS AS IS and NS AS
Operations efficiency improvements 20 20 10 10 Efficiencies generated through flexibility in position management 10 15 Increased ratio of IS and NS to administrative assistants 10 Deployment of positions freed up through early separation
b,c 22–25 25
Various automation and outsourcing initiativesd 15
Overall 42–45 55 20 40 AS = administrative staff, IS = international staff, NS = national staff. a Includes achievements made on redeployment of positions in 2015.
b Includes positions vacated through implementation of the Early Separation Program and deployed in the fourth
quarter of 2016. c Breakdown between IS, NS, and AS is based on budget assumptions and may differ during implementation.
d Some of the targeted savings are additional requirements that would be avoided because of automation.
Source: Asian Development Bank estimates.
103. To support the workforce analysis process, ADB intends to improve and simplify the time management system to align it with the workforce analysis activity categories. This will replace periodic staff time surveys. Currently being piloted, the time management system will be rolled out across ADB in early 2017. 104. Progress and budgetary impact of Early Separation Program. The budget for 2016 includes a provision of $7.3 million for the ESP. This supports staffing optimization efforts through the early separation of staff with skills mismatch, career stagnation, or lack of mobility. Launched in August 2016, the ESP has been a priority for 2016 and is on track for completion within 2016. 105. Net staffing requirements. Taking into account the priority staffing needs, about 360 additional staff will be required during 2017–2019, of which about 160 are to be met through optimization measures and 200 through the provision of new positions (Table 16). Excluding the 52 new positions made available in 2016, the net requirement of new positions for 2017–2018 is 218 under the WPBF, 2016–2018 stronger pipeline scenario. ADB has determined that 200 new positions will be needed during 2017–2019. This is more modest than those envisaged for the WPBF, 2016–2018 under the stronger pipeline scenario and includes a number of new needs identified in WPBF, 2017–2019 (paras. 99–100).
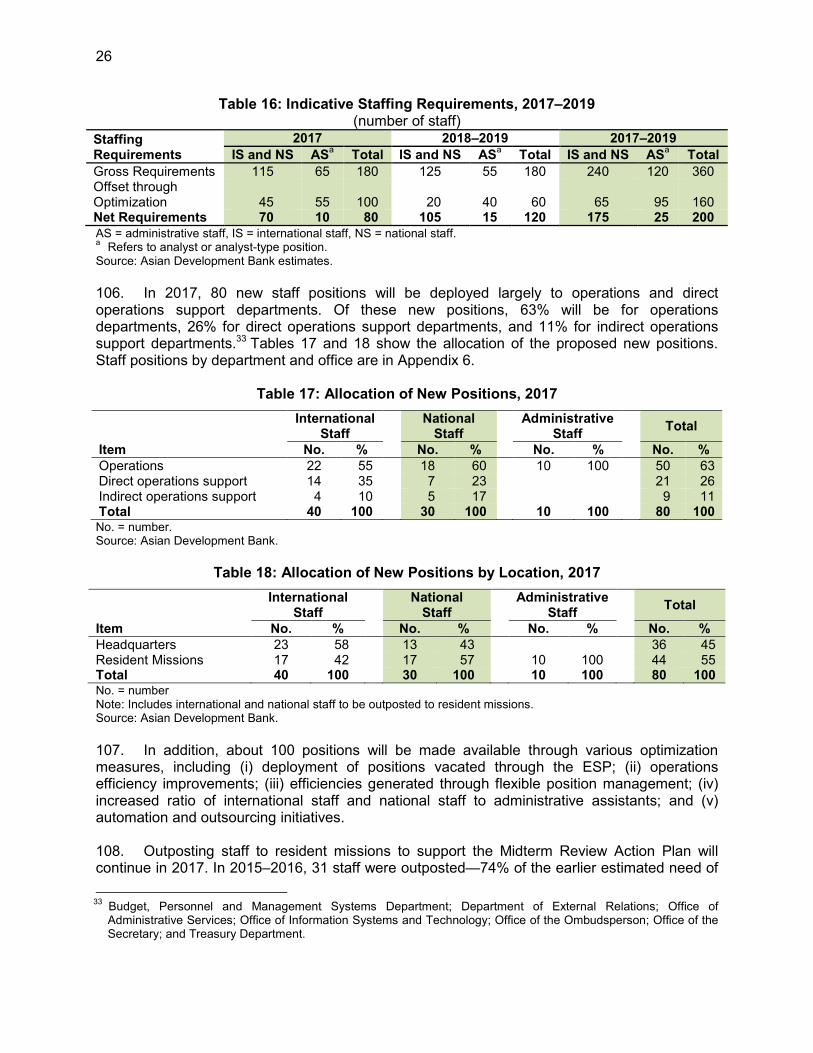
26
Table 16: Indicative Staffing Requirements, 2017–2019 (number of staff)
Staffing Requirements
2017 2018–2019 2017–2019
IS and NS ASa Total IS and NS AS
a Total IS and NS AS
a Total
Gross Requirements 115 65 180 125 55 180 240 120 360 Offset through Optimization 45 55 100 20 40 60 65 95 160 Net Requirements 70 10 80 105 15 120 175 25 200
AS = administrative staff, IS = international staff, NS = national staff. a Refers to analyst or analyst-type position.
Source: Asian Development Bank estimates.
106. In 2017, 80 new staff positions will be deployed largely to operations and direct operations support departments. Of these new positions, 63% will be for operations departments, 26% for direct operations support departments, and 11% for indirect operations support departments.33 Tables 17 and 18 show the allocation of the proposed new positions. Staff positions by department and office are in Appendix 6.
Table 17: Allocation of New Positions, 2017
International Staff
National Staff
Administrative Staff
Total
Item No. %
No. %
No. %
No. %
Operations 22 55 18 60 10 100 50 63 Direct operations support 14 35 7 23 21 26 Indirect operations support 4 10 5 17 9 11 Total 40 100
30 100
10 100
80 100
No. = number. Source: Asian Development Bank.
Table 18: Allocation of New Positions by Location, 2017
International Staff
National Staff
Administrative Staff
Total
Item No. %
No. %
No. %
No. %
Headquarters 23 58 13 43 36 45 Resident Missions 17 42 17 57 10 100 44 55 Total 40 100
30 100
10 100
80 100
No. = number Note: Includes international and national staff to be outposted to resident missions. Source: Asian Development Bank.
107. In addition, about 100 positions will be made available through various optimization measures, including (i) deployment of positions vacated through the ESP; (ii) operations efficiency improvements; (iii) efficiencies generated through flexible position management; (iv) increased ratio of international staff and national staff to administrative assistants; and (v) automation and outsourcing initiatives. 108. Outposting staff to resident missions to support the Midterm Review Action Plan will continue in 2017. In 2015–2016, 31 staff were outposted—74% of the earlier estimated need of
33
Budget, Personnel and Management Systems Department; Department of External Relations; Office of Administrative Services; Office of Information Systems and Technology; Office of the Ombudsperson; Office of the Secretary; and Treasury Department.
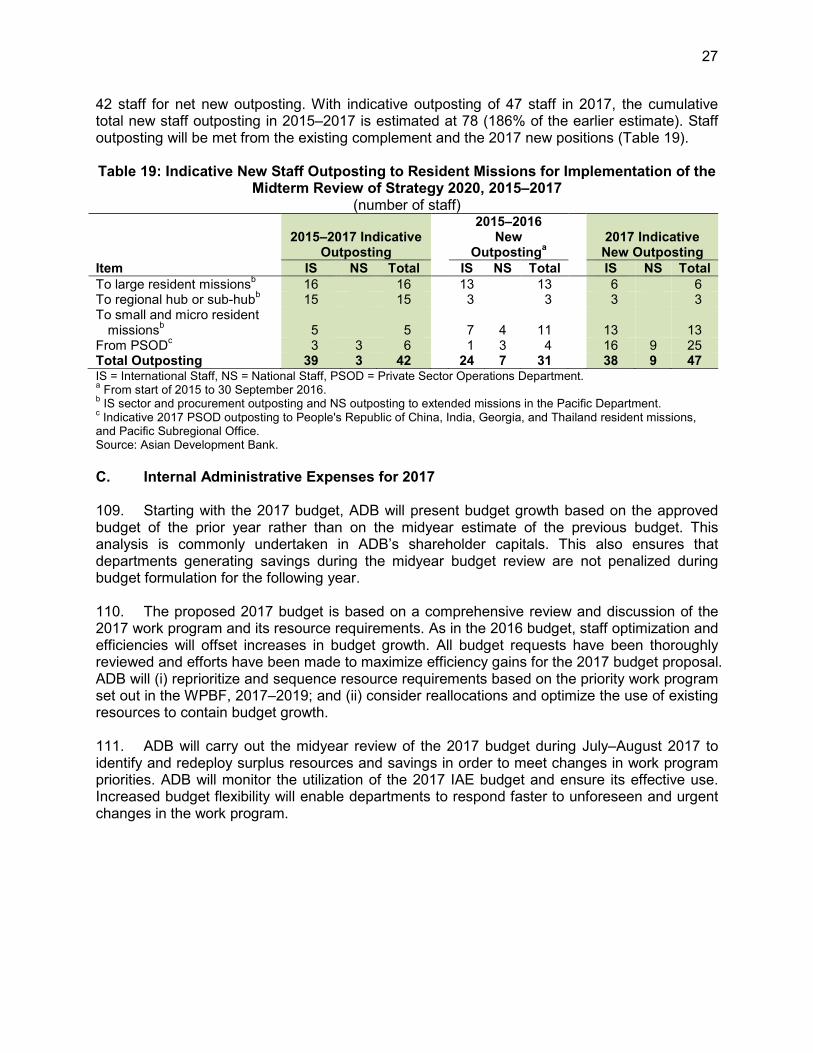
27
42 staff for net new outposting. With indicative outposting of 47 staff in 2017, the cumulative total new staff outposting in 2015–2017 is estimated at 78 (186% of the earlier estimate). Staff outposting will be met from the existing complement and the 2017 new positions (Table 19). Table 19: Indicative New Staff Outposting to Resident Missions for Implementation of the
Midterm Review of Strategy 2020, 2015–2017 (number of staff)
2015–2017 Indicative
Outposting
2015–2016 New
Outpostinga
2017 Indicative New Outposting
Item IS NS Total IS NS Total IS NS Total
To large resident missionsb 16 16 13 13 6 6
To regional hub or sub-hubb 15 15 3 3 3 3
To small and micro resident missions
b
5
5
7 4
11
13
13 From PSOD
c 3 3 6 1 3 4 16 9 25
Total Outposting 39 3 42 24 7 31 38 9 47 IS = International Staff, NS = National Staff, PSOD = Private Sector Operations Department. a From start of 2015 to 30 September 2016.
b IS sector and procurement outposting and NS outposting to extended missions in the Pacific Department.
c Indicative 2017 PSOD outposting to People's Republic of China, India, Georgia, and Thailand resident missions,
and Pacific Subregional Office. Source: Asian Development Bank.
C. Internal Administrative Expenses for 2017 109. Starting with the 2017 budget, ADB will present budget growth based on the approved budget of the prior year rather than on the midyear estimate of the previous budget. This analysis is commonly undertaken in ADB’s shareholder capitals. This also ensures that departments generating savings during the midyear budget review are not penalized during budget formulation for the following year. 110. The proposed 2017 budget is based on a comprehensive review and discussion of the 2017 work program and its resource requirements. As in the 2016 budget, staff optimization and efficiencies will offset increases in budget growth. All budget requests have been thoroughly reviewed and efforts have been made to maximize efficiency gains for the 2017 budget proposal. ADB will (i) reprioritize and sequence resource requirements based on the priority work program set out in the WPBF, 2017–2019; and (ii) consider reallocations and optimize the use of existing resources to contain budget growth. 111. ADB will carry out the midyear review of the 2017 budget during July–August 2017 to identify and redeploy surplus resources and savings in order to meet changes in work program priorities. ADB will monitor the utilization of the 2017 IAE budget and ensure its effective use. Increased budget flexibility will enable departments to respond faster to unforeseen and urgent changes in the work program.

28
1. Overview
112. The proposed net IAE budget for 2017 is $647.0 million,34 a projected increase of $18.6 million (3.0%) over the 2016 budget, before the 2016 one-time provision of $7.3 million for the ESP. The 3.0% budget growth consists of a 2.3% price increase and a 0.7% volume growth (Table 20). The proposed budget is lower than the 5.0% presented in the budget preview for 2017 in the WPBF, 2017–2019 before the 2016 ESP. The details of price and volume growth are in Appendix 7.
Table 20: Comparative Budget Growth, 2016–2017 (%)
L = not applicable or not calculated, ( ) negative, ESP = Early Separation Program, IT = information technology, OR = organizational resilience, SRP = Staff Retirement Plan, WPBF = work program and budget framework. Note: Numbers may not sum precisely because of rounding. a
Budget preview is based on the WPBF, 2017–2019, circulated to the Board of Directors on 9 November 2016. b
Identified savings of $3.8 million during the midyear review of the 2015 budget. Source: Asian Development Bank.
113. Price growth. The price growth for 2017 is $14.4 million (2.3%) over the 2016 budget. This is based on (i) the overall weighted average of salary-related price adjustments; (ii) salary-related benefits, such as contributions to the SRP; (iii) adjustments in rates for benefits-related expenses, such as rental and education assistance; (iv) adjustments in rates for staff consultants and business travel; and (v) adjustments for expected inflation in the Philippines and other countries resulting in cost increases in office rental, office supplies, contractual services, and others. The 2017 budget assumes a Philippine peso–US dollar exchange rate of
34
Net IAE for 2017 consists of $633.3 million for ADB, $12.1 million for the Independent Evaluation Department, and $1.6 million for the Compliance Review Panel and the Office of the Compliance Review Panel.
Budget over
2015
Midyear
Estimate
Budget over
2015 Budget
Price 1.7 1.7 2.2 2.3
Adjustment to SRP contribution rate 0.8 0.8 L L Price 2.5 2.5 2.2 2.3 Volume Scaling up of operations 2.4 2.4 2.2 3.7 Midterm review actions 0.3 0.3 L 0.1 Staffing optimization (1.5) (1.5) (2.7) Efficiency gains (1.4) (1.4) (1.0) (1.7)
Adjustmentb
L (0.6) L L
Subtotal (0.2) (0.8) 1.2 (0.6) Organizational resilience L L 0.7 0.5 IT Reforms L L 0.8 0.8
Subtotal 4 0.0 1.5 1.3 Volume (0.2) (0.8) 2.8 0.7
Depreciation of OR and IT reforms L L (0.8) (0.8)
Volume less depreciation L L 2.0 (0.1) Budget growth 2.3 1.7 5.0 3.0
ESP 1.2 1.2 (1.2) (1.2)Volume with ESP 1.0 0.4 1.6 (0.5)
Budget growth after ESP 3.5 2.9 3.8 1.8
Item
2016
Budget
2017 Budget
Previewa
Proposed
2017 Budget
Budget over
2016 Budget
Budget over
2016 Budget
Price before adjustment to SRP contribution

29
P47.5=$1. As the exchange rate continues to fluctuate widely, the Budget, Personnel and Management Systems Department, in coordination with the Treasury Department, will monitor the movement. If the peso strengthens against the US dollar beyond the projection used in the budget, ADB will manage the impact on administrative expenses by using the general contingency to the extent feasible.
114. Volume growth. Volume growth corresponds to additional resources required to deliver the 2017 work program and other strategic and institutional priorities. Additional resource requirements in 2017 are estimated at $32.0 million (5.1%)35 over the 2016 budget, reflecting increased resources required to deliver the work program in line with the WPBF, 2017–2019. Staff additions for scaling up operations will be broadly offset by staff optimization measures of about $17.3 million (2.7%). Further, about $10.5 million (1.7%) will be absorbed through efficiencies and cost-reduction measures, leaving a net volume growth of about $4.2 million (0.7%) in 2017.
115. Since presenting the budget preview for 2017 in the WPBF, 2017–2019, all budget requests have been reviewed and efforts have been made to identify and maximize efficiency gains. Staffing optimization and efficiency gains have been identified, both of which are larger than those in the 2016 budget. Consequently, the proposed 2017 volume growth is 0.7%. The volume growth includes depreciation estimated from capital investments in organizational resilience and IT reforms, equivalent to 0.8%. The volume growth less this depreciation (needed for the next 4 years) is –0.1% in 2017. 116. Projected allocable net income. [Information in this para. has been removed in accordance with para. 97 (i and viii) of ADB‘s Public Communications Policy (2011).]
35
This includes 3.7% scaling up, 0.1% for midterm review actions, 0.5% for organizational resilience, and 0.8% for IT reforms.

30
Table 21: Income and Expense Outlook, 2016–2017 ($ million)
[The table has been removed in accordance with para. 97 (i and viii) of ADB‘s Public Communications Policy (2011).]
2. 2017 Budget by Category
117. This section summarizes the proposed IAE budget for 2017 and presents the proposed IAE budget by category and by major expenses under each budget category, and overall administrative expenses used in the financial projections by the Treasury Department (Table 22). The details on the 2017 budget are in Appendix 1. Distribution of operational expenses by department and office is in Appendix 8. Cross-year comparison of ADB’s IAE is in Appendix 9. The main points of the financial status of SRP and the 2016 annual review of salary and benefits for staff are presented in Appendixes 17 and 18, respectively.

31
Table 22: Budget and Overall Administrative Expenses, 2016–2017 ($‘000)
L = not applicable or not calculated, ( ) = negative, ESP = Early Separation Program, IAE = internal administrative expenses, PRGMIP = Post-Retirement Group Medical Insurance Plan, SRP = Staff Retirement Plan. Note: Numbers may not sum precisely because of rounding. a
Estimated service charges for administering external grants excluding Japan trust funds. b
Refers to administrative expenses before adjusting for fee reimbursements and includes ESP for the 2016 budget and 2016 midyear estimate.
c Refers to administrative expenses related to loan origination. Accounting standards require that a portion of the
loan origination cost be deferred and amortized over the life of the loan. ADB uses 20 basis points of the amount of loans that become effective to represent the amount of loan origination costs that needs to be deferred.
d The estimates for overall administrative expenses are based on gross IAE (i.e., before adjusting for fee reimbursements) and include estimates for the net periodic benefit cost for the SRP and PRGMIP, and adjustments for loan origination costs.
Source: Asian Development Bank.
118. Overall administrative expenses. The estimates for overall administrative expenses for accounting purposes include estimates for the net periodic benefit cost for the SRP and Post-Retirement Group Medical Insurance Plan (PRGMIP) net of adjustments for loan origination costs. The estimates for the accruals for SRP and PRGMIP for 2017 are based on preliminary projected estimates provided by the plan’s actuary less ADB’s expected contributions to the SRP and PRGMIP included in the budget.36 The final figures for the net periodic benefit cost for the SRP and PRGMIP for 2017 could be significantly different based on the demographic and market-based assumptions as of 31 December 2016, and will be available only in the first quarter of 2017. For financial reporting purposes, an accounting accrual is set up for the net periodic benefit cost less budgeted contributions for financial reporting purpose. A separate
36
The plan’s actuary prepared the preliminary estimates for the net periodic benefit cost for the SRP and PRGMIP in August 2016.
2017
Budget Category Budget Amount % Amount %
Board of Governors 2,197 2,197 2,187 (10) (0.5) (10) (0.5)Board of Directors 32,782 32,473 33,225 443 1.4 752 2.3Operational Expenses 471,841 466,102 483,927 12,086 2.6 17,825 3.8Administrative Expenses 123,648 122,069 129,926 6,278 5.1 7,857 6.4
Total Regular Programs 630,468 622,841 649,265 18,797 3.0 26,424 4.2General Contingency 6,305 6,305 6,493 188 … 188 …
Gross IAE 636,773 629,146 655,758 18,985 3.0 26,612 4.2Fee Reimbursements
a(8,425) (8,425) (8,770) (345) … (345) …
Net IAE 628,348 620,721 646,988 18,640 3.0 26,267 4.2
ESP 7,276 7,276 L L L L LNet IAE after ESP 635,624 627,997 646,988 11,364 1.8 18,991 3.0
Memo item Amount % Amount %
Gross IAEb644,049 636,422 655,758 11,709 1.8 19,336 3.0
Accounting Adjustments 114,264 67,746 114,052 (212) L 46,306 L
Accrual for SRP 119,633 76,433 112,600 (7,033) L 36,167 L
Accrual for PRGMIP 17,679 15,179 29,260 11,581 L 14,081 L
Loan origination costsc(23,048) (23,867) (27,808) (4,760) L (3,941) L
Overall Administrative Expensesd758,313 704,168 769,810 11,497 1.5 65,643 9.3
Estimate
2016
Estimate
Change over
2016 Estimate
2016 Change over
2016 Budget
Change over 2016
Midyear Estimate2016 Midyear
Budget Estimate
Change over
2016 Midyear Estimate
2016
Midyear
Estimate
2017

32
approval of the Board will be sought if any cash transfers will be made from the OCR balance sheet to the SRP fund in 2017.
119. Board of Governors. The 50th Annual Meeting of ADB’s Board of Governors will be held in Yokohama, Japan in May 2017. A budget of $2.2 million is allocated for the meeting, 0.5% lower than 2016 budget allocation (Table 23). The cost of airfares to Yokohama is lower than the cost of the airfare to Frankfurt in 2016. However, Golden Week in Japan at the end of April to early May 2017 (a series of four national holidays) is expected to drive up the cost of accommodation. Therefore, the lower airfare is offset by the higher accommodation cost, resulting in only a minimal reduction in the travel budget for the 50th Annual Meeting compared with the 49th Annual Meeting.
Table 23: Board of Governors, 2016–2017
($'000)
( ) = negative. Note: Numbers may not sum precisely because of rounding. Source: Asian Development Bank.
120. Board of Directors. The budget for the Board of Directors covers the offices of the directors, the Accountability Mechanism, and IED, estimated at $33.2 million (Appendix 10). This $0.4 million increase (1.4%) over the 2016 budget consists of a $0.1 million increase in the offices of the directors, a $0.1 million decrease in the Accountability Mechanism, and a $0.4 million increase in IED. The budget increase or decrease in each subcategory is as follows:
(i) The budget increase for the offices of the directors is mainly from projected adjustments in salaries and benefits.
(ii) The $2.6 million budget for the Accountability Mechanism 37 comprises $1.6 million for the Compliance Review Panel and the Office of the Compliance Review Panel (Appendix 11), and $1.0 million for the Office of the Special Project Facilitator. The decline of $0.1 million is because of lower requirements for administrative expenses for the Office of the Compliance Review Panel and lower requirements in the Office of the Special Project Facilitator for staff consultants and business travel.
(iii) The IED budget38 for 2017 is $12.1 million, 3.8% higher than the 2016 budget of $11.6 million (Appendix 12). The IED budget increase is attributed to adjustments
37
The chair of the Compliance Review Panel prepared the budget for 2017, and the Board Compliance Review Committee endorsed it. The proposed budget was reviewed by the Budget Review Committee. The Board's approval for this budget is requested separately from ADB's overall IAE budget.
38 The director general of IED prepared the IED budget for 2017, and the Development Effectiveness Committee endorsed it. The proposed budget was reviewed by the Budget Review Committee. It is presented separately for Board approval.
Expense Item Amount Amount %Travel 1,068 1,039 1,052 (1.5) 13 1.3Representation 300 267 276 (24) (8.0) 9 3.4Administrative expenses 654 751 684 30 4.6 (67) (8.9)Seminars 150 115 150 0 0 35 30.4Remuneration committee 25 25 25 0 0 0 0Total 2,197 2,197 2,187 (10) (0.5) (10) (0.5)
Budget(16)
Midyear
Estimate
2017
Budget
Change
Midyear Estimate
%
Change
over 2016Budget
over 20162016
2016

33
in salaries and benefits, as well as anticipated increases in staff consultants and business travel to support the IED’s 2017 work program.
121. Operational expenses. Operational expenses for 2017 are estimated at $483.9 million, an increase of $12.1 million (2.6%) over the 2016 budget (Table 24 and Appendix 13).
Table 24: Operational Expenses, 2016–2017
($’000)
( ) = negative, SRP = Staff Retirement Plan. Note: Numbers may not sum precisely because of rounding. a This excludes the SRP contribution for the Board of Directors. The SRP budget for the Board of Directors is
included under the Board of Directors budget category. Table 25 provides details of the SRP contribution. Source: Asian Development Bank.
122. Salaries. In 2017, total staff salaries are projected at $251.1 million, an increase of $7.3 million (3.0%) over the 2016 budget.39 The increase includes a salary increase of $6.8 million. Of the total salary increase, international staff accounts for 60% ($4.1 million) and national and administrative staff 40% ($2.7 million). Salaries and benefits together account for 62.2% of the 2017 net IAE budget. 123. Benefits. The 2017 benefit-related expenses are estimated at $151.2 million, or 0.8% higher than the 2016 budget. The expenses comprise (i) the contribution to the SRP ($56.0 million), (ii) rental assistance ($31.6 million), (iii) education assistance ($21.1 million), (iv) medical insurance ($11.2 million), (v) home country travel ($8.2 million), (vi) special allowances for field offices ($7.2 million), (vii) severance pay ($5.9 million), (viii) dependency allowance ($4.0 million), (ix) health services ($2.7 million), (x) staff welfare ($2.0 million), and (xi) others ($1.3 million).40 The marginal increase is correlated with the anticipated increase in the SRP contribution, medical insurance, dependency allowance, and home country travel. This increase has been partly moderated by an anticipated reduction in overseas duty station allowances from the adjustment made following the 2016 midyear review. The increase in medical insurance reflects provision for the growth in staff and dependents covered in 2017.
39
The 2017 salary budget increase of $7.3 million includes $6.8 million for salary increases for staff and $0.5 million for other salary components of staff such as leave encashment and termination pay. The salary paper includes $6.9 million for salary increases for staff ($6.8 million) and $0.1 million for Board category (Office of the Compliance Review Panel, Compliance Review Panel and Office of the Special Project Facilitator, Board staff services and Independent Evaluation Department). The salary increases for Board category are included in their respective budget line items.
40 Others include budget estimates for group life insurance, accidental death and dismemberment insurance, workers’ compensation insurance, and special travel.
2016
2016 Midyear 2017
Expense Item Budget Estimate Budget Amount % Amount %
Salaries 243,793 241,344 251,065 7,272 3.0 9,721 4.0 Benefits 149,965 145,688 151,189 1,224 0.8 5,501 3.8 Contribution to Staff Retirement Plan
a53,597 53,487 55,997 2,400 4.5 2,510 4.7
Staff development 7,500 7,108 7,500 0 0 392 5.5 Relocation 9,100 7,949 9,104 4 0 1,155 14.5 Consultants 27,437 30,711 29,564 2,127 7.8 (1,147) (3.7) Business travel 33,489 32,694 34,925 1,436 4.3 2,231 6.8 Representation 557 608 580 23 4.1 (28) (4.6) Total 471,841 466,102 483,927 12,086 2.6 17,825 3.8
Change over Change over 2016
Midyear Estimate2016 Budget

34
124. Adjustments in salaries for existing staff caused the increase in the SRP (Table 25). The total contribution to the SRP in 2017 is estimated at $59.9 million, comprising of $56.0 million for staff and $3.9 million for Board of Directors category (offices of the directors, $2.3 million; Accountability Mechanism, $0.3 million; and IED, $1.3 million). The estimate of $56.0 million for staff is included under the benefits budget, while $3.9 million for Board of Directors category is included under their respective budget subcategories.
Table 25: Contribution to Staff Retirement Plan, 2016–2017 ($’000)
Note: Numbers may not sum precisely because of rounding. Source: Asian Development Bank.
125. Staff development. The staff development budget in 2017 is estimated at $7.5 million, the same level as in the 2016 budget. ADB will continue to roll out leadership training and the executive leaders program. Several workshops on mitigating unconscious bias will be offered to increase diversity and inclusion in ADB. The implementation of new gender actions will be supported by strengthened training and development of women, which will help increase the attractiveness of ADB for women employees, and support the retention of women. Through sector and thematic training allocations, 40 programs will be offered in 2017 (compared with 38 in 2016). New programs will cover renewable energy, capital markets development, climate change tools, and smart green infrastructure. The aim is to improve staff skills, as well as ensure that more resident missions are involved in enhancing DMCs’ capacity to respond to diverse development issues. 126. Relocation. The proposed budget for relocation for 2017 is $9.1 million, the same level as in the 2016 budget. This covers estimated relocation costs for (i) staff appointments against anticipated vacant positions, (ii) staff repatriations during 2017, and (iii) redeployment of staff between headquarters and field offices.
127. Consultants. In 2017, $29.6 million is proposed for the staff consultant budget, an increase of $2.1 million (7.8%) over the 2016 budget. From 2013 to 2016, the staff consultant budget’s share of net IAE has been decreasing (Figure 8), while the allocation to operations departments has been increasing over the same period (Figure 9). 128. More requests for staff consultant budget have been received for the 2017 budget. The increase in 2017 is to meet the demands for scaling up of operations, strengthening the quality of the portfolio, building capacity for further projects delegations to resident missions, and complementing skills. In addition, more resources will be used to improve integrity due diligence and safeguards for nonsovereign projects, to acquire and implement TAS mandates, and to develop guidelines on defining ADB’s role in ensuring tax transparency in its projects. ADB will continue to contain staff consultant expenses through greater reliance on national consultants, as well as strategic use of existing resources in line with the priorities of the work program.
2016
2016 Midyear 2017
Item Budget Estimate Budget Amount % Amount %Board of Directors 3,770 3,780 3,910 140 3.7 130 3.4 Offices of the Directors 2,279 2,314 2,331 52 2.3 18 0.8 Accountability Mechanism 238 194 250 12 5.0 56 28.7 Independent Evaluation 1,253 1,272 1,330 77 6.1 57 4.5 Operational Expenses 53,597 53,487 55,997 2,400 4.5 2,510 4.7 Total 57,367 57,267 59,907 2,540 4.4 2,640 4.6
2016 BudgetChange over Change over 2016
Midyear Estimate

35
71% 72% 74% 75% 74%
15% 14% 13% 13% 13%
14% 14% 13% 12% 13%0%
15%
30%
45%
60%
75%
2013 2014 2015 2016 2017
Figure 11: Distribution of Business Travel Budget by Department, 2013–2017
OperationsDirect Operations SupportIndirect Operations Support
Source: Asian Development Bank.
129. Business travel. The proposed budget for business travel in 2017 is $34.9 million, an increase of $1.4 million (4.3%) over the 2016 budget. In 2017, the business travel budget will account for 5.4% of net IAE and 7.2% of operational expenses. Figure 10 shows the slight increase in the share of business travel in the net IAE budget. ADB will continue with the efficiency and cost-reduction measures taken to contain the cost of travel.
Source: Asian Development Bank.
130. As illustrated in Figure 11, operations departments account for 74.0% of the proposed 2017 budget for business travel followed by direct operations support departments at 13.0%. Indirect operations support departments account for the remaining business travel budget. ADB implemented highly effective efficiency measures in January 2014 (Appendix 5), which have steadily reduced travel costs. These initial measures will continue to contribute to the efficient use of the business travel budget as demonstrated by the increase in the number of mission field days in 2015 (14.0% increase) and 2016 (4.4% increase) without significantly affecting budget requirements. In 2017, ADB plans to introduce more efficiency measures. While the 2017 proposed budget for business travel is an increase from 2016, this is partially attributed to the implementation of the organizational resilience program. Efficiency measures have ensured a minimal increase in budget, while still effectively contributing to the delivery of ADB’s expanding operational program. An analysis of the business travel budget is in Appendix 5.
5.2%
4.8%
4.5%4.4%
4.6%
4.0%
4.4%
4.8%
5.2%
2013 2014 2015 2016 2017
Figure 8: Share of Staff Consultant Budget to Net Internal Administrative
Expenses, 2013–2017
56% 58% 61% 63% 65%
24% 23% 23% 21% 19%
17% 19% 16% 16% 16%0%
15%
30%
45%
60%
75%
2013 2014 2015 2016 2017
Figure 9: Distribution of Staff Consultant Budget by Department, 2013–2017
OperationsDirect Operations SupportIndirect Operations Support
5.9%
5.8%
5.5%
5.3%5.4%
5.0%
5.4%
5.8%
6.2%
2013 2014 2015 2016 2017
Figure 10: Share of Business Travel Budget to Net Internal Administrative
Expenses, 2013–2017
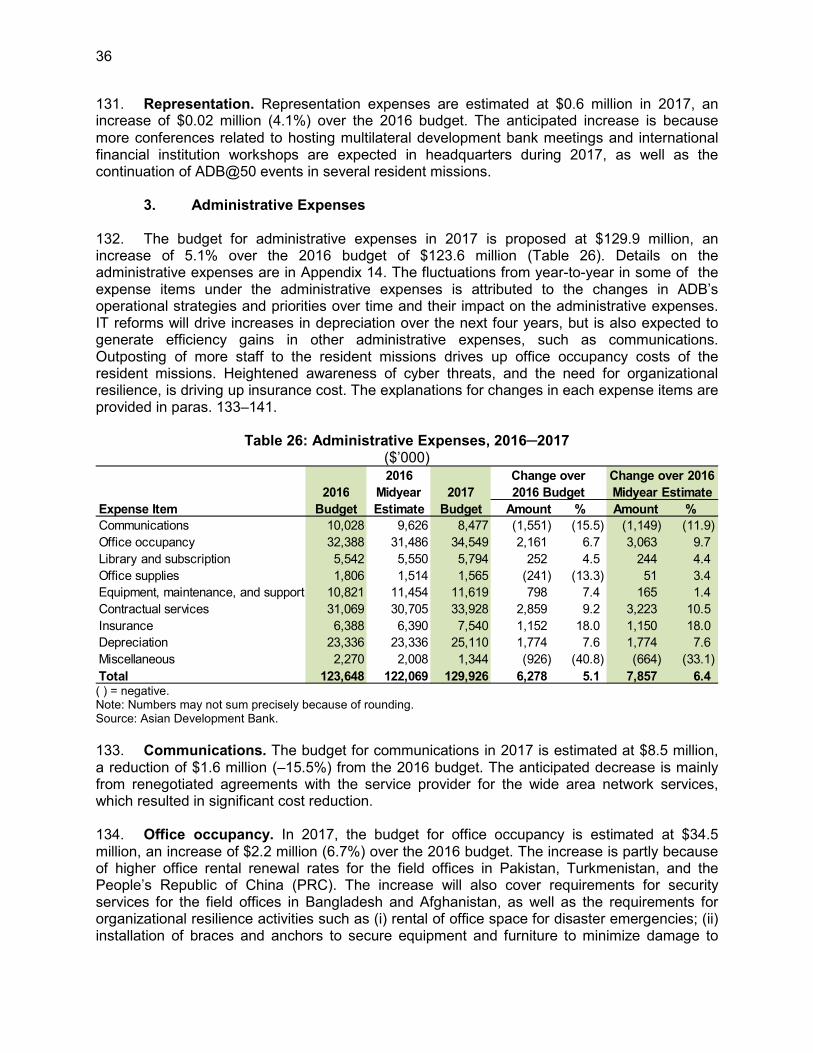
36
131. Representation. Representation expenses are estimated at $0.6 million in 2017, an increase of $0.02 million (4.1%) over the 2016 budget. The anticipated increase is because more conferences related to hosting multilateral development bank meetings and international financial institution workshops are expected in headquarters during 2017, as well as the continuation of ADB@50 events in several resident missions.
3. Administrative Expenses 132. The budget for administrative expenses in 2017 is proposed at $129.9 million, an increase of 5.1% over the 2016 budget of $123.6 million (Table 26). Details on the administrative expenses are in Appendix 14. The fluctuations from year-to-year in some of the expense items under the administrative expenses is attributed to the changes in ADB’s operational strategies and priorities over time and their impact on the administrative expenses. IT reforms will drive increases in depreciation over the next four years, but is also expected to generate efficiency gains in other administrative expenses, such as communications. Outposting of more staff to the resident missions drives up office occupancy costs of the resident missions. Heightened awareness of cyber threats, and the need for organizational resilience, is driving up insurance cost. The explanations for changes in each expense items are provided in paras. 133–141.
Table 26: Administrative Expenses, 2016─2017
($’000)
( ) = negative. Note: Numbers may not sum precisely because of rounding. Source: Asian Development Bank.
133. Communications. The budget for communications in 2017 is estimated at $8.5 million, a reduction of $1.6 million (–15.5%) from the 2016 budget. The anticipated decrease is mainly from renegotiated agreements with the service provider for the wide area network services, which resulted in significant cost reduction. 134. Office occupancy. In 2017, the budget for office occupancy is estimated at $34.5 million, an increase of $2.2 million (6.7%) over the 2016 budget. The increase is partly because of higher office rental renewal rates for the field offices in Pakistan, Turkmenistan, and the People’s Republic of China (PRC). The increase will also cover requirements for security services for the field offices in Bangladesh and Afghanistan, as well as the requirements for organizational resilience activities such as (i) rental of office space for disaster emergencies; (ii) installation of braces and anchors to secure equipment and furniture to minimize damage to
Expense Item Budget Estimate Budget Amount % Amount %
Communications 10,028 9,626 8,477 (1,551) (15.5) (1,149) (11.9)
Office occupancy 32,388 31,486 34,549 2,161 6.7 3,063 9.7
Library and subscription 5,542 5,550 5,794 252 4.5 244 4.4
Office supplies 1,806 1,514 1,565 (241) (13.3) 51 3.4
Equipment, maintenance, and support 10,821 11,454 11,619 798 7.4 165 1.4
Contractual services 31,069 30,705 33,928 2,859 9.2 3,223 10.5
Insurance 6,388 6,390 7,540 1,152 18.0 1,150 18.0
Depreciation 23,336 23,336 25,110 1,774 7.6 1,774 7.6
Miscellaneous 2,270 2,008 1,344 (926) (40.8) (664) (33.1)
Total 123,648 122,069 129,926 6,278 5.1 7,857 6.4
2016
2016
Midyear 2017
Change over
2016 Budget
Change over 2016
Midyear Estimate
37
property and reduce risks to staff during a seismic event; (iii) security and safety services, equipment, and supplies; and (iv) safe haven supplies and emergency kits. The increase also covers office rental and related costs for office expansion to accommodate outposting of staff from the Private Sector Operations Department to PRC, India, Georgia, and Thailand resident missions, and to the Pacific Subregional Office, as well as the anticipated increase in staff in selected resident missions in 2017.
135. Library and subscription. The allocation for library and subscriptions in 2017 is $5.8 million, an increase of $0.3 million (4.5%) over the 2016 budget. The increase is because of higher subscription rates for financial and nonfinancial database subscriptions required by various departments.
136. Office supplies. In 2017, a $1.6 million budget is allocated for office supplies, a decrease of $0.2 million (–13.3%) from the 2016 budget. The decrease in the 2017 budget is because of the change of supplier for cut-size papers, which offered lower rates, and the lower requirements for several office supply items.
137. Equipment, maintenance, and support services. In 2017, the indicative budget for equipment, maintenance, and support services is $11.6 million. The increase of $0.8 million (7.4%) over the 2016 budget is from the additional requirements for IT equipment maintenance for Office 365, which is part of the IT reform project.
138. Contractual services. In 2017, the budget estimate for contractual services41 is $33.9 million, an increase of $2.9 million (9.2%) over the 2016 budget. The increase is because of several additional requirements for (i) legal due diligence and litigation cases in nonsovereign operations, and increasing and complex mandates and/or contracts in PPP operations; (ii) fee increases for external audit services for OCR, ADF, and TASF; (iii) outsourcing administration of the new pension plan; (iv) ADB@50 events; (v) anticipated increase in sessions of ADB’s Administrative Tribunal; (vi) executive searches for hard-to-fill positions, senior positions, and women candidates; (vii) reclassification of the travel budget of candidates for interview at ADB headquarters, which was budgeted under the business travel expense budget in previous years; and (viii) managed services, link services and rental, and workplace recovery retainer for the organizational resilience initiative. 139. Insurance. The proposed budget allocation for insurance in 2017 is $7.5 million, an increase of $1.2 million (18.0%) over the 2016 budget. The increase includes provisions for (i) cyber risk; (ii) disaster risk related to the organizational resilience initiative; (iii) headquarters and resident mission properties, including new extended missions; and (iv) motor vehicles. 140. Depreciation. In 2017, the proposed allocation for depreciation is estimated at $25.1 million, an increase of $1.8 million (7.6%) over the 2016 budget. The anticipated increase is largely for the depreciation from capital expenditures of IT reform projects and organizational resilience initiatives.
41
Contractual services include outsourced services and contractors required to support noncore functions, and legal and other retainer services. In contrast, staff consultants are engaged to provide services where specialized skills are required to perform specific assignments, and such skills are not available within ADB. Staff consultants may also be used as short-term gap-filling measures to meet staff shortfall because of vacancies.
38
141. Miscellaneous. The proposed miscellaneous budget in 2017 is $1.3 million, a decrease of $0.9 million (–41%) from the 2016 budget. In earlier years, a provision for emergency disaster preparedness was lodged under this budget item. Beginning in 2017, this requirement has been included in the respective budget items for organizational resilience under the Office of Administrative Services, Office of Information and Systems Technology, and other departments supporting the implementation of these activities.
4. General Contingency
142. A general contingency provision of 1%, or $6.5 million, is included in the 2017 budget. The purpose of this general contingency is to meet any shortfall under any budget category, during the implementation of the 2017 budget. 143. Budget carryover from 2015. ADB carried over $12.4 million from the 2015 budget to 2016. No allocation had been made as of October 2016. Any use of the budget carryover will be reported in the year-end budget utilization report to the Board. The unspent balance of the budget carryover will lapse at the end of the budget calendar year. The purpose of budget carryover is to ensure funding for urgent and unplanned program and special initiatives, delayed projects, and the unfinished program of prior year’s activities without distorting the funding for the current year’s regular work program and without placing pressure on the general contingency.
5. Reimbursement of Service Fees from External Grants
144. Costs associated with administering external grants and cofinancing are included in the gross IAE. Reimbursements for these costs are estimated at $8.8 million for 2017 based on the expected fees. This has been deducted from the gross IAE to arrive at the estimated net IAE. These fees are recognized and claimed upon the disbursement of external funds during loan, grant, and TA implementation. Depending on the implementation progress of the projects, the actual fees could be higher or lower than the estimated amount for 2017.
6. Externally Funded Program
145. In 2017, funding is estimated at $1.0 million, which includes estimated externally funded programs for staff and related costs under the Government of Australia's Department of Foreign Affairs and Trade (two staff assigned to the Pacific Department) and the Government of Germany (four staff, one each assigned to the South Asia Department, Southeast Asia Department, East Asia Department, and SDCC). D. Summary of Resources Provided to Resident Missions 146. ADB will have 28 resident mission and 4 extended mission offices in 2017. The 2017 budget for the resident mission and extended mission offices is estimated at $126.9 million, 4.1% higher than the 2016 budget (Table 27). The increase in resources is in line with the efforts to strengthen resident mission capacity through additional staff and other administrative expenses requirements. The 2017 budget will support additional outposted positions, improvements to office facilities (space expansion and security), and outsourcing of certain services.

39
Table 27: Resident Mission Number and Expenses, 2015–2017
Item
2015 Actual
2016 Budget
2016 Midyear Estimate
2017 Budget
Number of Resident Missionsa 28 32 32 32
Operational and Administrative Expenses ($ million) 99.6 121.9b 113.9 126.9
% to Net Internal Administrative Expenses 18 19 18 20 a
Data in this table includes the extended missions in Samoa, Solomon Island, Tonga, and Vanuatu but excludes the representative offices and extended mission in areas affected by Typhoon Yolanda in the Philippines.
b The number is restated to reflect the actual allocation made to the resident missions after the 2016 budget approval.
Source: Asian Development Bank.
E. Operational Expenses by Program Category
147. The estimated operational expenses budget by program category for the 2016 budget and the proposed 2017 budget (Table 28) are indicative and based largely on staff time estimates by international and national staff.
Table 28: Operational Expenses by Program Category, 2016–2017
($'000)
2016 Midyear Estimate 2017 Budget
Program Category Amount Share (%) Amount Share (%)
Project processinga 73,134 15.7 79,847 16.5
Portfolio management 90,992 19.5 100,932 20.9 Country and regional strategy and programming
b 25,443 5.5 24,401 5.0
Direct operational support 75,231 16.1 77,379 16.0 Knowledge management 48,239 10.4 47,092 9.7 Institutional support services
c 153,064 32.8 154,276 31.9
Total 466,102 100.0 483,927 100.0 Note: Numbers may not sum precisely because of rounding. a
Includes the processing of new loan, grant, and TAs. b Includes the preparation of CPS, regional cooperation strategies, country operations business plans, and regional
cooperation operations business plans. c Includes operations overhead and support services.
Source: Asian Development Bank estimates.
148. In line with the WPBF, 2017–2019, the share of operational expenses for project processing and for portfolio management are expected to increase in 2017 from the 2016 midyear estimate. CPS-related activities are estimated to account for 5.0% of the operational expenses budget in 2017, lower than the 2016 midyear estimate of 5.5% (Table 5). 149. The share of the operational expenses for knowledge-related activities is estimated at 9.7% in 2017, down from 10.4% in 2016. Knowledge work related to projects and TA operations is now reported as direct operational support for project processing and administration by the knowledge departments. Because of the continuing efforts to lower overhead costs, institutional support services are expected to account for 31.9% of the operational expenses in 2017, down from the 2016 midyear estimate of 32.8%.
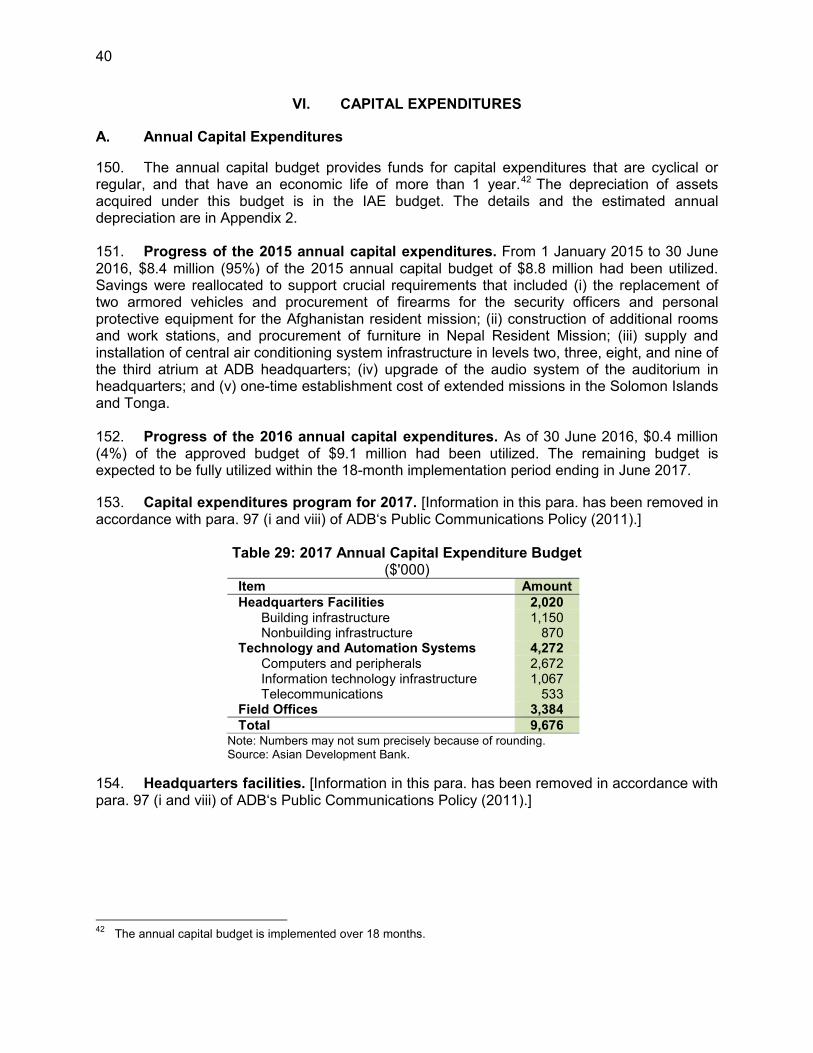
40
VI. CAPITAL EXPENDITURES
A. Annual Capital Expenditures
150. The annual capital budget provides funds for capital expenditures that are cyclical or regular, and that have an economic life of more than 1 year.42 The depreciation of assets acquired under this budget is in the IAE budget. The details and the estimated annual depreciation are in Appendix 2. 151. Progress of the 2015 annual capital expenditures. From 1 January 2015 to 30 June 2016, $8.4 million (95%) of the 2015 annual capital budget of $8.8 million had been utilized. Savings were reallocated to support crucial requirements that included (i) the replacement of two armored vehicles and procurement of firearms for the security officers and personal protective equipment for the Afghanistan resident mission; (ii) construction of additional rooms and work stations, and procurement of furniture in Nepal Resident Mission; (iii) supply and installation of central air conditioning system infrastructure in levels two, three, eight, and nine of the third atrium at ADB headquarters; (iv) upgrade of the audio system of the auditorium in headquarters; and (v) one-time establishment cost of extended missions in the Solomon Islands and Tonga. 152. Progress of the 2016 annual capital expenditures. As of 30 June 2016, $0.4 million (4%) of the approved budget of $9.1 million had been utilized. The remaining budget is expected to be fully utilized within the 18-month implementation period ending in June 2017.
153. Capital expenditures program for 2017. [Information in this para. has been removed in accordance with para. 97 (i and viii) of ADB‘s Public Communications Policy (2011).]
Table 29: 2017 Annual Capital Expenditure Budget
($'000) Item Amount
Headquarters Facilities 2,020 Building infrastructure 1,150 Nonbuilding infrastructure
870
Technology and Automation Systems 4,272 Computers and peripherals 2,672 Information technology infrastructure 1,067 Telecommunications 533
Field Offices 3,384
Total 9,676 Note: Numbers may not sum precisely because of rounding. Source: Asian Development Bank.
154. Headquarters facilities. [Information in this para. has been removed in accordance with para. 97 (i and viii) of ADB‘s Public Communications Policy (2011).] 42
The annual capital budget is implemented over 18 months.

41
155. Technology and automation systems. [Information in this para. has been removed in accordance with para. 97 (i and viii) of ADB‘s Public Communications Policy (2011).] 156. Field offices. The 2017 annual capital budget for field offices will provide for the periodic replacement and acquisition of vehicles, furniture, office equipment, computers and peripherals, and costs related to construction of additional office space in the PRC Resident Mission. This also includes an allocation of $0.2 million to support safety- and security-related expenditures. B. Ongoing Special Capital Expenditure Programs 157. Third atrium at headquarters building. 43 The performance certificate for the completion of the construction of the third atrium building was issued by the project management consultant to the building contractor in July 2016. The design layout and preparation of the technical drawings and specifications to select a building contractor for levels two, eight, and nine were completed in October 2016. 158. Improving office facilities of selected resident missions. As of 30 June 2016, $8.4 million of the $10.0 million special capital budget had been allocated for the expansion and relocation of several resident missions.44 The expansion and relocation of resident missions in Indonesia, Myanmar, and the Pacific Subregional Office in Suva, Fiji, were completed in the first half of 2016. The resident missions in India and Lao People’s Democratic Republic are being expanded. The relocation of the Turkmenistan Resident Mission is expected to be completed by the end of 2016, while the relocation of the resident mission in Papua New Guinea is scheduled for completion by the first half of 2017. 159. Business continuity facility. [Information in this para. has been removed in accordance with para. 97 (i and viii) of ADB‘s Public Communications Policy (2011).] 160. ADB headquarters building efficiency and security enhancement. Two remaining subprojects are in various stages of implementation:
(i) Upgrade and rehabilitation of the central air conditioning system. The replacement of fan-powered units is expected to be completed by end-2016. Technical drawings and specifications for the cleaning of the air conveyance system subproject component are under review. 30% of the project is expected to be completed by end-2017, while the remaining 70% is expected to be completed in 2018.
43
ADB. 2009. Special Capital Budget Proposal: Expansion of ADB Headquarters Building and Selected Resident Missions. Manila.
46 Phase 1 included procurement and installation of cubicle partitions, while Phase 2 includes replacement of lavatories, faucets and other accessories.
42
(ii) Rehabilitation of restroom facilities. Phase 1 of the project was completed in April 2015.46 Phase 2 is in the bidding process. The project is expected to be completed by July 2017.
161. Information Systems and Technology Strategy III and Real-Time ADB. As of 30 September 2016, $12.8 million (20%) of the total ISTS III budget had been used. ISTS III was approved in 2013. 162. The capital expenditure necessary to implement Real-Time ADB (Section II.D) will be funded mainly by the ISTS III budget. This comprehensive IT plan was presented to the President and the Information Technology Committee in July 2016. The committee endorsed the business cases for nine projects; additional business cases will be brought to the committee in late 2016 and early 2017. 163. Ongoing projects are (i) phase 1 of the organizational resilience offshore active disaster recovery site, (ii) mobility, and (iii) IT security improvement. Six other approved projects are being planned with some procurement expected in the fourth quarter of 2016: (i) nonsovereign operations; (ii) institutional e-procurement; (iii) human resource systems; (iv) Office 365 implementation; (v) treasury operations improvement; and (vi) a new disbursement system (mainframe replacement). Appendix 4 provides additional details. 164. Other significant accomplishments under ISTS III include the following: (i) Wi-Fi access has been fully deployed in ADB headquarters and in 32 field offices, (ii) staff and external parties can now participate in online meetings using videoconference facilities, and (iii) an upgrade of the new telephone system in headquarters was completed in September 2016. Network improvements on intranet connectivity resiliency and equipment upgrades will address the demand for increased network traffic and service availability of field offices. Network security enhancements in headquarters will be completed in 2017. Space allocations for staff mailboxes and shared drives were increased. The capital subscription system for the Controller’s Department was delivered in May 2016. The client portal for disbursement was rolled out to nine DMCs, with a target to complete six more DMCs by 2017. 165. Asset and liability management system. Phase 3 (income attribution) is expected to be completed by the end of February 2017. 166. Risk management system. Implementation of the risk assessment module has been completed. Efforts are now focused on the implementation of the portfolio monitoring module, which is expected to close in the fourth quarter of 2016. In addition, a related project on data cleansing is expected to be completed in the first quarter of 2017. 167. A list of special capital expenditure projects is in Appendix 16.
46
Phase 1 included procurement and installation of cubicle partitions, while Phase 2 includes replacement of lavatories, faucets and other accessories.
43
VII. RECOMMENDATIONS
168. I hereby recommend that the Board approve the 2017 budget consisting of
(i) net internal administrative expenses amounting to $633,286,000 for the Asian Development Bank, excluding the Compliance Review Panel and the Office of the Compliance Review Panel, and the Independent Evaluation Department; and
(ii) a capital expenditure budget amounting to $9,676,000. 169. I hereby recommend that the Board approve the 2017 budget for the Compliance Review Panel and the Office of the Compliance Review Panel, consisting of internal administrative expenses of $1,617,000. 170. I hereby recommend that the Board approve the 2017 budget for the Independent Evaluation Department, consisting of internal administrative expenses of $12,085,000. Takehiko Nakao President

2017 BUDGET APPENDIXES


Appendix 1 44
2017 BUDGET: INTERNAL ADMINISTRATIVE EXPENSES
($’000)
Item
A. Board of Governors 2,148 2,197 2,197 2,187 (0.5) (0.5)
B. Board of Directors 29,128 32,782 32,473 33,225 1.4 2.3
Offices of the Directors 16,502 18,407 18,407 18,502 0.5 0.5
Accountability Mechanism 2,051 2,733 2,424 2,638 (3.5) 8.8
Independent Evaluation 10,575 11,642 11,642 12,085 3.8 3.8
C. Operational Expenses 410,834 471,841 466,102 483,927 2.6 3.8
Salaries 216,896 243,793 241,344 251,065 3.0 4.0
Benefits 131,054 149,965 145,688 151,189 0.8 3.8 Contribution to Staff Retirement Plan
a44,556 53,597 53,487 55,997 4.5 4.7
Staff development 5,685 7,500 7,108 7,500 0 5.5
Relocation 4,784 9,100 7,949 9,104 0 14.5
Consultants 25,516 27,437 30,711 29,564 7.8 (3.7)
Business travel 26,494 33,489 32,694 34,925 4.3 6.8
Representation 405 557 608 580 4.1 (4.6)
D. Administrative Expenses 105,086 123,648 122,069 129,926 5.1 6.4
Communications 8,349 10,028 9,626 8,477 (15.5) (11.9)
Office occupancy 26,610 32,388 31,486 34,549 6.7 9.7
Library and subscription 1,538 5,542 5,550 5,794 4.5 4.4
Office supplies 1,216 1,806 1,514 1,565 (13.3) 3.4
Equipment, maintenance, and support 8,789 10,821 11,454 11,619 7.4 1.4
Contractual services 29,215 31,069 30,705 33,928 9.2 10.5
Insurance 5,349 6,388 6,390 7,540 18.0 18.0
Depreciation 23,181 23,336 23,336 25,110 7.6 7.6
Miscellaneous 839 2,270 2,008 1,344 (40.8) (33.1)
Total Regular Programs 547,195 630,468 622,841 649,265 3.0 4.2
E. General Contingency L 6,305 6,305 6,493 L L
Gross IAE 547,195 636,773 629,146 655,758 3.0 4.2
F. Fee Reimbursementsb (8,150) (8,425) (8,425) (8,770) L L
G. Net IAE 539,045 628,348 620,721 646,988 3.0 4.2
Early Separation Program L 7,276 7,276 L L L
H. Carryover 2% of IAE Budget 12,354 L L L L L
I. Net IAE After Carryover and ESP 551,399 635,624 627,997 646,988 1.8 3.0
Externally Funded Program 839 1,423 1,423 1,025 L L
2015
Actual
2016
Estimate
2016
Midyear
Estimate
2017
Estimate
Gross IAEc 547,195 644,049 636,422 655,758 1.8 3.0
Accounting Adjustments 113,302 114,264 67,746 114,052 L L
Accrual for SRP 113,354 119,633 76,433 112,600 L L
Accrual for PRGMIP 22,102 17,679 15,179 29,260 L L
Loan origination costsd (20,876) (23,048) (23,867) (27,808) L L
Other Adjustmentse (1,277) L L L L L
Overall Administrative Expensesf 660,497 758,313 704,168 769,810 1.5 9.3
Note: Numbers may not sum precisely because of rounding.a
b Estimated service charges for administering external grants excluding Japan trust funds.c
d
e
f
Source: Asian Development Bank.
2016 % Change over
% ChangeMemo item
Estimate
2016 Midyear2015 2016 Midyear 2017
Actual Budget Estimate Budget
2016
Budget
The estimates for overall administrative expenses are based on gross IAE (i.e., before adjusting for fee reimbursements) and include
estimates for the net periodic benefit cost (NPBC) for SRP and PRGMIP and adjustment for loan origination costs. The estimates for the
accruals for the SRP and PRGMIP for 2017 are based on preliminary projected estimates provided by the plan's actuary less ADB's
expected contributions included in the 2017 budget. The final figures for the NPBC for the SRP and PRGMIP for 2017 could be significantly
different from these estimates, based on the demographic and market based assumptions as of 31 December 2016, and will be available
only in the first quarter of 2017. An accounting accrual is set up for the NPBC less budgeted contributions for financial reporting purposes,
which may or may not be required for funding purpose. A separate approval of the Board will be sought if any cash transfers will be made
from the OCR balance sheet to the SRP fund in 2017.
L = not applicable or not calculated, ( ) = negative, ADB = Asian Development Bank, ESP = Early Separation Program, IAE = internal
administrative expenses, OCR = ordinary capital resources, PRGMIP = Post-Retirement Group Medical Insurance Plan, SRP = Staff
Retirement Plan.
This excludes SRP contribution for the Board of Directors. The SRP budget for the Board of Directors is included under the Board of
Directors budget category.
Refers to adjustments net of accrued resettlement and repatriation allowances and severance payments, costs for Afghanistan Guest
House and Public Information Center, other miscellaneous items and expenses of the Japan Special Fund.
Refers to administrative expenses before adjusting for fee reimbursements and includes ESP for the 2016 budget and 2016 midyear
estimate.
Refers to administrative expenses related to loan origination. Accounting standards require that a portion of the loan origination costs be
deferred and amortized over the life of the loan. ADB uses 20 basis points of the amount of loans that become effective to represent the
amount of loan origination costs that need to be deferred.

45 Appendix 2
SUMMARY OF ANNUAL CAPITAL EXPENDITURES ($’000)
2016
2015a Midyear 2017 2015 2016 Midyear
Item Estimate Budget Actual Budget EstimateA. Headquarters Facilities 2,098 3,002 2,555 2,020 1,117 1,530 1,476 1,464
Building infrastructure 249 854 860 1,150 294 237 261 239
Nonbuilding infrastructure 1,849 2,148 1,695 870 823 1,293 1,215 1,225Transportation 122 210 210 121 209 177 160 145
Furniture 244 250 250 370 214 280 257 277
Equipment 1,483 1,688 1,235 379 400 836 798 803
B. Technology and Automation Systems 3,720 3,673 3,673 4,272 3,239 3,671 3,931 4,320Computers and peripherals 2,347 2,148 1,648 2,672 1,174 1,492 2,183 2,309Information technology infrastructure 1,202 1,159 1,159 1,067 1,535 1,573 1,226 1,431Telecommunications 171 366 866 533 530 606 522 580
C. Field Offices 2,554 2,427 2,873 3,384 1,671 1,937 2,140 2,131Total 8,372 9,101 9,101 9,676 6,027 7,138 7,547 7,915
Note: Numbers may not sum precisely because of rounding.a
Includes commitments by the end of the implementation period.
Source: Asian Development Bank.
20162016
2017ProjectionActual Budget
Depreciation and AmortizationCapital Expenditure Budget
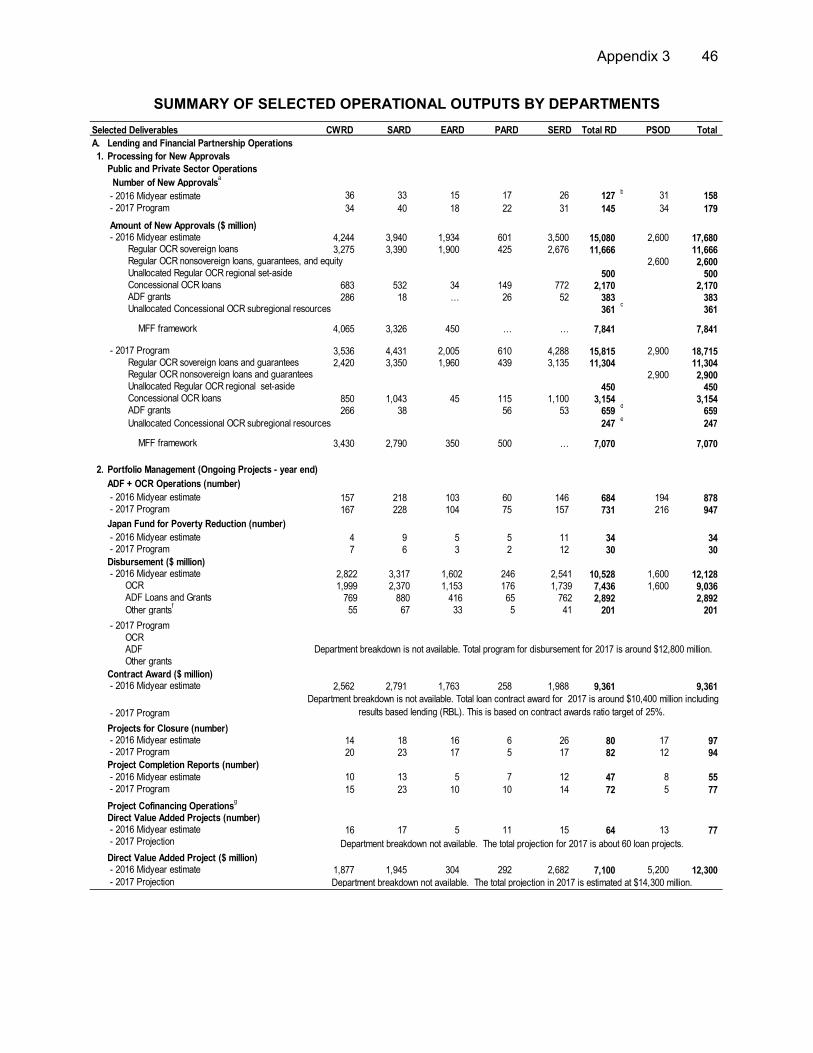
Appendix 3 46
SUMMARY OF SELECTED OPERATIONAL OUTPUTS BY DEPARTMENTS
Selected Deliverables SERD PSOD Total
A. Lending and Financial Partnership Operations
1. Processing for New Approvals
Public and Private Sector Operations
Number of New Approvalsa
- 2016 Midyear estimate 36 33 15 17 26 127 b 31 158
- 2017 Program 34 40 18 22 31 145 34 179
Amount of New Approvals ($ million) - 2016 Midyear estimate 4,244 3,940 1,934 601 3,500 15,080 2,600 17,680 Regular OCR sovereign loans 3,275 3,390 1,900 425 2,676 11,666 11,666 Regular OCR nonsovereign loans, guarantees, and equity 2,600 2,600 Unallocated Regular OCR regional set-aside 500 500 Concessional OCR loans 683 532 34 149 772 2,170 2,170 ADF grants 286 18 L 26 52 383 383 Unallocated Concessional OCR subregional resources 361
c361
MFF framework 4,065 3,326 450 L L 7,841 7,841
- 2017 Program 3,536 4,431 2,005 610 4,288 15,815 2,900 18,715 Regular OCR sovereign loans and guarantees 2,420 3,350 1,960 439 3,135 11,304 11,304 Regular OCR nonsovereign loans and guarantees 2,900 2,900 Unallocated Regular OCR regional set-aside 450 450 Concessional OCR loans 850 1,043 45 115 1,100 3,154 3,154 ADF grants 266 38 56 53 659
d659
Unallocated Concessional OCR subregional resources 247 e
247
MFF framework 3,430 2,790 350 500 L 7,070 7,070
2. Portfolio Management (Ongoing Projects - year end)
ADF + OCR Operations (number)
- 2016 Midyear estimate 157 218 103 60 146 684 194 878 - 2017 Program 167 228 104 75 157 731 216 947
Japan Fund for Poverty Reduction (number)
- 2016 Midyear estimate 4 9 5 5 11 34 34 - 2017 Program 7 6 3 2 12 30 30 Disbursement ($ million) - 2016 Midyear estimate 2,822 3,317 1,602 246 2,541 10,528 1,600 12,128 OCR 1,999 2,370 1,153 176 1,739 7,436 1,600 9,036 ADF Loans and Grants 769 880 416 65 762 2,892 2,892 Other grants
f55 67 33 5 41 201 201
- 2017 Program OCR ADF Other grants
Contract Award ($ million) - 2016 Midyear estimate 2,562 2,791 1,763 258 1,988 9,361 9,361
- 2017 Program
Projects for Closure (number) - 2016 Midyear estimate 14 18 16 6 26 80 17 97 - 2017 Program 20 23 17 5 17 82 12 94 Project Completion Reports (number) - 2016 Midyear estimate 10 13 5 7 12 47 8 55 - 2017 Program 15 23 10 10 14 72 5 77
Project Cofinancing Operationsg
Direct Value Added Projects (number) - 2016 Midyear estimate 16 17 5 11 15 64 13 77 - 2017 Projection
Direct Value Added Project ($ million) - 2016 Midyear estimate 1,877 1,945 304 292 2,682 7,100 5,200 12,300 - 2017 Projection
CWRD
Department breakdown is not available. Total program for disbursement for 2017 is around $12,800 million.
Department breakdown not available. The total projection for 2017 is about 60 loan projects.
Department breakdown not available. The total projection in 2017 is estimated at $14,300 million.
PARD EARD SARD Total RD
Department breakdown is not available. Total loan contract award for 2017 is around $10,400 million including
results based lending (RBL). This is based on contract awards ratio target of 25%.
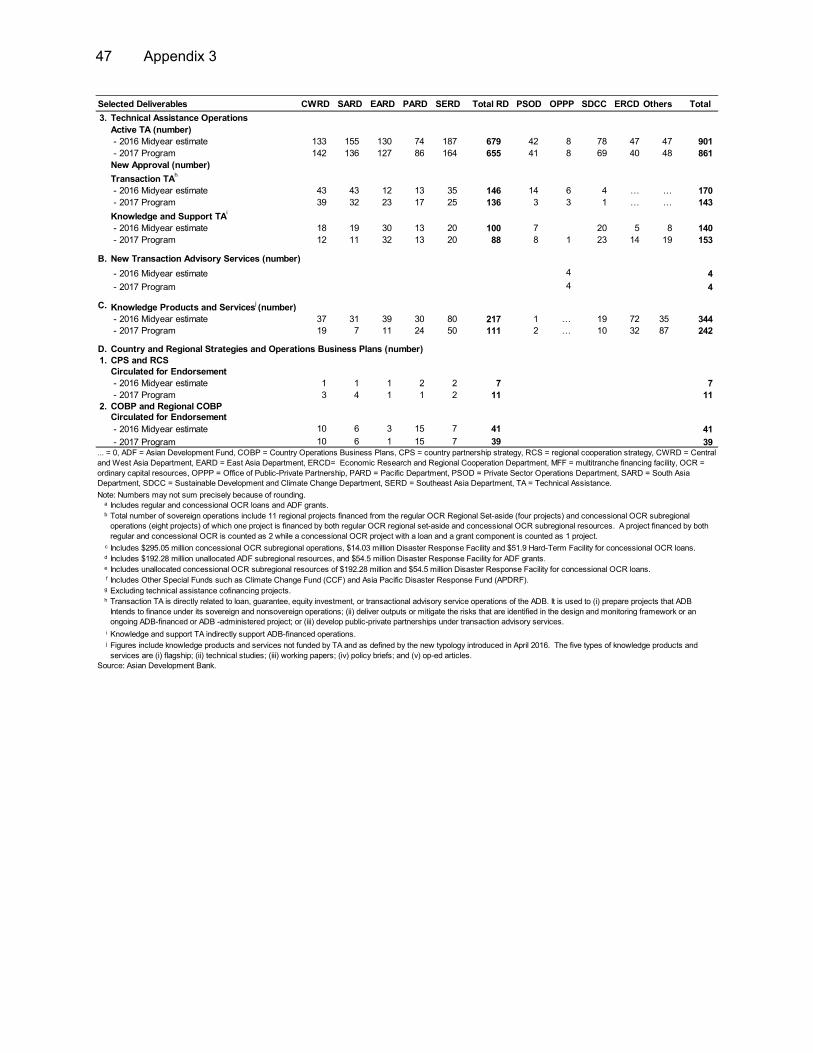
47 Appendix 3
3. Technical Assistance Operations
Active TA (number)
- 2016 Midyear estimate 133 155 130 74 187 679 42 8 78 47 47 901
- 2017 Program 142 136 127 86 164 655 41 8 69 40 48 861
New Approval (number)
Transaction TAh
- 2016 Midyear estimate 43 43 12 13 35 146 14 6 4 L L 170
- 2017 Program 39 32 23 17 25 136 3 3 1 L L 143
Knowledge and Support TAi
- 2016 Midyear estimate 18 19 30 13 20 100 7 20 5 8 140
- 2017 Program 12 11 32 13 20 88 8 1 23 14 19 153
B. New Transaction Advisory Services (number)
- 2016 Midyear estimate 4 4
- 2017 Program 4 4
C. Knowledge Products and Servicesj (number)
- 2016 Midyear estimate 37 31 39 30 80 217 1 L 19 72 35 344
- 2017 Program 19 7 11 24 50 111 2 L 10 32 87 242
D. Country and Regional Strategies and Operations Business Plans (number)
1. CPS and RCSCirculated for Endorsement
- 2016 Midyear estimate 1 1 1 2 2 7 7
- 2017 Program 3 4 1 1 2 11 11 2. COBP and Regional COBP
Circulated for Endorsement
- 2016 Midyear estimate 10 6 3 15 7 41 41
- 2017 Program 10 6 1 15 7 39 39
Note: Numbers may not sum precisely because of rounding.a Includes regular and concessional OCR loans and ADF grants.b
c Includes $295.05 million concessional OCR subregional operations, $14.03 million Disaster Response Facility and $51.9 Hard-Term Facility for concessional OCR loans.d Includes $192.28 million unallocated ADF subregional resources, and $54.5 million Disaster Response Facility for ADF grants.e
f
g Excluding technical assistance cofinancing projects.h
i Knowledge and support TA indirectly support ADB-financed operations.j
Source: Asian Development Bank.
TotalOthersSDCC ERCDSelected Deliverables CWRD SARD EARD PARD SERD PSOD Total RD OPPP
Includes unallocated concessional OCR subregional resources of $192.28 million and $54.5 million Disaster Response Facility for concessional OCR loans.
Includes Other Special Funds such as Climate Change Fund (CCF) and Asia Pacific Disaster Response Fund (APDRF).
... = 0, ADF = Asian Development Fund, COBP = Country Operations Business Plans, CPS = country partnership strategy, RCS = regional cooperation strategy, CWRD = Central
and West Asia Department, EARD = East Asia Department, ERCD= Economic Research and Regional Cooperation Department, MFF = multitranche financing facility, OCR =
ordinary capital resources, OPPP = Office of Public-Private Partnership, PARD = Pacific Department, PSOD = Private Sector Operations Department, SARD = South Asia
Department, SDCC = Sustainable Development and Climate Change Department, SERD = Southeast Asia Department, TA = Technical Assistance.
Transaction TA is directly related to loan, guarantee, equity investment, or transactional advisory service operations of the ADB. It is used to (i) prepare projects that ADB
Intends to finance under its sovereign and nonsovereign operations; (ii) deliver outputs or mitigate the risks that are identified in the design and monitoring framework or an
ongoing ADB-financed or ADB -administered project; or (iii) develop public-private partnerships under transaction advisory services.
Figures include knowledge products and services not funded by TA and as defined by the new typology introduced in April 2016. The five types of knowledge products and
services are (i) flagship; (ii) technical studies; (iii) working papers; (iv) policy briefs; and (v) op-ed articles.
Total number of sovereign operations include 11 regional projects financed from the regular OCR Regional Set-aside (four projects) and concessional OCR subregional
operations (eight projects) of which one project is financed by both regular OCR regional set-aside and concessional OCR subregional resources. A project financed by both
regular and concessional OCR is counted as 2 while a concessional OCR project with a loan and a grant component is counted as 1 project.

Appendix 4 48
IMPACTS FROM INFORMATION TECHNOLOGY REFORMS AND ORGANIZATIONAL RESILIENCE
A. Highlights of the Real-Time ADB Information Technology Reform Strategy
1. Real-Time ADB. The Asian Development Bank (ADB) initiated information technology (IT) reforms in 2016 to automate, simplify, and integrate key systems. These reforms aim to: (i) drive greater agility and mobility, (ii) improve collaboration, (iii) strengthen data quality and consistency, (iv) replace manual processes, (v) reduce heavy reliance on paperwork, (vi) increase resiliency, and (vii) reduce operational risk. Productivity and efficiency gains will be reflected in resource savings and cost avoidance across ADB after the initial investment and stabilization phases of these reforms. For example, automation of the nonsovereign operations system is expected to save the equivalent of 27 full-time staff over the next 5 years, and the new Treasury system for managing structured products is expected to save $7.9 million by 2022 through reduced funding costs.
Figure A4.1: Nine Business Cases Approved by the Information
Technology Committee (as of September 2016)
App = application, HR = human resources, IT = information technology, Mgt = management, OR = organizational resilience, ORM = Office of Risk Management, Sol = solutions. Source: Asian Development Bank.
2. Highlights of the approved business cases. Each approved business case (Figure A4.1) is supported by detailed documentation. A high-level summary of each follows:
(i) Nonsovereign operations. This project will provide automated solutions for (a) credit origination and client relationship management (front-end solution); (b) nonsovereign financial transaction processing, including disbursement, billing, and collection processes; accrual and amortization; valuation of investment; and posting to the general ledger; and (c) an integrated data repository and portfolio reporting.
(ii) Disbursement financial system. This project will replace core disbursement systems residing on the main frame: (a) the grant financial information system, (b) the loan financial information system, and (c) the TA information system. All
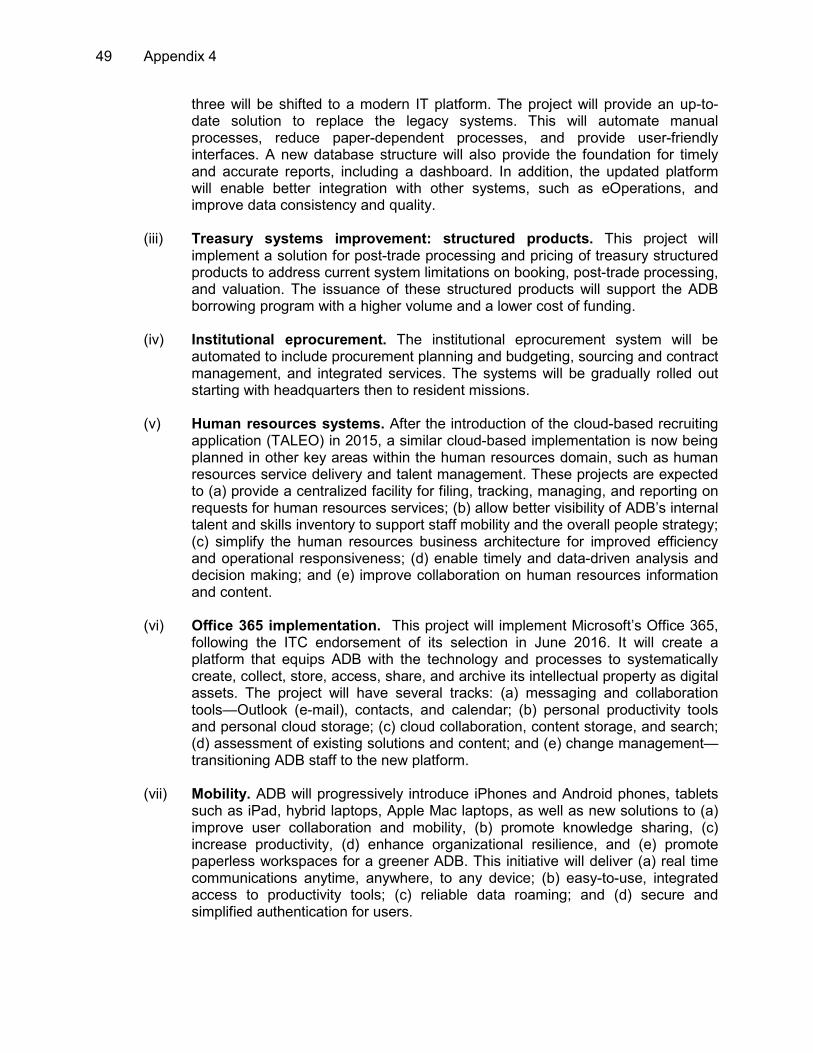
49 Appendix 4
three will be shifted to a modern IT platform. The project will provide an up-to-date solution to replace the legacy systems. This will automate manual processes, reduce paper-dependent processes, and provide user-friendly interfaces. A new database structure will also provide the foundation for timely and accurate reports, including a dashboard. In addition, the updated platform will enable better integration with other systems, such as eOperations, and improve data consistency and quality.
(iii) Treasury systems improvement: structured products. This project will
implement a solution for post-trade processing and pricing of treasury structured products to address current system limitations on booking, post-trade processing, and valuation. The issuance of these structured products will support the ADB borrowing program with a higher volume and a lower cost of funding.
(iv) Institutional eprocurement. The institutional eprocurement system will be
automated to include procurement planning and budgeting, sourcing and contract management, and integrated services. The systems will be gradually rolled out starting with headquarters then to resident missions.
(v) Human resources systems. After the introduction of the cloud-based recruiting
application (TALEO) in 2015, a similar cloud-based implementation is now being planned in other key areas within the human resources domain, such as human resources service delivery and talent management. These projects are expected to (a) provide a centralized facility for filing, tracking, managing, and reporting on requests for human resources services; (b) allow better visibility of ADB’s internal talent and skills inventory to support staff mobility and the overall people strategy; (c) simplify the human resources business architecture for improved efficiency and operational responsiveness; (d) enable timely and data-driven analysis and decision making; and (e) improve collaboration on human resources information and content.
(vi) Office 365 implementation. This project will implement Microsoft’s Office 365,
following the ITC endorsement of its selection in June 2016. It will create a platform that equips ADB with the technology and processes to systematically create, collect, store, access, share, and archive its intellectual property as digital assets. The project will have several tracks: (a) messaging and collaboration tools—Outlook (e-mail), contacts, and calendar; (b) personal productivity tools and personal cloud storage; (c) cloud collaboration, content storage, and search; (d) assessment of existing solutions and content; and (e) change management—transitioning ADB staff to the new platform.
(vii) Mobility. ADB will progressively introduce iPhones and Android phones, tablets
such as iPad, hybrid laptops, Apple Mac laptops, as well as new solutions to (a) improve user collaboration and mobility, (b) promote knowledge sharing, (c) increase productivity, (d) enhance organizational resilience, and (e) promote paperless workspaces for a greener ADB. This initiative will deliver (a) real time communications anytime, anywhere, to any device; (b) easy-to-use, integrated access to productivity tools; (c) reliable data roaming; and (d) secure and simplified authentication for users.
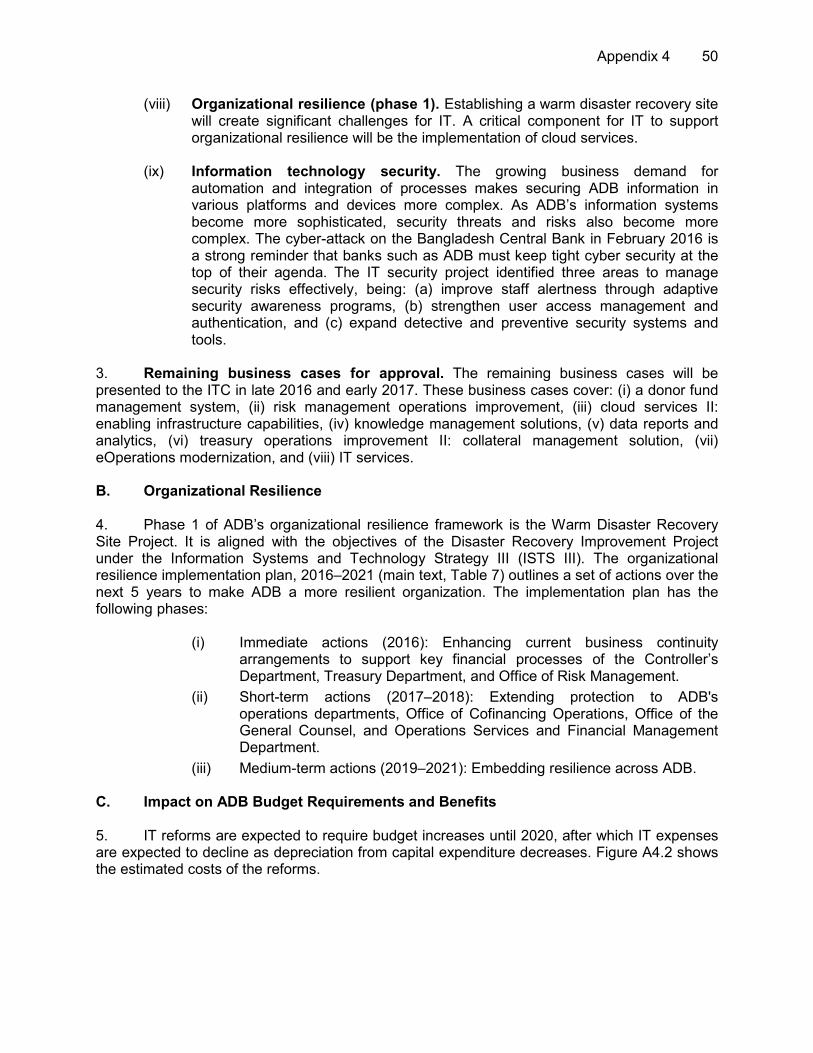
Appendix 4 50
(viii) Organizational resilience (phase 1). Establishing a warm disaster recovery site will create significant challenges for IT. A critical component for IT to support organizational resilience will be the implementation of cloud services.
(ix) Information technology security. The growing business demand for automation and integration of processes makes securing ADB information in various platforms and devices more complex. As ADB’s information systems become more sophisticated, security threats and risks also become more complex. The cyber-attack on the Bangladesh Central Bank in February 2016 is a strong reminder that banks such as ADB must keep tight cyber security at the top of their agenda. The IT security project identified three areas to manage security risks effectively, being: (a) improve staff alertness through adaptive security awareness programs, (b) strengthen user access management and authentication, and (c) expand detective and preventive security systems and tools.
3. Remaining business cases for approval. The remaining business cases will be presented to the ITC in late 2016 and early 2017. These business cases cover: (i) a donor fund management system, (ii) risk management operations improvement, (iii) cloud services II: enabling infrastructure capabilities, (iv) knowledge management solutions, (v) data reports and analytics, (vi) treasury operations improvement II: collateral management solution, (vii) eOperations modernization, and (viii) IT services. B. Organizational Resilience
4. Phase 1 of ADB’s organizational resilience framework is the Warm Disaster Recovery Site Project. It is aligned with the objectives of the Disaster Recovery Improvement Project under the Information Systems and Technology Strategy III (ISTS III). The organizational resilience implementation plan, 2016–2021 (main text, Table 7) outlines a set of actions over the next 5 years to make ADB a more resilient organization. The implementation plan has the following phases:
(i) Immediate actions (2016): Enhancing current business continuity
arrangements to support key financial processes of the Controller’s Department, Treasury Department, and Office of Risk Management.
(ii) Short-term actions (2017–2018): Extending protection to ADB's operations departments, Office of Cofinancing Operations, Office of the General Counsel, and Operations Services and Financial Management Department.
(iii) Medium-term actions (2019–2021): Embedding resilience across ADB. C. Impact on ADB Budget Requirements and Benefits
5. IT reforms are expected to require budget increases until 2020, after which IT expenses are expected to decline as depreciation from capital expenditure decreases. Figure A4.2 shows the estimated costs of the reforms.

51 Appendix 4
Figure A4.2: Real-Time ADB’s Impact on Information Technology Budget, 2016–2023 (Preliminary Estimates, 2017–2023)
AE = administrative expenses, CAPEX = capital expenditure, ISTS = Information Systems and Technology Strategy. Note: Figures are in nominal terms. Source: Asian Development Bank.
6. Figure A4.3 shows the estimated budget requirement to fulfill the actions under the organizational resilience implementation plan over 2017–2022. While the estimate for 2017 is based on the current assessment of the organizational resilience requirements, the estimates for the business needs in 2018–2022 are preliminary. Annual spending is anticipated to decline after 2017.
Figure A4.3: Annual Organizational Resilience Spending, 2017–2022 (Preliminary Estimates, 2018–2022)
Note: Numbers may not sum precisely because of rounding. Source: Asian Development Bank.
29.8 28.4 29.0 29.6 30.3 31.0 31.6 32.3
8.67.0 5.5 5.0 4.1 3.9 3.8 3.61.0 6.1 8.8 12.4 11.8 11.8 11.84.0
7.0
12.112.1 12.1 8.1 5.1
35.4 34.5 34.6 34.4 34.9 35.4 35.9
38.440.4
47.6
55.458.9 58.8
55.352.8
0
10
20
30
40
50
60
70
2016 2017 2018 2019 2020 2021 2022 2023
US$
Mill
ion
s
Additional
Depreciation
Additional AE
Current
Depreciation
Current AE
Current Total
Expenses
Revised Total
Expenses
5.013.1
20.8 24.5 23.919.9 16.9
Real time
ADB
Existing
Systems
Real Time ADB Capex $2.9M $28.3M $17.5M $11.5M $1.3M $1.3M $1.3M $1.3M
ISTS II - $2.5M - - - - - -
ISTS III $2.9M $25.1M $16.3M $6.7M - - - -
Annual Capex (Mobility) - $0.7M $1.2M $1.3M $1.3M $1.3M $1.3M $1.3M
Funding Gap - - - $3.5M - - - -
Non Real Time ADB Capex $4.1M $4.1M $4.1M $4.1M $3.5M $3.5M $3.5M $3.5M
2.1 2.0 1.9 1.9 2.1 2.1
0.9 0.9 1.0 1.0 0.2 0.2
3.0 2.9 2.9 2.9
2.3 2.3
0.0
1.0
2.0
3.0
4.0
5.0
6.0
2017 2018 2019 2020 2021 2022
Depreciation Annual Spend Total
US
$ m
illio
n

Appendix 4 52
D. Benchmarking Information Technology Spending against Comparator Organizations
[The information has been removed in accordance with para. 97 (i and viii) of ADB‘s Public Communications Policy (2011).]

53 Appendix 5
SUMMARY OF ADB EFFICIENCY
A. 2016 Highlights and Expectations for 2017
1. The midyear review of 2016 budget and departmental submissions for the Work Program and Budget Framework (WPBF), 2017–20191 allowed the quantification of some of the savings from efficiency measures that have been implemented and are planned. For 2016, incremental efficiency savings were expected to be about $8.5 million (excluding the impact of workload and workforce analysis and the Early Separation Program). In 2017, incremental efficiency savings of about $10.5 million are estimated, excluding the impact of staff optimization measures. 2. Information technology efficiency. The Asian Development Bank (ADB) is modernizing and updating its information technology (IT) services. These efforts will generate significant efficiency savings as the IT reforms roll out. Most of the savings are expected to be realized in the later years of the reforms. However, ADB has also taken strong steps to contain current IT spending, which will reduce the impact of IT reforms on overall budget requirements. During 2016, ADB rebid the wide area network services agreement, which significantly increased the bandwidth provided to field offices, improved resilience through a more robust network structure, and reduced the cost by 40% (equivalent to annual savings of $2.0 million). Renegotiation of other large IT contracts will save $0.8 million in maintenance costs. System enhancements for institutional procurement, human resources, mobility, and other administrative systems will save an additional $0.8 million. These initiatives, with some other minor automation efforts, will generate incremental IT efficiency savings estimated at $3.6 million for 2017. 3. Review of overseas duty station allowances. ADB postponed the regular six-monthly review of the overseas duty station allowances (ODSAs) in 2015 due to the benefits review undertaken in that year. ODSAs include cost-of-living allowances (COLAs), hardship and location allowances, additional locality premiums, and hardship premiums. The review recommended the retention of the current rates for all allowances except the COLA. The COLA experienced a large variation, and was increased in 1 location and decreased in 18 locations. The 2016 review covered changes that took place over a 12-month period. Changes in COLA are limited to 10% every six months to ensure staff is not adversely impacted. The ODSA reduction will generate annual savings of $1.9 million, which equates to a 25% reduction in the budget requirements for OSDA. 4. Operations efficiency in planning discretionary expenses. During the 2017 budget exercise, departments rationalized their budget requests for discretionary items, particularly related to business travel and staff consulting requirements. This was achieved through better mission planning and budgeting, more use of videoconference facilities, use of other funds for staff consulting engagements, and preference for national consultants. In 2017, budget requirements of the operations departments would have been about $1.6 million higher for business travel and staff consultants without this rationalization. 5. Budget management and flexibility measures. To improve budget planning and resource management, ADB began implementing measures in mid-2016 to enhance the flexibility of budgetary resources and increase transparency of resource use by user
1 ADB. 2016. Work Program and Budget Framework, 2017–2019. Manila.

Appendix 5 54
departments. These measures are expected to increase budget accountability and improve budget utilization. Better utilization should mean budget requirements will more closely reflect actual expenses, which will in turn reduce budget requests. Estimated efficiency savings are based on an improvement in budget utilization of 2.5% across discretionary expenses in 2017, which would result in saving of $1.5 million. The following measures are being implemented:
(i) Enhanced budget management flexibility. In July 2016, ADB rolled out enhanced budget management flexibility measures, which empowered business units by delegating authority to transfer budget funds between and across selected expense items. This allows business units to reallocate savings promptly to priority activities, ensuring efficient execution and optimal use of budgetary resources.
(ii) Incentives for better budget planning. ADB is introducing additional incentives to departments for prudent budget planning and efficient use of resources. The incentive measures are (a) reporting budget utilization status by department for increased transparency and accountability, (b) recognizing departments with good budget planning and performance relative to their work programs, and (c) shortening the accrual period for staff consultant costs. More realistic budget estimates and less variance between budget and actual spending are envisaged.
(iii) Improved budget management information systems. Since May 2016, an
automated departmental budget utilization report from the budget monitoring and control system is sent to the heads of departments and budget coordinators monthly and quarterly. Such notifications increase managerial awareness. ADB is refining and upgrading the user interface, accessibility, and reporting capability of the budget monitoring and control system to expedite Management’s decision making on resource allocations, deployment, and monitoring.
6. Business travel reforms. The second phase of business travel reforms began in 2016, with new initiatives approved to reduce the administrative burden of travel, simplify the underlying travel policy, and improve the eTrip system. 7. The new reforms will (i) allow greater flexibility in the field for unplanned changes; (ii) update the airfare benchmarking process; (iii) offer online booking options for travelers; (iv) ensure enhanced monitoring and services from the contracted travel agencies; (v) strengthen travel documentation, including the provision of the Asia Pacific Economic Cooperation business travel card; (vi) streamline travel allowances; and (vii) enhance the user experience in eTrip through simplification of the travel request authorization and request for reimbursement business travel modules, as well as the introduction of a mobile application. 8. Policy updates and the related fundamental system changes will become effective in early 2017. These updates are conservatively estimated to save $0.5 million in 2017. More system enhancements will be implemented throughout 2017 and will generate additional efficiency gains.
9. Earlier reforms, introduced in January 2014, continue to have a strong impact on reducing business travel costs and are still contributing to incremental efficiency gains. These reforms are expected to save $0.9 million in 2017 through the use of economy class airfares, less travel to locations that are not in ADB’s developing member countries, and less travel for conferences and seminars.
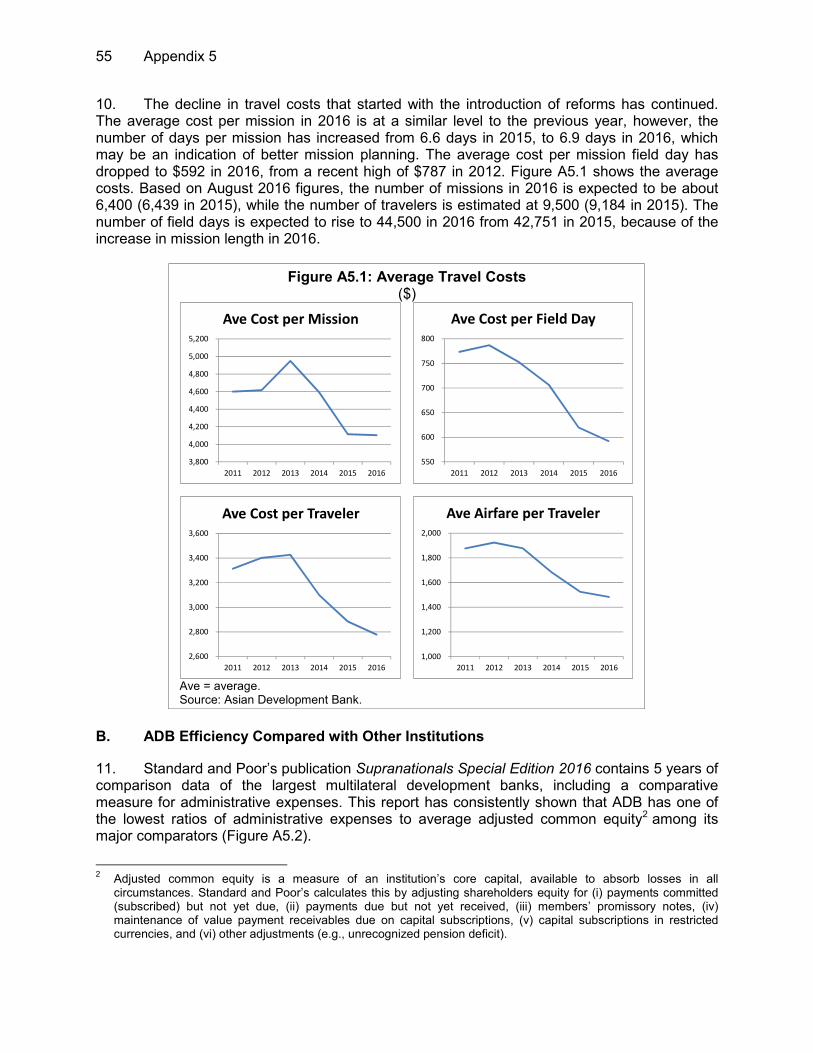
55 Appendix 5
10. The decline in travel costs that started with the introduction of reforms has continued. The average cost per mission in 2016 is at a similar level to the previous year, however, the number of days per mission has increased from 6.6 days in 2015, to 6.9 days in 2016, which may be an indication of better mission planning. The average cost per mission field day has dropped to $592 in 2016, from a recent high of $787 in 2012. Figure A5.1 shows the average costs. Based on August 2016 figures, the number of missions in 2016 is expected to be about 6,400 (6,439 in 2015), while the number of travelers is estimated at 9,500 (9,184 in 2015). The number of field days is expected to rise to 44,500 in 2016 from 42,751 in 2015, because of the increase in mission length in 2016.
Figure A5.1: Average Travel Costs ($)
Ave = average. Source: Asian Development Bank.
B. ADB Efficiency Compared with Other Institutions
11. Standard and Poor’s publication Supranationals Special Edition 2016 contains 5 years of comparison data of the largest multilateral development banks, including a comparative measure for administrative expenses. This report has consistently shown that ADB has one of the lowest ratios of administrative expenses to average adjusted common equity2 among its major comparators (Figure A5.2).
2
Adjusted common equity is a measure of an institution’s core capital, available to absorb losses in all circumstances. Standard and Poor’s calculates this by adjusting shareholders equity for (i) payments committed (subscribed) but not yet due, (ii) payments due but not yet received, (iii) members’ promissory notes, (iv) maintenance of value payment receivables due on capital subscriptions, (v) capital subscriptions in restricted currencies, and (vi) other adjustments (e.g., unrecognized pension deficit).
3,800
4,000
4,200
4,400
4,600
4,800
5,000
5,200
2011 2012 2013 2014 2015 2016
Ave Cost per Mission
550
600
650
700
750
800
2011 2012 2013 2014 2015 2016
Ave Cost per Field Day
2,600
2,800
3,000
3,200
3,400
3,600
2011 2012 2013 2014 2015 2016
Ave Cost per Traveler
1,000
1,200
1,400
1,600
1,800
2,000
2011 2012 2013 2014 2015 2016
Ave Airfare per Traveler

Appendix 5 56
Figure A5.2: 2015 Administrative Expense to Average Adjusted Common Equity of Multilateral Development Banks
(%)
ADB = Asian Development Bank, AfDB = African Development Bank, EBRD = European Bank for Reconstruction and Development, IADB = Inter-American Development Bank, WBG = World Bank Group. Source: Standard & Poor’s. 2016. Supranationals Special Edition 2016.
12. [The information has been removed in accordance with para. 97 (i and viii) of ADB‘s Public Communications Policy (2011).]
13. [The information has been removed in accordance with para. 97 (i and viii) of ADB‘s Public Communications Policy (2011).]
14. [The information has been removed in accordance with para. 97 (i and viii) of ADB‘s Public Communications Policy (2011).]
5.4%
3.2%3.0%
2.2%2.3%
0.0%
1.0%
2.0%
3.0%
4.0%
5.0%
6.0%
WBG IADB EBRD AfDB ADB

57 Appendix 6
STAFF POSITIONS BY DEPARTMENT AND OFFICE
Current 2016a Start 2017
Seniorb Other Total Seniorb Other Total Seniorb Other Total
A. President 24 56 80 40 63 24 57 81 41 66 24 62 86 44 66
Offices of Management 8 9 17 1 19 8 9 17 1 19 8 9 17 1 19
Office of the Special Project Facilitator 1 1 2 1 1 1 1 2 1 1 1 1 2 1 1
Office of the Auditor General 2 9 11 11 10 2 9 11 11 10 2 9 11 11 10
Office of Anticorruption and Integrity 3 7 10 8 5 3 8 11 9 6 3 8 11 11 6
Strategy and Policy Department 5 17 22 14 16 5 17 22 14 16 5 17 22 15 16
European Representative Office 1 1 2 1 2 1 1 2 1 2 1 1 2 1 2
Japanese Representative Office 1 1 2 1 2 1 1 2 1 2 1 1 2 1 2
North American Representative Office 1 1 2 1 2 1 1 2 1 2 1 1 2 1 2
Office of Public-Private Partnership 2 10 12 2 6 2 10 12 2 8 2 15 17 2 8
B.
27 107 134 71 82 29 105 134 71 82 29 108 137 73 82
Department of External Relations 2 19 21 17 15 2 19 21 17 15 2 19 21 17 15
17 51 68 26 42 19 49 68 26 42 19 51 70 28 42
8 37 45 28 25 8 37 45 28 25 8 38 46 28 25
C. Operations 1 38 219 257 200 280 40 220 260 199 284 40 226 266 209 288
South Asia Department 17 117 134 108 156 18 115 133 107 156 18 117 135 112 158
South Asia Department (HQ) 11 101 112 22 61 11 99 110 22 61
Bangladesh Resident Mission 2 5 7 21 27 2 5 7 21 27
Bhutan Resident Mission 1 1 1 1 1 1
India Resident Mission 2 5 7 32 33 2 5 7 32 33
Nepal Resident Mission 1 3 4 17 18 1 3 4 17 18
Sri Lanka Resident Mission 1 3 4 15 16 1 3 4 14 16
Central and West Asia Department 21 102 123 92 124 22 105 127 92 128 22 109 131 97 130
Central and West Asia Department (HQ) 10 89 99 19 54 11 93 104 19 56
Afghanistan Resident Mission 1 4 5 11 11 1 4 5 12 11
Armenia Resident Mission 1 1 4 2 1 1 4 3
Azerbaijan Resident Mission 1 1 5 2 1 1 5 2
Georgia Resident Mission 1 1 4 2 1 1 4 3
Kazakhstan Resident Mission 1 1 2 7 7 1 1 2 6 7
Kyrgyz Republic Resident Mission 1 1 2 5 7 1 1 2 5 7
Pakistan Resident Mission 2 3 5 20 19 2 3 5 20 19
Tajikistan Resident Mission 1 1 2 4 10 1 1 2 4 10
Turkey Regional Office 1 1
Turkmenistan Resident Mission 1 1 3 1 1 1 3 1
Uzbekistan Resident Mission 1 3 4 9 9 1 2 3 9 9
D. Operations 2 37 221 258 172 246 37 220 257 173 251 37 224 261 181 257
East Asia Department 10 68 78 46 71 10 67 77 47 71 10 67 77 48 71
East Asia Department (HQ) 7 60 67 11 37 7 60 67 11 37
PRC Resident Mission 2 6 8 27 26 2 5 7 27 26
Mongolia Resident Mission 1 2 3 8 8 1 2 3 9 8
International Staff
NS AS
Knowledge Management and Sustainable
Development
Economic Research and Regional
Cooperation Department
Sustainable Development and Climate
Change Department
Department/Office
Start 2016
International Staff
NS AS
International Staff
NS AS
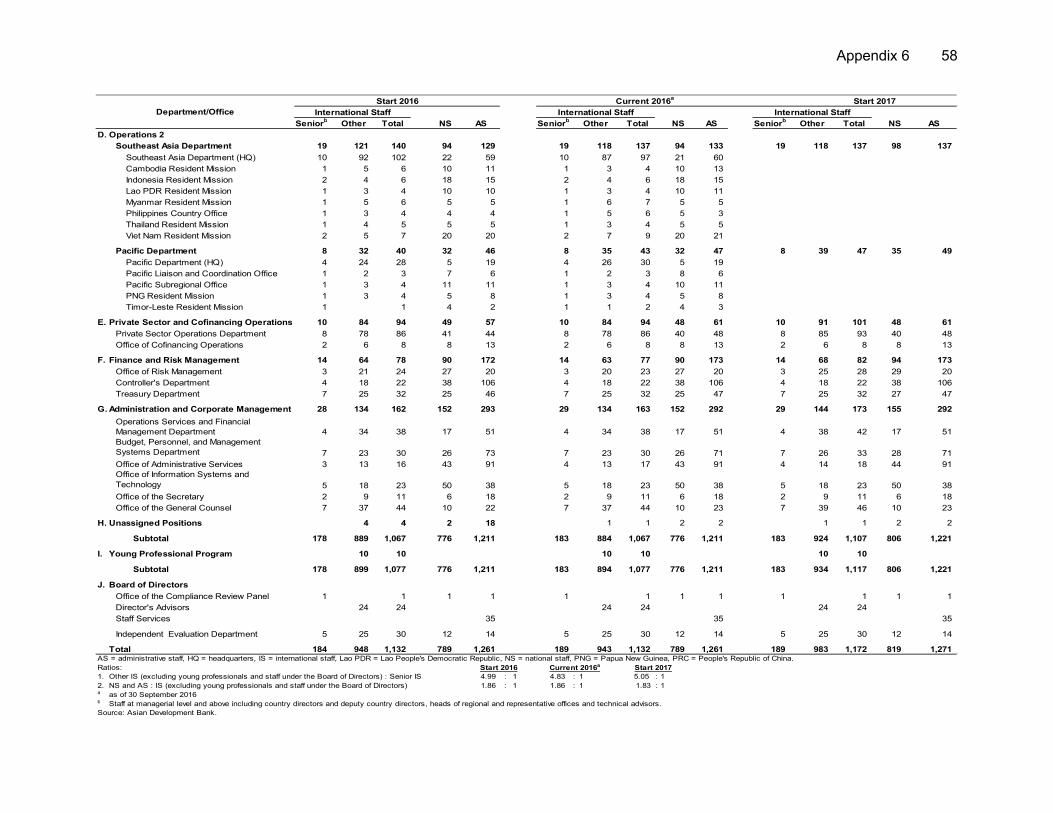
Appendix 6 58
Current 2016a
Start 2017
Seniorb
Other Total Seniorb
Other Total Seniorb
Other Total
D. Operations 2 37 221 258 172 246 37 220 257 173 251 37 224 261 181 257
Southeast Asia Department 19 121 140 94 129 19 118 137 94 133 19 118 137 98 137
Southeast Asia Department (HQ) 10 92 102 22 59 10 87 97 21 60
Cambodia Resident Mission 1 5 6 10 11 1 3 4 10 13
Indonesia Resident Mission 2 4 6 18 15 2 4 6 18 15
Lao PDR Resident Mission 1 3 4 10 10 1 3 4 10 11
Myanmar Resident Mission 1 5 6 5 5 1 6 7 5 5
Philippines Country Office 1 3 4 4 4 1 5 6 5 3
Thailand Resident Mission 1 4 5 5 5 1 3 4 5 5
Viet Nam Resident Mission 2 5 7 20 20 2 7 9 20 21
Pacific Department 8 32 40 32 46 8 35 43 32 47 8 39 47 35 49
Pacific Department (HQ) 4 24 28 5 19 4 26 30 5 19
Pacific Liaison and Coordination Office 1 2 3 7 6 1 2 3 8 6
Pacific Subregional Office 1 3 4 11 11 1 3 4 10 11
PNG Resident Mission 1 3 4 5 8 1 3 4 5 8
Timor-Leste Resident Mission 1 1 4 2 1 1 2 4 3
E. Private Sector and Cofinancing Operations 10 84 94 49 57 10 84 94 48 61 10 91 101 48 61
Private Sector Operations Department 8 78 86 41 44 8 78 86 40 48 8 85 93 40 48
Office of Cofinancing Operations 2 6 8 8 13 2 6 8 8 13 2 6 8 8 13
F. Finance and Risk Management 14 64 78 90 172 14 63 77 90 173 14 68 82 94 173
Office of Risk Management 3 21 24 27 20 3 20 23 27 20 3 25 28 29 20
Controller's Department 4 18 22 38 106 4 18 22 38 106 4 18 22 38 106
Treasury Department 7 25 32 25 46 7 25 32 25 47 7 25 32 27 47
G. Administration and Corporate Management 28 134 162 152 293 29 134 163 152 292 29 144 173 155 292
4 34 38 17 51 4 34 38 17 51 4 38 42 17 51
7 23 30 26 73 7 23 30 26 71 7 26 33 28 71
Office of Administrative Services 3 13 16 43 91 4 13 17 43 91 4 14 18 44 91
5 18 23 50 38 5 18 23 50 38 5 18 23 50 38
Office of the Secretary 2 9 11 6 18 2 9 11 6 18 2 9 11 6 18
Office of the General Counsel 7 37 44 10 22 7 37 44 10 23 7 39 46 10 23
H. Unassigned Positions 4 4 2 18 1 1 2 2 1 1 2 2
Subtotal 178 889 1,067 776 1,211 183 884 1,067 776 1,211 183 924 1,107 806 1,221
I. Young Professional Program 10 10 10 10 10 10
Subtotal 178 899 1,077 776 1,211 183 894 1,077 776 1,211 183 934 1,117 806 1,221
J. Board of Directors
Office of the Compliance Review Panel 1 1 1 1 1 1 1 1 1 1 1 1
Director's Advisors 24 24 24 24 24 24
Staff Services 35 35 35
Independent Evaluation Department 5 25 30 12 14 5 25 30 12 14 5 25 30 12 14
Total 184 948 1,132 789 1,261 189 943 1,132 789 1,261 189 983 1,172 819 1,271
Ratios:
1. Other IS (excluding young professionals and staff under the Board of Directors) : Senior IS 4.99 : 1 4.83 : 1 5.05 : 1
2. NS and AS : IS (excluding young professionals and staff under the Board of Directors) 1.86 : 1 1.86 : 1 1.83 : 1a as of 30 September 2016b Staff at managerial level and above including country directors and deputy country directors, heads of regional and representative offices and technical advisors.
Source: Asian Development Bank.
Department/Office
Start 2016
International Staff
NS AS
International Staff
NS AS
AS = administrative staff, HQ = headquarters, IS = international staff, Lao PDR = Lao People's Democratic Republic, NS = national staff, PNG = Papua New Guinea, PRC = People's Republic of China.
International Staff
NS AS
Budget, Personnel, and Management
Systems Department
Start 2016
Office of Information Systems and
Technology
Current 2016a
Operations Services and Financial
Management Department
Start 2017
59 Appendix 7
PRICE AND VOLUME GROWTH 1. The nominal budget growth comprises a price increase and real growth. At the Asian Development Bank (ADB), real growth is commonly referred as a volume growth. The price increase is determined based on the overall weighted average of all price increments influencing the adjustments in each major expense item. Applicable rates (price increase or decrease) are used to compute price increases (or decreases) in all expenses to derive the overall weighted average price increase. The volume growth (or decrease) is because of factors including (i) changes in units of activity, such as incremental work program and new initiatives; (ii) increases in staff costs resulting from new staff positions; (iii) incremental consulting services and mission travel compared with the previous levels; and (iv) incremental costs because of office expansion.
2. The price adjustments include (i) the anticipated salary increase and the impact of the currency exchange against United States dollar for peso and salaries denominated in other local currencies; (ii) adjustments to salary-related benefits, such as contributions to the Staff Retirement Plan; (iii) adjustments in rates for other benefits expense items, such as medical insurance, education, and rental assistance; (iv) adjustments to rates for international and national staff consultants; and (v) adjustments in travel and travel-related costs using the applicable price index. The budget estimates for administrative expenses are adjusted using the average country-specific consumer price index and the impact of currency exchange against United States dollar for peso-denominated expenses. These include expense items such as communication, office occupancy, library and subscriptions, office supplies, equipment maintenance and support services, contractual services, insurance, and miscellaneous expenses.
3. The net internal administrative expenses budget for 2017 is $647.0 million.1 This is an increase of $18.6 million (3.0%) over the 2016 budget of $628.3 million (before the provision of $7.3 million for the Early Separation Program in 2016). The 3.0% growth comprises a price increase of 2.3% ($14.4 million) and net volume growth of 0.7% ($4.2 million). The assumptions for the price factor for the 2017 budget are presented in Table A7.1; the overall price increase by major expense category is provided in Table A7.2. Further analysis of changes in budget estimates by major expense category is available in Section V.C.
1 Net internal administrative expenses for 2016 consist of $633.3 million for ADB, $12.1 million for the Independent
Evaluation Department and $1.6 million for the Compliance Review Panel and the Office of the Compliance Review Panel.
Appendix 7 60
Table A7.1: Assumptions for Price Factor
[The table has been removed in accordance with para. 97 (i and viii) of ADB‘s Public Communications Policy (2011).]
61 Appendix 7
Table A7.2: Price and Volume Analysis ($'000)
[The table has been removed in accordance with para. 97 (i and viii) of ADB‘s Public Communications Policy (2011).]
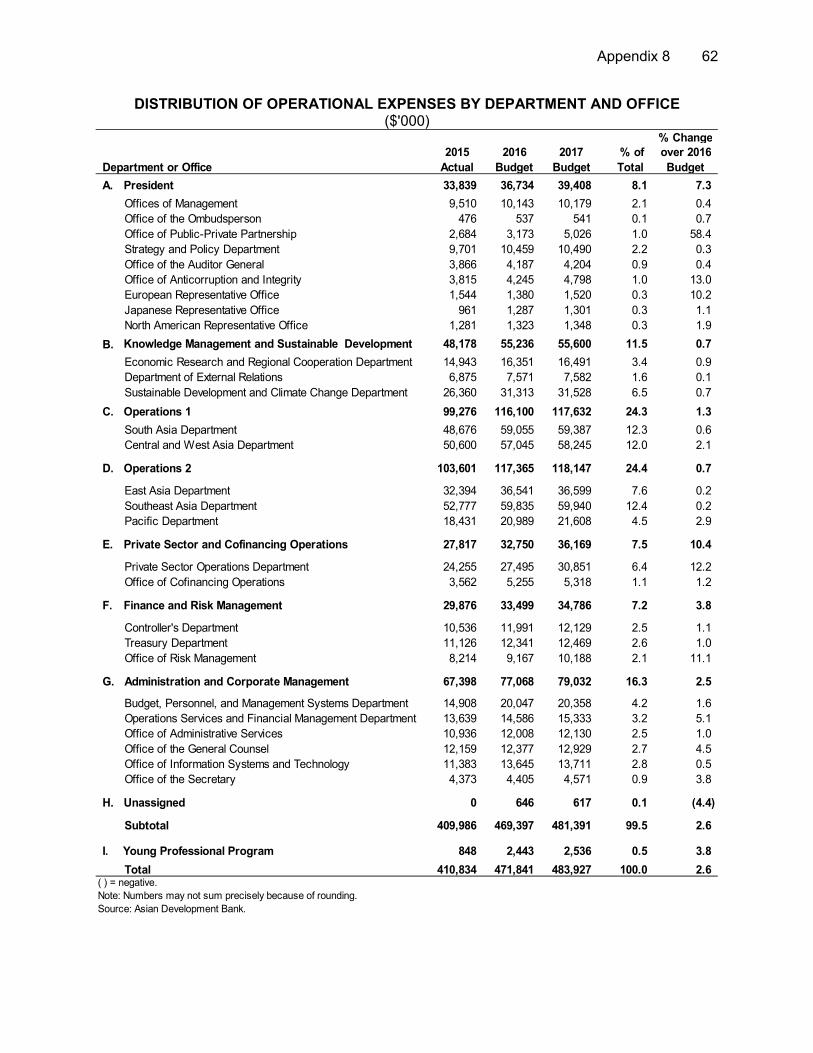
Appendix 8 62
DISTRIBUTION OF OPERATIONAL EXPENSES BY DEPARTMENT AND OFFICE ($'000)
2015 2016 2017
Department or Office Actual Budget Budget
A. President 33,839 36,734 39,408 8.1 7.3
Offices of Management 9,510 10,143 10,179 2.1 0.4
Office of the Ombudsperson 476 537 541 0.1 0.7
Office of Public-Private Partnership 2,684 3,173 5,026 1.0 58.4
Strategy and Policy Department 9,701 10,459 10,490 2.2 0.3
Office of the Auditor General 3,866 4,187 4,204 0.9 0.4
Office of Anticorruption and Integrity 3,815 4,245 4,798 1.0 13.0
European Representative Office 1,544 1,380 1,520 0.3 10.2
Japanese Representative Office 961 1,287 1,301 0.3 1.1
North American Representative Office 1,281 1,323 1,348 0.3 1.9
B. Knowledge Management and Sustainable Development 48,178 55,236 55,600 11.5 0.7
Economic Research and Regional Cooperation Department 14,943 16,351 16,491 3.4 0.9
Department of External Relations 6,875 7,571 7,582 1.6 0.1
Sustainable Development and Climate Change Department 26,360 31,313 31,528 6.5 0.7
C. Operations 1 99,276 116,100 117,632 24.3 1.3
South Asia Department 48,676 59,055 59,387 12.3 0.6
Central and West Asia Department 50,600 57,045 58,245 12.0 2.1
D. Operations 2 103,601 117,365 118,147 24.4 0.7
East Asia Department 32,394 36,541 36,599 7.6 0.2
Southeast Asia Department 52,777 59,835 59,940 12.4 0.2
Pacific Department 18,431 20,989 21,608 4.5 2.9
E. Private Sector and Cofinancing Operations 27,817 32,750 36,169 7.5 10.4
Private Sector Operations Department 24,255 27,495 30,851 6.4 12.2
Office of Cofinancing Operations 3,562 5,255 5,318 1.1 1.2
F. Finance and Risk Management 29,876 33,499 34,786 7.2 3.8
Controller's Department 10,536 11,991 12,129 2.5 1.1
Treasury Department 11,126 12,341 12,469 2.6 1.0
Office of Risk Management 8,214 9,167 10,188 2.1 11.1
G. Administration and Corporate Management 67,398 77,068 79,032 16.3 2.5
Budget, Personnel, and Management Systems Department 14,908 20,047 20,358 4.2 1.6
Operations Services and Financial Management Department 13,639 14,586 15,333 3.2 5.1
Office of Administrative Services 10,936 12,008 12,130 2.5 1.0
Office of the General Counsel 12,159 12,377 12,929 2.7 4.5
Office of Information Systems and Technology 11,383 13,645 13,711 2.8 0.5
Office of the Secretary 4,373 4,405 4,571 0.9 3.8
H. Unassigned 0 646 617 0.1 (4.4)
Subtotal 409,986 469,397 481,391 99.5 2.6
I. Young Professional Program 848 2,443 2,536 0.5 3.8
Total 410,834 471,841 483,927 100.0 2.6( ) = negative.
Note: Numbers may not sum precisely because of rounding.
Source: Asian Development Bank.
% of
Total
% Change
over 2016
Budget

63 Appendix 9
CROSS-YEAR COMPARISON OF INTERNAL ADMINISTRATIVE EXPENSES ($'000)
2016
2016 Midyear 2017 2016
Item 2013 2014 2015 Budget Estimate Budget Budget Estimate
A. Board of Governors 1,647 2,161 2,148 2,197 2,197 2,187 (0.5) (0.5)
Travel 745 1,252 1,050 1,068 1,039 1,052 (1.5) 1.3
Representation 195 146 224 300 267 276 (8.0) 3.4
Administrative expenses 546 660 740 654 751 684 4.6 (8.9)
Seminars 144 86 113 150 115 150 0 30.4
Remuneration committee 17 18 21 25 25 25 0 0
B. Board of Directors 30,488 28,691 29,128 32,782 32,473 33,225 1.4 2.3
Offices of the Directors 17,714 16,490 16,502 18,407 18,407 18,502 0.5 0.5
Accountability Mechanism 2,103 2,034 2,051 2,733 2,424 2,638 (3.5) 8.8
Independent Evaluation 10,671 10,167 10,575 11,642 11,642 12,085 3.8 3.8
C. Operational Expenses 433,195 397,066 410,834 471,841 466,102 483,927 2.6 3.8
Salaries 208,511 211,736 216,896 243,793 241,344 251,065 3.0 4.0
Benefits 160,390 125,257 131,054 149,965 145,688 151,189 0.8 3.8
Contribution to Staff Retirement Plana
74,942 42,640 44,556 53,597 53,487 55,997 4.5 4.7
Staff development 5,630 6,017 5,685 7,500 7,108 7,500 0 5.5
Relocation 5,236 4,944 4,784 9,100 7,949 9,104 0 14.5
Consultants 23,814 22,201 25,516 27,437 30,711 29,564 7.8 (3.7)
Business travel 29,249 26,487 26,494 33,489 32,694 34,925 4.3 6.8
Representation 367 424 405 557 608 580 4.1 (4.6)
D. Administrative Expenses 103,823 108,502 105,086 123,648 122,069 129,926 5.1 6.4
Communications 8,918 8,910 8,349 10,028 9,626 8,477 (15.5) (11.9)
Office occupancy 27,456 28,395 26,610 32,388 31,486 34,549 6.7 9.7
Library and subscription 1,404 1,527 1,538 5,542 5,550 5,794 4.5 4.4
Office supplies 1,668 1,308 1,216 1,806 1,514 1,565 (13.3) 3.4
Equipment, maintenance, and support 10,909 10,797 8,789 10,821 11,454 11,619 7.4 1.4
Contractual services 26,235 28,664 29,215 31,069 30,705 33,928 9.2 10.5
Insurance 4,628 4,661 5,349 6,388 6,390 7,540 18.0 18.0
Depreciation 21,844 23,323 23,181 23,336 23,336 25,110 7.6 7.6
Miscellaneous 762 917 839 2,270 2,008 1,344 (40.8) (33.1)
Total Regular Programs 569,154 536,421 547,195 630,468 622,841 649,265 3.0 4.2
E. General Contingency L L L 6,305 6,305 6,493 L L
F. Fee Reimbursementsb (7,825) (7,985) (8,150) (8,425) (8,425) (8,770) L L
G. Net IAE 561,329 528,436 539,045 628,348 620,721 646,988 3.0 4.2
Early Separation Program L L L 7,276 7,276 L L L
H. Carryover 2% of IAE Budget 11,500 11,967 12,354 L L L L L
I. Net IAE After Carryover and ESP 572,829 540,403 551,399 635,624 627,997 646,988 1.8 3.0
Externally Funded Program 35 587 839 1,423 1,423 1,025 L L
Note: Numbers may not sum precisely because of rounding.
b Estimated service charges for administering external grants excluding Japan trust funds.
Source: Asian Development Bank.
… = not applicable or not calculated, ( ) = negative, ESP = Early Separation Program, IAE = internal administrative expenses.
a This excludes SRP contribution for the Board of Directors. The SRP budget for the Board of Directors is included under the Board of Directors budget
IIIIcategory.
% Change over
Actuals 2016 Midyear
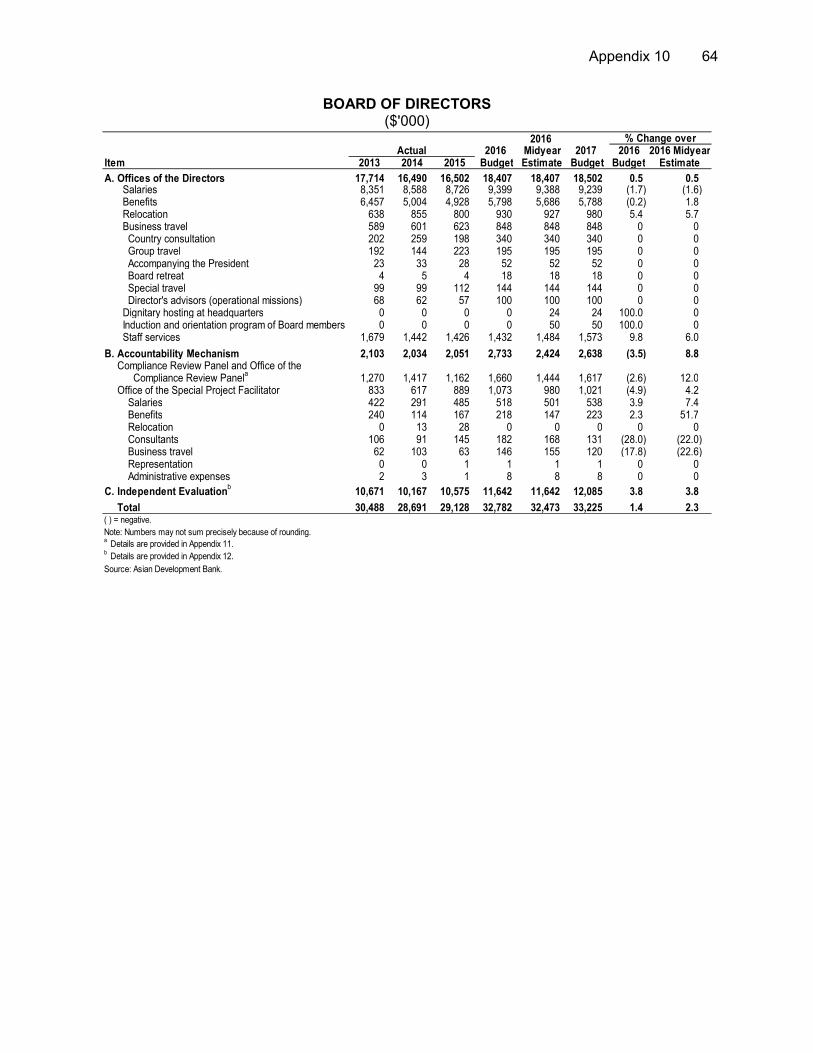
Appendix 10 64
BOARD OF DIRECTORS ($'000)
20162016 Midyear 2017 2016
Item 2013 2014 2015 Budget Estimate Budget Budget
A. Offices of the Directors 17,714 16,490 16,502 18,407 18,407 18,502 0.5 0.5 Salaries 8,351 8,588 8,726 9,399 9,388 9,239 (1.7) (1.6) Benefits 6,457 5,004 4,928 5,798 5,686 5,788 (0.2) 1.8 Relocation 638 855 800 930 927 980 5.4 5.7 Business travel 589 601 623 848 848 848 0 0
Country consultation 202 259 198 340 340 340 0 0Group travel 192 144 223 195 195 195 0 0Accompanying the President 23 33 28 52 52 52 0 0Board retreat 4 5 4 18 18 18 0 0Special travel 99 99 112 144 144 144 0 0Director's advisors (operational missions) 68 62 57 100 100 100 0 0
Dignitary hosting at headquarters 0 0 0 0 24 24 100.0 0 Induction and orientation program of Board members 0 0 0 0 50 50 100.0 0 Staff services 1,679 1,442 1,426 1,432 1,484 1,573 9.8 6.0
B. Accountability Mechanism 2,103 2,034 2,051 2,733 2,424 2,638 (3.5) 8.8
1,270 1,417 1,162 1,660 1,444 1,617 (2.6) 12.0Office of the Special Project Facilitator 833 617 889 1,073 980 1,021 (4.9) 4.2
Salaries 422 291 485 518 501 538 3.9 7.4Benefits 240 114 167 218 147 223 2.3 51.7Relocation 0 13 28 0 0 0 0 0 Consultants 106 91 145 182 168 131 (28.0) (22.0)Business travel 62 103 63 146 155 120 (17.8) (22.6)Representation 0 0 1 1 1 1 0 0Administrative expenses 2 3 1 8 8 8 0 0
C. Independent Evaluationb
10,671 10,167 10,575 11,642 11,642 12,085 3.8 3.8
Total 30,488 28,691 29,128 32,782 32,473 33,225 1.4 2.3( ) = negative.
Note: Numbers may not sum precisely because of rounding.a
Details are provided in Appendix 11.b
Details are provided in Appendix 12.
Source: Asian Development Bank.
Compliance Review Panela
Actual% Change over
2016 MidyearEstimate
Compliance Review Panel and Office of the
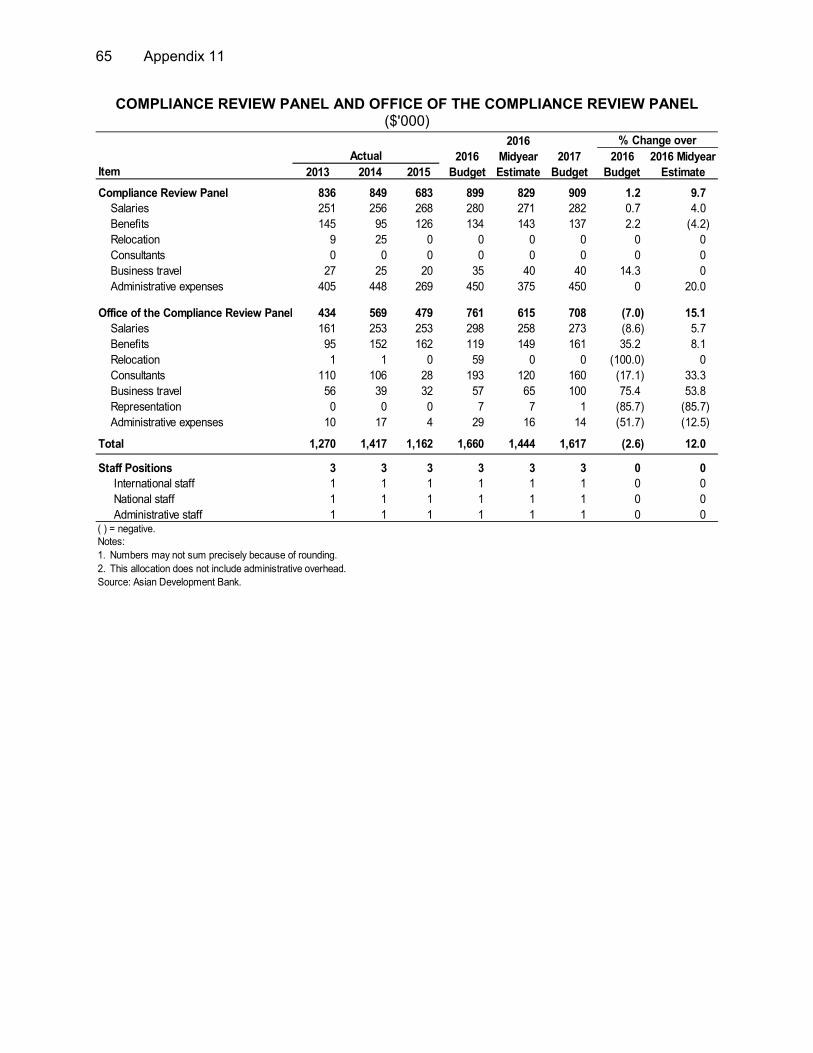
65 Appendix 11
COMPLIANCE REVIEW PANEL AND OFFICE OF THE COMPLIANCE REVIEW PANEL ($'000)
2016
2016 Midyear 2017 2016 2016 Midyear
2013 2014 2015 Budget Estimate Budget Budget Estimate
Compliance Review Panel 836 849 683 899 829 909 1.2 9.7
Salaries 251 256 268 280 271 282 0.7 4.0
Benefits 145 95 126 134 143 137 2.2 (4.2)
Relocation 9 25 0 0 0 0 0 0
Consultants 0 0 0 0 0 0 0 0
Business travel 27 25 20 35 40 40 14.3 0
Administrative expenses 405 448 269 450 375 450 0 20.0
Office of the Compliance Review Panel 434 569 479 761 615 708 (7.0) 15.1
Salaries 161 253 253 298 258 273 (8.6) 5.7
Benefits 95 152 162 119 149 161 35.2 8.1
Relocation 1 1 0 59 0 0 (100.0) 0
Consultants 110 106 28 193 120 160 (17.1) 33.3
Business travel 56 39 32 57 65 100 75.4 53.8
Representation 0 0 0 7 7 1 (85.7) (85.7)
Administrative expenses 10 17 4 29 16 14 (51.7) (12.5)
Total 1,270 1,417 1,162 1,660 1,444 1,617 (2.6) 12.0
Staff Positions 3 3 3 3 3 3 0 0
International staff 1 1 1 1 1 1 0 0
National staff 1 1 1 1 1 1 0 0
Administrative staff 1 1 1 1 1 1 0 0( ) = negative.Notes:
1. Numbers may not sum precisely because of rounding.
2. This allocation does not include administrative overhead.
Source: Asian Development Bank.
Item
Actual
% Change over

Appendix 12 66
INDEPENDENT EVALUATION DEPARTMENT ($'000)
2016
2016 Midyear 2017 2016 2016 Midyear
2013 2014 2015 Budget Estimate Budget Budget Estimate
Salaries 5,051 4,881 5,299 5,535 5,430 5,790 4.6 6.6
Benefits 3,895 3,071 3,218 3,836 3,611 3,742 (2.4) 3.6
Consultants 1,172 1,740 1,650 1,400 1,725 1,540 10.0 (10.7)
Business travel 538 445 378 710 845 840 18.3 (0.6)
Representation 1 2 1 2 4 3 50 (25.0)
Administrative expensesa 14 28 29 160 28 170 6.3 507.1
Total 10,671 10,167 10,575 11,642 11,642 12,085 3.8 3.8
Staff Positions 54 54 56 56 56 56 0 0
International staff 30 30 30 30 30 30 0 0
National staff 11 11 12 12 12 12 0 0
Administrative staff 13 13 14 14 14 14 0 0( ) = negative.Notes:
1. Numbers may not sum precisely because of rounding.
2. This allocation does not include administrative overhead.a
Source: Asian Development Bank.
Item
Actual
% Change over
In 2016, the budget for administrative expenses includes $110,000 for contingency. The midyear estimate for 2016 reflects the
transfers from contingency to consultants and business travel to cover Independent Evaluation Department's requirements for the
second half of the year, including advance work. The 2017 budget includes $120,000 for contingency.

67 Appendix 13
OPERATIONAL EXPENSES ($’000)
2016
2016 Midyear 2017 2016Item 2013 2014 2015 Budget Estimate Budget Budget
A. Salaries 208,511 211,736 216,896 243,793 241,344 251,065 3.0 4.0International staff 148,673 152,223 155,546 168,418 168,852 172,475 2.4 2.1National staff and administrative staff 59,838 59,513 61,351 75,375 72,492 78,590 4.3 8.4
B. Benefits 160,390 125,257 131,054 149,965 145,688 151,189 0.8 3.8
Contribution to staff retirement plan 74,942 42,640 44,556 53,597 53,487 55,997 4.5 4.7
Medical insurance 7,578 7,819 9,035 10,526 10,541 11,179 6.2 6.1Group life insurance 388 372 391 409 427 436 6.6 2.1Accidental death and dismemberment insurance 370 365 381 405 402 434 7.2 8.0Workers' compensation insurance 97 98 102 108 107 116 7.4 8.4Death grant 5 0 28 0 15 0 0 (100.0)Dependency allowance 3,409 3,277 3,252 3,542 3,874 3,978 12.3 2.7Home country travel 7,326 7,341 7,408 7,522 7,743 8,194 8.9 5.8Special travel 231 264 303 320 317 317 (0.9) 0Rental assistance 30,058 29,031 29,080 31,668 31,092 31,614 (0.2) 1.7Education assistance 19,373 19,191 20,175 21,987 20,938 21,089 (4.1) 0.7Special allowances 6,985 7,080 7,456 9,472 6,971 7,234 (23.6) 3.8Severance pay 6,453 4,311 5,392 5,907 5,291 5,919 0.2 11.9Health services 1,957 2,333 2,215 2,658 2,692 2,695 1.4 0.1Welfare and recreation 1,219 1,135 1,281 1,843 1,792 1,988 7.9 10.9
C. Staff development 5,630 6,017 5,685 7,500 7,108 7,500 0 5.5
D. Relocation 5,236 4,944 4,784 9,100 7,949 9,104 0 14.5
E. Consultants 23,814 22,201 25,516 27,437 30,711 29,564 7.8 (3.7)
F. Business travel 29,249 26,487 26,494 33,489 32,694 34,925 4.3 6.8
G. Representation 367 424 405 557 608 580 4.1 (4.6)
Total 433,195 397,066 410,834 471,841 466,102 483,927 2.6 3.8( ) = negative.Note: Numbers may not sum precisely because of rounding.Source: Asian Development Bank.
Estimate
Actual
% Change over
2016 Midyear

Appendix 14 68
ADMINISTRATIVE EXPENSES ($'000)
Item 2013 2014 2015A. Communications 8,918 8,910 8,349 10,028 9,626 8,477 (15.5) (11.9)
Telephone 1,750 1,787 1,255 2,517 2,362 3,161 25.6 33.8 Postage and freight 474 415 356 441 411 409 (7.3) (0.5) Telecommunications network 6,693 6,709 6,738 7,069 6,853 4,907 (30.6) (28.4)
B. Office Occupancy 27,456 28,395 26,610 32,388 31,486 34,549 6.7 9.7 Rental and association dues 10,839 10,965 10,350 12,279 12,179 13,898 13.2 14.1 Building maintenance services 3,899 4,110 4,225 4,916 4,662 4,548 (7.5) (2.4) Building maintenance supplies 1,344 1,427 593 1,097 1,016 1,080 (1.5) 6.3 Building equipment and spare parts 335 558 301 472 588 349 (26.1) (40.6) Alterations and improvements 826 1,127 901 1,465 1,470 2,199 50.1 49.6 Utilities 4,628 4,757 4,577 5,080 4,377 4,541 (10.6) 3.7 Security and food services supplies 5,303 5,320 5,621 6,951 7,056 7,828 12.6 10.9 Furniture 252 108 38 88 97 71 (19.3) (26.8) Furnishings 31 23 2 42 42 36 (14.3) (14.3)
C. Library and Subscription 1,404 1,527 1,538 5,542 5,550 5,794 4.5 4.4 Books 161 164 161 161 161 168 4.3 4.3 Serials 400 402 403 413 413 397 (3.9) (3.9) Documents 5 5 5 5 5 5 0 0 Electronic resources subscription 838 957 969 4,963 4,971 5,223 5.2 5.1
D. Office Supplies 1,668 1,308 1,216 1,806 1,514 1,565 (13.3) 3.4 Expendable supplies 1,466 1,180 1,147 1,625 1,352 1,401 (13.8) 3.6 Semi-expendable supplies 202 128 69 181 162 164 (9.4) 1.2
E. Equipment, Maintenance, and Support 10,909 10,797 8,789 10,821 11,454 11,619 7.4 1.4 Office equipment and maintenance 302 223 270 288 288 242 (16.0) (16.0) Vehicle maintenance 522 558 475 694 601 575 (17.1) (4.3) IT equipment support 10,086 10,016 8,044 9,840 10,565 10,802 9.8 2.2
F. Contractual Services 26,235 28,664 29,215 31,069 30,705 33,928 9.2 10.5 Legal services 2,021 2,102 2,430 4,517 3,852 4,361 (3.5) 13.2 Other professional fees 0 382 221 1,323 1,427 1,760 33.0 23.3 Fiscal services 4,479 4,593 5,390 2,137 2,296 2,280 6.7 (0.7) Information services 2,253 2,092 2,025 1,951 2,120 2,472 26.7 16.6 Administrative and other services 17,481 19,495 19,149 21,141 21,010 23,054 9.0 9.7
G. Insurance 4,628 4,661 5,349 6,388 6,390 7,540 18.0 18.0
H. Depreciation 21,844 23,323 23,181 23,336 23,336 25,110 7.6 7.6
I. Miscellaneous 762 917 839 2,270 2,008 1,344 (40.8) (33.1)
Total 103,823 108,502 105,086 123,648 122,069 129,926 5.1 6.4 ( ) = negative, IT = information technology.Note: Numbers may not sum precisely because of rounding.
Source: Asian Development Bank.
Estimate2017Actual
Budget
2016
MidyearEstimate
2016Budget
% Change over
2016 Budget
2016 Midyear

69 Appendix 15
2017 ANNUAL CAPITAL BUDGET AND 2018–2019 INDICATIVE ANNUAL CAPITAL EXPENDITURE PROGRAMS
($'000)
[The table has been removed in accordance with para. 97 (i and viii) of ADB‘s Public Communications Policy (2011).]

Appendix 16 70
SUMMARY OF SPECIAL CAPITAL EXPENDITURES ($’000)
[The table has been removed in accordance with para. 97 (i and viii) of ADB‘s Public Communications Policy (2011).]

71 Appendix 17
HIGHLIGHTS OF THE STAFF RETIREMENT PLAN PLAN YEAR 1 OCTOBER 2014 TO 30 SEPTEMBER 2015
[The information has been removed in accordance with para. 97 (i and viii) of ADB‘s Public Communications Policy (2011).]

Appendix 18 72
HIGHLIGHTS OF 2016 ANNUAL REVIEW OF SALARY AND BENEFITS 1. The pay policy of the Asian Development Bank (ADB) is to align annually the salary structures midpoints to reflect the market’s 75th percentile—or the upper quartile—and to align staff salaries with the market, through average salary increases. The Board of Directors reaffirmed the pay policy following the 2010 and 2015 comprehensive reviews of salary and benefits.1 2. Salary structure. The market movement determines the adjustment to the salary structure. The salary structure adjustment is the percentage increase needed to align the salary structure midpoints with the market’s 75th percentile after analyzing the market movement. The salary structure adjustment defines the budgetary requirements. 3. Average salary increase and comparatio. Applying the salary structure adjustment to actual staff salaries does not result in aligning staff salaries with the market. To determine the average salary increase needed to achieve this alignment, the actual pay of ADB staff is compared with the midpoints of the salary structure for the same number and mix of staff. This mechanism of comparing ADB staff pay with the updated midpoints of the salary structure is the comparatio. This is an indicator of the competitiveness of ADBs salaries to the market. A comparatio of 100 reflects full alignment to the market’s 75th percentile.
4. The comparatio is an indicator that evolves constantly over time due to changes in the number and composition of staff. These changes generate salary dilution. 2 Salary dilution lowers the comparatio during the year. To maintain the comparatio at a certain level, an additional merit increase to the salary structure adjustment is necessary using the expected savings generated by the salary dilution. The salary structure adjustment plus the additional merit increase equals the average salary increase mentioned in paras. 1 and 3.
5. Historically, ADB staff salaries have fallen short of achieving a 100% comparatio. In 2010, this led the Board of Directors to approve a target to achieve full alignment of pay with the market by 2015. While the comparatio has gradually increased, this target has not been met. Pay has remained below the market because the salary increases provided did not fully offset the impact of salary dilution.
A. 2016 Salary Structure Adjustment Methodology 6. For international staff, the methodology continues to refer to the World Bank Group (WBG) salary structure midpoints as a proxy for the market references. The WBG salary structure midpoints provide a valid proxy for the 75th percentile, as it is based on a well-established and robust approach to measuring the international market. It uses a market composition with a representation of two-thirds private sector and one-third public sector. This representation allows ADB to remain an active player in the labor markets where the organization is recruiting. Currently, more than 70% of ADB’s recruits come from the private sector or other international financial institutions (IFIs). The WBG midpoints have been raised by
1 ADB. 2016. 2016 Annual Review of Salary and Benefits for International Staff, National Staff and Administrative
Staff. Manila. The proposal will be presented for Board consideration on 24 November 2016. 2 Salary dilution is the result of staff members leaving the organization who usually have higher salaries at each
grade than the newly promoted staff or new hires who replace them, and growth in the number of staff positions.
73 Appendix 18
2.5% and are considered representative of the movement of international salaries. ADB’s salary structure for international staff will reflect this movement and be adjusted by 2.5%. 7. For national staff and administrative staff at headquarters, a survey was conducted in September 2016 of the same group of 15 comparators used for the comprehensive review of 2015. These comparators represent public and private companies operating in the Philippines. Based on the survey results, an average adjustment of the salary structure of 5.6% in Philippine pesos would align ADB’s salary structure for national staff and administrative staff at headquarters with the market’s 75th percentile.
8. For national staff and administrative staff in field offices, ADB’s salary structure midpoints are adjusted by reflecting the increase of the WBG salary structure midpoints in each of the duty station locations, except for Japan, which is based on an independent survey conducted by Willis Towers Watson. The proposed adjustment to each of the salary structures for the field offices results in an average adjustment of 7.4% in US dollars equivalent terms.
B. Average Salary Increase Proposals 9. The average salary increases comprise the salary structure adjustment plus an additional merit increase to support salary progression within the range to reward staff for proficiency and performance. 10. Based on the results of the 2016 compensation review, ADB Management is proposing for Board consideration the following:
(i) For international staff, provide a 2.5% adjustment to the salary structure and an
average salary increase of 4.8% for 2017. This increase is the sum of the 2.5% adjustment to the salary scale and an additional merit increase component of 2.3%. The total budget impact of the international staff salary increase for 2017 is 2.5%.
(ii) For national staff and administrative staff at headquarters, provide a 5.6% adjustment to the salary structure and an average salary increase of 7.4% in Philippine peso terms for 2017. This increase is the sum of the 5.6% adjustment to the salary structure and an additional merit increase component of 1.8%. The total budget impact of the salary increase of national staff and administrative staff at headquarters for 2017 is 5.6%.
(iii) For national staff and administrative staff in the 30 field offices, provide a 7.4% adjustment to the salary structure and an average salary increase of 8.8% in United States dollar terms. This increase is the sum of the 7.4 % adjustment to the salary structure and an additional merit increase component of 1.4%. The total budget impact of salary increases of national staff and administrative staff in the field offices for 2017 is 7.4%.
(iv) To more clearly ascertain the market movement for the annual review in field offices, strengthen the methodology to include additional data sources to complement the WBG salary structure midpoints for determining the market reference points (75th percentile).
11. If approved by Board of Directors, the proposed salary structures would become effective on 1 January 2017 for all staff categories.

Appendix 18 74
C. Budget Impact 12. The salary structure adjustments of 2.5% for international staff, 5.6% for national staff and administrative staff at headquarters, and 7.4% on average for national staff and administrative staff in the field offices determine the budgetary requirements (Table A18.1). The salary dilution observed throughout the year will help finance the average salary increases without any budgetary impact.
Table A18.1: Summary of Proposed Increases, 2017
(%) Component IS HQ NSAS FO NSAS Structure adjustment 2.5 5.6 7.4 Average increase
a 4.8 7.4 8.8
FO = field office, HQ = headquarters, IS = international staff, NSAS = national staff and administrative staff. a
Includes an element that supports salary progression within the salary scale and rewards performance.
Source: Asian Development Bank.
13. The overall increase in the salary budget is the projected growth in the amount of salaries and other salary-related personnel actions to be paid in 2017 over the corresponding figures in 2016. The overall increase in the salary budget for 2017 will be used to fund increases in salaries and other related personnel actions, such as confirmations and promotions. The amount being requested in 2017 to fund the overall increase in salaries is $6.9 million.3 This includes $4.2 million for international staff, $1.2 million for national staff and administrative staff at headquarters, and $1.5 million for national staff and administrative staff in field offices (Table A18.2).
Table A18.2: Cost of Overall Increase in Salary Budget
($ million) 2017 2016
Item
IS HQ
NSAS FO
NSAS Total
IS HQ
NSAS FO
NSAS Total Salary Increases
a 4.2 1.2 1.5 6.9 3.9 0.10 0.7 4.70
Salary-Related Benefitsb 1.0 0.3 0.4 1.7 0.9 0.02 0.2 1.12
FO = field office, HQ = headquarters, IS = international staff, NSAS = national staff and administrative staff. a Includes promotion and confirmation increases as well as other salary-related personnel actions.
b Calculated as 23.43% of salary increase (23% for the Staff Retirement Plan and the balance of 0.43% for insurance benefits).
Source: Asian Development Bank. 14. The $6.9 million salary increase represents 1.1% of the estimated proposed 2017 budget; the $1.7 million for salary-related benefit costs represents 0.3% of the 2017 budget. Table A18.3 shows the 10-year history (2007–2016) of the ratio of staff salaries and benefits to internal administrative budget expenses. Salaries and benefits are expected to represent about
3
This includes $6.8 million for salary increases for staff and $0.1 million for Board category (Office of the Compliance Review Panel, Compliance Review Panel and Office of the Special Project Facilitator, Board staff services and Independent Evaluation Department). The 2017 salary budget increase (2017 budget document) of $7.3 million, consists of $6.8 million for salary increases for staff and $0.5 million for other salary components of staff such as leave encashment and termination pay. This amount ($0.5 million) is not included in the salary paper as this is outside the scope of salary paper. The salary increases of $0.1 million for Board category are included in their respective budget line items.

75 Appendix 18
62.2% of the proposed 2017 internal administrative expenses which is lower than the 62.4% of 2016 midyear estimate before the Early Separation Program.
Table A18.3: Ratio of Staff Salaries and Benefits to Internal Administrative
Expenses (%)
IAE = internal administrative expenses, IS = international staff, MY = midyear, NSAS = national staff and administrative staff. Notes: 1. 2007–2015: actual data; 2016: MY estimates. 2. Figures for salary and benefits are adjusted to include cost of temporary staff services under salaries; health
services and staff welfare and recreation under benefits. 3. Percentages of salary and benefits over net IAE for 2007–2011 are adjusted using net IAE after carryover. 4. Major events in the rationalization of salaries and benefits: For international staff:
(i) Education grant: rationalization of tuition and flat rate allowance (1999–2003, 2015); (ii) Home country travel and education travel: 80% airfare (2006); (iii) Rental subsidy: fixed cost sharing at 60% ADB and 40% staff (2006);
(iv) Post-Retirement Group Medical Insurance Plan: decrease in reimbursement rate and elimination of subsidy for stop loss benefits (2006);
(v) Staff Retirement Plan: new plan provisions (2006 and 2009); (vi) Rental subsidy: fixed cost sharing at 65% ADB and 35% staff (2008); and (vii) Rental subsidy: implementation of rental allowance scheme (2012). For national staff and administrative staff: (i) Dependency allowance for headquarters NSAS: 3-year buyout for parents and parents-in-law (2011); (ii) Dependency allowance for headquarters NSAS: eliminated for staff hired from 1 January 2012 (2012); (iii) Salary payment mode for headquarters NSAS: annualized salary paid over 12 months (2012); and (iv) Overtime: uniform overtime rate for all AS to 1.5 for weekdays and 1.7 for weekends and holidays (2012).
Source: Asian Development Bank.
2007 2008 2009 2010 2011 2012 2013 2014 20152016MY
Total 61.1 62.3 61.6 61.8 62.3 63.3 64.4 62.4 63.1 62.4
IS Salaries 28.0 27.3 27.6 27.8 27.0 26.2 26.0 28.2 28.2 27.2
IS Benefits 19.9 20.9 20.2 20.1 20.7 21.9 23.1 19.7 20.4 19.6
NSAS Salaries 9.9 10.1 10.1 10.5 10.8 10.9 10.4 11.1 11.1 11.7
NSAS Benefits 3.3 4.0 3.7 3.4 3.8 4.3 4.9 3.4 3.4 3.9
-
10.0
20.0
30.0
40.0
50.0
60.0
70.0
80.0
90.0
100.0
Pe
rce
nta
ge
of
IAE
Appendix 19 76
ADB ACTIONS TO IMPROVE INSTITUTIONAL GENDER EQUALITY
[The appendix has been removed in accordance with para. 97 (i and viii) of ADB‘s Public Communications Policy (2011).]
ASIAN DEVELOPMENT BANK6 ADB Avenue, Mandaluyong City1550 Metro Manila, Philippineswww.adb.org
About the Asian Development Bank
ADB’s vision is an Asia and Paciic region free of poverty. Its mission is to help its developing member countries reduce poverty and improve the quality of life of their people. Despite the region’s many successes, it remains home to a large share of the world’s poor. ADB is committed to reducing poverty through inclusive economic growth, environmentally sustainable growth, and regional integration.
Based in Manila, ADB is owned by 67 members, including 48 from the region. Its main instruments for helping its developing member countries are policy dialogue, loans, equity investments, guarantees, grants, and technical assistance.