buildability and mechanical performance of …
TRANSCRIPT

BUILDABILITY AND MECHANICAL PERFORMANCE OF
ARCHITECTURED CEMENT-BASED MATERIALS FABRICATED
USING A DIRECT-INK-WRITING PROCESS
by
Mohamadreza Moini
A Dissertation
Submitted to the Faculty of Purdue University
In Partial Fulfillment of the Requirements for the degree of
Doctor of Philosophy
Lyles School of Civil Engineering
West Lafayette, Indiana
August 2020

2
THE PURDUE UNIVERSITY GRADUATE SCHOOL
STATEMENT OF COMMITTEE APPROVAL
Dr. Jan Olek, Co-Chair
Lyles School of Civil Engineering
Dr. Pablo D. Zavattieri, Co-Chair
Lyles School of Civil Engineering
Dr. Jeffrey P. Youngblood, Co-Chair
School of Materials Engineering
Dr. Joseph J. Biernacki
Department of Chemical Engineering
Dr. Scott Jones
National Institute of Standard and Technology
Approved by:
Dr. Dulcy M. Abraham

3
To my mother,
who first taught me how to convey my message to people,
and for her always open, liberating, and nourishing conversations about life,
that conferred upon me,
the wisdom, to think with an open mind.
And to my father,
for his steadiness, persistence, and perseverance,
that bestowed upon me,
pursuing life with determination, patience, and courage.

4
ACKNOWLEDGMENTS
First and foremost, I would like to thank my advisors, Prof. Jan Olek, Prof. Pablo Zavattieri,
and Prof. Jeffrey Youngblood, for their support toward me throughout my Ph.D. studies at Purdue
University. Their consistent and thorough insight and guidance over the past few years have
strongly enriched my academic experience, my scholarly vision, and this research. I also would
like to thank Professor Biernacki and Dr. Jones for their kind encouragements in the past years and
for the fruitful discussions they have had with me during this research. I gratefully acknowledge
the financial support of the National Science Foundation (NSF), Purdue College of Engineering,
and Lyles School of Civil Engineering for funding and supporting my research.
I would also like to thank my friends and colleagues at Purdue University for their company
and intellectual conversations, and the students who have assisted me in the laboratory for over
three years.
Finally, my deepest gratitude goes to my parents, my brothers, and my sisters, for their
unconditional love and support that has helped me navigate life with strength, especially during
my Ph.D. studies.
5
TABLE OF CONTENTS
LIST OF TABLES................................................................................................................................ 9
LIST OF FIGURES ............................................................................................................................ 10
ABSTRACT ........................................................................................................................................ 14
INTRODUCTION....................................................................................................................... 15
1.1 Background and Motivation .................................................................................................. 15
1.2 Goal and Objectives ............................................................................................................... 16
1.3 Hypotheses.............................................................................................................................. 18
1.4 References............................................................................................................................... 19
RHEOLOGICAL PROPERTIES-BUILDABILITY RELATIONSHIP IN ADDITIVELY
MANUFACTURED CEMENT-BASED ELEMENTS ................................................................... 22
2.1 Introduction ............................................................................................................................ 23
2.2 Materials and methods ........................................................................................................... 25
2.2.1 Materials composition .................................................................................................... 25
2.2.2 Rheological characterization .......................................................................................... 26
2.2.3 Assessment of buildability ............................................................................................. 26
2.2.4 Assessment of downward deformation via isosceles triangle...................................... 27
2.3 Results and Discussion .......................................................................................................... 28
2.3.1 Buildability ...................................................................................................................... 28
2.3.2 Prediction of Buildability ............................................................................................... 30
2.3.3 Buildability-Rheological Properties Relationship ........................................................ 31
2.3.4 Buildability, Elastic Modulus, and Prediction of Buildability ..................................... 35
2.3.5 Isosceles triangle deformation test results..................................................................... 38
2.4 Conclusion .............................................................................................................................. 40
2.5 Appendix ................................................................................................................................. 41
2.6 Acknowledgement.................................................................................................................. 43
2.7 References............................................................................................................................... 44
ADDITIVE MANUFACTURING AND CHARACTERIZATION OF ARCHITECTURED
CEMENT-BASED MATERIALS VIA X-RAY MICRO-COMPUTED TOMOGRAPHY ........ 49
3.1 Introduction ............................................................................................................................ 50

6
3.2 Methods .................................................................................................................................. 51
3.2.1 3D-Printing Setup ........................................................................................................... 51
3.3 Ink Design, Mixing Procedure, and Curing .......................................................................... 52
3.3.1 Slicing and Design .......................................................................................................... 54
3.3.2 Micro-CT and Scanning Specimens .............................................................................. 55
3.4 Results and Discussion .......................................................................................................... 56
3.4.1 3D-Printed Lamellar Architecture Micro-CT (0.4X and 4X scans) ............................ 56
3.4.2 Cast Specimen in 0.4X micro-CT (0.4X scan) ............................................................. 62
3.5 Summary ................................................................................................................................. 65
3.6 Acknowledgements ................................................................................................................ 65
3.7 References............................................................................................................................... 65
QUANTITATIVE INVESTIGATION OF PROCESSING-MICROSTRUCTURE
RELATIONSHIP IN 3D-PRINTED LAMELLAR CEMENT PASTE ELEMENTS VIA MICRO-
COMPUTED TOMOGRAPHY ........................................................................................................ 68
4.1 Introduction ............................................................................................................................ 69
4.2 Materials and Methods ........................................................................................................... 70
4.2.1 3D-Printing, Slicing, and Design ................................................................................... 70
4.2.2 Ink Design, Mixing Procedure, and Curing .................................................................. 71
4.2.3 Micro-Computed Tomography (Micro-CT) of the Elements ...................................... 72
4.2.4 Image Analysis................................................................................................................ 72
4.3 Results ..................................................................................................................................... 74
4.3.1 Micro-CT Characterization of the Entire Lamellar and Cast Elements (0.4X Scan) . 74
4.3.2 Analysis of the Categories of Pores in 3D-Printed Lamellar Element (0.4X Scan) ... 78
4.3.3 Micro-CT Characterization of a Region of Interest (ROI) in 3D-Printed Lamellar
Element (4X Scan) ...................................................................................................................... 81
4.4 Summary and Conclusion ...................................................................................................... 86
4.5 Acknowledgments .................................................................................................................. 88
4.6 References............................................................................................................................... 88
ADDITIVE MANUFACTURING AND PERFORMANCE OF ARCHITECTURED
CEMENT-BASED MATERIALS..................................................................................................... 90
5.1 Manuscript .............................................................................................................................. 91

7
5.2 Experimental Section ........................................................................................................... 107
5.3 Appendix ............................................................................................................................... 110
5.4 Acknowledgments ................................................................................................................ 110
5.5 Supporting Information: Additive Manufacturing and Performance of Architectured
Cement-based Materials ................................................................................................................ 111
5.6 References............................................................................................................................. 125
INFLUENCE OF INTERNAL ARCHITECTURES ON MECHANICAL RESPONSE AND
FRACTURE BEHAVIOR OF 3D-PRINTED CEMENT-BASED ELEMENT UNDER
COMPRESSIVE LOAD .................................................................................................................. 129
6.1 Introduction .......................................................................................................................... 130
6.2 Methods ................................................................................................................................ 131
6.2.1 3D-Printing, Slicing, and Design ................................................................................. 131
6.2.2 Ink Design, Mixing Procedure, and Curing ................................................................ 132
6.2.3 Sample Preparation and Mechanical Testing .............................................................. 133
6.2.4 Micro-Computed Tomography (Micro-CT) of Fractured Elements ......................... 133
6.3 Results and Discussion ........................................................................................................ 134
6.3.1 Mechanical Properties of Cast and Architectured Elements ...................................... 134
6.3.2 Stress-Strain Behavior .................................................................................................. 135
6.3.3 Specific Compressive Strength (Sp. C.S.) .................................................................. 137
6.3.4 Specific Work-of-Failure (Sp. WOF) .......................................................................... 137
6.3.5 Discussion of the Overall Mechanical Responses ...................................................... 138
6.3.6 Fracture Behaviors ........................................................................................................ 138
6.3.7 Cast Element (Tested in XY Plane) ............................................................................ 142
6.3.8 Lamellar Element (Tested in XY Plane) ..................................................................... 142
6.3.9 Bouligand Element (Tested in XY Plane) ................................................................... 143
6.3.10 Discussion on Fracture Behaviors ............................................................................. 143
6.3.11 Discussion on Fracture Behavior in Relation to Mechanical Properties ................ 144
6.4 Conclusion ............................................................................................................................ 145
6.5 Acknowledgments ................................................................................................................ 146
6.6 Appendix ............................................................................................................................... 147
6.7 References............................................................................................................................. 151

8
CONCLUSIONS AND RECOMMENDATIONS ................................................................. 156

9
LIST OF TABLES
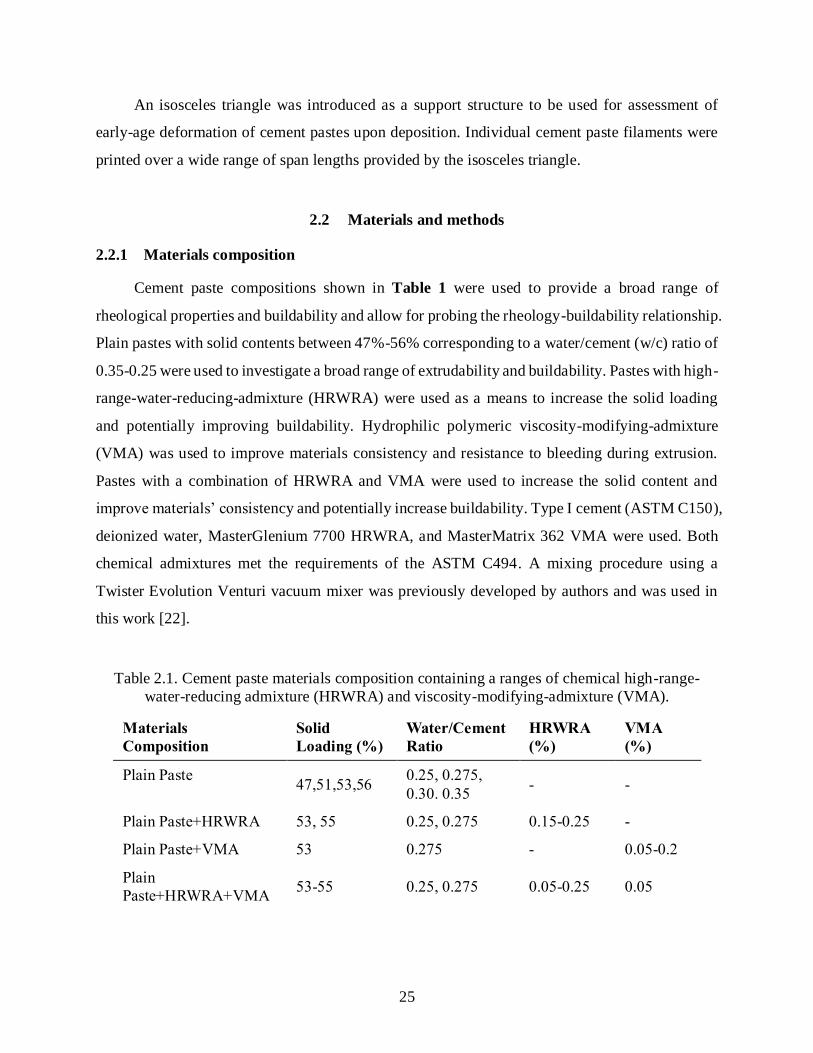
Table 2.1. Cement paste materials composition containing a ranges of chemical high-range-water-
reducing admixture (HRWRA) and viscosity-modifying-admixture (VMA). ............................... 25
Table 4.1. Comparison of the pore volumes of 3D-printed (lamellar) element and cast element
based on the frequency plot presented in Figure 4.3f, collected during a 0.4X magnification. .... 78
Table 4.2. Analysis of the pore types and their corresponding range of volumes in 3D-printed
(lamellar) element and cast element based on the frequency plot presented in Figure 4.3f, collected
during 4X magnification .................................................................................................................... 80
Table 4.3. Comparison of the range of volumes of three microstructural distinct phases based on
the frequency plot presented in Figure 4.5g. ..................................................................................... 84
Table 6.1. Rendition of the cast, 3D-printed lamellar, and 3D-printed Bouligand elements and their
respective plane in which they were tested (shown in dashed lines) in uniaxial compression (dash
lines represent testing plane) ............................................................................................................ 134
10
LIST OF FIGURES
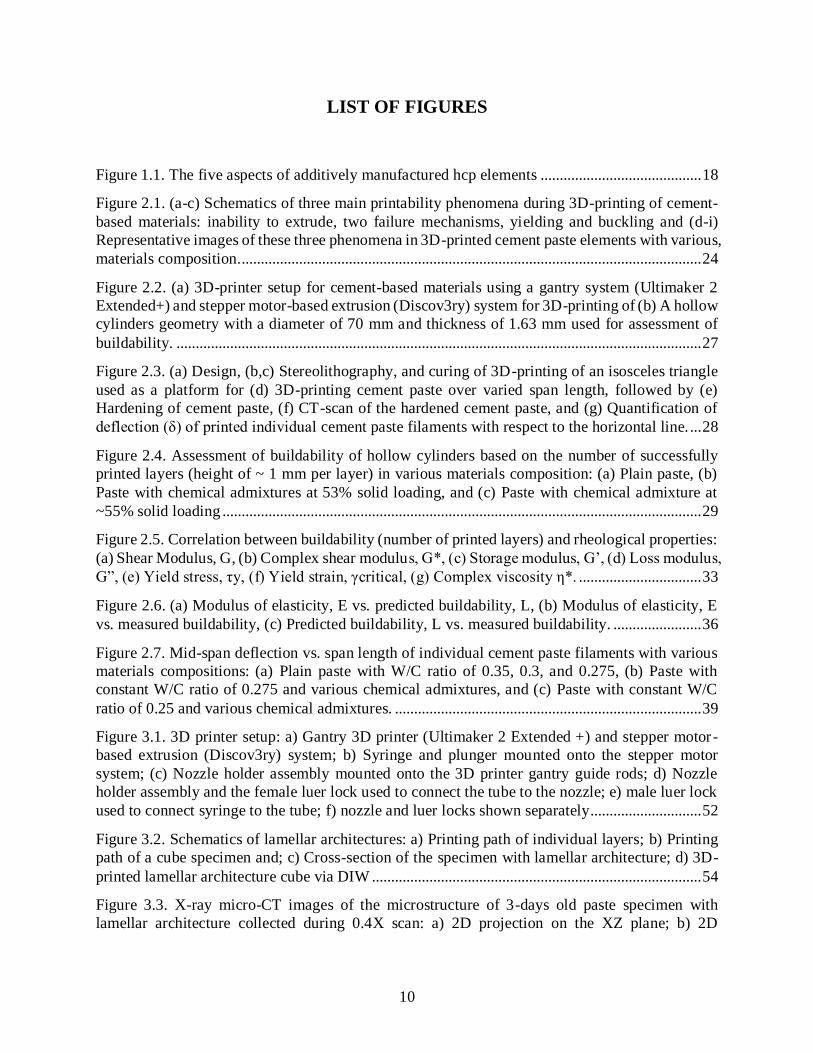
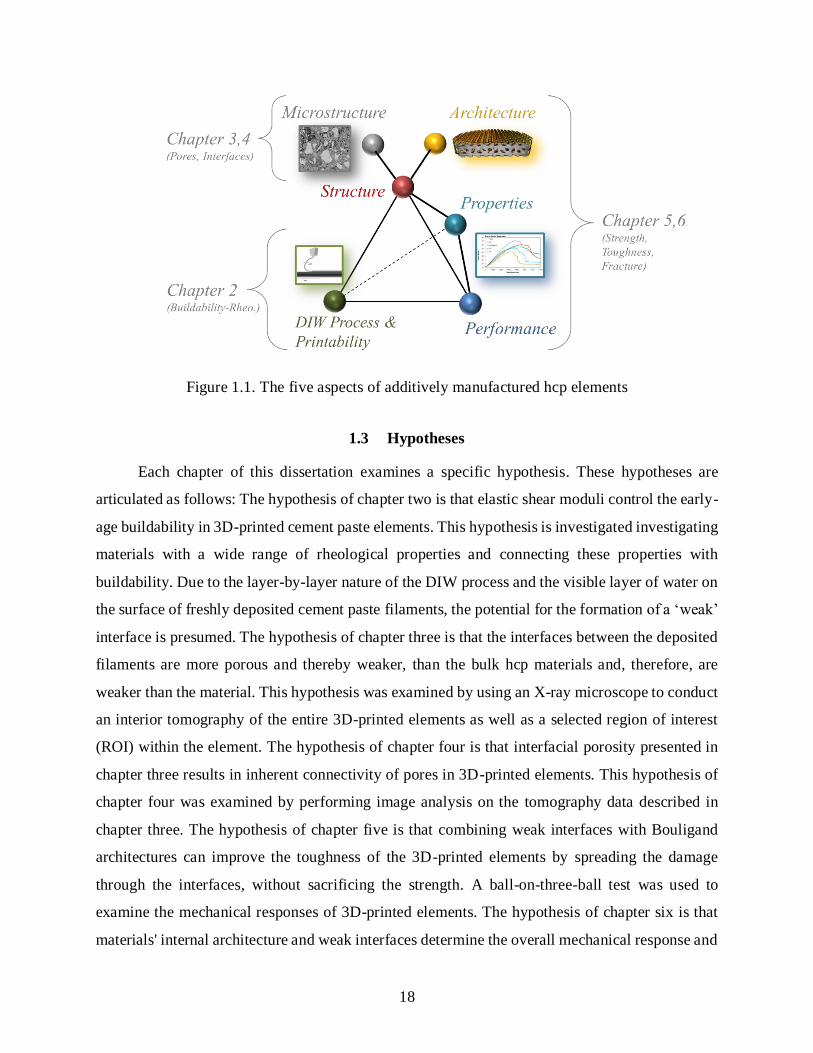
Figure 1.1. The five aspects of additively manufactured hcp elements .......................................... 18
Figure 2.1. (a-c) Schematics of three main printability phenomena during 3D-printing of cement-
based materials: inability to extrude, two failure mechanisms, yielding and buckling and (d-i)
Representative images of these three phenomena in 3D-printed cement paste elements with various,
materials composition......................................................................................................................... 24
Figure 2.2. (a) 3D-printer setup for cement-based materials using a gantry system (Ultimaker 2
Extended+) and stepper motor-based extrusion (Discov3ry) system for 3D-printing of (b) A hollow
cylinders geometry with a diameter of 70 mm and thickness of 1.63 mm used for assessment of
buildability. ......................................................................................................................................... 27
Figure 2.3. (a) Design, (b,c) Stereolithography, and curing of 3D-printing of an isosceles triangle
used as a platform for (d) 3D-printing cement paste over varied span length, followed by (e)
Hardening of cement paste, (f) CT-scan of the hardened cement paste, and (g) Quantification of
deflection (δ) of printed individual cement paste filaments with respect to the horizontal line. ... 28
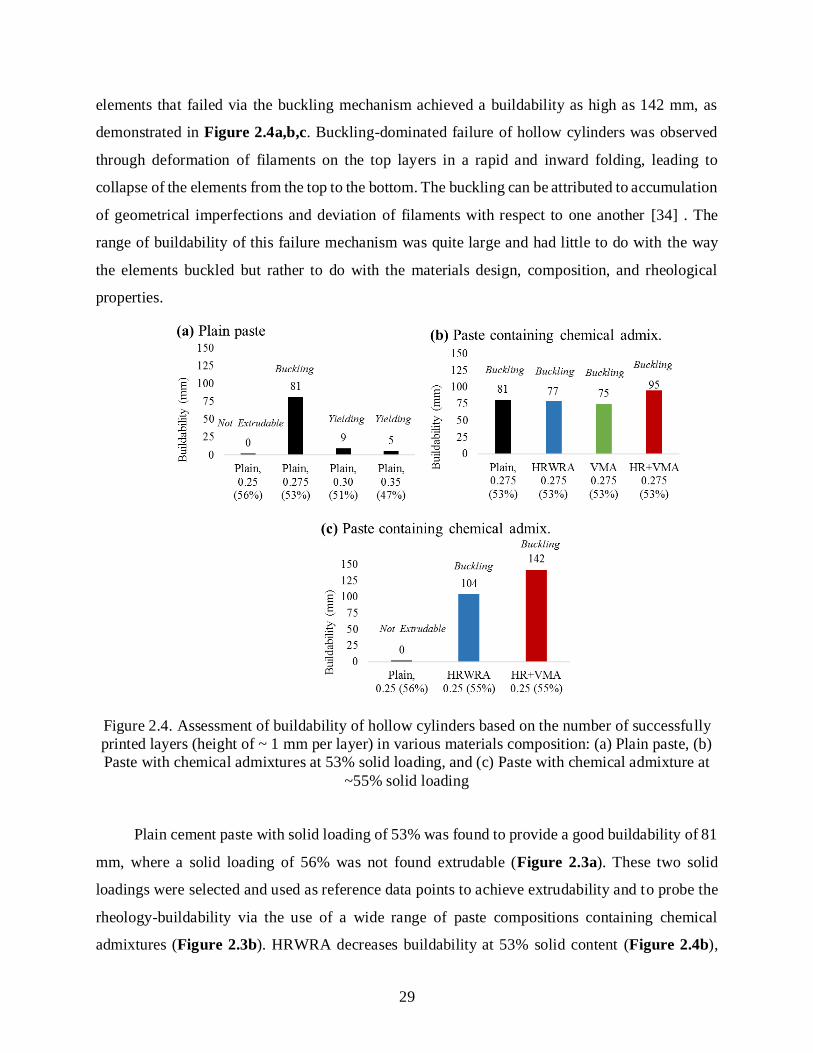
Figure 2.4. Assessment of buildability of hollow cylinders based on the number of successfully
printed layers (height of ~ 1 mm per layer) in various materials composition: (a) Plain paste, (b)
Paste with chemical admixtures at 53% solid loading, and (c) Paste with chemical admixture at
~55% solid loading ............................................................................................................................. 29
Figure 2.5. Correlation between buildability (number of printed layers) and rheological properties:
(a) Shear Modulus, G, (b) Complex shear modulus, G*, (c) Storage modulus, G’, (d) Loss modulus,
G”, (e) Yield stress, τy, (f) Yield strain, γcritical, (g) Complex viscosity η*. ................................ 33
Figure 2.6. (a) Modulus of elasticity, E vs. predicted buildability, L, (b) Modulus of elasticity, E
vs. measured buildability, (c) Predicted buildability, L vs. measured buildability. ....................... 36
Figure 2.7. Mid-span deflection vs. span length of individual cement paste filaments with various
materials compositions: (a) Plain paste with W/C ratio of 0.35, 0.3, and 0.275, (b) Paste with
constant W/C ratio of 0.275 and various chemical admixtures, and (c) Paste with constant W/C
ratio of 0.25 and various chemical admixtures. ................................................................................ 39
Figure 3.1. 3D printer setup: a) Gantry 3D printer (Ultimaker 2 Extended +) and stepper motor-
based extrusion (Discov3ry) system; b) Syringe and plunger mounted onto the stepper motor
system; (c) Nozzle holder assembly mounted onto the 3D printer gantry guide rods; d) Nozzle
holder assembly and the female luer lock used to connect the tube to the nozzle; e) male luer lock
used to connect syringe to the tube; f) nozzle and luer locks shown separately............................. 52
Figure 3.2. Schematics of lamellar architectures: a) Printing path of individual layers; b) Printing
path of a cube specimen and; c) Cross-section of the specimen with lamellar architecture; d) 3D-
printed lamellar architecture cube via DIW ...................................................................................... 54
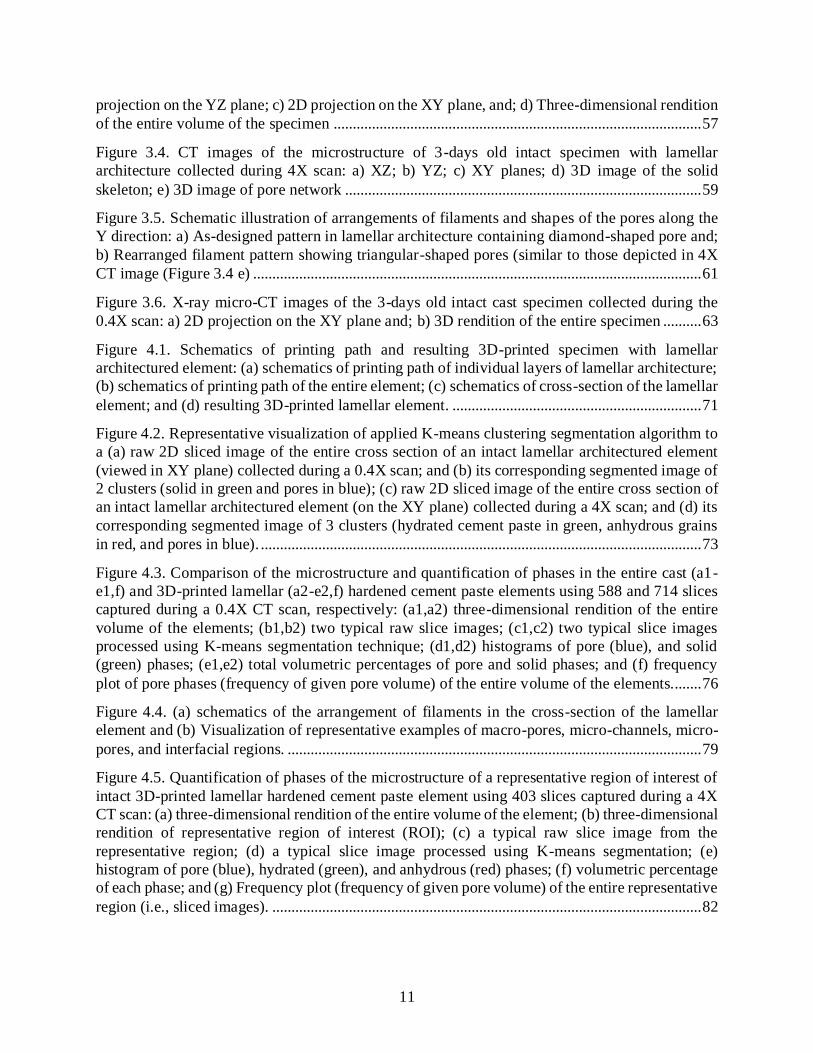
Figure 3.3. X-ray micro-CT images of the microstructure of 3-days old paste specimen with
lamellar architecture collected during 0.4X scan: a) 2D projection on the XZ plane; b) 2D
11
projection on the YZ plane; c) 2D projection on the XY plane, and; d) Three-dimensional rendition
of the entire volume of the specimen ................................................................................................ 57
Figure 3.4. CT images of the microstructure of 3-days old intact specimen with lamellar
architecture collected during 4X scan: a) XZ; b) YZ; c) XY planes; d) 3D image of the solid
skeleton; e) 3D image of pore network ............................................................................................. 59
Figure 3.5. Schematic illustration of arrangements of filaments and shapes of the pores along the
Y direction: a) As-designed pattern in lamellar architecture containing diamond-shaped pore and;
b) Rearranged filament pattern showing triangular-shaped pores (similar to those depicted in 4X
CT image (Figure 3.4 e) ..................................................................................................................... 61
Figure 3.6. X-ray micro-CT images of the 3-days old intact cast specimen collected during the
0.4X scan: a) 2D projection on the XY plane and; b) 3D rendition of the entire specimen .......... 63
Figure 4.1. Schematics of printing path and resulting 3D-printed specimen with lamellar
architectured element: (a) schematics of printing path of individual layers of lamellar architecture;
(b) schematics of printing path of the entire element; (c) schematics of cross-section of the lamellar
element; and (d) resulting 3D-printed lamellar element. ................................................................. 71
Figure 4.2. Representative visualization of applied K-means clustering segmentation algorithm to
a (a) raw 2D sliced image of the entire cross section of an intact lamellar architectured element
(viewed in XY plane) collected during a 0.4X scan; and (b) its corresponding segmented image of
2 clusters (solid in green and pores in blue); (c) raw 2D sliced image of the entire cross section of
an intact lamellar architectured element (on the XY plane) collected during a 4X scan; and (d) its
corresponding segmented image of 3 clusters (hydrated cement paste in green, anhydrous grains
in red, and pores in blue). ................................................................................................................... 73
Figure 4.3. Comparison of the microstructure and quantification of phases in the entire cast (a1-
e1,f) and 3D-printed lamellar (a2-e2,f) hardened cement paste elements using 588 and 714 slices
captured during a 0.4X CT scan, respectively: (a1,a2) three-dimensional rendition of the entire
volume of the elements; (b1,b2) two typical raw slice images; (c1,c2) two typical slice images
processed using K-means segmentation technique; (d1,d2) histograms of pore (blue), and solid
(green) phases; (e1,e2) total volumetric percentages of pore and solid phases; and (f) frequency
plot of pore phases (frequency of given pore volume) of the entire volume of the elements........ 76
Figure 4.4. (a) schematics of the arrangement of filaments in the cross-section of the lamellar
element and (b) Visualization of representative examples of macro-pores, micro-channels, micro-
pores, and interfacial regions. ............................................................................................................ 79
Figure 4.5. Quantification of phases of the microstructure of a representative region of interest of
intact 3D-printed lamellar hardened cement paste element using 403 slices captured during a 4X
CT scan: (a) three-dimensional rendition of the entire volume of the element; (b) three-dimensional
rendition of representative region of interest (ROI); (c) a typical raw slice image from the
representative region; (d) a typical slice image processed using K-means segmentation; (e)
histogram of pore (blue), hydrated (green), and anhydrous (red) phases; (f) volumetric percentage
of each phase; and (g) Frequency plot (frequency of given pore volume) of the entire representative
region (i.e., sliced images). ................................................................................................................ 82
12
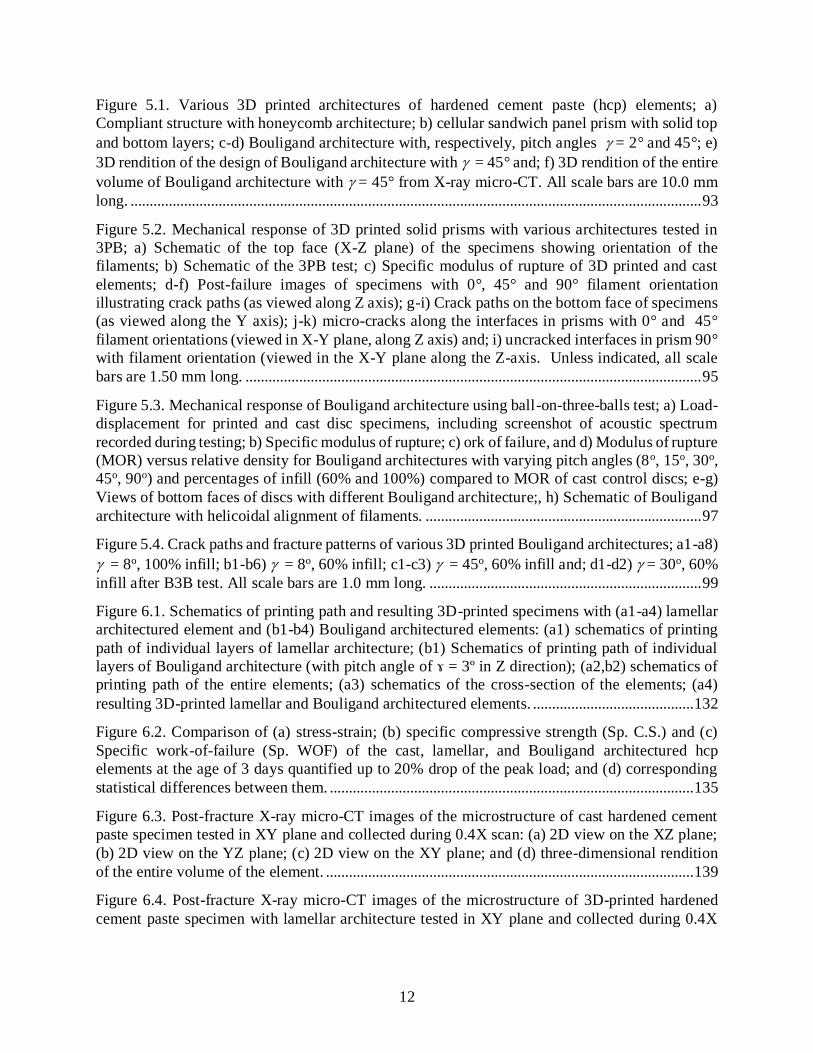
Figure 5.1. Various 3D printed architectures of hardened cement paste (hcp) elements; a)
Compliant structure with honeycomb architecture; b) cellular sandwich panel prism with solid top
and bottom layers; c-d) Bouligand architecture with, respectively, pitch angles = 2° and 45°; e)
3D rendition of the design of Bouligand architecture with = 45° and; f) 3D rendition of the entire
volume of Bouligand architecture with = 45° from X-ray micro-CT. All scale bars are 10.0 mm
long. ..................................................................................................................................................... 93
Figure 5.2. Mechanical response of 3D printed solid prisms with various architectures tested in
3PB; a) Schematic of the top face (X-Z plane) of the specimens showing orientation of the
filaments; b) Schematic of the 3PB test; c) Specific modulus of rupture of 3D printed and cast
elements; d-f) Post-failure images of specimens with 0°, 45° and 90° filament orientation
illustrating crack paths (as viewed along Z axis); g-i) Crack paths on the bottom face of specimens
(as viewed along the Y axis); j-k) micro-cracks along the interfaces in prisms with 0° and 45°
filament orientations (viewed in X-Y plane, along Z axis) and; i) uncracked interfaces in prism 90°
with filament orientation (viewed in the X-Y plane along the Z-axis. Unless indicated, all scale
bars are 1.50 mm long. ....................................................................................................................... 95
Figure 5.3. Mechanical response of Bouligand architecture using ball-on-three-balls test; a) Load-
displacement for printed and cast disc specimens, including screenshot of acoustic spectrum
recorded during testing; b) Specific modulus of rupture; c) ork of failure, and d) Modulus of rupture
(MOR) versus relative density for Bouligand architectures with varying pitch angles (8o, 15o, 30o,
45o, 90o) and percentages of infill (60% and 100%) compared to MOR of cast control discs; e-g)
Views of bottom faces of discs with different Bouligand architecture;, h) Schematic of Bouligand
architecture with helicoidal alignment of filaments. ........................................................................ 97
Figure 5.4. Crack paths and fracture patterns of various 3D printed Bouligand architectures; a1-a8)
= 8o, 100% infill; b1-b6) = 8o, 60% infill; c1-c3) = 45o, 60% infill and; d1-d2) = 30o, 60%
infill after B3B test. All scale bars are 1.0 mm long. ....................................................................... 99
Figure 6.1. Schematics of printing path and resulting 3D-printed specimens with (a1-a4) lamellar
architectured element and (b1-b4) Bouligand architectured elements: (a1) schematics of printing
path of individual layers of lamellar architecture; (b1) Schematics of printing path of individual
layers of Bouligand architecture (with pitch angle of ɤ = 3º in Z direction); (a2,b2) schematics of
printing path of the entire elements; (a3) schematics of the cross-section of the elements; (a4)
resulting 3D-printed lamellar and Bouligand architectured elements. .......................................... 132
Figure 6.2. Comparison of (a) stress-strain; (b) specific compressive strength (Sp. C.S.) and (c)
Specific work-of-failure (Sp. WOF) of the cast, lamellar, and Bouligand architectured hcp
elements at the age of 3 days quantified up to 20% drop of the peak load; and (d) corresponding
statistical differences between them. ............................................................................................... 135
Figure 6.3. Post-fracture X-ray micro-CT images of the microstructure of cast hardened cement
paste specimen tested in XY plane and collected during 0.4X scan: (a) 2D view on the XZ plane;
(b) 2D view on the YZ plane; (c) 2D view on the XY plane; and (d) three-dimensional rendition
of the entire volume of the element. ................................................................................................ 139
Figure 6.4. Post-fracture X-ray micro-CT images of the microstructure of 3D-printed hardened
cement paste specimen with lamellar architecture tested in XY plane and collected during 0.4X

13
scan: (a) 2D view on the XZ plane; (b) 2D view on the YZ plane; (c) 2D view on the XY plane;
and (d) three-dimensional rendition of the entire volume of the element. .................................... 140
Figure 6.5. Post-fracture X-ray micro-CT images of the microstructure of 3D-printed hardened
cement paste specimen with Bouligand architecture tested in XY plane and collected during 0.4X
scan: (a) 2D view on the XZ plane; (b) 2D view on the YZ plane; (c) 2D view on the XY plane;
(e) 2D view on the XY plane at three different heights of the specimen (f) three-dimensional
rendition of the entire volume of the specimen. ............................................................................. 141

14
ABSTRACT
Additive Manufacturing (AM) allows for the creation of elements with novel forms and
functions. Utilizing AM in development of components of civil infrastructure allows for achieving
more advanced, innovative, and unique performance characteristics. The research presented in this
dissertation is focused on development of a better understanding of the fabrication challenges and
opportunities in AM of cement-based materials. Specifically, challenges related to printability and
opportunities offered by 3D-printing technology, including ability to fabricate intricate structures
and generate unique and enhanced mechanical responses have been explored. Three aspects related
to 3D-printing of cement-based materials were investigated. These aspects include: fresh stability
of 3D-printed elements in relation to materials rheological properties, microstructural
characteristics of the interfaces induced during the 3D-printing process, and the mechanical
response of 3D-printed elements with bio-inspired design of the materials’ architecture. This
research aims to contribute to development of new pathways to obtain stability in freshly 3D-
printed elements by determining the rheological properties of material that control the ability to
fabricate elements in a layer-by-layer manner, followed by the understanding of the
microstructural features of the 3D-printed hardened cement paste elements including the interfaces
and the pore network. This research also introduces a new approach to enhance the mechanical
response of the 3D-printed elements by controlling the spatial arrangement of individual filaments
(i.e., materials’ architecture) and by harnessing the weak interfaces that are induced by the 3D-
printing process.

15
INTRODUCTION
There is a great need for researchers to apply scientific approaches to enhance the
understanding of engineering materials and to develop new knowledge toward creating more
advanced, durable, and ecologically viable built environments. The overall goal of the research
presented in this dissertation is to contribute to the development of more advanced components of
civil infrastructure using additive manufacturing technologies. To achieve this goal, this
dissertation is oriented toward overcoming the fabrication challenges of additive manufacturing of
cement-based materials, specifically printability, while exploring the opportunities offered by this
technology, such as the ability to fabricate components with controlled architecture, in order to
generate novel mechanical responses. This dissertation demonstrates a pathway to achieve novel
architectured cement-based elements using additive manufacturing on a small scale, that can
enable new approaches in the design and fabrication of civil infrastructure components on a large
scale.
1.1 Background and Motivation
There is a rising interest in the use of additive manufacturing (also known and
interchangeably used as 3D-printing) technologies in the design and development of innovative
cement-based materials with unique and novel performances and functionalities [1–8]. This
interest is mostly in response to the increasing demand for improvements in durability
sustainability, and mechanical performance of the materials and the construction productivity that
is emphasized in areas such as transportation and energy infrastructures [9–11]. However, additive
manufacturing of cement-based materials is a rather nascent field. Despite recent developments in
fabrication of materials using 3D-printing technologies, there are limited research efforts that focus
on the understanding of the mechanical behavior of additively manufactured cement-based
materials. Nevertheless, such an understanding of the mechanical responses of additively
manufactured cement-based materials is necessary (across multiple scales) as it is a precursor to
the development of an established design pathway in the future.
Several fabrication challenges and design opportunities continue to rise in the development
of cement-based materials using additive manufacturing technologies [12,13]. Direct-ink-writing
16
(DIW) is an extrusion-based additive manufacturing technique that uses a 3D-printer to fabricate
structural elements in a layer-by-layer deposition process [14–18]. This technique allows for
utilization and continuous deposition of a variety of colloid, slurry, and paste materials (typically
with ceramic and cementitious base) to create the desired 3D elements using a computer-controlled
3D printer. 3D-printing of cement-based elements from fresh cement pastes and mortars depends
upon the ability to maintain the shape of the elements upon deposition (i.e., extrusion in case of a
DIW process) especially at early-stages of cement hydration [19,20]. The low early-age load-
bearing capacity of cement-based materials triggers research questions about materials
composition and suitable rheological properties. Moreover, the brittle behavior of the hardened
cement-based materials, along with the presence of layer-wise interfaces from the additive
manufacturing process, represents another significant challenge with respect to the overall
mechanical behavior of 3D-printed elements.
On the other hand, opportunities offered by the 3D-printing process are quite unique and
promising. Cleverly designed and additively manufactured materials (such as ceramic, metallic,
polymeric, and composite) have been shown in the past to allow for control of the materials’
architecture (by a purposeful arrangement of geometrical patterns of the printed filaments).
Materials with such architectures have demonstrated enhanced mechanical performances, such as
energy absorption, strain recovery, impact resistance, and load-bearing capacity [21–26].
Desirable and unique performance characteristics have also been proven achievable using novel
forms and additive manufacturing of cement-based materials, although the number of studies in
this area is limited [27–30]. The research presented in in this dissertation focuses on addressing
the printability of fresh cement-based materials at early ages, defined as the combination of
extrudability and buildability, as well as exploiting the opportunities of applying novel
architectures into the design and fabrication of cement-based materials.
1.2 Goal and Objectives
The main goal of the research presented in this dissertation is to contribute to the
development of components of advanced concrete infrastructure by using additive manufacturing
technologies. To achieve this goal, five objectives are identified and are discussed in details in the
subsequent chapters:

17
(1) To understand the role of rheological properties of the printable material on the
buildability of elements fabricated via the Direct-Ink-Writing (DIW) process.
(2) To understand the microstructural characteristics of the 3D-printed hardened cement
paste (hcp) elements.
(3) To understand the pore characteristics of the microstructure of 3D-printed hcp elements.
(4) To understand the role of the internal architectures and the interfaces on the mechanical
behavior of 3D-printed hcp elements under biaxial flexure.
(5) To understand the role of the internal architectures and interfaces on the mechanical
behavior of 3D-printed hcp elements under compression.
Chapter two focuses on the challenges related to the control of materials rheological
properties that facilitates the buildability of 3D-printed elements. Buildability is specifically
defined as the height of successfully printed element before it undergoes failure by either yielding
or buckling. Chapter three focuses on the microstructural aspects of the 3D-printed elements, such
as pores and interfaces that are generated during the 3D-printing process and remain present in the
hardened microstructure. Chapter four explicitly focuses on such characteristics of the pore phase
as pore frequency distribution and the conectivity of porosity at the interfaces between filaments
of the 3D-printed hcp elements. Chapter five focuses on the opportunities related to harnassing the
interfaces present in 3D-printed hcp elements by using novel bio-inspired architectures (such as
Bouligand architecture) created by the DIW process. Chapter six focuses on the role the interfaces
and previously mentioned novel bio-inspired architectures (such as lamellar and Bouligand
architectures) in cotrolling the mechanical response and fracture behaviors of 3D-printed hcp
elements in compression. Chapter seven summarizes the overall findings and highlights the future
research questions that can be postulated based on the conclusions drawn from this research. In
short, as demonstrated in Figure 1.1, this dissertation is structured to discuss the printability in
DIW process in chapter two, the qualitative and quatitaitive characteristics of the hardened
microstructure in chapters three and four, and the mechanical properties and performances of the
additively manufactured architectured hcp elements in chapters five and six.
18
Figure 1.1. The five aspects of additively manufactured hcp elements
1.3 Hypotheses
Each chapter of this dissertation examines a specific hypothesis. These hypotheses are
articulated as follows: The hypothesis of chapter two is that elastic shear moduli control the early-
age buildability in 3D-printed cement paste elements. This hypothesis is investigated investigating
materials with a wide range of rheological properties and connecting these properties with
buildability. Due to the layer-by-layer nature of the DIW process and the visible layer of water on
the surface of freshly deposited cement paste filaments, the potential for the formation of a ‘weak’
interface is presumed. The hypothesis of chapter three is that the interfaces between the deposited
filaments are more porous and thereby weaker, than the bulk hcp materials and, therefore, are
weaker than the material. This hypothesis was examined by using an X-ray microscope to conduct
an interior tomography of the entire 3D-printed elements as well as a selected region of interest
(ROI) within the element. The hypothesis of chapter four is that interfacial porosity presented in
chapter three results in inherent connectivity of pores in 3D-printed elements. This hypothesis of
chapter four was examined by performing image analysis on the tomography data described in
chapter three. The hypothesis of chapter five is that combining weak interfaces with Bouligand
architectures can improve the toughness of the 3D-printed elements by spreading the damage
through the interfaces, without sacrificing the strength. A ball-on-three-ball test was used to
examine the mechanical responses of 3D-printed elements. The hypothesis of chapter six is that
materials' internal architecture and weak interfaces determine the overall mechanical response and

19
fracture behaviors in compression. An additional hypothesis of chapter six is similar to that of
chapter five in that the weak interfaces and Bouligand architectures are expected to improve the
toughness of the 3D-printed elements in compression without sacrificing the strength by spreading
the damage at the pre-existing porous (and helical) interfaces. This hypothesis of chapter six was
examined by using an X-ray microscope to conduct interior tomography of the fractured 3D-
printed elements and by determining the response under compressive load.
1.4 References
[1] T. Wangler, R.J. Flatt, First RILEM International Conference on Concrete and Digital
Fabrication – Digital Concrete, 2018.
[2] R.A. Buswell, W.R.L. De Silva, S.Z. Jones, J. Dirrenberger, Cement and Concrete Research
3D printing using concrete extrusion: A roadmap for research, Cem. Concr. Res. 112 (2018)
37–49. doi:10.1016/j.cemconres.2018.05.006.
[3] G. De Schutter, K. Lesage, V. Mechtcherine, V. Naidu, G. Habert, I. Agusti-juan, Vision of
3D printing with concrete — Technical, economic and environmental potentials, Cem.
Concr. Res. 112 (2018) 25–36. doi:10.1016/j.cemconres.2018.06.001.
[4] D. Lowke, E. Dini, A. Perrot, D. Weger, C. Gehlen, B. Dillenburger, Particle-bed 3D
printing in concrete construction – Possibilities and challenges, Cem. Concr. Res. 112 (2018)
50–65. doi:10.1016/j.cemconres.2018.05.018.
[5] B.N. Sanjayan, Jay G., Ali Nazari, ed., 3D Concrete Printing Technology: Construction and
Building Applications, Butterworth-Heinemann, 2019.
[6] N. Labonnote, A. Rønnquist, B. Manum, P. Rüther, Additive construction: State-of-the-art,
challenges and opportunities, Autom. Constr. 72 (2016) 347–366.
doi:10.1016/j.autcon.2016.08.026.
[7] S. Lim, T. Le, J. Webster, R. Buswell, S. Austin, A. Gibb, T. Thorpe, Fabricating
Construction Components Using Layered Manufacturing Technology, Glob. Innov. Constr.
Conf. 2009. (2009) 512–520. doi:10.1016/j.autcon.2011.06.010.
[8] H. Yin, M. Qu, H. Zhang, Y. Lim, 3D Printing and Buildings: A Technology Review and
Future Outlook, Technol. + Des. 2 (2018) 94–111. doi:10.1080/24751448.2018.1420968.
[9] A.W. Herrmann, “Asce 2013 report card for america’s infrastructure.,” IABSE Symp.
Report, Int. Assoc. Bridg. Struct. Eng. 99, (2013) 9–10.
20
[10] D.D. Camacho, P. Clayton, W.J. O’brien, C. Seepersad, M. Juenger, R. Ferron, S. Salamone,
Applications of additive manufacturing in the construction industry - A forward looking
review, Autom. Constr. 89 (2018) 110–119.
[11] J.J. Biernacki, J.W. Bullard, G. Sant, K. Brown, F.P. Glasser, S. Jones, T. Ley, R. Livingston,
L. Nicoleau, J. Olek, F. Sanchez, R. Shahsavari, P.E. Stutzman, K. Sobolev, T. Prater,
Cements in the 21 st century: Challenges, perspectives, and opportunities, J. Am. Ceram.
Soc. 100 (2017) 2746–2773. doi:10.1111/jace.14948.
[12] J.D. Silva, W.R. Leal de, S.Z. Jones, 3D printing using concrete extrusion: a roadmap for
research, Cem. Concr. Res. (2018) (this issue). doi:10.1016/j.cemconres.2018.05.006.
[13] T. Wangler, N. Roussel, F.P. Bos, T.A.M. Salet, R.J. Flatt, Cement and Concrete Research
Digital Concrete: A Review, 123 (2019). doi:10.1016/j.cemconres.2019.105780.
[14] J.A. Lewis, Direct-write assembly of ceramics from colloidal inks, Curr. Opin. Solid State
Mater. Sci. 6 (2002) 245–250. doi:10.1016/S1359-0286(02)00031-1.
[15] J.E. Smay, J. Cesarano, J.A. Lewis, Colloidal inks for directed assembly of 3-D periodic
structures, Langmuir. 18 (2002) 5429–5437. doi:10.1021/la0257135.
[16] J.A. Lewis, G.M. Gratson, Direct writing in three dimensions, Mater. Today. 7 (2004) 32–
39. doi:10.1016/S1369-7021(04)00344-X.
[17] J.A. Lewis, Direct ink writing of 3D functional materials, Adv. Funct. Mater. 16 (2006)
2193–2204. doi:10.1002/adfm.200600434.
[18] R.A. Barry, R.F. Shepherd, J.N. Hanson, R.G. Nuzzo, P. Wiltzius, J.A. Lewis, Direct-write
assembly of 3D hydrogel scaffolds for guided cell growth, Adv. Mater. 21 (2009) 2407–
2410. doi:10.1002/adma.200803702.
[19] L. Rueschhoff, W. Costakis, M. Michie, J. Youngblood, R. Trice, Additive Manufacturing
of Dense Ceramic Parts via Direct Ink Writing of Aqueous Alumina Suspensions, Int. J.
Appl. Ceram. Technol. 13 (2016) 821–830. doi:10.1111/ijac.12557.
[20] W.J. Costakis, L.M. Rueschhoff, A.I. Diaz-Cano, J.P. Youngblood, R.W. Trice, Additive
manufacturing of boron carbide via continuous filament direct ink writing of aqueous
ceramic suspensions, J. Eur. Ceram. Soc. 36 (2016) 3249–3256.
doi:10.1016/j.jeurceramsoc.2016.06.002.
[21] Z. Jia, L. Wang, 3D printing of biomimetic composites with improved fracture toughness,
Acta Mater. 173 (2019) 61–73. doi:10.1016/j.actamat.2019.04.052.
21
[22] D. Herzog, V. Seyda, E. Wycisk, C. Emmelmann, G.T. Gray, V. Livescu, P.A. Rigg, C.P.
Trujillo, C.M. Cady, S.R. Chen, J.S. Carpenter, T.J. Lienert, S.J. Fensin, T. Tancogne-
Dejean, A.B. Spierings, D. Mohr, H. Manzano, J.S. Dolado, A. Ayuela, F. Abdeljawad, D.S.
Bolintineanu, A. Cook, H. Brown-Shaklee, C. DiAntonio, D. Kammler, A. Roach, A.
Pineau, A.A. Benzerga, T. Pardoen, S. Xiao, H. Mei, D. Han, W. Yuan, L. Cheng, C. Zhang,
X. Hu, T. Sercombe, Q. Li, Z. Wu, P. Lu, Additive manufacturing of metals, Acta Mater.
117 (2016) 371–392. doi:10.1016/j.actamat.2016.07.019.
[23] M.R. Mansouri, H. Montazerian, S. Schmauder, J. Kadkhodapour, 3D-printed multimaterial
composites tailored for compliancy and strain recovery, Compos. Struct. 184 (2018) 11–17.
doi:10.1016/j.compstruct.2017.09.049.
[24] X. Zheng, W. Smith, J. Jackson, B. Moran, H. Cui, D. Chen, J. Ye, N. Fang, N. Rodriguez,
T. Weisgraber, C.M. Spadaccini, Multiscale metallic metamaterials, Nat. Mater. 15 (2016)
1100–1106. doi:10.1038/nmat4694.
[25] G.X. Gu, M. Takaffoli, M.J. Buehler, Hierarchically Enhanced Impact Resistance of
Bioinspired Composites, Adv. Mater. 29 (2017) 1–7. doi:10.1002/adma.201700060.
[26] M. DeVries, G. Subhash, A. Mcghee, P. Ifju, T. Jones, J. Zheng, V. Halls, Quasi-static and
Dynamic Response of 3D-printed Alumina, J. Eur. Ceram. Soc. 38 (2018) 3305–3316.
doi:10.1016/j.jeurceramsoc.2018.03.006.
[27] S.M. Sajadi, P.J. Boul, C. Thaemlitz, A.K. Meiyazhagan, A.B. Puthirath, C.S. Tiwary, M.M.
Rahman, P.M. Ajayan, Direct Ink Writing of Cement Structures Modified with Nanoscale
Additive, 1801380 (2019) 1–10. doi:10.1002/adem.201801380.
[28] Y. Xu, H. Zhang, E. Schlangen, M. Lukovi, B. Savija, Cementitious cellular composites
with auxetic behavior, 111 (2020). doi:10.1016/j.cemconcomp.2020.103624.
[29] M. Moini, J. Olek, J.P. Youngblood, B. Magee, P.D. Zavattieri, Additive Manufacturing
and Performance of Architectured Cement-Based Materials, Adv. Mater. 30 (2018).
doi:10.1002/adma.201802123.
[30] J.A. Rosewitz, H.A. Choshali, N. Rahbar, Bioinspired design of architected cement-polymer
composites, Cem. Concr. Compos. 96 (2019) 252–265.
doi:10.1016/j.cemconcomp.2018.12.010.

22
RHEOLOGICAL PROPERTIES-BUILDABILITY RELATIONSHIP IN
ADDITIVELY MANUFACTURED CEMENT-BASED ELEMENTS
This chapter contains experimental data collected by Mohamadreza Moini. Data
conceptualization was a collaborative effort with Jeffrey P. Youngblood, Jan Olek, and Pablo D.
Zavattieri. The manuscript was written by Mohamadreza Moini and edited by Jeffrey P.
Youngblood, Jan Olek, and Pablo D. Zavattieri.
Highlights
Shear Modulus G, is the most relevant rheological property to control buckling failure in
3D-printed cement paste materials.
An isosceles triangle was introduced for assessment of cement paste early-age deformation
over varied span lengths and for understanding the working mechanisms of chemical
admixtures on early-age deformations of 3D-printed elements.
Euler’s theory was used for prediction of buildability and overestimated the buildability by
93% to 194%, mainly due to assuming ideal geometry with no initial or printing
imperfection and linear elasticity.
Abstract
Ability to extrude and to achieve shape stability of layer-wised additively manufactured
cement-based elements depends upon the early-age rheological properties (shear moduli, yield
stress, viscosity) of the deposited materials. Upon successful extrusion, buildability challenges can
manifest in two common failure mechanisms: yielding at lower layers and buckling of the element.
However, it is yet unclear that among various rheological properties which one controls the early-
age materials’ deformation during printing processes and contributes to the resulting buildability
of the elements. This chapter focuses on how buildability is dependent upon rheological properties
as well as predicting the buildability using a buckling theoretical framework. Specifically, the
relationship between early-age rheological properties of various cement pastes and the buildability
of hollow cylinders dominated by buckling failure mechanism was investigated. It was found that
certain shear moduli of the fresh pastes (G, G*, and G’) obtained from oscillatory shear stress

23
sweep tests (within the first 30 minutes of hydration) correlates well with the buildability of hollow
elements more than other rheological properties (loss modulus G”, yield stress σ yield, yield strain
γ yield, and complex viscosity η*). Measured shear modulus (G) was used to calculate elastic
modulus (E) of the pastes using the assumed value of the 0.5 for Poisson’s ratio (𝜈) for fresh
cement paste. Euler’s buckling theory was used to predict buildability (height of the element) of
hollow cylinders. It was found that Euler's theory overestimates the buildability by 93% to 194%,
mainly due to assuming ideal geometry (and no initial or printing imperfection) and linear
elasticity. An isosceles triangle was introduced as a support structure and was used for assessment
of early-age deformation of individual cement paste filaments over varied span lengths. The results
provide insight into the role of the solid content and working mechanisms of chemical admixtures
on improving materials’ design and early-age deformations.
Keywords: Fresh cement paste, Failure mechanisms, Early-age deformation, Buildability
2.1 Introduction
Extrusion-based additive manufacturing (AM) of cement-based material, similar to other
ceramic materials, is dependent upon the ability to fabricate elements with suitable shape stability
[1–4]. Ability to extrude and to achieve shape stability in layer-wised additively manufactured
cement-based elements depends upon the early-age rheological properties (shear moduli, yield
stress, viscosity) of the deposited materials [5–8]. More specifically, three printability phenomena
as depicted in Figure 1 can occur that poses challenges to the fabrication process: (i) inability to
extrude the material from the nozzle (Figure 2.1a), and (ii) inability to successively build-up layer
upon layer due to deformation at the bottom layers (i.e., yielding, Figure 2.1b) or (iii) due to
buckling of the element (Figure 2.1c). In additive manufacturing of cement paste, inability to
extrude can translate to intermittent extrusion or no extrusion (Figure 2.1d,e). Once the extrusion
is achieved, buildability challenges can manifest itself in two common failure mechanisms:
yielding (Figure 2.1f,g) at lower layers and buckling of the element (Figure 2.1h,i) [9,10]. Once
yielding is overcome, buckling will be the ultimate candidate for the failure of the element.
The investigation of shape stability of 3D-printed elements [1,9–16] and early-age
deformations of cement-based materials [17–20] is a growing area of research. However, it is yet
unclear that among various rheological properties which one controls the early-age deformations

24
of cement paste during printing processes and contributes to the resulting buildability of the
elements [10]. Similarly, the fresh stability of cement-based materials at the lack of formwork
remains a challenge [21]. This chapter focuses on how buildability is dependent upon rheological
properties as well as predicting the buildability using a buckling framework. Specifically, the
relationship between early-age rheological properties of various cement pastes and the buildability
of hollow cylinders dominated by buckling failure mechanism was investigated. Measured shear
modulus (G) was used to calculate elastic modulus (E) of the pastes using the assumed value of
the 0.5 for Poisson’s ratio (𝜈) for fresh cement paste. Euler buckling theory was used to predict
buildability (height of the element) before it buckles.
Figure 2.1. (a-c) Schematics of three main printability phenomena during 3D-printing of cement-
based materials: inability to extrude, two failure mechanisms, yielding and buckling and (d-i)
Representative images of these three phenomena in 3D-printed cement paste elements with
various, materials composition.
25
An isosceles triangle was introduced as a support structure to be used for assessment of
early-age deformation of cement pastes upon deposition. Individual cement paste filaments were
printed over a wide range of span lengths provided by the isosceles triangle.
2.2 Materials and methods
2.2.1 Materials composition
Cement paste compositions shown in Table 1 were used to provide a broad range of
rheological properties and buildability and allow for probing the rheology-buildability relationship.
Plain pastes with solid contents between 47%-56% corresponding to a water/cement (w/c) ratio of
0.35-0.25 were used to investigate a broad range of extrudability and buildability. Pastes with high-
range-water-reducing-admixture (HRWRA) were used as a means to increase the solid loading
and potentially improving buildability. Hydrophilic polymeric viscosity-modifying-admixture
(VMA) was used to improve materials consistency and resistance to bleeding during extrusion.
Pastes with a combination of HRWRA and VMA were used to increase the solid content and
improve materials’ consistency and potentially increase buildability. Type I cement (ASTM C150),
deionized water, MasterGlenium 7700 HRWRA, and MasterMatrix 362 VMA were used. Both
chemical admixtures met the requirements of the ASTM C494. A mixing procedure using a
Twister Evolution Venturi vacuum mixer was previously developed by authors and was used in
this work [22].
Table 2.1. Cement paste materials composition containing a ranges of chemical high-range-
water-reducing admixture (HRWRA) and viscosity-modifying-admixture (VMA).
Materials Composition
Solid
Loading (%) Water/Cement
Ratio HRWRA
(%) VMA (%)
Plain Paste 47,51,53,56 0.25, 0.275,
0.30. 0.35 - -
Plain Paste+HRWRA 53, 55 0.25, 0.275 0.15-0.25 - Plain Paste+VMA 53 0.275 - 0.05-0.2
Plain
Paste+HRWRA+VMA 53-55 0.25, 0.275 0.05-0.25 0.05

26
2.2.2 Rheological characterization
A Malvern Bohlin Gemini HR rheometer, equipped with 40 mm serrated parallel plates were
used for oscillatory shear rheometry tests. Serrated surfaces were used to minimize the slippage
during the tests. A gap of 0.6 mm was used. A solvent trap was used to avoid water evaporation
during the test. Oscillatory shear rheometry protocols have been commonly used for studying
viscoelastic properties of cement paste [23–26]. The first step in performing oscillatory shear
rheometry tests is to find the linear viscoelastic region (LVR), where G’ and G” are independent
of applied frequency and strain [27]. A frequency sweep is commonly used to find LVR [23]. The
LVR was determined by conducting a frequency sweep from 0.1-100 Hz. The temperature was
kept constant at 25 ± 0.2 °C. Frequency of 1 Hz has been commonly used for fresh cement paste
oscillatory strain or stress sweep tests [23–28] and was found to be within LVR here as well. A
stress-controlled oscillatory shear stress sweep from 0.01 to 3000 Pa at a frequency of 1 Hz test
beginning within the linear viscoelastic region (LVR) and continued to non-linear LVR was used
to characterize viscoelastic properties including shear modulus (G), complex shear modulus (G*),
storage modulus (G’), and loss modulus (G”) and flow properties including yield stress (σ yield),
yield strain (γ yield), and complex viscosity (η*). The samples were pre-sheared before each test at
50 1/s for 30 s followed by a 30 s recovery. The LVR is bound by critical strain and critical
frequency [27–29]. G was characterized using a first-order fit to the linear portion of the stress-
strain using a zero intercept. G*, G’ and G” were characterized as constants within the LVR [29] .
σ yield and η* were taken at the strain in which crossover of G’ and G” (i.e., at γ yield) [30]. All
rheological properties were determined from the average value of at least two separate
measurements using a freshly mixed paste. Although cement-based materials’ rheological
properties are time-dependent [31,32], all rheological properties were characterized between 15-
20 minutes of mixing water and cement (during the dormant period of cement hydration) in which
the rheological properties are nearly constant, and their time-dependency is minimized.
2.2.3 Assessment of buildability
A 3D printer capable of printing cement paste via layer-by-layer extrusion with two separate
units (Figure 2.2a) was previously established by the authors and was used in this work [22].
Hollow cylinders with a diameter of 70 mm and a wall thickness of 1.63 mm were fabricated using

27
the paste compositions described in Table 2.1, as demonstrated in Figure 2.2b. A printing speed
of 750 mm per minute and a layer height of 1 mm was used for slicing to print the hollow cylinders.
The extrusion started 5 minutes after mixing water and cement. Buildable elements were
continuously printed until either yielding or buckling occurred. Buildability was defined as the
height of successfully printed element before the element yields or buckles. A material handling
procedure for charging the extrusion system with fresh cement pastes was previously developed
by authors and was used in this work [33]. Similarly, a commercially available slicer (Simplify3D)
was used to generate the G-code commands. A slicing procedure was previously established by
the authors and was used in this work [33].
Figure 2.2. (a) 3D-printer setup for cement-based materials using a gantry system (Ultimaker 2
Extended+) and stepper motor-based extrusion (Discov3ry) system for 3D-printing of (b) A
hollow cylinders geometry with a diameter of 70 mm and thickness of 1.63 mm used for
assessment of buildability.
2.2.4 Assessment of downward deformation via isosceles triangle
An isosceles triangle (Figure 2.3a) was designed and used as a support structure for the
assessment of the downward deformation of cement paste filaments [8]. A photopolymer resin
material and the Formlabs Form 3 Stereolithography (SLA) 3D-printer (Figure 2.3b) was used to
fabricate the triangle. The triangle was then rinsed and cured in the post-curing station using UV
light at 60 °C for 30 minutes (Figure 2.3c). Individual cement paste filaments with selected
materials compositions described in Table 2.1 were 3D-printed over varied span lengths (Figure
2.3d). The hardening of 3D-printed cement paste over the isosceles triangle, the object was rapidly

28
scanned using a micro-CT, as demonstrated in the rending of Figure 2.3f. The downward
deformation of the individual cement paste filaments (δ) over each span was measured.
Figure 2.3. (a) Design, (b,c) Stereolithography, and curing of 3D-printing of an isosceles triangle
used as a platform for (d) 3D-printing cement paste over varied span length, followed by (e)
Hardening of cement paste, (f) CT-scan of the hardened cement paste, and (g) Quantification of
deflection (δ) of printed individual cement paste filaments with respect to the horizontal line.
2.3 Results and Discussion
2.3.1 Buildability
Three main phenomena occur during extrusion and 3D-printing. All pastes except for the
plain paste with a solid loading of 56% shown in Figure 2.4a were extrudable, mostly due to high
solid content and processing limitations such as insufficient extrusion pressure. Upon successful
extrusion, two failure mechanisms of yielding and buckling were observed in the hollow cylinder
element and caused extreme deformation and loss of shape stability. The elements that failed via
yielding mechanism deformed at the bottom layers and typically had a small buildability of less
than 10 mm, such as those with solid contents above below 51% (Figure 2.3a). The yielding is
most likely due to low solid content and insufficient build-up of the fresh microstructure that is
inadequate to resist the deformation and self-weight of the layers [10]. On the other hand, the
29
elements that failed via the buckling mechanism achieved a buildability as high as 142 mm, as
demonstrated in Figure 2.4a,b,c. Buckling-dominated failure of hollow cylinders was observed
through deformation of filaments on the top layers in a rapid and inward folding, leading to
collapse of the elements from the top to the bottom. The buckling can be attributed to accumulation
of geometrical imperfections and deviation of filaments with respect to one another [34] . The
range of buildability of this failure mechanism was quite large and had little to do with the way
the elements buckled but rather to do with the materials design, composition, and rheological
properties.
Figure 2.4. Assessment of buildability of hollow cylinders based on the number of successfully
printed layers (height of ~ 1 mm per layer) in various materials composition: (a) Plain paste, (b)
Paste with chemical admixtures at 53% solid loading, and (c) Paste with chemical admixture at
~55% solid loading
Plain cement paste with solid loading of 53% was found to provide a good buildability of 81
mm, where a solid loading of 56% was not found extrudable (Figure 2.3a). These two solid
loadings were selected and used as reference data points to achieve extrudability and to probe the
rheology-buildability via the use of a wide range of paste compositions containing chemical
admixtures (Figure 2.3b). HRWRA decreases buildability at 53% solid content (Figure 2.4b),
30
and it facilities to make a previously unextrudable plain paste, extrudable and highly buildable at
55% solid content (Figure 2.4c). Counter-intuitively, VMA was found to reduce buildability
(Figure 2.4b). Additionally, when VMA was used in conjunction with HRWRA, the buildability
was increased in both levels of 53% and 55% solid content (Figure 2.4b), indicating a different
working mechanism than when only VMA or HRWRA were used. The results allude to a
relationship between materials composition (and their corresponding rheological properties) and
buildability. Therefore, one can hypothesize that one or more rheological properties of the pastes
are correlated with the buildability of the hollow cylinders that fail via a buckling mechanism.
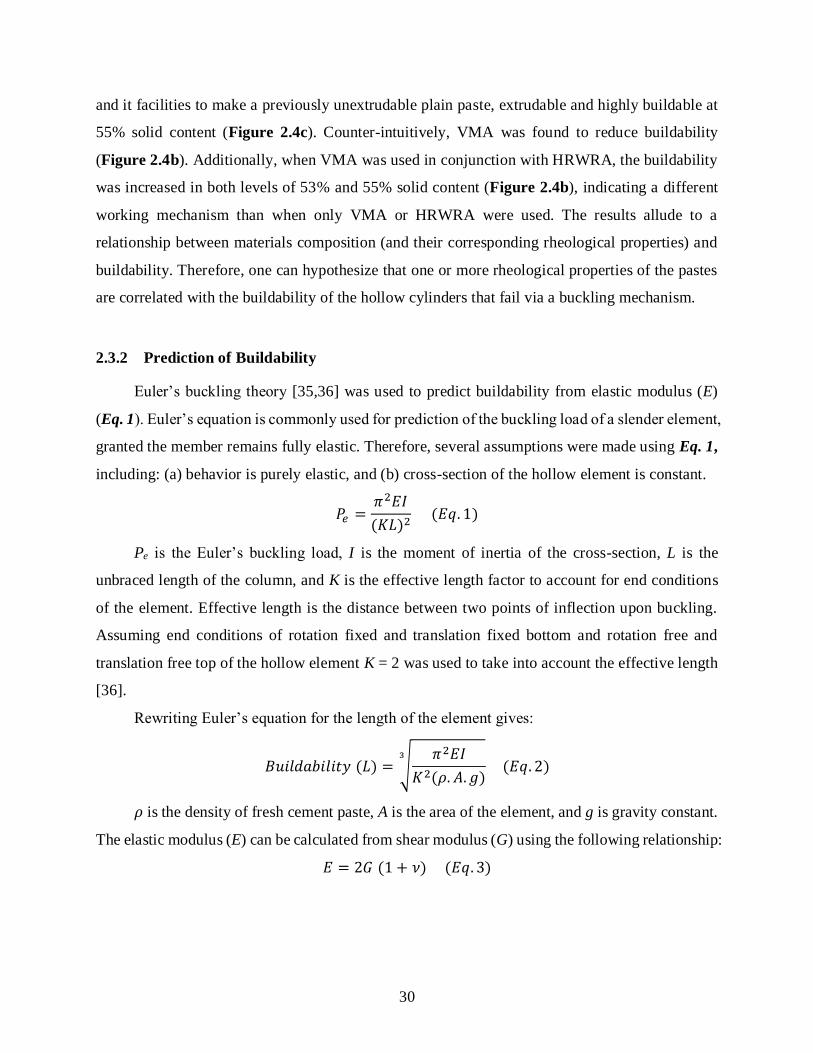
2.3.2 Prediction of Buildability
Euler’s buckling theory [35,36] was used to predict buildability from elastic modulus (E)
(Eq. 1). Euler’s equation is commonly used for prediction of the buckling load of a slender element,
granted the member remains fully elastic. Therefore, several assumptions were made using Eq. 1,
including: (a) behavior is purely elastic, and (b) cross-section of the hollow element is constant.
𝑃𝑒 =𝜋2𝐸𝐼
(𝐾𝐿)2 (𝐸𝑞. 1)
Pe is the Euler’s buckling load, I is the moment of inertia of the cross-section, L is the
unbraced length of the column, and K is the effective length factor to account for end conditions
of the element. Effective length is the distance between two points of inflection upon buckling.
Assuming end conditions of rotation fixed and translation fixed bottom and rotation free and
translation free top of the hollow element K = 2 was used to take into account the effective length
[36].
Rewriting Euler’s equation for the length of the element gives:
𝐵𝑢𝑖𝑙𝑑𝑎𝑏𝑖𝑙𝑖𝑡𝑦 (𝐿) = √𝜋2𝐸𝐼
𝐾2(𝜌. 𝐴. 𝑔)
3
(𝐸𝑞. 2)
𝜌 is the density of fresh cement paste, A is the area of the element, and g is gravity constant.
The elastic modulus (E) can be calculated from shear modulus (G) using the following relationship:
𝐸 = 2𝐺 (1 + 𝜈) (𝐸𝑞. 3)
31
𝜈 is the Poisson’s ratio of cement paste. Measured shear modulus (G) was used to calculate
elastic modulus (E) of the pastes using the assumed Poisson’s ratio (𝜈) value of the 0.5 for fresh
cement paste [37].
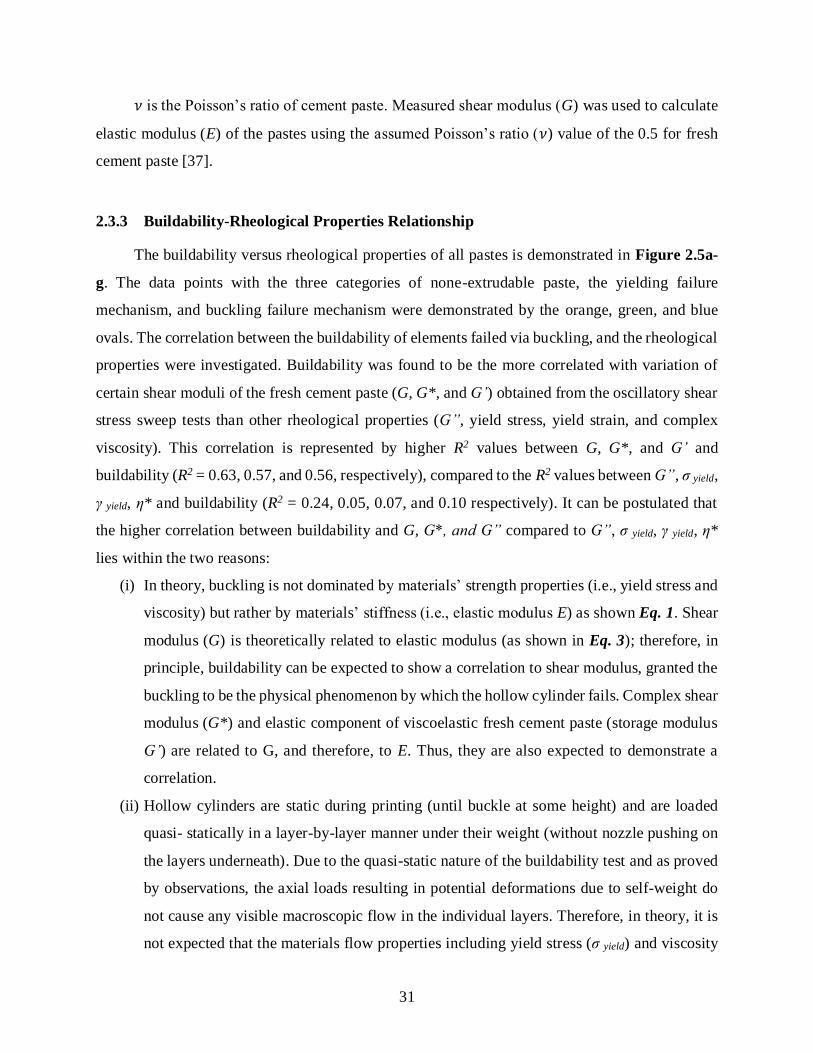
2.3.3 Buildability-Rheological Properties Relationship
The buildability versus rheological properties of all pastes is demonstrated in Figure 2.5a-
g. The data points with the three categories of none-extrudable paste, the yielding failure
mechanism, and buckling failure mechanism were demonstrated by the orange, green, and blue
ovals. The correlation between the buildability of elements failed via buckling, and the rheological
properties were investigated. Buildability was found to be the more correlated with variation of
certain shear moduli of the fresh cement paste (G, G*, and G’) obtained from the oscillatory shear
stress sweep tests than other rheological properties (G”, yield stress, yield strain, and complex
viscosity). This correlation is represented by higher R2 values between G, G*, and G’ and
buildability (R2 = 0.63, 0.57, and 0.56, respectively), compared to the R2 values between G”, σ yield,
γ yield, η* and buildability (R2 = 0.24, 0.05, 0.07, and 0.10 respectively). It can be postulated that
the higher correlation between buildability and G, G*, and G” compared to G”, σ yield, γ yield, η*
lies within the two reasons:
(i) In theory, buckling is not dominated by materials’ strength properties (i.e., yield stress and
viscosity) but rather by materials’ stiffness (i.e., elastic modulus E) as shown Eq. 1. Shear
modulus (G) is theoretically related to elastic modulus (as shown in Eq. 3); therefore, in
principle, buildability can be expected to show a correlation to shear modulus, granted the
buckling to be the physical phenomenon by which the hollow cylinder fails. Complex shear
modulus (G*) and elastic component of viscoelastic fresh cement paste (storage modulus
G’) are related to G, and therefore, to E. Thus, they are also expected to demonstrate a
correlation.
(ii) Hollow cylinders are static during printing (until buckle at some height) and are loaded
quasi- statically in a layer-by-layer manner under their weight (without nozzle pushing on
the layers underneath). Due to the quasi-static nature of the buildability test and as proved
by observations, the axial loads resulting in potential deformations due to self-weight do
not cause any visible macroscopic flow in the individual layers. Therefore, in theory, it is
not expected that the materials flow properties including yield stress (σ yield) and viscosity

32
(η*), the strain at which yield occurs (γ yield), or the viscous component of viscoelastic fresh
cement paste (loss modulus G”) to demonstrate any correlation with buildability.

33
Figure 2.5. Correlation between buildability (number of printed layers) and rheological
properties: (a) Shear Modulus, G, (b) Complex shear modulus, G*, (c) Storage modulus, G’, (d)
Loss modulus, G”, (e) Yield stress, τy, (f) Yield strain, γcritical, (g) Complex viscosity η*.

34
Figure 2.5 continued
Moreover, the buildability was more precisely correlated with the shear modulus G (R2 = 0.63),
compared to complex shear modulus G* (R2 = 0.57) and storage modulus G’ (R2 = 0.57). A
possible reason is the direct and physically correct relationship between G (slope of stress-strain)
and E as shown in Eq. 3, compared to the indirect relationship between G* and G’ and E (i.e.,
calculated based on materials stress stimulus and fitting a mathematical model for strain response).
In summary, the correlations reported in Figure 2.5a-g provides insight that some shear moduli
(specifically G, G*, and G’) are more important than others for controlling the buildability of the
thin hollow cylinder elements. In particular, the buildability correlated to shear modulus G. It also

35
infers that materials rheological properties such as yield stress are most likely essential at earlier
layers/stages of printing where yielding failure has the probability/chance of occurrence. Such
hypothesis have been evaluated by other researchers have resulted in similar understanding that
gravity-induced stresses surpass the materials yield stress at a given time, the element yields at
lower layers [38–41].
2.3.4 Buildability, Elastic Modulus, and Prediction of Buildability
From the discussion of measured shear moduli-buildability relationship (Figure 2.5) and the
theoretical relationship between E and buildability, one can argue that buildability can be predicted
using E that is calculated from measured shear moduli. The accuracy of such prediction then
becomes critical. Prediction of buildability from Euler’s theory was proceeded here using the
elastic moduli of all the pastes (E, E*, E’) calculated from the measured shear moduli (G, G*, G’)
using Eq. 3. The Euler’s buckling theory was rewritten for L per Eq. 2 for prediction of buildability.
The predicted buildability L was plotted versus E, E*, E’ for two different effective length factor
K (Figure 2.6.a). It was found that Euler's theory (with K = 2) overestimates the buildability by
104% to 210% using E, 101% to 206% using E*, and 93% to 194% using E’. One caveat is that K
depends on the end constraints as it influences the effective length, as discussed before. An element
with free translation and rotation movement at the top, similar to that of our hollow cylinder, has
an effective length of 2 (K = 2) compared to an element with fixed translation and rotation (K = 1).
In the case of our hollow cylinder, assuming a constrained top (K = 1) is inaccurate and led to even
a higher overestimation buildability compared to when free translation and rotation was used (K =
2) (Figure 2.6.a).
36
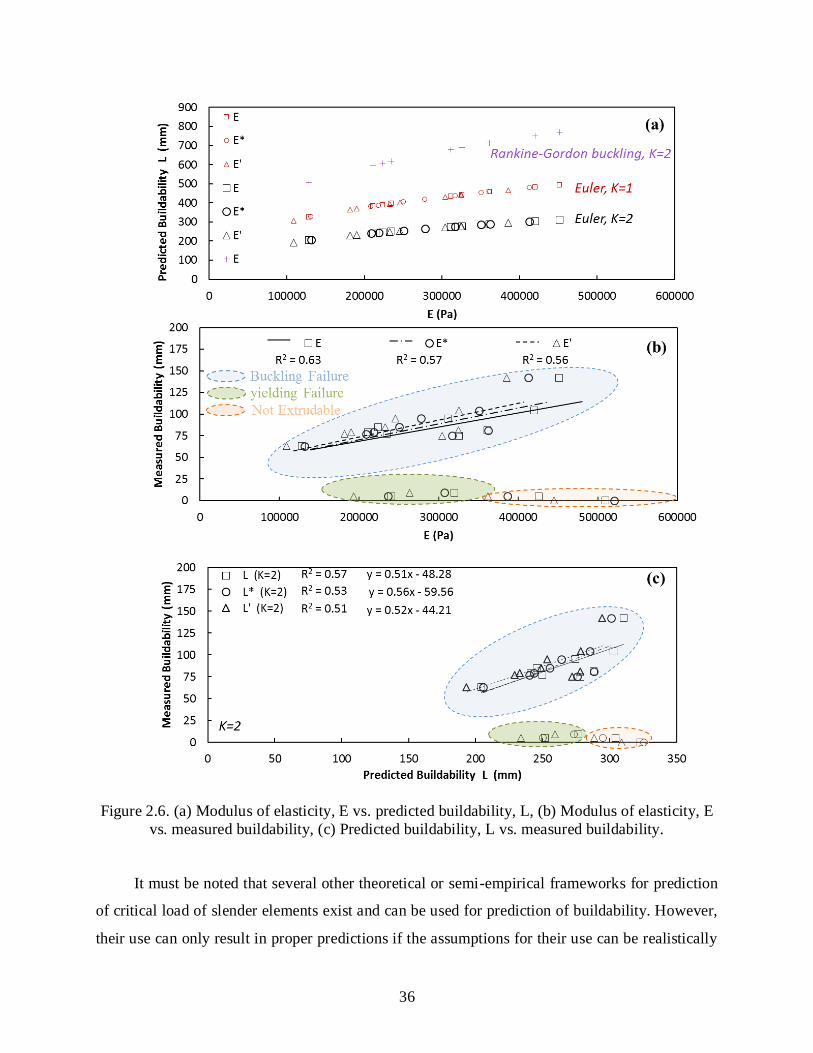
Figure 2.6. (a) Modulus of elasticity, E vs. predicted buildability, L, (b) Modulus of elasticity, E
vs. measured buildability, (c) Predicted buildability, L vs. measured buildability.
It must be noted that several other theoretical or semi-empirical frameworks for prediction
of critical load of slender elements exist and can be used for prediction of buildability. However,
their use can only result in proper predictions if the assumptions for their use can be realistically

37
applied to the problem of predicting the buildability of 3D-printed viscoelastic materials. Here,
Rankine-Gordon semi-empirical buckling equation [42] that extends the Euler’s equation to
consider crushing strength of the material, in addition to the elastic modulus and geometry as
follow:
𝑃𝑅 =𝜎𝑦𝑐𝐴
1 + 𝑎(𝐿0
𝑟⁄ )2 (𝐸𝑞. 4)
L0 is the effective length (L0 = KL = 2L), A is the cross-sectional area, r is the radius of
gyration, and a is the denominator constant:
𝑎 =𝜎𝑦𝑐
𝜋2𝐸 (𝐸𝑞. 5)
Yield strength σ yield was used as crushing strength σyc and E calculated from G was used in
rewriting Rankine-Gordon equation and solving a 3rd order equation for predicting buildability (L)
where self-weight becomes critical. The use of the Rankine-Gordon equation resulted in an
overestimation of buildability higher than either of the two Euler’s estimations, as demonstrated
in Figure 2.6.a.
As Figure 2.6.a demonstrated the predicted buildability and elastic moduli (E, E*, E’)
relationship, one can also look into the relationship between measured buildability and elastic
moduli (E, E*, E’). It is expected that buildability demonstrates a stronger correlation with E
compared to the other two elastic moduli (E* and E’). This relationship was plotted and examined
by comparing coefficients of determination. Similar trends between buildability and elastic moduli
to those observed between buildability and shear moduli (Figure 2.5a,b,c) were found. As
expected, buildability was more precisely correlated with the E (R2 = 0.63), compared to E* (R2 =
0.57) and E’ (R2 = 0.56) as demonstrated in Figure 2.6.b. The reason again has to do with the
direct relationship between E calculated from Eq. 3 and G (slope of stress-strain), compared to the
indirect relationship between E* and E’ with G.
More importantly, the relationship between the predicted buildability (L) at its best
estimation (using Euler, with K = 2) and the measured buildability for all of the pastes with
buckling failure mechanism was plotted in Figure 2.6c. The buildability (L, L*, L’) was predicted
using the elastic moduli (E, E*, E’) and were estimated close to one another. E was found to be a
more precise predictor of buildability compared to the other two moduli (E*, E’). None of the three
elastic moduli very accurate predictors of buildability. Overall, several reasons for the
overestimation of buildability using Euler’s theory can be conceived:

38
(i) Assumption of perfect straightness: Euler’s theory assumes an ideal geometry (i.e.,
perfectly vertical element) with no initial imperfection [34]. Elements are rarely
perfectly straight in reality. Layer-by-layer 3D-printing results in ample fabrication
imperfections in the orders of 100s of microns, such as misalignment of
filaments/layers with respect to one another (deviations enhanced by processing effects
such as vibration and inertia effects) another to that results in accumulation of
geometrical imperfections as the element is built up.
(ii) Assumption of perfect linear elasticity: It must also be noted that Euler’s theory was
applied, assuming the elements behave within their elastic region [43]. This assumption
needs further investigation and verification. Although no visible macroscopic ‘flow’
was observed in the printed layers, that does not assure us of a perfectly linear elastic
response before buckling. Early-age deformations upon materials deposition and rate
of building up the element can also reduce the elastic modulus of fresh paste and cause
the hollow cylinder to behave plastically. The isosceles triangle test was developed to
separately look into early-age deformation of individual cement paste filaments [3,8].
In addition, due to difficulties in obtaining close-form solutions for the buildability of
viscoelastic materials partly due to potential inelastic behavior, numerical methods can be
efficiently used to explore the influence of processing parameters (rate of building up, nozzle size)
and effects (vibration, inertia) on buildability.
2.3.5 Isosceles triangle deformation test results
The isosceles triangle test was developed to assess of deformation of individual filaments of
selected pastes over varied span lengths and obtain insight about the role of materials composition.
The mid-span deflection was used as a measure of deformation. The mid-span deflection
(maximum deflection) measured upon hardening form micro-CT was plotted versus the span
length (Figure 2.7). A second-order polynomial equation was fit to the experimental data for more
clear visualization. The range of deformations, as presented in Figure 2.7 are quite varied and
dependent upon materials composition (i.e., solid loading and chemical admixtures).

39
Figure 2.7. Mid-span deflection vs. span length of individual cement paste filaments with various
materials compositions: (a) Plain paste with W/C ratio of 0.35, 0.3, and 0.275, (b) Paste with
constant W/C ratio of 0.275 and various chemical admixtures, and (c) Paste with constant W/C
ratio of 0.25 and various chemical admixtures.
40
The effects of solid loading and chemical admixtures can be observed in Figure 2.7.a,b,c.,
the higher the solid content, the lower the mid-span deflection (Figure 2.7.a). For nearly constant
solid loading of 53%-54% as reference (Figure 2.7.b), the use of HWRA increases mid-span
deflection at spans longer than 12 mm, whereas the use of VMA decreases mid-span deformation.
The combined use of HRWRA and VMA also decreases the mid-span deflection compared to the
reference plain paste, rather slightly, compared to the paste with VMA, and rather drastically
compared to the paste with HRWRA (Figure 7.b). At a solid loading of 56%-57%, the data
demonstrate the same effects in the use of combined HRWRA and VMA, in the way that it highly
reduces mid-span deflection compared to the paste with HRWRA. The trend in which the
combined use of VMA and HRWRA reduce the early-age deformation over isosceles triangle test
is aligned with the buildability assessment and indicating a different working mechanism than
when only VMA or HRWRA were used. Several mechanisms for the role of HRWRA [44] and
polymeric VMA [45,46] are discussed by researchers. However, those mechanisms can be altered
at low solid contents such as pastes used in this study or by printing process. The reference and
the past with VMA in this solid content were not extrudable.
In summary, the isosceles triangle was used to examine the deformation of individual
filament (or their ability to resist deformation under self-weight) and the relationship between this
deformation and materials composition. The self-weight effects of the test can be used to
investigate the relationship between structural built-up of various materials composition and the
early-age deformations at the initial stages of hydration. The test can also be used to study the
working mechanisms of chemical admixture and provides a basis for precise fine-tuning of the
materials design as required. However, further research is needed to probe the deformation at the
filament scale over the varied span length and its correlation with the buildability at the element
scale. Similarly, treatment of the filaments as elastic beams is possible for the extraction of E and
prediction of buildability. However, such an approach requires further verification of elasticity and
alteration of the test (such as retaining a perfectly horizontal filament as the initial condition prior
to deformation under self-weight).
2.4 Conclusion
In this chapter, the correlation between a wide range of rheological properties of cement
pastes and the buildability of hollow elements fabricated with those inks and failed via buckling
41
was investigated. It was found that certain shear moduli of the fresh pastes (G, G*, and G’)
obtained from oscillatory shear stress sweep tests (within the first 30 minutes of hydration)
correlate well with the buildability of hollow elements more than other rheological properties (G”,
yield stress, yield strain, and complex viscosity). Moreover, the shear modulus (G) demonstrated
a higher correlation to buildability than the complex shear modulus (G*) and the storage modulus
(G’). Most importantly, the buildability-rheology investigation provides evidence that certain
shear moduli (G, G*, and G’) of fresh cement paste, specifically the shear modulus G, is the most
relevant rheological property if buckling is the dominant failure mechanism of the 3D-printed
element. Therefore, the shear modulus G, then can be used to tailor the materials design for
achieving shape stability. The rheology-buildability relationships also infer that materials
rheological properties such as yield stress are only important at earlier layers and stages of the
printing process where yielding failure has a probability of occurrence (depending on the
loading/printing rate). It must be noted that extrudability and buildability are also dependent upon
printing processes and parameters such as extrusion pressure, printing speed, nozzle size, which
all affect the ‘flow’ of the materials in the extrusion process.
Three properties obtained from oscillatory shear stress sweep can be used to calculated
corresponding elastic moduli (E, E*, E’) to predict buildability. It was found that using calculated
elastic moduli, Euler's theory can be used to predict buildability. However, Euler’s theory at best
overestimates the buildability by 92% to 184%, mainly due to assuming ideal geometry with no
initial or printing imperfection and linear elasticity. These two simplifications can result in the
overestimation in the prediction of buildability.
An isosceles triangle was introduced as a support structure and was used for assessment of
early-age deformation of individual cement paste filaments over varied span lengths. The results
provide insight into the role of the solid content and working mechanisms of chemical admixtures
and fine-tuning materials’ design and early-age deformations. Therefore, it can be used as a new
reference testing method for assessment materials resistance to deformations.
2.5 Appendix
Figure 2.S1 further describes the correlation between solid loading and all measured rheological
properties and demonstrates a threshold for extrudability and yielding. Figure 2.S2 describes the
correlation between solid loading and buildability. A similar threshold observed in Figure 2.S1 is

42
also evident here, mainly due to the correlation between shear moduli and buildability. These two
supplementary figures provide insight for the design of cement paste composition.
Figure 2.S1. Correlation between solid loading (%) and rheological properties: (a) Complex
shear modulus, G*, (b) Storage modulus G’, (c) Loss modulus, G”, (d) yield stress, τy, (e) yield
strain, γcritical, (f) complex viscosity η*.

43
Figure 2.S1. continued
2.6 Acknowledgement
The Type I cement used in this work was donated by Buzzi Unicem, USA, and the chemical
admixtures were donated by BASF, USA. I gratefully acknowledge the generous support of this
research by the National Science Foundation (CMMI Grant 1562927) as well as Purdue College
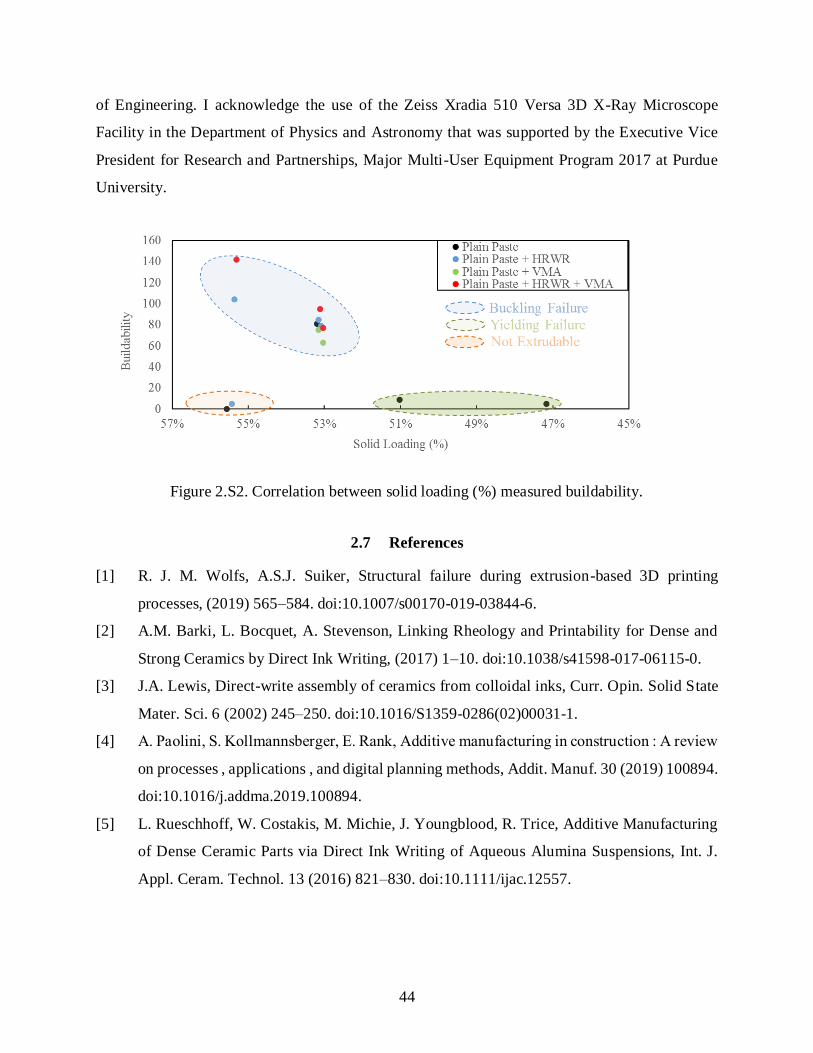
44
of Engineering. I acknowledge the use of the Zeiss Xradia 510 Versa 3D X-Ray Microscope
Facility in the Department of Physics and Astronomy that was supported by the Executive Vice
President for Research and Partnerships, Major Multi-User Equipment Program 2017 at Purdue
University.
Figure 2.S2. Correlation between solid loading (%) measured buildability.
2.7 References
[1] R. J. M. Wolfs, A.S.J. Suiker, Structural failure during extrusion-based 3D printing
processes, (2019) 565–584. doi:10.1007/s00170-019-03844-6.
[2] A.M. Barki, L. Bocquet, A. Stevenson, Linking Rheology and Printability for Dense and
Strong Ceramics by Direct Ink Writing, (2017) 1–10. doi:10.1038/s41598-017-06115-0.
[3] J.A. Lewis, Direct-write assembly of ceramics from colloidal inks, Curr. Opin. Solid State
Mater. Sci. 6 (2002) 245–250. doi:10.1016/S1359-0286(02)00031-1.
[4] A. Paolini, S. Kollmannsberger, E. Rank, Additive manufacturing in construction : A review
on processes , applications , and digital planning methods, Addit. Manuf. 30 (2019) 100894.
doi:10.1016/j.addma.2019.100894.
[5] L. Rueschhoff, W. Costakis, M. Michie, J. Youngblood, R. Trice, Additive Manufacturing
of Dense Ceramic Parts via Direct Ink Writing of Aqueous Alumina Suspensions, Int. J.
Appl. Ceram. Technol. 13 (2016) 821–830. doi:10.1111/ijac.12557.

45
[6] W.J. Costakis, L.M. Rueschhoff, A.I. Diaz-Cano, J.P. Youngblood, R.W. Trice, Additive
manufacturing of boron carbide via continuous filament direct ink writing of aqueous
ceramic suspensions, J. Eur. Ceram. Soc. 36 (2016) 3249–3256.
doi:10.1016/j.jeurceramsoc.2016.06.002.
[7] K.G. Kuder, S.P. Shah, Rheology of Extruded Cement-Based Materials, (2008).
[8] J.E. Smay, J. Cesarano, J.A. Lewis, Colloidal inks for directed assembly of 3-D periodic
structures, Langmuir. 18 (2002) 5429–5437. doi:10.1021/la0257135.
[9] A.S.J. Suiker, International Journal of Mechanical Sciences Mechanical performance of
wall structures in 3D printing processes : Theory , design tools and experiments, Int. J. Mech.
Sci. 137 (2018) 145–170. doi:10.1016/j.ijmecsci.2018.01.010.
[10] N. Roussel, Rheological requirements for printable concretes, Cem. Concr. Res. 112 (2018)
76–85. doi:10.1016/j.cemconres.2018.04.005.
[11] R.J.M. Wolfs, F.P. Bos, T.A.M. Salet, Early age mechanical behaviour of 3D printed
concrete: Numerical modelling and experimental testing, Cem. Concr. Res. 106 (2018) 103–
116. doi:10.1016/j.cemconres.2018.02.001.
[12] L. Reiter, T. Wangler, N. Roussel, R. Flatt, The role of early age structural build-up in digital
fabrication with concrete, Cem. Concr. Res. (2018) (this issue).
doi:10.1016/j.cemconres.2018.05.011.
[13] B.N. Diggs-mcgee, E.L. Kreiger, M.A. Kreiger, M.P. Case, Print time vs . elapsed time : A
temporal analysis of a continuous printing operation for additive constructed concrete, Addit.
Manuf. 28 (2019) 205–214. doi:10.1016/j.addma.2019.04.008.
[14] S. Ketel, G. Falzone, B. Wang, N. Washburn, G. Sant, A printability index for linking slurry
rheology to the geometrical attributes of 3D-printed components, Cem. Concr. Compos.
(2018) 0–1. doi:10.1016/j.cemconcomp.2018.03.022.
[15] E.L. Kreiger, M.A. Kreiger, M.P. Case, Development of the construction processes for
reinforced additively constructed concrete, Addit. Manuf. 28 (2019) 39–49.
doi:10.1016/j.addma.2019.02.015.
[16] V. Naidu, M. Krause, V. Mechtcherine, Automation in Construction Direct printing test for
buildability of 3D-printable concrete considering economic viability, Autom. Constr. 109
(2020) 102986. doi:10.1016/j.autcon.2019.102986.
46
[17] D. Marchon, S. Kawashima, H. Bessaies-bey, S. Mantellato, S. Ng, Cement and Concrete
Research Hydration and rheology control of concrete for digital fabrication : Potential
admixtures and cement chemistry, Cem. Concr. Res. 112 (2018) 96–110.
doi:10.1016/j.cemconres.2018.05.014.
[18] A. Kazemian, X. Yuan, E. Cochran, B. Khoshnevis, Cementitious materials for
construction-scale 3D printing : Laboratory testing of fresh printing mixture, Constr. Build.
Mater. 145 (2017) 639–647. doi:10.1016/j.conbuildmat.2017.04.015.
[19] W. Ricardo, H. Fryda, J.-N. Bousseau, P.-A. Andreani, T.J. Andersen, Evaluation of Early-
Age Concrete Structural Build-Up for 3D Concrete Printing by Oscillatory Rheometry, 1
(2020) 35–47. doi:10.1007/978-3-030-20216-3.
[20] T.T. Le, S.A. Austin, S. Lim, R.A. Buswell, A.G.F. Gibb, T. Thorpe, Mix design and fresh
properties for high-performance printing concrete, Mater. Struct. Constr. 45 (2012) 1221–
1232. doi:10.1617/s11527-012-9828-z.
[21] P. Carneau, R. Mesnil, N. Roussel, O. Baverel, Additive manufacturing of cantilever - From
masonry to concrete 3D printing, Autom. Constr. 116 (2020) 103184.
doi:10.1016/j.autcon.2020.103184.
[22] M. Moini, J. Olek, J. Youngblood, B. Magee, D. Zavattieri, Additive Manufacturing and
Performance of Architectured Cement-based Materials, Under Rev. (2018).
doi:10.1002/adma.201802123.
[23] L.J. Struble, H. Zhang, G.K. Sun, W.G. Lei., Oscillatory shear behavior of portland cement
paste during early hydration, Concr. Sci. Eng. 141–149.
[24] D. Han, R.D. Ferron, Effect of mixing method on microstructure and rheology of cement
paste, Constr. Build. Mater. 93 (2015) 278–288. doi:10.1016/j.conbuildmat.2015.05.124.
[25] T. Conte, M. Chaouche, Rheological behavior of cement pastes under Large Amplitude
Oscillatory Shear, Cem. Concr. Res. 89 (2016) 332–344.
doi:10.1016/j.cemconres.2016.07.014.
[26] Q. Yuan, X. Lu, K.H. Khayat, D. Feys, C. Shi, Small amplitude oscillatory shear technique
to evaluate structural build-up of cement paste, Mater. Struct. Constr. 50 (2017) 1–12.
doi:10.1617/s11527-016-0978-2.
47
[27] Y. Qian, S. Kawashima, Use of creep recovery protocol to measure static yield stress and
structural rebuilding of fresh cement pastes, Cem. Concr. Res. 90 (2016) 73–79.
doi:10.1016/j.cemconres.2016.09.005.
[28] Y. Qian, S. Kawashima, Flow onset of fresh mortars in rheometers: Contribution of paste
deflocculation and sand particle migration, Cem. Concr. Res. 90 (2016) 97–103.
doi:10.1016/j.cemconres.2016.09.006.
[29] Z. Sun, T. Voigt, S.P. Shah, Rheometric and ultrasonic investigations of viscoelastic
properties of fresh Portland cement pastes, Cem. Concr. Res. 36 (2006) 278–287.
doi:10.1016/j.cemconres.2005.08.007.
[30] M. Bellotto, Cement paste prior to setting: A rheological approach, Cem. Concr. Res. 52
(2013) 161–168. doi:10.1016/j.cemconres.2013.07.002.
[31] S.Z. Jones, D.P. Bentz, N.S. Martys, W.L. George, A. Thomas, Rheological Control of 3D
Printable Cement Paste and Mortars, Springer International Publishing, 2019.
doi:10.1007/978-3-319-99519-9.
[32] D. Marchon, S. Kawashima, H. Bessaies-Bey, S. Mantellato, S. Ng, Hydration and rheology
control of concrete for digital fabrication: Potential admixtures and cement chemistry, Cem.
Concr. Res. (2018). doi:10.1016/j.cemconres.2018.05.014.
[33] M. Moini, J. Olek, B. Magee, P. Zavattieri, J. Youngblood, Additive manufacturing and
characterization of architectured cement-based materials via X-ray micro-computed
tomography, 2019. doi:10.1007/978-3-319-99519-9_16.
[34] Tjörvi Björnsson, Structural analysis of columns with initial imperfections, University of
Iceland, 2017.
[35] L. Euler, De Curvis Elasticis Lausanne and Geneva (The Euler formula was derived in a
later paper, Sur le Forces des Colonnes Memoires de VAcademie Royale des Sciences et
Belles Lettres, Vol. 13, Berlin, 1759.), (1744) 267–268.
[36] W.F. Chen, E.M. Lui, Columns with End Restraint and Bending in Load and Resistance
Design Factor, (1985) 105–132.
[37] A. Boumiz, C. Vernet, F.C. Tenoudjif, C. Technique, I. Fran, G. Cedex, Mechanical
Properties of Cement Pastes and Mortars at Early Ages Evolution with Time and Degree of
Hydration, 7355 (1991).

48
[38] R. Jayathilakage, P. Rajeev, J.G. Sanjayan, Yield stress criteria to assess the buildability of
3D concrete printing, Constr. Build. Mater. 240 (2020) 117989.
doi:10.1016/j.conbuildmat.2019.117989.
[39] A. Szabo, L. Reiter, E. Lloret-Fritschi, F. Gramazio, M. Kohler, R.J. Flatt, Processing of
Set on Demand Solutions for Digital Fabrication in Architecture, in: Mechtcherine V.,
Khayat K., Secrieru E. Rheol. Process. Constr. Mater. RILEM Bookseries, Vol 23. Springer,
Cham, 2019: pp. 440–447.
[40] J. Kruger, S. Zeranka, G. Van Zijl, Automation in Construction 3D concrete printing: A
lower bound analytical model for buildability performance quantification, Autom. Constr.
106 (2019) 102904. doi:10.1016/j.autcon.2019.102904.
[41] J. Kruger, S. Cho, S. Zeranka, C. Viljoen, G. Van Zijl, 3D concrete printer parameter
optimisation for high rate digital construction avoiding plastic collapse, Compos. Part B.
183 (2020) 107660. doi:10.1016/j.compositesb.2019.107660.
[42] John Case, C.T.F. Ross, A. Chilver, Strength of Materials and Structures, 4th ed., Wiley,
United Kingdom, 1999.
[43] N.J. Hoff, Buckling and Stability.
[44] G. Gelardi, R.J. Flatt., Working mechanisms of water reducers and superplasticizers, in: Sci.
Technol. Concr. Admixtures, Woodhead Publishing, 2016: pp. 257–278.
[45] E. Schlangen, S.C. Figueiredo, Special Issue 4th Brazilian Conference on Composite
Materials (2018) Effect of viscosity modifier admixture on Portland cement paste hydration
and microstructure, 212 (2019) 818–840. doi:10.1016/j.conbuildmat.2019.04.020.
[46] M. Palacios, R.J. Flatt., Working mechanism of viscosity-modifying admixtures., in: Sci.
Technol. Concr. Admixtures, Woodhead Publishing, 2016: pp. 415–432.

49
ADDITIVE MANUFACTURING AND CHARACTERIZATION OF
ARCHITECTURED CEMENT-BASED MATERIALS VIA X-RAY
MICRO-COMPUTED TOMOGRAPHY
This chapter contains work that was originally published in Springer Nature as
“Mohamadreza Moini, Jan Olek, Bryan Magee, Pablo Zavattieri, and Jeffrey Youngblood.
Additive manufacturing and characterization of architectured cement-based materials via X-ray
micro-computed tomography. In First RILEM International Conference on Concrete and Digital
Fabrication, Digital Concrete 2018. DC 2018. RILEM Bookseries. Volume 19., pp. 176-189.
Springer, Cham, 2018.” The original article has been used with permission as stated below.
Reprinted by permission from Springer Nature: Springer, Cham, In: First RILEM
International Conference on Concrete and Digital Fabrication – Digital Concrete 2018. DC
2018. RILEM Bookseries. “Additive Manufacturing and Characterization of Architectured
Cement-based Materials via X-ray Micro-computed Tomography.” Mohamadreza Moini, Jan
Olek, Bryan Magee, Pablo Zavattieri, and Jeffrey Youngblood, COPYRIGHT (2018).
Moreover, this chapter contains experimental data collected by Mohamadreza Moini. Data
conceptualization was a collaborative effort with co-authors, Jan Olek, Jeffrey P. Youngblood, B.
Magee, and Pablo D. Zavattieri. The manuscript was written by Mohamadreza Moini and edited
by co-authors. The original article has also been modified for dissertation formatting purposes. I
also acknowledge Chven Mitchell from the the 3D X-Ray Microscope Facility in the Department
of Physics and Astronomy who assisted with the training on the use of Zeiss Xradia 510 Versa 3D
X-ray Microscope that was supported by the Executive Vice President for Research and
Partnerships, Major Multi-User Equipment Program 2017 at Purdue University.
Abstract
There is an increasing interest in the fabrication of cement-based materials via additive
manufacturing (AM) techniques. However, the processing-induced heterogeneities and interfaces
represent a major challenge. The role of processing in creating interfaces and their characteristics
requires understanding of the microstructure of 3D-printed hardened cement paste (hcp). This
work investigates the microstructural features of architectured cement-based materials, including
processing-induced heterogeneous patterns, interfacial regions (IRs), and pore network

50
distributions with respect to the architectural pattern. A 3D printer was modified and merged with
an extrusion system and specimens were 3D-printed using a layer-wise direct ink writing (DIW)
process capable of fabrication of ‘lamellar' architectures of materials. A lab-based X-ray
microscope (XRM) was used to perform X-ray micro-computed tomography (micro-CT)
evaluations to explore the microstructural characteristics of 3-day old intact (i.e. not tested) 3D
printed and cast specimens at two levels of magnification: 0.4X and 4X. CT scans of printed
specimen revealed a patterned pore network and several microstructural features, including: a)
macropores (visible during printing), b) micropores at interfacial regions (IRs), c) accumulation of
anhydrous cement particles near macropores, and d) rearrangement of filaments away from their
designed toolpath. In comparison, microstructural investigation of cast specimen at 4X scan
revealed randomly distributed pores with no connectivity throughout the specimen. The aptitude
of micro-CT as a non-destructive technique for microstructural characterization of architectured
cement-based materials is discussed. The role of processing to induce and to pattern
heterogeneities such as IRs in materials is demonstrated and the role of architecture in controlling
such heterogeneities and their directionality through the interface is discussed.
Keywords: 3D-printing, Cement Paste, Micro-CT, Interfacial Region (IR)
3.1 Introduction
Properties of hardened cement paste (hcp) are influenced by its microstructure and the way
in which the material is cast and placed [1]. Specifically, characteristics of the pore network (i.e.,
the size and distribution of internal flaws), the morphology of microstructural components, and
heterogeneities in the microstructure, all affect mechanical properties of hardened cement-based
materials [1,2]. Over the last decades, the use of advanced characterization techniques, such as
scanning electron microscopy (SEM), has significantly advanced the understanding of
microstructure of cement-based materials. However, the effectiveness of SEM is limited in terms
of obtaining three-dimensional information about connectivity and size distribution of pore
network [1,3].
X-ray micro-Computed Tomography (micro-CT) has been previously applied to cement-
based mortar and concrete materials to characterize pore network [4] and microstructure [5] and
their relationships with a variety of key properties including: fracture properties [5,6,7], damage

51
mechanisms [2,8,9], mass transport [10], and evolution of cement hydration [11]. Micro-CT is a
non-destructive technique that captures three-dimensional images of materials without the need
for destructive preparation processes such as drying, surface treatments, and vacuuming; all of
which are commonly required when preparing specimens for typical microstructural
characterization techniques such as MIP, gas sorption, and SEM [1]. As such, the use of micro-CT
for microstructural characterization of 3D-printed hcp is advantageous as it does not alter the
microstructure while allowing for imaging of elements as large as 10s of millimeters.
During this research, a laboratory-based (i.e. not requiring synchrotron facilities) X-ray
microscope was used to explore the microstructural characteristics of intact (i.e. not tested) printed
and cast 3-day old cement paste specimens at two magnifications: 0.4X and 4X corresponding,
respectively, to the resolution of 32.24 µm and 4.04 µm.
3D-printing via direct-ink-writing (DIW) of colloids, slurries, and pastes allows for control
of the architecture of the element and can give rise to a variety of microstructural features
[12,13,14]. In this work, four microstructural features observed in 3D-printed lamellar architecture
are discussed. All four features were qualitatively detected at 0.4X scans, and further verified at
4X scan. Finally, the microstructure of the printed specimen was compared to a microstructure of
conventionally cast specimen.
3.2 Methods
3.2.1 3D-Printing Setup
To establish a 3D printer capable of printing cement paste via DIW techniques, two separate
units were combined. A gantry-based 3D printer (Ultimaker 2 Extended+ used for printing
thermoplastic materials) was merged with a stepper motor-driven extrusion system (Structur3d
Discov3ry Paste Extruder) to serve as a paste extruder (see Figure 3.1a). These two units were
connected with tube and luer locks. The resulting system is capable of printing pastes with high
yield stress and viscosity and can fabricate elements at prototyping scale (mm). The extruder is
capable of applying desirable displacements (extrusion rates) via mounted 75 mL ink-charged
syringes as depicted in Figure. 3.1b). The 3D printer was modified to allow for mounting of a
nozzle holder assembly on the printer gantry rods (Figure 3.1c). The nozzle holder is consisted of
two lightweight aluminum parts designed and custom-fabricated specifically for this printer. To

52
continuously feed the paste from the syringe to the printer nozzle, a polyethylene tube for paste
delivery (with an internal diameter of 4.3 mm and 450 mm long) was passed through the nozzle
holder assembly. A female luer lock was inserted into the nozzle holder to connect the tube to the
nozzle (Figure 3.1d). To connect the other side of the tube, onto the syringe a male luer lock
(Figure 3.1e). The luer locks and the standard Nordsen nozzle (gauge 15 with 1.36 I.D.) are shown
Figure 3.1f.
Figure 3.1. 3D printer setup: a) Gantry 3D printer (Ultimaker 2 Extended +) and stepper motor-
based extrusion (Discov3ry) system; b) Syringe and plunger mounted onto the stepper motor
system; (c) Nozzle holder assembly mounted onto the 3D printer gantry guide rods; d) Nozzle
holder assembly and the female luer lock used to connect the tube to the nozzle; e) male luer lock
used to connect syringe to the tube; f) nozzle and luer locks shown separately
3.3 Ink Design, Mixing Procedure, and Curing
An iterative mix design process was employed to identify cement paste inks with flow
properties (i.e., yield stress, and viscosity) suitable for the DIW process. A combination of high-
range-water-reducing-admixture (HRWRA) and viscosity modifying admixture (VMA) are
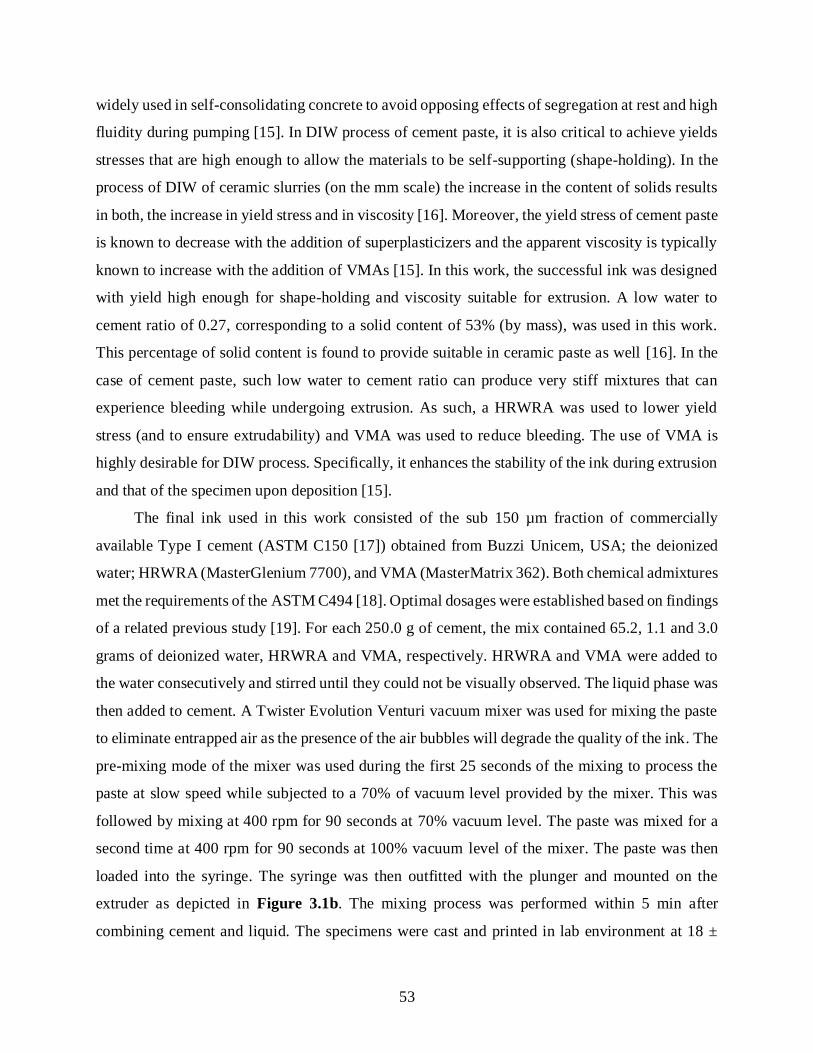
53
widely used in self-consolidating concrete to avoid opposing effects of segregation at rest and high
fluidity during pumping [15]. In DIW process of cement paste, it is also critical to achieve yields
stresses that are high enough to allow the materials to be self-supporting (shape-holding). In the
process of DIW of ceramic slurries (on the mm scale) the increase in the content of solids results
in both, the increase in yield stress and in viscosity [16]. Moreover, the yield stress of cement paste
is known to decrease with the addition of superplasticizers and the apparent viscosity is typically
known to increase with the addition of VMAs [15]. In this work, the successful ink was designed
with yield high enough for shape-holding and viscosity suitable for extrusion. A low water to
cement ratio of 0.27, corresponding to a solid content of 53% (by mass), was used in this work.
This percentage of solid content is found to provide suitable in ceramic paste as well [16]. In the
case of cement paste, such low water to cement ratio can produce very stiff mixtures that can
experience bleeding while undergoing extrusion. As such, a HRWRA was used to lower yield
stress (and to ensure extrudability) and VMA was used to reduce bleeding. The use of VMA is
highly desirable for DIW process. Specifically, it enhances the stability of the ink during extrusion
and that of the specimen upon deposition [15].
The final ink used in this work consisted of the sub 150 µm fraction of commercially
available Type I cement (ASTM C150 [17]) obtained from Buzzi Unicem, USA; the deionized
water; HRWRA (MasterGlenium 7700), and VMA (MasterMatrix 362). Both chemical admixtures
met the requirements of the ASTM C494 [18]. Optimal dosages were established based on findings
of a related previous study [19]. For each 250.0 g of cement, the mix contained 65.2, 1.1 and 3.0
grams of deionized water, HRWRA and VMA, respectively. HRWRA and VMA were added to
the water consecutively and stirred until they could not be visually observed. The liquid phase was
then added to cement. A Twister Evolution Venturi vacuum mixer was used for mixing the paste
to eliminate entrapped air as the presence of the air bubbles will degrade the quality of the ink. The
pre-mixing mode of the mixer was used during the first 25 seconds of the mixing to process the
paste at slow speed while subjected to a 70% of vacuum level provided by the mixer. This was
followed by mixing at 400 rpm for 90 seconds at 70% vacuum level. The paste was mixed for a
second time at 400 rpm for 90 seconds at 100% vacuum level of the mixer. The paste was then
loaded into the syringe. The syringe was then outfitted with the plunger and mounted on the
extruder as depicted in Figure 3.1b. The mixing process was performed within 5 min after
combining cement and liquid. The specimens were cast and printed in lab environment at 18 ±
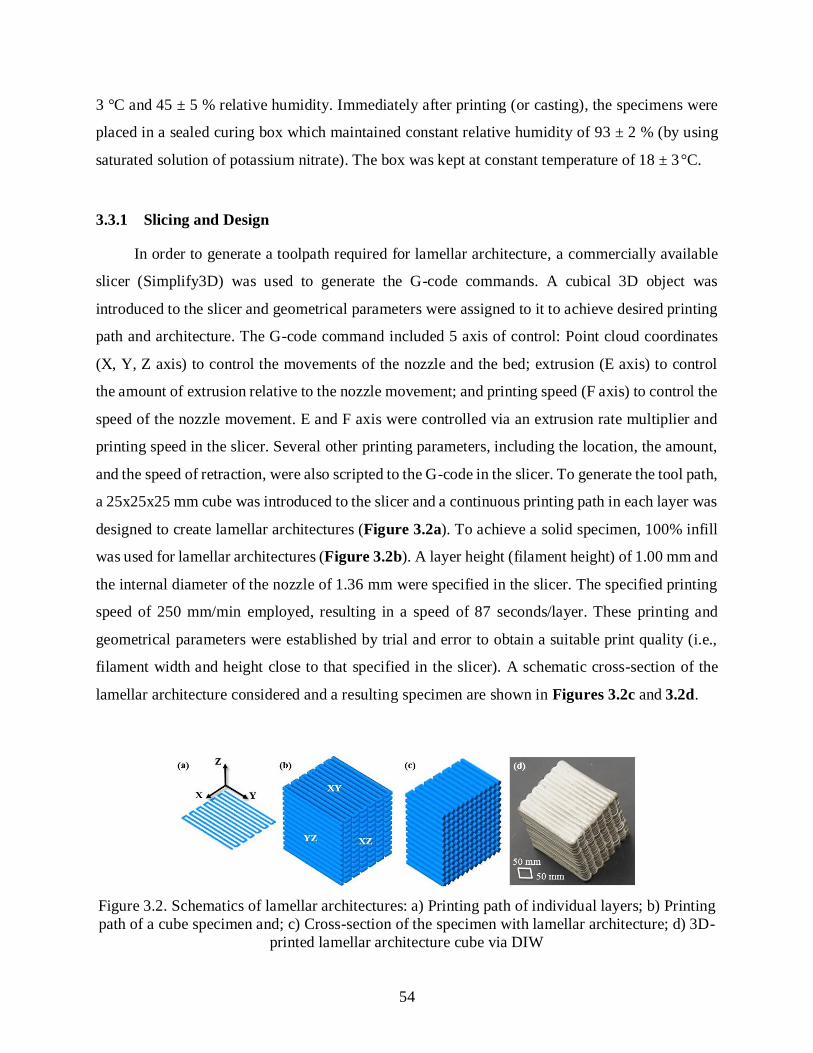
54
3 °C and 45 ± 5 % relative humidity. Immediately after printing (or casting), the specimens were
placed in a sealed curing box which maintained constant relative humidity of 93 ± 2 % (by using
saturated solution of potassium nitrate). The box was kept at constant temperature of 18 ± 3°C.
3.3.1 Slicing and Design
In order to generate a toolpath required for lamellar architecture, a commercially available
slicer (Simplify3D) was used to generate the G-code commands. A cubical 3D object was
introduced to the slicer and geometrical parameters were assigned to it to achieve desired printing
path and architecture. The G-code command included 5 axis of control: Point cloud coordinates
(X, Y, Z axis) to control the movements of the nozzle and the bed; extrusion (E axis) to control
the amount of extrusion relative to the nozzle movement; and printing speed (F axis) to control the
speed of the nozzle movement. E and F axis were controlled via an extrusion rate multiplier and
printing speed in the slicer. Several other printing parameters, including the location, the amount,
and the speed of retraction, were also scripted to the G-code in the slicer. To generate the tool path,
a 25x25x25 mm cube was introduced to the slicer and a continuous printing path in each layer was
designed to create lamellar architectures (Figure 3.2a). To achieve a solid specimen, 100% infill
was used for lamellar architectures (Figure 3.2b). A layer height (filament height) of 1.00 mm and
the internal diameter of the nozzle of 1.36 mm were specified in the slicer. The specified printing
speed of 250 mm/min employed, resulting in a speed of 87 seconds/layer. These printing and
geometrical parameters were established by trial and error to obtain a suitable print quality (i.e.,
filament width and height close to that specified in the slicer). A schematic cross-section of the
lamellar architecture considered and a resulting specimen are shown in Figures 3.2c and 3.2d.
Figure 3.2. Schematics of lamellar architectures: a) Printing path of individual layers; b) Printing
path of a cube specimen and; c) Cross-section of the specimen with lamellar architecture; d) 3D-
printed lamellar architecture cube via DIW

55
3.3.2 Micro-CT and Scanning Specimens
X-ray micro-computed tomography (micro-CT) is an imaging technique that involves the
recording of series of 2D radiographs (images), taken at various angles around a rotating object,
to mathematically reconstruct a spatial map and digitally render the entire volume (i.e., three-
dimensional appearance) of an object [2]. Resulting 3D renditions are typically presented as a
series of 2D (i.e., sliced images) with intensities corresponding to X-ray absorption and material
density at each voxel [20]. The resulting variations in intensity allow for identification of various
phases and features of the microstructure and their 3D distribution.
Conventionally, X-ray microscopes employed for micro-CT characterization technique, use
a flat panel detector and thus rely on single-step (i.e., geometric) magnification. As a result,
resolution degrades with increasing sample size and working distance. In this study, an X-ray
microscope (XRM), Zeiss Xradia 510 Versa was utilized, which allows of an increase in the
resolution of scans through dual-stage magnification process. In the first stage, the field of view
(FOV) desirable to scan the entire volume of the specimen was established via geometric
magnification process, which involved setting distances between the source, detector, and
specimen (as in conventional micro-CTs). In a second stage, additional optical magnification was
enabled at the detector system through objective lenses. The detector is equipped with scintillator
and objective lens which converts X-rays to light rays and thus allows for optical magnification
and higher resolution. The initial (i.e. the 0.4X) scan allowed a large FOV and thus facilitated to
scan the entire specimens (32.24 µm pixel size). This was followed by a 4X scan, allowing higher
resolution (4.04 µm pixel size) at regions of interest (ROI). A beam energy of 150 KeV, a power
of 10 W, exposure times of 0.94 second and 4 seconds, and full 360° rotation were used for 0.4X
and 4X scans of printed specimen and a beam energy of 140 KeV, a power of 9 W, exposure times
of 1 second, and full 360° rotation were used for 0.4X scans of cast specimen respectively.
Dragonfly software was used for post-processing of the data. One cast and one 3D-printed hcp
cubes (25x25x25 mm ± 1 mm) were used in this experiment.

56
3.4 Results and Discussion
3.4.1 3D-Printed Lamellar Architecture Micro-CT (0.4X and 4X scans)
0.4X Scan. The 0.4X magnification CT scan of the intact specimen revealed the presence of
four microstructural features: macropores, micropores, rearrangement of filaments and
accumulation of anhydrous cement grains. These features are illustrated in Figures 3.3a, 3.3b and
3.3c, for XZ, YZ, XY planes respectively, and in Figure 3.3d for the 3D rendition of the interior
of the lamellar architecture specimen. In micro-CT images of hcp, darker intensities represent
pores filled with air or water, with greyscale intensities corresponding to hydrated cement paste
products and brighter regions corresponding to anhydrous cement grains [1]. The previously
mentioned four microstructural features are analyzed in more details below:
Macropores. As seen in Figures 3.3a and 3.3d, there are several regions that contain large
pores (macropores) located between adjacent filaments of the same layer. These pores are aligned
along the filament in the direction of the Y axis as can be seen in the regions outlined by white
rectangles in Figures 3.3a and 3.3d. They are typically wider than 100 µm and range in length
from few to 10s of millimeters. These macropores are the result of variability in the width of the
filament as it is being extruded from the tip of the nozzle. That variability is, in turn, likely the
result of inconsistencies in the local properties of ink under extrusion.
Micropores (Micro-channels). The second type of pores was observed to exist between
adjacent filaments of the adjacent layers (see the regions outlined by blue rectangles shown in
Figures 3.3a and 3.3d. These micropores (or micro-channels) are smaller than 100 µm in diameter
but can be 10s of millimeters long. They are located between filaments along the Y axis (i.e., they
are present in the interfacial regions (IRs) of the filaments). The horizontal (i.e., XY) slices H1
and H2 shown in Figure 3.3c, correspond to, respectively, the core (i.e., through the center) and
interfacial regions of the filaments as indicated in cross-sectional view (XZ) in Figure 3.3a.
Similarly, vertical (YZ) slices W1 and W2 shown in Figure 3.3b also correspond to the core and
interface regions of the filaments indicated in Figure 3.3a. Analysis of Figures 3.3b and 3.3c
indicate that micro-channels (appearing in these figures as darker regions within the matrix) are
only present in the images representing slices through interfaces (i.e. they are absent from images
representing slices through the cores). It should be noted, however, that these micro-channels are
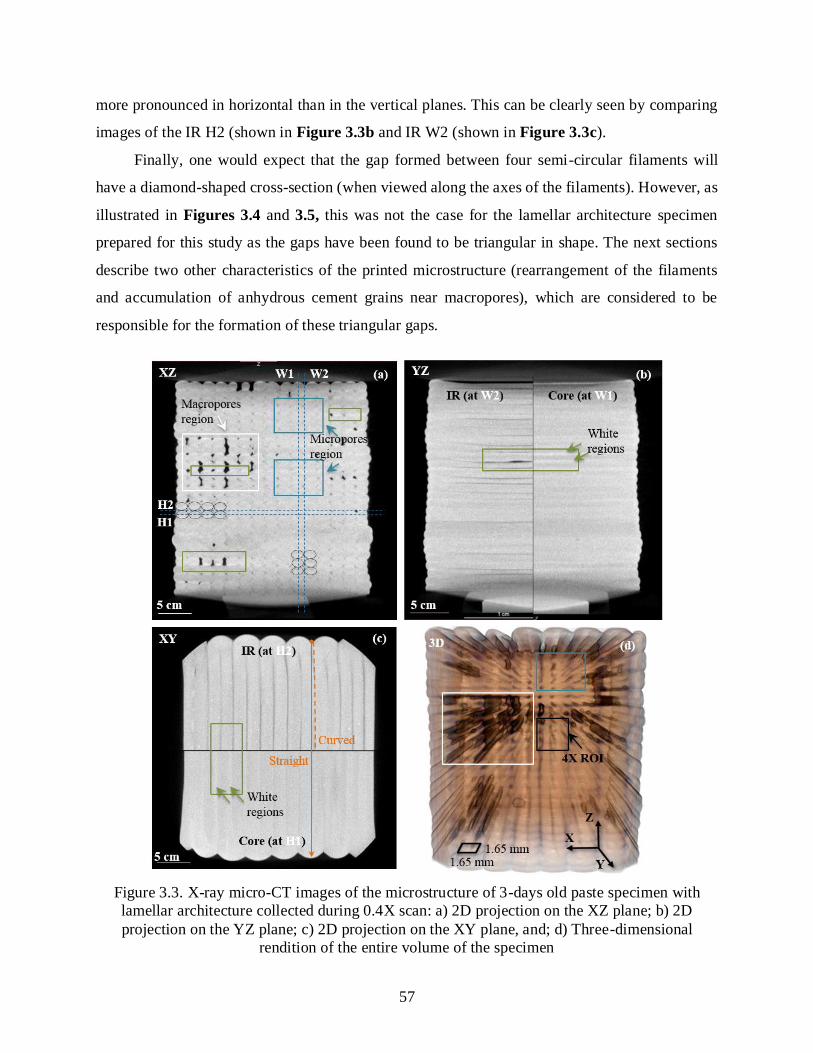
57
more pronounced in horizontal than in the vertical planes. This can be clearly seen by comparing
images of the IR H2 (shown in Figure 3.3b and IR W2 (shown in Figure 3.3c).
Finally, one would expect that the gap formed between four semi-circular filaments will
have a diamond-shaped cross-section (when viewed along the axes of the filaments). However, as
illustrated in Figures 3.4 and 3.5, this was not the case for the lamellar architecture specimen
prepared for this study as the gaps have been found to be triangular in shape. The next sections
describe two other characteristics of the printed microstructure (rearrangement of the filaments
and accumulation of anhydrous cement grains near macropores), which are considered to be
responsible for the formation of these triangular gaps.
Figure 3.3. X-ray micro-CT images of the microstructure of 3-days old paste specimen with
lamellar architecture collected during 0.4X scan: a) 2D projection on the XZ plane; b) 2D
projection on the YZ plane; c) 2D projection on the XY plane, and; d) Three-dimensional
rendition of the entire volume of the specimen

58
Self-Drifting of Filaments from the Programmed Toolpath. The examination of CT images
revealed that the internal filaments of the lamellar architecture self-drifted (to an extent of about
half width of the filament) from their targeted (programmed) toolpath. From the top view (i.e., XY
plane), the filaments in all interior layers were observed to follow slightly curved, rather than
straight, paths. This is in spite of the fact that the nozzle was programmed to move along a linear
tool path parallel to the Y axis. This observation was made possible due to the differences in the
gray level intensities between the signals from the core sections and interfaces of the filaments. A
typical curvature is highlighted in Figure 3.3c by the set of two orange lines: the solid line on the
left showing the location where a straight interface should have been observed and the dashed line
on the right that shows the actual (slightly curved) path of the actual interface. In the consecutive
layers of the microstructure, the direction of this curvature successively changes to left and right.
This has to do with the opposite direction of printing path in successive layers. The causes of this
self-drifting of the filaments are further elaborated in the section describing the 4X scan.

59
Figure 3.4. CT images of the microstructure of 3-days old intact specimen with lamellar
architecture collected during 4X scan: a) XZ; b) YZ; c) XY planes; d) 3D image of the solid
skeleton; e) 3D image of pore network
Accumulation of Anhydrous Cement Grains near Macropores (‘White Regions’). The
0.4X CT scans also revealed the accumulation of the unhydrated (anhydrous) cement grains in the
IRs near the macropores. This phenomenon was observed in both, the horizontal and vertical
interfacial planes of lamellar architecture. In addition, the 4X scan demonstrated the presence of a
subtle, ‘brighter’ zone at the horizontal interfaces, typically also near the macropores. These
brighter regions of the microstructure are referred to in this chapter as ‘white regions’ and are
outlined by green rectangles in Figures. 3.3a, 3.3b and 3.3c. The more in-depth analysis of these
white regions is presented in the section describing the 4X scan.
4X Scan. The 3D scan of the specimens resulting from the 0.4X scan shown in Figure 3.3d
has been used to select an internal region of interest (ROI) to be evaluated at higher (i.e., 4X)

60
magnification. That ROI is outlined by a red square rectangle in Figure 3.3d and the details are
presented in Figure 3.4. The examination at the magnification 4X was performed to further
explore the four types of microstructural features discussed during the analysis of the results from
the 0.4X scan. Specifically, the 4X CT scan provided additional information on the shape of the
micro-channels and their connectivity in the IRs, the rearrangement of the paths of the filaments,
and the nature of white regions. The 2D projections of individual XZ, YZ, XY planes are shown
in, respectively, Figures 3.4a, 4b and 3.4c; Figure 3.4d shows the 3D rendition of the interior of
the specimen. The higher resolution of these images (compared to the resolution obtained during
the 0.4X scans), allowed for the identification of larger cement grains (they appear as bright spots
against the gray matrix of the hydrated products) and pores (they appear as dark spots).
Macropores. The previously mentioned ROI was selected to capture the bottom edge of a
typical macropore between two filaments of the same layer. An example of such pore is shown in
the top left corner of Figure 3.4a. This macropore is also shown in the image of the solid skeleton
(Figure 3.4d) and that of the pore network (Figure 3.4e).
Micropores (Micro-channels). This section provides further analysis of the shape of the
micro-channels as observed in 4X images. Specifically, it can be observed that the triangular
micro-channels (Figure 3.4a) are commonly connected to one another and, when viewed in 3D,
they form of an inclined dog-bone shape as illustrated in Figures 3.4d and 3.4e. As filaments
rearrange upon deposition and move closer together, the connectivity between the micro-channels
can be facilitated. Thorough investigation of the 4X scanned volume qualitatively indicated that
this connectivity between micro-channels occurs through IRs and form pattern of pore network
aligned with the filament architecture (Figure 3.4d and 4e). The typical three horizontal (XY)
slices of H3, H4, H5 (indicated in Figure 3.4a) and shown in Figure 3.4c), demonstrate the
homogeneous characteristics of the microstructure along the ‘cores’ (H3), compared to
heterogeneous characteristic along IRs where micro-channels are present (H4, H5). Similarly, the
vertical (YZ) slices of W3 and W4 (indicated in Figure 3.4a and shown in Figure 3.4b),
demonstrate the homogeneous characteristic of the microstructure along the ‘cores’ (W4),
compared to the heterogeneous characteristic of the microstructure along ‘IRs’ (W3).
Self-Drifting of Filaments from the Programmed Toolpath. As discussed in the section
presenting the 4X scan, the triangular cross-sectional shape of the micro-channels is correlated
with the rearrangement of the filaments. This indicates that the filaments are shifted upon
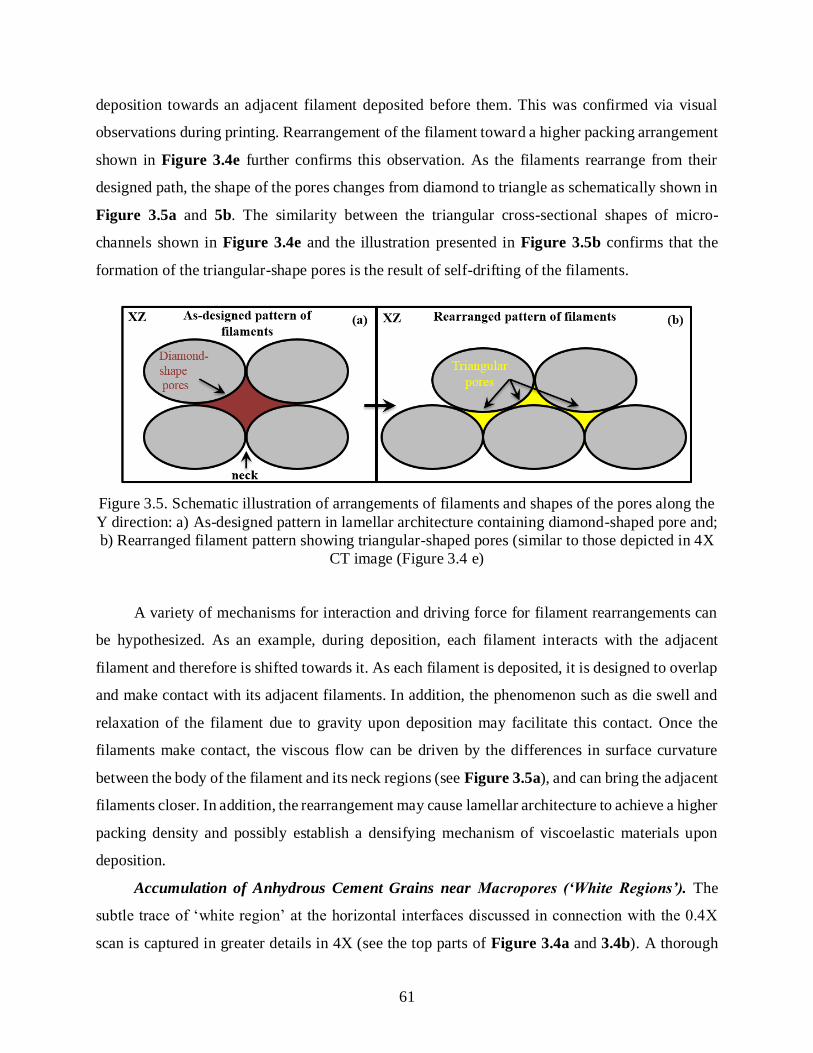
61
deposition towards an adjacent filament deposited before them. This was confirmed via visual
observations during printing. Rearrangement of the filament toward a higher packing arrangement
shown in Figure 3.4e further confirms this observation. As the filaments rearrange from their
designed path, the shape of the pores changes from diamond to triangle as schematically shown in
Figure 3.5a and 5b. The similarity between the triangular cross-sectional shapes of micro-
channels shown in Figure 3.4e and the illustration presented in Figure 3.5b confirms that the
formation of the triangular-shape pores is the result of self-drifting of the filaments.
Figure 3.5. Schematic illustration of arrangements of filaments and shapes of the pores along the
Y direction: a) As-designed pattern in lamellar architecture containing diamond-shaped pore and;
b) Rearranged filament pattern showing triangular-shaped pores (similar to those depicted in 4X
CT image (Figure 3.4 e)
A variety of mechanisms for interaction and driving force for filament rearrangements can
be hypothesized. As an example, during deposition, each filament interacts with the adjacent
filament and therefore is shifted towards it. As each filament is deposited, it is designed to overlap
and make contact with its adjacent filaments. In addition, the phenomenon such as die swell and
relaxation of the filament due to gravity upon deposition may facilitate this contact. Once the
filaments make contact, the viscous flow can be driven by the differences in surface curvature
between the body of the filament and its neck regions (see Figure 3.5a), and can bring the adjacent
filaments closer. In addition, the rearrangement may cause lamellar architecture to achieve a higher
packing density and possibly establish a densifying mechanism of viscoelastic materials upon
deposition.
Accumulation of Anhydrous Cement Grains near Macropores (‘White Regions’). The
subtle trace of ‘white region’ at the horizontal interfaces discussed in connection with the 0.4X
scan is captured in greater details in 4X (see the top parts of Figure 3.4a and 3.4b). A thorough

62
investigation this region demonstrates that the white region contained a higher fraction of
anhydrous cement grains, which explains why they appear brighter as cement grains have higher
density relative to the density of the hydration products and pores. Similarly, the images of the
solid skeleton (shown in Figure 3.4d) and that of the pore network (shown in Figure 3.4e), both
illustrate the accumulation of anhydrous cement grains in the white region. The fact that white
regions are only seen in the horizontal planes suggests that an encouraging drying environment
during the printing of each layer occurs in these planes. The presence of the macropores may have
additionally enhanced drying. The use of ink with a low water to cement ratio of 0.275 can also be
contributing to the increased rate of drying at the horizontal IRs due to longer exposure time to air
drying compared to vertical IRs.
3.4.2 Cast Specimen in 0.4X micro-CT (0.4X scan)
0.4X Scan. The 0.4X scan of cast specimen showed the random distribution of the pore
network. The XY plane of 0.4X scan of intact cast specimen is illustrated in Figure 3.6a whereas
Figure 3.6b shows the 3D rendition of the interior of the specimen. The darker regions in both
images represent pore regions. The random distribution of pores in cast elements and the lack of
patterned heterogeneous network compared to those observed in lamellar architecture (Figure 3.3),
highlights the differences between the microstructure of traditionally cast and 3D-printed hcp
specimen.
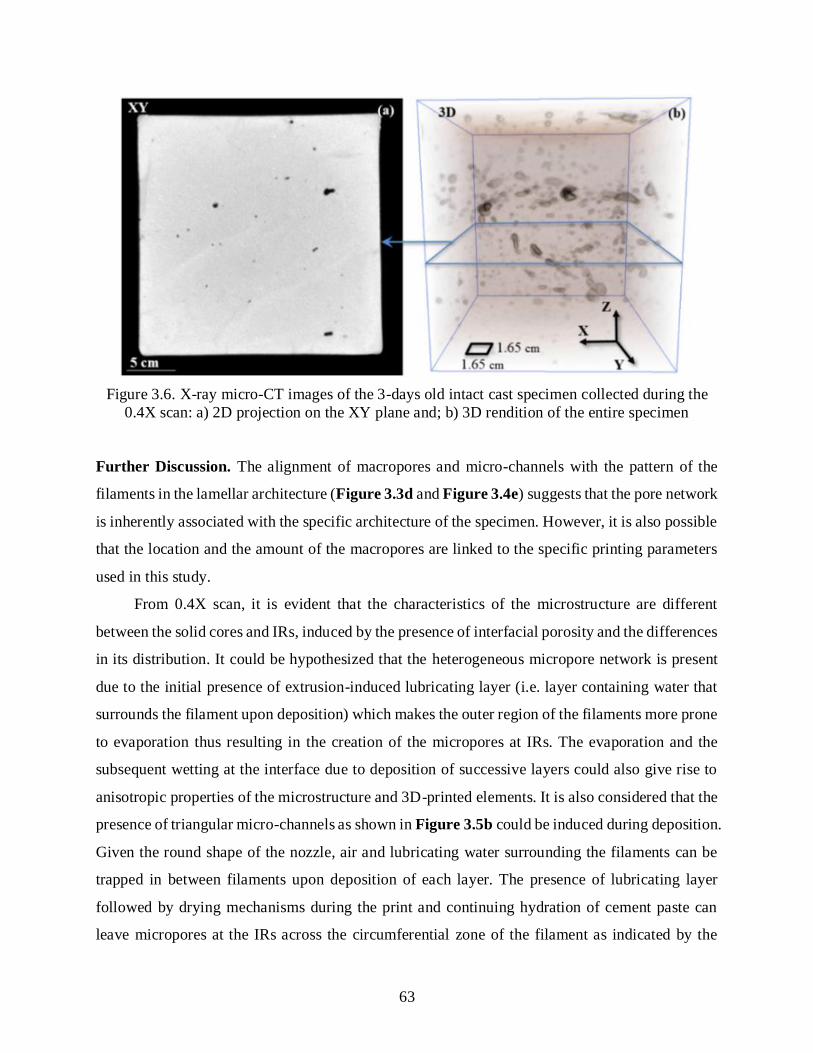
63
Figure 3.6. X-ray micro-CT images of the 3-days old intact cast specimen collected during the
0.4X scan: a) 2D projection on the XY plane and; b) 3D rendition of the entire specimen
Further Discussion. The alignment of macropores and micro-channels with the pattern of the
filaments in the lamellar architecture (Figure 3.3d and Figure 3.4e) suggests that the pore network
is inherently associated with the specific architecture of the specimen. However, it is also possible
that the location and the amount of the macropores are linked to the specific printing parameters
used in this study.
From 0.4X scan, it is evident that the characteristics of the microstructure are different
between the solid cores and IRs, induced by the presence of interfacial porosity and the differences
in its distribution. It could be hypothesized that the heterogeneous micropore network is present
due to the initial presence of extrusion-induced lubricating layer (i.e. layer containing water that
surrounds the filament upon deposition) which makes the outer region of the filaments more prone
to evaporation thus resulting in the creation of the micropores at IRs. The evaporation and the
subsequent wetting at the interface due to deposition of successive layers could also give rise to
anisotropic properties of the microstructure and 3D-printed elements. It is also considered that the
presence of triangular micro-channels as shown in Figure 3.5b could be induced during deposition.
Given the round shape of the nozzle, air and lubricating water surrounding the filaments can be
trapped in between filaments upon deposition of each layer. The presence of lubricating layer
followed by drying mechanisms during the print and continuing hydration of cement paste can
leave micropores at the IRs across the circumferential zone of the filament as indicated by the
64
dashed oval in Figure 3.4e. From 0.4X scan, it is evident that the characteristics of the
microstructure are different between the solid cores and IRs, due to the presence of interfacial
porosity and the differences in its distribution. Horizontal interfaces were exposed to air for a
longer period of time than vertical interfaces during the printing process. The higher amount of
horizontal (dark) IRs compared to (also dark) vertical IRs (Figures 3c and 3.3b) indicates the
higher amount of drying and resulting micropores in horizontal planes (XY). This observation
indicates the existence of the correlation between exposure time and formation of heterogeneous
IRs in different planes, which can result in anisotropy of mechanical properties of the 3D-printed
specimen. The accumulation of anhydrous cement grains near macropores in horizontal IRs could
be the result of the higher amount of drying at the horizontal IRs. These IRs are shown to be
connected to one another through the micro-channels in the microstructure of 3D-printed lamellar
architecture as shown in Figure 3.4e. This heterogeneously patterned pore network, together with
the presence of macropores, causes anisotropy in the 3D-printed elements. This anisotropy can
lead to differences in mechanical properties between the 3D-printed specimen and the cast
specimens, depending on the architecture of materials and the interfacial (bond) strength of 3D-
printed element in different directions. The presence of the interface is very important as IRs
follows the pattern of the filament and overall layered architecture of the element. The architecture
can then be designed to allow damage and micro-cracking to be promoted at the weak IR to achieve
higher fracture resistance without sacrificing the strength.
It was previously discussed that in 3D-printed hcp elements, a wide variety of heterogeneous
features could exist over a broad range of scales [21,22,23]. Application of micro-CT
characterization technique for 3D printed lamellar architecture demonstrated the presence of the
weak IRs induced by the processing and patterned via architecture. In addition, rearrangement of
the filaments and the resulting change in morphology of the pores was revealed. Connectivity of
micropores was discovered in the 4X scan in 3D-printed architecture. As revealed by comparing
the 4X scans of the printed and cast specimens, their microstructure is very different. These
observations reveal the role of processing in determining the microstructure of materials.

65
3.5 Summary
Micro-CT images of 3D-printed lamellar architecture collected during this study revealed
four characteristic features of the microstructure not observed in the cast specimens, thus
indicating these features resulted from the processing of material.
The previously mention microstructural features included the following: a) macropores
(i.e., visible gaps formed during printing), b) micropores at interfacial regions (IRs) of
filaments in the form of micro-channels smaller than 100 µm, c) self-rearrangement of
filaments from their designed toolpath, and d) high accumulation of anhydrous cement
particles near the large pores. All of these four features were qualitatively detected at the
0.4X scans, and further verified at the 4X scan. The presence of these features could play
a role in determining the overall mechanical response of architectured hcp specimen.
Pore network (at both macro and micro scale) appeared to be aligned with respect to the
direction of the filaments in the lamellar architecture of the printed specimen.
Micro-CT demonstrated great aptitude (as non-destructive technique) for capturing spatial
heterogeneities of the microstructure of 3D-printed elements as large as 10s of mm. The
dual-stage magnifications system used in this study facilitated higher resolutions at large
working distance, thus allowing CT of larger specimens.
3.6 Acknowledgements
The authors gratefully acknowledge generous support from the National Science Foundation
(CMMI 1562927) of this research.
3.7 References
[1] Gallucci, E., Scrivener, K., Groso, A., Stampanoni, M., & Margaritondo, G.: 3D
experimental investigation of the microstructure of cement pastes using synchrotron X-ray
microtomography (μCT). Cement and Concrete Research 37(3), 360-368 (2007).
[2] De Wolski, S. C., Bolander, J. E., & Landis, E. N.: An in-situ X-ray microtomography
study of split cylinder fracture in cement-based materials. Experimental Mechanics 54(7),
1227-1235 (2014).

66
[3] Scrivener, K. L.: Backscattered electron imaging of cementitious microstructures:
understanding and quantification. Cement and Concrete Composites 26(8), 935-945 (2004).
[4] Lu, S., Landis, E. N., & Keane, D. T.: X-ray microtomographic studies of pore structure and
permeability in Portland cement concrete. Materials and Structures 39(6), 611-620 (2006).
[5] Diamond, S., & Landis, E.: Microstructural features of a mortar as seen by computed
microtomography. Materials and Structures 40(9), 989-993 (2007).
[6] Landis, E. N., Nagy, E. N., & Keane, D. T.: Microstructure and fracture in three-
dimensions. Engineering Fracture Mechanics 70(7-8), 911-925 (2003).
[7] Landis, E. N., Nagy, E. N., Keane, D. T., & Nagy, G.: Technique to measure 3D work-of-
fracture of concrete in compression. Journal of engineering mechanics 125(6), 599-605
(1999).
[8] Landis, E. N., & Keane, D. T.: X-ray microtomography for fracture studies in cement-based
materials. In: Developments in X-Ray Tomography II, pp. 105-114. International Society
for Optics and Photonics. (1999).
[9] Landis, E. N., Zhang, T., Nagy, E. N., Nagy, G., & Franklin, W. R.: Cracking, damage and
fracture in four dimensions. Materials and Structures 40(4), 357-364 (2007).
[10] Sugiyama, T., Promentilla, M. A. B., Hitomi, T., & Takeda, N.: Application of synchrotron
microtomography for pore structure characterization of deteriorated cementitious materials
due to leaching. Cement and Concrete Research 40(8), 1265-1270 (2010).
[11] Gastaldi, D., Canonico, F., Capelli, L., Boccaleri, E., Milanesio, M., Palin, L., ... &
Stampanoni, M.: In situ tomographic investigation on the early hydration behaviors of
cementing systems. Construction and Building Materials 29, 284-290 (2012).
[12] Lewis, J. A.: Direct ink writing of 3D functional materials. Advanced Functional
Materials 16(17), 2193-2204 (2006).
[13] Duoss, E. B., Weisgraber, T. H., Hearon, K., Zhu, C., Small, W., Metz, T. R., Vericella, J.J.,
Barth, H.D., Kuntz, J.D., Maxwell, R.S. and Spadaccini, C.M.: Three‐dimensional printing
of elastomeric, cellular architectures with negative stiffness. Advanced Functional
Materials 24(31), 4905-4913 (2014).
[14] Raney, J. R., Compton, B. G., Mueller, J., Ober, T. J., Shea, K., & Lewis, J. A.: Rotational
3D printing of damage-tolerant composites with programmable mechanics. Proceedings of
the National Academy of Sciences 115 (6), 1198-1203 (2018).

67
[15] Aïtcin, P. C., Flatt, R. J. (Eds.): Science and technology of concrete admixtures. Woodhead
Publishing. (2015).
[16] Rueschhoff, L., Costakis, W., Michie, M., Youngblood, J., & Trice, R.: Additive
manufacturing of dense ceramic parts via direct ink writing of aqueous alumina
suspensions. International Journal of Applied Ceramic Technology 13(5), 821-830 (2016).
[17] ASTM C150 – Standard Specification for Portland Cement (2017).
[18] ASTM C494 – Standard Specification for Chemical Admixtures for Concrete (2016).
[19] Moini M.: Master’s thesis, University of Wisconsin-Milwaukee (2015).
[20] Landis, E. N., & Keane, D. T.: X-ray microtomography. Materials characterization 61(12),
1305-1316 (2010).
[21] Le, T. T., Austin, S. A., Lim, S., Buswell, R. A., Law, R., Gibb, A. G., & Thorpe, T.:
Hardened properties of high-performance printing concrete. Cement and Concrete
Research 42(3), 558-566 (2012).
[22] Spangenberg, J., Roussel, N., Hattel, J. H., Stang, H., Skocek, J., & Geiker, M. R.: Flow
induced particle migration in fresh concrete: theoretical frame, numerical simulations and
experimental results on model fluids. Cement and Concrete Research 42(4), 633-641 (2012).
[23] Choi, M., Roussel, N., Kim, Y., & Kim, J.: Lubrication layer properties during concrete
pumping. Cement and Concrete Research 45, 69-78 (2013).
68
QUANTITATIVE INVESTIGATION OF PROCESSING-
MICROSTRUCTURE RELATIONSHIP IN 3D-PRINTED LAMELLAR
CEMENT PASTE ELEMENTS VIA MICRO-COMPUTED
TOMOGRAPHY
This chapter contains experimental data collected by Mohamadreza Moini. Image analysis
was a collaborative effort between Mohamadreza Moini and Ahmadreza Baghaie. Data
conceptualization was a collaborative effort with Jan Olek, Jeffrey P. Youngblood, and Pablo D.
Zavattieri. The manuscript was written by Mohamadreza Moini and edited by Jan Olek, Jeffrey P.
Youngblood, and Pablo D. Zavattieri.
Highlights
The processing-microstructure relationship was investigated.
3D-printed element represented a unique patterned and connected pore microstructure,
indicating of a connected pore network.
The connected pore microstructure was found an interconnection between micro-channels
and micro-pores at the interfacial regions.
3D-printed element represented a unique patterned pore microstructure in which three
features previously reported (macro-pores, micro-channels, and interfacial micro-pores),
were found to have resided in three distinct pore volume domains.
The largest pores found in the entire 3D-printed element were larger than that of the
reference cast element (at 32-39 µm range of resolutions). In contrast, the small high-
frequency pores of the 3D-printed element were smaller than that of the cast element. The
dissimilarities indicate that 3D-printing strongly alters the microstructure.
Keywords: Macro-pores, micro-channels, interfacial micro-pores, micro-CT, 3D-printing,
hardened cement paste (hcp)
69
Abstract
Direct-ink-writing (DIW) is a 3D-printing process that provides the opportunity for
patterning the materials’ architecture in a layer-by-layer fashion. However, exploiting this
opportunity requires establishing a fundamental understanding of the relationship between the
DIW process and the resulting hardened microstructure of materials. This chapter quantitatively
investigates the microstructural phases of a 3D-printed hardened cement paste (hcp) element with
‘lamellar architecture’. A lab-based X-ray microscope (XRM) capable of two levels of
magnification (0.4X and 4X) was used to characterize the microstructure of intact 3-days old
lamellar and reference cast hcp elements.
The entire volume of 3D-printed and cast hcp elements were characterized using 0.4X
magnification corresponding to resolutions of 32.24 μm and 38.99 μm, respectively. Three
microstructural features (i.e., macro-pores, micro-channels, and interfacial micro-pores) that were
qualitatively reported (in chapter three) were found to reside in three distinct pore size domains. It
was also found that the largest pores of the 3D-printed element were larger than the largest pores
of the reference cast element. Also, the smallest high-frequency pore sizes of the 3D-printed
element were found to be smaller than those observed in the cast element. A representative region
of interest (ROI) of the 3D-printed element (selected from the center of the element containing a
micro-channel and interfacial micro-pores) was further characterized using 4X magnification
corresponding to a resolution of 4.04 µm. Analysis of microstructure at higher (i.e., 4X)
magnification of a ROI indicated that the micro-channels were connected to one another through
the macro-pores present at interfacial regions. The results indicate that 3D-printed elements have
a unique patterned and interconnected pore microstructure. Therefore, the presence of a connected
pore network in the entire microstructure of the 3D-printed lamellar element can be inferred.
4.1 Introduction
3D-printing process allows patterning of the cement-based materials in three dimensions and
thus achieving novel and enhanced mechanical responses [1–6]. In patterning the materials, 3D-
printing process also alters the materials’ microstructure. For example, several studies on the
hardened microstructure of 3D-printed cement-based materials have reported that layer-by-layer
3D-printing processes resulted in formation of interfaces between deposited filaments and lesser

70
amount of hydration products [7,8]. Moreover, it was revealed that changes in processing
parameters such as increase of printing speed and time gap between the layers increased the
porosity of 3D-printed hardened cement-based materials [8,9]. A few other studies have indirectly
investigated the microstructural characteristics of the interfaces between the layers by (altering
processing parameters and) mechanically characterizing the bond strength of the deposited
filaments [8–10]. These limited studies insightfully inform us of a processing-microstructure
relationship and mechanical characteristics of the interfaces in 3D-printed cement-based materials.
This chapter focuses on micro-computed tomography (µ-CT) characterization technique to
quantitatively investigate the processing-microstructure relationship in 3D-printed hardened
cement paste (hcp) elements with ‘lamellar architecture’. Specifically, three of the microstructural
features (i.e., macro-pores, micro-channels, and interfacial micro-pores) qualitatively reported by
authors in the past [7] have been analyzed in this chapter. An image analysis was performed on
the slice images of the entire 3D-printed and reference cast elements obtained from the X-ray
microscope (XRM) at 0.4X magnification. The pore size and pore frequency of these three pore
types of 3D-printed lamellar element were analyzed using an image analysis technique and
compared to a reference cast element. Similarly, an image analysis was conducted on the slice
images of a representative region of interest (ROI) obtained from a 4X magnification. The results
indicate that 3D-printed elements have a unique patterned and interconnected pore microstructure.
4.2 Materials and Methods
4.2.1 3D-Printing, Slicing, and Design
A 3D printer capable of printing cement paste via layer-by-layer extrusion process with two
separate units was previously established by the authors and was used in this work [7]. A standard
Nordsen nozzle (gauge 15 with 1.36. I.D.) was used for depositing materials with a width of 1.63
mm. Similarly, a commercially available slicer (Simplify3D) was used to generate the G-code
commands. A slicing procedure was previously established by the authors and was used in this
work [7]. To design the printing paths in order to achieve the desired lamellar element, a cubical
3D object (25x25x25 mm cube) was inserted in the slicer and the geometrical parameters
(including filament height, width, and orientation at each layer) and processing parameters (such
as printing speed, extrusion multiplier, and infill percentage). A continuous printing path in each

71
layer was designed to create lamellar element as shown in Figure 4.1a. To achieve a toolpath for
solid specimens (as shown in Figure 4.1b), 100% infill was used. A layer height (filament height)
of 1.00 mm and the extrusion width of 1.63 were specified in the slicer (using a nozzle with of I.D.
of 1.36 mm). The specified printing speed was 250 mm/min., resulting in a speed of 93 s per layer.
Each layer was exposed to the environment for a duration between 9.6 s to 186 s. A schematic
cross-section of the lamellar element was shown for clarity in Figure 4.1c. The resulting 3D-
printed lamellar element was shown in Figure 4.1d.
Figure 4.1. Schematics of printing path and resulting 3D-printed specimen with lamellar
architectured element: (a) schematics of printing path of individual layers of lamellar
architecture; (b) schematics of printing path of the entire element; (c) schematics of cross-section
of the lamellar element; and (d) resulting 3D-printed lamellar element.
4.2.2 Ink Design, Mixing Procedure, and Curing
The final ink used in this work consisted of the sub-150 μm fraction of commercially
available Type I cement (ASTM C150 [11]) obtained from Buzzi Unicem, USA; deionized water;
HRWRA (MasterGlenium 7700), and VMA (MasterMatrix 362). For each 250.0 grams of cement,
65.2, 1.1 and 3.0 grams of deionized water, HRWRA and VMA were used, respectively. A mixing
and materials handling procedure using Twister Evolution Venturi vacuum mixer was previously
developed by authors and was used in this work [10]. The specimens were 3D-printed and cast in
a lab environment at 18 ± 3 °C and 45 ± 5 % relative humidity. Immediately after printing (or
casting), the specimens were placed in a curing container in which the temperature of 18 ± 3 °C
and the relative humidity of 93 ± 2 % (by using a saturated solution of potassium nitrate) was kept
constant for 3 days when the specimens were taken out of the curing chamber for micro-CT
characterization.
72
4.2.3 Micro-Computed Tomography (Micro-CT) of the Elements
In this study, a Zeiss Xradia 510 Versa XRM was utilized for microstructural
characterization of both 3-days old 3D-printed and cast specimens, which allowed for an increase
in the resolution of scans through a dual-stage magnification process. The microstructure of 3D-
printed lamellar element and cast element was characterized using 0.4X magnification scans. This
initial stage was established via geometric magnification, which involved setting distances
between the source, detector, and specimen (as in conventional micro-CTs). The 3D-printed
lamellar element was then assessed using 4X magnification scan to achieve a higher resolution
and a closer look at the morphology of the microstructure of printed elements. This second stage
was enabled by optical magnification was enabled at the detector system through scintillator and
objective lenses. The lower resolution of 0.4X magnification (38.99 μm for cast and 32.24 μm for
lamellar element) allowed for identification and quantification of two microstructural phases (i.e.,
solid and pores) and the higher resolution of 4X magnification (4.04 μm for lamellar element)
allowed identification of three microstructural phases (i.e., hydrated cement paste, anhydrous
grains, and pores). A representative region of interest (ROI) encompassing two adjacent filaments
and three adjacent layers was selected at the higher resolution scan to encompass a representative
microstructure including an interface between the layers. The data was then used to conduct a
quantitative analysis of the microstructure of cast and 3D-printed elements using image processing
techniques. Dragonfly software was used for post-processing and visualization of the 2D and 3D
images as well as for extraction of 2D images for image analysis.
4.2.4 Image Analysis
Image analysis was performed to quantify the distinct phases of the microstructure and their
volumetric frequency distribution of the cast (collected during 0.4X scan) and 3D-printed lamellar
element (collected during both 0.4X and 4X scan) K-means clustering has been a widely used
method suitable for data clustering applications such as image segmentation [12]. This method, in
contrast to conventional intensity thresholding (in which the threshold was specified by the user
and applied to the image), uses intensity thresholding in a dynamic manner. In K-means clustering,
the number of clusters was specified by the user and the algorithm finds the best threshold(s) to
minimize the distance between the intensity of each pixel to its nearest cluster center. Therefore,
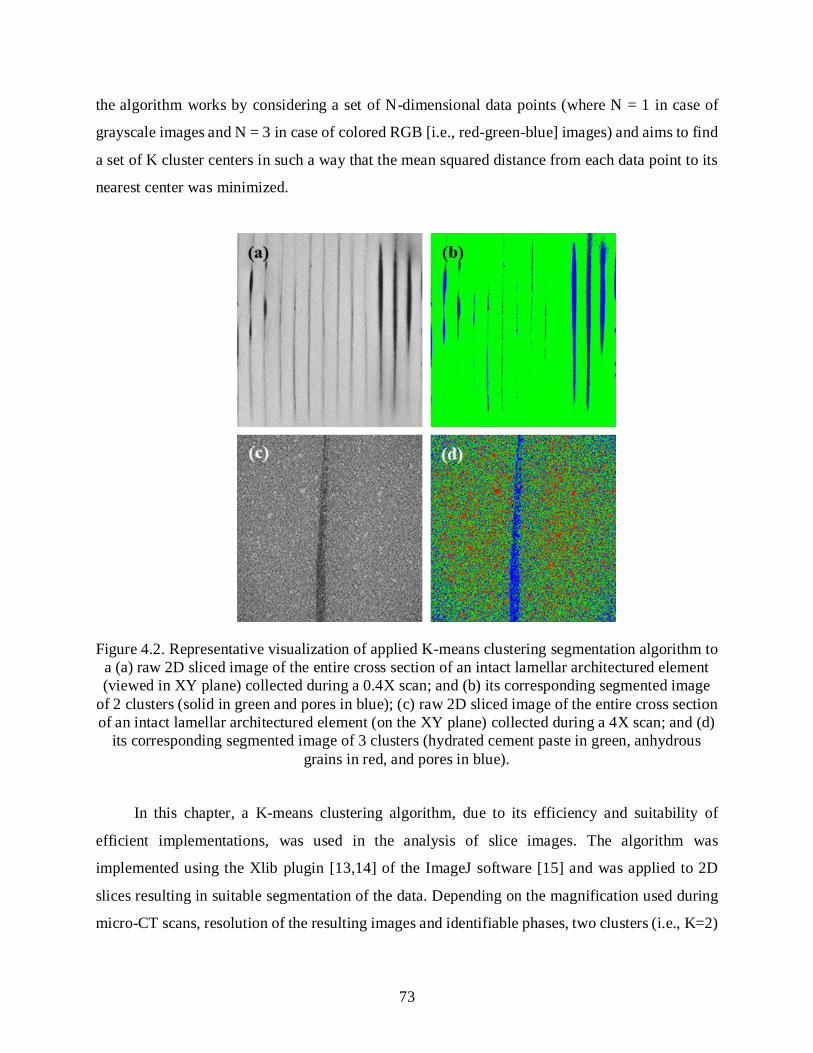
73
the algorithm works by considering a set of N-dimensional data points (where N = 1 in case of
grayscale images and N = 3 in case of colored RGB [i.e., red-green-blue] images) and aims to find
a set of K cluster centers in such a way that the mean squared distance from each data point to its
nearest center was minimized.
Figure 4.2. Representative visualization of applied K-means clustering segmentation algorithm to
a (a) raw 2D sliced image of the entire cross section of an intact lamellar architectured element
(viewed in XY plane) collected during a 0.4X scan; and (b) its corresponding segmented image
of 2 clusters (solid in green and pores in blue); (c) raw 2D sliced image of the entire cross section
of an intact lamellar architectured element (on the XY plane) collected during a 4X scan; and (d)
its corresponding segmented image of 3 clusters (hydrated cement paste in green, anhydrous
grains in red, and pores in blue).
In this chapter, a K-means clustering algorithm, due to its efficiency and suitability of
efficient implementations, was used in the analysis of slice images. The algorithm was
implemented using the Xlib plugin [13,14] of the ImageJ software [15] and was applied to 2D
slices resulting in suitable segmentation of the data. Depending on the magnification used during
micro-CT scans, resolution of the resulting images and identifiable phases, two clusters (i.e., K=2)

74
(in case of 0.4X scans as depicted in Figure 4.2a) or three clusters (K=3) (in case of 4X scans as
depicted in Figure 4.2b) was used for segmentation. The results of segmentation were
representatively shown in Figure 4.2c,d, for K=2 and K=3, respectively. The segmented images
were used for quantification of the total volume of each of the phases (i.e., clusters) of the
microstructure and as well as the visualization of the range of intensities of each phase on a
histogram. In-house MATLAB (The MathWorks, Inc., United States) codes were developed to
compute and quantify the amount (i.e., the number of voxels of each cluster of the scanned volume)
of connected components along with the volumetric frequency distribution of disconnected pore
clusters. This procedure was applied to images of both 3D-printed lamellar (at 0.4X and 4X scans)
and cast (at 0.4X scan) elements.
4.3 Results
4.3.1 Micro-CT Characterization of the Entire Lamellar and Cast Elements (0.4X Scan)
The quantifications of pore and solid phase of the cast and 3D-printed lamellar elements
from the 0.4X magnification were presented in Figure 4.3. The 3D rendition of the cast and 3D-
printed lamellar elements were shown in Figure 4.3a1 and Figure 4.3a2, respectively. Based on
the entire scanned volumes and the resolutions used (38.99 μm for cast and 32.24 μm for 3D-
printed lamellar elements), a recognizable difference can be qualitatively observed in the overall
arrangement of the pores between the cast and lamellar elements. The contrast between the two
microstructures was illustrated in two dimensional raw slice images of the cast (Figure 4.3b1) and
3D-printed elements (Figure 4.3b2) as well as their corresponding segmented images (Figure
4.3c1 and Figure 4.3c2) analyzed using the K-means clustering technique. This approach resulted
in quantification of the intensities of the pore and solid phase for cast and printed elements as
illustrated in Figure 4.3d1 and Figure 4.3d2, respectively. The total volumes of pores and solid
phase in the cast and 3D-printed lamellar elements as shown in Figure 4.3e1 and Figure 4.3e2,
respectively. The total amount of porosity was found to be higher (3.5%) in the 3D-printed element
compared to the cast counterpart (0.9%), as viewed in Figures 4.3.d1-e2. The volumetric
frequency distribution of the pore phase (obtained from the entire volume) of the cast and 3D-
printed elements were shown in a frequency plot in Figure 4.3f, revealing the volume of each
connected pore pockets versus their corresponding frequency. The ‘connected pore pockets’

75
demonstrated at any given data point in Figure 4.3f represents the volume of the voxels of every
pore pocket that were connected to one another and isolated from the other pockets.
The frequency plot shown in Figure 4.3f demonstrates that a wide range of porosity from small
pores (< 107 µm3) with very high frequencies (>101 - 105) to large pores (>108 µm3) with very small
frequency (=1) resides in microstructures of both cast and 3D-printed lamellar elements. However,
the two microstructures were dissimilar in that (i) the largest pores (specifically the first 20 large
pores) of 3D-printed element was larger the largest pores of the cast element and (ii) the frequency
of small pores in the 3D-printed lamellar element was smaller compared to the cast element
(Figure4. 3f).
To clarify the former, the first ten largest pore volumes with single frequencies can be
compared, as pointed out with blue and black arrows for the 3D-printed lamellar and cast elements
respectively in the bottom right corner of Figure 4.3f. More specifically, the largest pore volume
of the 3D-printed element holds a volume of 29.09 mm3, where the largest pore volume of the cast
element begins to appear only occupy 3.98 mm3, indicating that the largest pore volume of the 3D-
printed lamellar element was more than 7 times larger than the largest pores of the cast element.
To clarify the latter, the smallest pore volume of the 3D-printed lamellar element (31246 µm3),
with the frequency of 1.07 × 10⁵ can be compared the smallest pore volume of the cast element
(54340 µm3) as shown by dashed arrows on the left-hand side of the Figure 4.3f. At the constant
and highest frequency, the 3D-printed lamellar element inhabit pore volumes smaller in size
compared to that of the cast element. This contrast does not only exist at the highest frequencies.
The cast and 3D-printed elements each contained relatively close number of individual isolated
pore pockets (i.e., 541 in the cast and 525 in the 3D-printed lamellar element) represented by the
number of data points in Figure 4.4g. This data indicated the continuity and intermix of the pore
phase was similar in the hardened microstructure of the cast and 3D-printed lamellar element.
However, the distribution of the isolated individual pore volumes shown in the frequency plot data
points (Figure 4.3f) importantly marks the contrast in the range of pore volumes in 3D-printed
lamellar (between of 29.09 mm3 to 31245 µm3) and cast (between 3.98- 54340 µm3) elements.

76
Figure 4.3. Comparison of the microstructure and quantification of phases in the entire cast (a1-
e1,f) and 3D-printed lamellar (a2-e2,f) hardened cement paste elements using 588 and 714 slices
captured during a 0.4X CT scan, respectively: (a1,a2) three-dimensional rendition of the entire
volume of the elements; (b1,b2) two typical raw slice images; (c1,c2) two typical slice images
processed using K-means segmentation technique; (d1,d2) histograms of pore (blue), and solid
(green) phases; (e1,e2) total volumetric percentages of pore and solid phases; and (f) frequency
plot of pore phases (frequency of given pore volume) of the entire volume of the elements.

77
Figure 4.3e1,e2 demonstrates that about 3.5 % and 0.9% of volumes of, respectively, 3D-printed
and the cast elements was occupied by pores. Majority of these pores in both elements were
occupied by relatively infrequent larger pores as shown at the right-hand side of Figure 4.3f. More
precisely, the analysis of frequencies of appearance shows that the pores with a frequency of 1
make up 96.16% of total pore volume in 3D-printed lamellar element whereas they only make up
64.88% of the total pore volume in cast elements. Such dissimilarities in the microstructure of 3D-
printed lamellar and cast elements indicate that the 3D-printing process reduces the amount of very
small pores (i.e., micro-pores) in the hcp compared to traditional casting process. This may be due
to the expulsion of air bubbles to the surface of the materials during the pressurization in the
syringe and/or during the extrusion at the tip of nozzle. Since there was a higher population of
those pores in the 3D-printed elements at the vicinity of the interfacial regions (see Figure 4.3c2),
it is also likely that smaller pores could have coalesced to form slightly larger pores, a phenomenon
that is less likely to occur during the casting process.
To compare the median values of pore volumes in 3D-printed and cast elements (Figure
4.3f), a ‘V50’ was considered. The data was analyzed considering V50 volume, defined as the pore
volume up to which the sum of the pore volumes (from either end of frequency plot) were equal.
In this analysis, the first 9 large pore volumes of the 3D-printed element occupied a cumulative
volume of 176.95 mm3 (which was equal to the total volume occupied by the remaining 516 pores
of smaller volumes). The median values of pore volume for these two groups was V50 = 10.81 mm3.
On the other hand, the 48 largest pores of the cast elements occupied only 37.75 mm3 (which was
equal to a cumulative volume occupied by the remaining 493 smaller pores). The corresponding
median values of pore volume for these two groups was V50 = 0.18 mm3. The two median values
of pore volumes (V50) for the 3D-printed and cast elements are shown in Figure4.3f as two thick
blue and black double line arrows. To put the differences in pore volumes in perspective, it takes
the total volume of the 19 largest pores in the cast element to equate the volume occupied by the
single largest pore in the lamellar element. The comparison of the small, large, and median pore
volumes of the 3D-printed and cast elements discussed here is also summarized in Table 1.

78
Table 4.1. Comparison of the pore volumes of 3D-printed (lamellar) element and cast element
based on the frequency plot presented in Figure 4.3f, collected during a 0.4X magnification.
0.4X Magnification 3D-Printed Lamellar Cast
Largest pore 29.09 mm3 3.98 mm
3
Smallest pore* 3.12 × 10⁻⁵
mm3 5.43 × 10
-5 mm
3
Frequency of pore with largest volume 1 1
Frequency of pores with smallest volume 9.21 × 10⁴ 1.07 × 10
5
V50 10.81 mm
3 0.18 mm3
*pores smaller than this volume cannot be seen due to limitations in the resolutions of the
instrument at 0.4X magnification
4.3.2 Analysis of the Categories of Pores in 3D-Printed Lamellar Element (0.4X Scan)
Three categories of pores (i.e., macro-pores, micro-channels, interfacial micro-pores have
been previously reported by authors [7] and are schematically illustrated in Figure 4.4. However,
the volumetric distribution of these pores was unclear. To identify volumes of these three
categories of pores in view of the volume frequency distribution presented in Figure 4.3.f, further
analysis was conducted.
Macro-pores were previously discussed to appear in the form of visible gaps between the
filaments (with a width larger than 100 µm), which resulted from inconsistencies during the 3D-
printing process such as thinning of the filaments) [7]. The macro-pores were marked in two yellow
boxes shown in Figure 4.3.a2 and identified by the black solid arrow in 2D image in Figure 4.3.c2.
From the geometrical measurements conducted on the slice images obtained from micro-CT, the
largest and smallest macro-pores can be roughly estimated to have the width varying from about
100 µm to 800 µm, the height varying from 500 µm to 1500 µm, a length varying from 1000 µm
to 17,000 µm. These dimensions correspond to estimated volumes in the range between 0.05 mm3
and 20.40 mm3, respectively. The upper bound of this estimation (20.40 mm3) was lower than the
volume of the largest pore, quantified from image analysis (29.09 mm3). Since the volume obtained
from the image analysis was considered to be more accurate, that volume was taken as the upper
bound for the volume of macro-pores. The upper bound and lower bound of the volume of the

79
macro-pores are shown as labels placed over the horizontal arrows located at the top of the Figure
4.3f.
Figure 4.4. (a) schematics of the arrangement of filaments in the cross-section of the lamellar
element and (b) Visualization of representative examples of macro-pores, micro-channels, micro-
pores, and interfacial regions.
Micro-channels have been previously discussed [7] as the pores present between at the
interface between the adjacent filaments (i.e., at the interfacial regions) and oriented along the
length of the filaments as indicated by the black dashed arrow shown in Figure 4.3c2. From the
geometrical measurements conducted on slice images, it is known that micro-channels had a
typical width and height of up to 100 µm. Assuming such square cross-section, and a length
varying between the entire length of the lamellar element (25000 µm) down to a very small length
on the order of 100 µm (based on the measured width for a typical micro-channel), the pore volume
occupied by the largest micro-channel can be estimated to be between 0.001 mm3 to 0.25 mm3.
This analysis provides the range of the pore volumes associated with micro-channels as shown
over the top arrows by the labels placed above the horizontal arrows located at the top of Figure
4.3f.
As discussed in this chapter, the interfacial micro-pores are considered to be isolated pores
(located at the interfacial regions) smaller than micro-channels that were identifiable at the

80
achievable resolutions provided by 0.4X magnification (38.99 μm for cast and 32.24 μm for
lamellar elements). To locate the range of pore volumes at which micro-pores reside in the
frequency plot based on the 0.4X magnification, the pores smaller than 0.001 mm3 (which was the
lower bound of estimated pore volume of micro-channels) was taken as the upper bound. The
lower bound of volume of micro-pores was taken from the actual smallest pore volume identifiable
from image analysis (3.12 × 10⁻⁵
mm3
equal to 31246 µm3). This analysis provides the pore
volume range at which micro-pores can be present at the given frequency as shown over the top
arrows by the labels placed above the horizontal arrows located at the top of Figure 4.3f. The
analysis of the three pore types and their corresponding range of volumes in the 3D-printed
lamellar element is also summarized in Table 4.2.
Table 4.2. Analysis of the pore types and their corresponding range of volumes in 3D-printed
(lamellar) element and cast element based on the frequency plot presented in Figure 4.3f,
collected during 4X magnification
3D-Printed Lamellar Element
(4X Magnification) Largest Volume Smallest Volume
Macro-pore volume range 29.09 mm3 5 × 10
-2 mm
3
Micro-channel volume range 2.5 × 10⁻¹
mm3 1 × 10
-3 mm
3
Micro-pore volume range 1 × 10⁻³
mm3 3.12 × 10
-5 mm
3
It must be noted that, interfacial micro-pores are difficult to identify and quantify using 4X
magnification data. Further details regarding interfacial micro-pores are discussed in section 4.3.3.
However, it must be noted here that ‘interfacial’ micro-pores in the 3D-printed lamellar element
(as will be confirmed in Figure 4.5) prevalently resided in interfacial regions at high amounts (due
to the formation of lubricating layer) [7]. However, micro-pores can also be present in the bulk
part of the material (i.e., within the filaments). This type of micro-pore were the isolated pores that
can exist throughout the filament of hcp microstructure away from interfacial regions. In this
chapter the term ‘interfacial micro-pores’ specifically refers to the micro-pores present at the
interfacial regions, and the term ‘micro-pores’ generally refers to both types of pores near the
interfacial regions or in the filaments. The fact that micro-pores resided in interfacial regions have
already been qualitatively described in chapter two and attributed to the formation of lubricating

81
layer. This lubricating layer exists at the exterior of the filaments due to the formation of water-
rich layer. Therefore, this process can leave behind larger amounts of porosity at the interfacial
regions, upon evaporation of water during 3D-printing and upon solidification as compared to the
core of the filament. The authors have previously hypothesized about the connectivity between the
micro-channels and surrounding interfacial micro-pores [7]. A qualitative analysis of the
tomography data with 4X magnification is further discussed in section 4.3.3.
4.3.3 Micro-CT Characterization of a Region of Interest (ROI) in 3D-Printed Lamellar
Element (4X Scan)
To examine the connectivity between the micro-channels and interfacial micro-pores, the
quantifications of pore and solid phases (hydrated and anhydrous) at a region of interest (ROI) in
the 3D-printed lamellar element was investigated using 4X magnification tomography data
(Figure 4.5). The 3D volume of rendition of the entire 3D-printed lamellar element is shown in
Figure 4.5a. From this volume, a cylindrical ROI containing 2 adjacent filaments stacked in
multiple layers was selected for a 4X scan corresponding to the resolutions of 4.04 μm (Figure
4.5b). Quantitatively, a discernable connectivity between the micro-channels at the interfacial
regions of filaments was noticeable as previously discussed by authors in detail [7]. Within the
scanned ROI, a cubical volume of 1.65x1.65x1.65 mm was selected for conducting image analysis
(as shown in red cube in Figure 4.5b). The cubical volume contained one micro-channel at the
interfacial region in the middle of the cube and it is bound by the mid-planes of the adjacent
filaments throughout the width and height (i.e., it is bound by the planes located at the centers of
the core of the filaments). This cubical volume was selected in way that included a micro-channels
and surrounding interfacial micro-pore (i.e., micro-pores located at the interfacial regions), and
excluded macro-pores. A 2D view of a typical cross-section of the cubical volume is illustrated in
raw slice image shown in Figure 4.5c. Using K-means segmentation technique resulted in
quantification of the intensities of the three distinct phases (i.e., pores, hydrated solid, and
unhydrated solid) in the cubical volume within ROI as illustrated in Figure 4.5e. Hardened cement
paste was composed of many crystalline phases including both unreacted phases and agglomerated
hydration products (calcium–silicate–hydrate gel and calcium hydroxide) [17]. Due to limited
resolution of the instrument used in this study, it was not possible to identify the individual
hydration products. The total volume of the pore phase, hydrated phases, unhydrated cement grains

82
was analyzed (Figures 4.5f). The result of this analysis revealed the following volumes of pores
= 26%, hydrated = 51%, and unhydrated cement = 23%. It should noted, however, that the reported
porosity (26%) contains pores located at both, the interfacial regions and inside the filaments.
Figure 4.5. Quantification of phases of the microstructure of a representative region of interest of
intact 3D-printed lamellar hardened cement paste element using 403 slices captured during a 4X
CT scan: (a) three-dimensional rendition of the entire volume of the element; (b) three-
dimensional rendition of representative region of interest (ROI); (c) a typical raw slice image
from the representative region; (d) a typical slice image processed using K-means segmentation;
(e) histogram of pore (blue), hydrated (green), and anhydrous (red) phases; (f) volumetric
percentage of each phase; and (g) Frequency plot (frequency of given pore volume) of the entire
representative region (i.e., sliced images).

83
Even more important, was the volumetric frequency distribution of all three phases as shown
in the frequency plot in Figure 4.5g. In this figure, every data point represents the frequency of
voxels associated with each of the connected phases. These voxels are isolated from the voxels
representing other pockets of the corresponding phases. It can be briefly summarized that the left-
hand side of the frequency plot contains the smaller and more frequent volumes of each phase,
whereas the right-hand side contains single connected volume of each phase. In other words, the
frequency plot shown in Figure 4.5g demonstrates that in each case, there was consistently one
very large connected volume, presented by one single data point on the right-hand side of the
frequency plot, and smaller isolated volumes, presented by high-frequency data points on the left-
hand side. As shown with the green, blue, and red vertical solid arrows located at the bottom right
position of Figure 4.5g, one large connected volume of each phase (pore, hydrated, and anhydrous)
was singled out and resided between 1 mm3 to 10 mm3 on the volume axis. This single large volume
as shown in Figure 4.5g, corresponds to 7.36 mm3 hydrated phase (shown in green), 3.79 mm3
pore phase (shown in blue), and 3.23 mm3 anhydrous phase (shown in red). These single large
volumes make up almost the entire total volume of corresponding phases. Specifically, 99.99%,
99.34%, and 97.42% of the hydrated phase, pore phase, and anhydrous phase were composed of
the one single largest volume mentioned above. As can be viewed on the X-axis of Figure 4.5g,
the 2nd largest pore volume was 4, 5, and 6 orders of magnitude smaller than of the larges pore
volume of the anhydrous, pore, and hydrated phases, respectively. These data indicate the presence
of one large connected volume of each phase. Table 4.3 contains the summary of the comparison
of the largest and smallest volumes of each phase based on the frequency plot presented in Figure
4.5g.
Other than the volume frequency distribution, the number of isolated pockets of each phase
(i.e., the number of points in each phase in Figure 4.5g) also revealed interesting information. The
pore, hydrated, and anhydrous phases, each contained 102, 34, and 479 individual isolated pockets
(as represented by the number of data points of each phase shown in Figure 4.5g). The smaller the
number of isolated pockets, the more continuous the phase is. Therefore, the number of individual
isolated pockets provide a measure of the continuity and intermix of each phase of the hardened
microstructure. Also, the smallest detected individual isolated volume at 4X magnification was
equal to the smallest voxel size of 63.50 µm3. The frequency analysis of each phase at this voxel
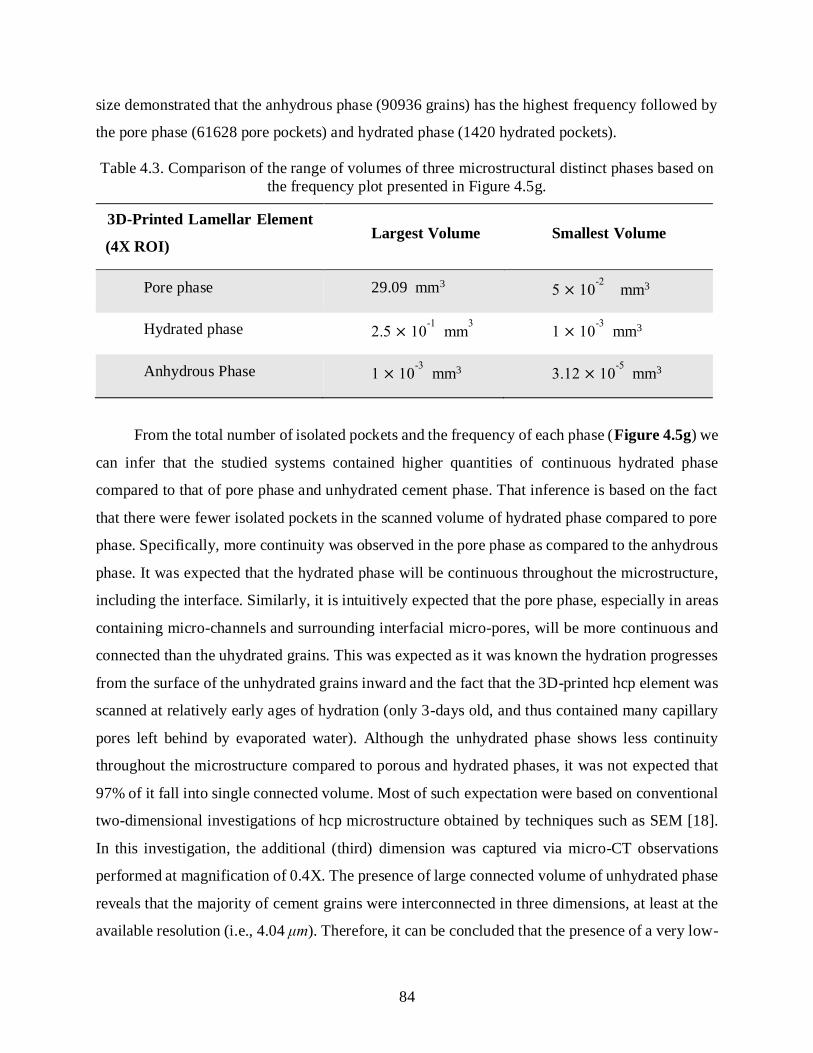
84
size demonstrated that the anhydrous phase (90936 grains) has the highest frequency followed by
the pore phase (61628 pore pockets) and hydrated phase (1420 hydrated pockets).
Table 4.3. Comparison of the range of volumes of three microstructural distinct phases based on
the frequency plot presented in Figure 4.5g.
3D-Printed Lamellar Element
(4X ROI) Largest Volume Smallest Volume
Pore phase 29.09 mm3 5 × 10⁻²
mm3
Hydrated phase 2.5 × 10⁻¹
mm3 1 × 10
-3 mm3
Anhydrous Phase 1 × 10⁻³
mm3 3.12 × 10⁻⁵
mm3
From the total number of isolated pockets and the frequency of each phase (Figure 4.5g) we
can infer that the studied systems contained higher quantities of continuous hydrated phase
compared to that of pore phase and unhydrated cement phase. That inference is based on the fact
that there were fewer isolated pockets in the scanned volume of hydrated phase compared to pore
phase. Specifically, more continuity was observed in the pore phase as compared to the anhydrous
phase. It was expected that the hydrated phase will be continuous throughout the microstructure,
including the interface. Similarly, it is intuitively expected that the pore phase, especially in areas
containing micro-channels and surrounding interfacial micro-pores, will be more continuous and
connected than the uhydrated grains. This was expected as it was known the hydration progresses
from the surface of the unhydrated grains inward and the fact that the 3D-printed hcp element was
scanned at relatively early ages of hydration (only 3-days old, and thus contained many capillary
pores left behind by evaporated water). Although the unhydrated phase shows less continuity
throughout the microstructure compared to porous and hydrated phases, it was not expected that
97% of it fall into single connected volume. Most of such expectation were based on conventional
two-dimensional investigations of hcp microstructure obtained by techniques such as SEM [18].
In this investigation, the additional (third) dimension was captured via micro-CT observations
performed at magnification of 0.4X. The presence of large connected volume of unhydrated phase
reveals that the majority of cement grains were interconnected in three dimensions, at least at the
available resolution (i.e., 4.04 μm). Therefore, it can be concluded that the presence of a very low-

85
frequency (i.e., one) large connected volume for each of the phases (in contrast to the presence of
isolated high-frequency smaller pore volumes) shown in Figure 4.5g indicates the continuity and
intermixing of all three phases in three dimensions.
It must be noted that the volumetric range at which the majority of the isolated volumes of
each phase (other than the largest single volumes of each phase exist), was also different between
the three phases as indicated by the top arrows shown in Figure 4.5g. While the lower bound of
this range was limited by the resolution, the upper bound varies significantly between the phases,
further indicating the higher levels of homogeneity and intermix in the hydrated phase and lower
levels of continuity in the anhydrous phase discussed above. The difference in the frequencies
between the three phases reveals the same information as the Figure 4.5g frequency plot – i.e.,
that small anhydrous grains exist at higher frequencies compared to pore pockets, and both
anhydrous and pore pockets were present at much higher frequencies than hydrated pockets. This
was intuitive and also further verifies the hypothesis that there would be more continuity in the
hydrated phase than in the pore and anhydrous phase.
Most importantly, in the case of pore phase, the presence of a single large pore indicates that
the micro-channels (illustrated in Figure 4.3b2,c2 based on the data obtained from the 0.4X scan
of the entire volume of lamellar element) were found interconnected to one another (at this given
resolution) through the micro-pores present at the interfacial regions.
Pore volume occupied 26% of the total volume of the cubical element within ROI. From this
26%, about 99.34% (i.e., 25.82%) makes up a single connected pore volume equal to 3.79 × 10⁹
µm3. As shown by previous qualitative analysis of representative ROI [7], this region contained
both a micro-channel and micro-pores. One can speculate about the interconnectivity between the
micro-channels through the presence of interfacial micro-pores. However, in order to
quantitatively prove such interconnectivity, the connectivity between micro-channel and the
interfacial micro-pores must be first proven. Using geometrical measurements performed on the
2D images. One can reasonably assume an average width 100 μm for both the micro-channel and
the surrounding interfacial micro-pores. Given the height and depth of the analyzed cubical volume
within ROI (i.e., 1650 μm x 1650 μm), a ‘connected’ vertical pore volume of 0.27 × 109 µm3 at
the interface can be estimated. A similar analysis can be done on the ‘connected’ horizontal pores
resulting in a volume of 0.27 × 109 µm3. Therefore, a ‘connected’ pore interfacial volume of 0.54
× 109 µm3 is estimated and is occupied by micro-channel and surrounding interfacial micro-pores.

86
This volume, occupied by the micro-channel and surrounding interfacial micro-pores (0.54 × 10⁹
µm3) was still relatively smaller compared to the single connected pore volume obtained from
image analysis (3.79 × 10⁹). In other words, assumptions of more-or-less realistic dimensions for
the micro-channel and interfacial micro-pores resulted in an overall volume of the pores being
lower than the volume of a single connected pore obtained from image analysis. Based on these
discrepancies, conclusions can be reasonably drawn as follow: (i) the micro-channel and micro-
pores (present at the surrounding interfacial regions) that were assumed to be connected are indeed
connected. In other words, because (as shown in Figure 4.5g) there are no data points that can
represent the single micro-channel contained in the analyzed cubical element, we can deduce that
the connectivity between micro-channel and the interfacial micro-pores is proven. Beyond that,
we can also conclude that (ii) the micro-channel interconnected with the surrounding interfacial
micro-pores were to some degree also connected to the pores inside the filament. Supporting the
second conclusion requires further analysis of the microstructural characteristics of the filament
alone. The presence of wider range of pores on the left-hand-side of Figure 4.5g, also implies that
the certain pores inside the filaments (as can be seen as the blue dots in Figure 4.5d) were isolated
from the interconnected micro-channel and surrounding interfacial micro-pores. Therefore, based
on the cubical volume analyzed, the micro-channels were demonstrated to be interconnected
through the macro-pores present at the interfacial regions. Also, due to the ramdon and aribirtary
selection of the location of the ROI, it can be concluded that the entire volume of the material
located outside of the analyzed cubical volume is interconnected through the porosity located
between the micro-channels.
Due to limits of the magnification of micro-CT imaging it can be expected that there were
pores that could not be detected at this resolution (4.04 µm) and that seemingly disconnected pore
pockets could indeed be interconnected.
4.4 Summary and Conclusion
This chapter presents, the results of quantitative evaluation of the microstructure of 3-days-
old 3D-printed hardened cement paste element with lamellar architecture. The data used in the
analysis were generated using an XRM operated at two magnifications (0.4X and 4X). These
magnifications yield resolutions of corresponding to ~32.24-38.99 µm and 4.04 µm, respectively.
The 3D-printed element demonstrated a significantly dissimilar pore volume distribution and

87
morphology, the result of the 3D-printing process. The porosity in 3D-printed lamellar element
(including macro-pores, micro-channels, and interfacial micro-pores) was found to be
preferentially aligned with the printing pattern (i.e., orientation of filaments) and was highly
heterogeneously distributed. This type of porosity was distinctively different from the spherical
pores with a random distribution observed in the microstructure of cast element. The larger pores
of the 3D-printed element were found to be larger than the largest pores of the cast element.
Furthermore, the smallest pores of the 3D-printed element were found to be less frequent than
similar pores in cast element. The analysis of the frequencies shows that the pores with a frequency
of 1 make up 96.16% of total pore volume in 3D-printed lamellar element whereas the pores with
a frequency of 1, only make up 64.88% of the total pore volume in cast elements. This finding
indicates that the connected pore network makes up the majority of the total quantifiable porosity
present in the entire 3D-printed lamellar element. The three categories of pores (i.e., macro-pores,
micro-channels, and interfacial micro-pores) were found to reside in three distinct pore size
domains.
Analysis of microstructure at higher (i.e., 4X) magnification of a ROI indicated that the
micro-channels were connected to one another through the macro-pores present at interfacial
regions. These two make up the majority of the total porosity (99.34%) observed at this
magnification, The rest of the porosity consisted of the individual isolated pores that exist inside
the filaments. Therefore, it can be concluded that the entire microstructure of 3D-printed lamellar
elements consists of a connected porous network.
In summary, the 3D-printed elements created via the DIW process contain unique patterned
and interconnected pore network. The presence of such connected network may offer the
opportunity to control the mechanical response of the brittle elements by changing the pattern
(orientation) of the region of high porosity. Specifically, the locally weaker regions may facilitate
the formation and spread of the cracks and microcracks, thus postpone or even prevent formation
or coalescence of a single crack, and resulting brittle behavior. The question remains how to
achieve isotropic mechanical response and to ensure the durability of elements containing
preferentially oriented network of pores.

88
4.5 Acknowledgments
I gratefully acknowledge the generous support of this research by the National Science
Foundation (CMMI Grant 1562927). I would also like to thank the BASF chemicals company for
providing materials. I would also like to thank the 2017 Major Multi-User Equipment Program,
offered by the Office of the Executive Vice President for Research at Purdue University, for
supporting the acquisition of the X-ray microscope (micro-CT) used in data reviewed in this
research.
4.6 References
[1] V. Mechtcherine, F.P. Bos, A. Perrot, W.R. Leal, V.N. Nerella, S. Fataei, R.J.M. Wolfs, M.
Sonebi, N. Roussel, Cement and Concrete Research Extrusion-based additive
manufacturing with cement-based materials – Production steps , processes , and their
underlying physics : A review, Cem. Concr. Res. 132 (2020) 106037.
doi:10.1016/j.cemconres.2020.106037.
[2] T. Wangler, N. Roussel, F.P. Bos, T.A.M. Salet, R.J. Flatt, Cement and Concrete Research
Digital Concrete : A Review, 123 (2019). doi:10.1016/j.cemconres.2019.105780.
[3] T. Wangler, R.J. Flatt, First RILEM International Conference on Concrete and Digital
Fabrication – Digital Concrete, 2018.
[4] B.N. Sanjayan, Jay G., Ali Nazari, ed., 3D Concrete Printing Technology: Construction and
Building Applications, Butterworth-Heinemann, 2019.
[5] S. Lim, R.A. Buswell, T.T. Le, S.A. Austin, A.G.F. Gibb, T. Thorpe, Developments in
construction-scale additive manufacturing processes, Autom. Constr. 21 (2012) 262–268.
doi:10.1016/j.autcon.2011.06.010.
[6] J.D. Silva, W.R. Leal de, S.Z. Jones, 3D printing using concrete extrusion: a roadmap for
research, Cem. Concr. Res. (2018) (this issue). doi:10.1016/j.cemconres.2018.05.006.
[7] M. Moini, J. Olek, B. Magee, P. Zavattieri, J. Youngblood, Additive Manufacturing and
Characterization of Architectured Cement-based Materials via X-ray Micro-Computed
Tomography, in: 1st Rilem Int. Conf. Concr. Digit. Fabr., 2018.
89
[8] Y.W.D. Tay, G.H.A. Ting, Y. Qian, B. Panda, L. He, M.J. Tan, Time gap effect on bond
strength of 3D-printed concrete, Virtual Phys. Prototyp. 0 (2018) 1–10.
doi:10.1080/17452759.2018.1500420.
[9] J. Van Der Putten, The Effect of Print Parameters on the ( Micro ) structure of 3D Printed
Cementitious Materials, Springer International Publishing, 2019. doi:10.1007/978-3-319-
99519-9.
[10] T. Marchment, J. Sanjayan, M. Xia, Method of enhancing interlayer bond strength in
construction scale 3D printing with mortar by effective bond area ampli fi cation, Mater.
Des. 169 (2019) 107684. doi:10.1016/j.matdes.2019.107684.
[11] ASTM C150 – Standard Specification for Portland Cement (2017), (n.d.).
[12] A.Y.W. T. Kanungo, D.M. Mount, N.S. Netanyahu, C. Piatko, R. Silverman, An Effiecient
K-means Clustering Algorithm: Analysis and Implementation, IEEE Trans. Pattern Anal.
Mach. Intell. 24 (2002) 411–426.
[13] B. Münch, L.H.J. Martin, A. Leemann, Segmentation of elemental EDS maps by means of
multiple clustering combined with phase identification, J. Microsc. 260 (2015) 411–426.
doi:10.1111/jmi.12309.
[14] No Title, (n.d.). https://imagej.net/Xlib.
[15] C.A. Schneider, W.S. Rasband, K.W. Eliceiri, NIH Image to ImageJ: 25 years of image
analysis, Nat. Methods. 9 (2012) 671–675. doi:10.1038/nmeth.2089.
[16] M. Choi, N. Roussel, Y. Kim, J. Kim, Lubrication layer properties during concrete pumping,
Cem. Concr. Res. 45 (2013) 69–78. doi:10.1016/j.cemconres.2012.11.001.
[17] H. Manzano, J.S. Dolado, A. Ayuela, Elastic properties of the main species present in
Portland cement pastes, Acta Mater. 57 (2009) 1666–1674.
doi:10.1016/j.actamat.2008.12.007.
[18] K.L. Scrivener, Backscattered electron imaging of cementitious microstructures:
Understanding and quantification, Cem. Concr. Compos. 26 (2004) 935–945.
doi:10.1016/j.cemconcomp.2004.02.029.

90
ADDITIVE MANUFACTURING AND PERFORMANCE OF
ARCHITECTURED CEMENT-BASED MATERIALS
This chapter contains work that was originally published in the Advanced Materials Journal
as “Moini, Mohamadreza, Jan Olek, Jeffrey P. Youngblood, Bryan Magee, and Pablo D. Zavattieri.
Additive Manufacturing and Performance of Architectured Cement‐Based Materials. Advanced
Materials 30, no. 43 (2018): 1802123.” The original article has been reproduced in this chapter
with permission from the publisher with partial modifications to include the supplemental
information of the published article. A paragraph is added to the end of the manuscript to further
elaborate on work-of-failure. The original article has also been modified for dissertation formatting
purposes. Moreover, this chapter contains experimental data collected by Mohamadreza Moini.
Data conceptualization was a collaborative effort with co-authors, Jan Olek, Jeffrey P. Youngblood,
B. Magee, and Pablo D. Zavattieri. The manuscript was written by Mohamadreza Moini and Jan
Olek, Jeffrey P. Youngblood, B. Magee, and Pablo D. Zavattieri provided editing.
Abstract
There is an increasing interest in hierarchical design and additive manufacturing (AM) of
cement-based materials. However, the brittle behavior of these materials and the presence of
interfaces from the AM process currently present a major challenge. Contrary to the commonly
adopted approach in AM of cement-based materials to eliminate the interfaces in 3D-printed
hardened cement paste (hcp) elements, this work focuses on harnessing the heterogeneous
interfaces by employing novel architectures (based on bioinspired Bouligand structures). These
architectures were found to generate unique damage mechanisms which allow inherently brittle
hcp materials to attain flaw-tolerant properties and novel performance characteristics. It is
hypothesized that combining heterogeneous interfaces with carefully designed architectures
promotes such damage mechanisms as, among others, interfacial microcracking and crack twisting.
This, in turn, leads to damage delocalization in brittle 3D-printed architectured hcp and therefore
results in quasi-brittle behavior, enhanced fracture and damage tolerance, and unique load-
displacement response, all without sacrificing strength. It was further found that in addition to
delocalization of the cracks, the Bouligand architectures can also enhance work of failure and

91
inelastic deflection of the architectured hcp elements by over 50% (when compared to traditionally
cast elements from the same materials.
Keywords: Architectured materials, Direct-ink-writing, Hardended cement paste, Interfaces,
Mechanical response
5.1 Manuscript
There is a rising interest in hierarchical design and additive manufacturing (AM) of
architectured materials due to their ability to achieve unique and novel performance characteristics
[1-8]. AM allows for engineering and fabrication of a vast array of metallic, ceramic, polymeric,
composite, and hydrogel materials into complex solid and cellular structures and assists us in the
understanding of the structure-property relationship [9-23]. It has been established that AM of
metallic [9,10], polymeric [11-13], hydrogel [14], and ceramic [15] materials introduces microstructural
heterogeneities, such as porosity and interfaces, which can result in anisotropy in the mechanical
response of the elements. For instance, in case of ceramic and metallic materials, the resulting
anisotropic mechanical properties are demonstrated to be similar, lower, or higher, compared to
the conventionally cast counterparts and depending on the printing directions, the type of applied
AM techniques and mechanical property of interest [9-14]. Currently, there are two approaches
towards enhancement of the mechanical response of additively manufactured materials: a)
elimination of detrimental heterogeneities such as porosities and interfaces present in fabricated
metallic [9,10], ceramic [15], and hydrogel materials [14] via optimizing the printing parameters in
order to achieve performance comparable to cast counterpart and; b) incorporation of multi-scale
[13], hierarchical [16], and bioinspired [17] design principles over a broad range of architectures of
fabricated materials, from nano [18] to micro [19,20] in order to engineer the mechanical properties
[19], to significantly enhance the strength and tensile performance [13], load-bearing capacity,
compliancy, and impact resistance [16], and to overcome the brittleness and flaw-sensitivity
limitations of these materials [18,20]. Similar to the trends observed in additively manufactured
materials [9-14], the presence of weak interface is considered detrimental for the overall mechanical
performance of additively manufactured cement-based materials, and current research efforts
focus mostly on eliminating or strengthening the AM-induced interfaces as a mean to minimize
their effect on the overall strength, bearing capacity to improve stress transfer across the interfaces
in 3D-printed elements [24-28]. Contrary to the common approach that suggests elimination of the
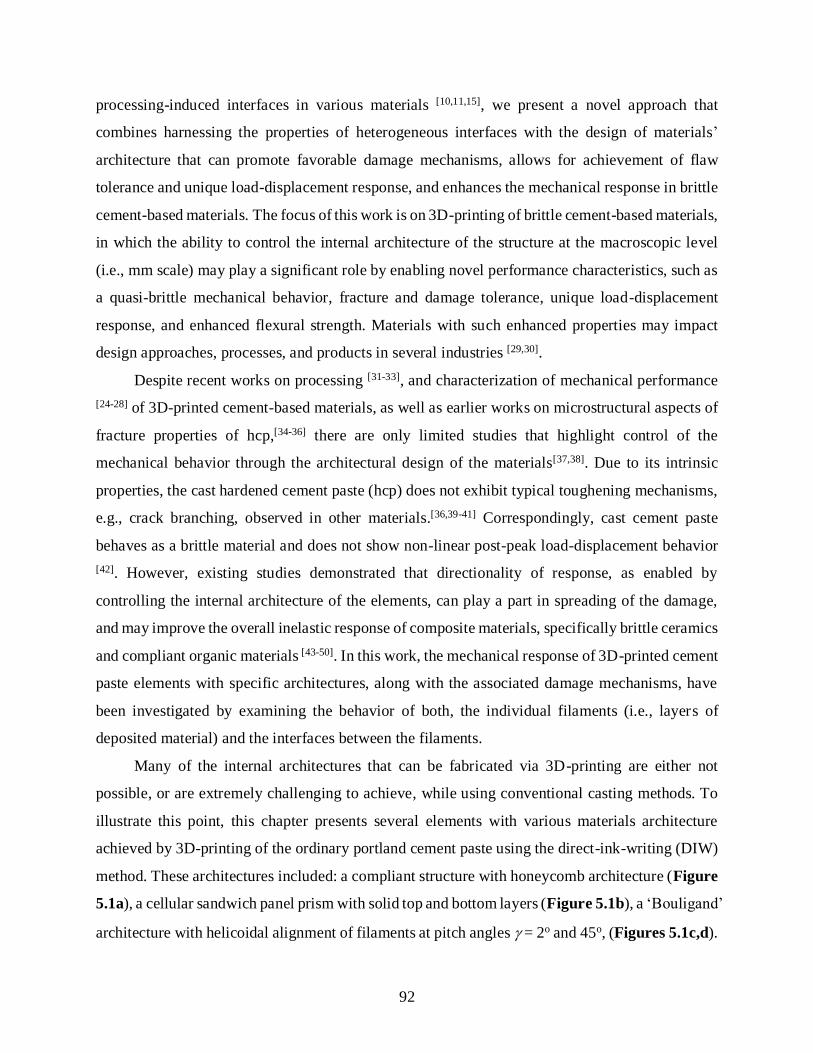
92
processing-induced interfaces in various materials [10,11,15], we present a novel approach that
combines harnessing the properties of heterogeneous interfaces with the design of materials’
architecture that can promote favorable damage mechanisms, allows for achievement of flaw
tolerance and unique load-displacement response, and enhances the mechanical response in brittle
cement-based materials. The focus of this work is on 3D-printing of brittle cement-based materials,
in which the ability to control the internal architecture of the structure at the macroscopic level
(i.e., mm scale) may play a significant role by enabling novel performance characteristics, such as
a quasi-brittle mechanical behavior, fracture and damage tolerance, unique load-displacement
response, and enhanced flexural strength. Materials with such enhanced properties may impact
design approaches, processes, and products in several industries [29,30].
Despite recent works on processing [31-33], and characterization of mechanical performance
[24-28] of 3D-printed cement-based materials, as well as earlier works on microstructural aspects of
fracture properties of hcp,[34-36] there are only limited studies that highlight control of the
mechanical behavior through the architectural design of the materials[37,38]. Due to its intrinsic
properties, the cast hardened cement paste (hcp) does not exhibit typical toughening mechanisms,
e.g., crack branching, observed in other materials.[36,39-41] Correspondingly, cast cement paste
behaves as a brittle material and does not show non-linear post-peak load-displacement behavior
[42]. However, existing studies demonstrated that directionality of response, as enabled by
controlling the internal architecture of the elements, can play a part in spreading of the damage,
and may improve the overall inelastic response of composite materials, specifically brittle ceramics
and compliant organic materials [43-50]. In this work, the mechanical response of 3D-printed cement
paste elements with specific architectures, along with the associated damage mechanisms, have
been investigated by examining the behavior of both, the individual filaments (i.e., layers of
deposited material) and the interfaces between the filaments.
Many of the internal architectures that can be fabricated via 3D-printing are either not
possible, or are extremely challenging to achieve, while using conventional casting methods. To
illustrate this point, this chapter presents several elements with various materials architecture
achieved by 3D-printing of the ordinary portland cement paste using the direct-ink-writing (DIW)
method. These architectures included: a compliant structure with honeycomb architecture (Figure
5.1a), a cellular sandwich panel prism with solid top and bottom layers (Figure 5.1b), a ‘Bouligand’
architecture with helicoidal alignment of filaments at pitch angles = 2o and 45o, (Figures 5.1c,d).

93
The 3D rendition of the design of Bouligand architecture with = 45o is shown in Figure 5.1e,
whereas 3D rendition of the entire volume of Bouligand architecture with = 45o generated using
X-ray Micro-CT is shown in Figure 5.1f.
When subjected to cycling loading, a compliant structure with honeycomb architecture
(similar to that illustrated in Figure 5.1f) displayed bi-linear stress-strain behavior characterized
by two discrete values of moduli of elasticity (see Figure 5.S1 in Supporting Information).
Figure 5.1. Various 3D printed architectures of hardened cement paste (hcp) elements; a)
Compliant structure with honeycomb architecture; b) cellular sandwich panel prism with solid
top and bottom layers; c-d) Bouligand architecture with, respectively, pitch angles = 2° and
45°; e) 3D rendition of the design of Bouligand architecture with = 45° and; f) 3D rendition of
the entire volume of Bouligand architecture with = 45° from X-ray micro-CT. All scale bars
are 10.0 mm long.
The values of modulus of rupture (MOR) of printed solid prisms with various filament
orientations (i.e., 0o, 45o, and 90o with respect to X-axis, Figure5. 2a) were determined using the
three-point-bending (3PB) test (Figure 5.52b). A comparison of average values of specific MOR
for printed and cast specimens (Figure 5.2c) reveals that they were not statistically different (i.e.,
94
at the 95% confidence level p 0.05 for all printed specimens when compared to cast specimens).
This implies that the mechanical response of all three of the printed prisms was independent of the
orientation of the filament, and the specimen processing method (i.e., printed vs. cast). Since there
are some observable variations in crack patterns of specimens with different filament orientations
(Figures 5.2d-m), the lack of statistically discernible changes in the values of specific MOR
(despite the presence of such differences in work of failure (WOF) values of printed and cast
specimens shown in Figure 5.3c) may simply imply that the 3PB test is not capable of adequately
capturing the microscopic level fracture response. However, the 3PB test can be used to
characterize the strength of the materials (i.e., tensile strength of the individual filaments) and the
interfacial strength. The strength of the materials reaches a plateau as the thickness of both cast,
and the 3D-printed prisms with 0o filament orientations increases from 1 mm (i.e., 1 layer) to 12
mm (i.e., 12 layers) and as shown in Supporting Information (Figure 5.S2). The strength of the
materials values are shown in Figure 5.2c are the average values from the plateau shown in Figure
5.S2. The interfacial strength was estimated via 3PB test of prims with 12 mm thickness and 90o
filament orientation and was found to be statistically similar to materials strength.
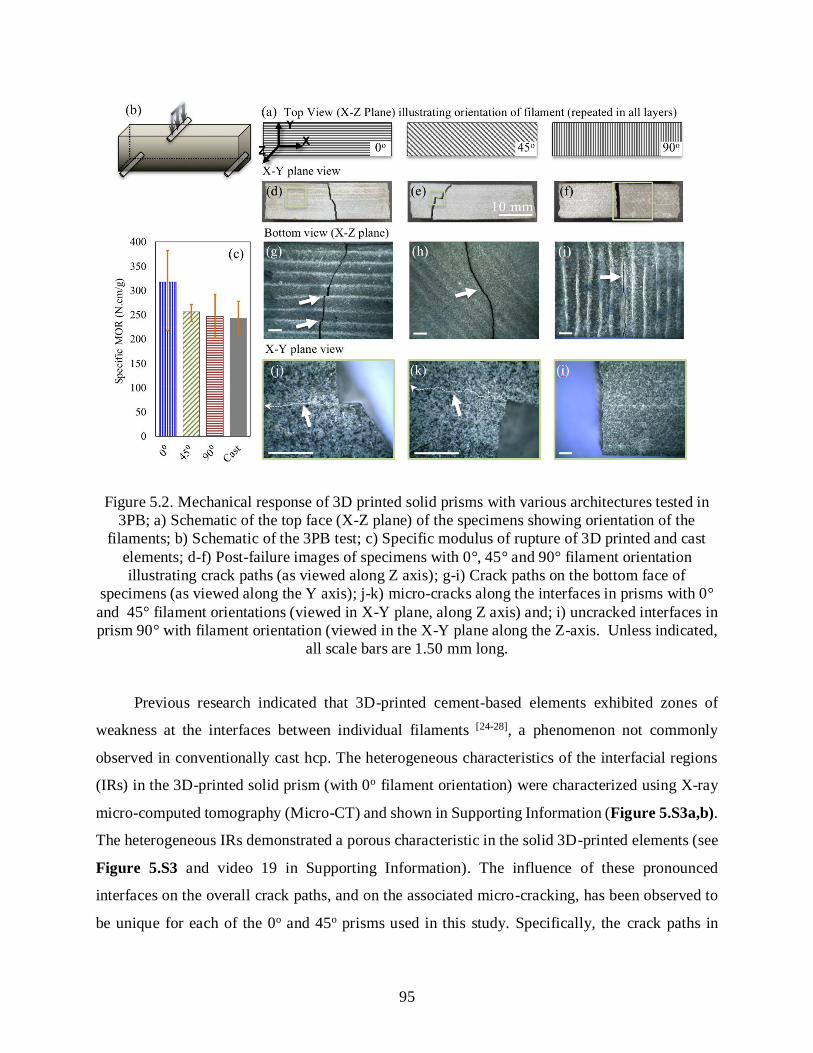
95
Figure 5.2. Mechanical response of 3D printed solid prisms with various architectures tested in
3PB; a) Schematic of the top face (X-Z plane) of the specimens showing orientation of the
filaments; b) Schematic of the 3PB test; c) Specific modulus of rupture of 3D printed and cast
elements; d-f) Post-failure images of specimens with 0°, 45° and 90° filament orientation
illustrating crack paths (as viewed along Z axis); g-i) Crack paths on the bottom face of
specimens (as viewed along the Y axis); j-k) micro-cracks along the interfaces in prisms with 0°
and 45° filament orientations (viewed in X-Y plane, along Z axis) and; i) uncracked interfaces in
prism 90° with filament orientation (viewed in the X-Y plane along the Z-axis. Unless indicated,
all scale bars are 1.50 mm long.
Previous research indicated that 3D-printed cement-based elements exhibited zones of
weakness at the interfaces between individual filaments [24-28], a phenomenon not commonly
observed in conventionally cast hcp. The heterogeneous characteristics of the interfacial regions
(IRs) in the 3D-printed solid prism (with 0o filament orientation) were characterized using X-ray
micro-computed tomography (Micro-CT) and shown in Supporting Information (Figure 5.S3a,b).
The heterogeneous IRs demonstrated a porous characteristic in the solid 3D-printed elements (see
Figure 5.S3 and video 19 in Supporting Information). The influence of these pronounced
interfaces on the overall crack paths, and on the associated micro-cracking, has been observed to
be unique for each of the 0o and 45o prisms used in this study. Specifically, the crack paths in
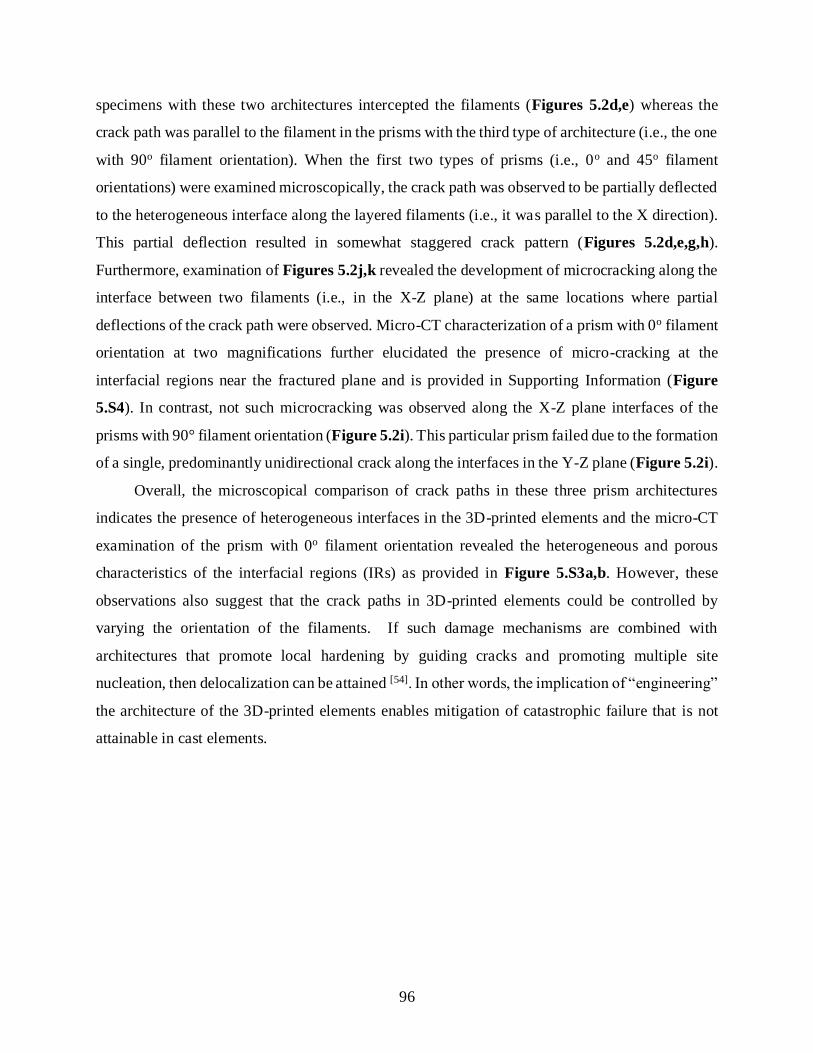
96
specimens with these two architectures intercepted the filaments (Figures 5.2d,e) whereas the
crack path was parallel to the filament in the prisms with the third type of architecture (i.e., the one
with 90o filament orientation). When the first two types of prisms (i.e., 0o and 45o filament
orientations) were examined microscopically, the crack path was observed to be partially deflected
to the heterogeneous interface along the layered filaments (i.e., it was parallel to the X direction).
This partial deflection resulted in somewhat staggered crack pattern (Figures 5.2d,e,g,h).
Furthermore, examination of Figures 5.2j,k revealed the development of microcracking along the
interface between two filaments (i.e., in the X-Z plane) at the same locations where partial
deflections of the crack path were observed. Micro-CT characterization of a prism with 0o filament
orientation at two magnifications further elucidated the presence of micro-cracking at the
interfacial regions near the fractured plane and is provided in Supporting Information (Figure
5.S4). In contrast, not such microcracking was observed along the X-Z plane interfaces of the
prisms with 90° filament orientation (Figure 5.2i). This particular prism failed due to the formation
of a single, predominantly unidirectional crack along the interfaces in the Y-Z plane (Figure 5.2i).
Overall, the microscopical comparison of crack paths in these three prism architectures
indicates the presence of heterogeneous interfaces in the 3D-printed elements and the micro-CT
examination of the prism with 0o filament orientation revealed the heterogeneous and porous
characteristics of the interfacial regions (IRs) as provided in Figure 5.S3a,b. However, these
observations also suggest that the crack paths in 3D-printed elements could be controlled by
varying the orientation of the filaments. If such damage mechanisms are combined with
architectures that promote local hardening by guiding cracks and promoting multiple site
nucleation, then delocalization can be attained [54]. In other words, the implication of “engineering”
the architecture of the 3D-printed elements enables mitigation of catastrophic failure that is not
attainable in cast elements.

97
Figure 5.3. Mechanical response of Bouligand architecture using ball-on-three-balls test; a)
Load-displacement for printed and cast disc specimens, including screenshot of acoustic
spectrum recorded during testing; b) Specific modulus of rupture; c) ork of failure, and d)
Modulus of rupture (MOR) versus relative density for Bouligand architectures with varying pitch
angles (8o, 15o, 30o, 45o, 90o) and percentages of infill (60% and 100%) compared to MOR of
cast control discs; e-g) Views of bottom faces of discs with different Bouligand architecture;, h)
Schematic of Bouligand architecture with helicoidal alignment of filaments.
The Bouligand architectures utilized here have been previously reported to introduce
damage mechanisms that increase the toughness and energy absorption capacity.[51-54] These
architectures have found applications in engineering materials and offer enhanced fracture
properties by enabling crack propagation in a stepwise pattern, crack redirection, branching, and
prevention of catastrophic failure in various biological organisms such as lobster, crab, and mantis

98
shrimp [51-56]. Previous research has shown that these Bouligand architectures, found in the
endocuticles of arthropods (such as mantis shrimp), tend to grow cracks in twisted patterns
following the direction of the fiber.[51] These twisting patterns have been found to be responsible
for increasing toughness [53] and promote the spread of the damage [54].
In naturally occurring fibrous Bouligand architectures, a competition between interfacial
failure (i.e., the separation between fibers) and solid failure (i.e., fiber fracture) of materials, is
anticipated to be a trade-off between small and large pitch angles [51-56]. While small pitch angles
facilitate the crack to grow through the interface, they also allow local softening [51-56]. However,
this interfacial failure can be controlled by providing a crack path that leads to local hardening
(e.g., such as crack twisting). This enables delocalization and spread of the damage to neighboring
regions. In contrast, large pitch angles may lead to crack growth through the solid materials (e.g.,
biomineral in case of arthropods) and hinder the twisting or spread of the crack at the interface.
These competing mechanisms can be controlled with the pitch angle as a design variable (among
other material properties). This competition is demonstrated in this chapter by focusing on the
analysis of the specimens with small pitch angle (e.g., = 8°) and the large pitch angles (e.g., =
45° and 90°).
To further investigate the structure-performance relationships, elements with several
Bouligand architectures were 3D-printed by varying pitch angles ( = 8o, 15o, 30o, 45o, 90o) and
infill percentages (60% and 100%, i.e., cellular and solid). The Ball-on-three-Ball mechanical
testing (B3B) was performed on these elements for determination of specific strength (MOR),
work of failure (WOF), and documenting load-displacement behavior.
The results presented in Figure 5.3a illustrate that deflections at maximum load of elements
with Bouligand architectures were consistently higher than the deflections at maximum load of the
cast elements. Specifically, the observed increases in the maximum load deflections were 5%, 25%
and 50% for architectures with = 8o (60% infill), = 45o (60% infill), and = 8o (solid, i.e., 100%
infill), respectively. It should also be noted that these Bouligand architectures have achieved higher
deflection while having relative densities (i.e., the density of each specimen relative to the average
of the conventional cast solid) lower than cast specimens.

99
Figure 5.4. Crack paths and fracture patterns of various 3D printed Bouligand architectures; a1-
a8) = 8o, 100% infill; b1-b6) = 8o, 60% infill; c1-c3) = 45o, 60% infill and; d1-d2) = 30o,
60% infill after B3B test. All scale bars are 1.0 mm long.

100
Similar to the observations from the prisms study presented above, the presence of the
heterogeneous interface and the deflection of the crack path into the interface and presence of
micro-cracks in the interfaces are also of particular importance for the printed disc structures. The
heterogeneous characteristics of the IRs in the 3D-printed solid Bouligand architecture discs (with
= 8o) were characterized using X-ray micro-CT and are provided in Supporting Information
(Figure 5.S3c,d and Video 5.S10). These heterogeneous IRs displayed porous characteristics
similar to those found in solid prisms with 0o filament orientation. The identified porous IRs found
in the microstructure of 3D-printed materials (in both solid prism and solid Bouligand architecture,
Figure 5.S3), can enable the spread of the damage in the solid structure by localization of micro-
cracks. In cellular structures, fracture of sacrificial links between filaments without sacrificing the
integrity of the structure can provide the spread of the damage in the structure and tolerance to
fracture. The damage and fracture process of filaments in pre- and post-peak regions are
additionally captured with acoustic recording in the studied Bouligand architectures. The
screenshot of the acoustic recording of the fracture process during testing of = 45o disc and the
cast disc is also illustrated in Figure 5.3a. The screenshot of the acoustic recordings qualitatively
describes the propagation of multiple cracks in the pre- and post-peak regions of the Bouligand
structure. The major peaks of the acoustic graph match the local maximum loads. This detected
damage propagation is distinguishably different from the brittle fracture of cast discs shown in
Figure 5.3a.
In terms of strength, the majority of Bouligand structures ( = 15o, 30o, 45o, 90o), except =
8o with 60% infill, are statistically similar in average specific values of MOR when compared to
cast structures (Figure 5.3b). This equivalent performance includes the solid specimen with the
small pitch angle of = 8o and 100% infill.
The WOF was assessed for all Bouligand architectures, and an increase in WOF was
observed as increased from 8o to 90o for 60% infill structures (Figure 5.3c). The observed pattern
is consistent with previous studies on composite materials with the Bouligand architecture,
suggesting increased WOF with the increase in rotation angle [52-54]. Figure 5.3c describes how
or infill percentage can play a role in the fracture properties of materials. The solid structures with
= 8o demonstrated elevated WOF compared to its identical at lower density (60% infill). The
solid structures with = 8o show a counter-clockwise orientation of the fractured plane following
the right-hand pattern in consecutive layers (positive counter-clockwise ) indicating subtle
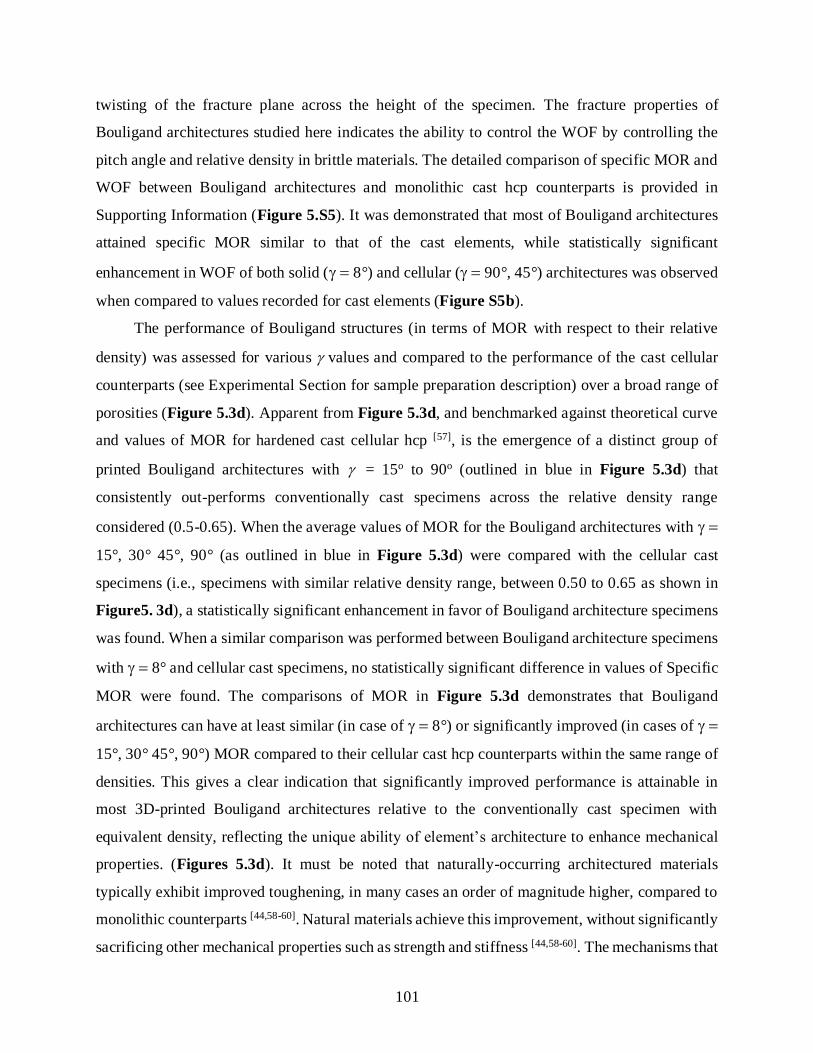
101
twisting of the fracture plane across the height of the specimen. The fracture properties of
Bouligand architectures studied here indicates the ability to control the WOF by controlling the
pitch angle and relative density in brittle materials. The detailed comparison of specific MOR and
WOF between Bouligand architectures and monolithic cast hcp counterparts is provided in
Supporting Information (Figure 5.S5). It was demonstrated that most of Bouligand architectures
attained specific MOR similar to that of the cast elements, while statistically significant
enhancement in WOF of both solid ( 8°) and cellular ( 90°, 45°) architectures was observed
when compared to values recorded for cast elements (Figure S5b).
The performance of Bouligand structures (in terms of MOR with respect to their relative
density) was assessed for various values and compared to the performance of the cast cellular
counterparts (see Experimental Section for sample preparation description) over a broad range of
porosities (Figure 5.3d). Apparent from Figure 5.3d, and benchmarked against theoretical curve
and values of MOR for hardened cast cellular hcp [57], is the emergence of a distinct group of
printed Bouligand architectures with = 15o to 90o (outlined in blue in Figure 5.3d) that
consistently out-performs conventionally cast specimens across the relative density range
considered (0.5-0.65). When the average values of MOR for the Bouligand architectures with
15°, 30° 45°, 90° (as outlined in blue in Figure 5.3d) were compared with the cellular cast
specimens (i.e., specimens with similar relative density range, between 0.50 to 0.65 as shown in
Figure5. 3d), a statistically significant enhancement in favor of Bouligand architecture specimens
was found. When a similar comparison was performed between Bouligand architecture specimens
with 8° and cellular cast specimens, no statistically significant difference in values of Specific
MOR were found. The comparisons of MOR in Figure 5.3d demonstrates that Bouligand
architectures can have at least similar (in case of 8°) or significantly improved (in cases of
15°, 30° 45°, 90°) MOR compared to their cellular cast hcp counterparts within the same range of
densities. This gives a clear indication that significantly improved performance is attainable in
most 3D-printed Bouligand architectures relative to the conventionally cast specimen with
equivalent density, reflecting the unique ability of element’s architecture to enhance mechanical
properties. (Figures 5.3d). It must be noted that naturally-occurring architectured materials
typically exhibit improved toughening, in many cases an order of magnitude higher, compared to
monolithic counterparts [44,58-60]. Natural materials achieve this improvement, without significantly
sacrificing other mechanical properties such as strength and stiffness [44,58-60]. The mechanisms that
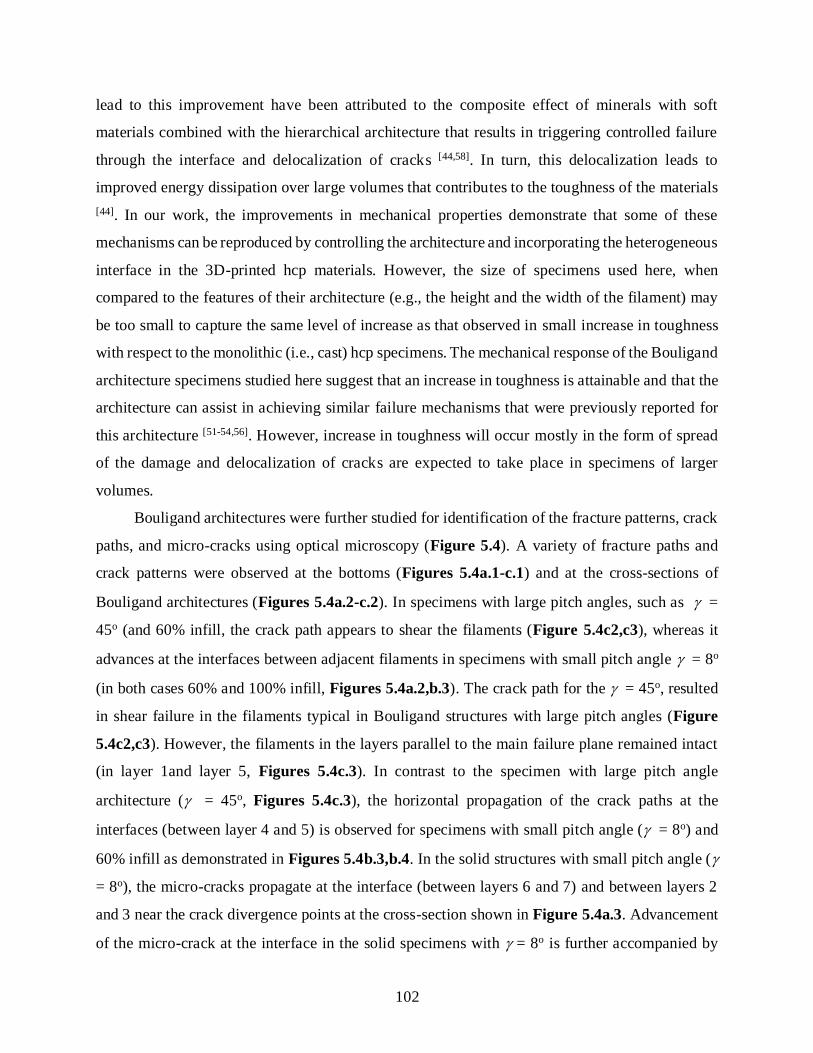
102
lead to this improvement have been attributed to the composite effect of minerals with soft
materials combined with the hierarchical architecture that results in triggering controlled failure
through the interface and delocalization of cracks [44,58]. In turn, this delocalization leads to
improved energy dissipation over large volumes that contributes to the toughness of the materials
[44]. In our work, the improvements in mechanical properties demonstrate that some of these
mechanisms can be reproduced by controlling the architecture and incorporating the heterogeneous
interface in the 3D-printed hcp materials. However, the size of specimens used here, when
compared to the features of their architecture (e.g., the height and the width of the filament) may
be too small to capture the same level of increase as that observed in small increase in toughness
with respect to the monolithic (i.e., cast) hcp specimens. The mechanical response of the Bouligand
architecture specimens studied here suggest that an increase in toughness is attainable and that the
architecture can assist in achieving similar failure mechanisms that were previously reported for
this architecture [51-54,56]. However, increase in toughness will occur mostly in the form of spread
of the damage and delocalization of cracks are expected to take place in specimens of larger
volumes.
Bouligand architectures were further studied for identification of the fracture patterns, crack
paths, and micro-cracks using optical microscopy (Figure 5.4). A variety of fracture paths and
crack patterns were observed at the bottoms (Figures 5.4a.1-c.1) and at the cross-sections of
Bouligand architectures (Figures 5.4a.2-c.2). In specimens with large pitch angles, such as =
45o (and 60% infill, the crack path appears to shear the filaments (Figure 5.4c2,c3), whereas it
advances at the interfaces between adjacent filaments in specimens with small pitch angle = 8o
(in both cases 60% and 100% infill, Figures 5.4a.2,b.3). The crack path for the = 45o, resulted
in shear failure in the filaments typical in Bouligand structures with large pitch angles (Figure
5.4c2,c3). However, the filaments in the layers parallel to the main failure plane remained intact
(in layer 1and layer 5, Figures 5.4c.3). In contrast to the specimen with large pitch angle
architecture ( = 45o, Figures 5.4c.3), the horizontal propagation of the crack paths at the
interfaces (between layer 4 and 5) is observed for specimens with small pitch angle ( = 8o) and
60% infill as demonstrated in Figures 5.4b.3,b.4. In the solid structures with small pitch angle (
= 8o), the micro-cracks propagate at the interface (between layers 6 and 7) and between layers 2
and 3 near the crack divergence points at the cross-section shown in Figure 5.4a.3. Advancement
of the micro-crack at the interface in the solid specimens with = 8o is further accompanied by

103
development of multiple parallel micro-cracks throughout the top (Figures 5.4a.4) and bottom
layers (Figures 5.4a.5,a.6). Also, a staggered fractured pattern is observed in the main failure
plane (Figure 5.4a.2,a.8). Micro-CT characterization of a solid Bouligand architecture with = 8o,
further elucidated crack advancement and micro-cracking at the interface as illustrated in Figure
5.S6 and Videos 5.S12 to 5.S14 in Supporting Information). The two interfacial damage
mechanisms (i.e., horizontal propagation of the crack and micro-crack propagation at the interface)
for specimens with small pitch angles are of great interest as they can promote controlled crack
growth and local hardening. In contrast, Micro-CT characterization of a cellular Bouligand
architecture with large pitch angle ( = 45o) demonstrated the shear failure of the filaments (Figure
5.S7a,b, and Videos 5.S15-S18). The contrast between damage mechanism in this large pitch
angle is further elucidated in Figure 5.S7c,d comparing it with the solid Bouligand architecture
with small pitch angle = 8o. The shear failure of the filaments at large pitch angles are in
accordance with previous research findings on damage mechanisms in composite Bouligand
architectures that present solid failures at such large pitch angles [51-54]. The WOF for solid
structures with = 8o was higher than that the conventionally cast discs (Figure 5.3c); may be
attributed to toughening and damage mechanisms such as observed micro-cracking advancement
at the heterogeneous interfaces.
Micro-cracking of other type was observed in the bridging links between the filaments in
Bouligand architectures in = 30o structures. In this case, multiple parallel micro-cracks were
observed near the fractured plane of the specimens at the bottom of layers 1, 2 and 3 (Figures
5.4d.1,d.2). These parallel micro-cracks are spaced equally from the fracture edge in the very
bottom layer (Figure 5.4d.1) and appear twisting in the subsequent bottom layers 2 and 3 at the
bridging links (Figure 5.4d.2).
A similar sinusoidal fractured pattern is observed in the Bouligand architecture with small
pitch angle = 8o with both 60% infill and 100% infill (Figures 5.4a.7,b.6). It is noteworthy that
in the 60% infill case, the micro-crack advancement is also observed at the interface (Figure
5.4b.6).
Overall, in Bouligand architectures, the crack deflection at the interface are commonly
observed for smaller pitch angles (= 8o with 60% infill and 100% solid, Figures 5.4b.3,b.4,a.1).
The micro-crack advancement at the interface is also observed in small pitch angle (Figures
5.5a.3-a.6,b.5) indicating heterogeneous properties of the interface. The presence of this

104
heterogeneous interface, not only allows for crack path to follow the interface but also for initiation
of numerous micro-cracks. Acknowledging this possibility, control of the architecture (via control
of the pitch angle) and the properties of the interface can be combined to promote crack initiation
and interfacial damage mechanisms and to allow for controlled crack growth and for an increased
threshold to crack initiation, initiation toughness, inelastic deformation, and WOF (Figure 5.3c).
As reported earlier, Bouligand architectures are known to present competing interfacial and
solid damage mechanisms corresponding to small and large pitch angles, respectively [53.54]. The
small pitch angles allow for crack growth at the interface and for control of the crack path, whereas
large pitch angles facilitate crack advancement through the solid material. The damage
mechanisms for specimens with small pitch angle (= 8°) solid (100% infill) and cellular (60%
infill) Bouligand architectures used in this study, demonstrate that the interfaces promote damage
mechanism such as crack advancement at the interface and micro-cracking as shown in Figure
5.a2-a8 and Figure 5.b3-6, respectively, as well as Figure 5.S7c,d. In contrast, the damage
mechanisms for specimens with large pitch angles (= 90° and 45°), involves a dominant crack
growth through the solid filaments as demonstrated in Figure 5.c2,3 and Figure 5.S7a,b. The
mechanisms demonstrated in solid and cellular Bouligand architectures with a small pitch angle
of 8°, can allow for achieving flaw-tolerant behavior in a larger volume. We therefore, surmise
that an optimum architecture could be obtained with a Bouligand structure with moderate pitch
angles. Such angles will be large enough to promote local hardening in the material, and therefore,
allow multiple site crack nucleation, and small enough to avoid advancement of one dominant
crack through the filaments
The fracture behavior of hcp commonly exhibits brittle and unstable crack propagation [24].
Overall, in 3D-printed prisms with 0o and 45o filament orientations, horizontal deflection of crack
is observed at the interface, followed by advancement of micro-cracks at the interface between
filaments (Figures 5.2g,h, Figure 5.S4). This crack deflection and the subsequent micro-crack
induction, suggests the possibility of the increased spread of the damage in the design of these
architectured materials. In 90o prisms, no micro-crack or crack deflection at the interface is
observed. However, a remarkable observation, in this case, is that the main crack occurs at the
interface between the filaments in the mid-span of the specimens through the entire cross-section
(Figures 5.2i). Thus, the interface between layers can be utilized in an architecture in which the
micro-cracks can be advanced in multi-layers and create a fracture toughening mechanism [44,45].
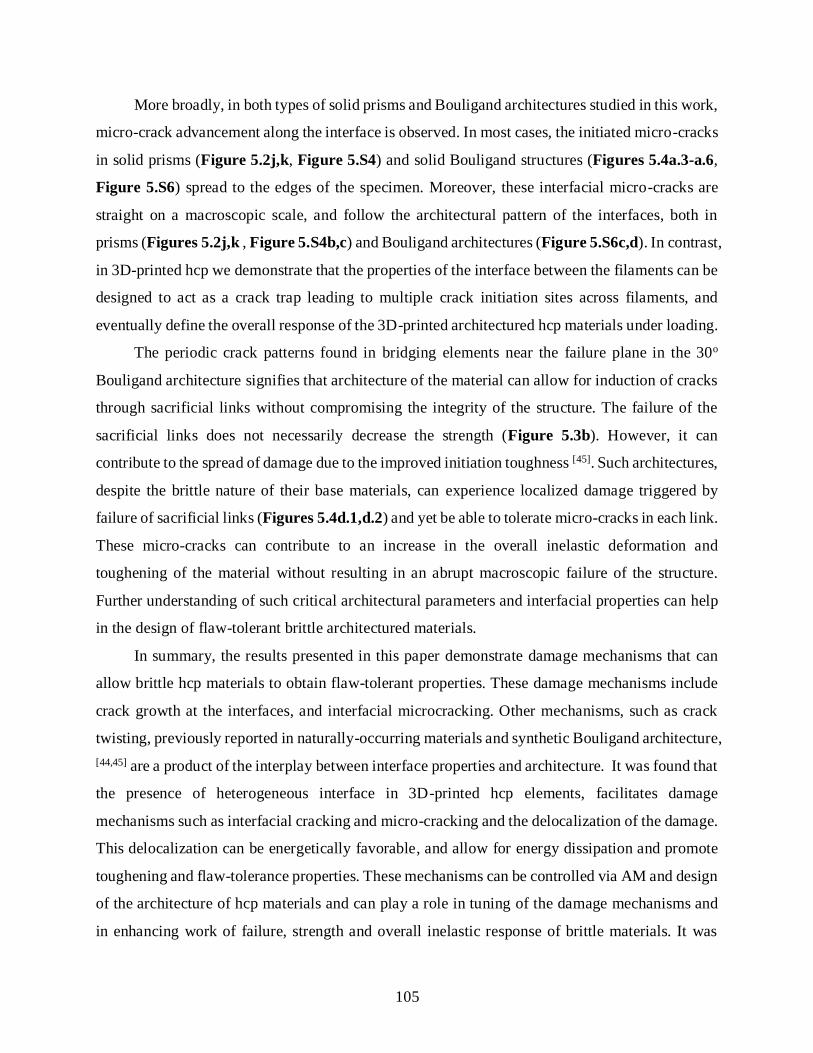
105
More broadly, in both types of solid prisms and Bouligand architectures studied in this work,
micro-crack advancement along the interface is observed. In most cases, the initiated micro-cracks
in solid prisms (Figure 5.2j,k, Figure 5.S4) and solid Bouligand structures (Figures 5.4a.3-a.6,
Figure 5.S6) spread to the edges of the specimen. Moreover, these interfacial micro-cracks are
straight on a macroscopic scale, and follow the architectural pattern of the interfaces, both in
prisms (Figures 5.2j,k , Figure 5.S4b,c) and Bouligand architectures (Figure 5.S6c,d). In contrast,
in 3D-printed hcp we demonstrate that the properties of the interface between the filaments can be
designed to act as a crack trap leading to multiple crack initiation sites across filaments, and
eventually define the overall response of the 3D-printed architectured hcp materials under loading.
The periodic crack patterns found in bridging elements near the failure plane in the 30o
Bouligand architecture signifies that architecture of the material can allow for induction of cracks
through sacrificial links without compromising the integrity of the structure. The failure of the
sacrificial links does not necessarily decrease the strength (Figure 5.3b). However, it can
contribute to the spread of damage due to the improved initiation toughness [45]. Such architectures,
despite the brittle nature of their base materials, can experience localized damage triggered by
failure of sacrificial links (Figures 5.4d.1,d.2) and yet be able to tolerate micro-cracks in each link.
These micro-cracks can contribute to an increase in the overall inelastic deformation and
toughening of the material without resulting in an abrupt macroscopic failure of the structure.
Further understanding of such critical architectural parameters and interfacial properties can help
in the design of flaw-tolerant brittle architectured materials.
In summary, the results presented in this paper demonstrate damage mechanisms that can
allow brittle hcp materials to obtain flaw-tolerant properties. These damage mechanisms include
crack growth at the interfaces, and interfacial microcracking. Other mechanisms, such as crack
twisting, previously reported in naturally-occurring materials and synthetic Bouligand architecture,
[44,45] are a product of the interplay between interface properties and architecture. It was found that
the presence of heterogeneous interface in 3D-printed hcp elements, facilitates damage
mechanisms such as interfacial cracking and micro-cracking and the delocalization of the damage.
This delocalization can be energetically favorable, and allow for energy dissipation and promote
toughening and flaw-tolerance properties. These mechanisms can be controlled via AM and design
of the architecture of hcp materials and can play a role in tuning of the damage mechanisms and
in enhancing work of failure, strength and overall inelastic response of brittle materials. It was

106
found that Bouligand architectures demonstrated elevated improvement from the typical strength-
porosity relationship, classically known for brittle hcp materials. In turns, the Bouligand
architectures showed improvements of the work of failure by more than 50% exhibiting the
controlled spread of damage without sacrificing the strength.
Two competing damage mechanisms were observed in Bouligand architectures used in this
study. Specifically, it was found that in hcp elements with Bouligand architecture, the use of small
pitch angles (8°) will facilitate interfacial crack growth through the interface and promote
interfacial micro-cracking, where the use of larger pitch angles (90° and 45°) will result in a
dominant crack growth through the solid filaments (Figure 5.S7).
The heterogeneous characteristics of the interfacial regions in the solid 3D-printed prism and
Bouligand architecture specimens was characterized using micro-CT (results are provide in Figure
5.S3 in Supporting Information). It was demonstrated that the presence of a porous IRs could
promote damage mechanisms such as crack advancement and micro-cracking in these regions.
These mechanisms can allow for crack initiation and for controlled crack growth, followed by
local hardening mechanism (e.g., crack twisting).
We have demonstrated that AM and control of the architecture of the elements, can lead to
novel behaviors of cement-based materials. These behaviors, observed in compliant design
(Figure 5.S1), prisms and Bouligand architectures, demonstrate new potential for engineering
performance of cement-based materials. Architectures such as compliant design demonstrated
bilinear stress-strain behavior, not attainable in cast elements, and thus can provides the ability to
customize stress-strain behavior as applicable.
Processing-induced weak interfaces are commonly considered to constitute defects in AM
of cementitious materials and are therefore avoided. In Bouligand architectures, we demonstrated
that such heterogeneous interfaces exist and are not necessarily detrimental to the overall
performance, rather they can provide mechanisms that can lead to novel responses such as an
increased deflection, enhanced WOF, and a variety of damage mechanisms. It must be noted that
the development of these enhanced properties certainly depends on the ability of the material to
spread the damage over larger volumes. Indeed, the mechanisms analyzed in this work can be
applied to other specimen sizes and can be used in the architectural design of brittle materials.
To further explore opportunities provided by architectured cement paste materials, a
fundamental understanding of the intertwined relationships between processing-induced

107
heterogeneities, interfacial strength, ink properties (cement hydration, rheology, chemistry, and
formulation), architectural parameters (such as pitch angle and infill percentage), and
microstructural characteristics of the filaments and interfaces must be developed to fine tune the
performance of resulting elements. Further understanding of the architectural parameters and
interfacial properties, can result in the design of flaw-tolerant architectured materials with a brittle
base, such as hardened cement paste.
It must be noted that in brittle cast hcp elements, only a small portion of work-of-failure
calculated from the area under the curve represents the actual energy dissipated by the fracture
process, mainly due to the dynamic nature of fracture (i.e., snap-through behavior) in those
elements. The rest of the area is the elastic energy that is stored in the element which is suddenly
released as wave propagation, sound, heat, etc. In contrast, in architectured elements, the observed
softening indicates little dynamic phenomena, and therefore, it is more plausible that the majority
of the area under the curve represents the work-of-failure after the crack is initiated. In other
words, a large portion of reported work-of-failure in architectured elements can be conceived as
inelastic as there are little dynamic effects during the fracture process. If only the portion of the
amount of energy after the crack is initiated were to be considered, the cast elements would even
have a smaller work-of-failure compared to architectured hcp elements. Therefore, if only
the energy dissipated by the actual fracture process is considered, architectured elements would
represent an even greater improvement in toughness. In the future, measurement of fracture
toughness can assist with a better estimate of the portion of reported work-of-failure, that dissipates
the energy in the actual fracture process.
5.2 Experimental Section
Cementitious Ink Formulation: An iterative trial and error ink design procedure is used to
identify cement inks suitable for the DIW process. The ink with proper flow properties that can
overcome processing challenges, such as flocculation, bleeding, and which could ensure in suitable
shape holding properties was designed. The final ink used constituted the sub 150 µm fraction of
commercially available Type I cement (Buzzi Unicem USA) in accordance with ASTM C150 [61],
deionized water, and both high range water reducing admixture (HRWRA-MasterGlenium 7700)
and viscosity modifying admixtures (VMA-MasterMatrix 362) in accordance with ASTM C494
108
[62] and the findings of previous study [63]. For each 250 g of cement, the mix comprised 65.2, 1.1
and 3 g of deionized water, HRWRA, and VMA, respectively.
Mixing Procedure: A Twister Evolution Venturi vacuum mixer is used to mix the
ingredients and to eliminate the entrapped air. First, admixtures are added and dispersed in water
and pre-mixed with cement for 25 s, followed by mixing at 400 rpm for 90 seconds at 70% vacuum.
This was followed by mixing (for another 90s) and then finally at 400 rpm at 100% vacuum. This
procedure was applied in preparing the cement paste ink for 3D-printed and cast specimen.
Ink Rheology: Rheological properties of the ink are characterized using a Malvern Bohlin
Gemini HR rheometer with 40 mm parallel plates (with the serrated surface to minimize the
slippage during the tests). A solvent trap was used to avoid evaporation during the test. The
rheological protocol used, and the yield stress and viscosity versus shear rates are presented in the
Supporting Information (Figure 5.S8). The shear rate at the nozzle is calculated in Supporting
Information, and the corresponding viscosity of the ink is estimated and provided at this rate
(Figure S8b).
Rheological properties of the ink were characterized using a Malvern Bohlin Gemini HR
rheometer equipped with 40 mm parallel plates (with the serrated surface to minimize the slippage
during the tests). A solvent trap was used to avoid water evaporation during the test. The
rheological protocol used, and the values of the yield stress and viscosity versus shear rates are
presented in Figure 5.S8 (Supporting Information). The shear rate at the nozzle was calculated
using previously developed equations [64,65] (see details in the Supporting Information) and the
corresponding viscosity of the ink was estimated and provided at this rate (Figure 5.S8b,
Supporting Information).
3D-Printing: A bespoke system is developed by merging a 3D printer typically used for
printing thermoplastics (Ultimaker 2 Extended+) with a stepper motor-driven extrusion system
(Structur3d Discov3ry Paste Extruder) capable of applying desirable extrusion rates to mounted
75 mL ink-charged syringes. The 3D printer hardware is modified by mounting a lightweight
aluminum nozzle holder on the gantry for nozzle placement. The printer and extrusion system are
connected through standard luer locks and polyethylene tubing. Slicer-generated g-code command
included X,Y, Z point cloud coordinates, E (extrusion), and F (printing speed) commands specific
to each design. A nozzle with an internal diameter of 1.36 mm, a layer thickness of 1 mm, and a
printing speed of 250 mm min-1 is used throughout. The resulting filaments have a nominal width

109
of 1.63 mm and a height of 1 mm. The nominal width is calculated by multiplying internal nozzle
diameter by a factor of 1.20 to account for die-swell effect. Specimens are transferred to a curing
chamber with a relative humidity of 93 ± 1 % (using potassium nitrate) at 25 °C immediately after
printing or casting. The specimens were cast and printed in the lab environment at 18 ± 3 °C and
45 ± 5 % relative humidity. During casting, the paste was carefully poured into the mold to ensure
no additional entrapped air is introduced during casting.
Characterization: The modulus of rupture and flexural strength and modulus-of-rupture
(MOR), is used to characterize the mechanical properties of the specimens. These properties were
determined using uniaxial three-point bending (3PB) testing of prism specimens and multi-axial
ball-on-three-ball (B3B) testing of disc-shaped specimens. For 3PB testing, prisms are designed
to have final dimensions of 12 x 12 x 40 mm, with surfaces being ground flat prior to testing to
ensure acceptable tolerances and good contact with test support plates [66]. MOR is calculated based
on the measured dimensions of each specimen. B3B testing was selected for determination of the
flexural strength of disc specimens due to its high sensitivity to internal defects and insensitivity
to outer and surface imperfections [67,68]. A load is applied via a central ball on the top face of a
round, disc-shaped specimen of 55 mm diameter and 8 mm thickness supported underneath by
three equally sized, equidistantly spaced balls placed on a 50 mm diameter circle [69]. Bouligand
structure discs are aligned to ensure that bottom filament orientation is aligned with the maximum
stress field. A stereo microphone device (Zoom iQ6) with customizable stereo width is used to
capture crack noise.
Force and displacement for both tests are measured using a 10 kN capacity test rig (MTS
insight 10). All reported data is an average of at least two separate results. The relative densities
of specimens were calculated from measured mass and volume of each specimen divided by the
average mass of conventionally cast ‘solid’ specimens. Specific MOR is calculated by dividing
the MOR value for each specimen by its relative density. WOF is calculated by integrating the
entire areas under load-displacement curves. The specific WOF was calculated by dividing the
WOF value for each specimen by its relative density. Although the first crack occurs at the first
drop in the load-displacement curve, the WOF based on the entire area under the load-displacement
curve. Two theoretical relationships between porosity and strength for brittle materials are
presented in Figure 5.3d and describe the strength-porosity relationship of lightweight cellular
structures based on the strength of a control specimen with zero porosity [57,70,71]. All specimens
110
are tested at the age of 3 days (72 ± 2 hours). Aluminum powder and variations of water/cement
ratios are used to cast lightweight cellular specimens.
X-ray micro-CT characterization: An X-ray microscope (XRM), Zeiss Xradia 510 Versa
which allows for an increase in the resolution of scans through dual-stage magnification process
was utilized. In the first stage (i.e., 0.4X scan), the field of view (FOV), desirable to scan the entire
volume of the specimens was established via geometric magnification process, which involved
setting distances between the source, detector, and specimen (as in conventional micro-CTs) [72,73].
In a second stage (4X scan), additional optical magnification was enabled at the detector system
through objective lenses. The detector is equipped with scintillator and objective lens which
converts X-rays to light rays and thus allows for optical magnification and higher resolution. The
0.4X scans were performed for a solid Bouligand architecture with = 8°, a solid prism specimen
with 0° filament orientation, and a cellular Bouligand architecture specimen with = 8°. Using
this magnification allowed a large FOV and thus facilitated to scan the entire specimens (55.1 µm,
37.2 µm, and 46.8 µm pixel size, respectively). For the solid prism, this was followed by a 4X
scan, allowing higher resolution (4.42 µm pixel size) at the region of interest near the main crack
(ROI). The beam energies of 150 KeV, 140 KeV, 90 KeV, 100 KeV, the power levels of 10 W, 10
W, 8 W, and 9 W, and exposure times of 4 s, 2 s, 4 s, and 14 s were used for 0.4X scans of the
solid Bouligand architecture with = 8° and 45°, and the 0.4X and 4X scans of the solid prism
specimens with 0° filament, respectively. Dragonfly software was used for post-processing of the
data.
5.3 Appendix
Supporting Information is available from the Wiley Online Library or from the author.
5.4 Acknowledgments
The authors gratefully acknowledge generous support from the National Science Foundation
(CMMI 1562927) of this research. The authors would also like to thank the BASF chemicals
company for providing materials.
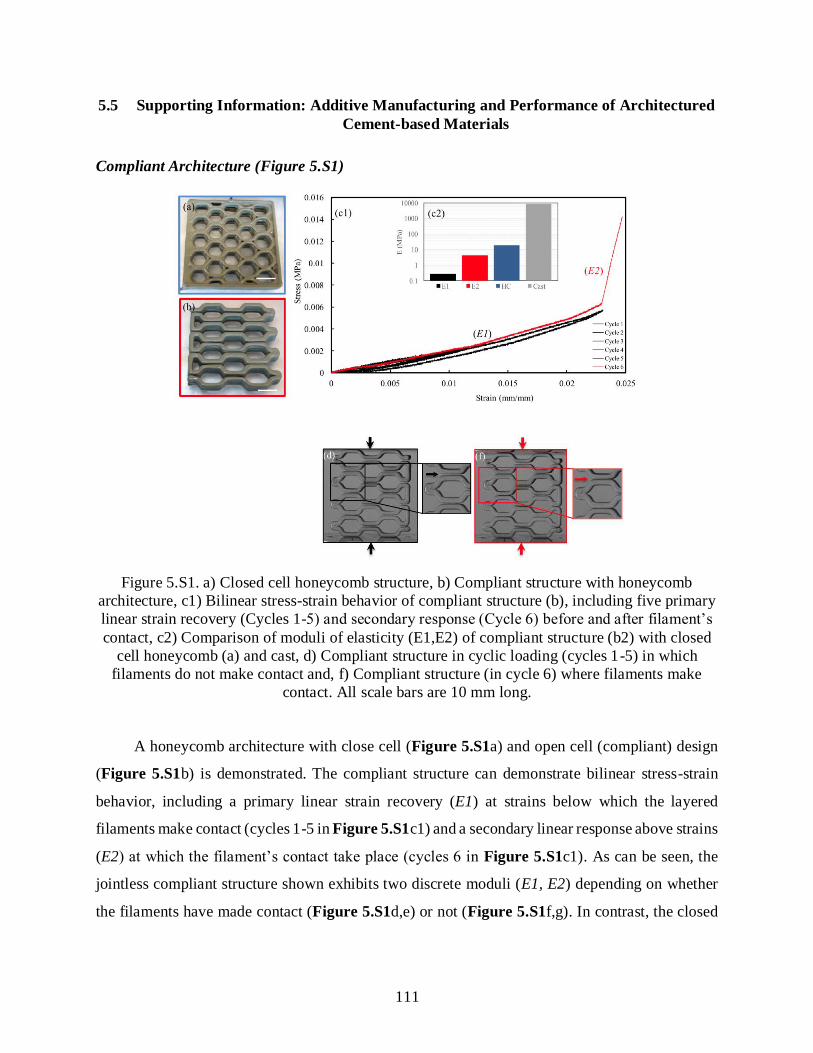
111
5.5 Supporting Information: Additive Manufacturing and Performance of Architectured
Cement-based Materials
Compliant Architecture (Figure 5.S1)
Figure 5.S1. a) Closed cell honeycomb structure, b) Compliant structure with honeycomb
architecture, c1) Bilinear stress-strain behavior of compliant structure (b), including five primary
linear strain recovery (Cycles 1-5) and secondary response (Cycle 6) before and after filament’s
contact, c2) Comparison of moduli of elasticity (E1,E2) of compliant structure (b2) with closed
cell honeycomb (a) and cast, d) Compliant structure in cyclic loading (cycles 1-5) in which
filaments do not make contact and, f) Compliant structure (in cycle 6) where filaments make
contact. All scale bars are 10 mm long.
A honeycomb architecture with close cell (Figure 5.S1a) and open cell (compliant) design
(Figure 5.S1b) is demonstrated. The compliant structure can demonstrate bilinear stress-strain
behavior, including a primary linear strain recovery (E1) at strains below which the layered
filaments make contact (cycles 1-5 in Figure 5.S1c1) and a secondary linear response above strains
(E2) at which the filament’s contact take place (cycles 6 in Figure 5.S1c1). As can be seen, the
jointless compliant structure shown exhibits two discrete moduli (E1, E2) depending on whether
the filaments have made contact (Figure 5.S1d,e) or not (Figure 5.S1f,g). In contrast, the closed

112
cell honeycomb architecture (HC) and cast element exhibit only one value of modulus (Figure
5.S1c2).
This dual response of the honeycomb structure can be likely customized to other types of
structures by suitable design of the architecture, selection of spacing between filaments, and
changes in material properties. The strain at failure of the cast hardened cement paste element is
of about 0.008. This is in the general range reported for typical hardened cement paste [39]. In
contrast, the strain at failure observed in the compliant structure was much higher (as high as 0.025
in the bi-linear region).
Characterization of Material Strength (i.e., filament strength) and Interfacial Strength (Figure
5.S2)
The strength of a single filament and the interfacial strength was estimated using 3-Point-
Bending (3PB) test on prism printed and cast specimen. To obtain material tensile strength, an
experiment with specimens of varying thickness was designed. Cast specimen with 10 mm width
and 1, 2, 5, and 12 mm thickness were made and tested in 3PB, and the specific MOR was obtained
(as outlined in grey in Figure 5.S2). Similarly, printed specimen with 10 mm width and 1, 2, 5,
and 12 mm thickness (corresponding to 1, 2, 5, and 12 layers) and 0° filament orientation were
fabricated and tested in 3PB, and the specific MOR was obtained (as outlined in blue in Figure
5.S2). As the thickness of specimens increases, this specific MOR as reported in Figure 5.S2a
reaches a plateau for the specimens with a thickness greater than 5 mm. As the bottom layers
remain in tension, the average tensile strength of a single filament is assumed to be the average
strength of the prisms at the plateau.
To obtain interfacial strength, prisms with 10 mm width, 12 mm thickness and 90° filament
orientation was fabricated. The specimens were tested in 3PB, and specific MOR was obtained.
An evident cleavage, parallel to the filaments (as shown in Figure 5.S2e in XY plane), was
observed in the fractured prisms with 90° filament orientation. The interfacial strength is assumed
to be the average strength of the element with 90° filament orientation.
The average value for interfacial strength as estimated from the 12 mm thick prism with 90°
filament orientation is found to be 246.4 ± 49.1. The average filament strength as estimated from
the 12 mm thick prism with 0° filament orientation and the cast is found to be 317.2 ± 95.5 and
243.1 ±73.6, respectively (as outlined in green rectangle in Figure 5.S2a. It must be noted that the

113
specimens with 12 mm layer height and 0° and 90° filament orientations in Figure 5.S2 are also
presented in Figure 5.2a, and is deployed here to provide the interfacial strength and filament
strength.
Although the estimated average value of interfacial strength is lower that the tensile strength
of the materials, when the estimated strength of the filament and the interface are compared, no
statistically significant difference was found.
Figure 5.S2. a) Specific MOR vs. prism thickness for cast specimen (schematically shown in
grey (b)), printed prism with 0o filament orientation specimens (schematically shown in blue (c));
and the Specific MOR of the prism with 90o filament orientation specimens (schematically
shown in red (d)). Dash lines present limits corresponding to the minimum and maximum values
of error bars in cast (grey) and printed prisms with 0o (in blue).
Micro-CT Characterization of the interface in Solid Bouligand Architectures (with 8° and
100% infill) and in Solid Prism (with 0° filament orientation, Figure 5.S3)
To investigate the characteristics of the interface, the microstructure of solid hardened
cement paste Bouligand architecture disc with 8° (Figure 5.S3a,b) and solid prism specimen
with 0° filament orientation (Figure 5.S3c,d) was characterized using micro-CT. In micro-CT

114
images of hcp, darker intensities represent pores filled with air or water, with greyscale intensities
corresponding to hydrated cement paste products [72].
The horizontal slices (C1,T1) shown in cross-sectional (H9) view in Figure 5.S3c,
corresponds to the ‘core’ (i.e., through the interface) and ‘interfacial regions’ (IRs) of the filaments
as indicated in plan view (Figure 5.S6d) for the solid Bouligand architecture with 8°. Similarly,
The horizontal slices (C2,T2) shown in cross-sectional (H8) view in Figure 5.S6a, corresponds to
the core (i.e., through the interface) and interfacial regions (IRs) of the filaments as indicated in
plan view (Figure 5.S6b) for the solid Bouligand architecture with 8°. Analysis of Figures
5.S6b,d indicates that porosity (appearing in these figures as darker regions within the hardened
cementitious matrix as indicated by arrows) are only present in the images representing slices (T1,
T2) through the interface (i.e., they are absent from images representing slices through the cores,
C1 and C2). The typical horizontal slices of C1, C2, T1, T2 demonstrate the homogeneous
characteristics of the microstructure along the cores (C1, C2), compared to the heterogeneous
characteristics of the microstructure along the IRs where interfacial porosity is present (T1, T2).
The observation interfacial porosity is typical in IRs and the cores in both prism and disc
elements and was made possible due to the differences in the gray level intensities between the
signals from the core sections and interfaces of the filaments in the micro-CT. Application of
micro-CT characterization technique for 3D-printed solid Bouligand architecture and prism
demonstrates the presence of the processing-induced interfacial heterogeneities and that it can
follow the architectural pattern. While these heterogeneities can give rise in anisotropic properties
and mechanical response of architectured hcp elements, they are utilized in this chapter, to allow
the spread of the damage through this heterogeneous network of IRs. Fine-tuning of the interfacial
strength via optimization of processing and printing parameters, environmental conditions can
allow better control of the mechanical response of the elements. The equivalent strength of the hcp
filament and the interface found in Figure 5.S2 can be of considerable prominence. The interfacial
strength, due to its equivalence to filaments strength would not sacrifice the overall strength of the
element and therefore allows 3D-printed prisms to obtain similar MOR compared to cast
counterparts as discussed in Figure 5.2a.
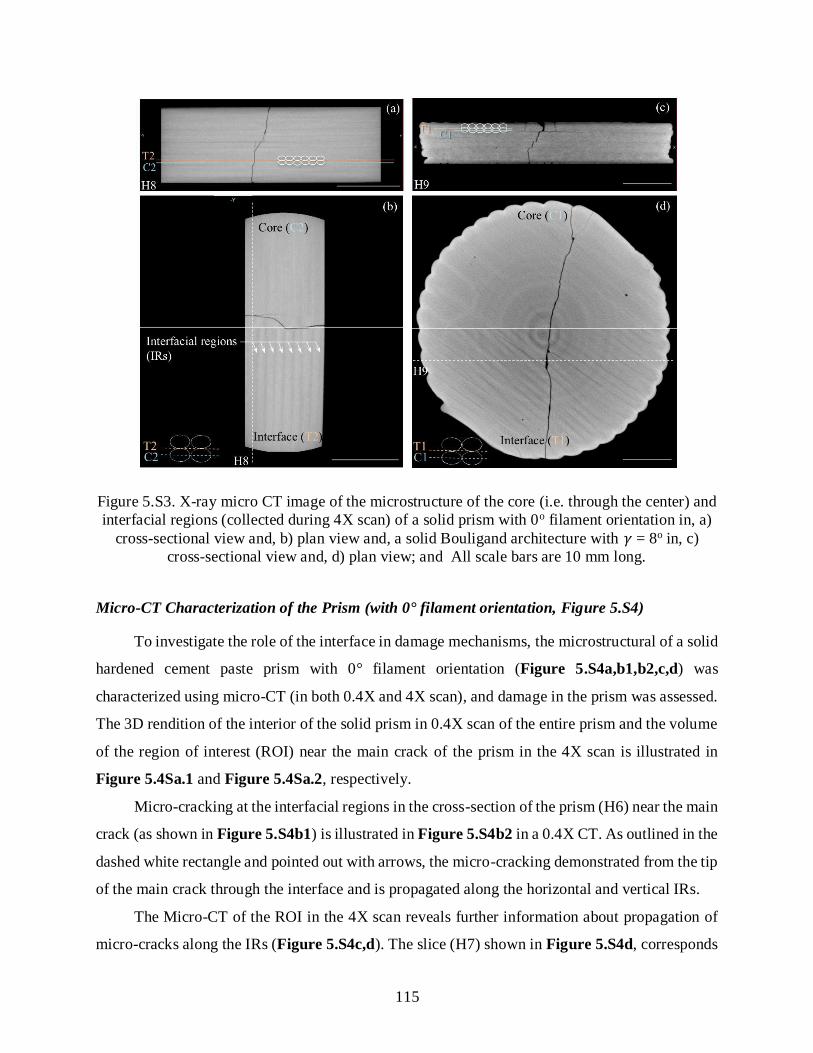
115
Figure 5.S3. X-ray micro CT image of the microstructure of the core (i.e. through the center) and
interfacial regions (collected during 4X scan) of a solid prism with 0o filament orientation in, a)
cross-sectional view and, b) plan view and, a solid Bouligand architecture with 𝛾 = 8o in, c)
cross-sectional view and, d) plan view; and All scale bars are 10 mm long.
Micro-CT Characterization of the Prism (with 0° filament orientation, Figure 5.S4)
To investigate the role of the interface in damage mechanisms, the microstructural of a solid
hardened cement paste prism with 0° filament orientation (Figure 5.S4a,b1,b2,c,d) was
characterized using micro-CT (in both 0.4X and 4X scan), and damage in the prism was assessed.
The 3D rendition of the interior of the solid prism in 0.4X scan of the entire prism and the volume
of the region of interest (ROI) near the main crack of the prism in the 4X scan is illustrated in
Figure 5.4Sa.1 and Figure 5.4Sa.2, respectively.
Micro-cracking at the interfacial regions in the cross-section of the prism (H6) near the main
crack (as shown in Figure 5.S4b1) is illustrated in Figure 5.S4b2 in a 0.4X CT. As outlined in the
dashed white rectangle and pointed out with arrows, the micro-cracking demonstrated from the tip
of the main crack through the interface and is propagated along the horizontal and vertical IRs.
The Micro-CT of the ROI in the 4X scan reveals further information about propagation of
micro-cracks along the IRs (Figure 5.S4c,d). The slice (H7) shown in Figure 5.S4d, corresponds

116
to the cross-section of the ROI in XZ plane (Figure 5.S54). The hairline micro-cracking at the IRs
(appearing thin hairline dark regions) was observed to be present near a micro-crack and to
propagate at the horizontal and vertical IRs as shown by the arrows in Figure 5.S4c.
Figure 5.S4. X-ray micro-CT images of the microstructure of post-fracture solid prim specimen
with 0o filament orientation collected during 0.4X scan: a.1) 3D rendition of the entire volume of
specimen in 0.4X scan and corresponding volume of the region of interest (ROI) in the 4X scan,
a.2) 3D rendition of the entire volume of specimen including the cylindrical region of interest
(ROI) for 4X scan, b.1) 2D image of the cross-section in YZ plane in 0.4X scan, b.2) 2D image
of the cross-section in XY plane in 0.4X scan, c) 2D images in the XZ plane in 4X scan and, d)
2D images in the XY plane in 4X scan. Unless indicated, all scale bars are 1 mm.

117
Comparison of Strength and Work of failure (WOF) between Bouligand Architecture and Cast
Specimens (Figure 5.S5)
The mechanical properties (MOR and WOF) of solid and cellular Bouligand architectures
versus cast counterparts presented in Figure 5.2c, is further elucidated in Figure 5.S5a,b. In terms
of work of fracture, when the average WOF of cellular Bouligand architectures specimens of pitch
angles 90°, 45°, and solid Bouligand architectures specimens of 8° (as outlined in the light
blue in Figure 5.S5a) were compared with that of solid cast specimens (as outlined in the light
grey in Figure 5.S5a), a statistically significant enhancement of the Bouligand architectures was
found. This significant enhancement indicates that both solid ( 8°) and cellular ( 90°, 45°)
architectures can provide significantly enhanced work of failure compared to cast elements.
In terms of strength, when the average Specific MOR of Bouligand architectures specimens
with various pitch angles including 15°, 30° 45°, 90° (i.e., cases where ≥ 15° as outlined in
the light blue in Figure 5.S5b) were compared with that of solid cast specimens (as outlined in the
light grey in Figure 5.S5b), no statistically significant loss of Specific MOR was found. This
demonstrates that most cases of Bouligand architectures (where ≥ 15° could maintain specific
MOR compared to cast elements.
Although larger pitch angles do not exhibit interfacial damage mechanisms and rather show
cracking through the filament, the enhanced WOF in cellular cases where ≥ 45° and solid case
with 8°, demonstrates that larger pitch angles allow for solid failure in the filaments and on
itself can provide higher fracture properties as a promising architectured structure. The comparison
of strength and work of failure between Bouligand architectures and monolithic cast hcp specimen
provides supporting evidence that architectured hcp can provide significant enhancement without
compromising the strength. We surmise that low pitch angles, that allow crack propagation along
the interfaces leading to twisting crack patterns, will be more efficient for larger specimens where
delocalization can be promoted.

118
Figure 5.S5. a) Specific WOF vs. Specific MOR and, b) WOF vs. MOR of the cast specimens
(outlined in grey), Bouligand architecture specimens with varying pitch angles 𝛾 = 8o (solid),
15o,30o,45o,90o (outlined in blue), and solid Bouligand architecture specimens with 60% infill
and pitch angles 𝛾 = 8o (outlined in green)
Micro-CT Characterization of Solid Bouligand Architecture (with 8° and 100% infill,
Figure 5.S6)
To investigate the role of the interface in damage mechanisms, the microstructure of a solid
hardened cement paste Bouligand architecture disc (Figure 5.S6a,b,c,d) was characterized using
micro-CT (in 0.4X magnification) and the interfacial damage mechanisms were investigated.
These mechanisms are illustrated in Figure 5.S6b,c,d for XY, XZ, YZ planes and in Figure 5.S6a
for 3D rendition of the interior of the solid Bouligand architecture. In micro-CT images of fractured
hcp, cracks, micro-cracks and voids correspond to darker greyscale intensities [72].
The slices (H1 to H5 in XZ plane in Figure 5.S6c, and K1 to K5 in YZ plane in Figure
5.S6d) shown in the XY plane in Figure 5.S6b, corresponds to the cross-section of the solid
Bouligand architecture with 8° in XZ (Figure 5.S6c) and YZ planes (Figure 5.S6d),
respectively. Micro-cracking at the IRs (appearing darker regions near the main crack) was
observed between the layers 6 and 7 (H1, to H3, K1 to K5), layers 4 and 5 (H2 to H5), and layers
3 and 4 (H4, H5) as depicted in Figure 5.S6c,d and pointed out by arrows. This micro-cracking is
typically spread in both directions throughout the IRs. Moreover, crack advancement at the
interfacial regions (appearing dark regions with broader width than micro-cracks) was observed
between layers 3 and 4 (H4, H5, K1 to K3) and layers 4 and 5 (K4) as depicted in Figure 5.S6c,d,
and the orange layer numbers. The cracking advancement through the interface was resulted in

119
crack staggering (as shown in Figure 5.S6a.2) and accompanied by micro-cracking at the interface.
It is surmised that the characteristics of porous IRs (as discussed in Figure 5.S3c,d), favors the
growth along the interfaces. Although an equivalent interfacial and materials strength was found
(Figure 5.S2), the micro-cracking and crack advancement through the interface can be attributed
to its porous characteristics and lower strength and toughness at a smaller scale (i.e. that
macroscopic scale).
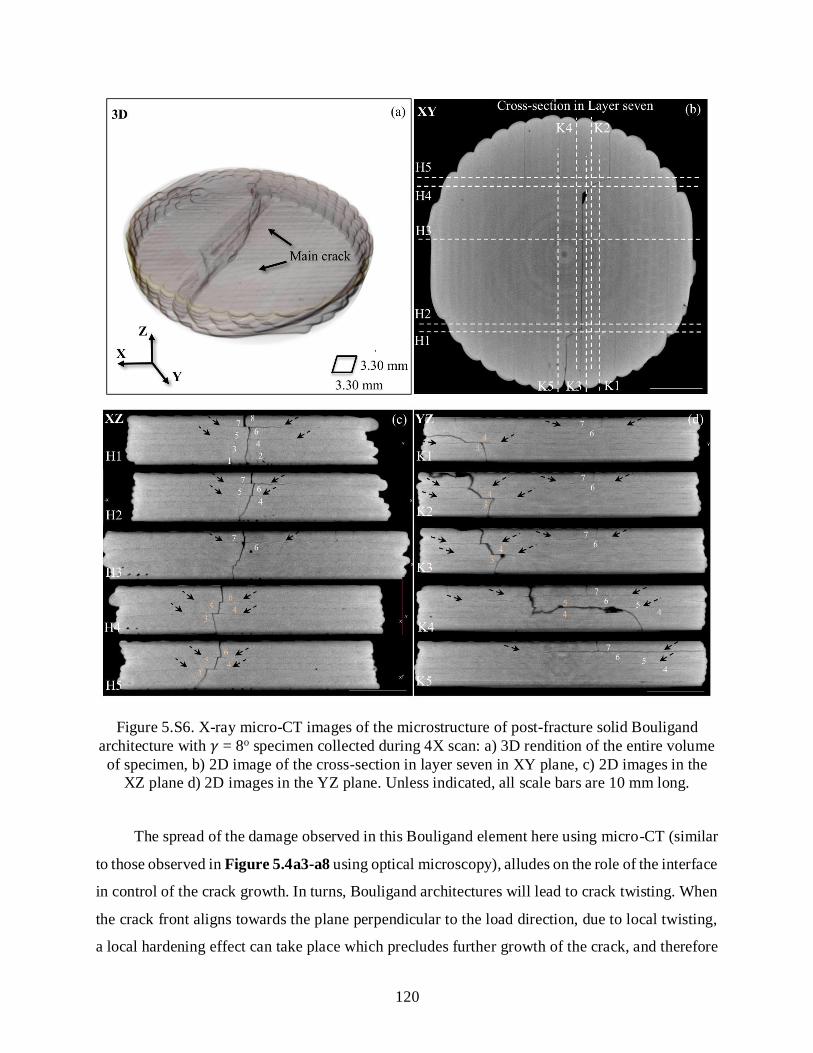
120
Figure 5.S6. X-ray micro-CT images of the microstructure of post-fracture solid Bouligand
architecture with 𝛾 = 8o specimen collected during 4X scan: a) 3D rendition of the entire volume
of specimen, b) 2D image of the cross-section in layer seven in XY plane, c) 2D images in the
XZ plane d) 2D images in the YZ plane. Unless indicated, all scale bars are 10 mm long.
The spread of the damage observed in this Bouligand element here using micro-CT (similar
to those observed in Figure 5.4a3-a8 using optical microscopy), alludes on the role of the interface
in control of the crack growth. In turns, Bouligand architectures will lead to crack twisting. When
the crack front aligns towards the plane perpendicular to the load direction, due to local twisting,
a local hardening effect can take place which precludes further growth of the crack, and therefore

121
promotes initiation and growth in other neighboring sites. This delocalization helps the spread of
the damage in larger volumes and can lead to flaw-tolerant behaviors.
Determination of Extrusion Rate of Cementitious Ink
The shear rate of the cementitious ink during extrusion at the tip of the nozzle was
determined using following equation [70,71]:
�̇� = 4𝑄
𝜋𝑟3 (S1)
Where Q, is the volumetric flow rate during extrusion at the tip of the nozzle with internal
radius r equal to 0.68 mm. The value of flow rate was determined by measuring the mass of
extruded materials over a specified time period and calculating the volumetric flow rate based on
the density of extruded paste. The paste was extruded over 15 minutes and the mass of was
measured as 8.86 g. The density of the extruded paste was separately determined as 2.28 ±0.06 g
cm−3. The flow rate is calculated as 4.62 mm3 s−1. The strain rates during extrusion were then
calculated based on equation 1, resulting in �̇� equal to 18.70 s−1. The corresponding viscosity of
the cementitious ink at this shear rate can be determined at this sheared.
Figure 5.S7. a) Shear stress and, b) viscosity as function of shear rate of the cementitious ink

122
Comparison of Competing Mechanisms in Bouligand architectures with small ( 8° ) and
large ( 45°) pitch angles demonstrated in 3D rendition upon Micro-CT processing (Figure
5.S7)
The Micro-CT characterization of a cellular Bouligand architecture with large pitch angle
= 45o is compared with that of small solid pitch angle ( = 8o) in order to evaluate the damage
mechanisms in small and large pitch angles (Figure 5.S8, Videos S15-S18). The shear failure of
the filaments at this large pitch angle (Figure 5.S7a,b, and Videos 5.S15-S18) demonstrates the
crack propagation through the filament. In contrast (as discussed in Figure S6), the interfacial
damage mechanisms are present at the small pitch angle ( = 8o) and crack twisting was allowed
(Figure 5.S7c,d). Comparison of the small and large pitch angles demonstrate the capacity of small
pitch angle to promote damage and flaw-tolerant behavior.
Ink Rheological Properties: Yield Stress and Viscosity (Figure S8)
The rheological behavior of cementitious ink is shown in Figure 5.S8. Stress and viscosity
were obtained as a function of shear rate by measuring shear stress for controlled shear rates in
ascending order at a fixed temperature of 23.6 °C (Figure 5.S8a,b). Shear rates were increased
logarithmically from 1 s−1 to 140 s−1. A water trap was used to minimize drying of the suspension
during testing. The samples were pre-sheared each time at 50 s−1 for 30 s and followed by a 10 s
resting time during which no shear was applied. Three replicate tests were performed. The obtained
stress and shear rate were fitted to Bingham model as follow to estimate the yield stress:
τ = 𝜏0 + 𝜇 �̇� (S2)
where τ , 𝜏0, 𝜇 and �̇� are shear stress (Pa), yield stress (Pa), viscosity (Pa.s), and shear rate (s−1).
The average static yield stress of 143.0 Pa was found based on the fitted linear Bingham
model. The viscosity of the ink corresponding to the shear rate of 18.70 s−1 (calculated based on
Equation 1) was determined by interpolating the data corresponding to Figure 5.S8b. An average
viscosity of 15.9 Pa.s was found.
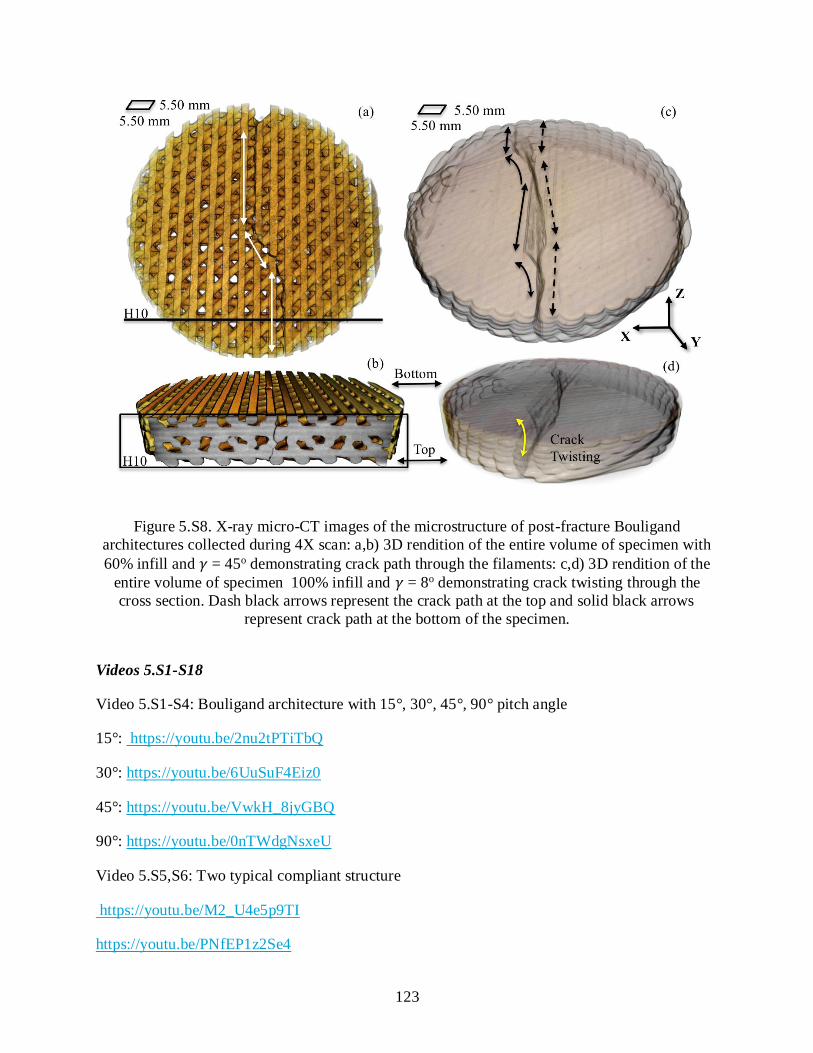
123
Figure 5.S8. X-ray micro-CT images of the microstructure of post-fracture Bouligand
architectures collected during 4X scan: a,b) 3D rendition of the entire volume of specimen with
60% infill and 𝛾 = 45o demonstrating crack path through the filaments: c,d) 3D rendition of the
entire volume of specimen 100% infill and 𝛾 = 8o demonstrating crack twisting through the
cross section. Dash black arrows represent the crack path at the top and solid black arrows
represent crack path at the bottom of the specimen.
Videos 5.S1-S18
Video 5.S1-S4: Bouligand architecture with 15°, 30°, 45°, 90° pitch angle
15°: https://youtu.be/2nu2tPTiTbQ
30°: https://youtu.be/6UuSuF4Eiz0
45°: https://youtu.be/VwkH_8jyGBQ
90°: https://youtu.be/0nTWdgNsxeU
Video 5.S5,S6: Two typical compliant structure
https://youtu.be/M2_U4e5p9TI
https://youtu.be/PNfEP1z2Se4
124
Video 5.S7-S9: Sandwich panel beams with closed top and bottom face
https://youtu.be/ahOkzXWCzSY
https://youtu.be/gjx-aQ9oEj4
https://youtu.be/q4qNOJmoIKk
Video 5.S10: Grid structure
https://youtu.be/8DW6l7EfkP4
Video 5.S11: 3D rendition of solid Bouligand architecture with 8° pitch angle upon micro-CT
processing
https://youtu.be/nWq6YUegEKc
Video 5.S12: XY view of the 2D slices of solid Bouligand architecture with 8° pitch angle upon
micro-CT processing
https://youtu.be/X8gBezIEfXw
Video 5.S13: XZ view of the 2D slices of solid Bouligand architecture with 8° pitch angle upon
micro-CT processing
https://youtu.be/5u5EY_0tWVo
Video 5.S14: YZ view of the 2D slices of solid Bouligand architecture with 8° pitch angle upon
micro-CT processing
https://youtu.be/7oshAJOi32A
Video 5.S15: 3D rendition of the Cellular Bouligand architecture with 45° pitch angle upon micro-
CT processing
https://youtu.be/l2PIKQKpJjg
Video 5.S16: XY view of the 2D slices of solid Bouligand architecture with 45° pitch angle upon
micro-CT processing
https://youtu.be/KlcFeBvGYas
Video 5.S17: XZ view of the 2D slices of cellular Bouligand architecture with 45° pitch angle
upon micro-CT processing
https://youtu.be/0YXX4e-2pqA
Video 5.S18: YZ view of the 2D slices of cellular Bouligand architecture with 45° pitch angle
upon micro-CT processing
125
https://youtu.be/ChQcDmeDHpc
Video 5.S19: Processing-induced heterogeneities at the Interfacial Regions (IRs) of 3D-printed
hardened cement paste upon X-ray Micro-CT Processing (Filament height is 1 mm)
https://youtu.be/NhbKg2xOBd4
5.6 References
[1] U. G. Wegst, H. Bai, E. Saiz, A.P. Tomsia, R. O. Ritchie, Nat. Mater. 2015, 14, 23.
[2] E. B. Duoss, T.H. Weisgraber, K. Hearon, C. Zhu, W. Small, T.R. Metz, J.J. Vericella, H.
D. Barth, J.D. Kuntz, R. S. Maxwell, C.M. Spadaccini, Adv. Funct. Mater. 2014, 24, 4905.
[3] J. P. Lewicki, J. N. Rodriguez, C. Zhu, M.A. Worsley, A.S. Wu, Y. Kanarska, J.D. Horn,
E. B. Duoss, J. M. Ortega, W. Elmer, R. Hensleigh, 2017, Sci. Rep. 7, 43401.
[4] B. G. Compton, J. A. Lewis, Adv. Mater. 2014, 26, 5930.
[5] K. T. Sullivan, C. Zhu, E. B. Duoss, A. E. Gash, D. B. Kolesky, J. D. Kuntz, J.A. Lewis,
C.M. Spadaccini, Adv. Mater. 2016, 28, 1934.
[6] A.S. Gladman, E.A. Matsumoto, R. G. Nuzzo, L. Mahadevan, J. A. Lewis, Nat.
Mater. 2016, 15, 413.
[7] C. Gosselin, R. Duballet, P. Roux, N. Gaudillière, J. Dirrenberger, P. Morel, Mater. Des.
2016, 100, 102.
[8] S. Bukkapatnam, J. Mander, S. Paal, ZJ. Pei, L. Zeng, NSF Worksh. on Addit. Manuf. for
Civ. Infr. Des. and Constr., Washington D.C., (July, 2017).
[9] D. Ouyang, N. Li, L. Liu, J. Alloys Compd. 2018, 740, 603.
[10] D. Herzog, V. Seyda, E. Wycisk, C. Emmelmann, Acta Mater. 2016, 117, 371.
[11] J.R.C. Dizon, A.H. Espera, Q. Chen, R.C. Advincula, Addit. Manuf. 2017, 20, 44.
[12] J.T. Cantrell, S. Rohde, D. Damiani, R. Gurnani, L. DiSandro, J. Anton, A. Young, A.
Jerez, D. Steinbach, C. Kroese, P.G. Ifju, Rapid Prototyping J. 2017, 23, 811.
[13] X. Zheng, W. Smith, J. Jackson, B. Moran, H. Cui, D. Chen, J. Ye, N. Fang, N. Rodriguez,
T. Weisgraber, C.M. Spadaccini, Nat. Mater. 2016, 15, 1100.
[14] K. Christensen, B. Davis, Y. Jin, Y. Mater. Sci. Eng. C, 2018, 89, 65.
[15] M. DeVries, G. Subhash, A. Mcghee, P. Ifju, T. Jones, J. Zheng, V. Halls, J. Eur. Ceram.
Soc. 2018, 38, 3305.
[16] G.X. Gu, M. Takaffoli, M.J. Buehler, Adv. Mater. 2017, 29.

126
[17] M. R. Mansouri, H. Montazerian, S. Schmauder, J. Kadkhodapour, Compos. Struct. 2018,
184, 11.
[18] L.R. Meza, D. Satyajit, J.R. Greer. Sci. 2014, 345, 1322.
[19] M. G. Rashed, M. Ashraf, R.A.W. Mines, P.J. Hazell, Mater. Des. 2016, 95, 518.
[20] J. Bauer, S. Hengsbach, I. Tesari, R. Schwaiger, O. Kraft, Proc. Natl. Acad. Sci. 2014, 111,
2453.
[21] C. Lv, X.C. Sun, H. Xia, Y.H. Yu, G. Wang, X.W. Cao, S.X. Li, Y.S. Wang, Q.D. Chen,
Y.D. Yu, H.B. Sun, Sens. Actuators, B, 2018, 259, 736.
[22] A. Zolfagharian, A.Z. Kouzani, S.Y. Khoo, B. Nasri-Nasrabadi, A. Kaynak, Sens.
Actuators, A. 2017, 265, 94.
[23] P.T. Smith, A. Basu, A. Saha, A. Nelson, Polym. 2018, DOI:
10.1016/j.polymer.2018.01.070.
[24] P. Shakor, J. Sanjayan, A. Nazari, S. Nejadi, Constr. Build. Mater. 2017,138, 398.
[25] B. Zareiyan, B. Khoshnevis, Automat. Constr. 2017, 83, 212.
[26] B. Panda, S. C. Paul, M. J. Tan, Matter. Lett. 2017, 209, 146.
[27] S. C. Paul, Y.W. D. Tay, B. Panda, M. J. Tan, Arch. Civ. Mech. Eng. 2018, 18, 311.
[28] T. T. Le, S. A. Austin, S. Lim, R. A. Buswell, R. Law, A. GF. Gibb, T. Thorpe, Cement.
Concrete. Res. 2012, 42, 558.
[29] J. J. Biernacki, J. W. Bullard, G. Sant, K. Brown, F.P. Glasser, S. Jones, T. Ley, R.
Livingston, L. Nicoleau, J. Olek, F. Sanchez, J. Am. Ceram. Soc. 2017, 100, 2746.
[30] W. Gao, Y. Zhang, D. Ramanujan, K. Ramani, Y. Chen, C.B. Williams, C.C. Wang, Y.C.
Shin, S. Zhang, P.D. Zavattieri, Comput. Aided Des. 2015., 69, 65.
[31] B. Zareiyan, B. Khoshnevis, Automat. Constr. 2017, 81, 112.
[32] G. Franchin, P. Scanferla, L. Zeffiro, H. Elsayed, A. Baliello, G. Giacomello, M. Pasetto,
P. Colombo, J. of Eur. Ceram. Soc. 2017, 37, 2481.
[33] A. Perrot, D. Rangeard, A. Pierre, Mater. Struct. 2016, 49, 1213.
[34] D. D. Higgins, J. E. Bailey, J. Mater. Sci. 1976, 11,1995.
[35] N. B. Eden, J. E. Bailey, J. Mater. Sci. 1984, 19, 150.
[36] L. J. Struble, P.E. Stutzman, E.R. Fuller, J. Am. Ceram. Soc., 1989, 72, 2295.
[37] M. Hambach, D. Volkmer, Cem. Concr. Compos. 2017, 79, 62.
[38] P. Feng, X. Meng, J.F. Chen, L. Ye, Constr. Build. Mater. 2015, 93, 486.
127
[39] Harsh, S., Shen, Z. and Darwin, D., 1990.
[40] T. Ficker, IOP Conf. Ser.: Mater. Sci. Eng. 2017, 1.
[41] J.D. Birchall, A.J. Howard, K. Kendall, Nature, 1981, 289, 388.
[42] V. C. Li, M. Maalej, Y.-M. Lim, in Fracture of Brittle Disordered Materials: Concrete,
Rock and Ceramics (Eds: G. Baker, B. L. Karihaloo), CRC Press, New York, 2004, Part 2.
[43] L.J. Gibson, M. F. Ashby. Cellular solids: structure and properties, Cambridge university
press, 1999.
[44] Y. Zhang, H. Yao, C. Ortiz, J. Xu, M. Dao, J. Mech. Behav. Biomed. Mater. 2012, 15, 70.
[45] E. Lin, Y. Li, J.C. Weaver, C. Ortiz, M.C. Boyce, J. of Mater. Res. 2014, 29, 1867.
[46] H. Ming-Yuan, J.W. Hutchinson, Int. J. Solids Struct. 1989, 25, 1053.
[47] M.Y. He, A.G. Evans, J.W. Hutchinson, Int. J. Solids Struct. 1994, 31, 3443.
[48] G. Noselli, V.S. Deshpande, N.A. Fleck, Int. J. Fract. 2013, 183, 241.
[49] C. L. Salinas, E. E. de Obaldia, C. Jeong, J. Hernandez, P. Zavattieri, D. Kisailus, J. Mech.
Behav. Biomed. Mater. 2017, 76, 58.
[50] E. E. de Obaldia, C. Jeong, L.K. Grunenfelderb, D. Kisailus, P. Zavattieri, J. Mech. Behav.
Biomed. Mater. 2015, 48, 70.
[51] J.C. Weaver, G.W. Milliron, A. Miserez, K. Evans-Lutterodt, S. Herrera, I. Gallana, W.J.
Mershon, B. Swanson, P. Zavattieri, E. DiMasi, D. Kisailus, 2012 Sci. 336, 1275.
[52] Suksangpanya, N., Doctoral Thesis, Purdue University, December, 2016.
[53] N. Suksangpanya, N. A. Yaraghi, D. Kisailus, P. Zavattieri, J. Mech. Behav. Biomed.
Mater. 2017, 76, 38.
[54] N. Suksangpanya, N. A. Yaraghi, R. B. Pipes, D. Kisailus, P. Zavattieri, Int. J. Solids
Structs. 2018, DOI: 10.1016/j.ijsolstr.2018.06.004
[55] L.K. Grunenfelder, N. Suksangpanya, C. Salinas, G. Milliron, N. Yaraghi, S. Herrera, K.
Evans-Lutterodt, S.R. Nutt, P. Zavattieri, D. Kisailus, Acta Biomater. 2014, 10, 3997.
[56] L.K. Grunenfelder, S. Herrera, D. Kisailus, Crustacean‐Derived Biomimetic Components
and Nanostructured Composites. Small, 2014, 10, 3207.
[57] Chen, X., Wu, S. and Zhou, J., Constr. Build. Mater. 2013, 40, 869.
[58] E. Munch, M.E. Launey, D.H. Alsem, E. Saiz, A.P. Tomsia, R.O. Ritchie, Sci. 2008, 322,
1516.
[59] S. W. Cranford, A. Tarakanova, N.M. Pugno, M.J. Buehler, Nat. 2012, 482, 72.

128
[60] R.O. Ritchie, Nat. Mater, 2011, 10, 817.
[61] ASTM C150 – 17, Standard Specification for Portland Cement.
[62] ASTM C494 – 16, Standard Specification for Chemical Admixtures for Concrete.
[63] M. Moini, Master’s thesis, University of Wisconsin-Milwaukee, August, 2015.
[64] L. Rueschhoff, W. Costakis, M. Michie, J. Youngblood, R. Trice, Int. J. Appl. Ceram.
Technol. 2016, 13, 821.
[65] N. G. McCrum, C. P. Buckley, C. B. Bucknall, Principles of Polymer Engineering, Oxford
University Press, New York 1997.
[66] ASTM C1161 – 13, Standard Test Method for Flexural Strength of Advanced Ceramics at
Ambient Temperature.
[67] A. Börger, P. Supancic, R. Danzer, J. of Eur. Ceram. Soc. 2002, 22, 1425.
[68] A. Börger, P. Supancic, R. Danzer, J. of Eur. Ceram. Soc. 2004, 24, 2917.
[69] Y. Cao, P. Zavaterri, J. Youngblood, R. Moon, J. Weiss, Cem. Concr. Compos. 2015, 56,
73.
[70] J.S. Magdeski, J. Univ. Chem. Technol. Metall. 2010. 45, 143.
[71] L.F. Nielsen, J. Am. Ceram. Soc. 1990, 73, 2684.
[72] M. Moini, J. Olek, B. Magee, P. Zavattieri, J. Youngblood, 1st Rilem Int. Conf. on Concr.
and Dig. Fab., Zurich, (September, 2018).
[73] S. C. De Wolski, J. E. Bolander, E. N. Landis, 2014, Exp. Mech. 54, 1227.

129
INFLUENCE OF INTERNAL ARCHITECTURES ON MECHANICAL
RESPONSE AND FRACTURE BEHAVIOR OF 3D-PRINTED
CEMENT-BASED ELEMENT UNDER COMPRESSIVE LOAD
This chapter contains experimental data collected by Mohamadreza Moini. Fabian
Rodriguez assisted with the fabrication of 3D-printed elements and conducting mechanical testing.
Data conceptualization was a collaborative effort with Jan Olek, Jeffrey P. Youngblood, and Pablo
D. Zavattieri. The manuscript was written by Mohamadreza Moini and the Jan Olek, Jeffrey P.
Youngblood, and Pablo D. Zavattieri provided editing.
Highlights
Layer-wise 3D-printing and materials architecture determines the mechanical response and
fracture behaviors.
In lamellar architecture, nearly straight vertical cracks localized at the pre-existing weak
interfaces were observed filaments.
In Bouligand architecture, widespread helical delocalization of cracks into smaller
microcracks was observed.
Using Bouligand architecture allowed for higher energy dissipation capacities, maintaining
a steady post-peak, and increase in inelastic deformation without sacrificing the strength.
Abstract
Direct-ink-writing (DIW) is a 3D-printing process that provides the opportunity for
patterning the materials’ architecture in a layer-by-layer fashion. However, exploiting this
opportunity requires establishing a fundamental understanding of the relationship between the
materials’ architecture and the resulting mechanical properties. Moreover, the role of the
processing-induced interfaces on the fracture behavior of the architectured elements is not well
understood. This chapter investigates the compressive mechanical properties and fracture
behaviors of 3-days old hardened cement paste (hcp) elements. Cubical cement paste elements
were 3D-printed into two bio-inspired architectures known as ‘lamellar’ and ‘Bouligand’ using a
DIW process. A lab-based X-ray microscope (XRM) was used to characterize the crack pattern of
130
lamellar, Bouligand, and reference cast hcp elements upon testing. The mechanical
properties/response and the role of the processing-induced interfaces (between the filaments and
layers) on fracture behaviors are discussed. The internal architecture and the presence of the
interface were found to dictate and alter the overall mechanical response and fracture behaviors in
brittle hcp materials. While no specific fracture pattern was observed in the cast element, specific
fracture behavior of the lamellar element was dominated by interfacial cracking, aligned with the
orientation of filaments, and the fracture behavior of Bouligand element was dominated by a
distributed interfacial cracking, aligned with the helical orientation of filaments. Bouligand
architecture can be used to improve both work-of-fracture properties and allow for crack
delocalization by promoting the spread of the damage in 3D-printed hcp elements.
Keywords: Architectured hardened cement paste, Interfaces, Fracture behavior, 3D-Printing
6.1 Introduction
There has been an exponential rise in the fabrication of brittle cement-based [1–5],
geopolymeric [6–10], and ceramic [11–14] materials using 3D-printing technologies. Several
studies have demonstrated that 3D-printing allows for purposeful control of the materials’
architecture (i.e., the purposeful arrangement of internal geometries of materials) and potential
enhancement of mechanical properties such as fracture toughness, energy absorption, strain
recovery, impact resistance, and load-bearing capacity [15–19]. Particularly, the ability to fabricate
cement-based materials with complex forms and architectures via 3D-printing has resulted in novel
mechanical responses and unique performance characteristics [20–23]. However, the presence of
processing-induced heterogeneities such as weak and layered interfaces [24] in brittle materials
such as cement paste has remained a major challenge and has posed concerns in terms of
mechanical properties [25–30]. More specifically, several researchers have intended to eliminate
or strengthen the interfaces in 3D-printed cement-based materials due to its weak characteristics
[31–33], while some others have attempted to harness the weak interface by tying it to the materials’
architecture to control the mechanical response [20,22,34]. Nevertheless, there seems to be a great
deal of ambiguity on the role of the interfaces on the mechanical responses of cement-based
materials as well as lack of converging research on the best way to approach the interfaces. This
chapter investigated the compressive mechanical properties and fracture behaviors of architectured
131
brittle cement paste elements with weak interfaces induced during the 3D-printing process. Two
types of nature-inspired internal architectures: “lamellar” and “Bouligand” were used to
investigate the mechanical properties of 3D-printed hardened cement paste (hcp) elements in
comparison with reference cast hcp elements. A lab-based X-ray microscope (i.e., not requiring
synchrotron facilities). Subsequently, the property-fracture was used to investigate the cracking
pattern in fractured lamellar, Bouligand, and reference cast elements. The following were
examined: (a) the compressive stress-strain behavior, compressive strength, and work-of-failure,
and (b) the characteristics of cracks using an XRM.
6.2 Methods
6.2.1 3D-Printing, Slicing, and Design
A 3D printer capable of printing cement paste via layer-by-layer extrusion process with two
separate units was previously established by the authors and was used in this work [24]. A standard
Nordsen nozzle (gauge 15 with 1.36. I.D.) was used for depositing materials with a width of 1.63
mm. Similarly, a commercially available slicer (Simplify3D) was used to generate the G-code
commands. A slicing procedure was previously established by the authors and was used in this
work [24]. A cubical 3D object (25x25x25 mm cube) was inserted in the slicer to design the
printing paths necessary to achieve the desired lamellar and Bouligand elements. The geometrical
parameters (including filament height, width, and orientation at each layer) and processing
parameters (such as printing speed, extrusion multiplier, and infill percentage) were assigned using
the slicer. A continuous printing path in each layer was designed to create lamellar and Bouligand
elements, as shown in Figure 6.1a.1,b1. A rotation angle (also known as pitch angle ) of 3º per
layer (in the Z direction) was used to create a helical rotation form in the design of the Bouligand
elements (Figure 6.1b.1). To achieve a toolpath for solid specimens (as shown in Figure
6.1a.2,b2), 100% infill was used for both lamellar and Bouligand architectures. A layer height
(filament height) of 1.00 mm and the extrusion width of 1.63 were specified in the slicer (using a
nozzle with of I.D. of 1.36 mm). The specified printing speed was 250 mm/min., resulting in a
speed of 93 s per layer. Each layer was exposed to the environment for a duration between 9.6 s to
186 s. A schematic cross-section of the lamellar and Bouligand architectures was shown for clarity
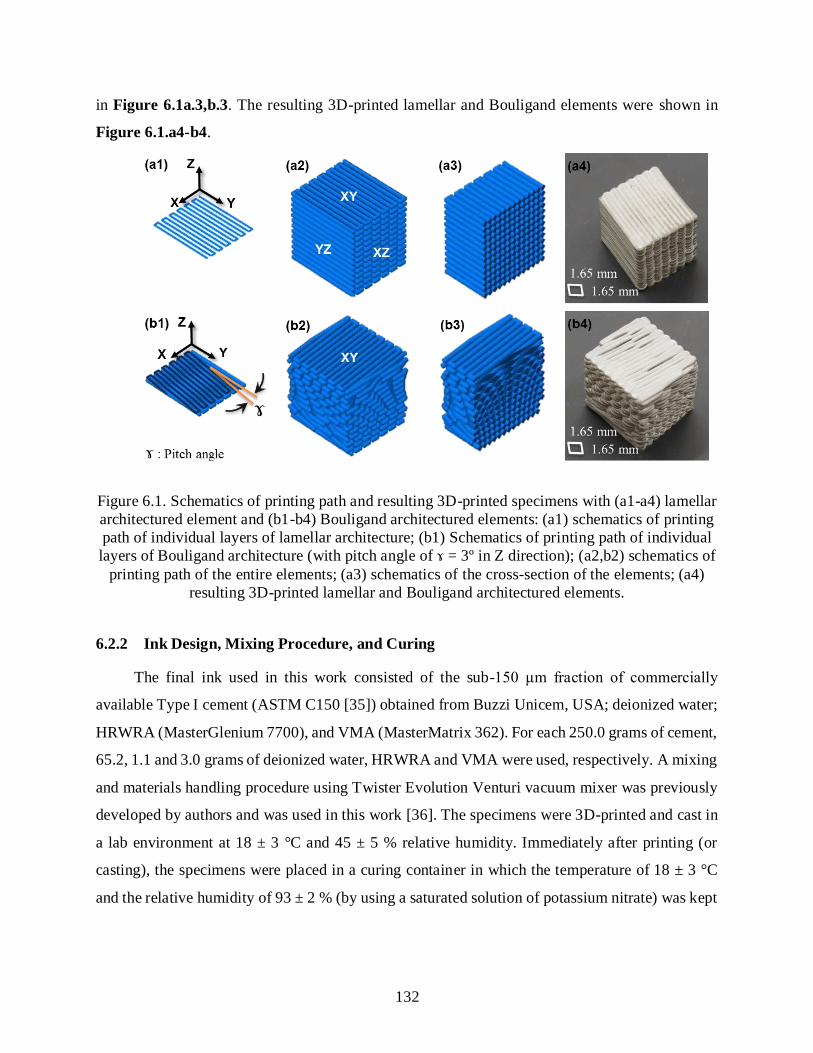
132
in Figure 6.1a.3,b.3. The resulting 3D-printed lamellar and Bouligand elements were shown in
Figure 6.1.a4-b4.
Figure 6.1. Schematics of printing path and resulting 3D-printed specimens with (a1-a4) lamellar
architectured element and (b1-b4) Bouligand architectured elements: (a1) schematics of printing
path of individual layers of lamellar architecture; (b1) Schematics of printing path of individual
layers of Bouligand architecture (with pitch angle of ɤ = 3º in Z direction); (a2,b2) schematics of
printing path of the entire elements; (a3) schematics of the cross-section of the elements; (a4)
resulting 3D-printed lamellar and Bouligand architectured elements.
6.2.2 Ink Design, Mixing Procedure, and Curing
The final ink used in this work consisted of the sub-150 μm fraction of commercially
available Type I cement (ASTM C150 [35]) obtained from Buzzi Unicem, USA; deionized water;
HRWRA (MasterGlenium 7700), and VMA (MasterMatrix 362). For each 250.0 grams of cement,
65.2, 1.1 and 3.0 grams of deionized water, HRWRA and VMA were used, respectively. A mixing
and materials handling procedure using Twister Evolution Venturi vacuum mixer was previously
developed by authors and was used in this work [36]. The specimens were 3D-printed and cast in
a lab environment at 18 ± 3 °C and 45 ± 5 % relative humidity. Immediately after printing (or
casting), the specimens were placed in a curing container in which the temperature of 18 ± 3 °C
and the relative humidity of 93 ± 2 % (by using a saturated solution of potassium nitrate) was kept

133
constant for 3 days when the specimens were taken out of the curing chamber for micro-CT
characterization.
6.2.3 Sample Preparation and Mechanical Testing
To examine the compressive properties, the specimens were tested in uniaxial compression
using an MTS machine with stainless steel platens. A loading rate of 0.1 mm/min was used for all
specimens. The 3D-printed lamellar elements were tested in all three planes (i.e., XY, XZ, and
YZ), and the 3D-printed Bouligand elements were tested in the XY plane (as indicated in Table
6.1). It must be noted that the XY testing plane was the same plane in which layers were printed
in both architectures. All cast and 3D-printed specimens were tested at the age of 3 days. All
specimens were polished ground using silicon carbide powder to remove surface flaws and obtain
flat and parallel surfaces with ±0.1 mm tolerance prior to testing. Stress-strain curves were
obtained by loading all specimens up to 0.7 mm extension corresponding to a strain of 0.028 strain
(mm/mm). The peak load was used in the strength calculations, and the area under the curve
corresponding to a 20% drop of the peak load was used for the determination of WOF. Specific
compressive strength (Sp. C.S.) and specific work-of-failure were used to take into account the
internal porosities, and corresponding densities of each element.
6.2.4 Micro-Computed Tomography (Micro-CT) of Fractured Elements
In this study, a Zeiss Xradia 510 Versa X-ray microscope (XRM) was utilized for qualitative
analysis of the fractured cast, lamellar, and Bouligand elements. The fractured cast element, three
3D-printed lamellar elements, and a 3D-printed Bouligand element was characterized using 0.4X
geometric magnification scan (initial lower resolution) to allow for a large FOV and thus facilitated
capturing the tomographic view of the entire element. The geometric magnification involved
setting distances between the source, detector, and element. The resolutions of 33.01, 34.86, 31.74,
34.35, 34.35 μm pixel size was used for the scans of the fractured cast, lamellar (tested in XY, YZ,
XZ planes), and Bouligand (tested in XY plane), respectively. The beam energies of 110, 120, 120,
100, and 100 keV, the power levels of 10, 10, 10, 9, and 9 W, and exposure times of 1, 0.6, 1, 0.75,
and 0.75 s were used for the scans of the fractured cast, lamellar (tested in XY, YZ, XZ planes),

134
and Bouligand (tested in XY plane), respectively. Dragonfly software was used for post-processing
and visualization of the 2D and 3D images.
6.3 Results and Discussion
6.3.1 Mechanical Properties of Cast and Architectured Elements
The mechanical response of cast and 3D-printed architectured lamellar (tested in XY, YZ,
and XZ) and Bouligand (tested in XY) hcp elements were investigated. Rendition of the two
architectured elements and the testing direction are elaborated in Table 6.1. The mechanical
responses, including representative stress-strain behavior, specific compressive strength (Sp. C.S.),
and specific work-of-failure (Sp. WOF), are reported in Figure 6.5 a-d.
Table 6.1. Rendition of the cast, 3D-printed lamellar, and 3D-printed Bouligand elements and
their respective plane in which they were tested (shown in dashed lines) in uniaxial compression
(dash lines represent testing plane)

135
6.3.2 Stress-Strain Behavior
The comparison of representative stress-strain behavior demonstrated several distinct
differences in the overall mechanical response between the cast, and 3D-printed lamellar and
Bouligand elements (Figure 6.2.a). The cast elements demonstrated a stress-strain behavior
notably different than all the 3D-printed architectured elements.
Figure 6.2. Comparison of (a) stress-strain; (b) specific compressive strength (Sp. C.S.) and (c)
Specific work-of-failure (Sp. WOF) of the cast, lamellar, and Bouligand architectured hcp
elements at the age of 3 days quantified up to 20% drop of the peak load; and (d) corresponding
statistical differences between them.

136
The Bouligand elements tested in the XY plane demonstrated a superior overall stress-strain
behavior compared to the other two types of 3D-printed elements.
The lamellar elements tested in the XZ plane and the Bouligand element tested in the XY
plane demonstrated a superior overall stress-strain behavior compared to the other two types of
3D-printed elements. In terms of strain at maximum stress, the lamellar elements tested in the XZ
plane and the Bouligand elements tested in the XY plane also demonstrated higher degrees of
deflection compared to cast elements (Figure 6.5a). In contrast, the lamellar elements tested in
both XY and YZ planes demonstrated a lower degree of deflection compared to cast elements
(Figure 6.5a). Consequently, the lamellar elements, due to differences in the degrees of deflection
and maximum stress, demonstrated three distinct stress-strain behaviors in three testing planes of
XY, YZ, and XZ (Figure 6.5a). Comparing stress-strain behavior between lamellar and Bouligand
elements, both tested in the XY plane demonstrated a significant difference both in terms of stress
and deflection (Figure 6.5a). Moreover, while Bouligand elements demonstrated a steady post-
peak drop in stress levels, all lamellar, including the one tested in the same plane at Bouligand
element (XY), exhibited a rather drastic and significant post-peak drop in stress-strain plot (Figure
6.5a). A higher degree of post-peak drop was also observed in all lamellar elements in comparison
to reference cast elements. In terms of stiffness, no apparent difference between the cast and 3D-
printed lamellar and Bouligand elements were observed.
From Figure 6.5a, it is evident that lamellar elements exhibited anisotropic compressive
mechanical properties. In other words, the testing planes play a substantial role in altering the
compressive mechanical responses of lamellar elements (Figure 6.5a). Comparing stress-strain
behaviors between lamellar and Bouligand elements, both tested in the XY plane, demonstrated
the role of the architecture of the material in altering the mechanical response of 3D-printed
elements. In a sense, the difference in stress-strain behavior of lamellar elements in different testing
planes also revealed further evidence on the role of architecture on changing the mechanical
response of 3D-printed elements.
In summary, lamellar and Bouligand elements tested in the same testing plane (XY)
demonstrated different stress-strain behaviors in terms of peak load, post-peak behavior, and area
under the curve. In a given lamellar element, the arrangement of filaments with respect to the
testing plane also results in significantly different stress-strain behaviors.
137
6.3.3 Specific Compressive Strength (Sp. C.S.)
The comparison of specific compressive strength and specific work-of-failure of the cast and
3D-printed elements are presented in Figure 6.5b and Figure 6.5c, respectively. The result of
statistical significance tests for Sp. C.S. and Sp. WOF properties are reported in the lower half of
Figure 6.5d. The lamellar elements tested in XY and YZ planes demonstrated significantly lower
Sp. C.S. compared to the cast elements (Figure 6.5b). However, the lamellar elements tested in
the XZ plane did not demonstrate any significant difference in Sp. C.S. when compared to the cast
(Figure 6.5b). No significant difference in the Sp. C.S. of the Bouligand elements tested in XY
plane and lamellar architecture tested in the YZ plane with the cast was found. This ‘equivalent’
strength compared to the cast is an interesting feature of the lamellar element when the filaments’
orientation is aligned with the load. Such ‘equivalent’ strength of Bouligand elements compared
to the cast was also attributed to the specific helical and layered architecture and will be discussed
further in the chapter. Although the lamellar elements tested in the XY and XZ planes also did not
demonstrate a significant difference in terms of Sp. C.S. (Figure 6.5b), those tested in the YZ
plane demonstrated a significantly lower Sp. C.S. with respect to the other lamellar elements tested
in the XY and YZ planes (Figure 6.5b), all were providing evidence that lamellar hcp elements
3D-printed using a specific DIW process do represent anisotropic compressive strength when
tested in uniaxial compression.
6.3.4 Specific Work-of-Failure (Sp. WOF)
The highest Sp. WOF among all cast and 3D-printed elements was achieved in Bouligand
architectures (Figure 6.5c). More importantly, the Bouligand architectures demonstrated a
significantly higher Sp. WOF compared to cast counterparts, featuring an outstanding fracture
behavior and energy dissipation characteristic of this architecture. Unlike the lamellar elements
tested in the YZ plane, the lamellar elements tested in XZ and XY planes did not demonstrate any
significant difference Sp. WOF compared to cast elements (Figure 6.5c). Although not significant,
the Sp. WOF of the lamellar elements tested in the XZ plane was slightly larger than that of the
cast elements. This ‘equivalent’ Sp. WOF compared to the cast was also an interesting feature of
the lamellar element and has to do with the alignment of the filaments’ orientation with the load.
Due to the significant difference in Sp. WOF among 3D-printed lamellar elements, it can be
138
determined that 3D-printed lamellar elements represent anisotropic Sp. WOF properties, in
addition to anisotropic Sp. C.S. discussed earlier.
6.3.5 Discussion of the Overall Mechanical Responses
Lamellar elements exhibited anisotropic compressive strength and work-of-failure. Lamellar
elements (tested in XZ plane where the orientation of the lamella is parallel to the loading direction)
also demonstrated an interesting feature to maintain the load-bearing capacity at post-peak stress
levels compared to the cast elements. Bouligand elements, on the other hand, demonstrated
significantly higher work-of-failure and the capacity to maintain the load at post-peak stress levels
(without sacrificing the strength) compared to cast counterparts. Hence, it can be stated that the
architecture can be potentially utilized as a means to enhance some of the mechanical properties
of 3D-printed elements compared to cast elements that were made of the same hcp materials.
In summary, it can be inferred that the Bouligand architecture demonstrated effectiveness in
increasing energy dissipation and a promising capacity to maintain the load at post-peak stress
levels (as exhibited in the steady post-peak drop in the stress-strain plot in Figure6. 5a) at higher
levels compared to cast elements. Such favorable characteristics, such as load-bearing capacity
and mechanical properties of Bouligand architecture, are mechanically very desirable when
achieved without sacrificing the strength (as indicated in Figure 6.5b). Nevertheless, identification
of underlying mechanisms responsible for different mechanical responses in 3D-printed elements
requires investigation of the elements during testing or after the fracture has occurred (i.e., post-
mortem). Further discussions followed in the next section will discuss the cracking involved in
shaping up the mechanical responses discussed in Figure 6.5 using an XRM.
6.3.6 Fracture Behaviors
The three cast, lamellar and Bouligand elements tested in the same direction (XY plane)
were selected for qualitative analysis of fracture behavior and are presented in Figures 6.6, 6.7,
6.8. The two lamellar elements tested in XZ and YZ planes were also analyzed and discussed in
Figure 6.S1 and Figure 6.S2, providing supportive information about fracture behavior in lamellar
elements.

139
Figure 6.3. Post-fracture X-ray micro-CT images of the microstructure of cast hardened cement
paste specimen tested in XY plane and collected during 0.4X scan: (a) 2D view on the XZ plane;
(b) 2D view on the YZ plane; (c) 2D view on the XY plane; and (d) three-dimensional rendition
of the entire volume of the element.
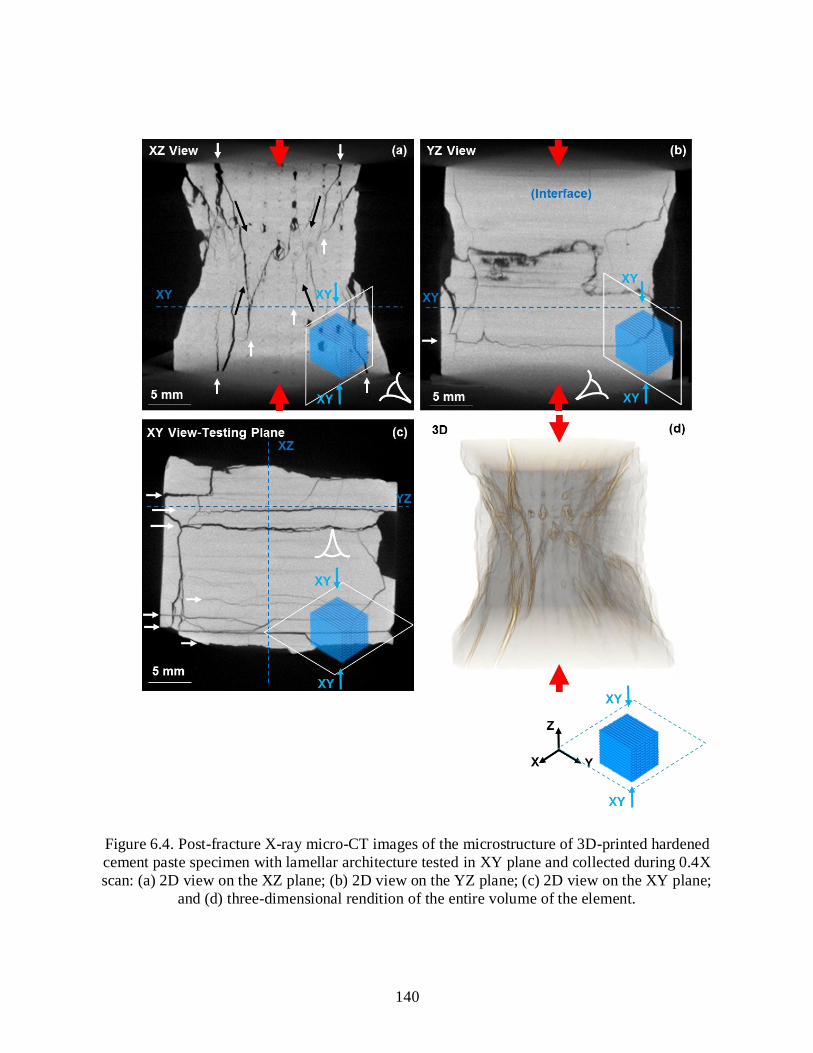
140
Figure 6.4. Post-fracture X-ray micro-CT images of the microstructure of 3D-printed hardened
cement paste specimen with lamellar architecture tested in XY plane and collected during 0.4X
scan: (a) 2D view on the XZ plane; (b) 2D view on the YZ plane; (c) 2D view on the XY plane;
and (d) three-dimensional rendition of the entire volume of the element.
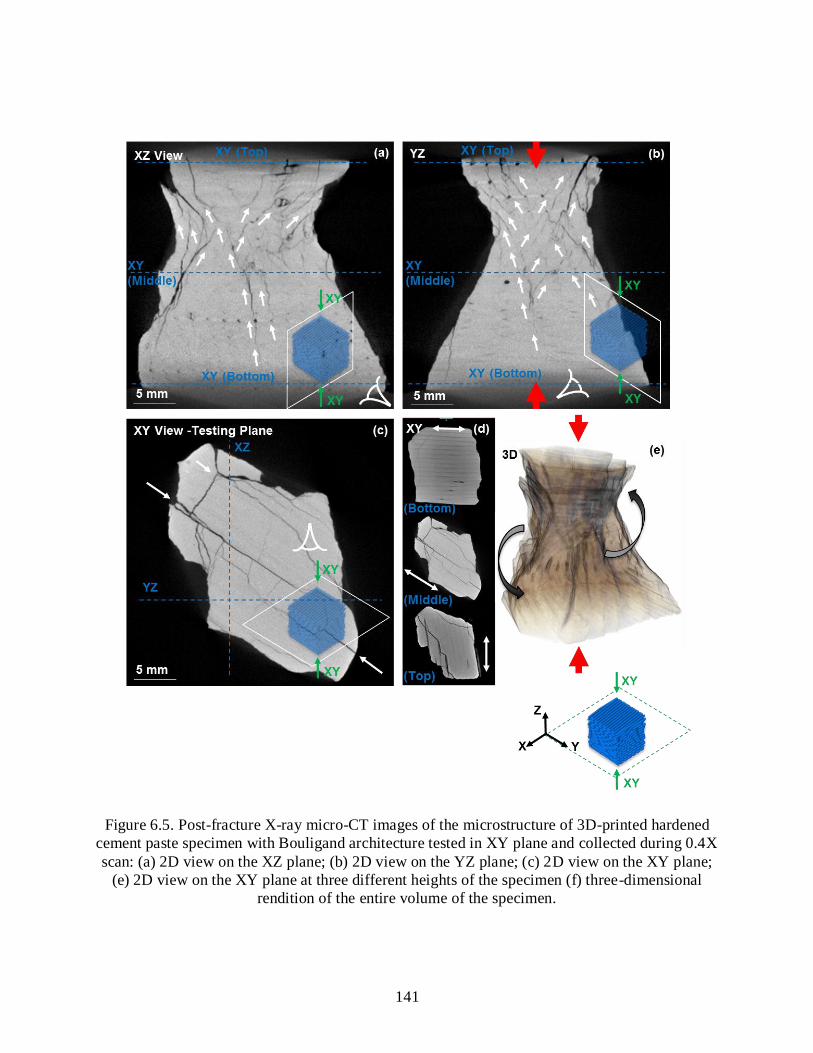
141
Figure 6.5. Post-fracture X-ray micro-CT images of the microstructure of 3D-printed hardened
cement paste specimen with Bouligand architecture tested in XY plane and collected during 0.4X
scan: (a) 2D view on the XZ plane; (b) 2D view on the YZ plane; (c) 2D view on the XY plane;
(e) 2D view on the XY plane at three different heights of the specimen (f) three-dimensional
rendition of the entire volume of the specimen.
142
6.3.7 Cast Element (Tested in XY Plane)
The post-fracture images of the reference cast element are demonstrated in XZ, YZ, XY, and
in three-dimensional view in Figure 6.6a,b,c,d, respectively. Most importantly, no specific crack
pattern was observed in the fractured cast element. A shear cone, as expected in brittle hcp
elements (at the presence of friction between the element and the compression platens), was
observed at the core of the element. This shear cone is indicative of a shear failure (on oblique
planes), as shown with black arrows in Figure 6.6a,b. With regard to a pore-crack interaction, it
was observed that the majority of the pores have remained undamaged (Figure 6.6a,b,c).
6.3.8 Lamellar Element (Tested in XY Plane)
The post-fracture images of the 3D-printed lamellar element tested in the XY plane are
demonstrated in XZ, YZ, XY, and in three-dimensional views in Figure 6.7a,b,c,d1,d2,
respectively. Here the element was tested in the same plane that it was printed in layers. As pointed
out with white arrows in Figure 6.7c (XY view), Several cracks appeared to have localized in the
nearly straight vertical form at the interfaces between the filaments of different layers (in the YZ
plane). These interfacial cracks in the YZ plane were also visible in the XY view (Figure 7.a), as
pointed out with white arrows. On the other hand, almost no cracks in the XY plane was populated,
as indicated in Figure 6.7a,b, respectively. There was only one visible interfacial crack in the YZ
plane (Figure 6.7b). Another important feature to mark was the formation of a partial shear cone
at the core (at about middle one third) of the element that was indicative of a partial shear failure
on oblique planes, as shown with black arrows in Figure 6.7a. It is important to note that the shear
cone was only present in the XZ view, as indicated in Figure 6.7a,b, indicating that weak
interfaces between the filaments have potentially facilitated a preferential shear failure. The partial
shear failure can also be seen in three dimensions in Figure 6.7d, where the brighter slits are
indicative of cracks in the element upon testing. Most importantly, the overall fracture behavior of
the lamellar element here (Figure 6.7d) was found distinctively different compared to the cast
element, mainly due to the prevalent vertical cracking at the interfaces between the filaments
(Figure 6.6d).
143
6.3.9 Bouligand Element (Tested in XY Plane)
The post-fracture images of 3D-printed Bouligand elements tested in XY direction are
demonstrated in XZ, YZ, XY views, and in three dimensions in Figure 6.8a-e. To refresh,
Bouligand element here holds a pitch (rotation) angle of 3° per layer in the Z direction. A rather
different crack pattern was identified in Bouligand architecture compared to the lamellar
architecture. In distinct contrast with lamellar elements, there was a lack of a large number of
localized straight vertical cracks at the interfaces here. Instead, the cracks appeared to delocalize
into widespread smaller and more distributed microcracks throughout the interfaces of the
Bouligand element, in the form of a helical pattern (as demonstrated with white arrows in Figure
6.8a,b). However, similar to the lamellar element, a few major cracks have localized at the
interfaces between the filaments were also present (as pointed out with white arrows Figure 8.c).
These internal cracks nonetheless did not take a straight vertical form such as those in the lamellar
element and rather followed the helical pattern along the Z direction (Figure 6.8a,b). At any given
layer in the XY plane (such as the one shown in Figure 6.8c), the majority of the populated cracks
and microcracks were aligned with the orientation of the architecture in that layer. A similar helical
pattern was also evident from exterior surfaces (Figure 6.8d). The twisting pattern in the exterior
surfaces from the bottom to the top was demonstrated by white arrows in Figure 6.8d and black
arrows in Figure 6.8e. Viewing the exterior of the Bouligand element (in Figure 6.8a,b)
demonstrated the formation of a shear cone similar to the lamellar element. However, in Bouligand
element, the shear failure was accompanied by crack twisting evident from Figure 6.8d,e.
6.3.10 Discussion on Fracture Behaviors
Three distinct fracture behaviors in the cast, lamellar, and Bouligand elements under
compressive loads can be recognized. Cast elements demonstrated an overall fracture behavior
with a typical shear cone and no specific cracking pattern (Figure 6.6). The presence of shear cone
in cast and 3D-printed elements can be attributed to the constraints induced by friction that was
present at the contact surfaces between the elements and the plattens. Moreover, the internal flaws
in the cast hcp, such as pores, did not generally appear to have served as crack nucleation sites
throughout the cast element. Lamellar and Bouligand elements, on the other hand, each
demonstrated unique fracture behaviors, unparalleled to the cast. Lamellar element demonstrated
144
a rather frequent population of straight vertical cracks at the interfaces between the filaments,
accompanied by the formation of a partial shear cone at the core (Figure 6.7). The abundant
presence of localized cracks, patterned in the vertical planes, indicated that the interfaces are
weaker than the filament itself (i.e., the hcp material in filament). Based on the evidence provided
in Appendix Figure 6.S1, it must be noted that the interfaces (both horizontal interfaces between
the layers and vertical interfaces between the filaments) are weaker than the material. Moreover,
the interfaces between the layers are weaker than the interface between the filaments. Although it
is not clear whether the cracks observed in the post-mortem lamellar element were initiated at the
interfaces or not (i.e., whether weak interfaces have served as crack nucleation sites), it can
reasonably be concluded that the weak interfaces in the intact lamellar element, weaker than the
material [24], have contributed to a preferential cracking at the vertical interfaces. The unique
fracture behavior of Bouligand element, in contrast to the cast and lamellar elements, was evident
from the (i) widespread delocalization of cracks into smaller microcracks, and (ii) their helical
pattern (Figure 8). Although it is not determined whether weak interfaces have served as crack
nucleation sites, it is indisputable that the combination of the weak interfaces and helical
architecture with 3º rotation angle has resulted in distributed cracking (i.e., the spread of the
damage) and have guided the cracks into the interfaces’ helical forms (Figure 6.8). The fact that
there exists a helical exterior surface (Figure 6.8d,e) implies that the guidance of crack through
the interfaces must have also been in play at the exterior damaged volume (that was not included
in the scanned volume). Distinct fracture behaviors of lamellar and Bouligand elements compared
to cast elements have certain ramifications for the mechanical response of the element that is
further discussed as follows.
6.3.11 Discussion on Fracture Behavior in Relation to Mechanical Properties
The insight obtained from the fracture behaviors of the cast, lamellar, and Bouligand elements can
be used to draw inferences about the corresponding mechanical response. The Sp. C.S. of lamellar
elements was superseded by that of the cast elements (Figure 6.5). The presence of initially weak
interfaces and the resulting vertically patterned localized cracks in lamellar elements (Figure 6.7)
can be hypothesized to be responsible for the significant reduction in strength in lamellar elements
compared to cast. In the case of Bouligand elements, the Sp. WOF significantly superseded that
of the cast element (Figure 6.5). The widespread delocalization of cracks into smaller microcracks

145
throughout the core volume observed in the Bouligand elements (Figure 6.8) requires a higher
amount of energy to be dissipated, which subsequently explains the significantly higher WOF in
Bouligand element compared to that of the cast counterpart. In other words, the initiation or
propagation of micro-cracks through multiple interfaces of the Bouligand element (Figure 6.8)
has resulted in a higher amount of energy dissipation compared to reference cast hcp element, in
which no interface pre-existed and specific fracture patterned occurred as evident from Figure
6.6). In terms of overall mechanical response, the rather prevalent localization of cracks into
smaller microcracks throughout the weak interfaces in Bouligand architecture (Figure 6.8) also
explained the extension of the peak stress toward larger strains as well as the rather steady post -
peak behavior (Shown in green in Figure 6.5.a), compared to the cast hcp element with the rather
drastic post-peak drop. The spread of the damage throughout the element in Bouligand elements
can also be the reason for a more ductile behavior of hcp elements under unidirectional
compressive load.
More specifically, in Bouligand elements, the pre-existed weak interfaces in a helical form
have prevented one major crack from localizing and have resulted in more efficient energy
dissipation in this element compared to the cast. Due to the common presence of helical crack
patterns in Bouligand elements, a toughening mechanism can be speculated in which the weak
interfaces could have been utilized to advance the cracks in twisting patterns. In such a hypothetical
case, helical interfaces allow for redistribution of stress and further spread of the damage in
multiple weak paths in the element (i.e., homogenizing the damage in the element by spreading it
at the interfaces).
6.4 Conclusion
This chapter investigated the mechanical properties and fracture behavior of 3D-printed
lamellar and Bouligand hardened cement past elements in comparison with cast counterparts. An
X-ray microscope was used to characterize the fracture behavior of elements upon testing.
It was found that the presence of interfaces (i) introduces anisotropy in mechanical properties
among 3D-printed elements and alters the stress-strain response among compared to cast elements,
(ii) the interfaces are weaker than the material and the horizontal interfaces between the layers are
weaker than the vertical interfaces between the filament, and (iii) promotes unique cracking
characteristics (such as large populations of interfacial cracking) in Bouligand architecture. It was
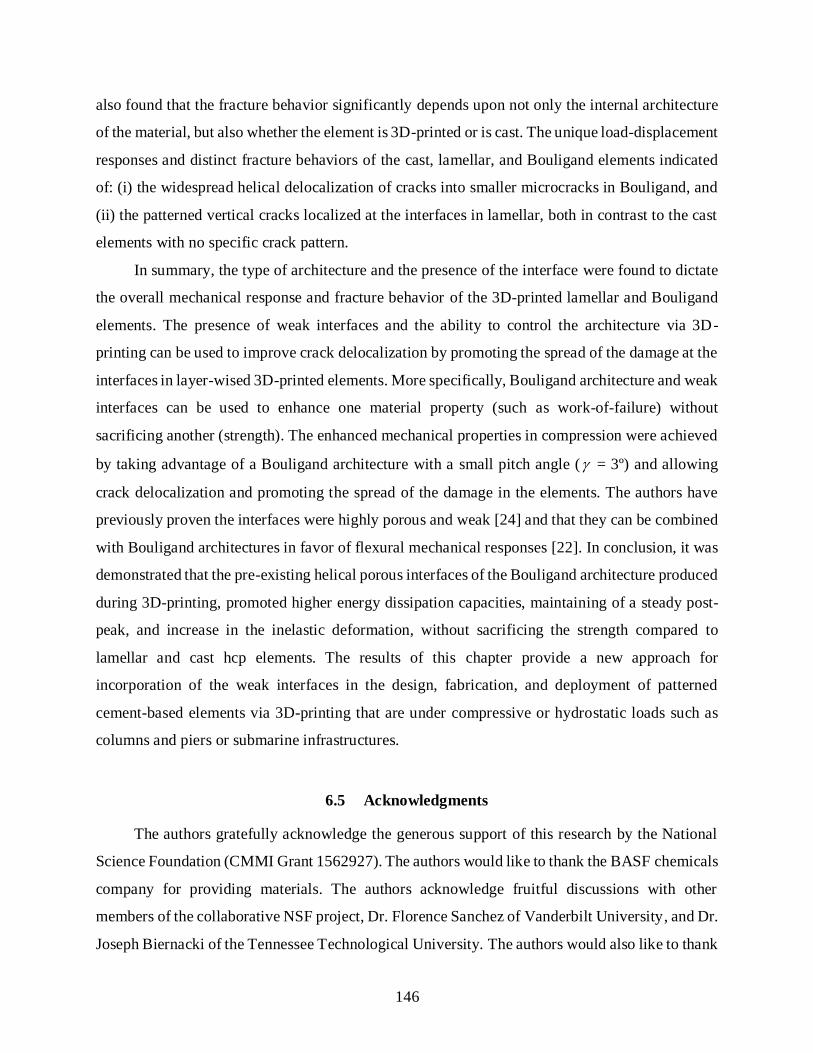
146
also found that the fracture behavior significantly depends upon not only the internal architecture
of the material, but also whether the element is 3D-printed or is cast. The unique load-displacement
responses and distinct fracture behaviors of the cast, lamellar, and Bouligand elements indicated
of: (i) the widespread helical delocalization of cracks into smaller microcracks in Bouligand, and
(ii) the patterned vertical cracks localized at the interfaces in lamellar, both in contrast to the cast
elements with no specific crack pattern.
In summary, the type of architecture and the presence of the interface were found to dictate
the overall mechanical response and fracture behavior of the 3D-printed lamellar and Bouligand
elements. The presence of weak interfaces and the ability to control the architecture via 3D-
printing can be used to improve crack delocalization by promoting the spread of the damage at the
interfaces in layer-wised 3D-printed elements. More specifically, Bouligand architecture and weak
interfaces can be used to enhance one material property (such as work-of-failure) without
sacrificing another (strength). The enhanced mechanical properties in compression were achieved
by taking advantage of a Bouligand architecture with a small pitch angle ( = 3º) and allowing
crack delocalization and promoting the spread of the damage in the elements. The authors have
previously proven the interfaces were highly porous and weak [24] and that they can be combined
with Bouligand architectures in favor of flexural mechanical responses [22]. In conclusion, it was
demonstrated that the pre-existing helical porous interfaces of the Bouligand architecture produced
during 3D-printing, promoted higher energy dissipation capacities, maintaining of a steady post-
peak, and increase in the inelastic deformation, without sacrificing the strength compared to
lamellar and cast hcp elements. The results of this chapter provide a new approach for
incorporation of the weak interfaces in the design, fabrication, and deployment of patterned
cement-based elements via 3D-printing that are under compressive or hydrostatic loads such as
columns and piers or submarine infrastructures.
6.5 Acknowledgments
The authors gratefully acknowledge the generous support of this research by the National
Science Foundation (CMMI Grant 1562927). The authors would like to thank the BASF chemicals
company for providing materials. The authors acknowledge fruitful discussions with other
members of the collaborative NSF project, Dr. Florence Sanchez of Vanderbilt University, and Dr.
Joseph Biernacki of the Tennessee Technological University. The authors would also like to thank
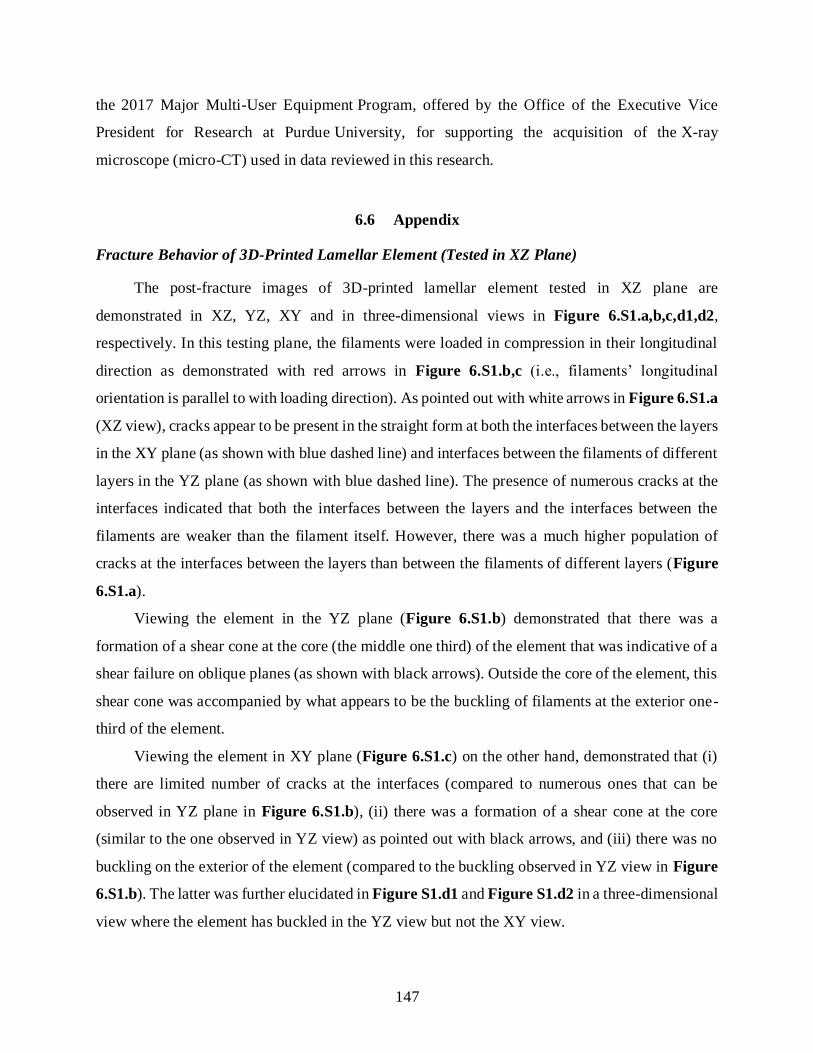
147
the 2017 Major Multi-User Equipment Program, offered by the Office of the Executive Vice
President for Research at Purdue University, for supporting the acquisition of the X-ray
microscope (micro-CT) used in data reviewed in this research.
6.6 Appendix
Fracture Behavior of 3D-Printed Lamellar Element (Tested in XZ Plane)
The post-fracture images of 3D-printed lamellar element tested in XZ plane are
demonstrated in XZ, YZ, XY and in three-dimensional views in Figure 6.S1.a,b,c,d1,d2,
respectively. In this testing plane, the filaments were loaded in compression in their longitudinal
direction as demonstrated with red arrows in Figure 6.S1.b,c (i.e., filaments’ longitudinal
orientation is parallel to with loading direction). As pointed out with white arrows in Figure 6.S1.a
(XZ view), cracks appear to be present in the straight form at both the interfaces between the layers
in the XY plane (as shown with blue dashed line) and interfaces between the filaments of different
layers in the YZ plane (as shown with blue dashed line). The presence of numerous cracks at the
interfaces indicated that both the interfaces between the layers and the interfaces between the
filaments are weaker than the filament itself. However, there was a much higher population of
cracks at the interfaces between the layers than between the filaments of different layers (Figure
6.S1.a).
Viewing the element in the YZ plane (Figure 6.S1.b) demonstrated that there was a
formation of a shear cone at the core (the middle one third) of the element that was indicative of a
shear failure on oblique planes (as shown with black arrows). Outside the core of the element, this
shear cone was accompanied by what appears to be the buckling of filaments at the exterior one-
third of the element.
Viewing the element in XY plane (Figure 6.S1.c) on the other hand, demonstrated that (i)
there are limited number of cracks at the interfaces (compared to numerous ones that can be
observed in YZ plane in Figure 6.S1.b), (ii) there was a formation of a shear cone at the core
(similar to the one observed in YZ view) as pointed out with black arrows, and (iii) there was no
buckling on the exterior of the element (compared to the buckling observed in YZ view in Figure
6.S1.b). The latter was further elucidated in Figure S1.d1 and Figure S1.d2 in a three-dimensional
view where the element has buckled in the YZ view but not the XY view.
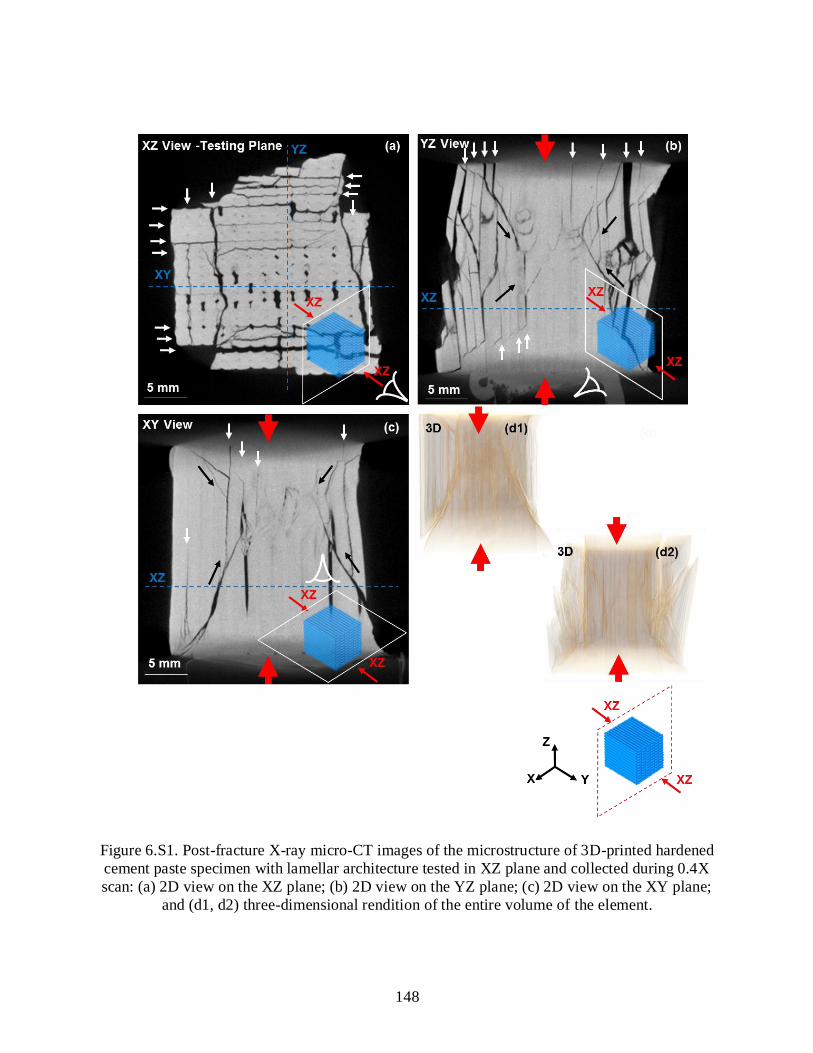
148
Figure 6.S1. Post-fracture X-ray micro-CT images of the microstructure of 3D-printed hardened
cement paste specimen with lamellar architecture tested in XZ plane and collected during 0.4X
scan: (a) 2D view on the XZ plane; (b) 2D view on the YZ plane; (c) 2D view on the XY plane;
and (d1, d2) three-dimensional rendition of the entire volume of the element.

149
The overall fracture pattern in lamellar elements tested in the XZ plane is then the numerous
population of cracks at the interfaces, principally at the exteriors, accompanied by the formation
of a shear cone at the core as demonstrated in Figure 6.S1.a,b,c. Consequently, the prevalent crack
pattern at the interfaces indicates that fracture behavior, if not pre-dominantly, were at least
partially governed by the presence of the weak interfaces. This anisotropic fracture behavior
caused by numerous preferential cracking at the interfaces can be correlated with the anisotropic
mechanical properties of lamellar architecture tested in YZ direction. More importantly, cracking
characteristics in lamellar architecture tested in the XZ plane were discernibly different from those
of the cast (Figure 6.6d, Figure 6.S1.d1,d2) and the lamellar architecture tested in the other two
directions (XY and YZ).
The higher population of cracks at the interfaces between the layers (Figure 6.S1.b)
compared to the interfaces between the filaments (Figure 6.S1.c) can suggest that the interfaces
between the layers (present in XY plane) are weaker than the interfaces between the filaments
(present in the YZ plane) in the 3D-printed lamellar elements. The distinct presence of buckling
phenomena (with associated delamination between the filaments) shown in the Figure 6.S1.b, as
compared to the limited number of interfacial cracks and the lack of buckling and delamination
shown in Figure 6.S1.c, also supports the same hypothesis about the weakness of the two
interfaces relative to one another.
The interfaces between the layers (present in the XY plane) is weaker than the interfaces
between the filaments mainly due to the higher evaporation rate and the presence of higher porosity
at interfacial regions between the layers that have pre-existed in the intact elements in this plane.
It can be concluded that a longer exposure time (up to 90 s x 2 = 180 s) at the interfaces between
the layers compared to that in between the filaments (20 s), could be the reason for higher degree
of porosity at the interfaces between the layers. Longer exposure time results in more rapid
evaporation and higher scarcity of water (and a possibly lower degree of hydration).
Figure 6.S1 demonstrated that both interfaces between the filaments/layers are weaker than
the material, and the interfaces between the layers are weaker than the interface between the
filaments. Given the interfacial fracture pattern, it can be speculated that the presence of interface
could have possibly triggered other energy dissipation and toughening mechanisms (other than
cracking at the interfaces) such as buckling, delamination, and debonding that would be
contributing to the increase of Sp. WOF in lamellar elements tested in this loading direction.

150
Figure 6.S2. Post-fracture X-ray micro-CT images of the microstructure of 3D-printed hardened
cement paste specimen with lamellar architecture tested in YZ plane and collected during 0.4X
scan: (a) 2D view on the XZ plane; (b) 2D view on the YZ plane; (c) 2D view on the XY plane;
and (d) three-dimensional rendition of the entire volume of the element
Fracture Behavior of Lamellar Element (Tested in YZ Plane)
The post-fracture images of the 3D-printed lamellar element tested in YZ direction were
demonstrated in XZ, YZ, XY views, and in three-dimensional view in Figure 6.S2.a,b,c,d,

151
respectively. As pointed out with white arrows in Figure 6.S2.a (XZ view), a number of cracks
appeared to be present in the straight form at the interfaces between the layers in the XY plane.
These interfacial cracks are also visible in Figure 6.S2.b (YZ view), as pointed out with white
arrows. On the other hand, almost no cracks appear to be populated in the YZ plane at the interface
between the filaments of different layers, as indicated in Figure 6.S2.a,c. There was only one
minor interfacial crack in the YZ plane (Figure 6.S2.c). Some other clear features to point out was
the formation of a partial shear cone at the core of the element that was indicative of a shear failure
on oblique planes (as shown with black arrows in Figure 6.S2.a). It is essential to note that a shear
cone in this testing direction was only present in XZ view, as indicated in Figure 6.S2.a,c. The
partial shear cone can also be seen in three dimensions in Figure 6.7.d, where the oblique bright
slits were indicative of cracks in the microstructure.
The overall fracture pattern in lamellar elements tested in the XY plane was the population
of cracks at the interfaces accompanied by the formation of a partial shear cone at the core, as
indicated in Figure 6.S2.a,d. The presence of interfacial cracks further indicates that the interface
between the filaments was weaker than the material itself, and makes the crack pattern in this
lamellar element different than the cast elements (Figure 6.6.d).
In Figure 6.S1, it was discussed that the interface between the layers (present in the XY
plane) was weaker than the interface between the filaments of different layers (present in the YZ
plane). The common crack patterns at the interfaces between the layers evident from Figure 6.S2.b,
further supports the hypothesis that the interfaces between the layers were weaker than the material.
6.7 References
[1] C. Gosselin, R. Duballet, P. Roux, N. Gaudillière, J. Dirrenberger, P. Morel, Large-scale
3D printing of ultra-high performance concrete - a new processing route for architects and
builders, Mater. Des. 100 (2016) 102–109. doi:10.1016/j.matdes.2016.03.097.
[2] J.J. Biernacki, J.W. Bullard, G. Sant, K. Brown, F.P. Glasser, S. Jones, T. Ley, R. Livingston,
L. Nicoleau, J. Olek, F. Sanchez, R. Shahsavari, P.E. Stutzman, K. Sobolev, T. Prater,
Cements in the 21 st century: Challenges, perspectives, and opportunities, J. Am. Ceram.
Soc. 100 (2017) 2746–2773. doi:10.1111/jace.14948.

152
[3] S. Lim, R.A. Buswell, T.T. Le, S.A. Austin, A.G.F. Gibb, T. Thorpe, Developments in
construction-scale additive manufacturing processes, Autom. Constr. 21 (2012) 262–268.
doi:10.1016/j.autcon.2011.06.010.
[4] Ed. By: Sanjayan, J. G., A. Nazari, B. Nematollahi. 3D Concrete Printing Technology:
Construction and Building Applications, Butterworth-Heinemann, 2019.
[5] Ed. By: A. Perrot. 3D Printing in Concrete: General Considerations and Technologies, ISTE
LTD, 2019.
[6] M. Xia, J. Sanjayan, Method of formulating geopolymer for 3D printing for construction
applications, Mater. Des. 110 (2016) 382–390. doi:10.1016/j.matdes.2016.07.136.
[7] G. Franchin, P. Scanferla, L. Zeffiro, H. Elsayed, A. Baliello, G. Giacomello, M. Pasetto, P.
Colombo, Direct ink writing of geopolymeric inks, J. Eur. Ceram. Soc. 37 (2017) 2481–
2489. doi:10.1016/j.jeurceramsoc.2017.01.030.
[8] B. Panda, S.C. Paul, N.A.N. Mohamed, Y.W.D. Tay, M.J. Tan, Measurement of tensile
bond strength of 3D printed geopolymer mortar, Meas. J. Int. Meas. Confed. 113 (2018)
108–116. doi:10.1016/j.measurement.2017.08.051.
[9] B. Panda, C. Unluer, M.J. Tan, Extrusion and rheology characterization of geopolymer
nanocomposites used in 3D printing, Compos. Part B Eng. 176 (2019) 107290.
doi:10.1016/j.compositesb.2019.107290.
[10] M. Xia, B. Nematollahi, J. Sanjayan, Printability, accuracy and strength of geopolymer
made using powder-based 3D printing for construction applications, Autom. Constr. 101
(2019) 179–189. doi:10.1016/j.autcon.2019.01.013.
[11] S. Xiao, H. Mei, D. Han, W. Yuan, L. Cheng, Porous (SiC w -Si 3 N 4w )/(Si 3 N 4 -SiC)
composite with enhanced mechanical performance fabricated by 3D printing, Ceram. Int.
44 (2018) 14122–14127. doi:10.1016/j.ceramint.2018.05.011.
[12] A. Zocca, P. Colombo, C.M. Gomes, J. Günster, Additive Manufacturing of Ceramics:
Issues, Potentialities, and Opportunities, J. Am. Ceram. Soc. 98 (2015) 1983–2001.
doi:10.1111/jace.13700.
[13] U.K. Roopavath, S. Malferrari, A. Van Haver, F. Verstreken, S.N. Rath, D.M. Kalaskar,
Optimization of extrusion based ceramic 3D printing process for complex bony designs,
Mater. Des. 162 (2019) 263–270. doi:10.1016/j.matdes.2018.11.054.

153
[14] L.R. Meza, S. Das, J.R. Greer, Strong, lightweight, and recoverable three-dimensional
ceramic nanolattices., Science. 345 (2014) 1322–6. doi:10.1126/science.1255908.
[15] Z. Jia, L. Wang, 3D printing of biomimetic composites with improved fracture toughness,
Acta Mater. 173 (2019) 61–73. doi:10.1016/j.actamat.2019.04.052.
[16] D. Herzog, V. Seyda, E. Wycisk, C. Emmelmann, G.T. Gray, V. Livescu, P.A. Rigg, C.P.
Trujillo, C.M. Cady, S.R. Chen, J.S. Carpenter, T.J. Lienert, S.J. Fensin, T. Tancogne-
Dejean, A.B. Spierings, D. Mohr, H. Manzano, J.S. Dolado, A. Ayuela, F. Abdeljawad, D.S.
Bolintineanu, A. Cook, H. Brown-Shaklee, C. DiAntonio, D. Kammler, A. Roach, A.
Pineau, A.A. Benzerga, T. Pardoen, S. Xiao, H. Mei, D. Han, W. Yuan, L. Cheng, C. Zhang,
X. Hu, T. Sercombe, Q. Li, Z. Wu, P. Lu, Additive manufacturing of metals, Acta Mater.
117 (2016) 371–392. doi:10.1016/j.actamat.2016.07.019.
[17] M.R. Mansouri, H. Montazerian, S. Schmauder, J. Kadkhodapour, 3D-printed multimaterial
composites tailored for compliancy and strain recovery, Compos. Struct. 184 (2018) 11–17.
doi:10.1016/j.compstruct.2017.09.049.
[18] X. Zheng, W. Smith, J. Jackson, B. Moran, H. Cui, D. Chen, J. Ye, N. Fang, N. Rodriguez,
T. Weisgraber, C.M. Spadaccini, Multiscale metallic metamaterials, Nat. Mater. 15 (2016)
1100–1106. doi:10.1038/nmat4694.
[19] G.X. Gu, M. Takaffoli, M.J. Buehler, Hierarchically Enhanced Impact Resistance of
Bioinspired Composites, Adv. Mater. 29 (2017) 1–7. doi:10.1002/adma.201700060.
[20] S.M. Sajadi, P.J. Boul, C. Thaemlitz, A.K. Meiyazhagan, A.B. Puthirath, C.S. Tiwary, M.M.
Rahman, P.M. Ajayan, Direct Ink Writing of Cement Structures Modified with Nanoscale
Additive, 1801380 (2019) 1–10. doi:10.1002/adem.201801380.
[21] Y. Xu, H. Zhang, E. Schlangen, M. Lukovi, B. Savija, Cementitious cellular composites
with auxetic behavior, 111 (2020). doi:10.1016/j.cemconcomp.2020.103624.
[22] M. Moini, J. Olek, J.P. Youngblood, B. Magee, P.D. Zavattieri, Additive Manufacturing
and Performance of Architectured Cement-Based Materials, Adv. Mater. 30 (2018).
doi:10.1002/adma.201802123.
[23] J.A. Rosewitz, H.A. Choshali, N. Rahbar, Bioinspired design of architected cement-polymer
composites, Cem. Concr. Compos. 96 (2019) 252–265.
doi:10.1016/j.cemconcomp.2018.12.010.
154
[24] M. Moini, J. Olek, B. Magee, P. Zavattieri, J. Youngblood, Additive Manufacturing and
Characterization of Architectured Cement-based Materials via X-ray Micro-Computed
Tomography, in: 1st Rilem Int. Conf. Concr. Digit. Fabr., 2018.
[25] M. DeVries, G. Subhash, A. Mcghee, P. Ifju, T. Jones, J. Zheng, V. Halls, Quasi-static and
Dynamic Response of 3D-printed Alumina, J. Eur. Ceram. Soc. 38 (2018) 3305–3316.
doi:10.1016/j.jeurceramsoc.2018.03.006.
[26] H. Xing, B. Zou, S. Li, X. Fu, Study on surface quality, precision and mechanical properties
of 3D printed ZrO2 ceramic components by laser scanning stereolithography, Ceram. Int.
43 (2017) 16340–16347. doi:10.1016/j.ceramint.2017.09.007.
[27] B. Zareiyan, B. Khoshnevis, Interlayer adhesion and strength of structures in Contour
Crafting - Effects of aggregate size, extrusion rate, and layer thickness, Autom. Constr. 81
(2017) 112–121. doi:10.1016/j.autcon.2017.06.013.
[28] J.G. Sanjayan, B. Nematollahi, M. Xia, T. Marchment, Effect of surface moisture on inter-
layer strength of 3D printed concrete, Constr. Build. Mater. 172 (2018) 468–475.
doi:10.1016/j.conbuildmat.2018.03.232.
[29] B. Panda, S. Chandra Paul, M. Jen Tan, Anisotropic mechanical performance of 3D printed
fiber reinforced sustainable construction material, Mater. Lett. (2017).
doi:10.1016/j.matlet.2017.07.123.
[30] W.R. Leal, D.A. Silva, T.J. Andersen, A. Kudsk, K.F. Jørgensen, 3D Concrete Printing of
post-tensioned elements, Annu. IASS Symp. Creat. Struct. Des. (2018).
[31] S.C. Paul, Y.W.D. Tay, B. Panda, M.J. Tan, Fresh and hardened properties of 3D printable
cementitious materials for building and construction, Arch. Civ. Mech. Eng. (2018).
doi:10.1016/j.acme.2017.02.008.
[32] T.T. Le, S.A. Austin, S. Lim, R.A. Buswell, R. Law, A.G.F. Gibb, T. Thorpe, Hardened
properties of high-performance printing concrete, Cem. Concr. Res. 42 (2012) 558–566.
doi:10.1016/j.cemconres.2011.12.003.
[33] Y.W.D. Tay, G.H.A. Ting, Y. Qian, B. Panda, L. He, M.J. Tan, Time gap effect on bond
strength of 3D-printed concrete, Virtual Phys. Prototyp. 0 (2018) 1–10.
doi:10.1080/17452759.2018.1500420.

155
[34] W.K. J. Mata-Falcón, P. Bischof, Exploiting the Potential of Digital Fabrication for
Sustainable and Economic Concrete Structures, (2019) 157–166. doi:10.1007/978-3-319-
99519-9.
[35] ASTM C150 – Standard Specification for Portland Cement (2017), (n.d.).
[36] M. Moini, J. Olek, B. Magee, P. Zavattieri, J. Youngblood, Additive manufacturing and
characterization of architectured cement-based materials via X-ray micro-computed
tomography, 2019. doi:10.1007/978-3-319-99519-9_16.

156
CONCLUSIONS AND RECOMMENDATIONS
Several hypotheses were examined in the previous five chapters from which a number of
inferences were drawn. Chapter two alluded that shear moduli, G, G*, and G’, are more relevant
rheological property of the material that should be controlled if buckling is the failure mechanism
that dominates the buildability of the 3D-printed elements. Specifically, the shear modulus G, was
confirmed to be the most important rheological property for buildability. Chapter two also inferred
that materials’ yield stress is only vital at earlier layers and stages of the printing process where
yielding failure has a probability of occurrence (depending on the loading and printing rate).
Overestimation of buildability using Euler’s theory, suggested that in the future, imperfections in
a vertically printed element must be considered. In the future, realistic geometrical deviations from
a straight and vertical element during 3D-printing must be taken into account and be incorporated
in the prediction of buildability using Euler’s linear elastic model. The assumption of linear
elasticity itself can be further examined in early-ages of cement pastes and mortars using direct
input from the materials’ deformation (such as yielding and buckling) during the 3D-printing
process.
Chapter three affirmed that the processing-induced interfaces are indeed porous and,
therefore, weak. In this chapter, several other microstructural features (including macro-pores,
micro-channels, micro-pores) were found. Chapter four revealed that in micro-channels and micro-
pores that were thought to be connected at a large resolution were indeed connected at a smaller
resolution. A connected pore network was, therefore, claimed. In the future, this line of research
can be explored by investigating means to control the pore network that enables the fabrication of
novel and advanced material.
Chapter five confirmed that bio-inspired designs of cement-based materials are possible. It
also concluded that the weak interface could be harnessed to improve mechanical response and
flexural properties of brittle materials such as cement paste. It verified that combining such weak
interfaces, combined with clever architectures such as Bouligand elements leads to delocalization
of the damage in the brittle materials and allows for a ductile behavior and enhanced toughness,
without sacrificing the strength, in comparison to cast elements that are made of the same materials.
In the future, the advantages mechanical characteristics of novel architectures, some of which can

157
be found in nature, can be further explored using a layer-by-layer 3D-printing process that allows
for embedment of flaws such as weak interfaces in the material.
Chapter six confirmed that made certain that the materials’ internal arrangements such as
Bouligand and lamellar architectures, dictates the overall mechanical response and in the fracture
behaviors under compressive loads, some anisotropic and all distinctly different from the cast
counterparts. It also determined that Bouligand architectures combined with weak interfaces
improved toughness without sacrificing the strength, in comparison to cast counterparts. While
this chapter focused on post-mortem fracture behaviors, future directions can focus improving the
understanding of the mechanical response of 3D-printed elements and provides insight for
developments at large scales.
In summary, the findings of this dissertation put forward new knowledge in the areas of
early-age deformations of cement-based materials and design of cement-based structures
fabricated using additive manufacturing technologies. Chapter two demonstrated the two
mechanisms concerning the shape stability of 3D-printed elements, yield, and buckling. This
chapter translates the shape stability requirements into the most relevant material rheological
properties in the development of 3D-printed elements. Chapter three and chapter four, resolve the
questions about the characteristics of the interfaces and reveal the ‘weak’ and ‘interconnected’
nature of the interfaces of 3D-printed elements, though, these characteristics can be highly
processing-dependant. Chapter five and chapter six demonstrated a new pathway in the design of
brittle and quasi-brittle materials in tension and compression. These chapters put forward
prospective ideas for novel performance characteristics, including compliancy, improved ductility,
and toughness. These pathways can serve as a precursor for the structural design of plain cement-
based structures. However, they are additionally valuable when combined with other
advancements in construction materials and technologies such as alternative fibers and topology
optimization.