builders to the nation -...
TRANSCRIPT

Analyst Presentation
Q4 / FY18
May 28, 2018
Builders to the nation
2
This presentation contains certain forward
looking statements concerning L&T’s future
business prospects and business profitability,
which are subject to a number of risks and
uncertainties and the actual results could
materially differ from those in such forward
looking statements.
The risks and uncertainties relating to these
statements include, but are not limited to,
risks and uncertainties regarding fluctuations
in earnings, our ability to manage growth,
competition (both domestic and
international), economic growth in India and
the target countries for exports, ability to
attract and retain highly skilled professionals,
time and cost over runs on contracts, our
ability to manage our international
operations, government policies and actions
with respect to investments, fiscal deficits,
regulations, etc., interest and other fiscal
costs generally prevailing in the economy.
Past performance may not be indicative of
future performance.
The company does not undertake to make
any announcement in case any of these
forward looking statements become
materially incorrect in future or update any
forward looking statements made from time
to time by or on behalf of the company.
Disclaimer

3Presentation Outline
Group Performance Highlights
Group Performance Summary
Segment / Key Subsidiaries
The Environment & the Outlook

4Performance Highlights – FY18
EBITDA
+22%
PAT
+22%
ROE
13.9%
(+110bps)
Order Inflow
+7%
Revenue
(like-to-like)
+9.5%
Div/Share
₹ 16/-
(Payout 48%)

5
Q4
FY17
Q4
FY18% Var Particulars FY17 FY18 % Var
473 496 5% Order Inflow 1430 1529 7%
366 407 11% Revenue from Operations (like-to-like) 1093 1197 9.5%
44 54 23% EBITDA 111 136 22%
13.5% 14.2% +70 bps EBITDA Margin (ex services) 10.0% 10.5% +50 bps
30 32 5% PAT 60 74 22%
Net Working Capital 18.6% 19.2% +60 bps
RONW (%) 12.8% 13.9% +110 bps
Dividend (per share)-post bonus ₹ 14.00 ₹ 16.00 +₹ 2.00
Key Financial Indicators
Amount in ₹ bn
6Presentation Outline
Group Performance Highlights
Group Performance Summary
Segment / Key Subsidiaries
The Environment & the Outlook

7Q4/FY18 Order Inflow/Order Book
Order Inflow
Order Book
Amount in ₹ bn
2006
625
FY18
Dom Intl
26311915
698
FY17
Dom Intl
2613
473496
14301529
• Ordering activity pre- dominantly
led by public sector
• Domestic inflows compensates
for decline in international
inflows
• Private sector capex (including
real estate) still muted.
Nascent signs of pickup in metals
• Large diversified order book
smoothening sectoral cyclicality;
3X E&C Book to Bill
5%

8Key Orders won during FY18
Order Details Client Segment Value
Integrated light rail-based Urban Transit system Govt of Mauritius Infrastructure ~ USD 520 mn
Haliba Field Development EPC Contract Al Dhafra Petro-UAE Hydrocarbon ~ USD 340 mn
Crude Transit Line Kuwait Oil Company Hydrocarbon ~ USD 260 mn
Gas based Power plant in Bangladesh BPDB Power ~ USD 250 mn
Mumbai Trans Harbour Link MMRDA Infrastructure ~ ₹ 86 bn
Railway track (Eastern corridor) DFCCIL Infrastructure ~ ₹ 29 bn
Design & Construction of Roads,
Water Supply , Sewerage Treatment PlantsAPCRDA Infrastructure ~ ₹ 23 bn
Survey, Design Validation and Revamping of entire
Water supply system for Pune CityPune Municipal Corp. Infrastructure ~ ₹ 17 bn
Hydrocracker Project HPCL, Vizag Hydrocarbon ~ ₹ 16 bn
Six Lane extra dosed bridge across Hoogly river WBHDCL Infrastructure ~ ₹ 14 bn
South Parallel Runway-Bangalore Airport BIAL Infrastructure ~ ₹ 14 bn
Blast Furnace - Dolvi JSW Steel Infrastructure ~ ₹ 13 bn
Integrated Infrastructure Package of ABD Area Udaipur Smart City Ltd Infrastructure ~ ₹ 11 bn
Steam Generator and End Shields NPCIL Heavy Engg. ~ ₹ 7 bn
International
Domestic

9Group Performance – Sales & Costs
* Finance cost of financial services business and finance lease activity
• Infra, Hydrocarbon and services businesses drives revenue growth
• MCO charge benefits from cost curtailment and operating efficiencies
• Services business growth drives increase in staff costs
• AR Provisions leads to SGA cost increase
Q4
FY17
Q4
FY18 % Var ` Billion FY17 FY18 % Var
366 407 11% Revenue (like-to-like) 1,093 1,197 9.5%
31% 29% -2% International Revenue % 34% 33% -1%
252 269 7% MCO Exp. 727 773 6%
13 16 18% Fin. Charge Opex* 54 60 12%
35 41 18% Staff Costs 139 153 10%
24 26 12% Sales & Admin. 70 77 10%
324 353 9% Total Opex 989 1,063 7%

10Group Performance – EBITDA to PAT
• EBITDA growth mainly
contributed by Infra, Realty
and Fin services businesses
• Other income comprises of
treasury earnings
• Finance Cost commensurate
with average borrowing
level
• Higher tax provision mainly
due to Rule 14A provisions,
timing differences on DDT
Credit from Subs. and
higher PBT
Q4
FY17
Q4
FY18 % Var ` Billion FY17 FY18 % Var
44 54 23% EBITDA 111 136 22%
(3) (4) 41% Fin. Cost (13) (15) 15%
(7) (5) -32% Depreciation (24) (19) -19%
4 4 23% Other Income 13 14 5%
(3) (15) Tax Expense (20) (32)
1 (1) JV/S&A PAT Share (4) (4)
(2) (2) 9% Non-controlling Interest (4) (6) 43%
(3) - Exceptional items 1 1
30 32 5% PAT 60 74 22%

11Presentation Outline
Group Performance Highlights
Group Performance Summary
Segment / Key Subsidiaries
The Environment & the Outlook
12
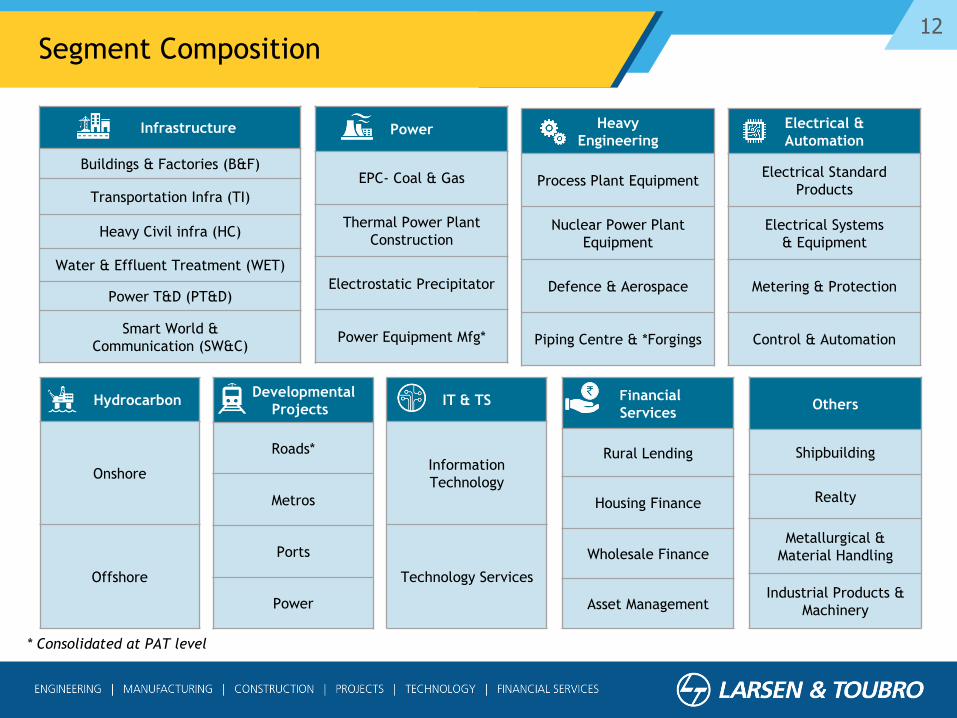
Power
EPC- Coal & Gas
Thermal Power Plant
Construction
Electrostatic Precipitator
Power Equipment Mfg*
* Consolidated at PAT level
Infrastructure
Buildings & Factories (B&F)
Transportation Infra (TI)
Heavy Civil infra (HC)
Water & Effluent Treatment (WET)
Power T&D (PT&D)
Smart World &
Communication (SW&C)
Heavy
Engineering
Process Plant Equipment
Nuclear Power Plant
Equipment
Defence & Aerospace
Piping Centre & *Forgings
Electrical &
Automation
Electrical Standard
Products
Electrical Systems
& Equipment
Metering & Protection
Control & Automation
Hydrocarbon
Onshore
Offshore
Developmental
Projects
Roads*
Metros
Ports
Power
IT & TS
Information
Technology
Technology Services
Financial
Services
Rural Lending
Housing Finance
Wholesale Finance
Asset Management
Others
Shipbuilding
Realty
Metallurgical &
Material Handling
Industrial Products &
Machinery
Segment Composition

13
Infrastructure57.1%
Power1.6%
HE3.8%
E&A3.7%
Hydrocarbon10.3%
Services16.7%
Others6.8%
Domestic76.6%
Middle East10.5%
USA & Europe6.5%
ROW6.4%
Order Inflow
₹1529 Bn
FY18 Order Inflow Composition

14
Domestic76.2%
Middle East16.8%
ROW7.0%
Order Book
₹2631 Bn
Infrastructure74.3%
Power3.6%
HE5.1%
E&A1.2%
Hydrocarbon10.1%
Others5.7%
FY18 Order Book Composition

15FY18 Revenue Composition
Infrastructure49.3%
Power5.2%
HE3.2%
E&A4.4%
Hydrocarbon9.8%
IT & TS9.3%
Fin. Services8.4%
Devl. Proj.3.6%
Others6.9%
Domestic66.9%
Middle East20.5%
USA& Europe8.5%
ROW4.1%
Revenue
₹1199 Bn
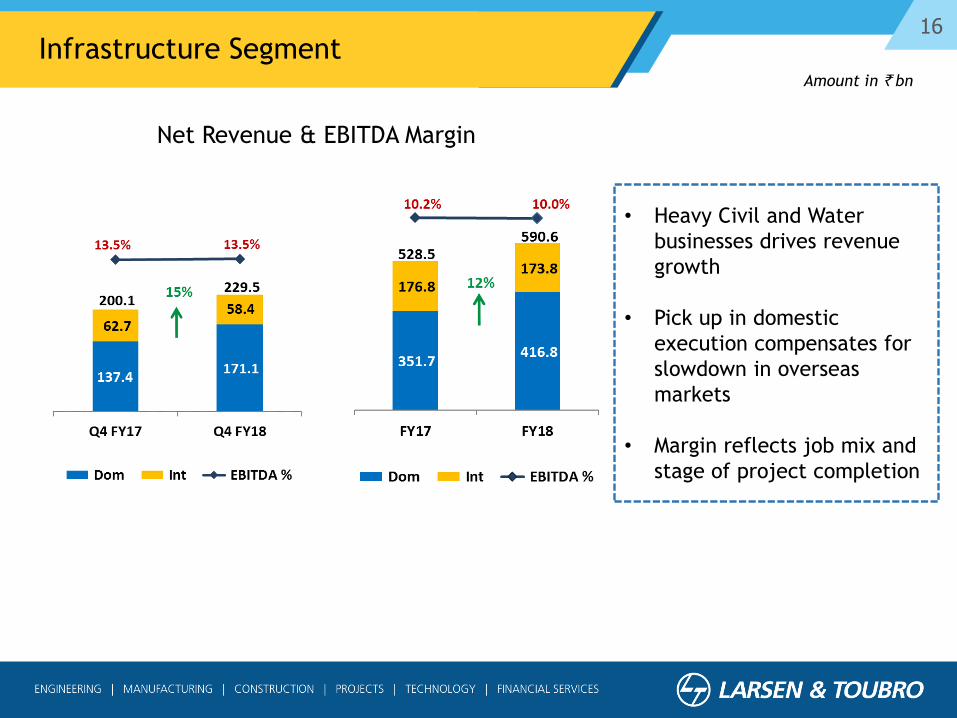
16
Amount in ` bn
Infrastructure Segment
• Heavy Civil and Water
businesses drives revenue
growth
• Pick up in domestic
execution compensates for
slowdown in overseas
markets
• Margin reflects job mix and
stage of project completion
Net Revenue & EBITDA Margin

17
Amount in ` bn
Power Segment
• Aggressive competition and
limited opportunities
continues to impact order
inflow
• Revenue decline reflects
depleting domestic order
book
• Execution of International
orders on track
• Profits of MHPS and other
JV companies are
consolidated at PAT level
under equity method
Net Revenue & EBITDA Margin

18
Amount in ` bn
Heavy Engineering Segment
• Defence business drives
revenue growth
• FY18 International
revenues impacted by
slowdown in refining
ordering
• Margin difference due to
variation in job execution
stages
Net Revenue & EBITDA Margin

19
Amount in ` bn
Electrical & Automation Segment
• Revenue growth for FY18
largely contributed by
product business
• Margin growth driven by
Standard Products group and
cost efficiencies across
multiple Business Units
• Undertaking signed for sale
of E&A business to Schneider
Electric for ₹ 140 bn subject
to regulatory clearances
Net Revenue & EBITDA Margin

20
Amount in ` bn
Hydrocarbon Segment
• Strong ordering activity
witnessed in domestic &
overseas markets
• Higher revenue growth on
efficient execution of
international order book
• Margin variance due to job
stage mix
Net Revenue & EBITDA Margin

21
Amount in ` bn
• Segment includes Power
Development, Hyderabad
Metro and Kattupalli Port
• IDPL (Roads & TL)
consolidated at PAT level
under Equity method.
Completed InvIT for 5 road
projects in May 2018
• Partial CoD of 30Km stretch
in Hyderabad Metro in Nov
2017.
• Q4 includes ₹ 2bn charge
on account of provision for
disputed receivables
(Nabha)
Developmental Projects Segment
Net Revenue & EBITDA Margin

22
Amount in ` bn
IT & Technology Services Segment
• LTI FY18 revenue growth led
by BFS, Energy & Utilities
and CPG, Retail & Pharma
Verticals
• LTTS FY18 revenue growth
led by Telecom & Hi-Tech
and Transportation verticals
Net Revenue & EBITDA Margin

23
Amount in ` bn
Others Segment
• Segment includes
Metallurgical & Material
Handling , Industrial
Products & Machinery,
Realty and Shipbuilding
businesses
• Revenues affected by
lower offtake in Valves
business, slowdown in
Realty sector and delayed
clearance/lower opening
Order Book in MMH
• Asset Monetisation in
Realty Business
Net Revenue & EBITDA Margin

24L&T Finance Holdings (I-GAAP)
• Growth momentum continues in Lending & investment management businesses
• Digital and Data Analytics aid operations including risk management
• Focus on ‘retailisation’ of the portfolio, growth in focused businesses, asset quality,
fee income, cost control and productivity gains
• Net worth increased due to Equity Issue of ₹ 30bn in Q4FY18
Q4
FY17
Q4
FY18 % Var ` Bn FY17 FY18 % Var
22.4 29.4 31% Total Income 85.7 105.0 22%
2.9 3.8 33%PAT attributable to Equity
Shareholders9.2 13.5 47%
393.0 659.3 68%
666.5 836.5 26%
5.0% 2.3% -268 bps
77.8 125.5 61%
12.3% 15.0% +272 bpsROE
Mutual Fund Average AUM
Networth
Loan Book
Net NPA (%)

25Presentation Outline
Group Performance Highlights
Group Performance Summary
Segment / Key Subsidiaries
The Environment & the Outlook

26The Environment & the Outlook
Operational Excellence
ValueMonetisation
Efficient &ProfitableExecution
RobustOrder
Acquisitions
NWCControl
Payouts Divestments
Asset Utilisation
RoE
Thrust
Budgetary Allocations
Private Sector
Capex
Tax Revenues
Middle East Capex
Global Protectionist
Policies
Oil Prices
Inflation /
Commodity Prices
Bharatmala / Infra
thrust
New Geographies
Nominal GDP
Growth
Central & State Govt. Spends
Client Payments &
Clearances
IBC / Twin Balance
Sheet Resolution
Currency
Rural & Social Welfare
Fiscal Deficit / CAD
MOAT
MOAT
MO
AT
MO
AT
Land Acquisition / ROW
Competition
Multilateral Funding
Inflation
Financialization of Savings
Consumption trends
PSU Capex

27
Thank You

28
Annexures

29Group Profit & Loss Extracts
*Income from operations does not include Excise duty from 1st July, 2017
FY18 FY17 % Var
Income from Operations* 111.9 100.6 42.9 943.2 1,198.6 1,100.1 9%
EBITDA 22.3 12.0 2.6 98.7 135.7 111.3 22%
Other Income 1.6 2.9 0.1 9.6 14.1 13.4 5%
Interest Expenses (0.3) (0.0) (0.5) (14.6) (15.4) (13.4) 15%
Depreciation (2.4) (0.5) (0.7) (15.6) (19.3) (23.7) -19%
Provision for Taxes (5.0) (1.8) (0.3) (24.9) (32.0) (20.1) 59%
Share in profit/(loss) of JVs /
Associates0.0 (3.9) (0.4) (4.4) (4.0)
Adjustments for non -controlling
interest in Subs., etc.(2.3) (4.6) 0.0 0.5 (6.3) (4.4)
Exceptional Items 1.2 1.2 1.2 1%
Net PAT 13.9 8.0 (2.8) 54.5 73.7 60.4 22%
L&T Group ` Billion IT & TS
Fin.
Services
Devl.
Projects
L&T &
Others (Incl.
Eliminations)
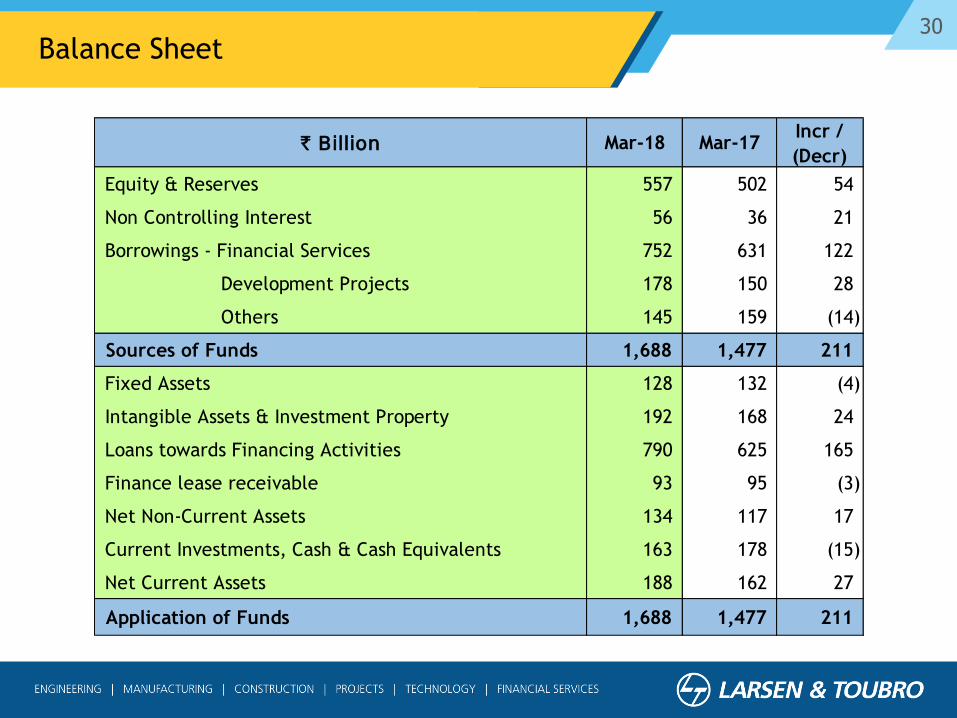
30Balance Sheet
` Billion Mar-18 Mar-17Incr /
(Decr)
Equity & Reserves 557 502 54
Non Controlling Interest 56 36 21
Borrowings - Financial Services 752 631 122
Development Projects 178 150 28
Others 145 159 (14)
Sources of Funds 1,688 1,477 211
Fixed Assets 128 132 (4)
Intangible Assets & Investment Property 192 168 24
Loans towards Financing Activities 790 625 165
Finance lease receivable 93 95 (3)
Net Non-Current Assets 134 117 17
Current Investments, Cash & Cash Equivalents 163 178 (15)
Net Current Assets 188 162 27
Application of Funds 1,688 1,477 211

31Group Cash Flow
* included under Net Cash from operations under statutory financial statements
Q4
FY17
Q4
FY18` Billion FY17 FY18
43.6 48.9 Operating Profit 112.5 132.5
28.1 11.9 Changes in Working Capital 43.5 (34.2)
(6.6) (8.7) Direct Taxes paid (32.0) (34.0)
65.1 52.1 Net Cash from Operations (A) 124.0 64.3
(6.9) (1.0) Net Investment in Fixed Assets (incl. Intangible) (28.2) (20.2)
(1.7) 2.0 Net (Purchase)/ Sale of Long Term investments 12.4 1.3
(20.3) 57.0 Net (Purchase)/ Sale of Current investments (71.5) 29.1
(19.8) (2.0) Loans/Deposits made with JV/Associate Cos. (22.2) (3.9)
5.8 23.0 Interest & Dividend Received 11.6 32.8
(42.9) 78.9 Net Cash from/(used in) Invest. Act. (B) (98.0) 39.1
0.6 12.1 Issue of Share Capital / Minority 21.1 14.6
13.8 (22.1) Net Borrowings 50.5 127.7
(26.3) (82.3) Disbursements towards financing activities* (57.4) (164.6)
(4.7) (6.5) Interest & Dividend paid (42.7) (48.6)
(16.6) (98.8) Net Cash from Financing Activities (C) (28.5) (70.9)
5.6 32.2 Net (Dec) / Inc in Cash & Bank (A+B+C) (2.4) 32.5

32Share in Profit/(Loss) of JVs/Associates
Q4
FY17
Q4
FY18 ` Bn FY17 FY18
0.34 0.43 MHPS JVs 1.12 1.54
0.63 (1.35) IDPL & Subs. (3.45) (4.14)
(0.46) (0.44) Special Steels and Heavy Forgings (1.87) (2.23)
0.32 0.19 Others 0.25 0.46
0.83 (1.17) Total (3.95) (4.36)

33
Roads and Bridges:
Portfolio: 15 projects (1661 Km)*
15 Operational
Project Cost: `161 bn
Power (Excl. Projects under DPR):
Portfolio: 2 projects (1499 MW)
1 Operational
Project Cost: `112 bn
Ports:
Portfolio: 2 projects (18 MTPA)
- Operational
Project Cost: `20 bn
Metros:
Portfolio: 1 project (71.16 Km)
– Under-implementation
Project Cost (Fin. Closure): `170 bn
Transmission Lines:
Portfolio: 1 project (482 Km)
- Operational
Project Cost: `15 bn
Total Project Cost
(Mar 2018): `478 Bn
Equity Invested at SPV level
(Mar 2018): ` 93 Bn
Balance Equity Commitment
(Mar 2018): ` 11 Bn
Concessions Business Portfolio – 21 SPVs
* As on 31st Mar,2018