building a better breakout system using simple filters
DESCRIPTION
Building a Better Breakout System Using Simple FiltersTRANSCRIPT
7/17/2019 Building a Better Breakout System Using Simple Filters
http://slidepdf.com/reader/full/building-a-better-breakout-system-using-simple-filters 1/426
T A C T I C A L I N V E S T M E N T S
(Figure. 1)
Building ABetter Breakout System
Using Simple Filters
TECHNICAL ANALYSIS TACKLES BREAKOUT AND
BREAKDOWN TRADE TECHNIQUES
There are several types of setups that traders look for when placing
long trades and short trades.Two of the most popular setups are known
as the trading range “breakout” for a long entry, and the trading range
“breakdown” for a short entry. After moving vertically for a period of
time, the price will often consolidate before resuming its vertical move ineither the same direction, or in the opposite direction. When prices trade
sideways, the bars or candles will often have similar highs and similar
lows. If there are two identical highs or two identical
lows, a trading range can be defined. This method
of defining a trading range will work regardless of
whether the trader uses a time chart, or a volume
bar, or tick chart.
Once defined, the trader places a horizontal
line on the highest high of the range and another
horizontal line on the lowest low. If the pr ice suddenly
breaks above the highest high of the range, a long
trade is entered using a buy stop a few ticks above
the highest high as the entry point. For a short trade,
a sell stop is placed a few ticks below the lowest lowto be used for the entry point. Some traders prefer to
use channels or bands to define their trading range
because both will follow price as it moves around
automatically, but most prefer using horizontal lines
which can give a trader a better visual view of the
top and bottom of the trading range, or trend lines
which help assist traders in determining the most
likely direction of the breakout.
While breakout and breakdown trades are
among the most popular, both can also be very
frustrating trades when shortly after entering the breakout or breakdown,
price goes a few ticks above or below the entry price, and then suddenly
reverses leaving the trader with a loss. There are a few ways to improve
the likelihood that the breakout or breakdown trade will result in a win
rather than a loss by selecting which breakout and breakdown trades
to enter, and then entering the ones with the better odds of success by
using a simple filter system. This article explains the filters I use when
deciding on which breakouts and breakdowns I believe will give me thebest chance for success.
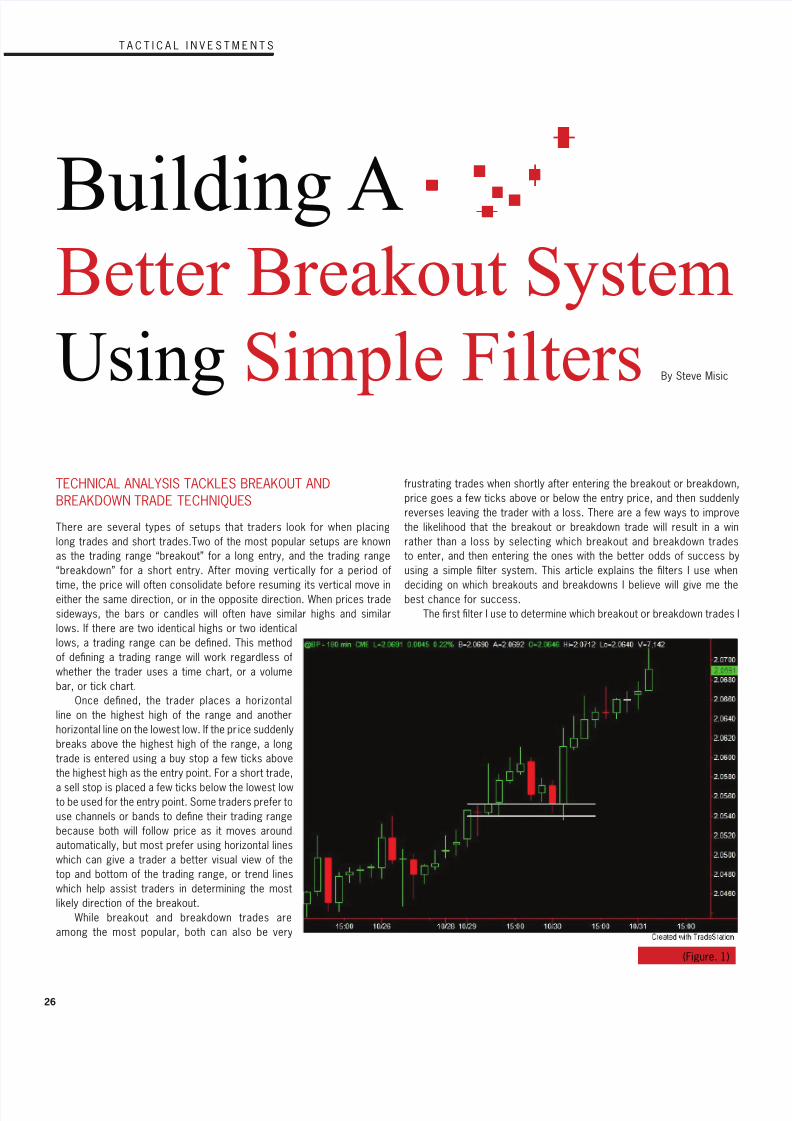
The first filter I use to determine which breakout or breakdown trades I
By Steve Misic
(Figure. 1)
7/17/2019 Building a Better Breakout System Using Simple Filters
http://slidepdf.com/reader/full/building-a-better-breakout-system-using-simple-filters 2/427INVEST FEB/MAR 2008
take on a small time frame entr y chart is the overall trend from the higher
time frame charts. Breakout long trades will have better win rates if the
instrument being traded is currently in a medium to long term up trend.
Breakdowns will have a higher success rate in markets that are topping
out, or have already entered short term down trends. In addition to the
trend, when I look at higher time frame charts, I am looking for visibleareas of support and resistance that need to be broken for a breakout or
a breakdown trade to be profitable. (Figure. 1)
Having a few concentrated bars or candles like those on a daily or
180 minute chart will provide a clear picture of the obstacles to success
on the entry chart. If the market is visiting an area of resistance or
support on a higher time frame for the first time, I will avoid breakout
and breakdown trades all together. These areas will produce higher time
frame retracement trades which will lead to many of the smaller time
frame whipsaw reversals that breakout traders often experience. If the
area of support or resistance on the higher time frame has been visited
several times, it becomes a better candidate for a winning breakout or
breakdown trade in the same direction as the macro trend.
As a visual aid, I use color coded horizontal lines to identify new or
old support and resistance. For support, I use blue for new and yellowfor old, and for resistance, red is new and yellow is old. These colored
lines help my mind make decisions faster without having to look at any
other charts during the trade. Another reason for knowing higher time
frame support and resistance would be for a pullback entry to join the
macro uptrend or downtrend with a minimal amount of risk. For example,
to safely enter a market that is in a macro up trend, I will find the area of
support on this higher time frame that I would buy a pullback to to join the
uptrend. Breakdowns into these support areas will be avoided since they
are less likely to produce consistent winning trades. Lim iting the losers in
a breakout or breakdown system using this first filter will lead to a fewer
number of overall entries, but it will not improve the amount of profit per
entry when used by itself. This will be addressed in the next two filters.
In summary, by finding support and resistance on the higher timeframe chart, and trading with the macro trend, I can force my mind to
focus on the long term picture, because the shor t term trend on my entry
chart will of ten show a completely different or totally opposite picture.
HIGHER TIME FRAME TREND AND VISIBLE SUPPORT AND
RESISTANCE
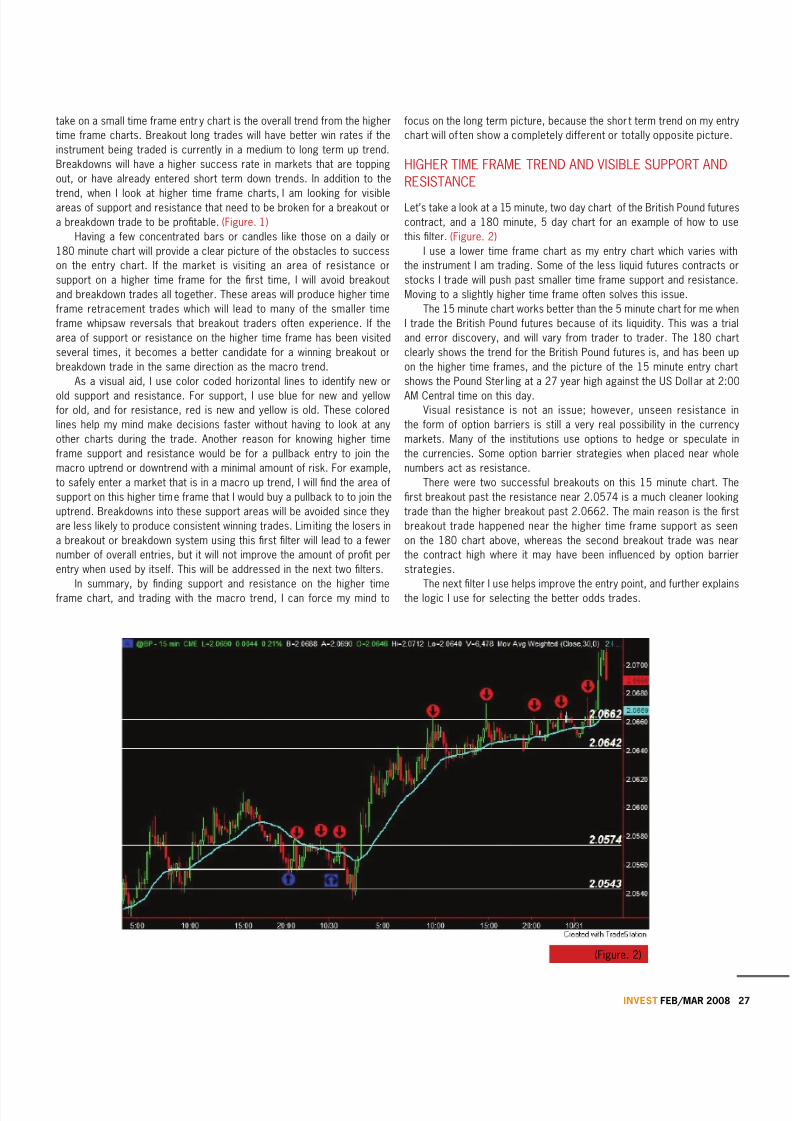
Let’s take a look at a 15 minute, two day chart of the British Pound futures
contract, and a 180 minute, 5 day chart for an example of how to use
this filter. (Figure. 2)
I use a lower time frame chart as my entry chart which varies with
the instrument I am trading. Some of the less liquid futures contracts or
stocks I trade will push past smaller time frame support and resistance.
Moving to a slightly higher time frame often solves this issue.
The 15 minute chart works better than the 5 minute chart for me when
I trade the British Pound futures because of its liquidity. This was a trial
and error discovery, and will vary from trader to trader. The 180 chart
clearly shows the trend for the British Pound futures is, and has been up
on the higher time frames, and the picture of the 15 minute entry chart
shows the Pound Ster ling at a 27 year high against the US Dollar at 2:00
AM Central time on this day.Visual resistance is not an issue; however, unseen resistance in
the form of option barriers is still a very real possibility in the currency
markets. Many of the institutions use options to hedge or speculate in
the currencies. Some option barrier strategies when placed near whole
numbers act as resistance.
There were two successful breakouts on this 15 minute chart. The
first breakout past the resistance near 2.0574 is a much cleaner looking
trade than the higher breakout past 2.0662. The main reason is the first
breakout trade happened near the higher time frame support as seen
on the 180 chart above, whereas the second breakout trade was near
the contract high where it may have been influenced by option barrier
strategies.
The next filter I use helps improve the entry point, and further explainsthe logic I use for selecting the better odds trades.
(Figure. 2)
7/17/2019 Building a Better Breakout System Using Simple Filters
http://slidepdf.com/reader/full/building-a-better-breakout-system-using-simple-filters 3/428
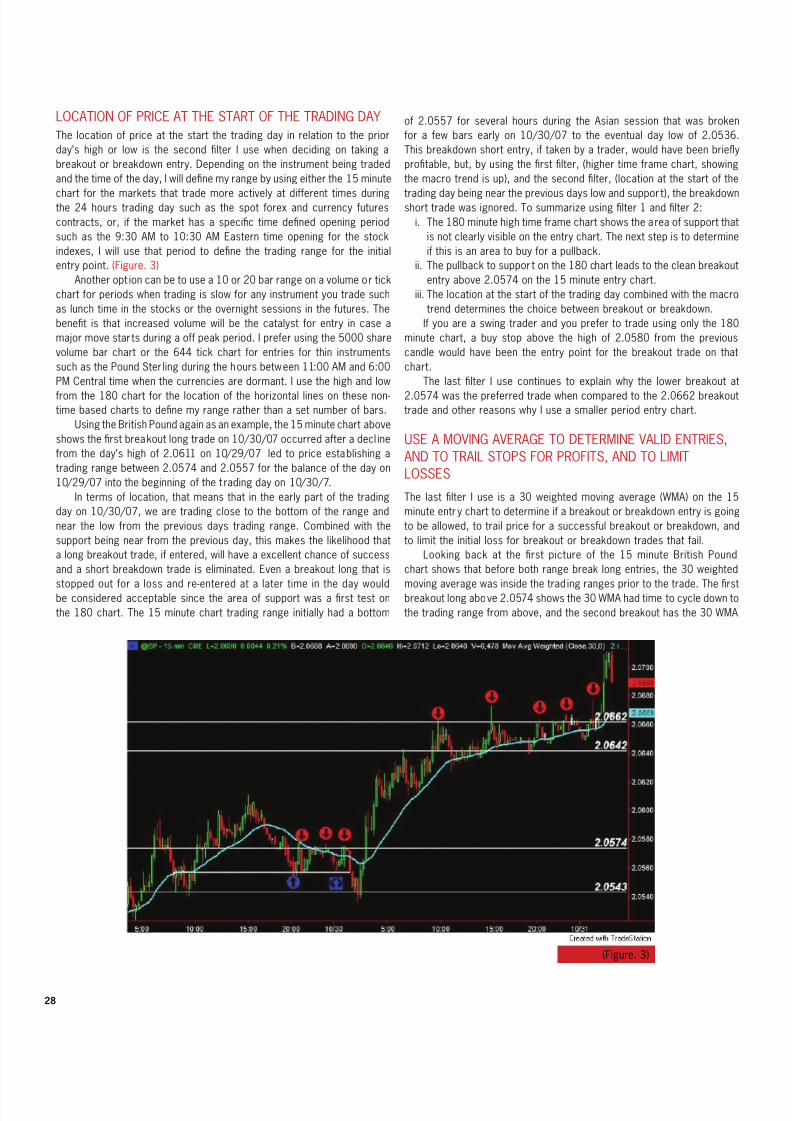
LOCATION OF PRICE AT THE START OF THE TRADING DAY
The location of price at the start the trading day in relation to the prior
day’s high or low is the second filter I use when deciding on taking a
breakout or breakdown entry. Depending on the instrument being traded
and the time of the day, I will define my range by using either the 15 minute
chart for the markets that trade more actively at different times duringthe 24 hours trading day such as the spot forex and currency futures
contracts, or, if the market has a specific time defined opening period
such as the 9:30 AM to 10:30 AM Eastern time opening for the stock
indexes, I will use that period to define the trading range for the initial
entry point. (Figure. 3)
Another opt ion can be to use a 10 or 20 bar range on a volume or tick
chart for periods when trading is slow for any instrument you trade such
as lunch time in the stocks or the overnight sessions in the futures. The
benefit is that increased volume will be the catalyst for entry in case a
major move star ts during a off peak period. I prefer using the 5000 share
volume bar chart or the 644 tick chart for entries for thin instruments
such as the Pound Ster ling during the hours between 11:00 AM and 6:00
PM Central time when the currencies are dormant. I use the high and low
from the 180 chart for the location of the horizontal lines on these non-time based charts to define my range rather than a set number of bars.
Using the British Pound again as an example, the 15 minute chart above
shows the first breakout long trade on 10/30/07 occurred after a decl ine
from the day’s high of 2.0611 on 10/29/07 led to price establishing a
trading range between 2.0574 and 2.0557 for the balance of the day on
10/29/07 into the beginning of the t rading day on 10/30/7.
In terms of location, that means that in the early part of the trading
day on 10/30/07, we are trading close to the bottom of the range and
near the low from the previous days trading range. Combined with the
support being near from the previous day, this makes the likelihood that
a long breakout trade, if entered, will have a excellent chance of success
and a short breakdown trade is eliminated. Even a breakout long that is
stopped out for a loss and re-entered at a later time in the day wouldbe considered acceptable since the area of support was a first test on
the 180 chart. The 15 minute chart trading range initially had a bottom
of 2.0557 for several hours during the Asian session that was broken
for a few bars early on 10/30/07 to the eventual day low of 2.0536.
This breakdown short entry, if taken by a trader, would have been briefly
profitable, but, by using the first filter, (higher time frame chart, showing
the macro trend is up), and the second filter, (location at the start of the
trading day being near the previous days low and suppor t), the breakdownshort trade was ignored. To summarize using filter 1 and filter 2:
The 180 minute high time frame chart shows the area of support that
is not clearly visible on the entry chart. The next step is to determine
if this is an area to buy for a pullback.
The pullback to suppor t on the 180 chart leads to the clean breakout
entry above 2.0574 on the 15 minute entry chart.
The location at the start of the trading day combined with the macro
trend determines the choice between breakout or breakdown.
If you are a swing trader and you prefer to trade using only the 180
minute chart, a buy stop above the high of 2.0580 from the previous
candle would have been the entry point for the breakout trade on that
chart.
The last filter I use continues to explain why the lower breakout at
2.0574 was the preferred trade when compared to the 2.0662 breakouttrade and other reasons why I use a smaller period entry chart.
USE A MOVING AVERAGE TO DETERMINE VALID ENTRIES,
AND TO TRAIL STOPS FOR PROFITS, AND TO LIMIT
LOSSES
The last filter I use is a 30 weighted moving average (WMA) on the 15
minute entr y chart to determine if a breakout or breakdown entry is going
to be allowed, to trail price for a successful breakout or breakdown, and
to limit the initial loss for breakout or breakdown trades that fail.
Looking back at the first picture of the 15 minute British Pound
chart shows that before both range break long entries, the 30 weighted
moving average was inside the trad ing ranges prior to the trade. The firstbreakout long above 2.0574 shows the 30 WMA had time to cycle down to
the trading range from above, and the second breakout has the 30 WMA
i.
ii.
iii.
(Figure. 3)
7/17/2019 Building a Better Breakout System Using Simple Filters
http://slidepdf.com/reader/full/building-a-better-breakout-system-using-simple-filters 4/429INVEST FEB/MAR 2008
Good luck and trade wisely.Steve MisicTradingAcademy.Com
catching up to the higher trading range from below.
Using the 30 WMA being a part of the trading range as a condition
for entry, I would now need both the 30 WMA being part of the trading
range, and for price to be above the highest high for the breakout long
trade to be valid. For a valid short entry, price would need to be below
the 30 WMA and the lowest low of the range for a valid breakdown shortto trigger. Trades where the 30 WMA is not a part of the trading range
prior to entry are ignored.
Once the entry happens in either case, a pullback to the breakout
price or back in the range is always possible. There is a condition I use
for ending the trade early that depends on the close of the breakout or
breakdown bar. My rule for using the 30 WMA as a stop loss is that if I take
the breakout long entry, and the breakout candle closes above the highest
high of the trading range, I will then use the 30 WMA as a trailing stop right
away. I use the lowest low of the trading range as my initial stop in case I
am dragged back into the trading range during a false breakout.
A false breakout is a breakout bar that returns to the trading range
before it closes. Once the breakout candle closes above the top of
the range, if price retraces immediately back to the trading range, the
breakout line would need to provide support. A trade below the 30 WMAat this point would be an early exit, and the breakout would be a failed
breakout long trade. For breakdowns, the initial stop is above the highest
high of the range until the breakdown candle closes. I f it closes below the
lowest low of the trading range, the 30 WMA will start to trail the trade.
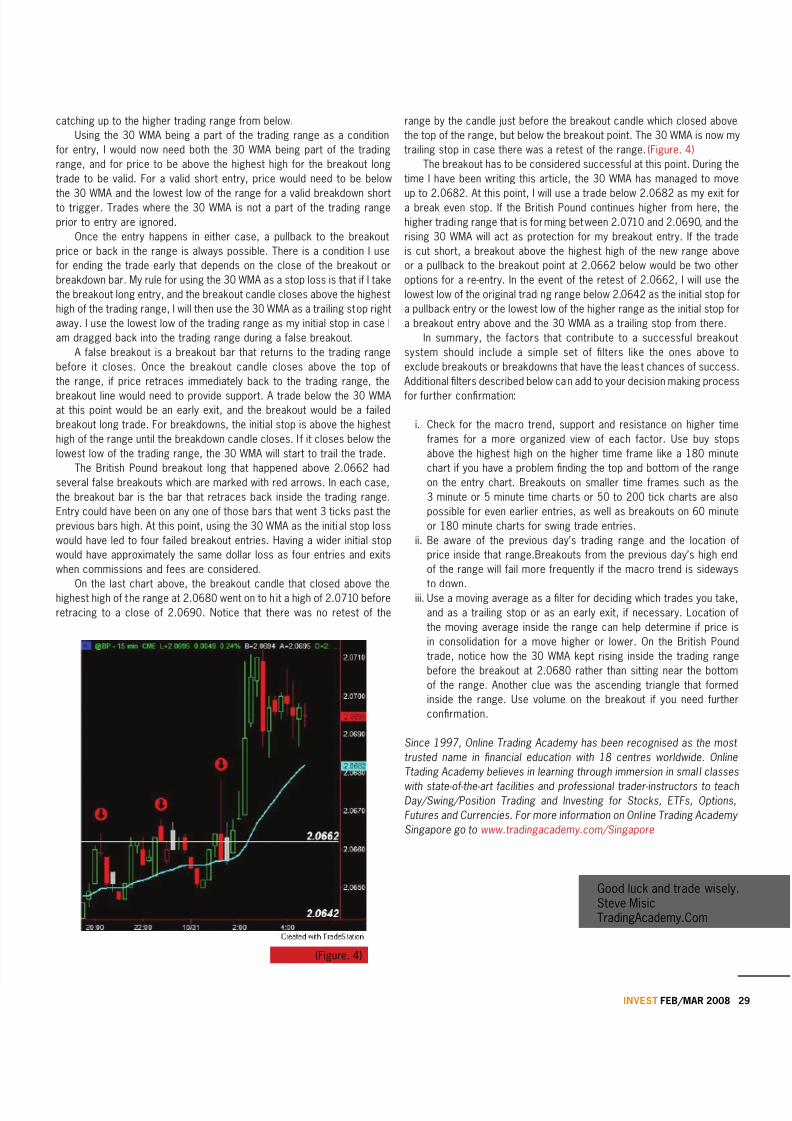
The British Pound breakout long that happened above 2.0662 had
several false breakouts which are marked with red arrows. In each case,
the breakout bar is the bar that retraces back inside the trading range.
Entry could have been on any one of those bars that went 3 ticks past the
previous bars high. At this point, using the 30 WMA as the initial stop loss
would have led to four failed breakout entries. Having a wider initial stop
would have approximately the same dollar loss as four entries and exits
when commissions and fees are considered.
On the last chart above, the breakout candle that closed above thehighest high of the range at 2.0680 went on to h it a high of 2.0710 before
retracing to a close of 2.0690. Notice that there was no retest of the
range by the candle just before the breakout candle which closed above
the top of the range, but below the breakout point. The 30 WMA is now my
trailing stop in case there was a retest of the range. (Figure. 4)
The breakout has to be considered successful at this point. During the
time I have been writing this article, the 30 WMA has managed to move
up to 2.0682. At this point, I will use a trade below 2.0682 as my exit fora break even stop. If the British Pound continues higher from here, the
higher trading range that is forming between 2.0710 and 2.0690, and the
rising 30 WMA will act as protection for my breakout entry. If the trade
is cut short, a breakout above the highest high of the new range above
or a pullback to the breakout point at 2.0662 below would be two other
options for a re-entry. In the event of the retest of 2.0662, I will use the
lowest low of the original trading range below 2.0642 as the initial stop for
a pullback entry or the lowest low of the higher range as the initial stop for
a breakout entry above and the 30 WMA as a trailing stop from there.
In summary, the factors that contribute to a successful breakout
system should include a simple set of filters like the ones above to
exclude breakouts or breakdowns that have the least chances of success.
Additional filters described below can add to your decision making process
for further confirmation:
Check for the macro trend, support and resistance on higher time
frames for a more organized view of each factor. Use buy stops
above the highest high on the higher time frame like a 180 minute
chart if you have a problem finding the top and bottom of the range
on the entry chart. Breakouts on smaller time frames such as the
3 minute or 5 minute time charts or 50 to 200 tick charts are also
possible for even earlier entries, as well as breakouts on 60 minute
or 180 minute charts for swing trade entries.
Be aware of the previous day’s trading range and the location of
price inside that range.Breakouts from the previous day’s high end
of the range will fail more frequently if the macro trend is sideways
to down.Use a moving average as a filter for deciding which trades you take,
and as a trailing stop or as an early exit, if necessary. Location of
the moving average inside the range can help determine if price is
in consolidation for a move higher or lower. On the British Pound
trade, notice how the 30 WMA kept rising inside the trading range
before the breakout at 2.0680 rather than sitting near the bottom
of the range. Another clue was the ascending triangle that formed
inside the range. Use volume on the breakout if you need further
confirmation.
Since 1997, Online Trading Academy has been recognised as the most
trusted name in financial education with 18 centres worldwide. Online
Ttading Academy believes in learning through immersion in smal l classes
with state-of-the-art facilities and professional trader-instructors to teachDay/Swing/Position Trading and Investing for Stocks, ETFs, Options,
Futures and Currencies. For more information on Onl ine Trading Academy
Singapore go to www.tradingacademy.com/Singapore
i.
ii.
iii.
(Figure. 4)