building a better company - corporate-ir.net · products/distribution network key brands/ markets...
TRANSCRIPT

Terex Equipment Limited Unit Rig Payhauler Fermecaques O&K Mining Powerscreen International Powerng Standard Havens American Crane Comedil Terex Ler PPM SAS Telelect Terex Aerials Limited Terex HandleWaverly Operations Terex RO Amida Industries Bartell
ica-Jaques Cedarapids Terex Equipment Limited Unit Rascreens Limited Jaques O&K Mining Powerscreen
dustries Simplicity Engineering Standard Havens Ameerexlift Terex Lifting UK Peiner PPM SAS Telelect Terexway Operations Terex Lifting Waverly Operations Tereenford Limited B.L. Pegson Canica-Jaques Cedarapids Tcturing Limited Finlay Hydrascreens Limited Jaques Oech Royer Industries Simplicity Engineering Standarand Lift Terexlift Terex Lifting UK Peiner PPM SAS Teleng Conway Operations Terex Lifting Waverly OperationeerinG Benford Limited B.L. Pegson Canica-Jaques Cedanufacturing Limited Finlay Hydrascreens Limited Jated Re-Tech Royer Industries Simplicity Engineering ia Holland Lift Terexlift Terex Lifting UK Peiner PPM
alia Terex Lifting Conway Operations Terex Lifting Wa
BUILDING A BETTER COMPANY
ANNUAL REPORT 2000
▼
P R O F I T A B L E G R O W T H
Q U A L I T Y P R O D U C T S
C U S T O M E R S A T I S F A C T I O N
B R A N D R E C O G N I T I O N
O R G A N I Z A T I O N A L E F F E C T I V E N E S S

CONTENTS
1 Financial Highlights
2 Terex Corporation At-A-Glance
4 Letter to Shareholders and Stakeholders
BUILDING A BETTER COMPANY
8 Profitable Growth
10 Quality Products
12 Customer Satisfaction
14 Brand Recognition
16 Organizational Effectiveness
18 Shareholder Information
— Annual Report on Form 10-K
IBC Terex Corporation World Wide Web Site
A B O U T T E R E X▼
Terex Corporation is a diversified global
manufacturer of a broad range of lifting, earth-
moving, and light construction equipment for
the construction, infrastructure development,
quarrying, recycling, and surface mining indus-
tries. Terex has achieved a significant opera-
tional transformation over the past several years
due to a unique business model of outsourcing,
low overhead, and acquisitions leading to prod-
uct and geographic diversity.
We are driven by our mission statement of
manufacturing and marketing high quality capital
equipment designed to improve our customers'
productivity and return on invested capital. Our
products are manufactured in 39 facilities in
North America, Europe, Asia, and Australia and
are marketed in more than 100 countries. They
are sold primarily through a worldwide network
of dealers in over 1000 locations.
1
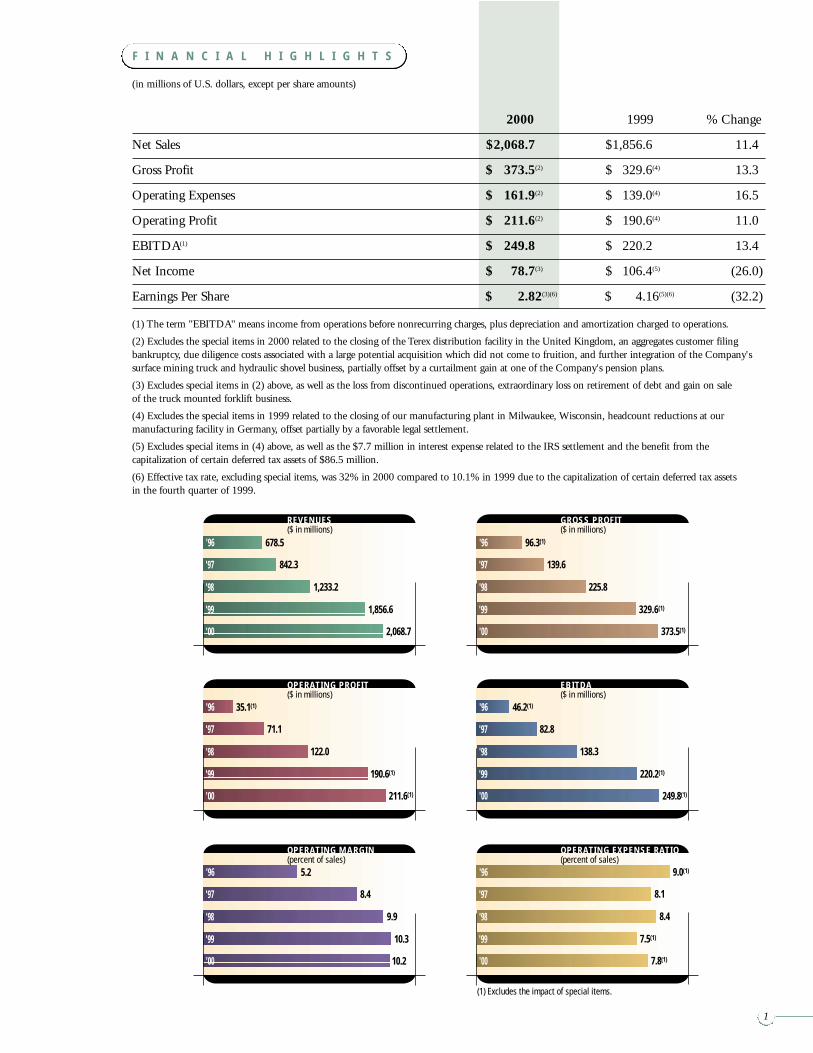
F I N A N C I A L H I G H L I G H T S
2000 1999 % Change
Net Sales $2,068.7 $1,856.6 11.4
Gross Profit $ 373.5(2) $ 329.6(4) 13.3
Operating Expenses $ 161.9(2) $ 139.0(4) 16.5
Operating Profit $ 211.6(2) $ 190.6(4) 11.0
EBITDA(1) $ 249.8 $ 220.2 13.4
Net Income $ 78.7(3) $ 106.4(5) (26.0)
Earnings Per Share $ 2.82(3)(6) $ 4.16(5)(6) (32.2)
(in millions of U.S. dollars, except per share amounts)
OPERATING EXPENSE RATIO(percent of sales)
(1) Excludes the impact of special items.
EBITDA($ in millions)
GROSS PROFIT($ in millions)
OPERATING MARGIN(percent of sales)
OPERATING PROFIT($ in millions)
REVENUES($ in millions)
'97
'98
'99
'00
'96
1,856.6
1,233.2
842.3
678.5
2,068.7
'97
'98
'99
'00
'96
329.6(1)
225.8
139.6
96.3(1)
373.5(1)
'97
'98
'99
'00
'96
220.2(1)
138.3
82.8
46.2(1)
249.8(1)
'97
'98
'99
'00
'96
7.5(1)
8.4
8.1
9.0(1)
7.8(1)
'97
'98
'99
'00
'96
190.6(1)
122.0
71.1
35.1(1)
211.6(1)
'97
'98
'99
'00
'96
10.3
9.9
8.4
5.2
10.2
(1) The term "EBITDA" means income from operations before nonrecurring charges, plus depreciation and amortization charged to operations.
(2) Excludes the special items in 2000 related to the closing of the Terex distribution facility in the United Kingdom, an aggregates customer filing bankruptcy, due diligence costs associated with a large potential acquisition which did not come to fruition, and further integration of the Company'ssurface mining truck and hydraulic shovel business, partially offset by a curtailment gain at one of the Company's pension plans.
(3) Excludes special items in (2) above, as well as the loss from discontinued operations, extraordinary loss on retirement of debt and gain on sale of the truck mounted forklift business.
(4) Excludes the special items in 1999 related to the closing of our manufacturing plant in Milwaukee, Wisconsin, headcount reductions at our manufacturing facility in Germany, offset partially by a favorable legal settlement.
(5) Excludes special items in (4) above, as well as the $7.7 million in interest expense related to the IRS settlement and the benefit from the capitalization of certain deferred tax assets of $86.5 million.
(6) Effective tax rate, excluding special items, was 32% in 2000 compared to 10.1% in 1999 due to the capitalization of certain deferred tax assets in the fourth quarter of 1999.

(1) Excludes the impact of special items.
OPERATING PROFIT($ in millions)
'97
'98
'99
'00
'96
90(1)
42
25
16
115(1)
(1) Excludes the impact of special items.
OPERATING PROFIT($ in millions)
'97
'98
'99
'00
'96
100(1)
82
47
23
95(1)
T E R E X E A R T H M O V I N G
T E R E X L I F T I N G
T E R E X L I G H T C O N S T R U C T I O N
2
Operating Units Manufacturing Facilities
B.L. Pegson Coalville, EnglandBenford Limited Warwick, EnglandCanica-Jaques Vancouver, Washington, USACedarapids Cedar Rapids, Iowa, USAFermec Manufacturing Limited Manchester, EnglandFinlay Hydrascreens Limited Omagh, Northern IrelandJaques Subang Jaya, Malaysia; Melbourne, Australia;
Chomburi, ThailandO&K Mining Dortmund, GermanyPowerscreen International Dungannon, Northern IrelandPowerscreen Limited Kilbeggan, IrelandRe-Tech and Royer Industries Lebanon, Pennsylvania, USASimplicity Engineering Durand, Michigan, USAStandard Havens Glasgow, Missouri, USATerex Equipment Limited Motherwell, ScotlandUnit Rig and Payhauler Tulsa, Oklahoma, USA
American Crane Wilmington, North Carolina, USAComedil Fontanafredda, ItalyHolland Lift Hoorn, The NetherlandsPPM SAS Montceau-les-Mines, FrancePeiner Trier, GermanyTelelect Watertown, South Dakota, USATerex Aerials Limited Cork, IrelandTerex Handlers Baraga, Michigan, USATerex Italia Crespellano, ItalyTerex Lifting Australia Brisbane, AustraliaTerex Lifting – Conway Operations Conway, South Carolina, USATerex Lifting UK Tetbury, EnglandTerex Lifting – Waverly Operations Waverly, Iowa, USATerex – RO Olathe, Kansas, USATerexlift Perugia, Italy
Amida Industries Rock Hill, South Carolina, USA
Coleman Engineering Holly Springs, Mississippi, USA; Memphis, Tennessee, USATerex Bartell Ltd. Brampton, Ontario, Canada
T E R E X C O R P O R A T I O N A T - A - G L A N C E

Products/Distribution Network Key Brands/ Markets
Crushers B.L. PegsonPower buggies, rollers, soil compactors, vibratory plate compactors BenfordCrushers Canica-JaquesCrushers, asphalt pavers, screens Cedarapids, GrayhoundLoader backhoes FermecCrushers, washing systems, trommels, screens FinlayScreens, feeders, crushers Jaques
Large hydraulic excavators O&KWashing systems, screens, trommels PowerscreenWashing systems, screens, trommels PowerscreenTrommels, recycling systems Re-Tech, Royer, TerexHeavy duty screens and feeders SimplicityAsphalt mixing plants Cedarapids, Standard HavensOff-highway rigid and articulated haulers, scrapers TerexElectric rear and bottom dump haulers, all wheel drive rigid off-highway trucks Unit Rig, Payhauler, Lectra Haul, TerexOver 212 independent dealers and over 77 distributor/agents. Broad array of worldwide customers
in the construction, mining, quarrying, recycling, and infrastructure industries.
Lattice boom cranes, tower cranes American, TerexTower cranes ComedilAerial work platforms Holland LiftAll terrain hydraulic mobile cranes, container stackers PPM, TerexTower cranes PeinerUtility aerial devices, digger derricks Telelect, Hi-RangerAerial work platforms TerexRough terrain telescopic material handlers Square Shooter, TerexRough terrain hydraulic mobile cranes Terex, Bendini, PPMAll terrain mobile cranes FrannaRough terrain hydraulic mobile cranes, truck cranes P&H, TerexMaterial handlers MatbroRough terrain hydraulic mobile cranes, truck cranes, aerial work platforms Terex, Lorain, Terex AerialsTruck mounted cranes RO-StingerRough terrain telescopic material handlers, cement mixers, concrete pumps Italmacchine, TerexOver 700 independent distributors worldwide. Crane and aerial lift rental customers in the construction,
recycling, shipping, transportation, refining, and utility industries.
Portable floodlighting systems, concrete power trowels, Amida, Benford, Morrison, Terex, Mullerconcrete placement systems, traffic control productsGenerators, light towers Coleman EngineeringPower trowels, concrete finishing systems Bartell, TerexGlobal network of dealers, distributors, and national accounts. Rental customers in the construction
and maintenance industries.
3

The year 2000 was a year of both accomplishments and
challenges at Terex. We posted record sales, operating income,
and operating cash flow for the fourth consecutive year, despite
an economic environment that grew increasingly more challeng-
ing as the year progressed. Over the past several years, we have
taken many steps to transform Terex into a Company that
not only thrives and prospers in good times, but also remains
profitable during downturns. I am gratified to say that the Terex
model of variabilizing our cost structure and minimizing our
overhead costs has proven itself during 2000. We were able to
maintain and, in some cases, increase our margins in the face
of declining volumes in several of our product lines, especially
in North America. The strategic actions we took in 1999 to
diversify and strengthen the Company with the acquisitions
of both Powerscreen and Cedarapids are paying off. We believe
we have positioned ourselves for more consistent growth and
profitability by becoming a leading player in the growing
aggregate equipment industry.
In last year’s letter, I made a commitment to generate a
substantial amount of free cash flow, to pay down debt and
to slow down acquisitions. We exceeded these commitments,
and I am happy to say that our financial structure has improved
markedly. I also commented that we would use the Internet to
help our customers and challenge the way we conduct business
in this industry. We delivered on that commitment too, and in
mid-January 2001, we announced the launching of EarthKing
(Terex is Latin for EarthKing), an independent and unbiased
Internet marketplace for owners and operators of construction
and mining equipment to manage their fleet. Our vision was to
create a new company that would reduce the life cycle costs on
all types of capital equipment and allow owners and operators
of capital equipment to maximize their return on investment.
And I believe we are on our way to realizing this goal.
For the fifth year in a row, we created a material amount of
economic value as our after-tax return on invested capital was
greater than our weighted average cost of capital. However, we
continue to be disappointed by the performance of our stock price.
Having said that, despite the fact that equity markets for capital
goods companies have been in turmoil for the past couple of
years, Terex’s equity value has outperformed both the S&P 500
and the S&P Diversified Machinery indices over the past five
T O O U R S H A R E H O L D E R S A N D S T A K E H O L D E R S :
years. The Terex operating model is designed to offer to current
and prospective stakeholders a company with a lower operating
risk, which in a cyclical industry should be rewarded with a
higher valuation than the current one. I remain committed to
look for ways to create shareholder value, and I am convinced
that ultimately Terex will prove to be a solid investment for
all our stakeholders.
Financial Performance
Over the past five years, we have quadrupled the size of our
Company, growing from $501 million in revenue in 1995
to $2.1 billion in revenue in 2000. We continue to build a
growing franchise under the Terex brand name and remain
very focused on our mission of delivering products that are
reliable, productive, and cost-effective and that improve our
customers’ return on invested capital. Sales in 2000 increased
11 percent to a new record of $2.1 billion. Operating profit
rose 11 percent to $212 million, driven almost entirely by the
impact of the 1999 acquisitions of Cedarapids and Powerscreen.
Operating margin remained essentially flat at 10.2 percent of
sales, despite the fact that we faced declining volumes in several
of our North American product lines.
The Terex operating model successfully passed a very impor-
tant test this past year, especially in the mining business, where
we saw volume decline almost 50 percent. Many in the capital
goods sector reported operating losses in this type of environment.
Terex did not! EBITDA of $250 million for the year was also
a record and was up $30 million, or 13.4 percent, versus the
prior year. EBITDA margin has also increased for the sixth con-
secutive year, increasing from 11.9 percent of sales in 1999 to
12.1 percent in 2000. Operating expenses as a percentage of sales,
which had fallen for the past four years, increased slightly from
7.5 percent in 1999 to 7.8 percent in 2000. Our objective in
this area is to continue to eliminate non-value added functions
throughout the organization and at the same time strengthen
our franchise by investing in operating control systems, after-
market service and support, and e-commerce capabilities. One
of our stated objectives for 2000 was to reach an 11 percent
operating margin for the entire Company. We did not reach
that objective, mainly because we faced a number of issues in
the mining business including the absence of the 1999 Coal
4

Over the past two years alone, we have
increased our revenues by more than
65 percent and at the same time reduced
our net debt-to-capital ratio by 25
percentage points from 86.1 percent
in 1998 to 61.5 percent in 2000.
next two years will be to further reduce our working capital as a
percentage of sales down to 25 percent.
We used cash to reduce debt, and at the end of 2000 our
debt net of cash stood at approximately $721 million and the
net debt-to-capital ratio was 61.5 percent. This is the first time
in the past decade that Terex’s net debt-to-capital ratio dropped
to approximately 60 percent. Over the past two years alone,
we have increased our sales by more than 65 percent and at the
same time reduced our net debt-to-capital ratio by approximately
25 percentage points from 86.1 percent in 1998 to 61.5 percent
in 2000. There is no question in my mind that today, Terex is
in a much better position to continue to grow and create value
for our shareholders.
Strategic Intent
We remain committed to a low cost provider strategy, selling to
multiple channels of distribution with a very flexible cost and
pricing structure. This is the same internal strategy that we out-
lined last year. During 1998 and 1999, we invested over $800
million in several acquisitions with the objective of diversifying
our portfolio and creating long-term value for our shareholders.
However, we did take a pause last year in our acquisition pro-
gram and concentrated on reducing our leverage and increasing
our financial flexibility. This does not alter the fact that both
our customers and suppliers are rapidly consolidating, and in
order to grow and prosper in the capital goods industry, manu-
facturers need to do the same. Our process regarding acquisitions
is very disciplined and is one of our core competencies. First,
the target company must provide substantial opportunity for
revenue growth or for implementing the Terex operating model
or both. Second, the transaction must generate a return on
invested capital substantially in excess of our weighted average
cost of capital of approximately 10 percent. Third, the acquisition
must be accretive to earnings within the first year of ownership.
India order, the slowdown in anticipated orders, and the finan-
cial impact of the introduction of the new MT5500 mining
truck, which needed to prove itself to our customers. In addi-
tion, in the North American hydraulic mobile crane market,
we had to manage through a 13 percent decline in industry
orders and a more aggressive competitor trying to reestablish
itself in the marketplace. We did find out in the process, however,
that the hydraulic crane market is a lot less price-sensitive in a
downturn than we had anticipated. We will continue to raise
the bar and challenge the organization, even if we know that
the business outlook will make it very difficult to increase our
operating margin in 2001.
Cash Flow and Capital Structure
In last year’s letter, I committed to increase our financial flexibility
and to generate over $200 million of free cash flow and pay
down debt. I believe we delivered on all those fronts. In total
for 2000, we generated over $300 million of free cash flow -
a very satisfying performance. During 2000, we generated $201
million of operating cash, a $196 million increase from 1999.
We also made a concerted effort to improve our working capital
management. By focusing more aggressively on our supply chain,
we were able to reduce our net inventories by approximately
10 percent from $666 million in 1999 to $598 million in 2000.
Furthermore, we brought our trade receivables and payables in
better balance, freeing additional cash flow. Overall, we reduced
our working capital by approximately $120 million. As a result,
our working capital as a percentage of sales declined from 37
percent in 1999 to 31 percent in 2000. There is no question that
we have more work to do in this area and our objective over the
Ronald M. DeFeo, Chairman, President and Chief Executive Officer, center
Ernest R. Verebelyi, President, Terex Earthmoving, left
Fil Filipov, President, Terex Lifting, right
5

EBITDA, were sold approximately one year later for 9 times
EBITDA to Partek of Finland. We also continued to reduce
our exposure to the aerial work platform business because we
believe that this industry suffers from over-capacity and that
the rental companies will continue to exert downward pressure
on manufacturers’ margins.
Going forward, you should expect us to remain disciplined
in our capital allocation whether we choose to pay down debt,
buy back stock, or acquire assets.
Internal Developments
The Terex franchise continues to grow across the construction,
infrastructure, recycling, mining, and rental markets. The
Lifting segment faced a difficult year, as the U.S. hydraulic
crane market fell approximately 13 percent and a major com-
petitor tried to reestablish itself with a revitalized product line.
Several of our hydraulic mobile crane customers were also
affected by a lack of capital and substantially reduced their
equipment purchases. We held our own very well and our mar-
ket share of U.S. commercial hydraulic cranes stayed above 40
percent in 2000. Besides the weakness in hydraulic mobile
cranes and aerial work platforms, we had a very successful year,
highlighted by the strong performance of our lattice boom crane
operation and our continued market penetration in boom
trucks and utility aerial devices. The European Lifting business
delivered a good performance, driven by the impact of the 1999
acquisitions and our strong performance in France, Italy, and
Spain, with container stackers, tower cranes, and material
handlers. We initiated a new aftermarket program designed to
provide faster and better service to our customers. This brand
new Product Support Plus Program was designed to create 30
service centers in both North America and Europe, all of them
connected to a central location with global positioning systems
capability. These red vans are providing a product support
link between customers, distributors, and the respective Terex
Lifting factories.
The Earthmoving segment had a mixed year, as the strong
performance of our aggregates business was partially offset by
the very soft performance of our mining business. Powerscreen
posted record results, led by the introduction of new track-
mounted machines, cost savings from leveraging our material
purchases, and more efficient production. Cedarapids benefited
from a full year of restructuring actions as overhead expenses
We did make two small acquisitions during the second half
of 2000. In October, we closed on the acquisition of Coleman
Engineering, a $15 million manufacturer of portable light
towers and generators for the rental industry. This transaction
strengthens our position in the light construction equipment
area, particularly in the large generator product line, which we
believe is a growth segment. In late December, we closed on
the acquisition of Fermec, a leading European manufacturer
of loader backhoes based in England, with $80 million in rev-
enues. This acquisition gives us the opportunity to implement
our low-cost operating model in a new product line that
increasingly sells through rental fleets and therefore requires a
lower cost design. The Fermec brand provides an excellent plat-
form from which to develop a cost-effective line under Terex
ownership that represents a compelling value to these customers.
While you know us for the many acquisitions we have made
over the past several years, we would like to be known for the
many we walked away from because they did not meet our criteria.
We were also busy during the past year assessing our portfolio
of assets, and during the third quarter of 2000, we divested the
truck-mounted forklift businesses. Those businesses, which we
acquired in the second half of 1999 for approximately 6 times
T O O U R S H A R E H O L D E R S A N D S T A K E H O L D E R S :
6
Front row, left to right, Jack Lascar, Vice President, Investor Relations
and Corporate Communications, Murray Scott, Vice President and General
Manager, Terex Light Construction / Terex Worldwide Parts Distribution Center,
Brian J. Henry, Vice President, Finance, Business Development
Back row, left to right, Eric I Cohen, Senior Vice President, Secretary and
General Counsel, Kevin A. Barr, Vice President, Human Resources,
Ronald M. DeFeo, Chairman, President and Chief Executive Officer,
Joseph F. Apuzzo, Chief Financial Officer
(continued)
were reduced by 50 percent from 1999 levels and company-
wide cost reduction efforts yielded in excess of $10 million
annualized in the second half of the year.
The construction business, which includes our off-highway
trucks, compaction and dumper equipment, set another record
year in terms of sales, operating profit, and market penetration.
Our off-highway truck volumes increased 23 percent as we
continue to successfully expand our presence in Europe, North
America, South Africa, and Indonesia. We are in the process of
upgrading our articulated truck product line, barely two years
after we went through a total redesign, in order to continue to
provide our customers with the lowest cost per ton moved.
The mining business faced a difficult environment in 2000,
with revenues down approximately 30 percent. The continued
weakness in commodity prices has driven the customer base into
postponing new equipment purchases. Despite the lack of new
orders, our mining revenues were up 8 percent compared to
1999, excluding the Coal India order, and we believe we main-
tained our number one market share position for the second year
in a row. During the third quarter of 2000, we finalized plans
to integrate our surface mining truck and hydraulic shovel busi-
nesses. This integration effort will position our mining business
to become more profitable, while improving our customer service.
We had a vision in early 2000 to create an independent
e-commerce company that will change the way business is
conducted in the capital goods industry and will provide new
tools for equipment owners and operators to maximize their
return on investment. In early 2001, this vision became reality.
We named it EarthKing. Our objective is for EarthKing to use
the Internet and available technology to provide real savings to
their customers in the selection, acquisition, management, and
disposition of their equipment and parts. Since EarthKing is
supplier, vendor, and channel-neutral, they can provide a
complete and unbiased solution to their customers’ equipment
and parts needs. We believe that EarthKing is currently the
only e-commerce company with the ability to provide a full menu
of services for equipment throughout the product life cycle.
Looking Ahead
We expect to post another solid performance in 2001, despite
the challenges of the U.S. economy. It is clear to us that the
U.S. economy started to slow down in the second half of 2000
and this situation, which we expect to continue at least through
the first half of this year, has created a real hesitancy from our
customers in terms of capital equipment purchases. The speed
at which the Federal Reserve Board is reacting to the slowdown
in the U.S. economy may bode well for the second half of this
year. We expect the energy producing countries to grow fairly
strongly during 2001, helped by strong energy prices, which
should help us in terms of lifting equipment sales. We also
expect relatively higher commodity prices, which should
strengthen our mining equipment sales, and continued infra-
structure spending worldwide, which should have a positive
impact on our aggregate equipment sales. We will continue to
drive to higher levels of performance by leveraging our internal
strengths and by delivering faster and better value to our cus-
tomers. Regarding our capital structure, we will continue to
focus our efforts on reducing working capital, generating cash,
and paying down additional debt. Our fundamental business
strategy has not changed. We will continue to grow and
strengthen our franchise and create economic value for our
shareholders. Our determination to execute, coupled with an
effective management team and a proven operating model,
should allow us to generate more stable and more predictable
financial performance going forward. Our entire organization
joins me in thanking you for your continuing support.
Sincerely,
Ronald M. DeFeo
Chairman, President and Chief Executive Officer
7
Our fundamental business strategy has
not changed. We will continue to grow
and strengthen our franchise and create
economic value for our shareholders.
Board of Directors:
front row, left to right,
Marvin B. Rosenberg,
G. Chris Andersen,
Back row, left to right,
David A. Sachs,
Ronald M. DeFeo,
Donald P. Jacobs, Not
shown, William H. Fike,
Don DeFosset

profitable growth
BU
ILD
ING
A B
ET
TE
R C
OM
PA
NY
TH
RO
UG
H
8

T E R E X C O R P O R A T I O N
9
T E R E X P RO V I D E S I T S C U S TO M E R S W I T H A
VA LU E P RO P O S I T I O N S E C O N D TO N O N E .
As a result of a multi-year contract between construction giant Enka-Bechtel and the
Republic of Croatia, Cedarapids was awarded approximately a $3 million order for an entire
portable crushing and screening system to be used in the Croatia Motorway project. When
complete, the motorway will feature 74 miles of four-lane segments linking the Croatian
capital of Zagreb with important economic corridors in the region. Specifications for the
project included the ability to readily move the equipment from site to site and the production
of up to six products simultaneously. The relationship between Cedarapids and Enka-Bechtel
stretches back more than a decade to the construction of a 114-mile, four-lane superhighway
connecting the Turkish capital of Ankara and the city of Gerede, located near the Black Sea.
Cedarapids began shipping the order to Croatia in March 2001.
Terex Mining introduced its new 150-ton AC drive truck, the MT3300AC, at MinExpo
in Las Vegas, Nevada, in the fall of 2000. This new truck is materially different from the
traditional standard for off-highway haulage trucks that have either a mechanical or a DC
electric drive train powered by diesel engines developing about 1 horsepower per 350 pounds
of gross vehicle weight. The drive train used on this new truck is an AC electric drive and the
engine, while still a diesel, has more horsepower, with a rating of better than 1 horsepower per
300 pounds of gross vehicle weight. The new system’s major advantage is less maintenance
and, as a result, more uptime. English China Clay (ECC) became our first customer for this
new truck. ECC, a British division of French-based parent IMERYS, is the largest producer
of five North American limestone properties. ECC was interested in upgrading their existing
truck fleet, which included 100-ton trucks from a major competitor. Their objectives were
to upgrade the technology at the quarry, lower their operational cost per ton, and ultimately
double their limestone production from one million to two million tons per year. Thanks to
the support from key suppliers and the total team effort from the Tulsa, Oklahoma, facility,
Terex Mining got their first order for four MT3300AC trucks against two key competitors.
The 150-ton AC drive truck was chosen based on the expected lower maintenance profile of
the AC drive system and its productivity potential as the quarry continues to expand.
Above: The Cedarapids
portable crushing
and screening system
consisting of three
components - a single
impeller, a vertical
shaft impactor and
a horizontal shaft
impactor - is being
used in the Croatia
motorway project.
Below: The newly
introduced, highly
productive MT3300AC
150-ton off-highway
hauler.

quality products
BU
ILD
ING
A B
ET
TE
R C
OM
PA
NY
TH
RO
UG
H
10

T E R E X C O R P O R A T I O N
N E W P RO D U C T I N T RO D U C T I O N A N D Q UA L I T Y P RO D U C T S
R E M A I N K E Y FA C TO R S I N I M P RO V E D M A R K E T P E N E T R AT I O N .
11
The summer of 2000 saw the introduction of the new Terex 70-ton capacity TR70
quarry truck, a model size in which the Company did not participate previously. The TR70
follows the proven Terex rigid truck concept, but incorporates several new features and is
aimed at the quarry market, where trucks are expected to perform around the clock. The
TR70 has a 24-liter, 4-cycle, 12-cylinder turbocharged and aftercooled Detroit Diesel
engine, very conservatively rated at 760 horsepower. This engine has been designed for low
maintenance and low fuel consumption and has a mean time to major overhaul of 20,000
hours. The low maintenance cost and a load over height which is five inches lower than
the main competition provides this truck with a major advantage in the marketplace.
Powerscreen, based in Dungannon, Northern Ireland, was acquired by Terex in the
summer of 1999 and has been introducing some of the most innovative and popular models
in today’s crushing and screening markets. During the spring of 2000, Powerscreen intro-
duced the brand new Turbo Chieftain 1400 at Intermat in Paris, France. Mounted on a
heavy-duty crawler undercarriage and with hydraulically folding conveyors, the Turbo Chieftain
1400 is easily transportable, highly maneuverable on site, and designed for high volume
processing and stockpiling of aggregates, overburden, coal, crushed stone, and demolition
debris up to 500 tons per hour. With set-up time of 15 minutes and the ability to be reduced
to a compact size for road travel, the machine has been gaining market share since its introduction.
The acquisition of Terexlift, formerly Italmacchine, in the fall of 1998 brought to Terex a
solid manufacturer of telescopic material handlers for construction and agricultural applica-
tions. The cost and performance advantage of this product line manufactured near Perugia,
Italy, provided Terex with the opportunity to introduce a popular 5,100 pounds lifting capac-
ity, rough terrain unit to the United States. The TX51-19 is a compact and versatile machine
that is easily transportable. The unit’s ability to operate in many diverse work environments
such as drywall, masonry, landscape, and general contracting activities has made this unit very
popular in the U.S. since its introduction in early 2000. Terex Lifting is finding many new
applications for this unit mainly because it is larger than a skid steer loader, but smaller than
most average telescopic handlers.
Above: The Powerscreen
Turbo Chieftain 1400
provides three-way
separation and stockpiling
of material.
Below: The TX51-19
telescopic material
handler has 5,100
pounds of lifting capacity,
19 feet of reach and
weighs only 9,500
pounds, making it a
versatile and easily
transportable machine.

customer satisfaction
BU
ILD
ING
A B
ET
TE
R C
OM
PA
NY
TH
RO
UG
H
12

T E R E X C O R P O R A T I O N
A D E L I G H T E D C U S TO M E R A LWAY S R E T U R N S
W I T H R E P E AT B U S I N E S S .
13
In early 2000, Terex Lifting initiated a new aftermarket program, Support-Plus, designed
to provide faster and better service to its customers. The objective of Support-Plus is to strate-
gically locate field service technicians throughout North America and Europe to provide
on-site technical assistance to any customer of Terex Lifting. These technicians are equipped
with vans that have CD-ROMs for parts, service, and maintenance material, fax-capable
mobile phones, vehicle locator systems, and global positioning systems that provide voice
turn-by-turn directions to assist them in getting to the customers as quickly as possible.
Mr. Tony Sacco, Director of Product and Service Assurance at Maxim Crane Works said,
“Terex is now the most responsive company in the industry. Support-Plus is a very innovative
program that has significantly improved Terex’s aftermarket support.”
With sales in excess of $800 million, Joannou & Paraskevaides (J&P) based in Athens,
Greece, is ranked among the top 40 international contractors worldwide. J&P has been a
customer of Terex Italia, based near Bologna, Italy, for the past five years and has purchased
25 hydraulic mobile cranes since 1996. During 2000, J&P ordered six cranes. Two of these
particular units were initially used for the construction of a new polypropylene plant in
Salonica, Greece. Mr. Costas Timotheou of J&P stated, “Both units were delivered within
a week after they were ordered, and the machines were commissioned and the operators
trained in record time. Both units are performing very well, and we continue to be very
satisfied with the level of aftermarket support we receive from Terex.”
A Cedarapids customer based in Minneapolis, Minnesota, who previously contracted
out his crushing and screening work, chose to enter this field through the purchase of both
a jaw primary plant and a portable MVP 380 Rollercone crusher system as part of his
recycling operation. This portable closed circuit, dual crusher operation is being used to
recycle concrete for the expansion of the Minneapolis-St. Paul airport. The equipment
owner, Mr. Frank Frattalone, has found the Cedarapids system to be extremely forgiving, and
it has enabled the recycling operation at the airport to achieve tonnage rates unmatched by
competitive systems. Mr. Frattalone commented, “I looked at a lot of different crushers
before we bought this system. It is very productive and the Cedarapids dealer has been very
helpful. We really like the Cedarapids products because they are state-of-the-art.”
Above: The red Terex
van, a symbol of the new
Support-Plus aftermarket
program initiated in 2000.
Below: The combination
of a Cedarapids primary
plant with a Rollercone
crusher provides a high
capacity, low maintenance
recycling system.
brand recognition
BU
ILD
ING
A B
ET
TE
R C
OM
PA
NY
TH
RO
UG
H
14

T E R E X C O R P O R A T I O N
I N C R E A S E D P RO D U C T I V I T Y A N D T H E H I G H E S T R E T U R N
O N I N V E S T E D C A P I TA L A R E T H E H A L L M A R K S O F T E R E X P RO D U C T S .
15
For the past seven years, rigid trucks built in Motherwell, Scotland, have played a critical
role in fulfilling the international demand for some of the world’s lowest sulfur coal located
in the Pasir coal mine in Kalimantan, Indonesia, with annual production set to reach ten
million tons in 2001. The first order of Terex off-highway trucks, twenty-three 55-ton capacity
trucks, went into operation at Pasir in 1993, and, by now, each truck has logged between
27,000 and 33,000 operating hours. Another twenty-three 85-ton and 100-ton trucks
followed that order between 1998 and 2000. Due to the exceptional performance of these
trucks, the customer recently ordered eight newly redesigned 100-ton capacity trucks for its
fleet. Annual output at the Pasir coalfield is expected to increase to 12 million tons by the
end of 2002, aided in no small way by the reliability and performance of the Terex fleet.
In the spring of 1999, Terex Mining entered into a multi-year $100 million supply con-
tract agreement with one of the world’s leading international mining groups for the delivery
of 205-ton and 260-ton rear dump surface mining trucks. During the second half of 1999
alone, Unit Rig received a $46 million order under that agreement for the customer’s biggest
mine, located in Boron, California. The record productivity of these machines, coupled
with one of the lowest maintenance profiles in the industry, led to another multi-year supply
contract in the second half of 2000 with the same customer for the sale of Terex Mining’s
hydraulic mining shovels. The world’s largest mining companies are increasingly recognizing
the value proposition being delivered by Terex’s package of surface mining trucks and
hydraulic shovels.
For the past 56 years, Telelect, based in Watertown, South Dakota, has been manufacturing
world-class digger derricks and Hi-Ranger articulated aerial devices for their customers. Digger
derricks are used to set telephone poles, while articulated aerial devices are used to elevate
construction personnel to work areas at the top of utility poles or in trees. Since 1996,
Telelect has developed a growing business with the world’s largest tree-trimming company.
The relationship began with the first order of 100 units in 1996, and since that time, the
customer has been delighted with the performance of the machines. Because of the reliability
and excellent maneuverability of these machines, they have taken delivery of 2,200 units
over the past four years, making Telelect their primary supplier.
Above: The TR100, a
100-ton, rigid, off-high-
way truck is being used to
mine coal in Indonesia.
Below: The Telelect
digger derrick has sheave
heights exceeding 95 feet
and lifting capacities up
to 48,000 pounds.
organizational effectiveness
BU
ILD
ING
A B
ET
TE
R C
OM
PA
NY
TH
RO
UG
H
16

T E R E X C O R P O R A T I O N
T H E T E R E X M OT TO " FA S T E R A N D B E T T E R " I S R E A L I Z E D
T H RO U G H A B U S I N E S S M O D E L O F O U T S O U RC I N G A N D LOW O V E R H E A D .
17
Terex is proud of its ability to operate a very lean and cost-effective organization.
Over the past six years, we have managed to reduce our operating expenses as a percentage
of revenues from 11.5% to 7.8%. This level of operating expenses compares very favorably
with the rest of the capital goods industry and requires a continuing effort to streamline the
organization and to eliminate non value-added functions throughout the Company.
During the third quarter of 2000, the Company finalized plans to integrate its surface
mining truck and hydraulic shovel businesses. The integration of these businesses, which
should generate savings in excess of $6 million, strengthens its sales and marketing effective-
ness with the customer base, creates an improved and more uniform manufacturing model,
and better utilizes key aftermarket service and support, purchasing and financial resources.
Terex’s parts distribution center in Southaven, Mississippi, has been upgrading its
computer system in order to deliver better service to its customers. The center has reduced
cycle times for expediting purchase orders by using automatic e-mails. Automatic e-mails are
being sent to vendors requesting best delivery dates on open purchase orders as soon as an
item becomes backordered. This has increased productivity and reduced handling costs.
Parts are now also being set-up to order automatically upon customer order entry. Purchase
orders are system-generated and e-mailed directly to the vendor without human intervention
and are placed within 15 minutes of order entry, making same day shipment of non-stock
items possible. This system is being used to expand non-stock item sales and significantly
reduce inventory at the distribution center.
In the fall of 2000, Terex Lifting implemented a new program designed to reduce
warranty claim costs and improve the quality of its 2-axle rough terrain hydraulic mobile
cranes as part of the ongoing effort to improve the cost-effectiveness of their operation. The
objective of this program is to hold suppliers responsible for the costs incurred by Terex as
a result of quality problems encountered during the warranty period and to induce process
improvement and redesign at the supplier level. Over the past six months under this
program, total warranty costs have declined 30 percent due to supplier participation and
the performance of the supplier base has increased markedly.
Above: The powerful
combination of a Unit
Rig surface mining
truck teamed with an
O&K 800-ton hydraulic
excavator is the most
productive package in
the mining industry.
Below: The RT555 rough
terrain hydraulic mobile
crane, manufactured
in Waverly, Iowa, has
a maximum lifting
capacity of 55 tons and
a maximum tip height
of 170 feet.
18
Terex Corporation
Board of Directors
Ronald M. DeFeoChairman of the Board
G. Chris AndersenPartner, Andersen, Weinroth andCo., L.P.
Don DeFossetPresident and Chief OperatingOfficer, Walter Industries, Inc.
William H. FikePresident, Fike & Associates
Dr. Donald P. JacobsDean, J.L. Kellogg GraduateSchool of Management,Northwestern University
Marvin B. RosenbergSenior Vice President and GeneralCounsel, Terex (retired)
David A. SachsManaging Director, AresManagement, L.P.
Corporate Officers
Joseph F. ApuzzoChief Financial Officer
Kevin A. BarrVice President, Human Resources
Eric I CohenSenior Vice President, Secretary and General Counsel
Ronald M. DeFeoChairman, President and Chief Executive Officer
Brian J. HenryVice President, Finance, BusinessDevelopment
Jack LascarVice President, Investor Relationsand Corporate Communications
Kevin M. O'ReillyController
Susan K. SutherlandTreasurer
Transfer Agent and RegistrarAmerican Stock Transfer & Trust Company 40 Wall Street, 46th FloorNew York, New York 10005(800) 937-5449 or(212) 936-5100
Shareholders seeking information concerning stock transfers, change ofaddresses and lost certificatesshould contact the Company'sstock transfer agent directly.American Stock Transfer & TrustCompany may also be contacted atwww.amstock.com.
Stock InformationStock Symbol: TEX
Stock Exchange: New York StockExchange
The high and low quarterly salesprices for the past two years ofTerex Corporation are as follows:
Q1 Q2 Q3 Q4
2000High 287/8 171/4 191/2 173/16
Low 111/8 123/8 12 119/16
1999High 281/2 351/2 317/8 311/2
Low 221/8 231/4 241/4 2413/16
Annual Report/Form 10-KAdditional copies of the Annual Report/Form 10-K are available from Terex corporate headquarters by calling (203) 222-5942.
Annual MeetingThe Annual Meeting of Shareholderswill be held at 10:00 a.m. (EasternTime) on Tuesday, May 15, 2001at Terex Corporation, 500 PostRoad East, Suite 320, Westport,Connecticut.
Corporate Headquarters
Terex Corporation500 Post Road East, Suite 320Westport, Connecticut 06880 Telephone: (203) 222-7170Fax: (203) 222-7976Website: www.terex.com
EarthKing, Inc.500 Post Road East, Suite 240Westport, Connecticut 06880Telephone: (203) 222-6100Fax: (203) 226-7100Website: www.earthking.com
Business Operations
Terex LiftingFil Filipov, President
Terex Lifting North AmericaBaraga, Michigan, USAConway, South Carolina, USAHuron, South Dakota, USAOlathe, Kansas, USAWatertown, South Dakota, USAWaverly, Iowa, USAWilmington, North Carolina, USA
Terex Lifting EuropeCork, IrelandCrespellano, ItalyFontanafredda, ItalyHoorn, The NetherlandsMontceau-les-Mines, FrancePerugia, ItalyTetbury, EnglandTrier, Germany
Terex Lifting AustraliaBrisbane, Australia
Terex EarthmovingErnest R. Verebelyi, President
Terex Construction/TerexPowerscreenColin Robertson, ManagingDirector
Benford LimitedWarwick, England
Fermec Manufacturing LimitedManchester, England
North Hauler LLC (Joint Venture)Baotou, Inner Mongolia, People'sRepublic of China
Terex Americas (North and South America) Tulsa, Oklahoma, USA
Terex Equipment LimitedMotherwell, Scotland
Terex U.K. Ltd. (U.K. Distributor)Watford Village, England
Terex PowerscreenB.L. PegsonCoalville, England
Finlay Hydrascreens LimitedOmagh, Northern Ireland
Powerscreen InternationalDungannon, Northern Ireland
Powerscreen LimitedKilbeggan, Ireland
Re-Tech and Royer Industries Lebanon, Pennsylvania, USA
Simplicity EngineeringDurand, Michigan, USA
Terex Mining InternationalPeter Rall, Managing Director
O & K MiningDortmund, Germany
Terex Mining AmericasBrian King, President
Payhauler Corp.Tulsa, Oklahoma, USA
Unit Rig DivisionTulsa, Oklahoma, USA
CedarapidsKerry O’Sullivan, General Manager
CedarapidsCedar Rapids, Iowa, USA
Canica-JaquesVancouver, Washington, USA
JaquesMelbourne, Australia
Standard HavensGlasgow, Missouri, USA
Terex Light Construction/Terex Worldwide PartsDistribution CenterMurray Scott, Vice President and General Manager
Amida IndustriesRock Hill, South Carolina, USA
Coleman EngineeringHolly Springs, Mississippi, USA
Terex Bartell Ltd.Brampton, Ontario, Canada
Terex Worldwide PartsDistribution CenterSouthaven, Mississippi, USA
Terex Employees Worldwide6,150 Full-time
S H A R E H O L D E R I N F O R M A T I O N

v i s i t o u r w e b s i t e : w w w . t e r e x . c o m
Corporate Divisions ProductsCompany Overview
Contact Us
Human Resources
Investor Relations
Over 50 Products
Listed by Division
Terex Distribution
Terex Earthmoving
Terex Financial
Terex Lifting
Terex Light Construction
Desig
ned
by: O
lsen
Graf
ix Gr
oup
Inc
NY P
rinte
d by
: San
dy A
lexa
nder
NJ
This Annual Report contains forward-looking information based on Terex's current expectations. Because forward-looking statements involve risks and uncertainties, actual results
could differ materially. For a more detailed description of such risks and uncertainties, see Terex's Annual Report on Form 10-K, included with this Annual Report, under the
heading "Management's Discussion and Analysis of Financial Condition and Results of Operations – Forward Looking Information." The forward-looking statements contained
herein speak only as of the date of this Annual Report. Terex expressly disclaims any obligation or undertaking to update or revise any forward-looking statement contained in this
Annual Report to reflect any change in its expectations.

Benford Limited B.L. Pegson Canica-Jaques CedarapidManufacturing Limited Finlay Hydrascreens LimitedLimited Re-Tech Royer Industries Simplicity EngineeAustralia Holland Lift Terexlift Terex Lifting UK PeiItalia Terex Lifting Conway Operations Terex LiftingColeman EngineerinG Benford Limited B.L. Pegson CaPayhauler Fermec Manufacturing Limited Finlay HydInternational Powerscreen Limited Re-Tech Royer InCrane Comedil Terex Lifting Australia Holland Lift Limited Terex Handlers Terex Italia Terex Lifting CoIndustries Bartell Industries Coleman EngineerinG Equipment Limited Unit Rig Payhauler Fermec ManufPowerscreen International Powerscreen Limited ReAmerican Crane Comedil Terex Lifting Australia HolAerials Limited Terex Handlers Terex Italia Terex LiftRO Amida Industries Bartell Industries Coleman EngTerex Equipment Limited Unit Rig Payhauler Fermec Mining Powerscreen International Powerscreen LiHavens American Crane Comedil Terex Lifting AustrTelelect Terex Aerials Limited Terex Handlers Terex
T E R E X C O R P O R A T I O N
5 0 0 P O S T R O A D E A S T , S U I T E 3 2 0
W E S T P O R T , C T 0 6 8 8 0
( 2 0 3 ) 2 2 2 - 7 1 7 0
W W W . T E R E X . C O M

UNITED STATES SECURITIES AND EXCHANGE COMMISSION
Washington, DC 20549
FORM 10-K
(Mark One)
ANNUAL REPORT PURSUANT TO SECTION 13 OR 15(d) ⌧ OF THE SECURITIES EXCHANGE ACT OF 1934
For the Fiscal Year Ended December 31, 2000
or
TRANSITION REPORT PURSUANT TO SECTION 13 OR 15 (d) o OF THE SECURITIES EXCHANGE ACT OF 1934 For the transition period from __________ to __________.
Commission File Number 1-10702
TEREX CORPORATION (Exact Name of Registrant as Specified in Charter)
Delaware 34-1531521 (State of incorporation) (I.R.S. Employer Identification No.) 500 Post Road East, Suite 320, Westport, Connecticut 06880 (Address of principal executive offices) (Zip Code) Registrant's Telephone Number, including area code: (203) 222-7170
Securities registered pursuant to Section 12(b) of the Act:
Common Stock, $.01 par value (Title of Class)
New York Stock Exchange
(Name of Exchange on which Registered)
Securities registered pursuant to Section 12(g) of the Act: None Indicate by check mark whether the Registrant (1) has filed all reports required to be filed by Section 13 or 15(d) of the Securities Exchange Act of 1934 during the preceding 12 months and (2) has been subject to such filing requirements for the past 90 days. YES X NO____
Indicate by check mark if disclosure of delinquent filers pursuant to Item 405 of Regulation S-K is not contained herein, and will not be contained, to the best of registrant's knowledge, in definitive proxy or information statements incorporated by reference in Part III of this Form 10-K or any amendment to this Form 10-K. ⌧
The aggregate market value of the voting and non-voting common equity stock held by non-affiliates of the Registrant was approximately $496.4 million based on the last sale price on March 13, 2001.
The number of shares of the Registrant's Common Stock outstanding was 26,810,105 as of March 13, 2001.
DOCUMENTS INCORPORATED BY REFERENCE: Portions of the Terex Corporation Proxy Statement to be filed with the Securities and Exchange Commission
within 120 days after the year covered by this Form 10-K with respect to the 2001 Annual Meeting of Stockholders are incorporated by reference into Part III hereof.

- 2 -
TEREX CORPORATION AND SUBSIDIARIES Index to Annual Report on Form 10-K For the Year Ended December 31, 2000
Page
PART I
Item 1 Business........................................................................................................................................................................ 3 Item 2 Properties ...................................................................................................................................................................... 17 Item 3 Legal Proceedings ....................................................................................................................................................... 19 Item 4 Submission of Matters to a Vote of Security Holders ........................................................................................... 19
PART II
Item 5 Market for Registrant's Common Stock and Related Stockholder Matters ........................................................ 19 Item 6 Selected Financial Data............................................................................................................................................... 20 Item 7 Management's Discussion and Analysis of Financial Condition and Results of Operations......................... 21 Item 7A Quantitative and Qualitative Disclosure about Market Risk................................................................................ 28 Item 8 Financial Statements and Supplementary Data....................................................................................................... 29 Item 9 Changes in and Disagreements with Accountants on Accounting and Financial Disclosures ..................... 30
PART III
Item 10 Directors and Executive Officers of the Registrant ................................................................................................ * Item 11 Executive Compensation ............................................................................................................................................ * Item 12 Security Ownership of Certain Beneficial Owners and Management.................................................................. * Item 13 Certain Relationships and Related Transactions.................................................................................................... *
PART IV Item 14 Exhibits, Financial Statement Schedules and Reports on Form 8-K .................................................................... 30 * Incorporated by reference from Terex Corporation Proxy Statement to be filed with the Securities and Exchange Commission with respect to the 2001 Annual Meeting of Stockholders.

- 3 -
As used in this Annual Report on Form 10-K, unless otherwise indicated, Terex Corporation, together with its consolidated subsidiaries, is hereinafter referred to as "Terex," the "Registrant," or the "Company."
PART I ITEM 1. BUSINESS General Terex is a diversified global manufacturer of a broad range of equipment for the construction, infrastructure and mining industries. The Company strives to build a growing franchise under the Terex brand name. The Company remains focused on its mission of delivering products that are reliable, productive and cost-effective, and of producing equipment that improves our customers’ return on invested capital. The Company primarily organizes itself into two business segments, Terex Lifting and Terex Earthmoving. The Company's products are manufactured at 39 plants in the United States, Europe, Australia and Asia, and are sold primarily through a worldwide distribution network with over 1,000 locations to the global construction, infrastructure and surface mining markets. Over the past several years, the Company has implemented a series of interrelated operational and strategic initiatives designed to create a competitive advantage in the marketplace. These include (i) increasing the variable portion of its manufacturing costs to over 80% of total costs; (ii) reducing operating expenses as a percentage of revenues substantially below the industry’s average and eliminating non value-added functions throughout the organization; (iii) providing our customers with a cost-effective product line; and (iv) diversifying the Company’s product line in order to maximize financial performance. For financial information about the Company's industry and geographic segments, see Note O --- "Business Segment Information" in the Notes to the Consolidated Financial Statements and "Management's Discussion and Analysis of Financial Condition and Results of Operations." Terex Lifting Terex Lifting manufactures and sells telescopic mobile cranes (including rough terrain, truck and all terrain mobile cranes), tower cranes, lattice boom cranes, utility aerial devices (including digger derricks and articulated aerial devices), telescopic material handlers (including container stackers and rough terrain), truck mounted cranes (boom trucks), aerial work platforms (including scissor, articulated boom and straight telescoping boom aerial work platforms)and related components and replacement parts. Construction and industrial customers, as well as utility companies, are the primary users of these products. Customers use these products to lift equipment, material or workers to various heights. Throughout the world market, mobile cranes are principally sold to rental companies and dealers with rental fleets. Terex Lifting's mobile crane market share varies by geographical area; however, the Company believes it is the leading manufacturer of mobile cranes in France, Italy and Spain and is the second largest manufacturer in the United States (and the Company believes it is the largest manufacturer of commercial hydraulic mobile cranes in the United States). The Company also believes that it is the second largest manufacturer in the United States of utility aerial devices and the third largest manufacturer of tower cranes worldwide. Terex Lifting has 15 significant manufacturing operations: (i) PPM S.A.S. located in Montceau-les-Mines, France, at which mobile cranes and container stackers under the brand names TEREX and PPM are manufactured; (ii) Terex Italia S.r.l., located in Crespellano, Italy, at which mobile cranes are manufactured under the TEREX, BENDINI and PPM brand names; (iii) PPM Cranes, Inc. (also known as Terex Cranes – Conway Operations), located in Conway, South Carolina, at which rough terrain hydraulic telescoping mobile cranes and truck cranes are manufactured under the P&H (a licensed trademark of Harnischfeger Corporation) and TEREX brand names; (iv) Terex Lifting - Waverly Operations (also known as Koehring Cranes, Inc.), located in Waverly, Iowa, at which rough terrain hydraulic telescoping mobile cranes and truck cranes are manufactured under the brand names TEREX and LORAIN, and aerial lift equipment is manufactured under the brand names TEREX AERIALS and TEREX; (v) Terex-Telelect, Inc. ("Telelect"), located in Watertown, South Dakota, at which utility aerial devices and digger derricks are manufactured under the TELELECT and HI-RANGER brand names; (vi) Terex Aerials Limited, located in Cork, Ireland, at which aerial platforms are manufactured under the TEREX brand name; (vii) Terex-RO Corporation ("Terex RO"), located in Olathe, Kansas, at which truck mounted cranes are manufactured under the RO-STINGER brand name; (viii) Terex Handlers, located in Baraga, Michigan, at which rough terrain telescopic boom material handlers are manufactured under the SQUARE SHOOTER and TEREX brand names; (ix) Holland Lift International B.V. (“Holland Lift”), located in Hoorn, The Netherlands, at which aerial platforms are manufactured under the HOLLAND LIFT brand name; (x) The American Crane Corporation ("American Crane") located in Wilmington, North Carolina, at which lattice boom cranes are manufactured under

- 4 -
the AMERICAN brand name; (xi) Terexlift S.r.l. ("Terexlift"), located near Perugia, Italy, at which rough terrain telescopic material handlers are manufactured under the ITALMACCHINE and TEREX brand names and cement mixers and concrete pumps are manufactured under the ITALMACCHINE brand name; (xii) Terex Peiner GmbH ("Peiner"), located in Trier, Germany, at which tower cranes are manufactured under the PEINER trade name; (xiii) Gru Comedil S.p.A. ("Comedil"), located in Fontanafredda, Italy, at which tower cranes are manufactured under the COMEDIL trade name; (xiv) Terex Lifting U.K. Limited ("Terex Lifting U.K."), located in Tetbury, England, at which material handlers are manufactured under the MATBRO trade name; and (xv) Terex Lifting Australia Pty. Ltd. ("Terex Lifting Australia"), located in Brisbane, Australia, at which all terrain mobile cranes are manufactured under the FRANNA trade name. The Company has been actively involved in both acquiring and disposing of operations with the Terex Lifting segment. In July 1999, as part of the acquisition of Powerscreen International plc, the Company acquired the material handling operations of Matbro Limited (now Terex Lifting U.K.) and Moffett Engineering Limited (“Moffett”). Moffett, located in Dundalk, Ireland, manufactures truck-mounted forklifts. On November 3, 1999, the Company completed the acquisition of the Material Handling Division of Teledyne, Inc., which included substantially all of the assets comprising the Princeton business and all of the capital stock of Teledyne GmbH, the owner of Kooi B.V. (collectively, “Princeton/Kooi”). Princeton/Kooi manufacture and market truck-mounted forklifts at facilities in Canal Winchester, Ohio and Vrouwenparochie, The Netherlands. On December 1, 1999, the Company comp leted the purchase of Terex Lifting Australia, formerly known as Franna Cranes Pty. Ltd., a manufacturer of all-terrain “pick and carry” cranes in Australia. See Note B – “Acquisitions” in the Notes to the Consolidated Financial Statements for further information. On September 30, 2000, the Company completed the sale of its truck-mounted forklift businesses, consisting of Moffett and Princeton/Kooi, to various subsidiaries of Partek Corporation of Finland for $144 million in cash, subject to adjustment. See Note C – “Sale of Businesses” in the Notes to the Consolidated Financial Statements for further information. Terex Earthmoving Terex Earthmoving manufactures and sells large hydraulic excavators, loader backhoes, articulated and rigid off-highway trucks, high capacity surface mining trucks, scrapers, crushing and screening equipment, asphalt pavers, asphalt mixing plants, and related components and replacement parts. These products are used primarily by construction, mining, quarrying and government customers. The Company believes that it has the leading market share for large hydraulic excavator models having machine weights in excess of 200 tons, that it is a significant competitor in the market for large capacity off highway haulers and scrapers and that it had the leading market share in high capacity surface mining trucks since 1999. Terex Earthmoving has 16 significant manufacturing operations: (i) Terex Equipment Limited ("TEL"), located in Motherwell, Scotland; (ii) Unit Rig ("Unit Rig") and Payhauler Corp. ("Payhauler"), located in Tulsa, Oklahoma; (iii) O&K Mining GmbH (“O&K Mining”), located in Dortmund, Germany; (iv) Powerscreen International Distribution Ltd. (“Powerscreen”), located in Dungannon, Northern Ireland and Kilbeggan, Ireland; (v) Finlay Hydrascreens (Omagh) Limited ("Finlay"), located in Omagh, Ireland; (vi) BL-Pegson Ltd. ("B.L. Pegson"), located in Coalville, England; (vii) Simplicity Engineering ("Simplicity"), located in Durand, Michigan; (viii) Royer Industries, Inc. and Re-Tech (collectively “Royer/Re-Tech”), located in Lebanon, Pennsylvania; (ix) Benford Limited ("Benford"), located in Warwick, England; (x) Cedarapids, Inc. (“Cedarapids”) located in Cedar Rapids, Iowa; (xi) Standard Havens, Inc. ("Standard Havens"), located in Glasgow, Missouri; (xii) Jaques International (“Jaques”), located in Melbourne, Australia; (xiii) Canica-Jaques, located in Vancouver, Washington; (xiv) Jaques International Sdn Bhd (“Jaques Malaysia”), located in Subang Jaya, Malaysia; (xv) Jaques (Thailand) Limited (“Jaques Thailand”), located in Chomburi, Thailand; and (xvi) Fermec Manufacturing Limited (“Fermec”) located in Manchester, England. TEL manufactures, sells and markets off-highway rigid haulers and articulated haulers, having capacities ranging from 25 to 100 tons, and scrapers that load, move and unload large quantities of soil for site preparations, including roadbeds. TEL's products are sold under the Company's TEREX brand name. Unit Rig and Payhauler manufacture, sell and market electric rear hauler trucks with payload capacities ranging from 50 to 360 tons and bottom dump haulers with capacities ranging from 180 to 270 tons, principally sold to copper, gold, iron ore, coal, borates and diamond mining industry customers, as well as all wheel drive rigid off-highway trucks. O&K Mining manufactures and sells large hydraulic mining shovels. Cedarapids, Finlay, Powerscreen, B.L. Pegson, Simplicity, Royer/Re-Tech, Jaques, Jaques Malaysia, Jaques Thailand and Canica-Jaques manufacture, sell and market crushing and screening equipment. Cedarapids also manufactures, sells and markets a line of asphalt pavers and associated equipment. Standard Havens manufactures, sells and markets asphalt plants. Benford manufactures, sells and markets dumpers and compactors. Fermec manufactures, sells and markets loader backhoes. These products are sold under the Company's TEREX, UNIT RIG, LECTRA HAUL, O&K, PAYHAULER, POWERSCREEN, FINLAY, SIMPLICITY, CEDARAPIDS, BENFORD, B.L. PEGSON, ROYER, RE-TECH, CEDARAPIDS/STANDARD HAVENS, JAQUES, CANICA-JAQUES and FERMEC brand names. TEL's North, Central and South American sales and distribution are managed

- 5 -
by Terex Americas, a division of the Company, located in Tulsa, Oklahoma. In addition, Terex Earthmoving has an interest in North Hauler Limited Liability Company (“North Hauler Limited”), a corporation incorporated under the laws of China, a joint venture with Second Inner Mongolia Machinery Company for the production of haulers in China. North Hauler Limited manufactures and sells heavy trucks, principally used in mining, at a facility in Baotou, Inner Mongolia, and the People’s Republic of China. The Company has made a number of significant acquisitions in the Terex Earthmoving segment in recent years as part of its continuing plan to diversify its product offerings and the geographic range of its customers. In January 2001, the Company acquired Jaques, Canica-Jaques, Jaques Malaysia and Jaques Thailand (collectively, the “Jaques Group”), manufacturers of crushing equipment in Australia, Asia and North America. On December 28, 2000, the Company acquired Fermec from CNH Global N.V., adding the loader backhoe product line to Terex Earthmoving’s offerings. The Company entered the aggregates industry with its acquisitions of Powerscreen International plc in July 1999 for a purchase price of approximately $294 million and Cedarapids on August 26, 1999 for approximately $170 million, subject to adjustment. The acquisitions of Powerscreen International plc and Cedarapids provided the Company with a significant market position in the crushing and screening equipment markets. On March 31, 1998, the Company acquired O&K Mining from O&K Orenstein & Koppel AG for net aggregate consideration of approximately $168 million, subject to adjustment. See Note B – “Acquisitions” in the Notes to the Consolidated Financial Statements for further information. Other Terex Light Construction manufactures and sells mobile and portable floodlighting systems, concrete power trowels, concrete placement systems, concrete finishing systems, concrete mixers, generators, traffic control products, and related components and replacement parts. These products are typically used for rental and construction applications. Terex Light Construction has three significant manufacturing operations: (i) Amida Industries, Inc. (“Amida”), located in Rock Hill, South Carolina, which manufactures and sells portable floodlighting systems, concrete power trowels, concrete placement systems, concrete finishing systems, concrete mixers and traffic control products under the AMIDA, BARTELL, MORRISON, BENFORD, MULLER and TEREX brand names; (ii) Terex Bartell, Ltd. (“Bartell”), located in Brampton, Ontario, Canada, which manufactures and sells concrete power trowels and concrete finishing systems under the BARTELL brand name and (iii) Coleman Engineering, Inc. (“Coleman”) located in Holly Springs, Mississippi, which manufactures and sells portable floodlighting systems and generators under the COLEMAN ENGINEERING brand name. Terex Light Construction also distributes products in North America that are manufactured in the Benford facility in Warwick, England, including dumpers and compaction equipment. These products are sold under the Company’s AMIDA, BENFORD, and TEREX brand names. Terex Light Construction is structured to capitalize on the rental segment of the construction equipment industry. The Company's strategy is to expand its product offerings to the national rental companies, while maintaining its business with independent rental stores. The Company's consolidation efforts are intended to create value for customers through the synergies of the Company's sales force and elimination of costly distribution steps, such as manufacturer’s representatives, thus lowering the cost of the Company's products to its customers. The light equipment concept originated in April 1999 with the acquisition of Amida. The Terex Light Construction product line was broadened by the addition of the Benford line of comp action equipment as part of the July 1999 acquisition of Powerscreen, the acquisition of Bartell in September 1999, the acquisition of the Muller Mixer product line in February 2000 and the acquisition of Coleman in October 2000. See Note B – “Acquisitions” in the Notes to the Consolidated Financial Statements for further information. In January 2001, the Company announced the launching of an Internet site by its subsidiary EarthKing, Inc. (“Earthking”). In 2001, EarthKing is introducing its e-commerce capabilities as an independent and unbiased Internet marketplace for the construction and mining equipment industry. EarthKing’s goal is to use the Internet and technology to provide savings to users of construction and mining equipment in the selection, acquisition, management and disposition of their equipment and parts. EarthKing has developed agreements with several strategic partners to participate within the EarthKing alliance to provide reliable delivery of cost-effective services to its customers.

- 6 -
Products Telescopic Mobile Cranes Telescopic mobile cranes are used primarily for industrial applications, in commercial and public works construction and in maintenance applications, to lift equipment or material to heights in excess of 50 feet. Terex Lifting manufactures the following types of telescopic mobile cranes:
Rough Terrain Cranes -- are designed to lift materials and equipment on rough or uneven terrain. Rough terrain cranes are most often located on a single construction or work site such as a building site, a highway or a utility project for long periods of time. Rough terrain cranes cannot be driven on highways and accordingly must be transported by truck to the work site. Rough terrain cranes manufactured by Terex Lifting have maximum lifting capacities of up to 100 tons and maximum tip heights of up to 225 feet. Terex Lifting manufactures its rough terrain cranes at its facilities located at Waverly, Iowa, Conway, South Carolina and Crespellano, Italy under the brand names TEREX, LORAIN, P&H, PPM and BENDINI.
Truck Cranes -- have two cabs and can travel rapidly from job site to job site at highway speeds. In contrast to rough terrain cranes, which are often located for extended periods at a single work site, truck cranes are often used for multiple local jobs, primarily in urban or suburban areas. Truck cranes manufactured by Terex Lifting have maximum lifting capacities of up to 75 tons and maximum tip heights of up to 193 feet. Terex Lifting manufactures truck cranes at its Waverly, Iowa and Conway, South Carolina facilities under the brand names TEREX, P&H and LORAIN.
All Terrain Cranes -- were developed in Europe as a cross between rough terrain and truck cranes in that they are designed to travel across both rough terrain and highways. All terrain cranes have two cabs and are versatile and highly maneuverable. All terrain cranes manufactured by Terex Lifting have lifting capacities of up to 130 tons and maximum tip heights of up to 246 feet. Terex Lifting manufactures its all terrain cranes at its Montceau-les-Mines, France and Brisbane, Australia facilities under the brand names TEREX, PPM and FRANNA.
Tower Cranes Tower cranes lift construction material to heights and place the material at the point where it is being used. They include a stationary vertical tower near the top of which is a horizontal jib with a counterweight. On the jib is a trolley through which runs a load carrying cable and which moves the load along the jib length. On larger cranes, the operator is located above the work site where the tower and jib meet, providing superior visibility. The jib also rotates 360 degrees, creating a large working area equal to twice the jib length. Luffing jib tower cranes have an angled jib with no trolley, and operate like a traditional lattice boom crane mounted on a tower. Luffing jib tower cranes are often used in urban areas where space is constrained. Tower cranes are currently produced by Terex under the PEINER, COMEDIL and TEREX brand names. Terex produces the following types of tower cranes:
Self-Erecting Tower Cranes -- are trailer mounted and unfold from four sections (two for the tower and two for the jib); certain larger models have a telescopic tower and folding jib. These cranes can be assembled on site in a few hours. Applications include residential and small commercial construction. Crane heights range from 50-75 feet and jib lengths from 60-100 feet.
Hammerhead Tower Cranes -- have a tower and a horizontal jib assembled from sections. The tower extends above the jib to which suspension cables supporting the jib are attached. These cranes are assembled on-site in one to three days depending on height, and can increase in height with the project; they have a maximum free-standing height of 200 feet and a maximum jib length of 240 feet.

- 7 -
Flat Top Tower Cranes -- have a tower and a horizontal jib assembled from sections. There is no tower extension above the jib, which reduces cost and facilitates assembly; the jib is self-supporting and consists of reinforced jib sections. These cranes are assembled on site in one to two days, and can increase in height with the project; they have a maximum freestanding height of 305 feet and a maximum jib length of 280 feet.
Luffing Jib Tower Cranes -- have a tower and an angled jib assembled from sections. The tower extends above the jib to which suspension cables supporting the jib are attached. Unlike other tower cranes, there is no trolley to control lateral movement of the load, which is accomplished by changing the jib angle. These cranes are assembled on site in two to three days, and can increase in height with the project; they have a maximum freestanding height of 185 feet and a maximum jib length of 200 feet.
Lattice Boom Cranes Terex Lifting produces crawler and truck mounted lattice boom cranes.
Crawler-mounted lattice boom cranes are designed to lift material on rough terrain and can maneuver while bearing a load. Truck mounted lattice boom cranes are used on-roads, typically in urban areas. Both types consist of a boom made of tubular steel sections, which are transported to and erected, together with the base unit, at a construction site. Terex Lifting manufactures crawler and truck mounted lattice boom cranes at its Wilmington, North Carolina facilities under the TEREX and AMERICAN brand names. These lattice boom crawler cranes have lifting capacities from 125 to 450 tons, and lattice boom truck cranes have lifting capacities up to 300 tons.
Utility Aerial Devices Utility aerial devices are used to set utility poles and move workers and materials to work areas at the top of utility poles and towers. Utility aerial devices are mounted on commercial truck chassis, which include separately installed steel cabinets for tool and material storage.
Articulated Aerial Devices -- are used to elevate workers to work areas at the top of utility poles or in trees and include one or two man baskets. Articulated aerial devices available from Terex Lifting include telescopic, non-overcenter and overcenter models and range in working heights from 32 to 103 feet. Articulated aerial devices are manufactured by Terex Lifting at its Watertown, South Dakota facility under the brand names TELELECT and HI-RANGER.
Digger Derricks -- are used to set telephone poles. The digger derricks include a telescopic boom with an auger mounted at the tip, which digs a hole, and a device to grasp, manipulate and set the pole. Digger derricks available from Terex Lifting have sheave heights exceeding 95 feet and lifting capacities up to 48,000 pounds. Digger derricks are manufactured by Terex Lifting at its Watertown, South Dakota facility under the brand name TELELECT.
Telescopic Material Handlers Telescopic material handlers are used to lift containers or other material from one location to another at the same job site.
Telescopic Container Stackers -- are used to pick up and stack containers at dock and terminal facilities. At the end of a telescopic container stacker's boom is a spreader which enables it to attach to containers of varying lengths and weights and to rotate the container up to 360 degrees. Telescopic container stackers are particularly effective in storage areas where containers are continually added and removed, and where the efficient manipulation of, and access to, specific containers is required. Telescopic container stackers manufactured by Terex Lifting have lifting capacities up to 49.5 tons, can stack up to six full or nine empty containers and are able to maneuver through very narrow areas. Terex Lifting manufactures its telescopic container stackers under the brand

- 8 -
names PPM, TEREX and P&H SUPERSTACKERS at its Montceau-les-Mines, France facility.
Rough Terrain Telescopic Boom Material Handlers -- serve a similar function as smaller size rough terrain telescopic mobile cranes and are used to move and place materials on new residential and commercial job sites. Terex Lifting manufactures rough terrain telescopic boom material handlers with load capacities of up to 10,000 pounds and with a maximum extended reach of up to 40 feet and lift capabilities of up to 56 feet. Terex Lifting manufactures rough terrain telescopic boom material handlers at its facilities in Baraga, Michigan and Perugia, Italy under the brand names SQUARE SHOOTER, TEREX and ITALMACCHINE.
Truck Mounted Cranes (Boom Trucks) Terex Lifting manufactures telescopic boom cranes for mounting on commercial truck chassis. Truck mounted cranes are used primarily in the construction industry to lift equipment or materials to various heights. Boom trucks are generally lighter and have a lower lifting capacity than truck cranes, and are used for many of the same applications when lower lifting capabilities are required. An advantage of a boom truck is that the equipment or material to be lifted by the crane can be transported by the truck, which can travel at highway speeds. Applications include the installation of air conditioners and other roof equipment. The Terex Lifting segment manufactures the following type of crane for installation on truck chassis:
Telescopic Boom Truck Mounted Cranes -- enable an operator to reach heights of up to 166 feet and have a maximum lifting capacity of up to 30 tons. Terex Lifting manufactures its telescopic boom truck mounted cranes at its Olathe, Kansas facility under the brand name RO-STINGER.
Aerial Work Platforms Aerial work platforms are self-propelled devices which position workers and materials easily and quickly to elevated work areas. These products have developed over the past 20 years as alternatives to scaffolding and ladders. The work platform is mounted on either a telescoping and/or articulating boom or on a vertical lifting scissor mechanism. Terex Lifting manufactures the following types of aerial work platforms:
Scissor Lifts -- are used in open areas in indoor or outdoor applications in a variety of construction, industrial and commercial settings. Scissor lifts manufactured by Terex Waverly, Iowa, and Hoorn, The Netherlands facilities under the brand names TEREX AERIALS and HOLLAND LIFT.
Straight Telescopic Boom Lifts -- are used primarily outdoors in residential, commercial and industrial new construction and maintenance projects. Straight telescopic boom lifts manufactured by Terex Lifting have maximum working heights of up to 116 feet and maximum load capacities of up to 650 pounds. Terex Lifting manufactures its straight telescopic aerial work platforms at its Waverly, Iowa facility under the brand name TEREX AERIALS.
Articulating Telescopic Boom Lifts -- are generally used in industrial environments where the articulation allows the user to access elevated areas over machines or structural obstacles which prevent access with a scissor lift or straight boom. Articulating lifts available from Terex Lifting have maximum working heights of up to 86 feet and maximum load capacities of up to 500 pounds. Terex Lifting manufactures its articulating telescopic boom lifts at its Cork, Ireland facility under the brand name TEREX AERIALS.

- 9 -
Rigid and Articulated Off-Highway Trucks Terex Earthmoving manufactures two distinct types of off-highway trucks with hauling capacities from 25 to 100 tons: articulated and rigid frame.
Articulated Off-Highway Trucks -- are three axle, six-wheel drive machines with a capacity range of 25 to 40 tons. Their differentiating feature is an oscillating connection between the cab and body, which allows the cab and body to move independently. This enables all six tires to maintain ground contact for improved traction on rough terrain. This also allows the truck to move effectively through extremely rough or muddy off-road conditions. Articulated off-highway trucks are typically used together with an excavator or wheel loader to move dirt in connection with road, tunnel or other infrastructure construction and commercial, industrial or major residential construction projects. Terex's articulated trucks are manufactured in Motherwell, Scotland, under the brand name TEREX.
Rigid Off-Highway Trucks -- are two axle machines which generally have larger capacities than articulated trucks, but can operate only on improved or graded surfaces. The capacities of rigid off-highway trucks range from 35 to 100 tons, and off-highway trucks have applications in large construction or infrastructure projects, aggregates and smaller surface mines. Terex Earthmoving's rigid trucks are manufactured in Motherwell, Scotland, under the TEREX brand name and in Tulsa, Oklahoma, under the PAYHAULER brand name.
High Capacity Surface Mining Trucks Terex Earthmoving manufactures high capacity surface mining trucks, which are off road dump trucks with capacities in excess of 120 tons used primarily for surface mining.
Terex Earthmoving's high capacity surface mining trucks are powered by a diesel engine driving an electric generator that provides power to individual electric motors in each of the rear wheels. Unit Rig's current LECTRA HAUL product line consists of a series of rear dump trucks with payload capabilities ranging from 120 to 360 tons, and bottom dump trucks with capacities ranging from 180 to 270 tons. Terex Earthmoving's high capacity surface mining trucks are manufactured at Unit Rig, located in Tulsa, Oklahoma, under the UNIT RIG, LECTRA HAUL and TEREX brand names.
Large Hydraulic Excavators Terex Earthmoving sells hydraulic excavators, which are shovels primarily used to load coal, copper ore, iron ore, diamonds, other mineral-bearing materials, or rocks into trucks. These products are primarily utilized for quarrying construction materials or digging in surface mines. Additional applications include large construction projects with difficult working conditions where large amounts of solid material and rock are to be moved.
Terex Earthmoving offers a complete range of large hydraulic excavators, with operating weights from 58 to 800 tons. O&K Mining produces the RH 400, available in both electric and diesel drive, the world's largest hydraulic excavator with an 800 ton machine weight and 80 ton bucket capacity. The inclusion of the RH 400 in Terex Earthmoving's product line enables it to compete with the most popular electric rope shovel size class. Most hydraulic excavators sold by Terex Earthmoving are manufactured under the O&K brand name by O&K Mining in Dortmund, Germany.
Loader Backhoes
Loader backhoes – incorporate a front-end loader and rear excavator arm. They are used for loading, excavating and lifting in many construction and agricultural related applications. Terex Earthmoving’s loader backhoes are manufactured under the FERMEC brand name in Manchester, England.

- 10 -
Crushing and Screening Equipment Terex Earthmoving's crushing and screening equipment is used in the aggregate processing and recycling industries. Crushing and screening products include crushers, screens, trommels, feeders and conveyors, which are used when processing raw aggregate materials. Typical crushing and screening operations utilize a combination of components in reducing virgin aggregate materials to required product sizes for final usage in road building and related construction applications. Crushing and screening plants can be either stationary or portable. Portable crushing and screening plants are configured with a variety of components to provide easy site-to-site mobility, application versatility, flexible on-demand finished product and reduced set-up time. Crushing Equipment Terex Earthmoving manufactures crushing equipment under the PEGSON, CEDARAPIDS, JAQUES AND CANICA-JAQUES brand names in Coalville, England, Cedar Rapids, Iowa, Melbourne, Australia, Subang Jaya, Malaysia and Vancouver, Washington. Terex Earthmoving produces the following types of crushing equipment: Jaw Crushers -- are primary crushers with reduction ratios of 6 to 1 for crushing larger
rock. Applications include hard rock, sand and gravel and recycled materials. Models offered yield a range of production capacities: up to 265 tons per hour for the smallest unit, and up to 1,700 tons per hour for the largest.
Horizontal Shaft Impactors -- are secondary crushers which utilize rotor impact bars and
breaker plates to achieve high production tonnages and improved aggregate particle shape. The rugged durability and easy maintenance of horizontal shaft impactors ensure less downtime and reduced wear costs for the owner. They are typically applied to reduce soft to medium hard materials.
Vertical Shaft Impactors -- are tertiary crushers which reduce material utilizing various
rotor configurations and are highly adaptable to any application. Vertical shaft impactors can be customized to material conditions and desired product size/shape. A full range of models provides customers with increased tonnages, better circuit balance and screen efficiency.
Cone Crushers -- are used in secondary and tertiary applications to reduce a number of
materials, including quarry rock and riverbed gravel. High production, low maintenance and enhanced final material cubical shape are the principal features of these compression-type roller bearing crushers.
Screening Equipment Terex Earthmoving manufactures screening equipment at its facilities in Dungannon, Northern Ireland, Kilbeggan, Ireland, Omagh, Northern Ireland, Durand, Michigan, Cedar Rapids, Iowa, Lebanon, Pennsylvania, Melbourne, Australia, Subang Jaya, Malaysia and Chomburi, Thailand under the brand names POWERSCREEN, FINLAY, SIMPLICITY, CEDARAPIDS, ROYER, RE-TECH and JAQUES.
Heavy Duty Inclined Screens and Feeders -- are found in high tonnage applications. These units are typically custom designed to meet the needs of each customer. Although primarily found in stationary installations, Terex Earthmoving supplies a variety of screens and feeders for use on heavy duty portable crushing and screening spreads.
Inclined Screens -- are used in all phases of plant design from handling quarried material
to fine screening. Capable of handling much larger capacity than a flat screen, inclined screens are most commonly found in large stationary installations where maximum output is required. This requires the ability to custom design and manufacture units that meet both the engineering and application requirements of the end user.

- 11 -
Feeders -- are generally situated at the primary end of the processing facility, requiring rugged design in order to handle the impact of the material being fed from front end loaders, excavators, etc. The feeder moves material to the crushing and screening equipment in a controlled fashion. Some feeders manufactured by Terex Earthmoving remove smaller sized materials through a short scalping area before reaching the crusher, significantly reducing the wear in the crusher chamber.
Flat Screens -- combine the high efficiency of a horizontal screen with the capacity,
bearing life and low maintenance of an inclined screen. They are adaptable for heavy scalping, standard duty and fine screening applications and are engineered for durability and user friendliness.
Dry Screening -- is used to process materials such as sand, gravel, quarry rock, coal, construction and demolition waste, soil, compost and wood chips.
Washing Screens -- are used to separate, wash, scrub, dewater and stockpile sand and gravel. Products manufactured by Terex Earthmoving include a completely mobile single chassis washing plant incorporating separation, washing, dewatering and stockpiling, mobile and stationary screening rinsers, bucket-wheel dewaterers, scrubbing devices for aggregate, a mobile cyclone for maximum retention of sand particles, silt extraction systems, stockpiling conveyors and a sand screw system as an alternative option to the bucket-wheel dewaterers. Trommels -- are used in the recycling of construction and demolition waste material, as well as soil, compost and wood chips. Trommels incorporate conveyors and variable speed fingertip control of the belts and rotating drum to separate the various materials. Terex Earthmoving manufactures a range of trommel and soil shredding equipment. Terex Earthmoving also designs, sources, installs, commissions and provides aftersales support for turnkey recycling systems. These systems are used to process construction and demolition waste, as well as decasing, segmenting and processing empty bottles. The soil shredding units are mainly used by landscape contractors and provide a high specification end product. Trommels are produced by Terex Earthmoving at its facilities in Lebanon, Pennsylvania under the brand names RE-TECH, ROYER and TEREX.
Asphalt Equipment Terex Earthmoving manufactures asphalt mixing plants and asphalt pavers at its facilities in Cedar Rapids, Iowa, and Glasgow, Missouri.
Asphalt Pavers -- Terex Earthmoving sells asphalt pavers with maximum widths from 18 feet to 30 feet. Pavers are available in rubber tire and steel or rubber track designs. The smaller units have a maximum paving width of 18 feet and are used for commercial work such as parking lots, development streets and construction overlay projects. Mid-sized pavers are used for mainline and commercial projects and have maximum paving widths ranging from 24 to 28 feet. High production pavers are engineered and built for heavy-duty, mainline paving and are capable of 30 foot maximum paving widths. All of the above feature direct hydrostatic drive for maximum uptime, patented frame raise for maneuverability and three-point suspension for smooth, uniform mats. Terex Earthmoving's asphalt pavers are manufactured under the CEDARAPIDS and GRAYHOUND brand names in Cedar Rapids, Iowa. Asphalt Mixing Plants -- are used by road construction companies to produce hot mix asphalt. The mixing plants are available in portable, relocatable and stationary configurations. Associated plant components and control systems are manufactured to offer customers a wide variety of equipment to meet individual production requirements. The asphalt mixing plants are manufactured under the CEDARAPIDS/STANDARD HAVENS brand name in Glasgow, Missouri.

- 12 -
Light Construction Equipment Light construction equipment produced by Terex includes mobile and portable floodlighting systems, concrete power trowels, concrete placement systems, concrete finishing systems, generators and traffic control products.
Light Towers -- are used primarily to light work areas for night construction activity. They are towed to the work-site where the telescopic tower is extended and outriggers are deployed for stability. They are diesel powered and provide adequate light for construction activity for a radius of approximately 300 feet from the tower. Light towers are manufactured under the AMIDA, COLEMAN ENGINEERING and TEREX brand names. Power Trowels -- are used to provide a smooth finish on concrete surfaces. They are used on soft cement as the concrete hardens. The power trowels are manufactured as walk-behind and ride-on models. Trowels are typically used in conjunction with other products manufactured by Terex Light Construction, including light towers, power buggies, screed, and material spreaders. Power trowels are manufactured under the BARTELL brand name in Brampton, Ontario, Canada. Power Buggies -- are used primarily to transport concrete from the mixer to the pouring site. Terex Amida power buggies include dump capacities from 10 to 21 cubic feet with both walk-behind and ride-on models. Terex manufactures power buggies under the AMIDA, MORRISION and TEREX brand names in Rock Hill, South Carolina. Generators – are used to provide electric power on construction sites and other remote locations. Generators are manufactured under the COLEMAN ENGINEERING brand name in Holly Springs, Mississippi. Directional Arrowboards -- are used to direct traffic around road construction sites. They are primarily solar powered, with solar panels continuously recharging batteries which provide power during night hours. Terex Amida arrowboards include 15 and 25 light configurations. Directional arrow boards are manufactured under the TEREX and AMIDA brand names in Rock Hill, South Carolina.
Backlog The Company's backlog as of December 31, 2000 and 1999 was as follows:
December 31, 2000 1999 (in millions) Terex Lifting ....................................... $ 111.7 $ 167.0 Terex Earthmoving ............................ 102.3 158.3 Other.................................................... 5.8 1.2
Total ............................................ $ 219.8 $ 326.5
Substantially all of the Company's backlog orders are expected to be filled within one year, although there can be no assurance that all such backlog orders will be filled within that time period. The Company's backlog orders represent primarily new equipment orders. Parts orders are generally filled on an as-ordered basis. Terex Lifting backlog at December 31, 2000 decreased $55.3 million to $111.7 million as compared to $167.0 million at December 31, 1999. The decrease in backlog was due to the continued slowdown in the mobile crane segment and the effect of the sale of the Company’s truck-mounted forklift businesses in September 2000. The backlog at Terex Earthmoving decreased to $102.3 million at December 31, 2000 from $158.3 million at December 31, 1999, principally due to slowdowns in the mining business and improvements in delivery performance and lead-times within the Company’s crushing and screening business. Included in Other backlog are backlog orders of Terex Light Construction.

- 13 -
Distribution Terex Lifting distributes its products primarily through a global network of dealers and national accounts in over 1,000 different locations. Terex Lifting's telescopic mobile cranes are marketed in the great majority of the United States under the TEREX brand name. Terex Lifting's European telescopic mobile cranes distribution is carried out primarily under three brand names, TEREX, PPM and BENDINI, through a distribution network comprised of both distributors and a direct sales force. Terex Lifting sells its lattice boom cranes through a distribution network under the TEREX and AMERICAN brand names. Terex Lifting distributes its mobile cranes in Australia under the FRANNA and TEREX brand names. Telescopic boom truck mounted cranes are distributed by Terex Lifting under the RO-STINGER brand name. Terex Lifting sells its utility aerial devices under the TEREX TELELECT and HI-RANGER brand names principally through a network of North American distributors. Terex Lifting sells its aerial work platform products through a distribution network throughout the world, but principally in North America and Europe. Terex Lifting's aerial work platform products are sold under the brand names TEREX AERIALS and HOLLAND LIFT. Terex Lifting sells its tower cranes through a distribution network under the PEINER, COMEDIL and TEREX brand names. Terex Lifting's material and container handlers products are sold through a distribution network under the brand names of TEREX, SQUARE SHOOTER, PPM, P&H and ITALMACCHINE. With respect to Terex Earthmoving products, TEL markets trucks and replacement parts primarily through worldwide dealership networks. TEL's truck dealers are independent businesses, which generally serve the construction, mining, timber and/or scrap industries. Although these dealers carry products of a variety of manufacturers, and may or may not carry more than one of Terex's products, each dealer generally carries only one manufacturer's "brand" of each particular type of product. Terex employs sales representatives who service these dealers from offices located throughout the world. Payhauler distributes its products primarily through a dealership network. Unit Rig distributes its products and services directly to customers primarily through its own distribution system. O&K Mining sells its hydraulic excavators and after-market parts and services primarily through its export sales department in Dortmund, Germany, through O&K Mining's global network of wholly-owned foreign subsidiaries and through dealership networks. Fermec sells its loader backhoes through a network of independent dealers and distributors throughout the world. Powerscreen distributes all screening products through a global network of dealers in more than 80 locations. The American dealers are supported by a distribution center located in Louisville, Kentucky. Most dealers are single line Powerscreen dealers. B.L. Pegson sells their entire range of crushers, screens and feeders worldwide through distributors under the PEGSON brand name. In total there are approximately 50 dealers, half of which are located in the United States and served by the distribution center in Louisville, Kentucky. Finlay distributes all products worldwide through a network of independent dealers. In total there are approximately 35 distributors located across five continents. Simplicity sells products through dealers, mainly located in the United States, as well as direct to original equipment manufactures. Most of Royer/Re-Tech’s business is in the United States and their products are sold by distributors. Benford sells its products primarily through dealers and distributors. Cedarapids crushing and screening equipment and asphalt pavers (and aftermarket support parts for both of these lines) are sold principally through a worldwide network of distributors under the CEDARAPIDS brand name. There are approximately 40 domestic and 25 international dealers, many of which have multiple branch offices. Asphalt mixing plants are sold direct to end user customers under the CEDARAPIDS/STANDARD HAVENS brand name. The Jaques Group distributes its crushing and screening equipment principally through a worldwide network of independent distributors and dealers. Terex Light Construction distributes its products through a global network of dealers and national accounts. Terex employs sales representatives who service these dealers throughout the world. Worldwide distribution is conducted under the AMIDA, BARTELL, MORRISON, BENFORD, MULLER, COLEMAN ENGINEERING and TEREX brand names. Research and Development Terex maintains engineering staffs at several of its locations who design new products and improvements in existing product lines. Terex's engineering expenses are primarily incurred in connection with the improvements of existing products, efforts to reduce costs of existing products and, in certain cases, the development of products which may have additional applications or represent extensions of the existing product line. Such costs incurred in the development of new products or significant improvements to existing products of continuing operations amounted to $9.1, $9.1 and $8.2 million in 2000, 1999 and 1998, respectively.

- 14 -
Materials Principal materials used by the Company in its various manufacturing processes include steel, castings, engines, tires, hydraulic cylinders, drive trains, electric controls and motors, and a variety of other fabricated or manufactured items. In the absence of labor strikes or other unusual circumstances, substantially all materials are normally available from multiple suppliers. Current and potential suppliers are evaluated on a regular basis on their ability to meet the Company's requirements and standards. Electric wheel motors and controls used in most of the Unit Rig product line are currently supplied exclusively by General Electric Company. The Company has endeavored to develop alternative sources and has entered into a contract with General Atomics, a former defense contractor, who has developed electric wheel motors for the largest Unit Rig trucks. If the Company is unable to develop alternative sources, or if there is disruption or termination of its relationship with General Electric Company (which is not governed by a written contract), it could have a material adverse effect on Unit Rig's operations. Competition Telescopic Mobile Cranes -- The domestic telescopic mobile crane industry is comprised primarily of three manufacturers. The Company believes that Terex Lifting is the second largest domestic manufacturer. The Company believes that the number one domestic manufacturer is Grove Worldwide, and the number three domestic manufacturer is Link-Belt, a subsidiary of Sumitomo Corp. The Company’s principal markets in Europe are in France, Italy and Spain, where the Company believes it has the largest market shares. In Europe, Terex Lifting's primary competitors are Grove Cranes Ltd, Liebherr and Mannesmann Dematic. Truck Mounted Cranes (Boom Trucks) -- The United States boom truck industry is dominated by four manufacturers, of which the Company believes Terex RO is the second largest behind Grove National. Tower Cranes -- The tower crane industry includes two principal competitors, Liebherr and Potain, who combined represent well over half of the worldwide market. Terex and Wolf are the only other competitors with a multi-national presence; other manufacturers are small and regional. Lattice Boom Cranes -- The lattice boom crane industry includes Manitowoc, Link-Belt, Mannesmann Dematic, Liebherr, and Hitachi. Manitowoc is the world leader in lifting capacities over 125 tons, and represents over half of the United States lattice boom crane market. Utility Aerial Devices -- The utility aerial device industry is comprised primarily of three manufacturers. The Company believes that it is the second largest manufacturer in the United States of utility aerial devices behind Altec. Telescopic Container Stackers -- The Company believes that four manufacturers account for a majority of the global market for telescopic container stackers. The Company believes that it is the second largest manufacturer behind Kalmar. Other manufacturers include Valmet Belloti and Taylor. Rough Terrain Telescopic Boom Material Handlers – OmniQuip (Textron), Caterpillar and Gradall (JLG) are the largest manufacturers of rough terrain telescopic material handlers. The Company believes that it is the fourth largest manufacturer of rough terrain telescopic material handlers. Aerial Work Platforms – The aerial work platform industry in North America is fragmented, with seven major competitors. Terex believes that it is the fifth largest manufacturer of aerial work platforms in North America, behind JLG, Genie, UpRight and Omn iQuip (Textron). The Company believes that its market share in boom lifts is greater than its market share in scissor lifts. Off-Highway Trucks -- North America and Europe account for a majority of the global market. Four manufacturers dominate the global market. Terex believes that it is the third largest of these manufacturers (behind Volvo and Caterpillar). High Capacity Surface Mining Trucks -- The high capacity surface mining truck industry includes three principal manufacturers: Caterpillar, Komatsu-Dresser and the Company. The Company believes that it had the leading market share since 1999. Large Hydraulic Excavators -- The large hydraulic excavator industry is comprised of primarily seven manufacturers, the largest of which are Hitachi, Komatsu-DeMag, Liebherr and Caterpillar. The Company believes it is the largest manufacturer of hydraulic excavators having machine weights in excess of 200 tons. The largest hydraulic excavators also compete against

- 15 -
electric mining shovels (rope excavators) from competitors such as Harnischfeger Corporation and Bucyrus International, Inc. and, for some applications, against bucket wheel loaders from competitors such as Caterpillar, Volvo and Komatsu-Dresser. Loader Backhoes -- The loader backhoe industry is a competitive market reflecting a large number of competitors. The largest competitors are Caterpillar, CNH (including both its Case and New Holland brands), JCB, Fiat-Hitachi and John Deere. The Company believes that it is the fifth largest of these manufacturers in Europe and in the United States. Crushing and Screening Equipment -- The crushing industry is a competitive market reflecting a large number of competitors. The two largest competitors are Nordberg, a subsidiary of Metso Corporation, and Svedala Industri A.B. The Company believes it is the third largest manufacturer. The screening industry includes six principal manufacturers: Extec (U.K.), Nordberg (Metso Corporation) (Finland), Astec Industries (U.S.), Svedala (Sweden), Ohio Screen (U.S.), and Parker Plant (U.K.). The Company believes that it is the market leader in the mobile screening industry. Asphalt Pavers -- The asphalt paver industry includes four principal manufacturers: Blaw-Knox (Ingersoll-Rand), Barber Greene (Caterpillar), Roadtec (Astec Industries) and the Company. The Company believes it is the third largest manufacturer. Asphalt Mixing Plants -- The asphalt mixing plant industry includes three principal manufacturers: Astec Industries, CMI Corporation, and Gencor Corporation. The Company believes it is the fourth largest manufacturer. Light Towers -- The United States light tower market is dominated by three manufacturers. The Company believes that it is the largest manufacturer followed by Allmand Bros. and Ingersoll-Rand. Light Concrete Equipment -- The light concrete equipment market is fragmented with numerous small manufacturers. The Company believes that Allen Engineering, Multiquip, and Wacker are the primary extended line competitors. The Company believes that it is the third largest extended line manufacturer in this category. Employees As of December 31, 2000, the Company had approximately 6,150 employees. The Company considers its relations with its personnel to be good. Approximately 34% of the Company's employees are represented by labor unions which have entered into or are in the process of entering into various separate collective bargaining agreements with the Company. The Company experienced a labor strike at its Terex Lifting manufacturing facility in Waverly, Iowa during December 1999 and January 2000 which was settled in January 2000. The strike at Waverly had no appreciable affect on the conduct of business or financial results of the Terex Lifting segment as a whole. Patents, Licenses and Trademarks Several of the trademarks and trade names of the Company, in particular the TEREX, LORAIN, UNIT RIG, MARKLIFT, P&H, PPM, TELELECT, SQUARE SHOOTER, PAYHAULER, O&K, HOLLAND LIFT, AMERICAN, ITALMACCHINE, PEINER, COMEDIL, FRANNA, POWERSCREEN, CEDARAPIDS, FINLAY, SIMPLICITY, B.L. PEGSON, MATBRO, BENFORD, MULLER, RE-TECH, JAQUES, CANICA-JAQUES, AMIDA, MORRISON, BRIMONT, EARTHKING, FERMEC, COLEMAN ENGINEERING and BARTELL trademarks, are important to the business of the Company. The Company owns and maintains trademark registrations and patents in countries where it conducts business, and monitors the status of its trademark registrations and patents to maintain them in force and renews them as required. The Company also protects its trademark, trade name and patent rights when circumstances warrant such action, including the initiation of legal proceedings, if necessary. P&H is a registered trademark of Harnischfeger Corporation which the Company has the right to use for certain products pursuant to a license agreement until 2011. The Company also has the right to use the O&K and Orenstein & Koppel names (which are registered trademarks of Orenstein & Koppel) for most applications in the mining business for an unlimited period of time. All other trademarks and trade names referred to in this Annual Report are registered trademarks of Terex Corporation or its subsidiaries. Environmental Considerations The Company generates hazardous and non-hazardous wastes in the normal course of its operations. As a result, the Company is subject to a wide range of federal, state, local and foreign environmental laws and regulations, including the Comprehensive Environmental Response, Compensation and Liability Act ("CERCLA"), that (i) govern activities or operations that may have adverse environmental effects, such as discharges to air and water, as well as handling and disposal practices for hazardous and non-hazardous wastes, and (ii) impose liability for the costs of cleaning up, and certain damages resulting from, sites of past spills, disposals or other releases of hazardous substances. Compliance with such laws and regulations

- 16 -
has, and will, require expenditures by the Company on a continuing basis. However, the Company has not incurred, and does not expect to incur in the future, any material capital expenditures for environmental control facilities. Seasonal Factors The Company markets a large portion of its products in North America and Europe, and its sales of trucks, asphalt mixing plants, mobile crushing and screening equipment and cranes during the fourth quarter of each year to the construction industry are usually lower than sales of such equipment during each of the first three quarters of the year because of the normal winter slowdown of construction activity. However, sales of trucks and excavators to the mining industry are generally less affected by such seasonal factors.

- 17 -
ITEM 2. PROPERTIES The following table outlines the principal manufacturing, warehouse and office facilities owned or leased by the Company and its subsidiaries: Entity Facility Location Type and Size of Facility Terex (Corporate Offices) and EarthKing ....... Westport, Connecticut (1) Office; 19,898 sq. ft. Terex (Distribution Center) .............................. Southaven, Mississippi (1) Office and warehouse; 505,000 sq. ft. (2) Amida................................................................... Rock Hill, South Carolina Office, manufacturing and warehouse; 121,020 sq. ft. Bartell ................................................................... Brampton, Ontario, Canada Office, manufacturing and warehouse; 32,509 sq. ft. Coleman ................................................................Holly Springs, Mississippi Office, manufacturing and warehouse; 100,000 sq. ft. Coleman ................................................................Memphis, Tennessee (1) Warehouse and manufacturing; 50,000 sq. ft.
Terex Lifting
Terex Lifting - Waverly Operations................. Waverly, Iowa Office, manufacturing and warehouse; 311,920 sq. ft. Terex Lifting - Conway Operations.................. Conway, South Carolina (1) Office, manufacturing and warehouse; 153,716 sq. ft. PPM S.A.S. ......................................................... Montceau-les-Mines, France Office, manufacturing and warehouse; 418,376 sq. ft. Terex Italia ........................................................... Crespellano, Italy Office, manufacturing and warehouse; 68,501 sq. ft. Terex Lifting Espana ......................................... Cabanillas Del Campo, Spain (1) Office and warehouse; 26,900 sq. ft. PPM S.A.S. subsidiary ...................................... Dortmund, Germany (1) Office and warehouse; 129,180 sq. ft. PPM S.A.S. subsidiary ...................................... Rethel, France Office, manufacturing and warehouse; 213,058 sq. ft. Telelect................................................................. Watertown, South Dakota (3) Office, manufacturing and warehouse; 237,900 sq. ft. Telelect (Terex Manufacturing)........................ Huron, South Dakota Manufacturing; 88,000 sq. ft. Terex Aerials Limited ......................................... Cork, Ireland (1) Office and manufacturing; 35,250 sq. ft. Terex-RO.............................................................. Olathe, Kansas Office and manufacturing; 80,400 sq. ft. Terex Handlers .................................................... Baraga, Michigan Office, manufacturing and warehouse; 53,620 sq. ft. Comedil……………………………………..Fontanafredda, Italy Office, manufacturing and warehouse; 100,682 sq. ft. Holland Lift…………………………………Hoorn, The Netherlands Office, manufacturing and warehouse; 30,000 sq. ft. Terexlift Perugia, Italy .........................................Office, manufacturing and warehouse; 113,834 sq. ft. Peiner……………………………………….Trier, Germany Office, manufacturing and warehouse; 85,787 sq. ft. American Crane…………………………….Wilmington, North Carolina Office, manufacturing and warehouse; 572,200 sq. ft. Terex Lifting Australia ....................................... Brisbane, Australia (1) Office, manufacturing and warehouse; 42,495 sq. ft. Terex Lifting U.K. ............................................... Tetbury, England (1) Office, manufacturing and warehouse; 80,000 sq. ft.

- 18 -
Terex Earthmoving
O&K Mining………………………………..Dortmund, Germany (1) Office, manufacturing, warehouse; 775,000 sq. ft. Unit Rig and Payhauler...................................... Tulsa, Oklahoma Office, manufacturing and warehouse; 375,587 sq. ft. TEL....................................................................... Motherwell, Scotland Office, manufacturing and warehouse; 473,000 sq. ft. Powerscreen.........................................................Dungannon, Northern Ireland Office, manufacturing and warehouse; 330,000 sq. ft. Powerscreen.........................................................Kilbeggan, Ireland Manufacturing; 70,000 sq. ft. Finlay.................................................................... Omagh, Northern Ireland Office, manufacturing and warehouse; 152,863 sq. ft. Benford ................................................................ Warwick, England Office, manufacturing and warehouse; 210,000 sq. ft. Simplicity ............................................................. Durand, Michigan Office, manufacturing and warehouse; 167,000 sq. ft. B. L. Pegson ........................................................ Coalville, England Office, manufacturing and warehouse; 204,486 sq. ft. Cedarapids........................................................... Cedar Rapids, Iowa Office, manufacturing and warehouse; 608,423 sq. ft. Standard Havens ............................................... Glasgow, Missouri Office, manufacturing and warehouse; 140,000 sq. ft. Royer/Re-Tech.................................................... Lebanon, Pennsylvania (1) Office, manufacturing and warehouse; 148,800 sq. ft. Fermec.................................................................. Manchester, England Office, manufacturing and warehouse; 371,683 sq. ft. Jaques .................................................................. Melbourne, Australia (1) Office, manufacturing and warehouse; 36,000 sq. ft. Canica-Jaques ..................................................... Vancouver, Washington (1) Office, manufacturing and warehouse; 41,000 sq. ft. Jaques Malaysian............................................... Subang Jaya, Malaysia (1) Manufacturing and warehouse; 111,200 sq. ft. Jaques Thailand...................................................Chomburi, Thailand Manufacturing; 79,500 sq. ft. (1) These facilities are either leased or subleased by the indicated entity. (2) Includes 239,400 sq. ft. of warehouse space subleased to others. (3) Includes 18,550 sq. ft. which are leased by the indicated entity. Unit Rig, O&K Mining and Powerscreen also have numerous owned or leased locations for parts distribution and rebuilding of components located worldwide. Management believes that the properties listed above are suitable and adequate for the Company's use. The Company has determined that certain of its properties exceed its requirements. Such properties may be sold, leased or utilized in another manner and have been excluded from the above list. The majority of the Company's U.S. properties are subject to mortgages arising from its bank credit facilities. Financial Information about Industry and Geographic Segments, Export Sales and Major Customers Information regarding foreign and domestic operations, export sales, segment information and major customers is included in Note O -- "Business Segment Information" in the Notes to the Consolidated Financial Statements.

- 19 -
ITEM 3. LEGAL PROCEEDINGS As described in Note M -- "Litigation and Contingencies" in the Notes to the Consolidated Financial Statements, the Company is involved in various legal proceedings, including product liability and workers' compensation liability matters, which have arisen in the normal course of its operations and to which the Company is self-insured for up to $2.5 million per incident. Management believes that the final outcome of such matters will not have a material adverse effect on the Company's consolidated financial position. In connection with the Company’s sale of the Clark material handling business to Clark Material Handling Company (“CMHC”) in November 1996, CMHC assumed liabilities from Terex arising from product liability claims dealing with Clark material handling products manufactured prior to the date of the divestiture. In connection with CMHC’s voluntary filing for bankruptcy in 2000, CMHC has defaulted on its obligations to indemnify and defend the Company from such product liability claims. As a result of this situation, the Company recorded an expense of $7.3 million, net of income taxes, in the fourth quarter of 2000 representing the Company’s estimated liability for known product liability claims. For information concerning other contingencies and uncertainties, see "Management's Discussion and Analysis of Financial Condition and Results of Operations -- Contingencies and Uncertainties." ITEM 4. SUBMISSION OF MATTERS TO A VOTE OF SECURITY HOLDERS Not applicable.
PART II ITEM 5. MARKET FOR THE REGISTRANT'S COMMON STOCK AND RELATED STOCKHOLDER MATTERS (a) The Company's Common Stock is listed on the New York Stock Exchange (the "NYSE") under the symbol "TEX." The high and low stock prices for the Company's Common Stock on the NYSE Composite Tape (for the last two completed years) are as follows: 2000 1999
Fourth Third Second First Fourth Third Second First
High.....................................................................................$17.19 $19.50 $17.25 $28.88 $31.50 $31.88 $35.50 $28.50 Low......................................................................................11.56 12.00 12.38 11.13 24.81 24.25 23.25 22.13 No dividends were declared or paid in 1999 or in 2000. Certain of the Company's debt agreements contain restrictions as to the payment of cash dividends. In addition, payment of dividends is limited by Delaware law. The Company intends generally to retain earnings, if any, to fund the development and growth of its business and to pay down debt. The Company does not plan on paying dividends on the Common Stock in the near term. Any future payments of cash dividends will depend upon the financial condition, capital requirements and earnings of the Company, as well as other factors that the Board of Directors may deem relevant. As of March 13, 2001, there were 717 stockholders of record of the Company's Common Stock. (b) Not Applicable.

- 20 -
ITEM 6. SELECTED FINANCIAL DATA (in millions except per share amounts and employees) As of or for the Year Ended December 31, 2000 1999 1998 1997 1996 Summary of Operations Net sales ............................................................................................... $ 2,068.7 $ 1,856.6 $ 1,233.2 $ 842.3 $ 678.5 Income from operations ..................................................................... 198.3 178.3 122.0 71.1 5.1 Income (loss) from continuing operations before extraordinary
items .................................................................................................. 103.9
172.9
72.8
30.3
(54.3) Income (loss) from discontinued operations.................................. (7.3) --- --- --- 102.0 Income before extraordinary items ................................................... 96.6 172.9 72.8 30.3 47.7 Net income ........................................................................................... 95.1 172.9 34.5 15.5 47.7 Income applicable to common stock................................................ 95.1 172.9 34.5 10.7 24.8 Per Common and Common Equivalent Share: Basic Income (loss) from continuing operations.................................. $ 3.82 $ 7.14 $ 3.52 $ 1.57 $ (6.54) Income (loss) from discontinued operations.............................. (0.27) --- --- --- 8.64 Income before extraordinary items ............................................... 3.55 7.14 3.52 1.57 2.10 Net income ....................................................................................... 3.50 7.14 1.67 0.66 2.10 Diluted Income (loss) from continuing operations.................................. $ 3.72 $ 6.75 $ 3.25 $ 1.44 $ (5.81) Income (loss) from discontinued operations.............................. (0.26) --- --- --- 7.67 Income before extraordinary items ............................................... 3.46 6.75 3.25 1.44 1.86 Net income ....................................................................................... 3.41 6.75 1.54 0.60 1.86 Working Capital Current assets ...................................................................................... $ 1,242.4 $ 1,315.3 $ 771.6 $ 426.5 $ 390.2 Current liabilities ................................................................................. 575.6 579.5 425.4 236.1 195.0 Working capital................................................................................... 666.8 735.8 346.2 190.4 195.2 Property, Plant and Equipment Net property, plant and equipment .................................................. $ 153.9 $ 172.8 $ 99.5 $ 47.8 $ 31.7 Capital expenditures ........................................................................... 24.2 21.4 13.1 9.9 8.1 Depreciation......................................................................................... 23.0 17.6 10.1 8.2 7.0 Total Assets........................................................................................... $ 1,983.7 $ 2,177.5 $ 1,151.2 $ 588.5 $ 471.2 Capitalization
Long-term debt and notes payable, including current maturities $ 902.5 $
1,156.4
$
631.3
$
300.1
$
281.3
Minority interest, including redeemable preferred stock of a subsidiary....................................................................................... ---
---
0.6
0.6
10.0
Redeemable convertible preferred stock......................................... --- --- --- --- 46.2 Stockholders' equity (deficit) ............................................................ 451.5 432.8 98.1 59.6 (71.7) Dividends per share of Common Stock........................................... $ --- $ --- $ --- $ --- $ --- Shares of Common Stock outstanding at year end........................ 26.8 27.5 20.8 20.5 13.2 Employees .............................................................................................. 6,150 6,650 4,142 2,950 2,270 The Selected Financial Data include the results of operations of Coleman, Fermec, Amida, Powerscreen, Cedarapids, Bartell, Re-Tech, Princeton/Kooi, Franna (now known as Terex Lifting Australia), Payhauler, O&K Mining, Holland Lift, American Crane, Italmacchine (now known as Terexlift S.r.l.), Peiner, Comedil, the Simon Access Companies, Terex Handlers and PPM from October 23, 2000, December 28, 2000, April 1, 1999, July 27, 1999, August 27, 1999, September 20, 1999, September 29, 1999, November 3, 1999, December 1, 1999, January 5, 1998, March 31, 1998, May 4, 1998, July 31, 1998, November 3, 1998, November 13, 1998, December 18, 1998, April 7, 1997, April 14, 1997 and May 9, 1995, respectively, the dates of their acquisitions. See Note B -- "Acquisitions" in the Notes to the Consolidated Financial Statements for further information. The Selected Financial Data for the year ended December 31, 2000, includes the results of operations of Princeton/Kooi and Moffett (a division of Powerscreen) through September 30, 2000, the date these units were sold. See Note C – “Sale of Businesses” in the Notes to the Consolidated Financial Statements for further information. The Selected Financial Data for the year ended December 31, 1996 includes the results of operations of Clark Material Handling Company ("CMHC") as discontinued operations. CMHC was sold by the Company in November 1996.

- 1 -
ITEM 7. MANAGEMENT'S DISCUSSION AND ANALYSIS OF FINANCIAL CONDITION AND RESULTS OF OPERATIONS
RESULTS OF OPERATIONS The Company organizes itself primarily in two industry segments: Terex Lifting and Terex Earthmoving. The 2000 results for Terex Lifting include the operations of Moffett and Princeton/Kooi through September 30, 2000, their date of sale. The 1999 results for Terex Lifting include the operations of Moffett, Terex Lifting U.K., Princeton/Kooi and Terex Lifting Australia from their respective acquisition dates of July 27, 1999, November 3, 1999 and December 1, 1999. The 1998 results for Terex Lifting include the operations of Holland Lift, American Crane, Terexlift, Peiner and Comedil from their respective acquisition dates of May 4, 1998, July 31, 1998, November 3, 1998, November 13, 1998 and December 18, 1998. The 1999 results for Terex Earthmoving include the operations of Powerscreen (excluding Moffett and Terex Lifting U.K.), Cedarapids and Re-Tech from their respective acquisition dates of July 27, 1999, August 27, 1999 and September 29, 1999. Terex Earthmoving results for 1998 includes the results of Payhauler and O&K Mining from their respective acquisition dates of January 5, 1998 and March 31, 1998. Included in the 2000 Other are the results of the operations of Coleman from October 23, 2000, its date of acquisition, along with the results of operations of Amida and Bartell, as well as general and corporate items. Included in the 1999 Other are the results of the operations of Amida and Bartell from their respective acquisition dates of April 1, 1999 and September 20, 1999 as well as general and corporate items. 2000 Compared with 1999 The table below is a comparison of net sales, gross profit, selling, general and administrative expenses and income (loss) from operations, by segment, for 2000 and 1999.
Year Ended December 31,
Increase
2000 1999 (Decrease) (in millions of dollars) NET SALES Terex Lifting.............................................................................................. $ 924.0 $ 944.9 $ (20.9) Terex Earthmoving................................................................................... 1,099.5 878.9 220.6 Other.......................................................................................................... 45.2 32.8 12.4 Total........................................................................................................ $ 2,068.7 $ 1,856.6 $ 212.1
GROSS PROFIT
Terex Lifting.............................................................................................. $ 155.2 $ 146.0 $ 9.2 Terex Earthmoving................................................................................... 201.1 164.0 37.1 Other.......................................................................................................... 7.3 6.7 0.6 Total........................................................................................................ $ 363.6 $ 316.7 $ 46.9
SELLING, GENERAL AND ADMINISTRATIVE EXPENSES
Terex Lifting.............................................................................................. $ 60.4 $ 59.6 $ 0.8 Terex Earthmoving................................................................................... 96.5 76.5 20.0 Other.......................................................................................................... 8.4 2.3 6.1 Total........................................................................................................ $ 165.3 $ 138.4 $ 26.9
INCOME FROM OPERATIONS
Terex Lifting.............................................................................................. $ 94.8 $ 86.4 $ 8.4 Terex Earthmoving................................................................................... 104.6 87.5 17.1 Other.......................................................................................................... (1.1) 4.4 (5.5) Total........................................................................................................ $ 198.3 $ 178.3 $ 20.0

- 2 -
Net Sales Sales increased $212.1 million, or approximately 11.4%, to $2,068.7 million in 2000 from $1,856.6 million in 1999. This revenue increase was due to the effect of a full year of inclusion of companies acquired in 1999, offset partially by declining revenues at existing businesses. Terex Lifting's sales were $924.0 million for 2000, a decrease of $20.9 million, or 2.2%, from $944.9 million in 1999. The decrease can be attributed to the continued decline in the hydraulic mobile crane market and the aerial work platform business, which was de-emphasized during the fourth quarter of 1999 with the closing of the Company’s Milwaukee facility. These items were offset partially by the contribution from companies acquired in 1999 and the Company’s performance in its utility aerial device business. Machine sales decreased $33.0 million to $762.0 million while part sales increased $4.3 million to $100.8 million. Terex Lifting's backlog decreased $55.3 million to $111.7 million, attributable primarily to a decline in the hydraulic mobile crane business and the sale of the truck-mounted forklift businesses in the third quarter of 2000. Terex Earthmoving's sales were $1,099.5 million in 2000, an increase of $220.6 million, or 25%, from $878.9 million in 1999. This increase was primarily due to the impact of companies acquired in 1999, offset partially by declining revenues in the Company’s mining business. Machine sales increased $187.1 million to $831.2 million while part sales increased $33.0 million to $233.4 million. Backlog decreased to $102.3 million at December 31, 2000 from $158.3 million at December 31, 1999 due to slowdowns in the mining business and improvements in delivery performance and lead-times within the Company’s crushing and screening business. Net sales for Other represent sales from Amida, Bartell and Coleman from their date of acquisition and service revenues generated by Terex's parts distribution center for services provided to a third party. Amida, Bartell and Coleman were acquired by Terex on April 1, 1999, September 20, 1999 and October 23, 2000, respectively. Gross Profit Gross profit for 2000 increased $46.9 million to $363.6 million as a result of 1999 acquisitions. Gross profit as a percentage of net sales for 2000 increased to 17.6% as compared to 17.1% for 1999. This increase was related primarily to margin improvements in the Terex truck and the utility aerial device businesses, driven by increased volumes and manufacturing efficiencies, and a full year of inclusion of companies acquired in 1999. In 2000, the Company recorded special charges of $10.1 million related to the closure of the Company’s distribution facility in the United Kingdom, the impact of an aggregates customer that filed for bankruptcy and the further integration of the Company’s mining division. In 1999, the Company recorded special charges of $9.9 million related to the closure of the Company's Milwaukee aerial work platform facility and head count reductions at O&K Mining. Excluding the special charges, gross margin was 18.1% in 2000 compared to 17.6% in 1999. Terex Lifting's gross profit increased $9.2 million, or 6.3%, to $155.2 million, compared to $146.0 million in 1999. Gross profit as a percentage of sales increased to 16.8% from 15.5% in 1999, due to product mix, the impact of companies acquired in 1999 and the effect of the 1999 special charges for the closure of the Company’s Milwaukee aerial work platform facility. Excluding the 1999 special charges, the gross profit percentage for 1999 was 16.5%. Terex Earthmoving's gross profit increased $37.1 million, or 22.6%, to $201.1 million, compared to $164.0 million in 1999. The decrease in gross profit as a percentage of sales, 18.3% compared to 18.7% in 1999, is primarily related to the special charges noted above. Excluding special charges, gross profit as a percentage of sales increased to 19.2% as a result of margin improvements in the Terex truck business and a full year of inclusion of companies acquired in 1999. Gross profit for Other increased to $7.3 million in 2000 from $6.7 million in 1999 primarily due to the increased sales from the businesses acquired in 2000 and 1999. Selling, General and Administrative Expenses Selling, general and administrative expenses (which include the Company's research and development expenses) increased to $165.3 million in 2000 from $138.4 million for 1999, reflecting the effects of a full year of inclusion of the companies acquired in 1999 and the special charges recorded during the year. In 2000, the Company recorded special charges of $2.7 million related to the closure of the Company’s distribution facility in the United Kingdom, the further integration of the Company’s mining division and due diligence costs associated with a large potential acquisition which did not come to fruition, offset partially by a curtailment gain related to one of the Company’s pension plans. In 1999, the Company recorded special items of ($1.4) million related to headcount reductions at the Company’s manufacturing facility in Germany, offset by a favorable legal

- 3 -
settlement. As a percentage of sales, selling, general and administrative expenses increased to 8.0% in 2000 from 7.5% in 1999. Terex Lifting's selling, general and administrative expenses increased to $60.4 million from $59.6 million in 1999, due to a full year of inclusion of companies acquired in 1999 and additional investments in sales and marketing support. Selling, general and administrative expenses as a percentage of sales increased to 6.5% from 6.3% in 1999. Excluding the impact of acquisitions, selling, general and administrative expenses as a percentage of sales decreased to 6.0% from 6.2% in 1999. Terex Earthmoving's selling, general and administrative expenses increased $20.0 million to $96.5 million for 2000 as compared to $76.5 million in 1999. This increase is primarily due to the effect of acquired companies and the special charges noted above. As a percentage of sales, however, selling, general and administrative expenses increased slightly to 8.8% in 2000 from 8.7% in 1999. Selling, general and administrative expenses for Other increased to $8.4 million in 2000 as compared to $2.3 million in 1999. The increase in 2000 is primarily the result of the inclusion of Coleman in 2000 and of Amida and Bartell for all of 2000, the special charges noted above and the Company’s investment in its new EarthKing subsidiary, an independent e-commerce company that will provide new tools for equipment owners and operators to maximize their return on investment. In 1999, selling, general and administrative expenses were lower due to the effect of a favorable legal settlement to the Company during the fourth quarter of 1999. See "Business--Research and Development" for a discussion of the Company's engineering expenses. Income from Operations Income from operations for the Company increased $20.0 million, or 11.2%, to $198.3 million, compared to $178.3 million in 1999. Income from operations as a percentage of sales remained at 9.6% in 2000 and 1999. Excluding the special charges, income from operations as a percentage of sales was 10.2% in 2000 as compared to 10.1% in 1999. Terex Lifting's income from operations increased $8.4 million, or 9.7%, to $94.8 million, as compared to $86.4 million in 1999. The increase can be attributed to the contributions from acquired companies in 1999 and the performance of the Company's utility aerial devices business, offset somewhat by a decline in the hydraulic mobile crane business. Included in income from operations in 1999 were special charges related to the closing of the Company's Milwaukee facility. Income from operations as a percentage of sales, excluding the special charges, increased to 10.3% in 2000 from 10.2% in 1999. Terex Earthmoving's income from operations increased $17.1 million, or 19.5%, to $104.6 million, compared to $87.5 million in 1999. As a percentage of sales, income from operations decreased to 9.5% from 10.0% in 1999. Excluding special charges, operating margin improved to 10.4% in 2000 from 10.2% in 1999. Income from operations for Other decreased $5.5 million in 2000 to an operating loss of $1.1 million, compared to income of $4.4 million in 1999. This decrease was a result of the impact in 2000 of due diligence costs associated with a large potential acquisition which did not come to fruition and the Company’s investment in EarthKing, partially offset by the inclusion of the Amida, Bartell and Coleman acquisitions for all or a portion of 2000. Further, the 1999 results benefited from the one-time impact of a favorable legal settlement. Interest Expense Net interest expense increased to $94.3 million for 2000 from $77.5 million in 1999 as a result of higher average debt levels due to debt incurred to finance the 1999 acquisitions as well as higher interest rates. Income Taxes During 2000, the Company recognized an income tax expense of $55.7 million as compared to an income tax benefit of $74.5 million in 1999. During the fourth quarter of 1999, the Company announced the resolution of an IRS audit, which started in December 1994, regarding its income tax returns for the years 1987 through 1989. The resolution of this audit did not require payment of tax. The 1999 income tax benefit resulted from the capitalization of certain deferred taxes. See Note J – “Income Taxes” in the Notes to the Consolidated Financial Statements. Loss from Discontinued Operations In connection with the Company’s sale of the Clark material handling business to CMHC in November 1996, CMHC assumed liabilities from Terex arising from product liability claims dealing with Clark material handling products manufactured prior to the date of the divestiture. In connection with CMHC’s voluntary filing for bankruptcy in 2000, CMHC has defaulted on its obligations to indemnify and defend the Company from such product liability claims. As a result of this situation, the Company recorded an expense of $7.3 million, net of income taxes, in the fourth quarter of 2000 representing the Company’s estimated liability for known product liability claims.

- 4 -
Extraordinary Items During 2000, the Company recorded a charge of $1.5 million, net of income taxes, to recognize a loss on the early extinguishment of debt in connection with the prepayment of principal of the Company's bank credit facilities. 1999 Compared with 1998 The table below is a comparison of net sales, gross profit, selling, general and administrative expenses and income (loss) from operations, by segment, for 1999 and 1998.
Year Ended December 31,
Increase
1999 1998 (Decrease) (in millions of dollars) NET SALES Terex Lifting.............................................................................................. $ 944.9 $ 770.9 $ 174.0 Terex Earthmoving................................................................................... 878.9 456.4 422.5 Other.......................................................................................................... 32.8 5.9 26.9 Total........................................................................................................ $ 1,856.6 $ 1,233.2 $ 623.4
GROSS PROFIT
Terex Lifting.............................................................................................. $ 146.0 $ 128.5 $ 17.5 Terex Earthmoving................................................................................... 164.0 96.5 67.5 Other.......................................................................................................... 6.7 0.8 5.9 Total........................................................................................................ $ 316.7 $ 225.8 $ 90.9
SELLING, GENERAL AND ADMINISTRATIVE EXPENSES
Terex Lifting.............................................................................................. $ 59.6 $ 46.4 $ 13.2 Terex Earthmoving................................................................................... 76.5 54.8 21.7 Other.......................................................................................................... 2.3 2.6 (0.3) Total........................................................................................................ $ 138.4 $ 103.8 $ 34.6
INCOME FROM OPERATIONS
Terex Lifting.............................................................................................. $ 86.4 $ 82.1 $ 4.3 Terex Earthmoving................................................................................... 87.5 41.7 45.8 Other.......................................................................................................... 4.4 (1.8) 6.2 Total........................................................................................................ $ 178.3 $ 122.0 $ 56.3
Net Sales Sales increased $623.4 million, or approximately 51%, to $1,856.6 million in 1999 from $1,233.2 million in 1998. Internally generated growth represented approximately $234.0 million, or 38%, of this revenue increase while acquired companies contributed approximately $389.0 million, or 62%. Terex Lifting's sales were $944.9 million for 1999, an increase of $174.0 million, or 23%, from $770.9 million in 1998, which was driven primarily from contributions of acquired companies. Internal growth of approximately $25 million represents strong performances by the Company's utility aerial devices and material handling businesses, which reported sales increases of 38% and 51% respectively, partially offset by declines in the hydraulic mobile crane and U.S. aerials businesses. Machine sales increased $138.1 million to $795.0 million while part sales increased $14.9 million to $96.5 million. Terex Lifting's backlog decreased $54.8 million to $167.0 million attributable primarily to a decline in the hydraulic mobile crane business, offset partially by the backlog of businesses acquired in 1999. Terex Earthmoving's sales were $878.9 million in 1999, an increase of $422.5 million, or 93%, from $456.4 million in 1998, which was split evenly between internal growth and contributions from acquired companies. Internal growth was driven by strong performances at the Company's surface mining truck business, which generated over $300 million in sales in 1999, and the Company's Terex truck business, which reported an increase in sales of 18% from 1998. Machine sales increased $354.5 million to $644.1 million while part sales increased $56.7 million to $200.4 million. Backlog decreased to $158.3 million at December 31,
- 5 -
1999 from $196.4 million at December 31, 1998 primarily from the completion of the $157 million order for 160 trucks from Coal India, partially offset by the backlog of business acquired in 1999. Net sales for Other in 1999 represent sales from Amida, Bartell and service revenues generated by Terex's parts distribution center for services provided to a third party. Amida and Bartell were acquired by Terex on April 1, 1999 and September 20, 1999, respectively. In 1998, net sales consisted of service revenues generated by Terex's parts distribution center. Gross Profit Gross profit for 1999 increased $90.9 million to $316.7 million as a result of acquisitions, internally generated growth and the execution and completion of the Coal India order during 1999. Gross profit as a percentage of net sales for 1999 decreased to 17.1% as compared to 18.3% for 1998. This decrease was primarily due to the product mix, as machine sales as a percent of total sales increased during the year, and special charges related to the closure of the Comp any's Milwaukee aerial work platform facility. Terex Lifting's gross profit increased $17.5 million, or 14%, to $146.0 million, compared to $128.5 million in 1998. Gross profit as a percentage of sales decreased to 15.5% from 16.7% in 1998, due to product mix and the special charges mentioned above. Excluding the special charge, the gross profit percentage for 1999 was 16.5%. Terex Earthmoving's gross profit increased $67.5 million, or 70%, to $164.0 million, compared to $96.5 million in 1998. The decrease in gross profit as a percentage of sales, 18.7% compared to 21.1% in 1998, is primarily related to product mix as new machine sales represented 71.6% of total sales in 1999 compared to 60.3% in 1998. Selling, General and Administrative Expenses Selling, general and administrative expenses (which include the Company's research and development expenses) increased to $138.4 million in 1999 from $103.8 million for 1998, reflecting the effects of the companies acquired in 1999 and 1998. As a percentage of sales, however, selling, general and administrative expenses decreased to 7.5% in 1999 from 8.4% in 1998. Terex Lifting's selling, general and administrative expenses increased to $59.6 million from $46.4 million in 1998, reflecting the impact of acquired companies. Selling, general and administrative expenses as a percentage of sales increased to 6.3% from 6.0% in 1998. Excluding the impact of acquisitions, selling, general and administrative expenses as a percentage of sales remained constant at 6.0%. Terex Earthmoving's selling, general and administrative expenses increased $21.7 million to $76.5 million for 1999 primarily due to the effect of acquired companies and the cost of a headcount reduction at the Company's manufacturing facility in Germany. As a percentage of sales, however, selling, general and administrative expenses decreased to 8.7% in 1999 from 12.0% in 1998. Excluding the special charge, selling, general and administrative expense as a percentage of sales was 8.5% for 1999. Selling, general and administrative expenses for Other decreased slightly to $2.3 million in 1999 as compared to $2.6 million in 1998. The decrease is the result of a favorable legal settlement to the Company during the fourth quarter of 1999, partially offset by the inclusion of the Amida and Bartell acquisitions. See "Business--Research and Development" for a discussion of the Company's engineering expenses. Income from Operations Income from operations for the Company increased $56.3 million, or 46%, to $178.3 million, compared to $122.0 million in 1998. Income from operations as a percentage of sales decreased to 9.6% compared to 9.9% in 1998. Excluding the special charges, income from operations as a percentage of sales was 10.1%. Terex Lifting's income from operations increased $4.3 million, or 5%, to $86.4 million, as compared to $82.1 million in 1998. The increase can be attributed to the contributions from acquired companies, strong performances by the Company's utility aerial devices and material handling businesses offset by a decline in hydraulic mobile crane business and special charges related to closing of the Company's Milwaukee facility. Income from operations as a percentage of sales decreased to 9.1% in 1999 from 10.7% in 1998. Excluding the special charges, income from operations as a percentage of sales was 10.2% in 1999. Terex Earthmoving's income from operations increased $45.8 million, or 110%, to $87.5 million, compared to $41.7 million in 1998. As a percentage of sales, income from operations increased to 10.0% from 9.1% in 1998. The increase in both dollars

- 6 -
and as a percentage is driven primarily by acquisitions, internally generated growth and continuing cost control efforts. Income from operations for Other increased $6.2 million as a result of the inclusion of the Amida and Bartell acquisitions and the impact of a favorable legal settlement. Interest Expense Net interest expense increased to $77.5 million for 1999 from $44.5 million in 1998 as a result of higher average debt levels due to the 1999 acquisitions and $7.7 million of interest related to the Company's settlement of its IRS audit. (See Note J – “Income Taxes” in the Notes to the Consolidated Financial Statements). Income Taxes During 1999, the Company recognized an income tax benefit of $74.5 million as compared to an income tax expense of $1.7 million in 1998. During the fourth quarter of 1999, the Company announced the resolution of an IRS audit, which started in December 1994, regarding its income tax returns for the years 1987 through 1989. The resolution of this audit did not require payment of tax. This net tax benefit resulted from the capitalization of deferred taxes. (See Note J – “Income Taxes” in the Notes to the Consolidated Financial Statements). Extraordinary Items During 1998, the Company recorded a charge of $38.3 million to recognize a loss on the early extinguishment of debt in connection with the redemption of $166.7 million of its 13-¼% Senior Secured Notes (the "Senior Secured Notes") and the refinancing of the Company's bank credit facilities. LIQUIDITY AND CAPITAL RESOURCES Net cash of $200.6 million was provided by operating activities during the year ended December 31, 2000, approximately $120 million of which was provided by reductions in working capital. Net cash provided by investing activities was $110.9 million during the year ended December 31, 2000, primarily related to the receipt of $144 million in proceeds from the sale of the Company’s truck-mounted forklift businesses in September 2000. Net cash used in financing activities was $261.2 million during the year ended December 31, 2000. As described below, cash was used to repay debt (approximately $241 million) and purchase shares of the Company’s common stock (approximately $20 million). Cash and cash equivalents totaled $181.4 million at December 31, 2000. Including the January 2001 acquisition of the Jaques Group and the 2000 acquisitions of Fermec and Coleman (see Note B --"Acquisitions" in the Notes to the Consolidated Financial Statements), since the beginning of 1995 Terex has invested approximately $1 billion to strengthen and expand its core businesses through more than 20 strategic acquisitions. Terex expects that acquisitions and new product development will continue to be important components of its growth strategy and is continually reviewing acquisition opportunities. The Company will continue to pursue strategic acquisitions, some of which could individually or in the aggregate be material, which complement the Company’s core operations and offer cost reduction opportunities, distribution and purchasing synergies and product diversification. Debt reduction and an improved capital structure are major focal points for the Company. In the first quarter of 2000, the Company announced its intention to repay $200 million of debt by the end of 2000 from working capital reduction and free cash flow. During 2000, the Company met these goals by repaying approximately $241 million of its debt. On March 9, 2000, the Company also announced that its Board of Directors had authorized the repurchase of up to 2 million shares of the Company’s common stock over the next 12 months from cash on hand. During 2000, the Company purchased 1.3 million shares of its common stock. In addition, the Company regularly reviews its alternatives to improve its capital structure and to reduce debt service through debt refinancings, issuance of equity, asset sales, including strategic dispositions of business units, or any combination thereof. The Company's businesses are working capital intensive and require funding for purchases of production and replacement parts inventories, capital expenditures for repair, replacement and upgrading of existing facilities, as well as financing of receivables from customers and dealers. The Company has significant debt service requirements including semi-annual interest payments on its 8-7/8% senior subordinated notes and monthly interest payments on the Company’s bank credit facilities. Management believes that cash generated from operations, together with the Company’s bank credit facilities and cash on hand, provides the Company with adequate liquidity to meet the Company's operating and debt service requirements. No principal payments are required under the Company’s bank facility or subordinated notes until June 2003.

- 7 -
The Company continues to explore ways to improve its liquidity and capital structure. In this regard, the Company announced on March 14, 2001 that it intends to issue approximately $200 million principal amount of Senior Subordinated Notes Due 2011 (“New Notes”) and increase the availability under its existing revolving bank credit facility maturing March 2004 from $125 million to $300 million. The Company also announced at that time that it is negotiating an amendment to its existing bank credit agreements to provide the Company with greater operating flexibility. The Company intends to use the net proceeds from the offering of the New Notes to prepay a portion of its existing term loans. It is intended that the Company will offer the New Notes pursuant to Rule 144A promulgated under the Securities Act of 1933, as amended (the “Act”), and that the New Notes will not initially be registered under the Act. Accordingly, the New Notes will not be able to be offered or sold in the United States absent registration under the Act or an applicable exemption from the registration requirements. There can be no assurances as to whether these transactions, or any other financing transaction, will occur, or as to the timing or definitive terms of any such transaction. CONTINGENCIES AND UNCERTAINIES Clark Material Handling Company In connection with the Company’s sale of the Clark material handling business to CMHC in November 1996, CMHC assumed liabilities from Terex arising from product liability claims dealing with Clark material handling products manufactured prior to the date of the divestiture. In connection with CMHC’s voluntary filing for bankruptcy in 2000, CMHC has defaulted on its obligations to indemnify and defend the Company from such product liability claims. As a result of this situation, the Company recorded an expense of $7.3 million, net of income taxes, in the fourth quarter of 2000 representing the Company’s estimated liability for known product liability claims. Euro Currently, 12 of the 15 member countries of the European Union have established fixed conversion rates between their existing currencies (“legacy currencies”) and one common currency, the euro. The euro now trades on currency exchanges and may be used in business transactions. Beginning in January 2002, new euro-denominated bills and coins will be issued, and legacy currencies will be withdrawn from circulation. The Company’s operating subsidiaries affected by the euro conversion are assessing the systems and business issues raised by the euro currency conversion. These issues include, among others, (1) the need to adapt computer and other business systems and equipment to accommodate euro-denominated transaction and (2) the competitive impact of cross-border price transparency, which may make it more difficult for businesses to charge different prices for the same products on a country-by-country basis, particularly once the euro currency is issued in 2002. The Company believes that the euro conversion has not and will not have a material adverse impact on its financial condition or results of operations. Foreign Currencies and Interest Rate Risk The Company's products are sold in over 100 countries around the world and, accordingly, revenues of the Company are generated in foreign currencies, while the costs associated with those revenues are only partly incurred in the same currencies. The major foreign currencies, among others, in which the Company does business are the Euro, the British Pound, the French Franc, the German Mark, the Irish Punt, the Italian Lira and the Australian Dollar. The Company may, from time to time, hedge specifically identified committed cash flows in foreign currencies using forward currency sale or purchase contracts. Such foreign currency contracts have not historically been material in amount. Because certain of the Company's obligations, including indebtedness under the Company’s bank credit facility, will bear interest at floating rates, an increase in interest rates could adversely affect, among other things, the results of operations of the Company. The Company has entered into interest protection arrangements with respect to approximately $257 million of the principal amount of its indebtedness under its bank credit facility fixing interest at various rates between 5.44% and 9.66%. In June 1998, the Financial Accounting Standards Board issued Statement of Financial Accounting Standards (“SFAS”) No. 133, “Accounting for Derivative Instruments and Hedging Activities,” which establishes a new model for accounting for derivative and hedging activities and supersedes and amends a number of existing standards. Upon initial application, all derivatives are required to be recognized in the statement of financial position as either assets or liabilities and measured at fair value. Changes in the fair value of derivatives are recorded each period in current earnings or other comprehensive income, depending on whether a derivative is designated as part of a hedge transaction and, if it is, the type of hedge transaction. In addition, all hedging relationships must be reassessed and documented pursuant to the provisions of SFAS No. 133. SFAS No. 133 is effective for the Company beginning in 2001. Upon adoption of this statement on January 1, 2001, the Company did

- 8 -
not experience a significant impact on its financial position or results of operations. Forward-Looking Information Certain information in this Annual Report includes forward looking statements regarding future events or the future financial performance of the Company that involve certain contingencies and uncertainties, including those discussed above in the section entitled "Contingencies and Uncertainties". In addition, when included in this Annual Report or in documents incorporated herein by reference, the words "may," "expects," "intends," "anticipates," "plans," "projects," "estimates" and the negatives thereof and analogous or similar expressions are intended to identify forward-looking statements. However, the absence of these words does not mean that the statement is not forward-looking. The Company has based these forward-looking statements on current expectations and projections about future events. These statements are not guarantees of future performance. Such statements are inherently subject to a variety of risks and uncertainties that could cause actual results to differ materially from those reflected in such forward-looking statements. Such risks and uncertainties, many of which are beyond the Company's control, include, among others: competitive pressures and adverse economic conditions are more likely to have a negative effect on the Company’s business, the sensitivity of construction and mining activity to interest rates, government spending and general economic conditions; the ability to successfully integrate acquired businesses; the retention of key management personnel; foreign currency fluctuations; the Company’s businesses are very competitive and may be affected by pricing, product initiatives and other actions taken by competitors; the effects of changes in laws and regulations; the Company’s business is international in nature and is subject to exchange rates between currencies, as well as international politics; the ability of suppliers to timely supply parts and components at competitive prices and the Company’s ability to timely manufacture and deliver products to customers; compliance with the restrictive covenants contained in the Company’s debt agreements; continued use of net operating loss carryovers; compliance with applicable environmental laws and regulations; and other factors. Actual events or the actual future results of the Company may differ materially from any forward looking statement due to these and other risks, uncertainties and significant factors. The forward-looking statements contained herein speak only as of the date of this Annual Report and the forward-looking statements contained in documents incorporated herein by reference speak only as of the date of the respective documents. The Company expressly disclaims any obligation or undertaking to release publicly any updates or revisions to any forward-looking statement contained or incorporated by reference in this Annual Report to reflect any change in the Company's expectations with regard thereto or any change in events, conditions or circumstances on which any such statement is based. ITEM 7A. QUANTITATIVE AND QUALITATIVE DISCLOSURES ABOUT MARKET RISK The Company is exposed to certain market risks which exist as part of its ongoing business operations and the Company uses derivative financial instruments, where appropriate, to manage these risks. The Company, as a matter of policy, does not engage in trading or speculative transactions. See Note A – “Significant Accounting Policies” in the Notes to the Consolidated Financial Statements for further information on accounting policies related to derivative financial statements. Foreign Exchange Risk The Company is exposed to fluctuations in foreign currency cash flows related to third party purchases and sales, intercompany product shipments and intercompany loans. The Company is also exposed to fluctuations in the value of foreign currency investments in subsidiaries and cash flows related to repatriation of these investments. Additionally, the Company is exposed to volatility in the translation of foreign currency earnings to U.S. Dollars. Primary exposures include the U.S. Dollars versus functional currencies of the Comp any’s major markets which include the Euro, the British Pound, the German Mark, the French Franc, the Irish Punt, the Italian Lira and the Australian Dollar. The Company assesses foreign currency risk based on transactional cash flows and identifies naturally offsetting positions and purchases hedging instruments to protect anticipated exposures. At December 31, 2000, the Company had foreign exchange contracts with a notional value of $20.3 million. The fair market value of these arrangements, which represents the cost to settle these contracts, was an asset of approximately $1.3 million at December 31, 2000.

- 9 -
Interest Rate Risk The Company is exposed to interest rate volatility with regard to future issuances of fixed rate debt and existing issuances of variable rate debt. Primary exposure includes movements in the U.S. prime rate and London Interbank Offer Rate ("LIBOR"). The Company uses interest rate swaps to reduce interest rate volatility. At December 31, 2000, the Company had approximately $257 million of interest rate swaps fixing interest rates between 5.44% and 9.66%. The fair market value of these arrangements, which represents the cost to settle these contracts, was a liability of approximately $0.4 million at December 31, 2000. At December 31, 2000, the Company performed a sensitivity analysis for the Company’s derivatives and other financial instruments that have interest rate risk. The Company calculated the pretax earnings effect on its interest sensitive instruments. Based on this sensitivity analysis, the Company has determined that an increase of 10% in the Company’s weighted average interest rates at December 31, 2000 would have increased interest expense by approximately $4 million in 2000. ITEM 8. FINANCIAL STATEMENTS AND SUPPLEMENTARY DATA Unaudited Quarterly Financial Data Summarized quarterly financial data for 2000 and 1999 are as follows (in millions, except per share amounts): 2000 1999 Fourth Third Second First Fourth Third Second First Net sales $ 446.6 $ 475.1 $ 593.5 $ 553.5 $ 489.6 $ 495.6 $ 448.1 $ 423.3 Gross profit 73.6 86.7 106.6 96.7 80.6 88.5 76.7 70.9 Income before extraordinary items 0.8 49.7 26.0 20.1 86.6 29.9 30.4 26.0 Net income (loss) (0.7) 49.7 26.0 20.1 86.6 29.9 30.4 26.0 Per share: Basic Income before extraordinary items $ 0.03 $ 1.84 $ 0.95 $ 0.73 $ 3.15 $ 1.12 $ 1.40 $ 1.25 Net income (loss) (0.03) 1.84 0.95 0.73 3.15 1.12 1.40 1.25 Diluted Income before extraordinary items $ 0.03 $ 1.79 $ 0.93 $ 0.71 $ 3.04 $ 1.07 $ 1.30 $ 1.16 Net income (loss) (0.03) 1.79 0.93 0.71 3.04 1.07 1.30 1.16 The accompanying unaudited quarterly financial data of the Company have been prepared in accordance with generally accepted accounting principles for interim financial information and with Item 302 of Regulation S-K. In the opinion of management, all adjustments considered necessary for a fair presentation have been made and were of a normal recurring nature except for those discussed below. During the fourth quarter of 2000, the Company recorded expenses of $9.8 million related to the closing of its distribution facility in the United Kingdom, the impact of an aggregates customer that filed for bankruptcy and a one-time charge related to due diligence costs associated with a large potential acquisition which did not come to fruition. These expenses have been included in cost of sales and selling, general and administrative expenses in the statement of income in the amounts of $6.9 million and $2.9 million, respectively. Also in the fourth quarter of 2000, the Company recorded a loss from discontinued operations of $7.3 million, net of income taxes, representing the Company’s estimated liability for known product liability claims dealing with Clark material handling products manufactured prior to November 1996. See Item 3. “Legal Proceedings” During the third quarter of 2000, the Company recorded expenses of $3.0 related to the further integration of the Company’s surface mining truck and hydraulic shovel business, partially offset by a curtailment gain recorded for one of the Company’s pension plans. These items have been reflected in cost of sales and selling, general and administrative expenses in the statement of income in the amounts of $3.2 million and $(0.2) million, respectively. Also in the third quarter of 2000, the Company completed the sale of its truck-mounted forklift business for a gain of $57.2 million before income taxes. (See Note C – “Sale of Businesses” to the Notes to the Consolidated Financial Statements.)

- 10 -
During the fourth quarter of 1999, the Company announced the resolution of an IRS audit, which started in December 1994, regarding its income tax returns for the years 1987 through 1989. The resolution of this audit did not require payment of tax. This net tax benefit resulted from the capitalization of the deferred taxes. (See Note J – “Income Taxes” to the Notes to the Consolidated Financial Statements.) Also in the fourth quarter of 1999, the Company announced the closing of its aerial work platform scissor lift manufacturing plant in Milwaukee, Wisconsin. As a result of this action the Company had a one-time charge of $9.9 million related to the impairment of goodwill and certain closure costs. These costs have been included in cost of sales in the statement of income. Furthermore, in the fourth quarter of 1999, the Company recorded income of $1.4 million related to a favorable legal settlement partially offset by the cost of a headcount reduction at its manufacturing facility in Germany. These items have been reflected in selling, general and administrative expenses in the statement of income. Extraordinary Items In the fourth quarter of 2000, the Company recognized an extraordinary loss on the early extinguishment of debt ($1.5 million) in connection with the prepayment of principal on its existing credit facility. ITEM 9. CHANGES IN AND DISAGREEMENTS WITH ACCOUNTANTS ON ACCOUNTING AND FINANCIAL DISCLOSURE Not applicable.
PART III
ITEM 10. DIRECTORS AND EXECUTIVE OFFICERS OF THE REGISTRANT ITEM 11. EXECUTIVE COMPENSATION ITEM 12. SECURITY OWNERSHIP OF CERTAIN BENEFICIAL OWNERS AND MANAGEMENT ITEM 13. CERTAIN RELATIONSHIPS AND RELATED TRANSACTIONS The information required by Items 10 through 13 is incorporated by reference to the definitive Terex Corporation Proxy Statement to be filed with the Securities and Exchange Commission not later than 120 days after the end of the fiscal year covered by this Annual Report on Form 10-K.
PART IV
ITEM 14. EXHIBITS, FINANCIAL STATEMENT SCHEDULES AND REPORTS ON FORM 8-K (a) (1) and (2) Financial Statements and Financial Statement Schedules. See "Index to Consolidated Financial Statements and Financial Statement Schedule" on Page F-1. (3) Exhibits See "Exhibit Index" on Page E-1. (b) Reports on Form 8-K During the quarter ended December 31, 2000, the Company filed the following Current Report on Form 8-K: − A report on Form 8-K dated September 30, 2000 was filed on October 4, 2000, announcing the completion of the sale of the
Company’s truck-mounted forklift businesses to subsidiaries of Partek Corporation.

- 11 -
SIGNATURES
Pursuant to the requirements of Section 13 or 15(d) of the Securities Exchange Act of 1934, the registrant has duly caused this report to be signed on its behalf by the undersigned, thereunto duly authorized. TEREX CORPORATION By: /s/ Ronald M. DeFeo March 21, 2001 Ronald M. DeFeo, Chairman, Chief Executive Officer and Director Pursuant to the requirements of the Securities Exchange Act of 1934, this report has been signed below by the following persons on behalf of the registrant and in the capacities and on the dates indicated. Name Title Date /s/ Ronald M. DeFeo Chairman, Chief Executive Officer, March 21, 2001 Ronald M. DeFeo and Director (Principal Executive Officer) /s/ Joseph F. Apuzzo Chief Financial Officer March 21, 2001 Joseph F. Apuzzo (Principal Financial Officer) /s/ Kevin M. O'Reilly Controller March 21, 2001 Kevin M. O'Reilly (Principal Accounting Officer) /s/ G. Chris Andersen Director March 21, 2001 G. Chris Andersen /s/ Don DeFosset Director March 21, 2001 Don DeFosset /s/ Donald P. Jacobs Director March 21, 2001 Donald P. Jacobs /s/ William H. Fike Director March 21, 2001 William H. Fike /s/ Marvin B. Rosenberg Director March 21, 2001 Marvin B. Rosenberg /s/ David A. Sachs Director March 21, 2001 David A. Sachs

- 12 -
THIS PAGE IS INTENTIONALLY BLANK
NEXT PAGE IS NUMBERED "F-1"

F - 1
TEREX CORPORATION AND SUBSIDIARIES
Index to Consolidated Financial Statements and Financial Statement Schedule
Page TEREX CORPORATION
CONSOLIDATED FINANCIAL STATEMENTS AS OF DECEMBER 31, 2000 AND 1999 AND FOR EACH OF THE THREE YEARS
IN THE PERIOD ENDED DECEMBER 31, 2000 Report of independent accountants .................................................................................................................F - 2 Consolidated statement of income ..................................................................................................................F - 3 Consolidated balance sheet...............................................................................................................................F - 4 Consolidated statement of changes in stockholders' equity........................................................................F - 5 Consolidated statement of cash flows .............................................................................................................F - 6 Notes to consolidated financial statements ....................................................................................................F - 7
PPM CRANES, INC.
CONSOLIDATED FINANCIAL STATEMENTS AS OF DECEMBER 31, 2000 AND 1999 AND FOR EACH OF THE THREE YEARS
IN THE PERIOD ENDED DECEMBER 31, 2000 Report of independent accountants ................................................................................................................. F - 37 Consolidated statement of operations............................................................................................................. F - 38 Consolidated balance sheet............................................................................................................................... F - 39 Consolidated statement of changes in shareholders’ deficit ....................................................................... F - 40 Consolidated statement of cash flows ............................................................................................................. F - 41 Notes to consolidated financial statements .................................................................................................... F - 42
FINANCIAL STATEMENT SCHEDULE Schedule II -- Valuation and Qualifying Accounts and Reserves ...............................................................F - 49 All other schedules for which provision is made in the applicable regulations of the Securities and Exchange Commission are not required under the related instructions or are not applicable, and therefore have been omitted.

F - 2
REPORT OF INDEPENDENT ACCOUNTANTS
To the Board of Directors and Stockholders of Terex Corporation In our opinion, the Terex Corporation consolidated financial statements listed in the accompanying index on page F-1 present fairly, in all material respects, the financial position of Terex Corporation and its subsidiaries (the "Company") at December 31, 2000 and 1999, and the results of their operations and their cash flows for each of the three years in the period ended December 31, 2000, in conformity with accounting principles generally accepted in the United States of America. In addition, in our opinion, the financial statement schedule listed in the accompanying index on page F-1 presents fairly, in all material respects, the information set forth therein when read in conjunction with the related consolidated financial statements. These financial statements and financial statement schedule are the responsibility of the Company's management; our responsibility is to express an opinion on these financial statements and financial statement schedule based on our audits. We conducted our audits of these statements in accordance with auditing standards generally accepted in the United States of America, which require that we plan and perform the audit to obtain reasonable assurance about whether the financial statements are free of material misstatement. An audit includes examining, on a test basis, evidence supporting the amounts and disclosures in the financial statements, assessing the accounting principles used and significant estimates made by management, and evaluating the overall financial statement presentation. We believe that our audits provide a reasonable basis for our opinion. PricewaterhouseCoopers LLP Stamford, Connecticut February 19, 2001

F - 3
TEREX CORPORATION AND SUBSIDIARIES CONSOLIDATED STATEMENT OF INCOME
(in millions, except per share amounts)
Year Ended December 31, 2000 1999 1998 NET SALES................................................................................................................................ $ 2,068.7 $ 1,856.6 $ 1,233.2
COST OF GOODS SOLD.......................................................................................................... 1,705.1 1,539.9 1,007.4
GROSS PROFIT ...................................................................................................................... 363.6 316.7 225.8
SELLING, GENERAL AND ADMINISTRATIVE EXPENSES ............................................ 165.3 138.4 103.8
INCOME FROM OPERATIONS.......................................................................................... 198.3 178.3 122.0
OTHER INCOME (EXPENSE) Interest income ....................................................................................................................... 5.5 5.3 2.7 Interest expense ..................................................................................................................... (99.8) (82.8) (47.2) Gain on sale of businesses ................................................................................................... 57.2 --- --- Amortization of debt issuance costs .................................................................................. (3.5) (2.6) (2.1) Other income (expense) - net................................................................................................ 1.9 0.2 (0.9)
INCOME FROM CONTINUING OPERATIONS BEFORE INCOME TAXES AND EXTRAORDINARY ITEMS............................................................................................ 159.6 98.4 74.5
(PROVISION FOR) BENEFIT FROM INCOME TAXES ..................................................... (55.7) 74.5 (1.7)
INCOME FROM CONTINUING OPERATIONS BEFORE EXTRAORDINARY ITEMS.........................................................................................................................................
103.9 172.9 72.8
LOSS FROM DISCONTINUED OPERATIONS.................................................................... (7.3) --- ---
INCOME BEFORE EXTRAORDINARY ITEMS.................................................................. 96.6 172.9 72.8
EXTRAORDINARY LOSS ON RETIREMENT OF DEBT................................................... (1.5) --- (38.3)
NET INCOME ........................................................................................................................ $ 95.1 $ 172.9 $ 34.5
PER COMMON SHARE:
Basic Income from continuing operations ................................................................................. $ 3.82 $ 7.14 $ 3.52 Loss from discontinued operations.................................................................................. (0.27) --- ---
Income before extraordinary items .................................................................................. 3.55 7.14 3.52 Extraordinary loss on retirement of debt.......................................................................... (0.05) --- (1.85)
Net income ......................................................................................................................... $ 3.50 $ 7.14 $ 1.67
Diluted Income from continuing operations ................................................................................. $ 3.72 $ 6.75 $ 3.25 Loss from discontinued operations.................................................................................. (0.26) --- ---
Income before extraordinary items .................................................................................. 3.46 6.75 3.25 Extraordinary loss on retirement of debt.......................................................................... (0.05) --- (1.71)
Net income.......................................................................................................................... $ 3.41 $ 6.75 $ 1.54
WEIGHTED AVERAGE NUMBER OF SHARES OUTSTANDING IN PER SHARE CALCULATION:
Basic ............................................................................................................................... 27.2 24.2 20.7 Diluted............................................................................................................................ 27.9 25.6 22.4
The accompanying notes are an integral part of these financial statements.

F - 4
TEREX CORPORATION AND SUBSIDIARIES CONSOLIDATED BALANCE SHEET
(in millions, except par value)
December 31, 2000 1999
CURRENT ASSETS Cash and cash equivalents ........................................................................................................................ $ 181.4 $ 133.3 Trade receivables (less allowance of $6.3 and $5.8 as of December 31, 2000 and 1999, respectively)....................................................................................................................................................
360.2 429.2
Net inventories ............................................................................................................................................. 598.1 665.6 Deferred taxes ............................................................................................................................................... 51.0 47.2 Other current assets .................................................................................................................................... 51.7 40.0
Total Current Assets ................................................................................................................ 1,242.4 1,315.3
LONG-TERM ASSETS Property, plant and equipment - net ......................................................................................................... 153.9 172.8 Goodwill ........................................................................................................................................................ 491.4 554.7 Deferred taxes ............................................................................................................................................... 21.2 55.3 Other assets .................................................................................................................................................. 74.8 79.4
TOTAL ASSETS............................................................................................................................................. $ 1,983.7 $ 2,177.5
CURRENT LIABILITIES Notes payable and current portion of long-term debt ........................................................................... $ 20.5 $ 57.6 Trade accounts payable ............................................................................................................................. 311.2 297.0 Accrued compensation and benefits ........................................................................................................ 25.9 27.3 Accrued warranties and product liability................................................................................................. 65.2 55.9 Other current liabilities ................................................................................................................................ 152.8 141.7
Total Current Liabilities ............................................................................................................ 575.6 579.5
NON CURRENT LIABILITIES Long-term debt, less current portion ........................................................................................................ 882.0 1,098.8 Other.............................................................................................................................................................. 74.6 66.4 COMMITMENTS AND CONTINGENCIES STOCKHOLDERS' EQUITY Warrants to purchase common stock....................................................................................................... --- 0.8
Equity rights ................................................................................................................................................. 0.7 0.8 Common Stock, $0.01 par value -- authorized 150.0 shares; issued 27.9 and 27.5 shares at December 31, 2000 and 1999,
respectively .............................................................................................................................................. 0.3 0.3
Additional paid -in capital........................................................................................................................... 358.9 355.0 Retained earnings ........................................................................................................................................ 187.1 92.0 Accumulated other comprehensive income ............................................................................................ (78.5) (16.1) Less cost of shares of common stock in treasury (1.1 shares at December 31, 2000) ..................... (17.0) ---
Total Stockholders' Equity ......................................................................................................... 451.5 432.8
TOTAL LIABILITIES AND STOCKHOLDERS' EQUITY........................................................................ $ 1,983.7 $ 2,177.5
The accompanying notes are an integral part of these financial statements.

F - 5
TEREX CORPORATION AND SUBSIDIARIES CONSOLIDATED STATEMENT OF CHANGES IN STOCKHOLDERS' EQUITY
(in millions)
Warrants
Equity Rights
Common Stock
Additional Paid-in Capital
Retained Earnings (Accumu-
lated Deficit)
Accumulate
d Other Comprehen-sive Income
Common Stock in Treasury
Total
BALANCE AT DECEMBER 31, 1997.......
$
0.8
$
3.2
$
0.2
$
178.7
$
(115.4)
$
(7.9)
$
---
$
59.6
Net Income .......................... --- --- --- --- 34.5 --- --- 34.5 Other Comprehensive
Income:
Translation adjustment . --- --- --- --- --- 3.8 --- 3.8
Comprehensive Income .... --- 38.3
Issuance of Common Stock..........................................
--- --- --- 0.8 --- --- --- 0.8
Exercise of Equity Rights .. --- (0.1) --- (0.5) --- --- --- (0.6)
BALANCE AT DECEMBER 31, 1998.......
0.8
3.1
0.2
179.0
(80.9)
(4.1)
---
98.1
Net Income .......................... --- --- --- --- 172.9 --- --- 172.9 Other Comprehensive
Income:
Translation adjustment . --- --- --- --- --- (13.3) --- (13.3) Pension liability
adjustment --- --- --- --- --- 1.3 --- 1.3
Comprehensive Income .... 160.9
Exercise of Equity Rights .. --- (2.3) --- 1.6 --- --- --- (0.7) Issuance of Common Stock
.......................................... --- --- 0.1 174.4 --- --- --- 174.5
BALANCE AT DECEMBER 31, 1999.......
0.8
0.8
0.3
355.0
92.0
(16.1)
---
432.8
Net Income .......................... --- --- --- --- 95.1 --- --- 95.1 Other Comprehensive
Income:
Translation adjustment . --- --- --- --- --- (62.6) --- (62.6) Pension liability
adjustment --- --- --- --- --- 0.2 --- 0.2
Comprehensive Income .... 32.7
Exercise of Equity Rights .. --- (0.1) --- (0.1) --- --- --- (0.2) Issuance of Common Stock
.......................................... --- --- --- 3.0 --- --- --- 3.0
Exercise of Warrants ......... (0.8) --- --- 0.8 --- --- --- --- Acquisition of Businesses
.......................................... --- --- --- 0.2 --- --- 3.2 3.4
Acquisition of Treasury Shares
--- --- --- --- --- --- (20.2) (20.2)
BALANCE AT
DECEMBER 31, 2000..... $
---
$
0.7
$
0.3
$
358.9
$
187.1
$
(78.5)
$
(17.0)
$
451.5

F - 6
The accompanying notes are an integral part of these financial statements.

F - 7
TEREX CORPORATION AND SUBSIDIARIES CONSOLIDATED STATEMENT OF CASH FLOWS
(in millions)
Year Ended December 31, 2000 1999 1998
OPERATING ACTIVITIES Net income ................................................................................................................. $ 95.1 $ 172.9 $ 34.5 Adjustments to reconcile net income to cash provided by (used in) operating activities:
Depreciation ......................................................................................................... 23.0 17.6 10.1 Amortization ......................................................................................................... 18.5 14.6 8.3 Gain on sale of businesses ................................................................................. (34.2) --- --- Deferred taxes ....................................................................................................... 33.5 (82.8) --- Extraordinary loss on retirement of debt .......................................................... 1.5 --- 38.3 Loss from discontinued operations.................................................................. 7.3 --- --- Gain on sale of fixed assets ................................................................................ (0.6) (0.1) --- Impairment charges and asset writedowns ..................................................... --- 9.9 --- Changes in operating assets and liabilities (net of effects of
acquisitions):
Trade receivables ........................................................................................... 64.2 (79.4) (45.5) Net inventories ............................................................................................... 43.6 (48.1) (106.1) Trade accounts payable ................................................................................ 12.8 7.1 35.7 Other ................................................................................................................ (64.1) (6.7) 5.2
Net cash provided by (used in) operating activities ............................ 200.6 5.0 (19.5)
INVESTING ACTIVITIES Proceeds from sale of businesses ..................................................................... 144.3 --- --- Acquisition of businesses, net of cash acquired............................................ (20.0) (535.6) (211.3) Capital expenditures ............................................................................................ (24.2) (21.4) (13.1) Proceeds from sale of assets .............................................................................. 10.8 4.0 2.4
Net cash provided by (used in) investing activities ............................. 110.9 (553.0) (222.0)
FINANCING ACTIVITIES Principal repayments of long-term debt............................................................ (183.1) (33.7) (170.8) Net repayments under revolving line of credit agreements ........................... (53.6) (17.3) (71.5) Purchases of common stock held in treasury .................................................. (20.2) --- --- Proceeds from issuance of long-term debt, net of issuance costs ............... --- 534.6 513.6 Payment of premiums on early extinguishment of debt ................................. --- --- (29.0) Issuance of common stock................................................................................. --- 162.8 --- Other ...................................................................................................................... (4.3) 10.8 (3.0)
Net cash provided by (used in) financing activities ............................. (261.2) 657.2 239.3
EFFECT OF EXCHANGE RATE CHANGES ON CASH AND CASH
EQUIVALENTS..................................................................................................
(2.2)
(1.0)
(1.4)
NET INCREASE (DECREASE) IN CASH AND CASH EQUIVALENTS.......... 48.1 108.2 (3.6) CASH AND CASH EQUIVALENTS AT BEGINNING OF PERIOD.................. 133.3 25.1 28.7
CASH AND CASH EQUIVALENTS AT END OF PERIOD................................ $ 181.4 $ 133.3 $ 25.1
The accompanying notes are an integral part of these financial statements.

F - 8
TEREX CORPORATION AND SUBSIDIARIES NOTES TO CONSOLIDATED FINANCIAL STATEMENTS
December 31, 2000 (dollar amounts in millions, unless otherwise noted, except per share amounts)
NOTE A -- SIGNIFICANT ACCOUNTING POLICIES Principles of Consolidation. The Consolidated Financial Statements include the accounts of Terex Corporation and its majority owned subsidiaries ("Terex" or the "Company"). All material intercompany balances, transactions and profits have been eliminated. The equity method is used to account for investments in affiliates in which the Company has an ownership interest between 20% and 50%. Investments in entities in which the Company has an ownership interest of less than 20% are accounted for on the cost method or at fair value in accordance with Statement of Financial Accounting Standards ("SFAS") No. 115 "Accounting for Certain Investments in Debt and Equity Securities." Use of Estimates. The preparation of financial statements in conformity with generally accepted accounting principles requires management to make estimates and assumptions that affect the reported amounts of assets and liabilities and disclosure of contingent assets and liabilities at the date of the financial statements and the reported amounts of revenues and expenses during the reporting period. Actual results could differ from those estimates. Cash and Cash Equivalents. Cash equivalents consist of highly liquid investments with original maturities of three months or less. The carrying amount of cash and cash equivalents approximates their fair value. Cash and cash equivalents at December 31, 2000 and 1999 include $11.7 and $8.6, respectively, the use of which was not immediately available. Inventories. Inventories are stated at the lower of cost or market value. Cost is determined by the first-in, first-out ("FIFO") method. Debt Issuance Costs. Debt issuance costs incurred in securing the Company's financing arrangements are capitalized and amortized over the term of the associated debt. Capitalized debt issuance costs related to debt that is retired early are charged to expense at the time of retirement. Debt issuance costs before amortization totaled $21.8 and $25.2 at December 31, 2000 and 1999, respectively. Intangible Assets. Intangible assets include purchased patents, trademarks and other specifically identifiable assets and are amortized on a straight-line basis over the respective estimated useful lives not exceeding seven years. Goodwill. Goodwill, representing the difference between the total purchase price and the fair value of assets (tangible and intangible) and liabilities at the date of acquisition, is being amortized on a straight-line basis over between fifteen and forty years. Accumulated amortization is $39.9 and $27.1 at December 31, 2000 and 1999, respectively. Property, Plant and Equipment. Property, plant and equipment are stated at cost. Expenditures for major renewals and improvements are capitalized while expenditures for maintenance and repairs not expected to extend the life of an asset beyond its normal useful life are charged to expense when incurred. Plant and equipment are depreciated over the estimated useful lives of the assets under the straight-line method of depreciation for financial reporting purposes and both straight-line and other methods for tax purposes. Impairment of Long Lived Assets. The Company's policy is to assess the realizability of its long lived assets and to evaluate such assets for impairment whenever events or changes in circumstances indicate that the carrying amount of such assets (or group of assets) may not be recoverable. Impairment is determined to exist if the estimated future undiscounted cash flows is less than its carrying value. The amount of any impairment then recognized would be calculated as the difference between estimated future discounted cash flows and the carrying value of the asset. Revenue Recognition. Revenue and costs are generally recorded when products are shipped and invoiced to either independently owned and operated dealers or to customers. Certain new units may be invoiced prior to the time customers take physical possession. Revenue is recognized in such cases only when the customer has a fixed commitment to purchase the units, the units have been completed, tested and made available to the customer for pickup or delivery, and the customer has requested that the Company hold the units for pickup or delivery at a time specified by the customer. In such cases, the units are invoiced under the Company's customary billing terms, title to the units and risks of ownership pass to the customer

F - 9
upon invoicing, the units are segregated from the Company's inventory and identified as belonging to the customer and the Company has no further obligations under the order. Accrued Warranties and Product Liability. The Company records accruals for potential warranty and product liability claims based on the Company's claim experience. Warranty costs are accrued at the time revenue is recognized. The Company provides self-insurance accruals for estimated product liability experience on known claims. Non Pension Postretirement Benefits. The Company provides postretirement benefits to certain former salaried and hourly employees and certain hourly employees covered by bargaining unit contracts that provide such benefits and has elected the delayed recognition method of adoption of the accounting standard related to the benefits. (See Note L -- "Retirement Plans.") Foreign Currency Translation. Assets and liabilities of the Company's international operations are translated at year-end exchange rates. Income and expenses are translated at average exchange rates prevailing during the year. For operations whose functional currency is the local currency, translation adjustments are accumu lated in the Cumulative Translation Adjustment component of Stockholders' Equity. Gains or losses resulting from foreign currency transactions are recorded in the accounts based on the underlying transaction. Derivatives. The Company may from time to time use foreign exchange contracts to hedge recorded balance sheet amounts related to certain international operations and firm commitments that create currency exposures. The Company does not enter into speculative contracts. Gains and losses on hedges of assets and liabilities are recognized in income as offsets to the gains and losses from the underlying hedged amounts. Gains and losses on hedges of firm commitments are recorded on the basis of the underlying transaction. At December 31, 2000 and 1999 the Company had foreign exchange contracts with notional amounts totaling $20.3 and $19.8, respectively. At December 31, 2000, the fair value of these contracts approximates a $1.3 asset. As certain of the Company's obligations, including indebtedness under the 1998 Bank Credit Facility and the 1999 Bank Credit Facility (as defined in Note H – “Long-Term Obligations”), bear interest at floating rates, the Company entered into certain interest protection arrangements. At December 31, 2000, the Company had approximately $257 of such interest protection arrangements fixing interest at various rates between 5.44% and 9.66%. The differentials to be received or paid are recognized as adjustments to interest expense. The fair market value of these arrangements was a liability of approximately $0.4 at December 31, 2000. In June 1998, the Financial Accounting Standards Board issued SFAS No. 133, “Accounting for Derivative Instruments and Hedging Activities,” which establishes a new model for accounting for derivative and hedging activities and supersedes and amends a number of existing standards. Upon initial application, all derivatives are required to be recognized in the statement of financial position as either assets or liabilities and measured at fair value. Changes in the fair value of derivatives are recorded each period in current earnings or other comprehensive income, depending on whether a derivative is designated as part of a hedge transaction and, if it is, the type of hedge transaction. In addition, all hedging relationships must be reassessed and documented pursuant to the provisions of SFAS No. 133. SFAS No. 133 is effective for the Company beginning in 2001. Upon adoption of this statement on January 1, 2001, the Company did not have a significant impact on its financial position or results of operations. Environmental Policies. Environmental expenditures that relate to current operations are either expensed or capitalized depending on the nature of the expenditure. Expenditures relating to conditions caused by past operations that do not contribute to current or future revenue generation are expensed. Liabilities are recorded when environmental assessments and/or remedial actions are probable, and the costs can be reasonably estimated. Such amounts were not material at December 31, 2000 and 1999. Research and Development Costs. Research and development costs are expensed as incurred. Such costs incurred in the development of new products or significant improvements to existing products are included in Selling, General and Administrative Expenses. Income Taxes. The Company accounts for income taxes using the asset and liability method. This approach requires the recognition of deferred tax assets and liabilities for the expected future tax consequences of temporary differences between the carrying amounts and the tax bases of assets and liabilities (see Note J -- "Income Taxes").

F - 10
Earnings Per Share. Basic earnings per share is computed by dividing net income for the period by the weighted average number of shares of Terex common stock outstanding. Diluted earnings per share is computed by dividing net income for the period by the weighted average number of shares of Terex common stock outstanding and dilutive potential common shares. NOTE B -- ACQUISITIONS On October 23, 2000, the Company completed the purchase of Coleman Engineering, Inc. (“Coleman”). Coleman manufactures and markets light construction equipment consisting of light towers and generators at its facilities in Memphis, Tennessee and Holly Springs, Mississippi. On December 28, 2000, the Company acquired Fermec Manufacturing Limited (“Fermec”). Fermec, headquartered in Manchester, England, is a manufacturer and marketer of loader backhoes. The Coleman and Fermec acquisitions (the "Acquired Businesses") are being accounted for using the purchase method, with the purchase price allocated to the assets acquired and the liabilities assumed based upon their respective estimated fair values at the date of acquisition. The Company is in the process of completing certain valuations, appraisals and actuarial and other studies for purposes of determining certain fair values with respect to the Acquired Businesses. The Company is also estimating costs related to plans to integrate the activities of the Acquired Businesses into the Company, including plans to exit certain activities and consolidate and restructure certain functions. The Company may revise its preliminary allocations as additional information is obtained. In addition, with respect to certain of the Acquired Businesses, the Company is in the process of finalizing the purchase price with the seller and any adjustment will be reflected in goodwill. On April 1, 1999, the Company completed the purchase of Amida Industries, Inc. ("Amida"). Amida manufactures and markets light construction equipment consisting of light towers, concrete products and traffic safety devices at its facility in Rock Hill, South Carolina. The Company announced on June 15, 1999 an offer to acquire all of the issued and to be issued share capital of Powerscreen International plc (“Powerscreen”). On July 27, 1999, the effective date of acquisition, Terex declared the offer for Powerscreen unconditional, with respect to all valid acceptances received. Powerscreen, headquartered in Dungannon, Northern Ireland, is a manufacturer and marketer of screening and crushing equipment for the quarrying, construction and demolition industries. The purchase price of GBP 181 (approximately $294) was financed with a loan under a bank credit facility maturing March 2006 (see Note H - "Long-Term Obligations"). On August 26, 1999, the Company acquired Cedarapids, Inc. (“Cedarapids”) for approximately $170. Cedarapids, headquartered in Cedar Rapids, Iowa, is a manufacturer and marketer of mobile crushing and screening equipment, asphalt pavers and asphalt material mixing plants. The acquisition was financed through cash on hand and approximately $125 in additional debt (see Note H - "Long-Term Obligations"). The Company is negotiating with the seller to finalize adjustments to the purchase price. Any adjustment will be reflected in goodwill. On September 20, 1999, the Company completed the acquisition of certain assets and liabilities of Bartell Industries, Inc. ("Bartell"), a manufacturer and marketer of concrete finishing equipment located near Toronto, Canada. On September 29, 1999, the Company completed the acquisition of certain assets and liabilities of Re-Tech, a manufacturer and marketer of trommels, conveyors, and picking stations located in Pennsylvania. On November 3, 1999, the Company completed the acquisition of certain assets of the Material Handling Business of Teledyne Specialty Equipment ("Princeton/Kooi"). Princeton/Kooi manufactures and markets truck mounted lift trucks at its facilities in Canal Winchester, Ohio and Vrouwenparochie, The Netherlands. (See Note C – “Sale of Businesses”.) On December 1, 1999, the Company completed the purchase of Franna Cranes Pty. Ltd., now known as Terex Lifting Australia Pty. Ltd. (“Terex Lifting Australia”). Terex Lifting Australia manufactures and markets mobile cranes at its facility in Brisbane, Australia. The Amida, Powerscreen, Cedarapids, Bartell, Re-Tech, Princeton/Kooi and Terex Lifting Australia acquisitions are being accounted for using the purchase method, with the purchase price allocated to the assets acquired and the liabilities assumed

F - 11
based upon their respective estimated fair values at the date of acquisition. The excess of purchase price over the net assets acquired (approximately $302) is being amortized on a straight-line basis over 40 years. On January 5, 1998, the Company completed the purchase of Payhauler Corp. (“Payhauler”). Payhauler, which is part of the Terex Earthmoving segment, manufactures four-wheel drive off-highway trucks. On March 31, 1998, the Company purchased all of the outstanding shares of O&K Mining GmbH (“O&K Mining”) from O&K Orenstein & Koppel AG (“Orenstein & Koppel”) for net aggregate consideration of approximately $168, subject to certain post-closing adjustments. The transaction was financed through the issuance of the Company’s 1999 Senior Subordinated Notes (as defined in Note H – “Long-Term Obligations”) and borrowings under the Company’s 1999 Bank Credit Facility (as defined in Note H – “Long-Term Obligations”). O & K Mining, which is part of the Terex Earthmoving segment, is headquartered in Dortmund, Germany, and has operations in the United States, the United Kingdom, Australia, Canada, South Africa and Singapore. O&K Mining markets a complete range of large hydraulic mining shovels serving the global surface mining industry and the global construction and infrastructure development markets. The Company has commenced litigation with the seller to finalize adjustments to the purchase price. Any adjustment will be reflected in goodwill. On May 4, 1998, the Company completed the purchase of Holland Lift International B.V. (“Holland Lift”). Holland Lift, which is part of the Terex Lifting segment, manufactures aerial work platforms at its facility near Amsterdam, the Netherlands. On July 31, 1998, the Company completed the acquisition of The American Crane Corporation (“American Crane”). American Crane, which is part of the Terex Lifting segment, manufactures lattice boom cranes at its facility in Wilmington, North Carolina. On November 3, 1998, the Company completed the acquisition of Italmacchine S.p.A., now known as Terexlift S.r.l. (“Terexlift”). Terexlift, which is part of the Terex Lifting segment, manufactures rough terrain telescopic boom forklifts at its facility near Perugia, Italy. On November 13, 1998, the Company completed the acquisition of Peiner HTS, now known as Terex Peiner GmbH ("Peiner"). Peiner, which is part of the Terex Lifting segment, manufactures tower cranes at it its facility in Trier, Germany. On December 18, 1998, the Company completed the acquisition of Gru Comedil S.p.A. ("Comedil"). Comedil, which is part of the Terex Lifting segment, manufactures tower cranes at its facility in Fontanafredda, Italy. The Payhauler, O&K Mining, Holland Lift, American Crane, Terexlift, Peiner and Comedil acquisitions are being accounted for using the purchase method, with the purchase price allocated to the assets acquired and the liabilities assumed based upon their respective estimated fair values at the date of acquisition. The excess of purchase price over the net assets acquired (approximately $177) is being amortized on a straight-line basis over 40 years. The operating results of the acquired businesses are included in the Company's consolidated results of operations since the date of acquisition.

F - 12
NOTE C – SALE OF BUSINESSES On September 30, 2000, the Company completed the sale of its truck-mounted forklift businesses to various subsidiaries of Partek Corporation of Finland for $144 in cash, subject to adjustment. During the year ended December 31, 2000 and 1999, total net sales for the Company’s truck-mounted forklift businesses were approximately $68 and $23, respectively, and were included in the Terex Lifting segment. The Company used approximately $125 of net after-tax proceeds from this transaction to repay long-term bank debt. These businesses sold included Princeton/Kooi and the Moffett subsidiary of Powerscreen. NOTE D -- SPECIAL CHARGES During the fourth quarter of 2000, the Company recorded expenses of $9.8 related to the closing of its distribution facility in the United Kingdom, the impact of an aggregates customer that filed for bankruptcy and a one-time charge related to due diligence costs associated with a large potential acquisition which did not come to fruition. These expenses have been included in cost of sales and selling, general and administrative expenses in the statement of income in the amounts of $6.9 and $2.9, respectively. During the third quarter of 2000, the Company recorded expenses of $3.0 related to the further integration of the Company’s surface mining truck and hydraulic shovel businesses, partially offset by a curtailment gain related to one of the Company’s pension plans. These items have been reflected in cost of sales and selling, general and administrative expenses in the statement of income in the amounts of $3.2 and $(0.2), respectively. During the fourth quarter of 1999, the Company announced the closing of its aerial work platform scissor lift manufacturing plant in Milwaukee, Wisconsin. As a result of this action the Company had a one-time charge of $9.9 related to the impairment of goodwill and certain closure costs. These costs have been included in cost of sales in the statement of income. Also in the fourth quarter of 1999, the Company recorded income of $1.4 related to a favorable legal settlement, partially offset by the cost of a headcount reduction at its manufacturing facility in Germany. These items have been reflected in selling, general and administrative expenses in the statement of income. NOTE E -- EARNINGS PER SHARE
(in millions, except per share data)
2000 1999 1998
Income
Shares
Per-Share
Amount
Income
Shares
Per-Share
Amount
Income
Shares
Per-Share Amount
Basic earnings per share Income from continuing
operations before extraordinary items ................................$ 103.9 27.2 $ 3.82 $ 172.9 24.2 $ 7.14 $ 72.8 20.7 $ 3.52
Effect of dilutive securities
Warrants................................................................ --- 0.1 --- 0.1 --- 0.1 Stock Options................................ --- 0.5 --- 0.8 --- 0.8 Equity Rights ................................ --- 0.1 --- 0.5 --- 0.8
Income from continuing operations before extraordinary items ................................$ 103.9 27.9 $ 3.72 $ 172.9 25.6 $ 6.75 $ 72.8 22.4 $ 3.25
Options to purchase 548 thousand, 198 thousand and 201 thousand shares of common stock were outstanding during 2000, 1999 and 1998, respectively, but were not included in the computation of diluted earnings per share because the exercise price of the options was greater than the average market price of the common shares and therefore, the effect would be anti dilutive.

F - 13
NOTE F -- INVENTORIES Inventories consist of the following:
December 31, 2000 1999 Finished equipment ...................................................................... $ 215.1 $ 235.3 Replacement parts......................................................................... 161.9 176.8 Work-in-process ........................................................................... 63.9 81.9 Raw materials and supplies ......................................................... 157.2 171.6 Net inventories ............................................................................ $ 598.1 $ 665.6
NOTE G -- PROPERTY, PLANT AND EQUIPMENT Property, plant and equipment consist of the following:
December 31, 2000 1999 Property.......................................................................................... $ 20.8 $ 23.3 Plant................................................................................................ 87.9 97.2 Equipment...................................................................................... 118.6 112.5 227.3 233.0 Less: Accumulated depreciation............................................... (73.4) (60.2) Net property, plant and equipment.......................................... $ 153.9 $ 172.8
NOTE H -- LONG-TERM OBLIGATIONS Long-term debt is summarized as follows:
December 31, 2000 1999 8-7/8% Senior Subordinated Notes due March 31, 2008 ............................................................ $ 245.2 $ 244.7 1999 Bank Credit Facility ................................................................................................................. 398.9 450.0 1998 Bank Credit Facility ................................................................................................................. 208.3 403.1 Notes payable ................................................................................................................................... 10.6 19.7 Capital lease obligations.................................................................................................................. 14.8 22.9 Other................................................................................................................................................... 24.7 16.0 Total long-term debt....................................................................................................................... 902.5 1,156.4 Less: Current portion of long-term debt...................................................................................... (20.5) (57.6) Long-term debt, less current portion........................................................................................... $ 882.0 $ 1,098.8
The Senior Subordinated Notes On March 9, 1999 and March 31, 1998, the Company issued and sold $100.0 and $150.0 aggregate principal amount of 8-7/8% Senior Subordinated Notes due 2008, discounted to yield 9.73% and 8.94%, respectively (the "Senior Subordinated Notes"). The Senior Subordinated Notes are jointly and severally guaranteed by certain domestic subsidiaries (see Note P – “Consolidating Financial Statements”). The net proceeds from the offering were used to repay a portion of the outstanding indebtedness under Terex's credit facilities, to fund a portion of the aggregate consideration for the acquisition of O&K Mining and for other acquisitions.

F - 14
The 1999 Bank Credit Facility On July 2, 1999, the Company entered into a credit agreement for a term loan of up to $325 to provide the funds necessary to acquire the outstanding share capital of Powerscreen and for other general corporate purposes. This credit agreement was subsequently amended and restated on August 23, 1999 to provide an additional term loan of up to $125 to acquire Cedarapids. The term loans under this facility (the “1999 Bank Credit Facility”) mature in March 2006 and bear interest, at the Company's option, at a rate of 3.00% to 3.50% per annum in excess of the adjusted Eurodollar rate or 2.00% to 2.50% in excess of the prime rate. The weighted average interest rate on the 1999 Bank Credit Facility at December 31, 2000 was 9.66%. During 2000, the Company made principal prepayments of $50.0 on the 1999 Bank Credit Facility such that the next scheduled principal payment is due in June 2003. The 1998 Bank Credit Facility On March 6, 1998, the Company refinanced its then outstanding credit facility and redeemed or defeased all of its $166.7 principal amount of its then outstanding 13-¼% Senior Secured Notes due 2002 (the "Senior Secured Notes"). The refinancing included effectiveness of a revolving credit facility aggregating up to $125.0 and term loan facilities providing for loans in an aggregate principal amount of up to approximately $375.0 (collectively, the "1998 Bank Credit Facility"). In connection with the 1998 refinancing of the Company's then outstanding credit facility and the repurchase of the Senior Secured Notes, the Company incurred extraordinary losses of $1.9 and $36.4, respectively. These extraordinary charges were recorded in the first quarter of 1998. The 1998 Bank Credit Facility consists of a secured global revolving credit facility aggregating up to $125.0 (the “Revolving Credit Facility”) and two term loan facilities (collectively, the “Term Loan Facilities”) providing for loans in an aggregate principal amount of up to approximately $375.0. The Revolving Credit Facility is used for working capital and general corporate purposes, including acquisitions. With limited exceptions, the obligations of the Company under the 1998 Bank Credit Facility are secured by (i) a pledge of all of the capital stock of domestic subsidiaries of the Company, (ii) a pledge of 65% of the stock of the foreign subsidiaries of the Company and (iii) a first priority security interest in, and mortgages on, substantially all of the assets of Terex and its domestic subsidiaries. The 1998 Bank Credit Facility contains covenants limiting the Borrowers’ activities, including, without limitation, limitations on dividends and other payments, liens, investments, incurrence of indebtedness, mergers and asset sales, related party transactions and capital expenditures. The 1998 Bank Credit Facility also contains certain financial and operating covenants, including a maximum leverage ratio, a minimum interest coverage ratio and a minimum fixed charge coverage ratio. Pursuant to the Term Loan Facilities, the Company has borrowed (i) $175.0 in aggregate principal amount pursuant to a Term Loan A due March 2004 (the “Term A Loan”) and (ii) $200.0 in aggregate principal amount pursuant to a Term Loan B due March 2005 (the “Term B Loan”). The outstanding principal amount of the Term A Loan currently bears interest, at the Company's option, at an all-in drawn cost of 0.875% per annum in excess of the adjusted eurodollar rate or, with respect to U.S. dollar denominated alternate based rate loans, at an all-in drawn cost of 0.125% per annum below the prime rate. The outstanding principal amount of the Term B Loan currently bears interest, at the Company’s option, at a rate of 2.75% per annum in excess of the adjusted eurodollar rate or, with respect to U.S. Dollar denominated alternate base rate loans, 1.75% in excess of the prime rate. The weighted average interest rate on the Term A Loan and Term B Loan at December 31, 2000 was 7.19% and 9.06%, respectively. The Term A Loan amortizes on a quarterly basis, in the annual percentages of 0%, 16%, 16%, 21%, 21% and 26%, respectively, during the six-year term of the loan. The Term B Loan amortizes in an annual percentage of 1% during each of the first six years of the term of the loan and 94% in the seventh year of the term of the loan. The Term A Loan and Term B Loan are subject to mandatory prepayment in certain circumstances and are voluntarily prepayable without payment of a premium (subject to reimbursement of the lenders’ costs in case of prepayment of eurodollar loans other than on the last day of an interest period). During 2000, the Company made principal prepayments of $124.4 on the Term A Loan and Term B Loan such that the next scheduled principal payments are due in June 2003. Pursuant to the Revolving Credit Facility, the Company has available an aggregate amount of up to $125.0. As of December 31, 2000, the Company had no balance outstanding under the Revolving Credit Facility, letters of credit issued under the Revolving Credit Facility totaled $13.3, and the additional amount the Company could have borrowed under the Revolving Credit Facility was $111.7. The outstanding principal amount of loans under the Revolving Credit Facility bears interest, at the Company's option, at an all-in drawn cost of 0.875% per annum in excess of the adjusted eurocurrency rate or, with respect to U.S. dollar denominated alternate base rate loans, at an all-in drawn cost of 0.125% per annum below the prime rate. The weighted average interest rate on the Revolving Credit Facility outstanding was 6.3% at December 31, 1999. The Revolving Credit Facility will terminate on March 6, 2004.
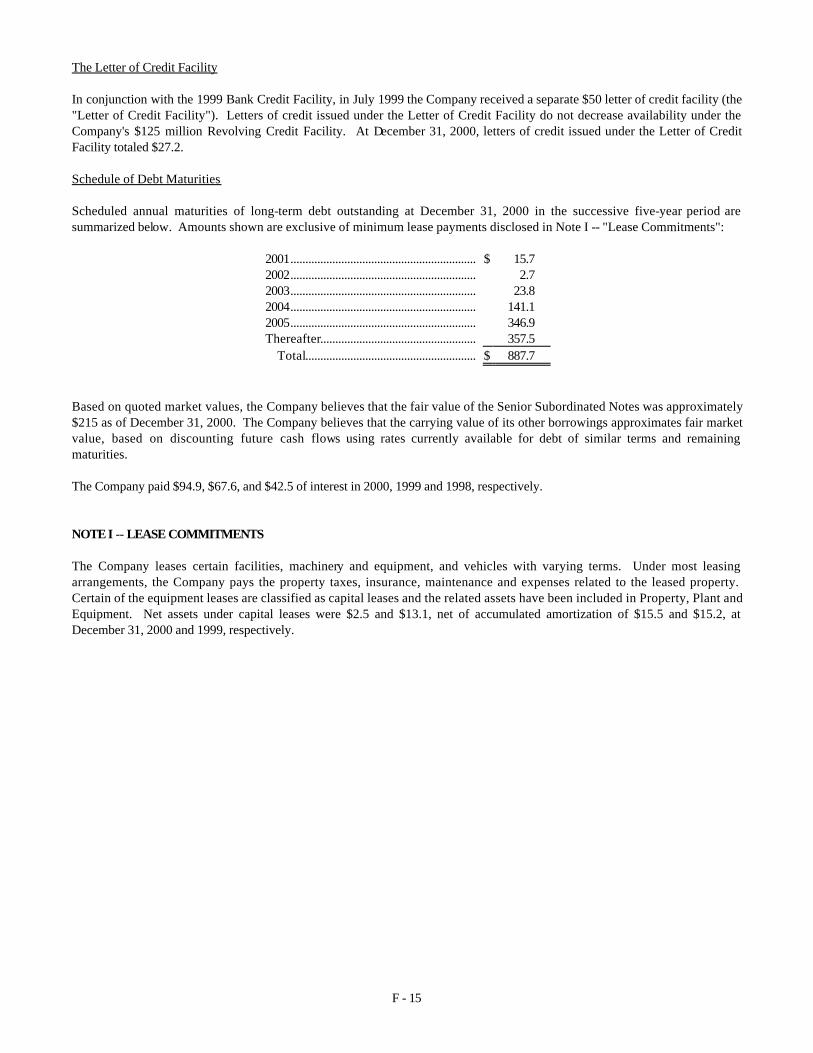
F - 15
The Letter of Credit Facility In conjunction with the 1999 Bank Credit Facility, in July 1999 the Company received a separate $50 letter of credit facility (the "Letter of Credit Facility"). Letters of credit issued under the Letter of Credit Facility do not decrease availability under the Company's $125 million Revolving Credit Facility. At December 31, 2000, letters of credit issued under the Letter of Credit Facility totaled $27.2. Schedule of Debt Maturities Scheduled annual maturities of long-term debt outstanding at December 31, 2000 in the successive five-year period are summarized below. Amounts shown are exclusive of minimum lease payments disclosed in Note I -- "Lease Commitments":
2001.............................................................. $ 15.7 2002.............................................................. 2.7 2003.............................................................. 23.8 2004.............................................................. 141.1 2005.............................................................. 346.9 Thereafter.................................................... 357.5 Total......................................................... $ 887.7
Based on quoted market values, the Company believes that the fair value of the Senior Subordinated Notes was approximately $215 as of December 31, 2000. The Company believes that the carrying value of its other borrowings approximates fair market value, based on discounting future cash flows using rates currently available for debt of similar terms and remaining maturities. The Company paid $94.9, $67.6, and $42.5 of interest in 2000, 1999 and 1998, respectively. NOTE I -- LEASE COMMITMENTS The Company leases certain facilities, machinery and equipment, and vehicles with varying terms. Under most leasing arrangements, the Company pays the property taxes, insurance, maintenance and expenses related to the leased property. Certain of the equipment leases are classified as capital leases and the related assets have been included in Property, Plant and Equipment. Net assets under capital leases were $2.5 and $13.1, net of accumulated amortization of $15.5 and $15.2, at December 31, 2000 and 1999, respectively.

F - 16
Future minimum capital and noncancelable operating lease payments and the related present value of capital lease payments at December 31, 2000 are as follows:
Capital Leases
Operating Leases
2001.............................................................................. $ 4.8 $ 8.2 2002.............................................................................. 3.7 7.5 2003.............................................................................. 2.4 6.3 2004.............................................................................. 1.6 4.6 2005.............................................................................. 1.3 4.2 Thereafter.................................................................... 1.8 7.4 Total minimum obligations .................................. 15.6 $ 38.2
Less amount representing interest.......................... (0.8) Present value of net minimum obligations......... 14.8 Less current portion.................................................. (4.8) Long-term obligations........................................... $ 10.0
Most of the Company's operating leases provide the Company with the option to renew the leases for varying periods after the initial lease terms. These renewal options enable the Company to renew the leases based upon the fair rental values at the date of expiration of the initial lease. Total rental expense under operating leases was $8.7, $9.1 and $9.3 in 2000, 1999 and 1998, respectively. NOTE J -- INCOME TAXES
In December 1994, the Company received an examination report from the Internal Revenue Service ("IRS") proposing a tax deficiency of approximately $56 for 1987 through 1989. The examination report raised several issues including the substantiation for certain tax deductions and whether the Company was able to use certain net operatings losses ("NOLs") to offset taxable income. In April 1995, the Company filed an administrative appeal to the examination. On November 18, 1999, Terex announced that it had resolved the IRS audit regarding the Company’s federal income tax returns for the years 1987 through 1989. As a result of the completion of the audit, the IRS will no longer challenge the Company’s right to use certain NOLs. Furthermore, because of the existence of substantial NOLs, Terex will not owe any tax. However, due to timing issues associated with NOL carrybacks and the substantial amount of time which has elapsed since the years in question, Terex has recorded interest expense of $0.9 and $7.7 in 2000 and 1999, respectively, all of which will be tax deductible. The components of Income From Continuing Operations Before Income Taxes and Extraordinary Items are as follows:
Year ended December 31, 2000 1999 1998 United States ............................................................................................. $ 91.2 $ 26.5 $ 57.4 Foreign........................................................................................................ 68.4 71.9 17.1 Income from continuing operations before income taxes
and extraordinary items ..................................................................... $
159.6
$
98.4
$
74.5
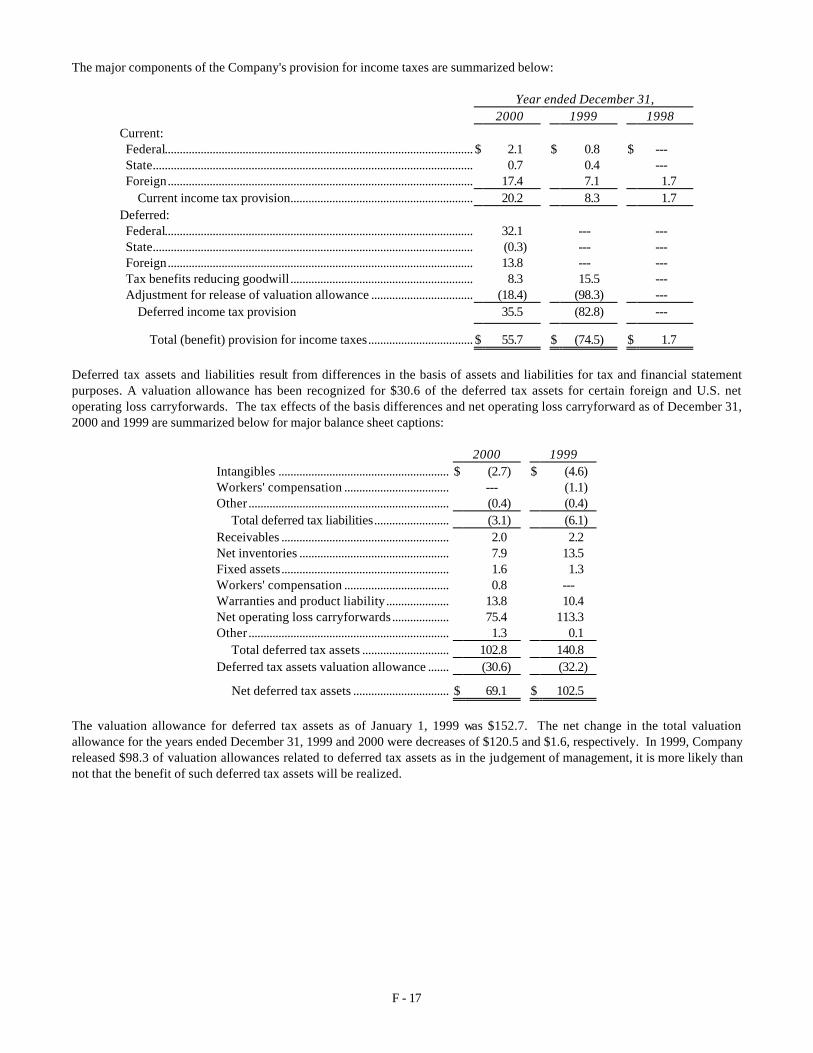
F - 17
The major components of the Company's provision for income taxes are summarized below:
Year ended December 31, 2000 1999 1998 Current: Federal....................................................................................................... $ 2.1 $ 0.8 $ --- State........................................................................................................... 0.7 0.4 --- Foreign...................................................................................................... 17.4 7.1 1.7 Current income tax provision............................................................. 20.2 8.3 1.7 Deferred: Federal....................................................................................................... 32.1 --- --- State........................................................................................................... (0.3) --- --- Foreign...................................................................................................... 13.8 --- --- Tax benefits reducing goodwill............................................................. 8.3 15.5 --- Adjustment for release of valuation allowance .................................. (18.4) (98.3) ---
Deferred income tax provision 35.5 (82.8) ---
Total (benefit) provision for income taxes................................... $ 55.7 $ (74.5) $ 1.7
Deferred tax assets and liabilities result from differences in the basis of assets and liabilities for tax and financial statement purposes. A valuation allowance has been recognized for $30.6 of the deferred tax assets for certain foreign and U.S. net operating loss carryforwards. The tax effects of the basis differences and net operating loss carryforward as of December 31, 2000 and 1999 are summarized below for major balance sheet captions:
2000 1999 Intangibles ......................................................... $ (2.7) $ (4.6) Workers' compensation ................................... --- (1.1) Other ................................................................... (0.4) (0.4) Total deferred tax liabilities......................... (3.1) (6.1) Receivables ........................................................ 2.0 2.2 Net inventories .................................................. 7.9 13.5 Fixed assets........................................................ 1.6 1.3 Workers' compensation ................................... 0.8 --- Warranties and product liability..................... 13.8 10.4 Net operating loss carryforwards................... 75.4 113.3 Other ................................................................... 1.3 0.1 Total deferred tax assets ............................. 102.8 140.8 Deferred tax assets valuation allowance ....... (30.6) (32.2)
Net deferred tax assets ................................ $ 69.1 $ 102.5
The valuation allowance for deferred tax assets as of January 1, 1999 was $152.7. The net change in the total valuation allowance for the years ended December 31, 1999 and 2000 were decreases of $120.5 and $1.6, respectively. In 1999, Company released $98.3 of valuation allowances related to deferred tax assets as in the judgement of management, it is more likely than not that the benefit of such deferred tax assets will be realized.

F - 18
The Company's Provision for Income Taxes is different from the amount which would be provided by applying the statutory federal income tax rate to the Company's Income From Continuing Operations Before Income Taxes and Extraordinary Items. The reasons for the difference are summarized below:
Year ended December 31, 2000 1999 1998 Tax at statutory federal income tax rate................................................... $ 55.9 $ 34.4 $ 26.1 Recognition of fully reserved preacquisition deferred tax asset ......... 8.3 15.5 --- Change in valuation allowance relating to NOL and temporary
differences ................................................................................................
(14.4)
(124.5)
(21.1) Foreign tax differential on income/losses of foreign subsidiaries ....... 1.4 (2.8) (4.4) Goodwill........................................................................................................ 1.9 0.5 1.0 Other ............................................................................................................. 2.6 2.4 0.1 Total (benefit) provision for income taxes ......................................... $ 55.7 $ (74.5) $ 1.7
United States income taxes have not been provided on undistributed earnings of foreign subsidiaries. The Company's intention is to reinvest these earnings indefinitely or to repatriate when it is tax effective to do so. Accordingly, the Company believes that any U.S. tax on unrepatriated earnings would be substantially offset by foreign tax credits. At December 31, 2000, the Company had domestic federal net operating loss carryforwards of $110.1. The tax basis of U. S. federal net operating loss carryforwards expire as follows:
Tax Basis Net Operating Loss Carryforwards
2008........................................................... $ 24.4 2009........................................................... 36.5 2010........................................................... 44.4 2011........................................................... 1.5 2012........................................................... 1.3 2018........................................................... 0.5 2019........................................................... 1.5 Total ..................................................... $ 110.1
If a change of control of the Company, as defined by the Tax Reform Act of 1986, were to occur, the Company's utilization of the U.S. net operating loss and credit carryforwards would be subject to annual limitation in future periods. The Company also has various state net operating loss carryforwards expiring at various dates through 2013 available to reduce future state taxable income and income taxes. In addition, the Company's foreign subsidiaries have approximately $142.3 of loss carryforwards, $63.1 in the United Kingdom, $8.0 in France, $54.3 in Germany, and $16.9 in other countries, which are available to offset future foreign taxable income. The tax loss carryforwards in the United Kingdom, Germany and France are available without expiration. Tax loss carryforwards in other countries of $1.8 expire in 2002 through 2004, with the remaining $15.1 available without expiration. The Company also has tax credit carryforwards of $3.8 in the U.S., $0.8 of which expire in 2006 and the remaining $3.0 is available without expiration. The Company made income tax payments of $2.9, $2.6, and $0.7 in 2000, 1999 and 1998, respectively. NOTE K -- STOCKHOLDERS' EQUITY Common Stock. The Company's certificate of incorporation was amended in June 1998 to increase the number of authorized shares of common stock, par value $0.01 (the "Common Stock"), to 150.0 million. On June 22, 1999, the Company issued 3.5 million shares of Common Stock in a public offering for net proceeds to the Company of $103.7. On July 28, 1999, the Company issued 2 million shares of Common Stock for net proceeds to the Company of $59.1. As of December 31, 2000, there were 27.9 million shares issued and 26.8 million shares outstanding. Of the 122.1 million unissued shares at that date, 3.8 million shares were reserved for issuance for the exercise of stock options and restricted stock.

F - 19
Common Stock in Treasury. In March 2000, the Company’s Board of Directors authorized the purchase of up to 2.0 million shares of the Company’s outstanding Common Stock over the following twelve months. As of December 31, 2000, the Company had acquired 1.3 million shares of Common Stock at a total cost of $20.2. During the fourth quarter of 2000, the Company reissued 0.2 million shares of Common Stock as partial payment for an acquired company. As of December 31, 2000, the Company held 1.1 million shares of Common Stock in treasury. Preferred Stock. The Company's certificate of incorporation was amended in June 1998 to authorize 50.0 million shares of preferred stock, $0.01 par value per share. As of December 31, 2000, no shares of preferred stock were outstanding. Equity Rights. On May 9, 1995, the Company sold one million equity rights securities (the "Equity Rights") along with a $250 debt offering. The portion of the proceeds related to the Equity Rights ($3.2) has been recorded in the stockholders' equity section of the balance sheet, because they can be satisfied in Common Stock or cash at the option of the Company. The Equity Rights entitle the holders, upon exercise at any time on or prior to May 15, 2002, to receive cash or, at the election of the Company, Common Stock in an amount equal to the average closing sale price of the Common Stock for the 60 consecutive trading days prior to the date of exercise (the "Current Price"), less $7.288 per share, subject to adjustment in certain circumstances. Changes in the Current Price do not affect the net income or loss reported by the Company; however, changes in the Current Price vary the amount of cash that the Company would have to pay or the number of shares of Common Stock that would have to be issued in the event holders exercise the Equity Rights. During 2000 and 1999 holders exercised 23.2 thousand and 721.4 thousand rights, respectively. As of December 31, 2000, 219.8 thousand Equity Rights were outstanding and the Current Price of the Common Stock was $16.188. Accordingly, the Company would have been required to either pay $1.3 or issue 80.0 thousand shares of Common Stock, at the Company's option, in the event that all of the holders had exercised their Equity Rights. Series A Warrants. In connection with the December 1993 private placement of Series A Preferred Stock, the Company issued 1.3 million Series A Warrants. Each Series A Warrant could have been exercised, in whole or in part, at the option of the holder at any time before the expiration date on December 31, 2000 and was redeemable by the Company under certain circumstances. All Series A Warrants were exercised prior to the December 31, 2000 expiration date. Stock Options. The Company maintains a qualified incentive stock option ("ISO") plan covering certain officers and key employees. The exercise price of the ISO is the fair market value of the shares at the date of grant. The ISO allows the holder to purchase shares of Common Stock, commencing one year after grant. ISO expire after ten years. At December 31, 2000, 12.9 thousand stock options were available for grant under the ISO plan. Long-Term Incentive Plans. In May 2000, the stockholders approved the Terex Corporation 2000 Incentive Plan (the “2000 Plan”). The purpose of the 2000 Plan is to assist the Company in attracting and retaining selected individuals to serve as directors, officers, consultants, advisors and employees of the Company and its subsidiaries and affiliates who will contribute to the Company's success and to achieve long-term objectives which will inure to the benefit of all stockholders of the Company through the additional incentive inherent in the ownership of the Common Stock. The 2000 Plan authorizes the granting of (i) options (“Options”) to purchase shares of Common Stock, (ii) stock appreciation rights (“SARs”), (iii) stock purchase awards, (iv) restricted stock awards and (v) performance awards. There are 2.0 million shares of Common Stock available for grant under the 2000 Plan. As of December 31, 2000, no shares have been granted under the 2000 Plan. In May 1996, the stockholders approved the 1996 Terex Corporation Long-Term Incentive Plan (the "1996 Plan"). The 1996 Plan authorizes the granting, among other things, of (i) Options to purchase shares of Common Stock, (ii) shares of Common Stock, including restricted stock, and (iii) cash bonus awards based upon a participant's job performance. In May 1999, the stockholders approved an increase in the aggregate number of shares of Common Stock (including restricted stock, if any) optioned or granted under the 1996 Plan to 2.0 million shares. At December 31, 2000, 75.0 thousand shares were available for grant under the 1996 Plan. The 1996 Plan also provides for automatic grants of Options to non-employee directors. In 1994, the stockholders approved the 1994 Terex Corporation Long-Term Incentive Plan (the "1994 Plan") covering certain managerial, administrative and professional employees and outside directors. The 1994 Plan provides for awards to employees, from time to time and as determined by a committee of outside directors, of cash bonuses, stock options, stock and/or restricted stock. The total number of shares of the Company's Common Stock available to be awarded under the 1994 Plan is 750 thousand, subject to certain adjustments. At December 31, 2000, 4.3 thousand shares were available for grant under the 1994 Plan. The following table is a summary of stock options under all four of the Company's plans.

F - 20
Number of Options
Weighted Average
Exercise Price per Share
Outstanding at December 31, 1997 ......................... 731,587 $ 7.64 Granted..................................................................... 547,851 $ 22.02 Exercised.................................................................. (100,900) $ 6.72 Canceled or expired................................................ (17,329) $ 15.00
Outstanding at December 31, 1998 ......................... 1,161,209 $ 14.39 Granted..................................................................... 204,574 $ 25.93 Exercised.................................................................. (145,583) $ 6.73 Canceled or expired................................................ (12,958) $ 22.14
Outstanding at December 31, 1999 ......................... 1,207,242 $ 16.76 Granted..................................................................... 224,030 $ 13.33 Exercised.................................................................. (121,550) $ 4.65 Canceled or expired................................................ (12,325) $ 18.97
Outstanding at December 31, 2000 ......................... 1,297,397 $ 17.29
Exercisable at December 31, 2000............................ 713,246 $ 15.78
Exercisable at December 31, 1999............................ 641,235 $ 12.35
Exercisable at December 31, 1998............................ 579,595 $ 10.00

F - 21
The following table summarizes information about stock options outstanding and exercisable at December 31, 2000:
Options Outstanding Options Exercisable
Range of Exercise Prices
Number of Options
Weighted Average
Life (in years)
Weighted Average Exercise Price per
Share
Number of Options
Weighted Average Exercise Price per
Share $ 3.50 - $ 6.00 108,672 4.7 $ 4.51 108,672 $ 4.51 $ 6.01 - $ 10.00 119,090 4.4 $ 6.68 119,090 $ 6.68 $ 10.01 - $ 15.00 503,383 7.5 $ 13.24 211,883 $ 13.50 $ 15.01 - $ 20.00 55,625 8.4 $ 17.35 23,125 $ 17.37 $ 20.01 - $ 25.00 135,738 6.1 $ 22.69 77,712 $ 22.63 $ 25.01 - $ 30.00 357,866 6.9 $ 27.67 161,491 $ 28.45 $ 30.01 - $ 34.88 17,023 8.2 $ 30.96 11,273 $ 31.26 1,297,397 6.7 $ 17.29 713,246 $ 15.78
In accordance with the provisions of SFAS 123, "Accounting for Stock-Based Compensation," the Company applies APB Opinion No. 25, "Accounting for Stock Issued to Employees," and related interpretations in accounting for its plans and does not recognize compensation expense for its stock-based compensation plans other than for restricted stock. If the Company had elected to recognize compensation expense based upon the fair value at the grant date for awards under these plans consistent with the methodology prescribed by SFAS No. 123, the Company's net income would have been reduced by $2.2 ($0.08 (basic) and $0.08 (diluted) per share), $2.9 ($0.12 (basic) and $0.11 (diluted) per share), and $3.4 ($0.16 (basic) and $0.15 (diluted) per share), in 2000, 1999 and 1998, respectively. The fair value for these options was estimated at the date of grant using the Black-Scholes option-pricing model with the following weighted-average assumptions for 2000, 1999 and 1998, respectively: dividend yields of 0%, 0% and 0%; expected volatility of 49.46%, 51.47% and 54.86% risk-free interest rates of 6.23%, 5.64% and 5.26%; and expected life of 9.7 years, 9.5 years and 9.3 years. The aggregate fair value of options granted during 2000, 1999 and 1998 for which the exercise price equals the market price on the grant date was $1.9, $3.6 and $8.1, respectively. The Black-Scholes option valuation model was developed for use in estimating the fair value of traded options which have no vesting restrictions and are fully transferable. In addition, option valuation models require the input of highly subjective assumptions including the expected stock price volatility. Because the Company's employee stock options have characteristics significantly different from those of traded options, and because changes in the subjective input assumptions can materially affect the fair value estimate, in management's opinion, the existing models do not necessarily provide a reliable single measure of the fair value of its employee stock options. Comprehensive Income . The following table reflects the accumulated balances of other comprehensive income.
Pension Liability
Adjustment
Cumulative Translation Adjustment
Accumulated Other
Comprehensive Income
Balance at December 31, 1997................................$ (1.8) $ (6.1) $ (7.9) Current year change................................................................ --- 3.8 3.8 Balance at December 31, 1998................................ (1.8) (2.3) (4.1) Current year change................................................................ 1.3 (13.3) (12.0) Balance at December 31, 1999................................ (0.5) (15.6) (16.1) Current year change................................................................ 0.2 (62.6) (62.4) Balance at December 31, 2000................................$ (0.3) $ (78.2) $ (78.5)

F - 22
NOTE L -- RETIREMENT PLANS Pension Plans US Plans - As of December 31, 1998, the Company maintained four defined benefit pension plans covering certain domestic employees (the "Terex Plans"). During 1999 the Company added four additional defined benefit pension plans in connection with the acquisitions of Powerscreen and Cedarapids. On June 30, 2000, four of the Company’s defined benefit pension plans merged into one of the Company’s other defined benefit pension plans. As a result of the merger, as of December 31, 2000, the Company maintained four defined benefit pension plans. The benefits for the plans covering the salaried employees are based primarily on years of service and employees' qualifying compensation during the final years of employment. Participation in the Terex Plans and the Cedarapids pension plan for salaried employees was frozen as of May 7, 1993 and October 15, 2000, respectively, and no participants will be credited with service following such date except that participants not fully vested will be credited with service for purposes of determining vesting only. The benefits for the plans covering the hourly employees are based primarily on years of service and a flat dollar amount per year of service. It is the Company's policy generally to fund these plans based on the minimum requirements of the Employee Retirement Income Security Act of 1974 (ERISA). Plan assets consist primarily of common stocks, bonds, and short-term cash equivalent funds. Other Postemployment Benefits The Company provides postemployment health and life insurance benefits to certain former salaried and hourly employees of Terex Cranes - Waverly Operations (also known as Koehring Cranes, Inc.), Cedarapids and Simplicity Engineering. The Company adopted SFAS No. 106, "Employers' Accounting for Postretirement Benefits Other than Pensions," on January 1, 1993. This statement requires accrual of postretirement benefits (such as health care benefits) during the years an employee provides service. Terex adopted the provisions of SFAS No. 106 using the delayed recognition method, whereby the amount of the unrecognized transition obligation at January 1, 1993 is recognized prospectively as a component of future years' net periodic postretirement benefit expense. The unrecognized transition obligation at January 1, 1993 was $4.5. Terex is amortizing this transition obligation over 12 years, the average remaining life expectancy of the participants.

F - 23
The liability of the Company's U.S. Plans, as of December 31, was as follows:
Pension Benefits Other Benefits 2000 1999 2000 1999
Change in benefit obligation: Benefit obligation at beginning of year $ 88.5 $ 37.0 $ 4.8 $ 2.5 Benefits obligation of plans acquired during the year........................................ ---
56.1 0.5
2.2
Service cost............................................... 1.3 0.6 0.2 --- Interest cost .............................................. 7.3 3.8 0.5 0.2 Impact of plan amendments .................... 0.9 1.0 1.2 0.5 Actuarial (gain) loss................................. 6.1 (6.6) 0.4 (0.3) Benefits paid ............................................. (7.1) (3.4) (0.7) (0.3)
Benefit obligation end of year.................. 97.0 88.5 6.9 4.8 Change in plan assets:
Fair value of plan assets at beginning of year ...................................................... 124.2
36.1 ---
---
Fair value of plan assets acquired during the year........................................ ---
80.0 ---
---
Actual return on plan assets .................. (13.4) 11.2 --- --- Employer contribution ............................ --- 0.3 0.7 0.3 Benefits paid............................................. (7.1) (3.4) (0.7) (0.3)
Fair value of plan assets at end of year... 103.7 124.2 --- ---
Funded status ............................................. 6.7 35.7 (6.9) (4.8) Unrecognized actuarial (gain) loss .......... 19.8 (10.5) (1.1) (1.4) Unrecognized prior service cost............... 4.3 1.3 1.1 --- Unrecognized transition obligation ......... --- --- 1.2 1.5 Net amount recognized.............................. $ 30.8 $ 26.5 $ (5.7) $ (4.7)
Amounts recognized in the Consolidated
Balance Sheet consist of: Prepaid benefit cost ............................... $ 33.0 $ 27.6 $ --- $ --- Accrued benefit liability........................ (2.5) (1.6) (5.7) (4.7) Accumulated other comprehensive income .................................................... 0.3
0.5 ---
---
Net amount recognized.............................. $ 30.8 $ 26.5 $ (5.7) $ (4.7)
Pension Benefits Other Benefits 2000 1999 2000 1999
Weighted-average assumptions as of December 31:
Discount rate........................................... 7.75% 7.75% 7.75% 7.75% Expected return on plan......................... 9.00% 9.00% 9.00% 9.00% Rate of compensation increase............ 4.50% 4.50% --- ---

F - 24
Pension Benefits Other Benefits 2000 1999 1998 2000 1999 1998
Components of net periodic cost: Service cost ............................................... $ 1.3 $ 0.6 $ 0.2 $ 0.2 $ --- $ --- Interest cost............................................... 7.3 3.8 2.4 0.5 0.2 0.2 Expected return on plan assets............... (10.6) (5.5) (2.5) --- --- --- Amortization of prior service cost.......... 0.4 0.1 0.1 --- --- --- Amortization of transition obligation .... --- --- --- 0.4 0.3 0.3 Recognized actuarial (gain)loss.............. (0.1) 0.1 0.2 (0.1) (0.1) (0.1) Curtailment (gain)loss.............................. (2.6) --- --- --- --- ---
Net periodic cost (benefit)......................... $ (4.3) $ (0.9) $ 0.4 $ 1.0 $ 0.4 $ 0.4
The projected benefit obligation, accumulated benefit obligation, and fair value of plan assets for the pension plans with accumulated benefit obligations in excess of plan assets were $14.3, $14.3 and $8.7, respectively, as of December 31, 2000, $12.2 , $12.2 and $10.5, respectively, as of December 31, 1999. The Company has five nonpension postretirement benefit plans. The health care plans are contributory with participants' contributions adjusted annually; the life insurance plan is noncontributory. For measurement purposes, a 7.55 percent annual rate of increase in the per capita cost of covered health care benefits was assumed for 2000. The rate was assumed to decrease gradually to 5.75 percent for 2005 and remain at that level thereafter. Assumed health care cost trend rates have a significant effect on the amounts reported for the health care plan. A one-percentage-point change in assumed health care cost trend rates would have the following effects:
1-Percentage- Point Increase
1-Percentage- Point Decrease
Effect on total service and interest cost components 5.06% (5.16)% Effect on postretirement benefit obligation 8.18% (7.83)%
International Plans – Terex Equipment Limited maintains a government-required defined benefit plan (which includes certain defined contribution elements) covering substantially all of its management employees. Terex Aerials Limited (Ireland) maintains two voluntary defined benefit plans covering its employees. O & K Mining maintains an unfunded noncontributory defined benefit plan covering substantially all of its employees. Fermec maintains a voluntary defined benefit pension plan covering substantially all of its employees.

F - 25
The liability of the Company’s International Plans as of December 31, was as follows:
Pension Benefits 2000 1999
Change in benefit obligation: Benefit obligation at beginning of year $ 13.0 $ 12.4 Benefits obligation of plans acquired during the year........................................ 41.3 ---
Service cost ............................................... 0.7 0.8 Interest cost............................................... 0.8 0.7 Actuarial (gain) loss................................. (0.9) (0.8) Benefits paid.............................................. (0.7) (0.1)
Benefit obligation end of year................... 54.2 13.0 Change in plan assets:
Fair value of plan assets at beginning of year....................................................... 8.9 7.6
Fair value of plan assets acquired during the year........................................ 37.6 ---
Actual return on plan assets .................. (0.2) 0.7 Employer contribution............................. 0.8 0.7 Benefits paid ............................................. (0.7) (0.1)
Fair value of plan assets at end of year... 46.4 8.9
Funded status.............................................. (7.8) (4.1) Unrecognized actuarial (gain) loss........... 2.8 (0.1) Unrecognized transition obligation.......... (0.1) (0.3) Net amount recognized .............................. $ (5.1) $ (4.5)
Amounts recognized in the Consolidated
Balance Sheet consist of: Prepaid benefit cost................................ $ 1.2 $ 0.8 Accrued benefit liability ........................ (6.3) (5.3)
Net amount recognized .............................. $ (5.1) $ (4.5)
Pension Benefits 2000 1999
The range of assumptions as of December 31:
Discount rate ........................................... 6.00%-8.00% 6.00%-8.00% Expected return on plan ......................... 6.25%-9.50% 6.00%-8.00% Rate of compensation increase............. 3.75%-6.00% 3.75%-6.00%

F - 26
Pension Benefits 2000 1999 1998
Components of net periodic benefit cost: Service cost ............................................... $ 0.7 $ 0.8 $ 0.7 Interest cost............................................... 0.8 0.7 0.8 Expected return on plan assets............... (0.6) (0.5) (0.5) Amortization of prior service cost.......... --- --- --- Amortization of transition obligation .... --- --- --- Recognized actuarial (gain)loss.............. --- --- ---
Net periodic benefit cost............................ $ 0.9 $ 1.0 $ 1.0
The projected benefit obligation, accumulated benefit obligation, and fair value of plan assets for the pension plans with accumulated benefit obligations in excess of plan assets were $46.8, $46.8 and $37.6, respectively, as of December 31, 2000, $5.3, $5.3 and $0, respectively, as of December 31, 1999. Saving Plans The Company sponsors various tax deferred savings plans into which eligible employees may elect to contribute a portion of their compensation. The Company may, but is not obligated to, contribute to certain of these plans. Company contributions to these plans were $2.5, $1.7 and $1.2 for the years ended December 31, 2000, 1999 and 1998, respectively. NOTE M -- LITIGATION AND CONTINGENCIES In the Company's lines of business numerous suits have been filed alleging damages for accidents that have arisen in the normal course of operations involving the Company's products. The Company is self-insured, up to certain limits, for these product liability exposures, as well as for certain exposures related to general, workers' compensation and automobile liability. Insurance coverage is obtained for catastrophic losses as well as those risks required to be insured by law or contract. The Company has recorded and maintains an estimated liability in the amount of management's estimate of the Company's aggregate exposure for such self-insured risks. The Company is involved in various other legal proceedings which have arisen in the normal course of its operations. The Company has recorded provisions for estimated losses in circumstances where a loss is probable and the amount or range of possible amounts of the loss is estimable. The Company's outstanding letters of credit totaled $45.9 at December 31, 2000. The letters of credit generally serve as collateral for certain liabilities included in the Consolidated Balance Sheet. Certain of the letters of credit serve as collateral guaranteeing the Company's performance under contracts. The Company has agreed to indemnify certain outside parties for losses related to a former subsidiary's worker compensation obligations. Some of the claims for which Terex is contingently obligated are also covered by bonds issued by an insurance company. The Company recorded liabilities for these contingent obligations representing management's estimate of the potential losses which the Company might incur. In connection with the Company’s sale of the Clark material handling business to Clark Material Handling Company (“CMHC”) in November 1996, CMHC assumed liabilities from Terex arising from product liability claims dealing with Clark material handling products manufactured prior to the date of the divestiture. In connection with CMHC’s voluntary filing for bankruptcy in 2000, CMHC has defaulted on its obligations to indemnify and defend the Company from such product liability claims. As a result of this situation, the Company recorded an expense of $7.3, net of income taxes, in the fourth quarter of 2000 representing the Company’s estimated liability for known product liability claims. NOTE N -- RELATED PARTY TRANSACTIONS On August 28, 1995, the Company's former chairman retired from his positions with the Company and its Board of Directors. In connection with his retirement, the Company (upon the recommendation of a committee comprised of its independent Directors and represented by independent counsel) and the former chairman executed a retirement agreement providing certain benefits to the former chairman and the Company. The agreement provides, among other things, for a five-year consulting

F - 27
engagement requiring the former chairman to make himself available to the Company to provide consulting services for certain portions of his time. The former chairman, or his designee, received a fee for consulting services which included payments in an amount, and a rate, equal to his 1995 base salary until December 31, 1996. The agreement also provides for the (i) granting of a five-year $1.8 million loan bearing interest at 6.56% per annum which is subject to being forgiven in increments over the five-year term of the agreement upon certain conditions, and (ii) equity grants having a maximum potential of 200.0 thousand shares of Terex Common Stock conditioned upon the Company achieving certain financial performance objectives in the future. During 1998 the former chairman received 150.0 thousand shares of common stock in accordance with this agreement. In contemplation of the execution of this retirement agreement, the Company advanced to the former chairman the principal amount of the forgivable loan. During 2000, 1999 and 1998, the Company forgave $0.1, $0.2 and $0.5, respectively, of principal on the loan along with the current interest. The Company, a director, certain former executives of the Comp any and a limited partnership that formerly provided certain administrative and other services to the Company, have been named parties in various legal proceedings. During 2000, 1999 and 1998, the Company incurred $0.5, $0.3 and $0.3, respectively, of legal fees and expenses on behalf of the Company, the director, former executives of the Company and the limited partnership that formerly provided certain administrative and other services to the Company named in the lawsuits. Ares Leverage Investment Fund L.P. ("Ares"), an affiliate of a director of the Company, participated as a lender under the 1998 Bank Credit Facility for the amount of $15.0. Ares received a fee of less than $0.1 for participating as a lender under the 1998 Bank Credit Facility. Ares Leveraged Investment Fund II, L.P. ("Ares II"), an affiliate of a director of the Company, and Ares participated as lenders under the 1999 Bank Credit Facility for the amount of $14.0. Ares and Ares II also received total fees of less than $0.1 for participating lenders under the 1999 Bank Credit Facility. Participation by Ares and Ares II as lenders under the 1999 Bank Credit Facility and the 1998 Bank Credit Facility was made in the ordinary course of Ares' and Ares II's business and on the same terms as all other lenders under the 1999 Bank Credit Facility and the 1998 Bank Credit Facility. Canadian Imperial Bank of Commerce, an affiliate of CIBC Oppenheimer Corp., of which a director (who has since resigned) of the Company is a managing director, is a lender with a commitment of up to $37.5 and a Co-Documentation Agent under the 1998 Bank Credit Facility. Canadian Imperial Bank of Commerce received a fee of $0.8 for acting as Co-Documentation Agent under the 1998 Bank Credit Facility. Participation by Canadian Imperial Bank of Commerce as a lender under the 1998 Bank Credit Facility was made in the ordinary course of its business and on the same terms as all other lenders under the 1998 Bank Credit Facility. In addition, CIBC Oppenheimer Corp. was retained by the Company in connection with the offering of the Senior Subordinated Notes. CIBC Oppenheimer Corp. was paid $0.4 as an underwriting discount upon issuance of the Senior Subordinated Notes on the same terms as all other underwriters. On Decemb er 31, 1997, a director of the Company retired as an officer of the Company. In connection with his retirement, the Company and the former officer entered into an agreement providing certain benefits to the former officer and the Company. Pursuant to the agreement, the former officer received an award of 5.0 thousand shares of Common Stock in consideration of his years of service to the Company. The agreement also provided for a two-year consulting engagement requiring the former officer to make himself available to the Company to provide consulting services for a certain portion of his time, for such services he received a consulting fee of $0.1 for services provided in 1999. On March 2, 2000, the Company made a loan to a director and officer of the Company for $3.0. The loan bears interest at 9% per annum and matures on March 31, 2005. The loan is full recourse to the director and officer and is secured by shares of the Common Stock owned by the director/officer and other employee benefits. During the year, the director and officer repaid $1.0 of the loan and the principal amount due to the Company was $2.0 at December 31, 2000. The Company requires that all transactions with affiliates be on terms no less favorable to the Company than could be obtained in comparable transactions with an unrelated person. The Board of Directors is advised in advance of any such proposed transaction or agreement and utilizes such procedures in evaluating their terms and provisions as are appropriate in light of the Board's fiduciary duties under Delaware law. In addition, the Company has an Audit Committee consisting solely of outside directors. One of the responsibilities of the Audit Committee is to review related party transactions.
F - 28
NOTE O-- BUSINESS SEGMENT INFORMATION The Company operates primarily in two industry segments: Terex Earthmoving and Terex Lifting. Terex Earthmoving designs, manufactures and markets large hydraulic excavators, loader backhoes, articulated and rigid off-highway trucks, high capacity surface mining trucks, mobile crushing and screening equipment, asphalt pavers, asphalt mixing plants and related components and replacement parts. These products are used primarily by construction, mining, logging, industrial and government customers in building roads, dams and commercial and residential buildings and supplying coal, minerals, sand and gravel. Terex Lifting designs, manufactures and markets telescopic mobile cranes (including rough terrain, truck and all-terrain mobile cranes), lattice boom cranes, tower cranes, utility aerial devices (including digger derricks and articulated aerial devices), telescopic materials handlers (including container stackers and rough terrain lift trucks), truck-mounted cranes (boom trucks), aerial work platforms (including scissors, articulated boom lifts and straight telescopic boom lifts) and related components and replacement parts. These products are used primarily for construction, repair and maintenance of infrastructure, buildings and manufacturing facilities, for material handling applications in the distribution, transportation and utilities industries as well as in the scrap, refuse and lumber industries. Included in the 2000 and 1999 Other are the results of operations of Amida, Bartell and Coleman since their date of acquisition, as well as general and corporate items for 2000, 1999 and 1998.

F - 29
Industry segment information is presented below:
2000 1999 1998 Sales Terex Earthmoving............................................................ $ 1,099.5 $ 878.9 $ 456.4 Terex Lifting....................................................................... 924.0 944.9 770.9 Other ................................................................................... 45.2 32.8 5.9 Total.................................................................................. $ 2,068.7 $ 1,856.6 $ 1,233.2
Income from Operations Terex Earthmoving............................................................ $ 104.6 $ 87.5 $ 41.7 Terex Lifting....................................................................... 94.8 86.4 82.1 Other ................................................................................... (1.1) 4.4 (1.8) Total.................................................................................. $ 198.3 $ 178.3 $ 122.0
Depreciation and Amortization Terex Earthmoving............................................................ $ 21.4 $ 15.6 $ 6.7 Terex Lifting....................................................................... 14.4 12.6 9.5 Other ................................................................................... 5.7 4.0 2.2 Total.................................................................................. $ 41.5 $ 32.2 $ 18.4
Capital Expenditures Terex Earthmoving............................................................ $ 8.9 $ 12.0 $ 4.8 Terex Lifting....................................................................... 14.2 8.3 7.5 Other ................................................................................... 1.1 1.1 0.8 Total.................................................................................. $ 24.2 $ 21.4 $ 13.1
Identifiable Assets Terex Earthmoving............................................................ $ 1,114.0 $ 1,158.4 Terex Lifting....................................................................... 652.9 781.6 Other ................................................................................... 825.4 772.7 Eliminations........................................................................ (608.6) (535.2) Total.................................................................................. $ 1,983.7 $ 2,177.5
Sales between segments areas are generally priced to recover costs plus a reasonable markup for profit. Geographic segment information is presented below:
2000 1999 1998 Sales United States ..................................................................... $ 1,048.9 $ 871.2 $ 600.6 United Kingdom................................................................ 213.1 151.3 100.0 Other European countries................................................ 384.3 353.2 242.1 All other.............................................................................. 422.4 480.9 290.5 Total.................................................................................. $ 2,068.7 $ 1,856.6 $ 1,233.2
Long-lived Assets United States ..................................................................... $ 58.5 $ 68.5 United Kingdom................................................................ 44.0 48.9 Other European Countries ............................................... 49.7 47.9 All other.............................................................................. 1.7 7.5 Total.................................................................................. $ 153.9 $ 172.8
The Company attributes sales to unaffiliated customers in different geographical areas on the basis of the location of the customer. Long-lived assets include net fixed assets which can be attributed to the specific geographic regions.

F - 30
The Company is not dependent upon any single customer. NOTE P -- CONSOLIDATING FINANCIAL STATEMENTS On March 31, 1998 and March 9, 1999, the Company issued and sold $150.0 and $100.0 aggregate principal amount, respectively, of the Senior Subordinated Notes. The Senior Subordinated Notes are jointly and severally guaranteed by the following wholly-owned subsidiaries of the Company (the “Wholly-owned Guarantors”): Terex Cranes, Inc., Koehring Cranes, Inc., Terex-Telelect, Inc., Terex-RO Corporation, Terex Aerials, Inc., Terex Mining Equipment, Inc., Payhauler Corp., O & K Orenstein & Koppel, Inc., The American Crane Corporation, Amida Industries, Inc. and Cedarapids, Inc. The financial results of O & K Orenstein & Koppel, Inc., The American Crane Corporation, Amida Industries, Inc. and Cedarapids, Inc. are included in the results of the Wholly-owned Guarantors since March 31, 1998, July 31, 1998, April 1, 1999, and August 26, 1999, their respective dates of acquisition. The Senior Subordinated Notes are also jointly and severally guaranteed by PPM Cranes, Inc., which is 92.4% owned by Terex. All subsidiaries of the Company except the Wholly-owned Guarantors and PPM Cranes, Inc. have not provided a guarantee of the Senior Subordinated Notes. The following summarized condensed consolidating financial information for the Company segregates the financial information of Terex Corporation, the Wholly-owned Guarantors, PPM Cranes, Inc. and the Non-guarantor Subsidiaries. Terex Corporation consists of parent company operations. Subsidiaries of the parent company are reported on the equity basis. Wholly-owned Guarantors combine the operations of the Wholly-owned Guarantor subsidiaries. Subsidiaries of Wholly-owned Guarantors that are not themselves guarantors are reported on the equity basis. PPM Cranes, Inc. consists of the operations of PPM Cranes, Inc. Its subsidiaries are reported on an equity basis. Non-guarantor Subsidiaries combine the operations of subsidiaries which have not provided a guarantee of the obligations of Terex Corporation under the 1998 Senior Subordinated Notes and the 1999 Senior Subordinated Notes.
Debt and goodwill allocated to subsidiaries is presented on an accounting "push-down" basis.
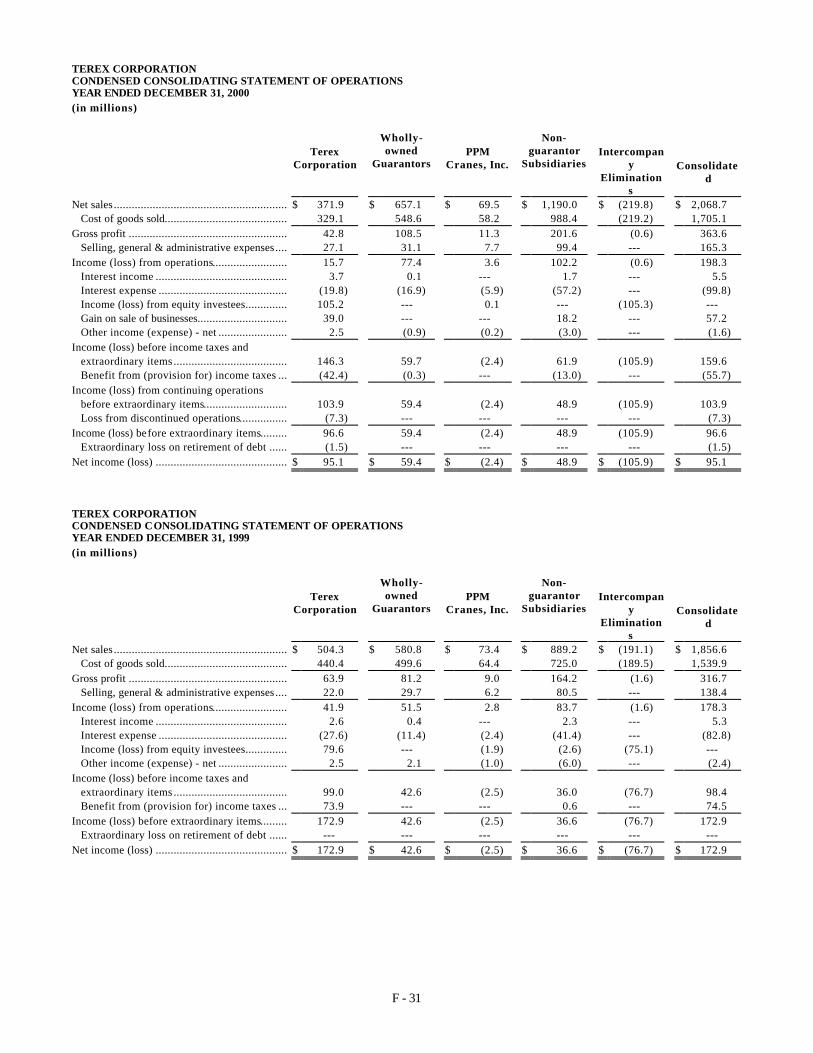
F - 31
TEREX CORPORATION CONDENSED CONSOLIDATING STATEMENT OF OPERATIONS YEAR ENDED DECEMBER 31, 2000 (in millions)
Terex
Corporation
Wholly- owned
Guarantors
PPM
Cranes, Inc.
Non- guarantor
Subsidiaries
Intercompan
y Elimination
s
Consolidated
Net sales .......................................................... $ 371.9 $ 657.1 $ 69.5 $ 1,190.0 $ (219.8) $ 2,068.7 Cost of goods sold......................................... 329.1 548.6 58.2 988.4 (219.2) 1,705.1
Gross profit ..................................................... 42.8 108.5 11.3 201.6 (0.6) 363.6 Selling, general & administrative expenses .... 27.1 31.1 7.7 99.4 --- 165.3
Income (loss) from operations......................... 15.7 77.4 3.6 102.2 (0.6) 198.3 Interest income ............................................ 3.7 0.1 --- 1.7 --- 5.5 Interest expense ........................................... (19.8) (16.9) (5.9) (57.2) --- (99.8) Income (loss) from equity investees.............. 105.2 --- 0.1 --- (105.3) --- Gain on sale of businesses.............................. 39.0 --- --- 18.2 --- 57.2 Other income (expense) - net ....................... 2.5 (0.9) (0.2) (3.0) --- (1.6)
Income (loss) before income taxes and extraordinary items ...................................... 146.3 59.7 (2.4) 61.9 (105.9) 159.6 Benefit from (provision for) income taxes ... (42.4) (0.3) --- (13.0) --- (55.7)
Income (loss) from continuing operations before extraordinary items............................ 103.9 59.4 (2.4) 48.9 (105.9) 103.9 Loss from discontinued operations................ (7.3) --- --- --- --- (7.3)
Income (loss) before extraordinary items......... 96.6 59.4 (2.4) 48.9 (105.9) 96.6 Extraordinary loss on retirement of debt ...... (1.5) --- --- --- --- (1.5)
Net income (loss) ............................................ $ 95.1 $ 59.4 $ (2.4) $ 48.9 $ (105.9) $ 95.1
TEREX CORPORATION CONDENSED CONSOLIDATING STATEMENT OF OPERATIONS YEAR ENDED DECEMBER 31, 1999 (in millions)
Terex
Corporation
Wholly- owned
Guarantors
PPM
Cranes, Inc.
Non- guarantor
Subsidiaries
Intercompan
y Elimination
s
Consolidated
Net sales .......................................................... $ 504.3 $ 580.8 $ 73.4 $ 889.2 $ (191.1) $ 1,856.6 Cost of goods sold......................................... 440.4 499.6 64.4 725.0 (189.5) 1,539.9
Gross profit ..................................................... 63.9 81.2 9.0 164.2 (1.6) 316.7 Selling, general & administrative expenses .... 22.0 29.7 6.2 80.5 --- 138.4
Income (loss) from operations......................... 41.9 51.5 2.8 83.7 (1.6) 178.3 Interest income ............................................ 2.6 0.4 --- 2.3 --- 5.3 Interest expense ........................................... (27.6) (11.4) (2.4) (41.4) --- (82.8) Income (loss) from equity investees.............. 79.6 --- (1.9) (2.6) (75.1) --- Other income (expense) - net ....................... 2.5 2.1 (1.0) (6.0) --- (2.4)
Income (loss) before income taxes and extraordinary items ......................................
99.0
42.6
(2.5)
36.0
(76.7)
98.4
Benefit from (provision for) income taxes ... 73.9 --- --- 0.6 --- 74.5 Income (loss) before extraordinary items......... 172.9 42.6 (2.5) 36.6 (76.7) 172.9
Extraordinary loss on retirement of debt ...... --- --- --- --- --- --- Net income (loss) ............................................ $ 172.9 $ 42.6 $ (2.5) $ 36.6 $ (76.7) $ 172.9

F - 32
TEREX CORPORATION CONDENSED CONSOLIDATING STATEMENT OF OPERATIONS YEAR ENDED DECEMBER 31, 1998 (in millions)
Terex
Corporation
Wholly- owned
Guarantors
PPM
Cranes, Inc.
Non- guarantor
Subsidiaries
Intercompan
y Elimination
s
Consolidated
Net sales.......................................................... $ 208.9 $ 445.7 $ 84.9 $ 616.8 $ (123.1) $ 1,233.2 Cost of goods sold......................................... 174.0 360.8 74.7 516.4 (118.5) 1,007.4
Gross profit ..................................................... 34.9 84.9 10.2 100.4 (4.6) 225.8 Selling, general & administrative expenses .... 20.5 24.5 3.4 55.4 --- 103.8
Income (loss) from operations......................... 14.4 60.4 6.8 45.0 (4.6) 122.0 Interest income ............................................ 1.0 0.5 --- 1.2 --- 2.7 Interest expense ........................................... (8.5) (8.0) (5.4) (25.3) --- (47.2) Income (loss) from equity investees.............. 36.8 5.5 (1.1) --- (41.2) --- Other income (expense) - net ....................... (0.7) (0.4) (0.2) (1.7) --- (3.0)
Income (loss) before income taxes and extraordinary items ......................................
43.0
58.0
0.1
19.2
(45.8)
74.5
Benefit from (provision for) income taxes ... --- --- --- (1.7) --- (1.7) Income (loss) before extraordinary items......... 43.0 58.0 0.1 17.5 (45.8) 72.8
Extraordinary loss on retirement of debt ...... (8.5) (5.0) (10.4) (14.4) --- (38.3) Net income (loss) ............................................ $ 34.5 $ 53.0 $ (10.3) $ 3.1 $ (45.8) $ 34.5

F - 33
TEREX CORPORATION CONDENSED CONSOLIDATING BALANCE SHEET DECEMBER 31, 2000 (in millions)
Terex
Corporation
Wholly- Owned
Guarantors
PPM
Cranes, Inc.
Non- Guarantor
Subsidiaries
Intercompan
y Elimination
s
Consolidated
Assets Current assets
Cash and cash equivalents ........................ $ 108.7 $ 0.3 $ 0.1 $ 72.3 $ --- $ 181.4 Trade receivables - net ............................. 22.2 70.7 8.7 258.6 --- 360.2 Intercompany receivables ........................ 36.4 28.9 17.5 60.7 (143.5) --- Net inventories........................................ 75.2 157.0 16.3 360.4 (10.8) 598.1 Current deferred tax assets....................... 51.0 --- --- --- --- 51.0 Other current assets................................. 4.5 1.6 0.3 45.3 --- 51.7
Total current assets ............................. 298.0 258.5 42.9 797.3 (154.3) 1,242.4 Property, plant & equipment - net .............. 12.7 40.7 0.6 99.9 --- 153.9 Investment in and advances to (from)
subsidiaries............................................... 346.1 (117.6) (1.5) (137.3) (89.7) --- Long-term deferred tax assets...................... 21.2 --- --- --- --- 21.2 Goodwill - net .............................................. 11.1 168.1 11.9 300.3 --- 491.4 Other assets - net ......................................... 8.1 35.2 0.7 30.8 --- 74.8
Total assets ..................................................... $ 697.2 $ 384.9 $ 54.6 $ 1,091.0 $ (244.0) $ 1,983.7
Liabilities and stockholders' equity (deficit)
Current liabilities Notes payable and current portion of
long-term debt ..................................... $ 0.8
$ ---
$ 0.5
$ 19.2
$ ---
$ 20.5
Trade accounts payable............................ 32.7 57.0 10.2 211.3 --- 311.2 Intercompany payables............................ 3.8 15.2 9.3 115.2 (143.5) --- Current deferred tax liabilities .................. --- --- --- --- --- --- Accruals and other current liabilities ........ 74.8 35.7 7.4 126.0 --- 243.9
Total current liabilities ........................ 112.1 107.9 27.4 471.7 (143.5) 575.6 Long-term debt less current portion............. 117.0 163.9 62.6 538.5 --- 882.0 Other long-term liabilities............................ 16.6 12.1 1.2 44.7 --- 74.6 Stockholders' equity (deficit)........................ 451.5 101.0 (36.6) 36.1 (100.5) 451.5
Total liabilities and stockholders' equity
(deficit) ....................................................... $ 697.2 $ 384.9 $ 54.6 $ 1,091.0 $ (244.0) $ 1,983.7

F - 34
TEREX CORPORATION CONDENSED CONSOLIDATING BALANCE SHEET DECEMBER 31, 1999 (in millions)
Terex
Corporation
Wholly- owned
Guarantors
PPM
Cranes, Inc.
Non- Guarantor
Subsidiaries
Intercompan
y Elimination
s
Consolidated
Assets Current assets
Cash and cash equivalents ........................ $ 64.3 $ 1.7 $ 0.1 $ 67.2 $ --- $ 133.3 Trade receivables - net ............................. 90.2 103.5 21.3 214.2 --- 429.2 Intercompany receivables ........................ 8.8 26.1 13.7 57.0 (105.6) --- Net inventories........................................ 130.3 190.2 18.2 330.7 (3.8) 665.6 Other current assets................................. 50.2 8.8 --- 28.2 --- 87.2
Total current assets ............................. 343.8 330.3 53.3 697.3 (109.4) 1,315.3 Property, plant & equipment - net .............. 17.3 49.1 0.1 106.3 --- 172.8 Investment in and advances to (from)
subsidiaries...............................................
311.4
(185.7)
(20.6)
(95.2)
(9.9)
--- Goodwill - net .............................................. 28.7 151.5 12.0 362.5 --- 554.7 Other assets - net ......................................... 74.5 28.0 0.4 31.8 --- 134.7
Total assets ..................................................... $ 775.7 $ 373.2 $ 45.2 $ 1,102.7 $ (119.3) $ 2,177.5
Liabilities and stockholders' equity (deficit)
Current liabilities Notes payable and current portion of
long-term debt ..................................... $
16.6
$
(0.8)
$
0.8
$
41.0
$
---
$
57.6
Trade accounts payable............................ 41.4 53.3 6.4 195.9 --- 297.0 Intercompany payables............................ 30.6 15.9 4.5 54.1 (105.1) --- Accruals and other current liabilities ........ 68.5 30.2 7.5 118.7 ---- 224.9
Total current liabilities ........................ 157.1 98.6 19.2 409.7 (105.1) 579.5 Long-term debt less current portion............. 170.8 223.7 59.8 644.5 --- 1,098.8 Other long-term liabilities............................ 15.0 9.3 0.4 41.7 --- 66.4 Stockholders' equity (deficit)........................ 432.8 41.6 (34.2) 6.8 (14.2) 432.8
Total liabilities and stockholders' equity
(deficit) ....................................................... $ 775.7 $ 373.2 $ 45.2 $ 1,102.7 $ (119.3) $ 2,177.5

F - 35
TEREX CORPORATION CONDENSED CONSOLIDATING STATEMENT OF CASH FLOWS YEAR ENDED DECEMBER 31, 2000 (in millions)
Terex
Corporation
Wholly- owned
Guarantors
PPM
Cranes, Inc.
Non- guarantor
Subsidiaries
Intercompan
y Elimination
s
Consolidated
Net cash provided by (used in) operating activities
$ 180.2 $ 4.9 $ 1.1 $ 14.4 $ --- $ 200.6
Cash flows from investing activities: Proceeds from sale of business ...................... 51.8 --- --- 92.5 --- 144.3 Acquisition of business, net of cash acquired.. (2.9) (0.5) --- (16.6) --- (20.0) Capital expenditures ..................................... (2.5) (12.6) (0.3) (8.8) --- (24.2) Proceeds from sale of assets.......................... --- 6.8 --- 4.0 --- 10.8 Net cash provided by (used in) investing
activities.................................................. 46.4 (6.3) (0.3) 71.1 --- 110.9 Cash flows from financing activities:
Principal repayments of long-term debt ......... (161.0) --- (0.8) (21.3) --- (183.1) Net borrowings (repayments) under revolving
line of credit agreements.............................. --- --- --- (53.6) (53.6) Purchases of common stock held in treasury.. (20.2) --- --- --- --- (20.2) Proceeds from issuance of long-term debt, net
of issuance costs .......................................... --- --- --- --- --- --- Payment of premiums on early
extinguishment of debt ................................ --- --- --- --- --- --- Issuance of common stock............................. --- --- --- --- --- --- Other............................................................. (1.0) --- --- (3.3) (4.3) Net cash provided by (used in) financing
activities.................................................. (182.2) --- (0.8) (78.2) --- (261.2) Effect of exchange rates on cash and cash
equivalents..................................................... --- --- --- (2.2) --- (2.2) Net (decrease) increase in cash and cash
equivalents..................................................... 44.4 (1.4) --- 5.1 48.1 Cash and cash equivalents, beginning of period. 64.3 1.7 0.1 67.2 --- 133.3 Cash and cash equivalents, end of period.......... $ 108.7 $ 0.3 $ 0.1 $ 72.3 $ --- $ 181.4
TEREX CORPORATION CONDENSED CONSOLIDATING STATEMENT OF CASH FLOWS YEAR ENDED DECEMBER 31, 1999 (in millions)
Terex
Corporation
Wholly- owned
Guarantors
PPM
Cranes, Inc.
Non- guarantor
Subsidiaries
Intercompan
y Elimination
s
Consolidated
Net cash provided by (used in) operating activities
$ 326.5 $ (124.8) $ 0.6 $ (197.3) $ --- $ 5.0
Cash flows from investing activities: Acquisition of business, net of cash acquired.. (535.6) --- --- --- --- (535.6) Capital expenditures ..................................... (3.3) (4.6) (0.2) (13.3) --- (21.4) Proceeds from sale of assets.......................... --- 2.6 0.4 1.0 --- 4.0 Net cash provided by (used in) investing
activities.................................................. (538.9) (2.0) 0.2 (12.3) --- (553.0) Cash flows from financing activities:
Proceeds from issuance of long-term debt, net of issuance costs ..........................................
123.7
128.0
---
282.9
---
534.6
Net borrowings (repayments) under revolving line of credit agreements..............................
(1.5)
---
---
(15.8)
---
(17.3)
Principal repayments of long-term debt ......... (18.7) (0.2) (0.8) (14.0) --- (33.7) Payment of premiums on early
extinguishment of debt ................................
---
---
---
---
---
---
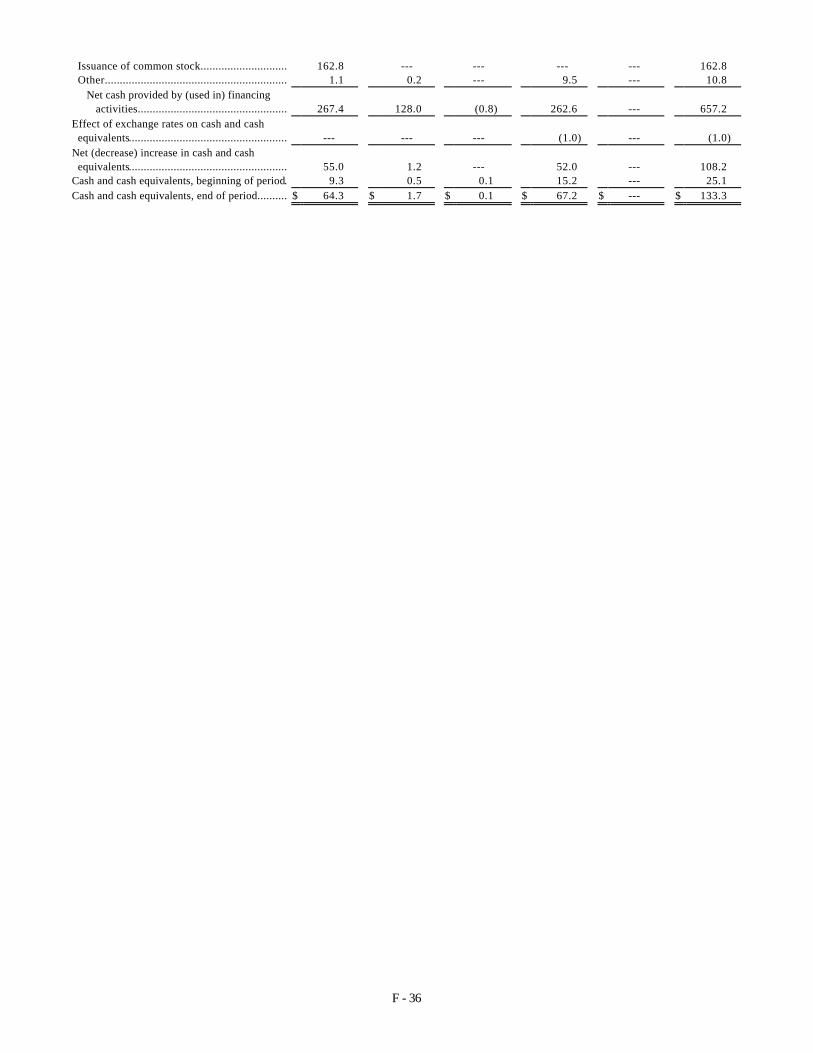
F - 36
Issuance of common stock............................. 162.8 --- --- --- --- 162.8 Other............................................................. 1.1 0.2 --- 9.5 --- 10.8 Net cash provided by (used in) financing
activities.................................................. 267.4 128.0 (0.8) 262.6 --- 657.2 Effect of exchange rates on cash and cash
equivalents.....................................................
---
---
---
(1.0)
---
(1.0) Net (decrease) increase in cash and cash
equivalents.....................................................
55.0
1.2
---
52.0
---
108.2 Cash and cash equivalents, beginning of period. 9.3 0.5 0.1 15.2 --- 25.1 Cash and cash equivalents, end of period.......... $ 64.3 $ 1.7 $ 0.1 $ 67.2 $ --- $ 133.3

F - 37
TEREX CORPORATION CONDENSED CONSOLIDATING STATEMENT OF CASH FLOWS YEAR ENDED DECEMBER 31, 1998 (in millions)
Terex
Corporation
Wholly- owned
Guarantors
PPM
Cranes, Inc.
Non- guarantor
Subsidiaries
Intercompan
y Elimination
s
Consolidated
Net cash provided by (used in) operating activities
$ 6.6 $ (0.8) $ (1.4) $ (23.9) $ --- $ (19.5)
Cash flows from investing activities: Acquisition of business, net of cash acquired.. (184.9) --- --- (26.4) --- (211.3) Capital expenditures ..................................... (1.7) (4.1) (0.1) (7.2) --- (13.1) Proceeds from sale of assets.......................... --- 1.9 0.2 0.3 --- 2.4 Net cash provided by (used in) investing
activities..................................................... (186.6) (2.2) 0.1 (33.3) --- (222.0) Cash flows from financing activities:
Proceeds from issuance of long-term debt, net of issuance costs ..........................................
254.4
90.8
58.6
109.8
---
513.6
Net borrowings (repayments) under revolving line of credit agreements..............................
(24.9)
(64.1)
0.5
17.0
---
(71.5)
Principal repayments of long-term debt ......... (39.3) (20.1) (47.9) (63.5) --- (170.8) Payment of premiums on early
extinguishment of debt ................................
(6.0)
(3.7)
(8.6)
(10.7)
---
(29.0) Other............................................................. --- --- (1.2) (1.8) --- (3.0) Net cash provided by (used in) financing
activities..................................................... 184.2 2.9 1.4 50.8 --- 239.3 Effect of exchange rates on cash and cash
equivalents.....................................................
(0.5)
0.5
---
(1.4)
---
(1.4) Net (decrease) increase in cash and cash
equivalents.....................................................
3.7
0.4
0.1
(7.8)
---
(3.6) Cash and cash equivalents, beginning of period. 5.6 0.1 --- 23.0 --- 28.7 Cash and cash equivalents, end of period.......... $ 9.3 $ 0.5 $ 0.1 $ 15.2 $ --- $ 25.1

F - 38
NOTE Q – SUBSEQUENT EVENT (UNAUDITED) On March 14, 2000, the Company announced that it intends to issue approximately $200 principal amount of Senior Subordinated Notes Due 2011 (“New Notes”) and increase the availability under its existing revolving bank credit facility maturing March 2004 from $125 to $300. The Company also announced at that time that it is negotiating an amendment to its existing bank credit agreements to provide the Company with greater operating flexibility. The Company intends to use the net proceeds from the offering of the New Notes to prepay a portion of its existing term loans. It is intended that the Company will offer the New Notes pursuant to Rule 144A promulgated under the Securities Act of 1933, as amended (the “Act”), and that the New Notes will not initially be regis tered under the Act. Accordingly, the New Notes will not be able to be offered or sold in the United States absent registration under the Act or an applicable exemption from the registration requirements. There can be no assurances as to whether these transactions, or any other financing transaction, will occur, or as to the timing or definitive terms of any such transaction.

F - 39
REPORT OF INDEPENDENT ACCOUNTANTS
To the Board of Directors and Shareholders of PPM Cranes, Inc. In our opinion, the accompanying consolidated balance sheets and the related consolidated statements of operations, of changes in shareholders' deficit and of cash flows present fairly, in all material respects, the financial position of PPM Cranes, Inc. and its subsidiaries (the "Company") at December 31, 2000 and 1999, and the results of their operations and their cash flows for each of the three years in the period ended December 31, 2000, in conformity with accounting principles generally accepted in the United States of America. These financial statements are the responsibility of the Company's management; our responsibility is to express an opinion on these financial statements based on our audits. We conducted our audits of these statements in accordance with auditing standards generally accepted in the United States of America, which require that we plan and perform the audit to obtain reasonable assurance about whether the financial statements are free of material misstatement. An audit includes examining, on a test basis, evidence supporting the amounts and disclosures in the financial statements, assessing the accounting principles used and significant estimates made by management, and evaluating the overall financial statement presentation. We believe that our audits provide a reasonable basis for our opinion. PricewaterhouseCoopers LLP Stamford, Connecticut February 19, 2001

F - 40
PPM Cranes, Inc.
Consolidated Statement of Operations
(in millions)
Year Ended December 31, 2000 1999 1998 Net sales ................................................................................................$ 69.5 $ 80.4 $ 92.4 Cost of goods sold ................................................................ 58.2 70.2 81.2 Gross profit ................................................................................................ 11.3 10.2 11.2
Selling, general and administrative expenses ................................ 7.7 7.2 4.5 Income (loss) from operations ................................................................ 3.6 3.0 6.7
Other income (expense): Interest expense................................................................ (5.8) (4.8) (5.8) Amortization of debt issuance costs ................................ (0.2) (0.2) (0.3) Other income (expense)................................................................ --- (0.5) --- Income (loss) before income taxes ................................ (2.4) (2.5) 0.6
Provision for income taxes................................................................ --- --- --- Income (loss) before extraordinary items ................................
(2.4)
(2.5)
0.6
Extraordinary loss on retirement of debt ................................
---
---
(10.9)
Net loss................................................................................................$ (2.4) $ (2.5) $ (10.3)
The accompanying notes are an integral part of these financial statements.
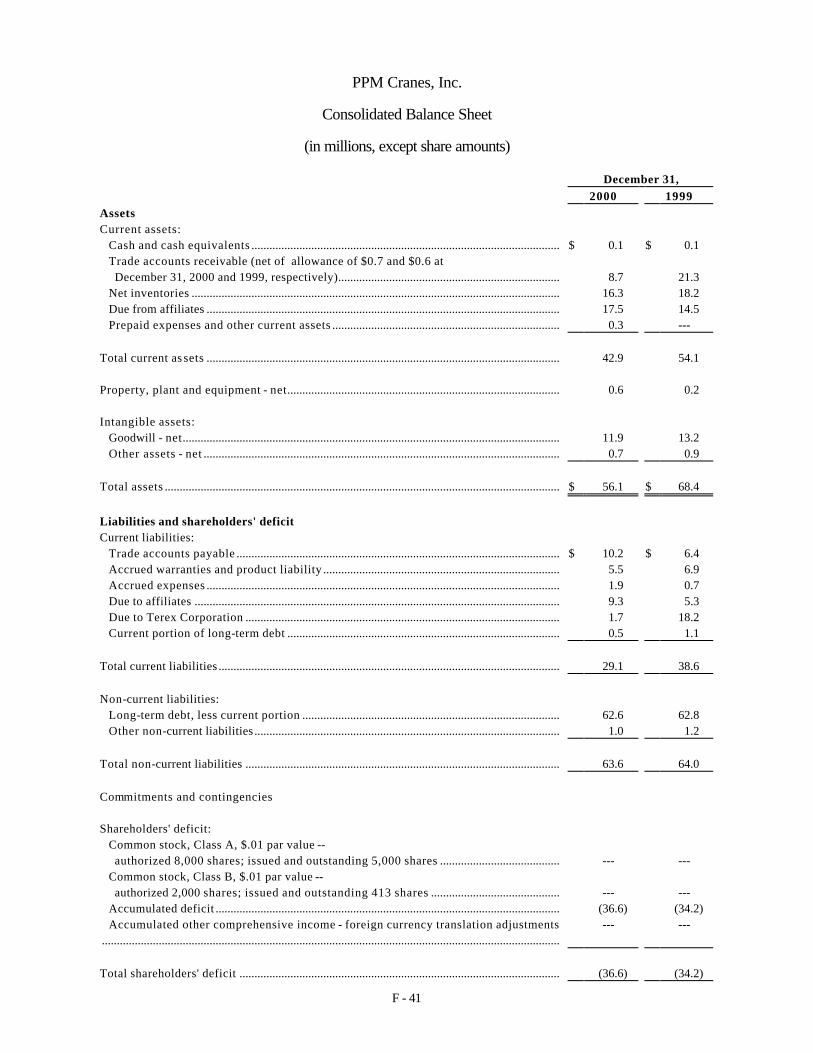
F - 41
PPM Cranes, Inc.
Consolidated Balance Sheet
(in millions, except share amounts)
December 31, 2000 1999
Assets Current assets:
Cash and cash equivalents ....................................................................................................... $ 0.1 $ 0.1 Trade accounts receivable (net of allowance of $0.7 and $0.6 at December 31, 2000 and 1999, respectively).......................................................................... 8.7 21.3
Net inventories ........................................................................................................................... 16.3 18.2 Due from affiliates ...................................................................................................................... 17.5 14.5 Prepaid expenses and other current assets ............................................................................ 0.3 ---
Total current as sets ...................................................................................................................... 42.9 54.1 Property, plant and equipment - net........................................................................................... 0.6 0.2 Intangible assets:
Goodwill - net.............................................................................................................................. 11.9 13.2 Other assets - net ....................................................................................................................... 0.7 0.9
Total assets .................................................................................................................................... $ 56.1 $ 68.4
Liabilities and shareholders' deficit Current liabilities:
Trade accounts payable ............................................................................................................ $ 10.2 $ 6.4 Accrued warranties and product liability ............................................................................... 5.5 6.9 Accrued expenses ...................................................................................................................... 1.9 0.7 Due to affiliates .......................................................................................................................... 9.3 5.3 Due to Terex Corporation ......................................................................................................... 1.7 18.2 Current portion of long-term debt ........................................................................................... 0.5 1.1
Total current liabilities .................................................................................................................. 29.1 38.6
Non-current liabilities:
Long-term debt, less current portion ...................................................................................... 62.6 62.8 Other non-current liabilities ...................................................................................................... 1.0 1.2
Total non-current liabilities ......................................................................................................... 63.6 64.0
Commitments and contingencies Shareholders' deficit:
Common stock, Class A, $.01 par value -- authorized 8,000 shares; issued and outstanding 5,000 shares ........................................ --- ---
Common stock, Class B, $.01 par value -- authorized 2,000 shares; issued and outstanding 413 shares ........................................... --- ---
Accumulated deficit ................................................................................................................... (36.6) (34.2) Accumulated other comprehensive income - foreign currency translation adjustments
......................................................................................................................................................... --- ---
Total shareholders' deficit ........................................................................................................... (36.6) (34.2)

F - 42
Total liabilities and shareholders' deficit ................................................................................... $ 56.1 $ 68.4
The accompanying notes are an integral part of these financial statements.

F - 43
PPM Cranes, Inc.
Consolidated Statement of Changes of Shareholders' Deficit
(in millions)
Common Stock
Accumulated Deficit
Accumulated Other
Comprehensive Income (Loss)
Total Balance at December 31, 1997............... $ --- $ (21.4) $ (0.3) $ (21.7)
Net loss ............................................. --- (10.3) --- (10.3) Translation adjustment................... --- --- 0.2 0.2 Comprehensive loss........................ (10.1)
Balance at December 31, 1998............... --- (31.7) (0.1) (31.8)
Net loss ............................................. --- (2.5) --- (2.5) Translation adjustment................... --- --- 0.1 0.1 Comprehensive loss........................ (2.4)
Balance at December 31, 1999 --- (34.2) --- (34.2)
Net loss ............................................. --- (2.4) --- (2.4) Translation adjustment................... --- --- --- --- Comprehensive loss........................ --- --- --- (2.4)
Balance at December 31, 2000 $ --- $ (36.6) $ --- $ (36.6)
The accompanying notes are an integral part of these financial statements.
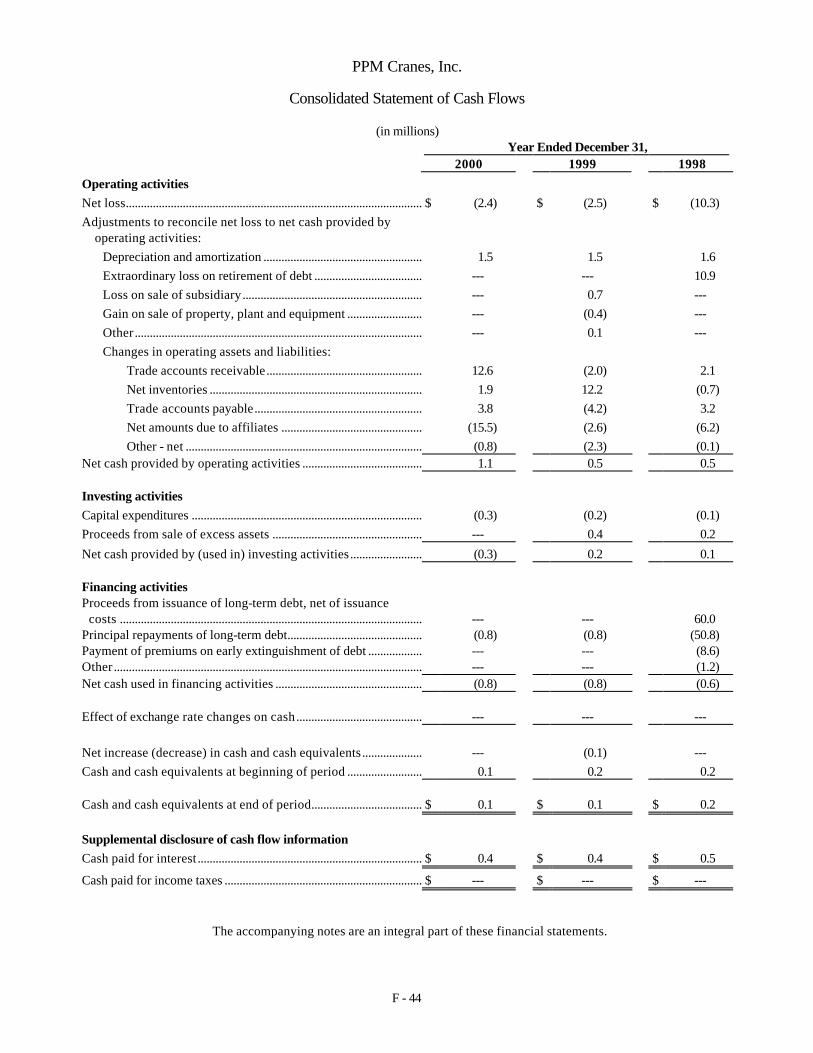
F - 44
PPM Cranes, Inc.
Consolidated Statement of Cash Flows
(in millions) Year Ended December 31,
2000 1999 1998
Operating activities
Net loss.............................................................................................................................$ (2.4) $ (2.5) $ (10.3)
Adjustments to reconcile net loss to net cash provided by operating activities:
Depreciation and amortization ................................................................ 1.5 1.5 1.6
Extraordinary loss on retirement of debt .............................................................. --- --- 10.9
Loss on sale of subsidiary................................................................ --- 0.7 ---
Gain on sale of property, plant and equipment ................................ --- (0.4) ---
Other ................................................................................................ --- 0.1 ---
Changes in operating assets and liabilities:
Trade accounts receivable................................................................ 12.6 (2.0) 2.1
Net inventories ................................................................................................ 1.9 12.2 (0.7)
Trade accounts payable................................................................ 3.8 (4.2) 3.2
Net amounts due to affiliates ................................................................ (15.5) (2.6) (6.2)
Other - net ................................................................................................ (0.8) (2.3) (0.1) Net cash provided by operating activities ................................................................ 1.1 0.5 0.5 Investing activities
Capital expenditures ................................................................................................ (0.3) (0.2) (0.1)
Proceeds from sale of excess assets ................................................................ --- 0.4 0.2
Net cash provided by (used in) investing activities................................ (0.3) 0.2 0.1 Financing activities Proceeds from issuance of long-term debt, net of issuance
costs ............................................................................................................................... ---
---
60.0 Principal repayments of long-term debt................................................................ (0.8) (0.8) (50.8) Payment of premiums on early extinguishment of debt ................................ --- --- (8.6) Other ................................................................................................................................ --- --- (1.2) Net cash used in financing activities ................................................................ (0.8) (0.8) (0.6) Effect of exchange rate changes on cash ................................................................ --- --- ---
Net increase (decrease) in cash and cash equivalents................................ --- (0.1) ---
Cash and cash equivalents at beginning of period ................................ 0.1 0.2 0.2
Cash and cash equivalents at end of period...............................................................$ 0.1 $ 0.1 $ 0.2
Supplemental disclosure of cash flow information
Cash paid for interest ................................................................................................$ 0.4 $ 0.4 $ 0.5
Cash paid for income taxes ............................................................................................$ --- $ --- $ ---
The accompanying notes are an integral part of these financial statements.

F - 45
PPM CRANES, INC.
NOTES TO CONSOLIDATED FINANCIAL STATEMENTS
DECEMBER 31, 2000
(In millions of dollars) NOTE 1 -- DESCRIPTION OF THE BUSINESS AND BASIS OF PRESENTATION PPM Cranes, Inc. (the "Company" or "PPM") is engaged in the design, manufacture, marketing and worldwide distribution and support of construction equipment, primarily hydraulic cranes and related spare parts. On May 9, 1995, Terex Corporation, through its wholly-owned subsidiary Terex Cranes, Inc., completed the acquisition of all of the capital stock of Legris Industries, Inc., a Delaware corporation which owns 92.4% of the capital stock of PPM Cranes, Inc. Terex Corporation and Terex Cranes, Inc., are both Delaware corporations. Prior to the acquisition of Legris Industries, Inc. by Terex Cranes, Inc. on May 9, 1995, Legris Industries, Inc. was a holding company, with no assets, liabilities, or operations other than its investment in PPM. The financial statements reflect Terex Corporation's basis in the assets and liabilities of the Company which was accounted for as a purchase transaction. As a result, the debt and goodwill associated with the acquisition have been "pushed down" to the Company's financial statements. NOTE 2 -- SUMMARY OF SIGNIFICANT ACCOUNTING POLICIES Principles of Consolidation. The consolidated financial statements include the accounts of the Company and its wholly-owned inactive subsidiary PPM Far East Private Ltd. Prior to November 30, 1999 the accounts of the Company's other wholly-owned subsidiary, PPM of Australia Pty. Ltd. ("PPM Australia"), were also included. On November 30, 1999, the Company sold its ownership in PPM Australia to Terex Corporation for $1.2, resulting in a loss of $0.7, which has been included in other income (expense). All material intercompany transactions and profits have been eliminated. Use of Estimates. The preparation of financial statements in conformity with generally accepted accounting principles requires management to make estimates and assumptions that affect the reported amounts of assets and liabilities and disclosure of contingent assets and liabilities at the date of the financial statements and the reported amounts of revenues and expenses during the reporting period. Actual results could differ from those estimates. Inventories. Inventories are stated at the lower of cost or market. Cost is determined by the first-in, first-out (FIFO) method. Property, Plant and Equipment. Additions and major replacements or improvements to property, plant and equipment are recorded at cost. Maintenance, repairs and minor replacements are charged to expense when incurred. Plant and equipment are depreciated over the estimated useful lives of the assets under the straight-line method of depreciation for financial reporting purposes and both straight-line and other methods for tax purposes. Goodwill. Goodwill, representing the difference between the total purchase price and the fair value of assets (tangible and intangible) and liabilities at the date of acquisition, is amortized on a straight-line basis over fifteen years. Accumulated amortization is $7.3 and $6.0 at December 31, 2000 and 1999, respectively. Debt Issuance Costs. Debt issuance costs incurred by Terex Corporation in securing the financing related to acquiring the Company have been capitalized and are reflected in the financial statements. Capitalized debt issuance costs are amortized over the term of the related debt. Accumulated amortization is $0.6 and $0.4 at December 31, 2000 and 1999, respectively. Impairment of Long Lived Assets. The Company's policy is to assess the realizability of its long lived assets and to evaluate such assets for impairment whenever events or changes in circumstances indicate that the carrying amount of such assets (or group of assets) may not be recoverable. Impairment is determined to exist if the estimated future undiscounted cash flows is less than its carrying value. The amount of any impairment then recognized would be calculated as the difference between estimated future discounted cash flows and the carrying value of the asset.

F - 46
Product Liability and Warranty. The Company records accruals for potential warranty and product liability claims based on the Company's claim experience. Warranty costs are accrued at the time revenue is recognized. The Company provides self-insurance accruals for estimated product liability experience on known claims. Income Taxes. Income taxes are provided using the liability method in accordance with Statement of Financial Accounting Standards ("SFAS") No. 109, "Accounting for Income Taxes." The Company is a part of a group that files a consolidated income tax return. The method used to allocate income taxes to members of the group is one in which current and deferred income taxes are calculated on a separate return basis as if the Company had not been included in a consolidated income tax return with its parent. The tax benefit associated with the 1998 Bank Credit Facility (as defined in Note 5) has been taken into account in the Company's tax provision. Revenue Recognition. Revenue and costs are generally recorded when products are shipped and invoiced to either independently owned and operated dealers or to customers. Certain new units may be invoiced prior to the time customers take physical possession. Revenue is recognized in such cases only when the customer has a fixed commitment to purchase the units, the units have been completed, tested and made available to the customer for pickup or delivery, and the customer has requested that the Company hold the units for pickup or delivery at a time specified by the customer. In such cases, the units are invoiced under the Company's customary billing terms, title to the units and risks of ownership pass to the customer upon invoicing, the units are segregated from the Company's inventory and identified as belonging to the customer and the Company has no further obligations under the order. Foreign Currency Translation. Assets and liabilities of the Company's international operations are translated at year-end exchange rates. Income and expenses are translated at average exchange rates prevailing during the year. For operations whose functional currency is the local currency, translation adjustments are accumulated in the Cumulative Translation Adjustment component of Stockholders' Deficit. Gains or (losses) resulting from foreign currency transactions are recorded in the accounts based on the underlying transaction. During 1999, the Company recognized a loss of $0.1 in other income (expense) related to the cumulative translation adjustment of PPM Australia at the sale date. The translation gain included in comprehensive loss represents a reclassification adjustment. Foreign Exchange Contracts. The Company may from time to time use foreign exchange contracts to hedge recorded balance sheet amounts related to certain international operations and firm commitments that create currency exposures. The Company does not enter into speculative contracts. Gains and losses on hedges of assets and liabilities are recognized in income as offsets to the gains and losses from the underlying hedged amounts. Gains and losses on hedges of firm commitments are recorded on the basis of the underlying transaction. At December 31, 2000 the Company had no material outstanding foreign exchange contracts. Environmental Policies. Environmental expenditures that relate to current operations are either expensed or capitalized depending on the nature of the expenditure. Expenditures relating to conditions caused by past operations that do not contribute to current or future revenue generation are expensed. Liabilities are recorded when environmental assessments and/or remedial actions are probable, and the costs can be reasonably estimated. Such amounts were not material at December 31, 2000 and 1999. Research and Development Costs. Research and development costs are expensed as incurred. Such costs incurred in the development of new products or significant improvements to existing products are included in Selling, General and Administrative Expenses.

F - 47
NOTE 3 -- INVENTORIES Inventories consist of the following:
December 31, 2000 1999 Raw materials and supplies ....................................... $ 5.0 $ 5.9 Work in process.......................................................... 0.7 1.9 Replacement parts ...................................................... 6.2 6.8 Finished goods equipment........................................ 4.4 3.6 $ 16.3 $ 18.2
NOTE 4 -- PROPERTY, PLANT AND EQUIPMENT Property, plant and equipment consists of the following:
December 31, 2000 1999 Property.......................................................................... $ 0.2 $ 0.2 Plant................................................................................ --- --- Machinery and equipment .......................................... 0.6 0.2 0.8 0.4 Less accumulated depreciation .................................. (0.2) (0.2) $ 0.6 $ 0.2
Depreciation expense for 2000, 1999 and 1998 was $0.0, $0.0 and $0.1, respectively.
NOTE 5 – LONG-TERM DEBT Long-term debt at is summarized as follows:
December 31, 2000 1999 1998 Bank Credit Facility ............................................................... $ 60.0 $ 60.0 Note payable ................................................................................... 3.1 3.9 Other................................................................................................. --- --- Total long-term debt.................................................................. 63.1 63.9 Less: Current portion of long-term debt................................. (0.5) (1.1) Long-term debt, less current portion...................................... $ 62.6 $ 62.8
On May 9, 1995, Terex Corporation issued $250 of 13-¼% Senior Secured Notes due May 15, 2002 (the "Senior Secured Notes"). The Senior Secured Notes were issued in conjunction with Terex Corporation's acquisition of substantially all of the capital stock of PPM Cranes, Inc. and P.P.M. S.A. and the refinancing of Terex Corporation's debt. Of the total principal amount, $50 related to the acquisition of substantially all of the capital stock of PPM Cranes, Inc. and was included in the Company's consolidated balance sheet prior to March 6, 1998. On March 6, 1998, Terex Corporation redeemed or defeased all of its $166.7 principal amount of its then outstanding Senior Secured Notes. The Company had $50.0 in principal of the Senior Secured Notes that were redeemed. Concurrently therewith, Terex Corporation also refinanced substantially all of its then existing domestic and foreign revolving credit debt. The proceeds for the offer to purchase and the repayment of its then existing revolving credit facility were obtained from borrowings under Terex Corporation’s new $500.0 global bank credit facility (“1998 Bank Credit Facility”). In connection with the repurchase of the Senior Secured Notes, the Company incurred an extraordinary loss of $10.9. This extraordinary loss was recorded in the first quarter of 1998. The 1998 Bank Credit Facility consists of a new secured global revolving credit facility aggregating up to $125.0 (the “1998 Revolving Credit Facility”) and two term loan facilities (collectively, the “Term Loan Facilities”) providing for loans in an aggregate principal amount of up to approximately $375.0. With limited exceptions, the obligations under the 1998 Bank Credit Facility are secured by (i) a pledge of all of the capital stock of domestic subsidiaries of Terex Corporation, (ii) a pledge of 65%

F - 48
of the stock of the foreign subsidiaries of Terex Corporation and (iii) a first priority security interest in, and mortgages on, substantially all of the assets of Terex and its domestic subsidiaries. The 1998 Bank Credit Facility contains covenants limiting Terex Corporation’s activities, including, without limitation, limitations on dividends and other payments, liens, investments, incurrence of indebtedness, mergers and asset sales, related party transactions and capital expenditures. The 1998 Bank Credit Facility also contains certain financial and operating covenants, including a maximum leverage ratio, a minimum interest coverage ratio and a minimum fixed charge coverage ratio. Pursuant to the Term Loan Facilities, Terex Corporation has borrowed (i) $175.0 in aggregate principal amount pursuant to a Term Loan A due March 2004 (the “Term A Loan”) and (ii) $200.0 in aggregate principal amount pursuant to a Term Loan B due March 2005 (the “Term B Loan”) of which $60.0 was pushed down to the Company. The outstanding principal amount of the Term B Loan currently bears interest, at Terex Corporation’s option, at a rate of 2.75% per annum in excess of the adjusted eurodollar rate or, with respect to U.S. Dollar denominated alternate base rate loans, 1.75% in excess of the prime rate. The weighted average interest rate on the Term B Loan at December 31, 2000 was 9.06%. The Term B Loan amortizes in an annual percentage of 1% during each of the first six years of the term of the loan and 94% in the seventh year of the term of the loan. The Term A Loan and Term B Loan are subject to mandatory prepayment in certain circumstances and are voluntarily prepayable without payment of a premium (subject to reimbursement of the lenders’ costs in case of prepayment of eurodollar loans other than on the last day of an interest period.) As of December 31, 2000, the Term A Loan and Term B Loan have been prepaid such that the next scheduled principal payment is due in June 2003. Note Payable The note payable is to Harnischfeger Corporation and is not interest bearing. Schedule of Debt Maturities Scheduled annual maturities of long-term debt outstanding at December 31, 2000 in the successive five-year period are summarized as follows:
Note Payable - Harnischfeger
Other
Total
2001 ............................................... 0.8 --- 0.8 2002 ............................................... 0.5 --- 0.5 2003 ............................................... 0.5 --- 0.5 2004 ............................................... 0.5 --- 0.5 2005 ............................................... 0.5 --- 0.5 Thereafter..................................... 2.7 60.0 62.7 5.5 60.0 65.5 Imputed Interest.......................... (2.4) --- (2.4) $ 3.1 $ 60.0 $ 63.1
The Company believes that the carrying value of other borrowings approximates fair market value, based on discounting future cash flows using rates currently available for debt of similar terms and remaining maturities. NOTE 6 -- EMPLOYEE BENEFIT PLAN The Company participates in a defined contribution plan which is sponsored by Terex Corporation. The plan covers U.S. employees. Under the plan, the Company matches a portion of an employee's contribution to the plan. The related expense to the Company was $0.1, $0.1 and $0.1 for 2000, 1999 and 1998, respectively.

F - 49
NOTE 7 -- INCOME TAXES The components of income (loss) from continuing operations before income taxes and extraordinary items consisted of the following:
Year Ended December 31, 2000 1999 1998
Domestic ..............................................................$ (2.4) $ (2.9) $ 0.4 Foreign ................................................................ --- 0.4 0.2
$ (2.4) $ (2.5) $ 0.6 The Company has no provision (benefit) for federal, foreign and state income taxes. Deferred tax assets and liabilities result from differences in the basis of assets and liabilities for tax and financial statements purposes. In accordance with SFAS No. 109, "Accounting for income taxes," a valuation allowance fully offsetting the net deferred tax asset, has been recognized. The tax effects of the basis differences and Net Operating Loss ("NOL") carryforward as of December 31, 2000 and 1999 are summarized below:
Year Ended December 31, 2000 1999
Total deferred tax liabilities ......................................... $ --- $ ---
Receivables.................................................................... $ 0.1 0.1 Inventory ....................................................................... --- 0.2 Fixed assets ................................................................... (0.2) (0.5) Product liability............................................................. 1.8 5.1 Warranty........................................................................ 0.5 1.8 NOL carryforwards....................................................... 23.2 22.3 Total deferred tax assets.............................................. 25.4 29.0 Deferred tax asset valuation allowance..................... (25.4) (29.0)
Net deferred taxes ......................................................... $ --- $ ---
The valuation allowance for deferred tax assets at acquisition date, May 9, 1995, was $19.0. Any future reduction of this valuation allowance attributable to the pre-acquisition period will reduce goodwill. The net change in the valuation allowance for 2000, 1999 and 1998 was a decrease of $3.6, an increase of $3.9 and an increase of $3.6, respectively. At December 31, 2000, the Company has loss carryforwards for federal income tax purposes of approximately $66.4 available to offset future taxable income. The expiration of the Company's loss carryforwards are as follows:
Year Expiring
Amount
2004 .............................. $ 21.7 2005 .............................. 0.8 2006 .............................. 5.8 2007 .............................. 8.9 2008 .............................. 3.1 2009 .............................. 2.4 2010 .............................. 0.2 2011 .............................. 5.4 2018 .............................. 10.8 2019 .............................. 4.6 2020 .............................. 2.7 Total .............................. $ 66.4

F - 50
The utilization of approximately $42.7 of loss carryforwards is limited annually, as a result of an "ownership change" (as defined by Section 382 of the Internal Revenue Code), which occurred in 1995. The Company's provision for income taxes from continuing operations is different from the amount which would be provided by applying the statutory federal income tax rate to the Company's loss before income taxes. The reasons for the difference are summarized below:
Year Ended December 31, 2000 1999 1998
Statutory federal income tax rate..................................... $ (0.8) $ (0.8) $ 0.2 Goodwill .............................................................................. 0.4 0.4 0.4 NOL and basis differences with no current benefit ...... 0.4 0.4 (0.6) Total provision for income taxes ..................................... $ --- $ --- $ ---
There were no income taxes paid during 2000, 1999 and 1998. NOTE 8 -- COMMITMENTS AND CONTINGENCIES The Company has various lease agreements, primarily related to office space, production facilities, and office equipment, which are accounted for as operating leases. Certain leases have renewal options and provisions requiring the Company to pay maintenance, property taxe s and insurance. Rent expense for 2000, 1999 and 1998 was $0.3, $0.3 and $0.3, respectively. Future minimum payments under noncancelable operating leases at December 31, 2000 are as follows:
2001.................................................................... 0.2 2002.................................................................... 0.2 2003.................................................................... 0.2 2004.................................................................... 0.1 2005.................................................................... --- Thereafter........................................................... --- $ 0.7
The Company is involved in product liability and other lawsuits incident to the operation of its business. Insurance with third parties is maintained for certain of these items. It is management's opinion that none of these lawsuits will have a materially adverse effect on the Company's financial position. On March 31, 1998 and March 9, 1999, Terex Corporation issued and sold $150.0 and $100.0 aggregate principal amount, respectively, of 8-7/8% Senior Subordinated Notes due 2008 (the “Senior Subordinated Notes”). The Senior Subordinated Notes are each jointly and severally guaranteed by certain domestic subsidiaries of Terex Corporation, including PPM. NOTE 9 – BUSINESS SEGMENT INFORMATION The Company operates in one industry segment, that being the designing, manufacturing, and marketing of telescopic mobile cranes. These products are used primarily in the construction industry. Geographic segment information is presented below:
2000 1999 1998 Sales United States .....................................................................................$ 57.8 $ 65.4 $ 66.6 All Other............................................................................................. 11.7 15.0 25.8 $ 69.5 $ 80.4 $ 92.4
The Company attributes sales to unaffiliated customers in different geographical areas on the basis of the location of the customer.

F - 51
Sales to the Company's largest customer comprised 12% and 12% of the Company's net sales in the years ended December 31, 1999 and 1998, respectively. During 2000, no customer exceeded 10% of the Company’s net sales. NOTE 10 -- RELATED PARTY TRANSACTIONS During the years ended December 31, 2000, 1999 and 1998, the Company had transactions with various unconsolidated affiliates as follows:
2000 1999 1998 Product sales and service revenues............... $ 1.4 $ --- $ 1.3 Management fee expense............................. $ 1.0 $ 1.0 $ 1.0 Interest expense........................................... $ 5.2 $ 5.2 $ 5.3
Included in management fee expense are expenses paid by Terex Corporation on behalf of the Company (e.g. legal, treasury and tax services expense).

F - 52
TEREX CORPORATION AND SUBSIDIARIES
SCHEDULE II - VALUATION AND QUALIFYING ACCOUNTS AND RESERVES
(Amounts in millions)
Additions Balance
Beginning of Year
Charges to Earnings
Other
Deductions (1)
Balance
End of Year Year ended Decemb er 31, 2000 Deducted from asset accounts: Allowance for doubtful accounts..................... $ 5.8 $ 2.4 $ --- $ (1.9) $ 6.3 Reserve for excess and obsolete inventory .... 22.5 8.1 --- (4.5) 26.1 Totals .................................................................. $ 28.3 $ 10.5 $ --- $ (6.4) $ 32.4
Year ended December 31, 1999: Deducted from asset accounts: Allowance for doubtful accounts..................... $ 5.6 $ 0.4 $ --- $ (0.2) $ 5.8 Reserve for excess and obsolete inventory .... 24.0 4.7 --- (6.2) 22.5 Totals .................................................................. $ 29.6 $ 5.1 $ --- $ (6.4) $ 28.3
Year ended December 31, 1998: Deducted from asset accounts: Allowance for doubtful accounts..................... $ 4.5 $ 1.8 $ --- $ (0.7) $ 5.6 Reserve for excess and obsolete inventory .... 24.0 5.6 --- (5.6) 24.0 Totals .................................................................. $ 28.5 $ 7.4 $ --- $ (6.3) $ 29.6
(1) Primarily represents the utilization of established reserves, net of recoveries.

F - 53
EXHIBIT INDEX
3.1 Restated Certificate of Incorporation of Terex Corporation (incorporated by reference to Exhibit 3.1 to the Form S-1 Registration Statement of Terex Corporation, Registration No. 33-52297).
3.2 Certificate of Elimination with respect to the Series B Preferred Stock (incorporated by reference to Exhibit 4.3 to the Form 10-K for the year ended December 31, 1998 of Terex Corporation, Commission File No. 1-10702).
3.3 Certificate of Amendment to Certificate of Incorporation of Terex Corporation dated September 5, 1998 (incorporated by reference to Exh ibit 3.3 to the Form 10-K for the year ended December 31, 1998 of Terex Corporation, Commission File No. 1-10702).
3.4 Amended and Restated Bylaws of Terex Corporation (incorporated by reference to Exhibit 3.2 to the Form 10-K for the year ended December 31, 1998 of Terex Corporation, Commission File No. 1-10702).
4.1 Indenture dated as of March 31, 1998 among Terex Corporation, the Guarantors named therein and United States Trust Company of New York, as Trustee (incorporated by reference to Exhibit 4.6 of Amendment No. 1 to the Form S-4 Registration Statement of Terex Corporation, Registration No. 333-53561).
4.2 First Supplemental Indenture, dated as of September 23, 1998, between Terex Corporation and United States Trust Company of New York, as Trustee (to Indenture dated as of March 31, 1998) (incorporated by reference to Exhibit 4.4 to the Form 10-Q for the quarter ended September 30, 1999 of Terex Corporation, Commission File No. 1-10702).
4.3 Second Supplemental Indenture, dated as of April 1, 1999, between Terex Corporation and United States Trust Company of New York, as Trustee (to Indenture dated as of March 31, 1998) (incorporated by reference to Exhibit 4.5 to the Form 10-Q for the quarter ended September 30, 1999 of Terex Corporation, Commission File No. 1-10702).
4.4 Third Supplemental Indenture, dated as of July 29, 1999, between Terex Corporation and United States Trust Company of New York, as Trustee (to Indenture dated as of March 31, 1998) (incorporated by reference to Exhibit 4.6 to the Form 10-Q for the quarter ended September 30, 1999 of Terex Corporation, Commission File No. 1-10702).
4.5 Fourth Supplemental Indenture, dated as of August 26, 1999, between Terex Corporation and United States Trust Company of New York, as Trustee (to Indenture dated as of March 31, 1999) (incorporated by reference to Exhibit 4.7 to the Form 10-Q for the quarter ended September 30, 1999 of Terex Corporation, Commission File No. 1-10702).
4.6 Indenture dated as of March 9, 1999 among Terex Corporation, the Guarantors named therein and United States Trust Company of New York, as Trustee (incorporated by reference to Exhibit 4.4 to the Form 10-K for the year ended December 31, 1998 of Terex Corporation, Commission File No. 1-10702).
4.7 First Supplemental Indenture, dated as of April 1, 1999, between Terex Corporation and United States Trust Company of New York, as Trustee (to Indenture dated as of March 9, 1999) (incorporated by reference to Exhibit 4.8 to the Form 10-Q for the quarter ended September 30, 1999 of Terex Corporation, Commission File No. 1-10702).
4.8 Second Supplemental Indenture, dated as of July 30, 1999, between Terex Corporation and United States Trust Company of New York, as Trustee (to Indenture dated as of March 9, 1999) (incorporated by reference to Exhibit 4.9 to the Form 10-Q for the quarter ended September 30, 1999 of Terex Corporation, Commission File No. 1-10702).
4.9 Third Supplemental Indenture, dated as of August 26, 1999, between Terex Corporation and United States Trust Company of New York, as Trustee (to Indenture dated as of March 9, 1999) (incorporated by reference to Exhibit 4.11 to the Form 10-Q for the quarter ended September 30, 1999 of Terex Corporation, Commission File No. 1-10702).
10.1 Terex Corporation Incentive Stock Option Plan, as amended (incorporated by reference to Exhibit 4.1 to the Form S-8 Registration Statement of Terex Corporation, Registration No. 33-21483).
10.2 1994 Terex Corporation Long Term Incentive Plan (incorporated by reference to Exhibit 10.2 to the Form 10-K for the year ended December 31, 1994 of Terex Corporation, Commission File No. 1-10702).
10.3 Terex Corporation Employee Stock Purchase Plan (incorporated by reference to Exhibit 10.3 to the Form 10-K for the year ended December 31, 1994 of Terex Corporation, Commission File No. 1-10702).
10.4 1996 Terex Corporation Long Term Incentive Plan (incorporated by reference to Exhibit 10.1 to Form S-8 Registration Statement of Terex Corporation, Registration No. 333-03983).
10.5 Amendment No. 1 to 1996 Terex Corporation Long Term Incentive Plan (incorporated by reference to Exhibit 10.5 to the Form 10-K for the year ended December 31, 1999 of Terex Corporation, Commission File No. 1-10702).

F - 54
10.6 Amendment No. 2 to 1996 Terex Corporation Long Term Incentive Plan (incorporated by reference to Exhibit 10.6 to the Form 10-K for the year ended December 31, 1999 of Terex Corporation, Commission File No. 1-10702).
10.7 Terex Corporation 1999 Long-Term Incentive Plan (incorporated by reference to Exhibit 10.7 to the Form 10-Q for the quarter ended March 31, 2000 of Terex Corporation, Commission File No. 1-10702).
10.8 Terex Corporation 2000 Incentive Plan (incorporated by reference to Exhibit 10.8 to the Form 10-Q for the quarter ended June 30, 2000 of Terex Corporation, Commission File No. 1-10702).
10.9 Common Stock Appreciation Rights Agreement dated as of May 9, 1995 between the Company and United States Trust Company of New York, as Rights Agents (incorporated by reference to Exhibit 10.29 of the Amendment No. 1 to the Form S-1 Registration Statement of Terex Corporation, Regis tration No. 33-52711).
10.10 SAR Registration Rights Agreement dated as of May 9, 1995 among the Company and the Purchasers, as defined therein (incorporated by reference to Exhibit 10.31 of the Amendment No. 1 to the Form S-1 Registration Statement of Terex Corporation, Registration No. 33-52711).
10.11 Credit Agreement dated as of March 6, 1998 among Terex Corporation, certain of its subsidiaries, the lenders named therein, Credit Suisse First Boston, as Administrative Agent, Bank Boston N.A., as Syndication Agent and Canadian Imperial Bank of Commerce and First Union National Bank, as Co-Documentation Agents (incorporated by reference to Exhibit 10.13 to the Form 10-K for the year ended December 31, 1998 of Terex Corporation, Commission File No. 1-10702).
10.12 Guarantee Agreement dated as of March 6, 1998 of Terex Corporation and Credit Suisse First Boston, as Collateral Agent (incorporated by reference to Exhibit 10.14 to the Form 10-K for the year ended December 31, 1998 of Terex Corporation, Commission File No. 1-10702).
10.13 Guarantee Agreement dated as of March 6, 1998 of Terex Corporation, each of the subsidiaries of Terex Corporation listed therein and Credit Suisse First Boston, as Collateral Agent (incorporated by reference to Exhibit 10.15 to the Form 10-K for the year ended December 31, 1998 of Terex Corporation, Commission File No. 1-10702).
10.14 Security Agreement dated as of March 6, 1998 of Terex Corporation, each of the subsidiaries of Terex Corporation listed therein and Credit Suisse First Boston, as Collateral Agent (incorporated by reference to Exhibit 10.16 to the Form 10-K for the year ended December 31, 1998 of Terex Corporation, Commission File No. 1-10702).
10.15 Pledge Agreement dated as of March 6, 1998 of Terex Corporation, each of the subsidiaries of Terex Corporation listed therein and Credit Suisse First Boston, as Collateral Agent (incorporated by reference to Exhibit 10.17 to the Form 10-K for the year ended December 31, 1998 of Terex Corporation, Commission File No. 1-10702).
10.16 Form Mortgage, Leasehold Mortgage, Assignment of Leases and Rents, Security Agreement and Financing entered into by Terex Corporation and certain of the subsidiaries of Terex Corporation, as Mortgagor, and Credit Suisse First Boston, as Mortgagee (incorporated by reference to Exhibit 10.18 to the Form 10-K for the year ended December 31, 1998 of Terex Corporation, Commission File No. 1-10702).
10.17 Amendment No. 1 to Credit Agreement dated as of March 6, 1998 among Terex Corporation, certain of its subsidiaries, the lenders named therein, Credit Suisse First Boston, as Administrative and Collateral Agent (incorporated by reference to Exhibit 10.17 to the Form 10-K for the year ended December 31, 1998 of Terex Corporation, Commission File No. 1-10702).
10.18 Amendment No. 2 to Credit Agreement dated as of March 6, 1998 among Terex Corporation, certain of its subsidiaries, the lenders named therein, Credit Suisse First Boston, as Administrative and Collateral Agent (incorporated by reference to Exhibit 10.18 to the Form 10-K for the year ended December 31, 1998 of Terex Corporation, Commission File No. 1-10702).

F - 55
10.19 Amendment No. 3 to Credit Agreement dated as of March 6, 1998 among Terex Corporation, certain of its subsidiaries, the lenders named therein, Credit Suisse First Boston, as Administrative and Collateral Agent (incorporated by reference to Exhibit 10.19 to the Form 10-K for the year ended December 31, 1998 of Terex Corporation, Commission File No. 1-10702).
10.20 Amendment No. 4 to Credit Agreement dated as of March 6, 1998 among Terex Corporation, certain of its subsidiaries, the lenders named therein, and Credit Suisse First Boston, as Administrative and Collateral Agent (incorporated by reference to Exhibit 10.1 to the Form 8-K Current Report, Commission File No.1-10702, dated July 27, 1999 and filed with the Commission on August 10, 1999).
10.21 Amendment No. 5 to Credit Agreement dated as of March 6, 1998 among Terex Corporation, certain of its subsidiaries, the lenders named therein, and Credit Suisse First Boston, as Administrative and Collateral Agent (incorporated by reference to Exhibit 10.2 to the Form 8-K Current Report, Commission File No. 1-10702, dated July 27, 1999 and filed with the Commission on August 10, 1999).
10.22 Amendment No. 6 to Credit Agreement dated as of March 6, 1998 among Terex Corporation, certain of its subsidiaries, the lenders named therein, and Credit Suisse First Boston, as Administrative and Collateral Agent (incorporated by reference to Exhibit 10.22 to the Form 10-Q for the quarter ended September 30, 1999 of Terex Corporation, Commission File No. 1-10702).
10.23 Amendment No. 7 to Credit Agreement dated as of March 6, 1998 among Terex Corporation, certain of its subsidiaries, the lenders named therein and Credit Suisse First Boston, as Administrative and Collateral Agent (incorporated by reference to Exhibit 10.21 to the Form 10-K for the year ended December 31, 1999 of Terex Corporation, Commission File No. 1-10702).
10.24 Amendment No. 8 to Credit Agreement dated as of March 6, 1998 among Terex Corporation, certain of its subsidiaries, the lenders named therein, and Credit Suisse First Boston, as Administrative and Collateral Agent (incorporated by reference to Exhibit 10.24 to the Form 10-Q for the quarter ended June 30, 2000 of Terex Corporation, Commission File No. 1-10702).
10.25 Tranche C Credit Agreement, dated as of July 2, 1999, as amended and restated as of August 23, 1999, among Terex Corporation, the lenders named therein, and Credit Suisse First Boston, as Administrative and Collateral Agent (incorporated by reference to Exhibit 10.23 to the Form 10-Q for the quarter ended September 30, 1999 of Terex Corporation, Commission File No. 1-10702).
10.26 Amendment No. 1 to Tranche C Credit Agreement dated as of July 2, 1999, as amended and restated as of August 23, 1999, among Terex Corporation, the lenders named therein, and Credit Suisse First Boston, as Administrative and Collateral Agent (incorporated by reference to Exhibit 10.26 to the Form 10-Q for the quarter ended June 30, 2000 of Terex Corporation, Commission File No. 1-10702).
10.27 Purchase Agreement dated as of March 9, 1999 among the Company and the Initial Purchasers, as defined therein (incorporated by reference to Exhibit 10.20 to the Form 10-K for the year ended December 31, 1998 of Terex Corporation, Commission File No. 1-10702).
10.28 Registration Rights Agreement dated as of March 9, 1999 among the Company and the Purchasers, as defined therein (incorporated by reference to Exhibit 10.21 to the Form 10-K for the year ended December 31, 1998 of Terex Corporation, Commission File No. 1-10702).
10.29 Underwriting Agreement, dated as of September 17, 1999, between Terex Corporation and Salomon Smith Barney Inc. (incorporated by reference to Exhibit 1 of the Form 8-K Current Report, Commission File No. 1-10702, dated and filed with the Commission on September 18, 1999).
10.30 Stock Purchase Agreement between Raytheon Engineers & Constructors International, Inc. and Terex Corporation, dated as of July 19, 1999 (incorporated by reference to Exhibit 10.27 to the Form 10-Q for the quarter ended September 30, 1999 of Terex Corporation, Commission File No. 1-10702).
10.31 Stock Purchase Agreement between Terex Corporation and Hartford Capital Appreciation Fund, Inc., dated July 23, 1999 (incorporated by reference to Exhibit 10.28 to the Form 10-Q for the quarter ended September 30, 1999 of Terex Corporation, Commission File No. 1-10702).
10.32 Asset Purchase and Sale Agreement between Terex Corporation and Partek Acquisition Company, Inc., dated as of July 20, 2000 (incorporated by reference to Exhibit 1 of the Form 8-K Current Report, Commission File No. 1-10702, dated September 30, 2000 and filed with the Commission on October 5, 2000).

F - 56
10.33 Share Purchase and Sale Agreement among Powerscreen International plc, Partek Cargotec Holding Ltd and, for purposes of Article 9 only, Moffett Engineering Limited, dated as of July 20, 2000 (incorporated by reference to Exhibit 2 of the Form 8-K Current Report, Commission File No. 1-10702, dated September 30, 2000 and filed with the Commission on October 5, 2000).
10.34 Share Purchase and Sale Agreement among Holland Lift International B.V., Partek Cargotec Holding Netherlands B.V. and, for purposes of Article 9 only, Kooi B.V., dated as of July 20, 2000 (incorporated by reference to Exhibit 3 of the Form 8-K Current Report, Commission File No. 1-10702, dated September 30, 2000 and filed with the Commission on October 5, 2000).
10.35 Asset Purchase and Sale Agreement among PPM Deutschland GmbH Terex Cranes, Hiab GmbH and, for purposes of Section 2.3 only, Holland Lift International B.V., Partek Cargotec Holding Netherlands B.V. and Kooi B.V., dated as of September 29, 2000 (incorporated by reference to Exhibit 4 of the Form 8-K Current Report, Commission File No. 1-10702, dated September 30, 2000 and filed with the Commission on October 5, 2000).
10.36 Contract of Employment, dated as of September 1, 1999, between Terex Corporation and Filip Filipov (incorporated by reference to Exhibit 10.29 to the Form 10-Q for the quarter ended September 30, 1999 of Terex Corporation, Commission File No. 1-10702).
10.37 Supplement to Contract of Employment, dated as of April 1, 2000, between Terex Corporation and Filip Filipov (incorporated by reference to Exhibit 10.37 to the Form 10-Q for the quarter ended September 30, 2000 of Terex Corporation, Commission File No. 1-10702).
10.38 Amended and Restated Employment and Compensation Agreement, dated as of April 1, 2000, between Terex Corporation and Ronald M. DeFeo (incorporated by reference to Exhibit 10.38 to the Form 10-Q for the quarter ended September 30, 2000 of Terex Corporation, Commission File No 1-10702).
10.39 Form of Change in Control and Severance Agreement dated as of April 1, 2000 between Terex Corporation and certain executive officers (incorporated by reference to Exhibit 10.34 to the Form 10-Q for the quarter ended June 30, 2000 of Terex Corporation, Commission File No. 1-10702).
12.1 Calculation of Ratio of Earnings to Fixed Charges. *
21.1 Subsidiaries of Terex Corporation. *
23.1 Consent of Independent Accountants – PricewaterhouseCoopers LLP, Stamford, Connecticut. *
24.1 Power of Attorney. *
* Exhibit filed with this document.