building a strong minnesota
TRANSCRIPT

Building a Strong
Minnesota
An Analysis of Minnesota’s
Union Construction Industry
July 1, 2021
Frank Manzo IV, MPP
Policy Director
Midwest Economic Policy Institute
Jill Gigstad
Midwest Researcher
Midwest Economic Policy Institute
Robert Bruno, Ph.D.
Director
Labor Education Program
Project for Middle Class Renewal
University of Illinois at Urbana-Champaign
Kevin Duncan, Ph.D.
BCG Economics, LLC and
Distinguished University Professor,
Colorado State University-Pueblo

Building a Strong Minnesota: An Analysis of Minnesota’s Union Construction Industry
i
EXECUTIVE SUMMARY Minnesota needs good jobs that provide family-supporting wages and ensure access to health care coverage and safe workplaces. One industry that has consistently offered pathways into middle-class careers is construction, primarily because it is highly unionized. Fully 41 percent of Minnesota’s construction workers are union members.
Minnesota has a strong economy, and its construction workforce is highly productive.
• Minnesota’s economy has more than doubled since 2000, growing by 3.6 percent annually.
• In 2019, Minnesota had 130,000 workers employed in the construction industry, including 105,000 in blue-collar construction and extraction occupations.
• Each Minnesota construction worker contributes $120,600 annually in value added to the economy.
Through registered apprenticeship programs, the union construction industry supports the largest privately financed system of higher education in Minnesota.
• Joint labor-management programs are cooperatively administered and have standards, wages, and “cents per hour” contributions that are negotiated privately between contractors and unions.
• Joint labor-management programs train 93 percent of all construction apprentices in Minnesota.
• Union construction workers earn hourly wages ($33 per hour) that rival workers with bachelor’s degrees ($35 per hour).
Minnesota’s union construction industry creates ladders into the middle class, promotes worker safety, and strengthens the economy.
• Union construction workers earn 32 percent higher wages than nonunion construction workers.
• Wage inequality is 24 percent lower in union construction compared with nonunion construction.
• Union jobsites in Minnesota had 40 percent fewer health and safety violations than nonunion jobsites in 2019.
• Union construction workers are 3 percent more likely to own their homes, 43 percent more likely to be covered by private health insurance, and 24 percent more likely to have access to pension plans.
• The union construction industry annually supports $2.7 billion in economic output in Minnesota.
The union construction industry delivers value to Minnesota taxpayers.
• Union construction workers contribute 48 percent more in state income taxes than nonunion construction workers.
• Union construction workers are 13 percent less likely to rely on food stamps and Earned Income Tax Credit (EITC) government assistance than nonunion construction workers.
• An analysis of 640 school construction projects in the Minneapolis-St. Paul region reveals that union contractors are no more expensive than nonunion contractors, after accounting for other factors.
Clean energy investments are a potential opportunity for Minnesota’s union construction industry.
• Every $1 billion invested in clean energy creates 7,300 jobs and $1.3 billion in economic activity.
• This relatively new sector is not heavily unionized. Workers earn 22 percent more in fossil fuel power generation than in the wind and solar sector.
• Attaching prevailing wage to clean energy projects would boost worker earnings, improve labor productivity, and support work for local contractors with little to no cost impact because installation labor only accounts for between 7 percent and 11 percent of total costs on clean energy projects.
Minnesota’s experience demonstrates that both a resilient middle class and robust economic outcomes are products of strong collective bargaining agreements in the construction industry.

Building a Strong Minnesota: An Analysis of Minnesota’s Union Construction Industry
ii
TABLE OF CONTENTS
Executive Summary i Table of Contents ii About the Authors and Organizations iii Introduction 1 Overview of Minnesota’s Economy and Construction Industry 1 The Impact of the Union Construction Industry on Apprenticeship Training 4 Economic Research on the Value of Unions and Collective Bargaining 8 The Impact of the Union Construction Industry on the Construction Workforce 9 The Impact of the Union Construction Industry on Social Outcomes 12 The Impact of the Union Construction Industry Business Model on the Economy 13 Research on Prevailing Wages, Responsible Bidding, and Total Construction Costs 16 The Impact of the Union Construction Industry on School Construction Costs 20 Clean Energy Investments as a Potential Opportunity 22 Conclusion 24 Sources 25 Cover Photo Credits 31

Building a Strong Minnesota: An Analysis of Minnesota’s Union Construction Industry
iii
ABOUT THE AUTHORS AND ORGANIZATIONS Frank Manzo IV, MPP is the Policy Director of the Midwest Economic Policy Institute (MEPI). He earned a Master of Public Policy from the University of Chicago Harris School of Public Policy and a Bachelor of Arts in Economics and Political Science from the University of Illinois at Urbana-Champaign. He can be contacted at [email protected]. Jill Gigstad is a Midwest Researcher at the Midwest Economic Policy Institute (MEPI). She earned a Bachelor of Arts in Political Science and International Studies from Iowa State University. She can be contacted at [email protected].
The Midwest Economic Policy Institute (MEPI) is a nonprofit organization which uses advanced statistics and the latest forecasting models to promote thoughtful economic growth for businesses and working families across the Midwest. MEPI is committed to providing timely, rigorous, and methodologically sound analyses that advance high-quality jobs, foster
accountable governments, and positively contribute to the policy dialogue in the Midwest. MEPI is affiliated with the Illinois Economic Policy Institute (ILEPI).
Robert Bruno, PhD is a Professor at the University of Illinois at Urbana-Champaign School of Labor and Employment Relations and is the Director of the Project for Middle Class Renewal (PMCR). He earned a Doctor of Philosophy in Political Theory from New York University, a Master of Arts from Bowling Green State University, and a Bachelor of Arts from Ohio University. He can be contacted at [email protected].
The Project for Middle Class Renewal’s mission is to investigate the working conditions of workers in today’s economy and elevate public discourse on issues affecting workers with research, analysis and education in order to develop and propose public policies that will reduce poverty,
provide forms of representation to all workers, prevent gender, race, and LGBTQ+ discrimination, create more stable forms of employment, and promote middle-class paying jobs. Each year, the Project publishes critical research studies and holds education forums on contemporary public policies and practices impacting labor and workplace issues.
Kevin Duncan, PhD is a Distinguished University Professor and a Professor of Economics at Colorado State University-Pueblo. Dr. Duncan teaches business and regional economics in the Hasan School of Business. He has also been a visiting scholar at the Institute for Research on Labor and Employment at the University of California, Berkeley. He received his Doctor of Philosophy in Economics from the University of Utah and his Bachelor of Arts in Economics from the University of California, Riverside. He can be contacted at [email protected].

Building a Strong Minnesota: An Analysis of Minnesota’s Union Construction Industry
1
INTRODUCTION
Both the Great Recession of 2008 and the coronavirus disease (COVID-19) pandemic of 2020 exacerbated economic inequities and revealed that essential workers earn lower wages and suffer from higher job volatility than those who could work remotely from home. Reducing inequality and fully recovering from these severe economic recessions requires rapid growth in good jobs that not only provide family-supporting incomes, but also ensure access to quality health care coverage, retirement plans, and healthy workplaces that ensure worker safety. One essential industry that has consistently offered pathways into middle-class careers is construction. There are about 130,000 wage and salary employees in Minnesota’s construction industry, including more than 105,000 blue-collar construction and extraction workers (BEA, 2021; BLS, 2021a). Minnesota’s construction industry is highly unionized with strong collective bargaining agreements. Between 2015 and 2019, two out of every five workers in construction and extraction occupations (41 percent) were union members in Minnesota, a unionization rate that was more than double the comparable U.S. average (18 percent) (CEPR, 2020). This report, conducted by researchers at the Midwest Economic Policy Institute (MEPI), the Project for Middle-Class Renewal (PMCR) at the University of Illinois at Urbana-Champaign, and BCG Economics, analyzes the union construction industry’s business model in Minnesota. The report first provides an overview of Minnesota’s economy and construction industry before exploring how the union construction industry supports the largest privately-financed system of higher education in Minnesota. Then, economic research on the value of unions and collective bargaining are presented before evaluating the union construction industry’s impact on worker wages, worker productivity, workplace safety, homeownership rates, reliance on government assistance programs, state income tax revenues, and the broader economy in Minnesota. This is followed by a discussion of construction costs, including the effects of prevailing wage laws, responsible bidder ordinances, and union contractors on the cost of taxpayer construction projects. The potential impacts of incorporating greater levels of unionization to the state’s clean energy infrastructure are also considered. A concluding section recaps key findings.
OVERVIEW OF MINNESOTA’S ECONOMY AND CONSTRUCTION INDUSTRY
The State of Minnesota has a strong economy, robust job growth, and a high quality of life for its residents. Minnesota ranks third in the nation by average life expectancy at birth, at 80.7 years (Manzo & Bruno, 2021). The state’s gross domestic product (GDP) has continued to grow over the past two decades, more than doubling from $191 billion in 2000 to $384 billion in 2019 (Figure 1). While Minnesota’s annualized growth rate of 3.6 percent since 2000 is slightly below the overall national average (3.8 percent), it has surpassed the combined economic growth rate of the Plains and Great Lakes regions (3.1 percent), which include Minnesota and 11 neighboring U.S. states.1 Wage and salary employment also increased between 2000 and 2019, from 2.7 million workers to more than 3.0 million workers. By contrast, across the border in Wisconsin, wage and salary employment growth was significantly slower. Minnesota began the millennium with about 133,000 fewer workers than Wisconsin but ended 2019 with over 5,000 more workers than Wisconsin (BEA, 2021). Minnesota recovered relatively quickly from the Great Recession. While state GDP contracted by 1.6 percent between 2008 and 2009, Minnesota’s economic output exceeded its pre-recession level as early as 2010
1 The Plains region includes Minnesota, Iowa, Kansas, Missouri, Nebraska, North Dakota, and South Dakota and the Great Lakes region includes Illinois, Indiana, Michigan, Ohio, and Wisconsin (FRED, 2021).

Building a Strong Minnesota: An Analysis of Minnesota’s Union Construction Industry
2
(Figure 1). Total full-time and part-time wage and salary employment fell by 4.7 percent between 2007 and 2010 but returned to pre-recession levels by 2013. Though not shown, Minnesota’s GDP fell by 2.5 percent in 2020 due to the COVID-19 pandemic (BEA, 2021). Figure 1: Minnesota’s Gross Domestic Product (GDP) and Wage and Salary Employment, 2000-2019
Source(s): 2000-2019 “GDP & Personal Income” data from the Bureau of Economic Analysis at the U.S. Department of Commerce (BEA, 2021).
Figure 2: Minnesota’s Construction Industry GDP and Wage and Salary Employment, 2000-2019
Source(s): 2000-2019 “GDP & Personal Income” data from the Bureau of Economic Analysis at the U.S. Department of Commerce (BEA, 2021).
Minnesota’s construction industry has grown slower than the overall economy (Figure 2). The entire construction industry in Minnesota—including the building, heavy and highway, building, and residential sectors—expanded from $9.2 billion in economic activity in 2000 to a $15.7 billion industry by 2019, a total growth of 69 percent and an annualized growth rate of 2.7 percent. This lower growth rate is largely due to the Great Recession, which disproportionately impacted the construction industry. Minnesota’s construction industry GDP decreased by 31 percent between 2007 and 2010. In fact, wage and salary employment in Minnesota’s construction industry—which includes both blue-collar construction workers and white-collar employees such as architects and office workers—was only beginning to reach levels last seen before the Great Recession in 2019, right before the COVID-19 pandemic. Wage and salary employment in construction
$0
$50,000
$100,000
$150,000
$200,000
$250,000
$300,000
$350,000
$400,000
$450,000
20
00
20
02
20
04
20
06
20
08
20
10
20
12
20
14
20
16
20
18
In M
illio
ns
Minnesota's Gross Domestic Product (GDP)
2,500,000
2,600,000
2,700,000
2,800,000
2,900,000
3,000,000
3,100,000
20
00
20
02
20
04
20
06
20
08
20
10
20
12
20
14
20
16
20
18
Minnesota's Wage and Salary Employment
$0
$2,000
$4,000
$6,000
$8,000
$10,000
$12,000
$14,000
$16,000
$18,000
20
00
20
02
20
04
20
06
20
08
20
10
20
12
20
14
20
16
20
18
In M
illio
ns
Minnesota's Construction Industry GDP
0
20,000
40,000
60,000
80,000
100,000
120,000
140,000
160,000
20
00
20
02
20
04
20
06
20
08
20
10
20
12
20
14
20
16
20
18
Minnesota's Construction Wage and Salary Employment

Building a Strong Minnesota: An Analysis of Minnesota’s Union Construction Industry
3
peaked at nearly 134,000 workers in 2005 and was 130,000 workers in 2006. It fell to as little as 90,000 workers in 2010 before steadily increasing to 130,000 again in 2019.
Figure 3: Construction GDP, Employment, and Worker Productivity in Midwest and Plains States, 2019
Construction Industry
Gross Domestic Product (Value Added)
Wage and Salary Employment
GDP Per Wage and Salary Worker
Minnesota $15,695,100,000 130,104 $120,635
Illinois $30,357,500,000 233,367 $130,085
Iowa $8,006,500,000 79,966 $100,124
Michigan $22,589,700,000 177,608 $127,189
Nebraska $3,556,000,000 55,054 $64,591
North Dakota $3,385,500,000 28,646 $118,184
South Dakota $2,168,100,000 24,178 $89,672
Wisconsin $14,715,900,000 127,430 $115,482
United States $892,684,000,000 7,647,000 $116,736 Source(s): 2019 “GDP & Personal Income” data from the Bureau of Economic Analysis at the U.S. Department of Commerce (BEA, 2021).
Minnesota’s construction workers are among the most productive in the region and the nation (Figure 3). While Minnesota has fewer total workers its construction industry than Illinois and Michigan, it has more than Iowa, Nebraska, North Dakota, South Dakota, and Wisconsin. On average, each worker in Minnesota’s construction industry contributes $120,600 annually to the state’s economy. This is higher than the national average of about $116,700 per construction industry worker and higher than every neighboring state, except Illinois and Michigan.2
Figure 4: State and Local Government Infrastructure Investment in Midwest and Plains States, 2018
2018 State Data
Gross Domestic Product (Value Added)
State and Local Government Infrastructure Investment*
State and Local Investment as Share of GDP
Minnesota $371,929,700,000 $8,202,783,000 2.21%
Illinois $863,039,500,000 $13,231,607,000 1.53%
Iowa $190,147,000,000 $4,398,770,000 2.31%
Michigan $521,803,400,000 $7,269,574,000 1.39%
Nebraska $124,705,400,000 $3,175,742,000 2.55%
North Dakota $56,286,800,000 $1,833,598,000 3.26%
South Dakota $53,239,000,000 $1,169,114,000 2.20%
Wisconsin $337,553,100,000 $6,660,232,000 1.97%
United States $20,611,861,000,000 $378,522,646,000 1.84% Source(s): 2018 “State and Local Government Finances” data from the U.S. Census Bureau (Census, 2020); 2018 “GDP & Personal Income” data from the Bureau of Economic Analysis at the U.S. Department of Commerce (BEA, 2021). *Infrastructure investment is measured by total capital outlay expenditures by state and local governments.
Investing in high-quality public infrastructure attracts business activity, creates jobs, and drives economic growth. For every dollar increase in infrastructure spending, the economy grows by between $1.57 and $2.20 (Zandi, 2010; Arnon et al., 2020). State and local government spending on infrastructure, however, has fallen to historic lows from 2.4 percent of GDP in the early 2000s to about 1.8 percent across the United States in
2 The value produced by the construction industry as a whole can depends in part on the composition of the type of construction work within a state. For example, certain states may have more residential construction work occurring while others may have more industrial or heavy and highway construction work occurring. However, gross domestic product per worker in the construction industry has been higher in Minnesota than most neighboring states for decades, indicating that the composition of the type of construction work, which varies by year, is not the primary factor.

Building a Strong Minnesota: An Analysis of Minnesota’s Union Construction Industry
4
2018 (McNichol, 2019). In 2018, Minnesota invested $8.2 billion in capital outlays on state and local infrastructure projects, amounting to about 2.2 percent of the state’s overall GDP. While this is a higher rate of investment than the national average, it is in the middle of the pack compared to neighboring states (Figure 4). Underinvestment in public infrastructure is another reason growth in the construction industry has lagged the rest of the state’s economy.
Figure 5: MEPI Forecast of Minnesota’s Construction Industry GDP over the Next Decade
Source(s): Authors’ analysis of 2000-2019 “GDP & Personal Income” data from the Bureau of Economic Analysis at the U.S. Department of Commerce (BEA, 2021); seasonally-adjusted “Employment, Hours, and Earnings —State Metro Area” estimates which show that construction industry employment declined by 3.0 percent in Minnesota in 2020 compared with 2019 (BLS, 2021b). The forecast assumes construction industry GDP growth will continue to nominally grow by 2.5 percent, which has been the industry’s 20-year annualized growth rate since 2000.
Nevertheless, Minnesota’s construction industry is expected to grow by about $4 billion over the next decade (Figure 5). According to the Bureau of Labor Statistics, Minnesota’s construction industry employment declined by about 3 percent in 2020 compared with 2019, a much smaller loss of jobs than frontline and face-to-face industries such as restaurants, barber shops, and music venues (BLS, 2021b). If construction maintains its average pre-pandemic growth rate—likely a conservative assumption since it includes data from the Great Recession—the industry is forecasted to be a $17 billion industry by 2025 and a nearly $20 billion industry by 2030. Note that this forecast also does not incorporate any potential infusion of federal dollars through the proposed American Jobs Plan.
THE IMPACT OF THE UNION CONSTRUCTION INDUSTRY ON APPRENTICESHIP TRAINING
Registered apprenticeships are industry-driven programs where employers and unions train and develop skilled workers who are in high demand. Participating apprentices get the opportunity to “earn while they learn” and obtain portable, nationally-recognized credentials with minimal or no out-of-pocket costs. Employers, unions, joint labor-management programs, and governments all sponsor apprenticeship programs, covering tuition costs and offering structured, on-the-job training and certified classroom instruction tailored to meet the needs of employers. In return for these investmenst, businesses in Minnesota gain access to pools of skilled workers who meet industry standards for productivity and safety. Apprenticeship programs create alternative pathways into middle-class careers for young adults who are unable or unwilling to go to college.
$10,000,000,000
$11,000,000,000
$12,000,000,000
$13,000,000,000
$14,000,000,000
$15,000,000,000
$16,000,000,000
$17,000,000,000
$18,000,000,000
$19,000,000,000
$20,000,000,0002
01
5
20
16
20
17
20
18
20
19
20
20
20
21
20
22
20
23
20
24
20
25
20
26
20
27
20
28
20
29
20
30
Forecast of Construction Industry GDP in Minnesota

Building a Strong Minnesota: An Analysis of Minnesota’s Union Construction Industry
5
Economic research finds that registered apprenticeship programs have positive economic impacts. Countries that have more widespread usage of apprenticeship programs are have higher wages and lower unemployment rates (Bertschy et al., 2009; Ryan, 2001; Ryan, 1998). In Germany, where these programs are especially prevalent, apprenticeships have been found to increase a worker’s wages by 8 percent per year (Clark & Fahr, 2002). The future employment prospects, lifetime earnings, and work-life satisfaction of workers all improve upon completion of an apprenticeship program. Additionally, because the majority of apprenticeship programs are privately funded, the public also benefits from better quality work and lower educational costs (Samek Lodovici et al., 2013). In the United States, the comprehensive research on registered apprentices was conducted by analysts at Mathematica Policy Research for the U.S. Department of Labor Employment and Training Administration (Reed et al., 2012). The study performed a cost-benefit analysis of registered apprenticeship programs in 10 states that differed across labor market characteristics, including usage of apprenticeship programs and level of unionization. The analysis found that participants in registered apprenticeship programs have substantially higher earnings than nonparticipants. On average, apprenticeship participants earn about $124,000 more in wages and fringe benefits over their careers than similar non-participants. Apprenticeship training also reduces a worker’s chances of suffering an unemployment spell, saving governments thousands of dollars per apprentice. Apprenticeship training is particularly important in the construction industry (Olinsky & Ayres, 2013). In this industry, apprenticeship programs are sponsored either jointly by labor unions and employers that are signatories to collective bargaining agreements (joint labor-management programs) or unilaterally by employers. Joint labor-management programs are cooperatively administered with standards, trainee wages, and apprentice-to-worker ratios established in collective bargaining agreements (CBAs). By contrast, employer-only programs are sponsored by a single employer or group of employers—usually through a trade association—who unilaterally determine program content, set entry requirements, and monitor trainee progress. Through registered apprenticeship programs, “construction operates the largest privately-financed system of higher education in the country” (Philips, 2014). Nearly all of this investment, however, comes from joint labor-management programs cooperatively administered by labor unions and signatory employers. Joint labor-management programs are funded by “cents per hour” contributions that are negotiated in private collective-bargaining agreements made by construction employers on behalf of union workers. By contrast, employer-only apprenticeship programs typical lack an institutional financing mechanism, and are instead funded by voluntary contributions from employers. However, employers often have short-term incentives to forgo such investments in order to win project bids. Joint labor-management programs account for 97 percent of all active construction apprentices in Illinois, 94 percent in Indiana, 82 percent in Ohio, 82 percent in Wisconsin, 79 percent in Kentucky, and 78 percent in Michigan (Manzo & Bruno, 2020; Philips, 2015a; Manzo & Duncan, 2018; Onsarigo et al., 2017; Philips, 2015b; Duncan & Manzo, 2016; Bilginsoy, 2017). July 2014 through July 2017 data from the Minnesota Department of Labor and Industry that contains information on active apprenticeships by gender identification, racial or ethnic background, veteran status, and program type can be utilized to illustrate the differences between the employer-only (or nonunion) segment and the joint labor-management (or union) segments of the construction industry. More than nine-in-10 construction apprentices in Minnesota are enrolled in joint labor-management apprenticeship programs (Figure 6). An average of about 10,200 active apprentices were enrolled in joint labor-management programs per year compared with just over 800 trainees in non-joint programs. In total, 93 percent of all registered apprentices are enrolled in joint labor-management (union) apprenticeship programs. This is noteworthy considering that just 41 percent of construction workers in Minnesota are union members.

Building a Strong Minnesota: An Analysis of Minnesota’s Union Construction Industry
6
Joint labor-management apprenticeship programs train the vast majority of construction apprentices regardless of background (Figure 6). Joint labor-management programs train 92 percent of all White apprentices, 92 percent of all Black or African American apprentices, 95 percent of all Latino and Latina apprentices, and 98 percent of apprentices from other racial backgrounds in Minnesota. By gender identification, about 94 percent of all male apprentices and 79 percent of all female apprentices are enrolled in joint labor-management apprenticeship programs. Additionally, of the more than 600 veterans enrolled in construction apprenticeship programs each year, 83 percent are enrolled in union-sponsored programs (Figure 6).
Figure 6: Characteristics of Construction Apprenticeship Programs in Minnesota, FY2015 to FY2017
Minnesota Registered Apprenticeships: Characteristic,
FY2015-FY2017 Average
Total for All Registered Programs
Joint Labor- Management
(Union) Programs
Employer-Only (Nonunion) Programs
Joint Labor- Management (Union) Share
Number of Active Apprentices 11,035 10,219 816 93%
Gender: Male 10,292 9,634 658 94% Gender: Female 743 585 158 79%
Race: White 8,917 8,208 709 92% Race: Black or African American 742 683 59 92% Race: Latinx or Hispanic 687 651 36 95% Race: Other Race (or Unknown) 689 677 12 98%
Military Veterans 606 506 100 83% Source(s): Minnesota Department of Labor and Industry’s “Gender/Ethnicity/Veteran Reports” from July 2014 through July 2017 (Manzo & Duncan, 2018).
Although joint labor-management apprenticeship programs in construction can take steps to improve the diversity of their apprenticeship classes, their racial and ethnic diversity is on par with the University of Minnesota System and other public universities (Figure 7). The Black or African American share of apprentices registered in joint labor-management construction programs (7 percent) is slightly higher than the comparable share enrolled in Minnesota’s public universities (6 percent). The Latinx share of apprentices in joint construction programs (6 percent) is also 2 percent higher than the Latinx share of students at public universities. The share of White graduates is higher in joint construction programs (80 percent) than public universities (77 percent), but that is partially because the share of graduates from all other racial and ethnic backgrounds—most notably, Asians and Pacific Islanders—is higher in public universities (13 percent) than joint construction programs (7 percent). Across Minnesota, joint construction programs have racial diversity outcomes that rival public four-year universities.
Figure 7: Number and Shares of Enrolled Participants by Higher Education Program in Minnesota, 2017
Diversity of Participants Enrolled in Higher Education Classes by
Program, Fall 2017
Apprentices in Joint Labor-Management (Union) Programs
in Construction
Non-International Students in Minnesota’s Public
Universities
Average Number Share 2017 Number Share
All Higher Education Enrollment 10,219 100.0% 87,891 100.0%
White 8,208 80.3% 67,220 76.5%
Black or African American 683 6.7% 5,401 6.1%
Latinx 651 6.4% 3,734 4.2%
Other Race (or Unknown) 677 6.6% 11,536 13.1% Source(s): Minnesota Department of Labor and Industry’s “Gender/Ethnicity/Veteran Reports” from July 2014 through July 2017 (Manzo & Duncan, 2018); Fall 2017 Enrollment Data for state universities by the Minnesota Office of Higher Education (MN OHE, 2017).

Building a Strong Minnesota: An Analysis of Minnesota’s Union Construction Industry
7
For young Minnesota residents, registered apprenticeships in construction offer viable post-secondary options that parallel bachelor’s degrees (Figure 8). On average, union journeyworkers earn about $33 per hour in base wages in Minnesota. By contrast, nonunion construction workers only earn about $25 per hour. Journeyworkers from joint construction apprenticeship programs thus earn 32 percent higher hourly wages than their counterparts from employer-only programs. The $33 per hour average wage for union construction workers who complete joint labor-management (union) apprenticeship training compares favorably to earnings for college-educated workers. In Minnesota, the average wage is about $35 per hour for workers with bachelor’s degrees and $25 per hour for workers with associate’s degrees (CEPR, 2020). A typical construction worker who completes a joint labor-management program in Minnesota earns 5 percent less than the average worker with a bachelor’s degree and 32 percent more than the average worker with an associate degree in the state—without any college debt (Figure 8). These findings echo previous research which has found that participation in a registered apprenticeship program has a larger effect on a worker’s hourly earnings than many bachelor’s degrees (Manzo et al., 2019).
Figure 8: Average Hourly Earnings for Minnesota Workers by Sector or Education, 2015-2019
Average Hourly Earnings by Segment of Construction Industry or by Educational Attainment
Average Hourly Earnings
Union Construction $33.36
Nonunion Construction $25.35
High School Degree $20.61
Associate Degree $25.28
Bachelor's Degree $35.03
Advanced Degree $42.12 Source(s): 2015-2019 inflation-adjusted hourly wages for workers employed in construction and extraction occupations by union membership status and for workers by educational attainment from the Current Population Survey Outgoing Rotation Group (CPS-ORG) by the U.S. Census Bureau (CEPR, 2020).
Joint labor-management apprenticeship programs add value to Minnesota’s economy. If all construction registered apprenticeship programs in Minnesota were combined and compared with other institutions of higher education, they would be one of the largest private colleges in the state. The 10 largest joint labor-management construction programs in Minnesota’s construction industry provide more than $600 million in long-run economic value—an economic return of $21 per dollar invested (Manzo et al., 2019). Consequently, privately funded registered apprenticeships are an asset to Minnesota’s unionized construction industry. According to data from the Annual Social and Economic Supplement (ASEC) of the Current Population Survey since 2010, an estimated 89.2 percent of workers who were employed in construction and extraction occupations in the previous year reported that they were still working in construction and extraction occupations in the year they were surveyed. The remaining 10.8 percent exited the field, either due to retirement, to work in a different occupation, to pursue educational opportunities, or to unemployment or layoffs. Assuming this 10.8 percent separation rate held, an average of 10,600 construction and extraction workers vacated their positions from 2015 and 2017 (Figure 9). This drop in labor supply was met with an average active enrollment of more than 11,000 registered construction apprentices in Minnesota, including 10,200 in joint labor-management construction programs.3 This suggests that the
3 While not every construction apprentice will complete his or her training, it is also true that not every construction and extraction worker who retires or otherwise exits the industry is a union member. It is likely that only a small portion of these exiters were union members. However, 93 percent of the registered apprentices were enrolled in joint labor-management programs. As a result, Minnesota’s union construction industry only needs a completion rate of about 50 percent to replace these workers.

Building a Strong Minnesota: An Analysis of Minnesota’s Union Construction Industry
8
union construction industry is effective at providing a constant supply of skilled workers to meet Minnesota’s demand for craft labor.
Figure 9: Construction Worker Employment and Separations vs. Construction Apprentices, 2015-2017
Supply and Demand Metrics 2015 2016 2017 Average
Construction and Extraction Workers 95,560 98,730 99,900 98,063
Estimated Separations (10.8% Exit Rate) -10,329 -10,672 -10,798 -10,600
Average Number of Active Construction Apprentices in Minnesota +11,035 Source(s): May 2015-May 2017 Occupational Employment Statistics data from the Bureau of Labor Statistics at the U.S. Department of Labor (BLS, 2021a); 2010-2019 Current Population Survey Annual Economic and Social Supplement (CPS-ASEC) by the U.S. Census Bureau (Flood et al., 2021); Minnesota Department of Labor and Industry’s “Gender/Ethnicity/Veteran Reports” from July 2014 through July 2017 (Manzo & Duncan, 2018).
ECONOMIC RESEARCH ON THE VALUE OF UNIONS AND COLLECTIVE BARGAINING
Collective bargaining enables workers to join together in unions and negotiate contracts with their employers to establish the terms and conditions of employment. Collective bargaining is a method for formalizing labor-management relations, with workplace decisions made jointly by employers and employees, rather than unilaterally by one party. This process fosters democratic workplaces, with workers having the ability to elect representatives to bargain on their behalf. Collective bargaining agreements (CBAs) typically include terms on pay, hours, time off, health insurance benefits, retirement benefits, safety procedures, and other workplace policies. Every year, thousands of workers in Minnesota negotiate or renegotiate their workplace contracts. Numerous studies have found that collective bargaining boosts wages for workers, specifically for low-income employees, for middle-class workers, and for people of color (Callaway & Collins, 2017; Bivens et al., 2017; Long, 2013; Mishel & Walters, 2003). On average, union households earn between 10 percent and 20 percent more than nonunion households—an income premium that has been consistent since the 1930s (Farber et al., 2018). In Minnesota, union members have been found to earn 7 percent higher wages than nonunion workers, with a higher wage differential for middle-class workers (9 percent) (Manzo et al., 2018a). Conversely, a recent study that compared states with so-called “right-to-work” laws—which effectively weaken the power of collective bargaining units—found that average worker wages were 3 percent lower, health insurance coverage was 5 percent lower, and worker productivity was 17 percent lower than in states that require workers to share in the cost off negotiating their collective bargaining agreements (Manzo & Bruno, 2021). The pay penalty associated with so-called “right-to-work” laws is even larger for essential workers, including 11 percent lower wages for construction and extraction workers. Workers covered by collective bargaining agreements also have better fringe benefits. Fully 95 percent of union workers have access to health care coverage, 94 percent have access to retirement plans, and 91 percent have access to paid sick leave compared with just 68 percent health care access, 67 percent retirement plan access, and 73 percent paid sick leave access for nonunion workers (BLS, 2019). Likewise, unions reduce poverty, worker turnover, and inequality and discrimination in ways that reduce taxpayer costs for government assistance programs and increase tax revenues (Nunn et al., 2019). According to recent research by economists at the University of Minnesota, union members contribute approximately $1,110 more in taxes and receive about $180 less in social safety net benefits, on average, than nonunion workers—positively impacting public budgets by $1,290 per member per year (Sojourner & Pacas, 2018). Unions in the construction industry are no different. While unionization has declined over time for construction workers, the construction industry remains one of the most unionized private-sector industries

Building a Strong Minnesota: An Analysis of Minnesota’s Union Construction Industry
9
in the nation, and Minnesota’s construction workers are more unionized than their counterparts nationwide (CPWR, 2017). For every $1 paid in union dues, $5.59 is returned to Minnesota’s unionized construction workers in after-tax income each year, a return on investment that is unparalleled for working families (Manzo et al., 2016a). This higher pay is in addition to better health and retirement benefits, enhanced workplace safety procedures, and reduced likelihood of relying on government assistance programs. However, Minnesota’s construction industry is segmented into “commercial construction,” “highway and heavy construction,” and “residential construction or agricultural construction” (MN DLI, 2021). These three different types of construction result in different outcomes for the industry’s contractors and workers. For example, highway and heavy construction projects are significantly more likely to be publicly funded and include labor standards, while residential construction is generally considered a low-wage, low-benefits, and low-skill segment of the industry. As a result, careers in the highway and heavy construction segment are more likely to pay higher wages, provide better fringe benefits, and offer apprenticeship training than residential construction (Manzo, 2016; Schmitt, 2008).
THE IMPACT OF THE UNION CONSTRUCTION INDUSTRY ON THE CONSTRUCTION WORKFORCE
On average, union construction workers earn 32 percent more than nonunion construction workers (Figure 10). However, the union wage premium is highest for the lowest-income construction workers. For example, the highest-earning 10th percentile of construction workers earn 15 percent higher wages if they are union members while the median construction worker earns 51 percent more per hour if he or she is a union member. Unions also boost wages by between 44 percent and 50 percent for the lowest-earning construction workers. In fact, the bottom 25th percentile of union construction workers still take home $25 per hour, exceeding the $22 per hour median and matching the $25 per hour average for the nonunion segment of the construction industry. Only 3 percent of union construction workers earn less than $15 per hour compared with 14 percent of nonunion construction workers, an 11 percent difference.
Figure 10: Distribution of Wages for Minnesota Construction Workers by Union Status, 2015-2019
Distribution of Income in Minnesota’s Construction Industry
Union Construction
Nonunion Construction
Union Difference
Average $33.36 $25.35 +31.6%
Highest-Earning 10th Percentile $48.08 $41.72 +15.2%
Top 25th Percentile $40.72 $30.88 +31.9%
Median Worker $32.48 $21.50 +51.1%
Bottom 25th Percentile $25.03 $16.69 +50.0%
Lowest-Earning 10th Percentile $19.23 $13.32 +44.4%
Share Earning Less than $15 Per Hour 3.4% 14.0% -10.6%
Inequality Index: 90-10 Ratio 2.50 3.13 -20.2%
Inequality Index: 90-50 Ratio 1.48 1.94 -23.7% Source(s): 2015-2019 inflation-adjusted hourly wages for workers employed in construction and extraction occupations by union membership status and for workers by educational attainment from the Current Population Survey Outgoing Rotation Group (CPS-ORG) by the U.S. Census Bureau (CEPR, 2020).
Consequently, Minnesota’s union construction industry has significantly less wage inequality (Figure 10). The “90-10 inequality index” and the “90-50 inequality index” are utilized to assess wage inequality in Minnesota’s construction industry. The 90-10 inequality index is a ratio of how much more the highest-earning 10th percentile of construction workers are paid compared to the lowest-earning 10th percentile. Similarly, the “90-50 inequality index” is a ratio of how much more the highest-earning 10th percentile make
Building a Strong Minnesota: An Analysis of Minnesota’s Union Construction Industry
10
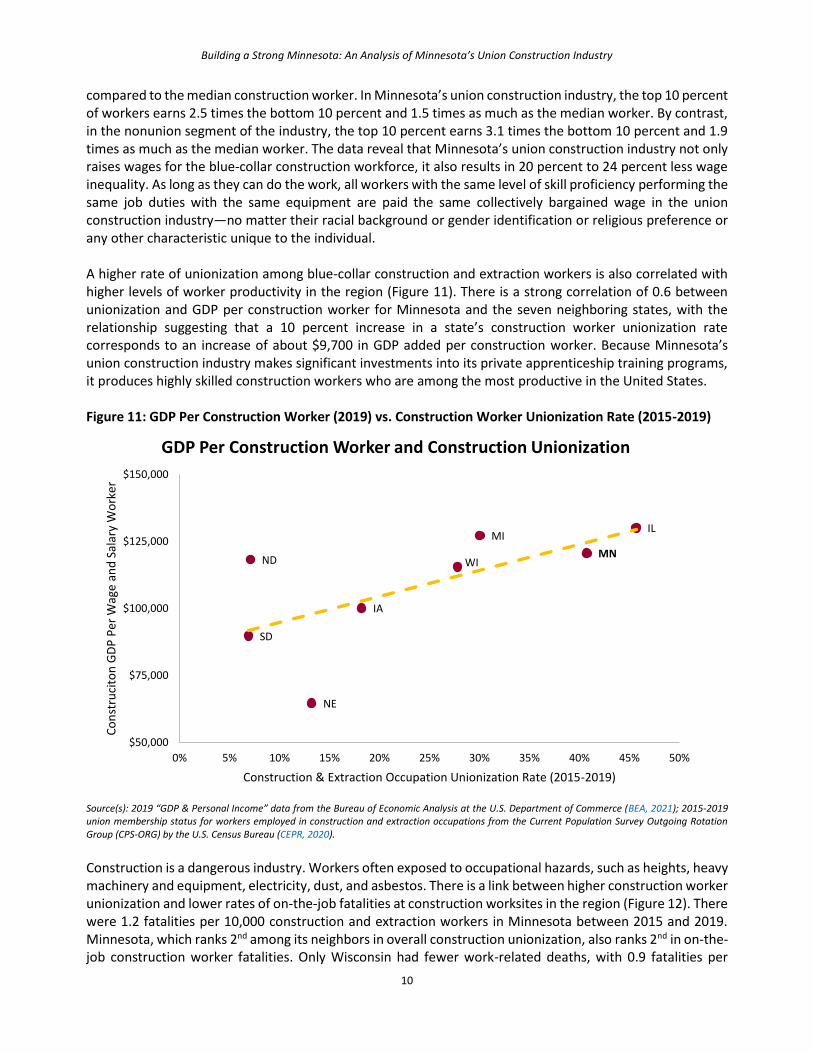
compared to the median construction worker. In Minnesota’s union construction industry, the top 10 percent of workers earns 2.5 times the bottom 10 percent and 1.5 times as much as the median worker. By contrast, in the nonunion segment of the industry, the top 10 percent earns 3.1 times the bottom 10 percent and 1.9 times as much as the median worker. The data reveal that Minnesota’s union construction industry not only raises wages for the blue-collar construction workforce, it also results in 20 percent to 24 percent less wage inequality. As long as they can do the work, all workers with the same level of skill proficiency performing the same job duties with the same equipment are paid the same collectively bargained wage in the union construction industry—no matter their racial background or gender identification or religious preference or any other characteristic unique to the individual. A higher rate of unionization among blue-collar construction and extraction workers is also correlated with higher levels of worker productivity in the region (Figure 11). There is a strong correlation of 0.6 between unionization and GDP per construction worker for Minnesota and the seven neighboring states, with the relationship suggesting that a 10 percent increase in a state’s construction worker unionization rate corresponds to an increase of about $9,700 in GDP added per construction worker. Because Minnesota’s union construction industry makes significant investments into its private apprenticeship training programs, it produces highly skilled construction workers who are among the most productive in the United States. Figure 11: GDP Per Construction Worker (2019) vs. Construction Worker Unionization Rate (2015-2019)
Source(s): 2019 “GDP & Personal Income” data from the Bureau of Economic Analysis at the U.S. Department of Commerce (BEA, 2021); 2015-2019 union membership status for workers employed in construction and extraction occupations from the Current Population Survey Outgoing Rotation Group (CPS-ORG) by the U.S. Census Bureau (CEPR, 2020).
Construction is a dangerous industry. Workers often exposed to occupational hazards, such as heights, heavy machinery and equipment, electricity, dust, and asbestos. There is a link between higher construction worker unionization and lower rates of on-the-job fatalities at construction worksites in the region (Figure 12). There were 1.2 fatalities per 10,000 construction and extraction workers in Minnesota between 2015 and 2019. Minnesota, which ranks 2nd among its neighbors in overall construction unionization, also ranks 2nd in on-the-job construction worker fatalities. Only Wisconsin had fewer work-related deaths, with 0.9 fatalities per
IL
IA
MI
MN
NE
ND
SD
WI
$50,000
$75,000
$100,000
$125,000
$150,000
0% 5% 10% 15% 20% 25% 30% 35% 40% 45% 50%
Co
nst
ruci
ton
GD
P P
er W
age
and
Sal
ary
Wo
rker
Construction & Extraction Occupation Unionization Rate (2015-2019)
GDP Per Construction Worker and Construction Unionization

Building a Strong Minnesota: An Analysis of Minnesota’s Union Construction Industry
11
100,000 construction and extraction workers over this timeframe. On the other hand, North Dakota had 2.4 fatalities per 100,000 construction and extraction workers. Relative to its size, North Dakota has one-sixth as many construction and extraction workers in unions but two times as many construction workers suffering from on-the-job fatalities when compared with Minnesota. Figure 12: On-the-Job Construction Fatalities Per 10,000 and Construction Unionization Rate, 2015-2019
Average (2015-2019)
Fatalities Per 10,000 Construction and Extraction Workers
Construction Unionization
Minnesota 1.24 40.7%
Illinois 1.54 45.7%
Iowa 1.62 18.2%
Michigan 2.17 30.1%
Nebraska 1.56 13.2%
North Dakota 2.44 7.1%
South Dakota 1.90 6.9%
Wisconsin 0.86 27.8%
United States 1.63 17.9% Source(s): 2015-2019 “Census of Fatal Occupational Injuries” data on fatalities divided by May 2015-May 2019 Occupational Employment Statistics data from the Bureau of Labor Statistics at the U.S. Department of Labor (BLS, 2021c; BLS, 2021a); 2015-2019 union membership status for workers employed in construction and extraction occupations from the Current Population Survey Outgoing Rotation Group (CPS-ORG) by the U.S. Census Bureau (CEPR, 2020).
Figure 13: On-the-Job Construction Fatality Rate vs. Construction Worker Unionization Rate, 2015-2019
Source(s): 2015-2019 “Census of Fatal Occupational Injuries” data on fatalities divided by May 2015-May 2019 Occupational Employment Statistics data from the Bureau of Labor Statistics at the U.S. Department of Labor (BLS, 2021c; BLS, 2021a); 2015-2019 union membership status for workers employed in construction and extraction occupations from the Current Population Survey Outgoing Rotation Group (CPS-ORG) by the U.S. Census Bureau (CEPR, 2020).
ILIA
MN
MN
NE
ND
SD
WI
0.00
0.50
1.00
1.50
2.00
2.50
0% 5% 10% 15% 20% 25% 30% 35% 40% 45% 50%Co
nst
ruct
ion
& E
xtra
ctio
n O
ccu
pat
ion
Fat
alit
ies
Per
10
,00
0
Construction & Extraction Occupation Unionization Rate (2015-2019)
Construction Jobsite Fatalities and Construction Unionization

Building a Strong Minnesota: An Analysis of Minnesota’s Union Construction Industry
12
The correlation between the unionization rate and the on-the-job fatalities rate is -0.5 for Minnesota and the seven neighboring states (Figure 13). The relationship indicates that each 10 percent increase in a state’s construction worker unionization rate corresponds with 0.2 fewer fatalities per 10,000 construction and extraction workers. This association implies that Minnesota’s unionized construction industry fosters safer work environments. Previous research has also found that union construction workers are significantly less likely than nonunion construction workers to suffer a workplace fatality in New York and Massachusetts (Obernauer, 2020; Laing et al., 2019). There is also direct evidence that union jobsites are safer and healthier for construction workers in Minnesota (Figure 14). In 2019, the Occupational Safety and Health Administration (OSHA) conducted 771 investigations at construction workplaces in Minnesota—including 199 at union jobsites and 572 at nonunion jobsites. During the 199 visits to union jobsites, OSHA investigators found at least one health and safety violation on 94 occasions, or 47 percent of the time. Union jobsites averaged 0.7 total violations per OSHA investigation. By contrast, visits to nonunion jobsites resulted in at least one health and safety violation 53 percent of the time and an average of 1.2 violations per OSHA investigation. Even though union jobsites accounted for 35 percent of all OSHA investigations in the construction industry, union jobsites only accounted for 21 percent of all health and safety violations. Accordingly, union jobsites had 40 percent fewer health and safety violations than nonunion jobsites in Minnesota’s construction industry. Figure 14: OSHA Investigations and Violations at Minnesota Construction Jobsites by Union Status, 2019
771 OSHA Investigations on Construction Worksites in 2019
Union Contractor
Nonunion Contractor
Union Difference
Investigations 199 572 --
Investigations with Violation 94 305 --
Share with a Violation 47.2% 53.3% -6.1%
Number of Violations 141 680 --
Violations Per Investigation 0.71 1.19 -40.4% Source(s): Health and safety investigation data from the Occupational Safety and Health Administration at the U.S. Department of Labor for investigations opened between January 1, 2019 and December 31, 2019 for NAICS Codes 230000 through 239999 in Minnesota (OSHA, 2021).
THE IMPACT OF THE UNION CONSTRUCTION INDUSTRY ON SOCIAL OUTCOMES
Minnesota’s union construction industry expands access to the American Dream and reduces reliance on social safety net programs for blue-collar construction workers (Figure 15). As noted previously, union construction workers earn higher wages, which enables them to afford homes in the communities where they build schools, roads, bridges, parks, and other essential infrastructure. Over the past decade, union construction workers have been more likely to own homes than their nonunion counterparts. Fully 68 percent of union construction workers report that they own their homes, 3 percent higher than households with nonunion construction workers (65 percent). This expansion of homeownership likely increases the wealth of skilled construction workers (Herbert et al., 2013; Schuetz, 2019). Minnesota’s union construction industry produces other social outcomes that are traditionally associated with the American middle class (Figure 15). For example, more than 6-in-10 middle-class Americans are married compared with just less than 4-in-10 low-income adults (Reeves & Pulliam, 2020). In Minnesota, 53 percent of union construction workers are currently married, which is more than 15 percent higher than the nonunion average (38 percent). In addition, about 9-in-10 union construction workers (91 percent) have private health insurance coverage, compared with less than 5-in-10 nonunion construction workers (48

Building a Strong Minnesota: An Analysis of Minnesota’s Union Construction Industry
13
percent), a difference of 43 percent. Union construction workers (60 percent) are also significantly more likely to have access to pension plans than their nonunion counterparts (36 percent). Union construction workers are about 13 percent less likely to rely on both Supplemental Nutrition Assistance Program (SNAP) food stamps and Earned Income Tax Credit (EITC) government assistance than their nonunion counterparts. Minnesota’s union construction industry ensures that skilled construction workers have access to middle-class incomes and high-quality fringe benefits that support families.
Figure 15: Social Outcomes in Minnesota’s Construction Industry by Union Status, 2010-2019
Social and Community Outcomes in Minnesota’s Construction Industry
Union Construction
Nonunion Construction
Union Difference
Homeownership Rate 67.9% 64.9% +2.9%
Marriage Rate 52.6% 37.6% +15.1%
Covered by Private Health Insurance 91.3% 48.7% +42.6%
Has a Pension Plan at Work 60.2% 36.1% +24.2%
SNAP Food Stamp Reliance 0.9% 13.6% -12.7%
EITC Assistance 3.5% 16.7% -13.2% Source(s): 2010-2019 Current Population Survey Annual Economic and Social Supplement (CPS-ASEC) by the U.S. Census Bureau (Flood et al., 2021).
The union construction industry not only saves taxpayer dollars on social safety net programs, it expands the tax base in Minnesota (Figure 16). Union construction workers earn about $69,000 per year on average compared to about $53,000 annually for nonunion construction workers in Minnesota, a difference of 32 percent. Because they earn more, union construction workers contribute more towards public budgets. On average, union construction workers contribute nearly $3,500 in state income taxes, 48 percent more than the $2,400 paid by nonunion construction workers in Minnesota. This exceeds the pay differential of 32 percent because Minnesota’s income tax rates are “progressive,” with higher tax rates for higher earners. Similarly, union construction workers contribute another $8,300 on average in federal income taxes, which is 79 percent more than the $4,700 paid per nonunion construction worker. Furthermore, because union construction workers are more likely to own homes, they are also more likely to contribute more in property taxes to support their local communities.
Figure 16: Average Income Taxes Contributed by Minnesota’s Construction Workers by Union Status
Income Taxes Paid by Workers in Minnesota’s Construction Industry
Union Construction
Nonunion Construction
Union Difference
Annual Income $69,383 $52,724 +31.6%
Average Effective State Tax Rate 5.04% 4.49% +12.2%
Average Effective Federal Tax Rate 12.00% 8.84% +35.7%
Average State Income Taxes $3,498 $2,365 +47.9%
Average Federal Income Taxes $8,326 $4,661 +78.6% Source(s): 2015-2019 inflation-adjusted hourly wages for workers employed in construction and extraction occupations by union membership status from the Current Population Survey Outgoing Rotation Group (CPS-ORG) by the U.S. Census Bureau (CEPR, 2020); “Minnesota Income Tax Calculator” by SmartAsset (SmartAsset, 2021).
THE IMPACT OF THE UNION CONSTRUCTION INDUSTRY BUSINESS MODEL ON THE ECONOMY An analysis of collective bargaining agreements (CBAs) between the Associated General Contractors (AGC) of Minnesota, a multi-employer association that includes union contractors, and unions representing six construction trades also reveals that Minnesota’s union construction industry provides ladders into the
Building a Strong Minnesota: An Analysis of Minnesota’s Union Construction Industry
14
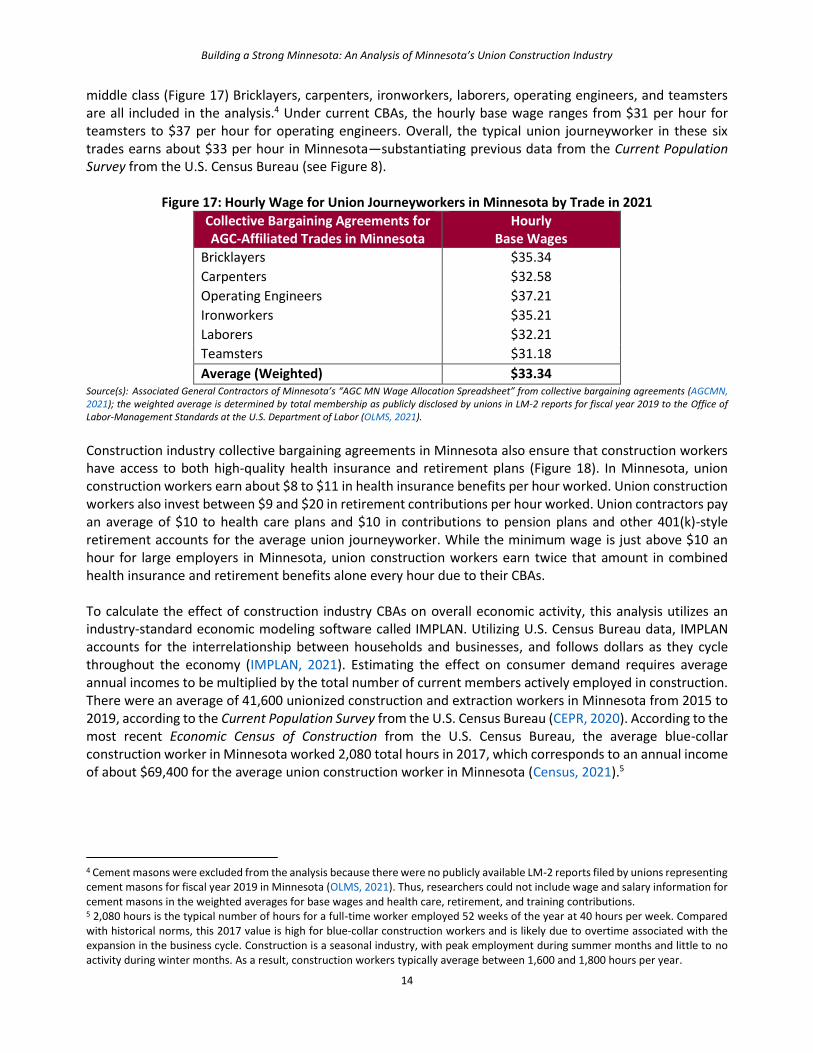
middle class (Figure 17) Bricklayers, carpenters, ironworkers, laborers, operating engineers, and teamsters are all included in the analysis.4 Under current CBAs, the hourly base wage ranges from $31 per hour for teamsters to $37 per hour for operating engineers. Overall, the typical union journeyworker in these six trades earns about $33 per hour in Minnesota—substantiating previous data from the Current Population Survey from the U.S. Census Bureau (see Figure 8).
Figure 17: Hourly Wage for Union Journeyworkers in Minnesota by Trade in 2021
Collective Bargaining Agreements for AGC-Affiliated Trades in Minnesota
Hourly Base Wages
Bricklayers $35.34
Carpenters $32.58
Operating Engineers $37.21
Ironworkers $35.21
Laborers $32.21
Teamsters $31.18
Average (Weighted) $33.34 Source(s): Associated General Contractors of Minnesota’s “AGC MN Wage Allocation Spreadsheet” from collective bargaining agreements (AGCMN, 2021); the weighted average is determined by total membership as publicly disclosed by unions in LM-2 reports for fiscal year 2019 to the Office of Labor-Management Standards at the U.S. Department of Labor (OLMS, 2021).
Construction industry collective bargaining agreements in Minnesota also ensure that construction workers have access to both high-quality health insurance and retirement plans (Figure 18). In Minnesota, union construction workers earn about $8 to $11 in health insurance benefits per hour worked. Union construction workers also invest between $9 and $20 in retirement contributions per hour worked. Union contractors pay an average of $10 to health care plans and $10 in contributions to pension plans and other 401(k)-style retirement accounts for the average union journeyworker. While the minimum wage is just above $10 an hour for large employers in Minnesota, union construction workers earn twice that amount in combined health insurance and retirement benefits alone every hour due to their CBAs. To calculate the effect of construction industry CBAs on overall economic activity, this analysis utilizes an industry-standard economic modeling software called IMPLAN. Utilizing U.S. Census Bureau data, IMPLAN accounts for the interrelationship between households and businesses, and follows dollars as they cycle throughout the economy (IMPLAN, 2021). Estimating the effect on consumer demand requires average annual incomes to be multiplied by the total number of current members actively employed in construction. There were an average of 41,600 unionized construction and extraction workers in Minnesota from 2015 to 2019, according to the Current Population Survey from the U.S. Census Bureau (CEPR, 2020). According to the most recent Economic Census of Construction from the U.S. Census Bureau, the average blue-collar construction worker in Minnesota worked 2,080 total hours in 2017, which corresponds to an annual income of about $69,400 for the average union construction worker in Minnesota (Census, 2021).5
4 Cement masons were excluded from the analysis because there were no publicly available LM-2 reports filed by unions representing cement masons for fiscal year 2019 in Minnesota (OLMS, 2021). Thus, researchers could not include wage and salary information for cement masons in the weighted averages for base wages and health care, retirement, and training contributions. 5 2,080 hours is the typical number of hours for a full-time worker employed 52 weeks of the year at 40 hours per week. Compared with historical norms, this 2017 value is high for blue-collar construction workers and is likely due to overtime associated with the expansion in the business cycle. Construction is a seasonal industry, with peak employment during summer months and little to no activity during winter months. As a result, construction workers typically average between 1,600 and 1,800 hours per year.

Building a Strong Minnesota: An Analysis of Minnesota’s Union Construction Industry
15
Figure 18: Health Care and Retirement Benefits Per Hour for Union Journeyworkers by Trade in 2021
Source(s): Associated General Contractors of Minnesota’s “AGC MN Wage Allocation Spreadsheet” from collective bargaining agreements (AGCMN, 2021); the weighted average is determined by total membership as publicly disclosed by unions in LM-2 reports for fiscal year 2019 to the Office of Labor-Management Standards at the U.S. Department of Labor (OLMS, 2021).
When a construction worker earns a dollar, he or she spends most of it back in the economy. That dollar helps employ people at local businesses, who in turn spend it on goods and services for their families. Collective bargaining agreements support an estimated $2.9 billion in total worker wages for these 41,600 unionized construction and extraction workers in Minnesota (Figure 19). These 41,600 union construction workers spend billions of dollars locally in the Minnesota economy, supporting about 15,700 jobs. In total, an estimated $2.7 billion is circulated in business sales and economic output from the spending of union construction workers and their families in Minnesota.
Figure 19: Impacts of Construction Industry CBAs on Jobs and Economic Activity in Minnesota in 2021
Economic Impacts
Current Union Workers
Total Income from Wages
Jobs Created or Saved
Total Economic Output
Total Effects 41,593 +$2,884,647,177 +15,699 +$2,691,726,937 Source(s): Associated General Contractors of Minnesota’s “AGC MN Wage Allocation Spreadsheet” from collective bargaining agreements (AGCMN, 2021); average hours worked by all construction workers in Minnesota according to the 2017 Economic Census of Construction from the U.S. Census Bureau (Census, 2021). Data are entered into an input-output economic impact analysis software called IMPLAN (IMPLAN, 2021).
The biggest industry that is indirectly impacted by construction industry CBAs is the health care and community services industry. More than 3,300 jobs are created or saved at Minnesota hospitals, health care facilities, and rehabilitation centers due to the large investment in health care benefits negotiated in construction industry CBAs. The retail and wholesale trade sector annually employs nearly 2,500 more workers in Minnesota because of the consumer spending of union construction workers in the state. Similarly, hotels, restaurants, and other hospitality businesses employ about 1,900 more workers as a result of construction industry CBAs. Construction industry CBAs have a similar impact (more than 1,800 jobs) on professional and business services—which include legal services and architecture and engineering services (Figure 20).
$10.47$9.36
$11.10$10.00
$8.40
$11.37$10.43
$12.72$11.59
$9.97
$19.75
$9.27$8.55
$9.95
$0
$5
$10
$15
$20
Bricklayers Carpenters OperatingEngineers
Ironworkers Laborers Teamsters Average(Weighted)
Health Care and Retirement Contributions Per Hour
Health Care Contributions Retirement Contributions

Building a Strong Minnesota: An Analysis of Minnesota’s Union Construction Industry
16
Figure 20: Impact of Construction Industry CBAs on Jobs in Other Industries Based on Total Sales, 2021
Rank Sector Jobs Created or Saved
1 Health Care and Community Services +3,346
2 Retail and Wholesale Trade +2,487
3 Accommodation and Food Services +1,884
4 Finance, Insurance, and Real Estate +1,818
5 Transportation and Warehousing +917
6 Professional and Business Services +750
7 Educational Services +593
8 Social Assistance and Nonprofits +534
9 Arts, Entertainment, and Recreation +500
10 Manufacturing +124
-- All Other Sectors +2,745 Source(s): Associated General Contractors of Minnesota’s “AGC MN Wage Allocation Spreadsheet” from collective bargaining agreements (AGCMN, 2021); average hours worked by all construction workers in Minnesota according to the 2017 Economic Census of Construction from the U.S. Census Bureau (Census, 2021). Data are entered into an input-output economic impact analysis software called IMPLAN (IMPLAN, 2021).
RESEARCH ON PREVAILING WAGES, RESPONSIBLE BIDDING, AND TOTAL CONSTRUCTION COSTS
The Minnesota Prevailing Wage Act promotes minimum standards for blue-collar construction workers employed on public construction projects. Specifically, prevailing wages are minimum wage rates for different types of skilled construction workers on taxpayer-funded projects, based on wages and benefits that are paid for similar work in the local area where public projects are to be completed. By preventing public bodies from awarding bids to contractors that pay less than the privately established local market rate, the Minnesota Prevailing Wage Act ensures that workers can afford to live in the communities where they are building roads, bridges, paths, parks, schools, or other public projects. The Minnesota Prevailing Wage Act, which was enacted in 1973, is modeled off of the federal Davis-Bacon Act, which was passed by Congress in 1931. The main purpose of a prevailing wage law is to protect local construction labor standards in the competitive bidding process. Public construction bidding is different from private-sector construction. Public bodies in Minnesota are generally required to select the lowest bidder. In the low-bid model, contractors aim to lower their bids however possible, including through cutthroat reductions in worker wages, benefits, and apprenticeship training or safety. In particular, long-term investments in worker training and fringe benefits that attach workers to construction careers are often jettisoned by contractors in order to win bids on short-term projects. Large infusions of government spending into an area, along with a contract award process that rewards the lowest bidder, may also attract contractors from areas with low wages and low skills. Any appreciable infusion of low-wage contractors could result in the erosion of these local market standards. In fact, Minnesota's prevailing wage law was enacted in 1973 in response to an incident in which out-of-state workers, who earned much less than local workers, were hired for a University of Minnesota farm project (MN DLI, 2017). Prevailing wage laws level the playing field for contractors by taking labor costs out of the equation, incentivizing them to compete based on core competencies and efficiencies in construction. Prevailing wage and benefits rates are based on the most common wage paid for a job classification in a county. In Minnesota, prevailing wage and benefits rates are often (but are not required to be) based on collectively-bargained union rates. Rates may be the same in neighboring counties, but typically vary between

Building a Strong Minnesota: An Analysis of Minnesota’s Union Construction Industry
17
regions. Prevailing wages are required on state-funded projects with a value of $2,500 if a single trade is involved and $25,000 if multiple trades are involved (WHD, 2021). Economic research has found that, by leveling the playing field for construction contractors and ensuring that public expenditures reflect local market standards of compensation and craftsmanship, local contractors are awarded more taxpayer-funded projects in states with prevailing wage laws. Data from the Economic Census of Construction reveals that states with prevailing wage laws have 2 percent more of the total value of construction work completed by in-state contractors (Census, 2012). Impacts are even larger in certain areas. In Minnesota, local contractors account for a 10 percent higher market share when prevailing wages are paid on public school projects (Manzo & Duncan, 2018). Oregon’s prevailing wage law is associated with 12 percent greater market share of in-state contractors on state highway projects (Stepick & Manzo, 2021). In Santa Clara County, California, county-resident businesses account for 16 percent higher market share when prevailing wages are paid on library construction projects (Duncan, 2011). Conversely, the share of Wisconsin Department of Transportation projects that were awarded to out-of-state contractors increased from 9 percent to 14 percent after the state repealed its prevailing wage law in 2017, an increase that was driven almost entirely by contractors from Iowa, Michigan, and Florida—three states without prevailing wage laws (Manzo et al., 2020a). Economic research also shows that state prevailing wage laws increase apprenticeship training in the construction industry. Economist Cihan Bilginsoy has found that apprenticeship enrollments are up to 8 percent higher in states with prevailing wage and that apprentices complete their on-the-job and classroom training at a faster rate in these states (Bilginsoy, 2005). Another study found that the apprenticeship share of the construction workforce is 14 percent in states with prevailing wage laws compared to 8 percent in states without prevailing wage laws (Dickson Quesada et al., 2013). The result is that workers are higher skilled and more productive. Indeed, productivity per construction worker has been found to be 14 to 33 percent higher in states that have prevailing wage laws (Philips, 2014). Economic studies conducted after the repeal of prevailing wage laws have also shown a strong correlation with a decrease in worker training. After Utah repealed its law, apprenticeship training declined to historical lows (Azari-Rad et al., 2003). Registered apprenticeships fell by 38 percent in Kansas following repeal (Philips, 2014). In an analysis of nine states that repealed their prevailing wage laws from 1979 to 1988, researchers found that repeal was associated with a decrease in training by 40 percent and caused workplace injuries to rise by 15 percent (Philips et al., 1995). After West Virginia repealed its prevailing wage law in May 2016, the number of active apprentices fell by 28 percent, leading to a 26 percent increase in the on-the-job construction worker injury rate (Kelsay & Manzo, 2019). Additionally, recent peer-reviewed research has found that the repeal of a state prevailing wage law leads to a 12 to 13 percent increase in construction injury rates (Li et al., 2019). In addition to ensuring that the next generation of construction workers is trained, state prevailing wage laws foster middle-class careers for skilled construction workers. There is a significant disparity in the wages paid to blue-collar construction workers between states with prevailing wage laws and states without prevailing wage laws (Philips, 2014). One economic analysis found that Minnesota’s prevailing wage law statistically increases blue-collar construction worker earnings by about 5 percent per year and expands health insurance coverage by 5 percent (Manzo & Duncan, 2018). They also ensure that construction workers can afford to live in the communities where they build roads, schools, and other public infrastructure, increasing their homeownership rate by 2 percent and improving their housing wealth by 13 percent (Manzo et al., 2020b). Because they earn higher incomes, skilled construction workers in states with prevailing wage laws contribute more in tax revenues than their counterparts in states without the law. Skilled construction workers in states

Building a Strong Minnesota: An Analysis of Minnesota’s Union Construction Industry
18
with prevailing wage laws contribute about 17 percent in income and property taxes than their counterparts in states without prevailing wage laws (Philips & Blatter, 2017). In addition, skilled construction workers are statistically less likely to rely on government assistance programs, such as Supplemental Nutrition Assistance Program (SNAP) food stamps and the Earned Income Tax Credit (EITC) assistance (Manzo et al., 2016b). Economic research has also found that prevailing wage laws protect workers against exploitation—regardless of race or ethnicity. Peer-reviewed studies have found no relationship between prevailing wage laws and the racial composition of the construction workforce (Duncan & Ormiston, 2018). After accounting for individual factors such as age, gender, residence in a metropolitan area, marital status, educational attainment, and union coverage, there is no evidence that prevailing wage laws deter people of color from participating in the construction industry (Belman & Philips, 2005). Furthermore, there is no evidence that prevailing wage laws exclude people of color from training in registered apprenticeship programs (Bilginsoy, 2005; Bilginsoy, 2017). Instead, recent research has found that prevailing wage standards boost the homeownership rate of African American construction workers by 8 percent, compared with a 3 percent increase for white construction workers, while another study found that state prevailing wage laws reduce racial income inequality in construction by between 7 and 53 percent (Manzo et al., 2020b; Manzo et al., 2018b). Overall, prevailing wage laws have been found to ensure that the construction workforce is highly skilled, reduce the leakage of construction funds and jobs from the local economy, and prevent skilled construction workers from relying on government assistance programs—without impacting construction costs There have been 18 studies on the impact of prevailing wage standards on the cost of school construction, highway construction, and municipal building projects that have been published in academic journals since 2000 (Figure 21). Cumulatively, these peer-reviewed studies have analyzed more than 21,000 traditional public works projects. Peer review is the process of establishing credibility by submitting research to a group of anonymous, independent experts who critically evaluate methodologies and conclusions before being accepted for publication. By contrast, studies that have not undergone peer review can suffer from errors, methodological defects, and misleading or suspicious conclusions. Of the 18 peer-reviewed studies on prevailing wage laws since 2000, 13 pertain to school construction costs, which is a key focus among economic researchers. Public school construction is more homogenous than other types of public works projects, which makes it easier to isolate the potential cost impact of prevailing wage laws. Additionally, three evaluate highway costs and two investigate public and municipal buildings. In total, 15 of these peer-reviewed studies (83 percent) find that prevailing wage laws have no effect on the total construction costs (Figure 21). There is a four-part rationale for the economic consensus is that prevailing wage laws have no impact on total construction costs (Duncan & Ormiston, 2018). First, labor costs are a low and historically declining share of total costs in the construction industry—approximately 18 percent (Census, 2021). Second, peer-reviewed research indicates that, when wages rise in construction, contractors respond by utilizing more capital equipment and by hiring skilled workers to replace their less-productive counterparts (Balistreri et al., 2003; Blankenau & Cassou, 2011). Third, contractors have also been found to respond to higher wages by reducing expenditures on materials, fuels, and rental equipment and by accepting marginally lower profit margins (Duncan & Lantsberg, 2015). Since labor costs represent a small portion of overall costs, these minor changes offset any effect of prevailing wage laws, protecting market standards, and stabilize overall construction costs. Finally, there have been four peer-reviewed studies since 2000 that empirically examine the effect of prevailing wage standards on the overall level of bid competition—an important determinant of construction costs. All four of these studies, which collectively evaluated data on more than 2,000 bid proposals, found

Building a Strong Minnesota: An Analysis of Minnesota’s Union Construction Industry
19
that prevailing wage standards did not reduce the number of bidders on public construction projects (Duncan, 2015a; Kim et al., 2012; Onsarigo et al., 2020; Duncan & Waddoups, 2020). These include Professor Duncan’s evaluation of about 500 bids on highway construction projects in Colorado (Duncan, 2015a). In fact, “the cost-reducing effect of increased bid competition is stronger on projects covered by the prevailing wage policy” (Onsarigo et al., 2020).
Figure 21: Research on the Impact of Prevailing Wage on the Cost of Public Works Projects Since 2000
Study Authors Year Project Focus Projects Geography Effect
1 Onsarigo, Duncan, & Atalah 2020 School construction 113 Ohio No effect
2 Duncan & Waddoups 2020 School construction 77 Nevada No effect
3 Duncan 2015 Highways 132 Colorado No effect
4 Duncan 2015 Highways 91 Colorado No effect
5 Duncan, Philips, & Prus 2014 School construction 498 Canada No effect
6 Kaboub & Kelsay 2014 Public buildings 3,120 12 states* No effect
7 Atalah 2013 School construction 1,496 Ohio No effect
8 Atalah 2013 School construction 1,496 Ohio No effect
9 Duncan, Philips, & Prus 2012 School construction 723 Canada No effect
10 Kim, Kuo-Liang, & Philips 2012 Municipal projects 141 California No effect
11 Vincent & Monkkonen 2010 School construction 2,645 United States 13%
12 Duncan, Philips, & Prus 2009 School construction 438 Canada No effect
13 Duncan, Philips, & Prus 2006 School construction 528 Canada No effect
14 Azari-Rad, Philips, & Prus 2003 School construction 4,653 United States No effect
15 Azari-Rad, Philips, & Prus 2002 School construction 4,974 United States No effect
16 Vitaliano 2002 Highways 50** United States 8%
17 Keller & Hartman 2001 School construction 25*** Pennsylvania 2%
18 Bilginsoy & Philips 2000 School construction 54 Canada No effect *Nebraska, South Dakota, North Dakota, Kansas, Missouri, Iowa, Minnesota, Wisconsin, Illinois, Indiana, Michigan, and Ohio. **The 50 observations are DOT expenditures for all 50 states, and do not account for the amount of new highway construction ordered, which is an important determinant of project costs. ***The analysis did not analyze actual projects, but rather conducted hypothetical "wage differentials" for 25 arbitrary projects. Wage differential studies are flawed compared to regression analyses (Duncan & Ormiston, 2018).
Source(s): Individual studies listed in table.
Responsible bidder ordinances (RBOs), sometimes referred to as responsible contractor policies, are policy tools that establish objective criteria and verifiable standards for contractors bidding on public construction projects. RBOs typically require proof of participation in apprenticeship training programs, proof of certificates of insurance, prequalification surveys, and compliance with all local, state, and federal laws. As a result, RBOs are qualifications-based standards that work within the low-bid system to provide quality by ensuring the use of professional, competent contractors. RBOs ensure that reputable contractors with proven track records complete jobs, thereby minimizing the need for additional re-construction later on. Contractors with workplace law violations are more than five times as likely to have a low performance rating as contractors with a clean record of workplace law compliance (Adler, 2003). By weeding out cut-rate contractors, RBOs encourage successful project delivery. In fact, case studies from across the country have found that RBOs promote higher quality and more reliable services, increased competition, and reduced back-end reconstruction and litigation costs (Sonn & Gebreselassie, 2010) Additionally, evidence suggests that 98 percent of construction owners using qualifications-based procurement models—like those in RBOs—report being satisfied with project quality (Kashiwagi et al., 2005).
Building a Strong Minnesota: An Analysis of Minnesota’s Union Construction Industry
20
The most recent research on RBOs reviewed more than 1,200 public projects in Illinois and Indiana. The analysis found that RBOs encourage 8 percent more bid competition on taxpayer-funded projects and increase the market share of union contractors by 12 percent—suggesting that nonunion contractors are less likely to contribute to apprenticeship training programs and less likely to comply with state, local, and federal laws. Despite increasing the chances that union contractors are awarded public projects, RBOs had no statistical impact on total construction costs. Notably, when focusing on the nonunion segment of the construction industry, RBO-covered projects awarded to nonunion contractors were no more costly than nonunion projects that were not covered by RBOs (Manzo, 2020). Another peer-reviewed, academic study investigated the bid costs of over 300 elementary schools in Ohio from 1997 to 2008 and found that responsible contracting policies have “no discernible statistical impact on construction bid costs” after controlling for geographic location. The study concluded that adopting RBOs “may be an effective way to improve employment conditions and living standards of construction workers without significantly raising costs for taxpayers” (Waddoups & May, 2014). Similarly, in April 2013, Kansas Governor Sam Brownback signed a bill into law that prohibited cities and counties from requiring contractors to pay locally prevailing wages “or offer an employee benefit other than those required by state or federal law,” which included apprenticeship training contributions (HB 2069, 2013). This state pre-emption law invalidated local construction policies in Sedgwick County and Wyandotte County. A 2016 report investigated 1,325 bids on school construction and non-residential projects in those counties between 2005 and 2016. While the author concluded that there was no statistical difference in the total cost of non-residential construction projects as a result of the repeal of the local construction policies, the data did reveal that school construction costs were $67 cheaper per square foot during the years when the policies were in place (Kelsay, 2016).
THE IMPACT OF THE UNION CONSTRUCTION INDUSTRY ON SCHOOL CONSTRUCTION COSTS
Data from school construction projects in Minnesota are analyzed to determine whether projects completed by union contractors are more costly than projects completed by nonunion contractors. The school construction cost data was obtained from applicable school board meeting minutes, construction manager bid tabulations, and from Dodge Data and Analytics, an organization that collects and distributes construction project information to industry stakeholders (Dodge, 2021). Specifically, the full dataset includes 668 subcontractor low bids submitted to construction managers for specific project tasks such as HVAC and concrete work between 2015 and 2017. School construction projects are a key focus among economic researchers because the projects are more homogenous than other types of public works projects, which makes it easier to isolate the cost impact of certain factors. This study takes advantage of the fact that some school projects were awarded to union contractors and others were awarded to nonunion contractors. Of the 668 low bids, union contractors were awarded 477 projects (71 percent) and nonunion contractors were awarded 191 projects (29 percent). Summary statistics for the 668 package bids are reported in Figure 22. Minnesota’s school districts are allowed, but not required, to apply state prevailing wage and benefits rates to projects that do not involve state funding. The data show that 50 percent of the projects awarded to union contractors included prevailing wage standards, compared with just 37 percent of projects awarded to nonunion contractors. The data also show that union contractors were significantly more likely to be local businesses. Among union contractors in the dataset, 97 percent were based in-state and 3 percent were from other states. By contrast, 13 percent

Building a Strong Minnesota: An Analysis of Minnesota’s Union Construction Industry
21
of nonunion contractors awarded projects came from out-of-state, a 10 percent difference. Projects that were awarded to union contractors received an average of 2.4 bids and projects that were awarded to nonunion contractors received an average of 2.3 bids.
Figure 22: Subcontractor Low Bids on School Construction Projects in Minnesota, 2015-2017
School Construction Metric
Union Contractor
Nonunion Contractor
Significant Difference?
Total Number of Projects 477 191
Prevailing Wage Project 50.1% 36.6% ***
Out-of-State Contractor 2.9% 13.1% ***
Average Number of Bidders 2.43 2.31
Average Low Package Bid $579,910 $304,972 ***
Average Total Cost $14.6 million $14.1 million
Type of Work: Casework 1.3% 7.3% ***
Type of Work: Ceiling 5.2% 0.0% ***
Type of Work: Concrete 7.5% 8.4%
Type of Work: Earthwork 5.0% 0.0% ***
Type of Work: Doors 1.9% 12.0% ***
Type of Work: Flooring 7.8% 9.4%
Type of Work: HVAC 8.4% 0.5% ***
Type of Work: Roof 6.1% 4.7%
Source(s): School District Board Meeting minutes and Dodge Data and Analytics (Dodge, 2021; Manzo & Duncan, 2018).**Indicates the mean for projects awarded to union contractors is significantly different at p<|0.05| compared to the mean for projects awarded to nonunion contractors.
The data indicates that average package bids and total costs for projects that were awarded to union contractors were higher than comparable cost data for projects that were awarded to nonunion contractors (Figure 22). Package bids on union projects averaged about $580,000 per project compared with an average of about $305,000 for nonunion projects. However, the data shows that union contractors worked on larger projects, with a total project value of $14.6 million compared with their nonunion counterparts ($14.1 million). Union contractors were also likely to perform complex work that required additional skills. For example, 8 percent of all projects awarded to union contractors were for heating, ventilation, and air conditioning (HVAC) systems compared with less than 1 percent of all projects awarded to nonunion projects. The average cost of an HVAC project in the dataset was $1.3 million. By contrast, 12 percent of nonunion projects involved replacing and installing doors compared with just 2 percent of union project. This type of work cost an average of $121,000. Simply put, union contractors appear to have a higher average cost per project, but that is only because they tended to work on larger, more complex projects than nonunion contractors. An advanced but common statistical technique called a “regression” is used to understand the unique and independent effect of union contractors on the average cost of a school construction project in the seven-county Minneapolis-St. Paul metropolitan area (Figure 23). The seven-county region includes Anoka, Hennepin, Ramsey, Washington, Carver, Scott, and Dakota Counties and accounted for 640 projects (96 percent) in the dataset. After accounting for the size and complexity of the overall project, the 24 different types of work conducted, whether the project was awarded to an out-of-area contractor, and whether the project involved new school construction, there was no statistically significant cost difference between union contractors and nonunion contractors. It is worth noting that prevailing wage standards also had no statistically significant effect on school construction costs.

Building a Strong Minnesota: An Analysis of Minnesota’s Union Construction Industry
22
Figure 23: Regression Results for Package Bids on School Projects in the Twin Cities Region, 2015-2017
Impact on the Natural Log of the Winning Package Bid
Ordinary Least Squares (OLS) Regression
Average Cost (Standard Error)
Union Contractor +0.059*** (0.09) Prevailing Wage Project +0.026*** (0.08) Natural Log of Project Cost +0.702*** (0.05) Out-of-Area Contractor -0.350*** (0.09) New School +0.170*** (0.11) Work Type (Carpentry)ⱡ +0.712*** (0.19) 2016 +0.083*** (0.12) 2017 +0.068*** (0.13) Constant +1.015*** (0.82)
Sample Size (N=) 640
R2 0.62 Source(s): School District Board Meeting minutes and Dodge Data and Analytics (Dodge, 2021; Manzo & Duncan, 2018). ***p<|0.01|; **p<|0.05|; *p<|0.10| (two-tailed tests). ⱡThis is based on a model that includes controls for 24 work types. There may be segmentation in the type of work performed by union and nonunion contractors.
The bids of winning contractors who were signatories to collective bargaining agreements were not more expensive than the bids of nonunion contractors, after taking the type of work into consideration. These findings corroborate previous research on school construction costs. In two studies conducted in 2013, Professor Alan Atalah examined 8,093 bids on 1,496 school projects in Ohio and found no statistically significant difference between the bid costs per square foot for union contractors and the bid costs per square foot for nonunion contractors—with the exception of the southern region of the state, where bids from union contractors were significantly cheaper than those from nonunion contractors (Atalah, 2013a). When analyzing bids submitted by different trades on these school construction projects, the average bid cost per square foot for union contractors was not higher than for nonunion contractors in 15 of the 18 trades (83 percent) (Atalah, 2013b). Two additional studies also find no statistically significant union cost effect after controlling for the type of work (Kim et al., 2012; Duncan & Waddoups, 2020). This is in part be due to increased productivity. Research has found that union productivity is between 17 percent and 22 percent higher than nonunion productivity, including 30 percent higher for office building construction and up to 20 percent higher in school projects (Allen, 1984; Allen, 1986). Minnesota’s union contractors are competitive in the market because they are able to offset higher labor costs with greater levels of worker productivityand other construction efficiencies.
CLEAN ENERGY INVESTMENTS AS A POTENTIAL OPPORTUNITY In 2020, the world invested over $500 billion in clean energy projects such as renewable power generation, electric vehicles, and charging stations (Bloomberg NEF, 2021). States across the United States are promoting clean energy investments to spur economic growth, combat climate change, and create jobs. As public and private energy investments in Minnesota have increasingly moved towards cleaner alternatives over the past two decades, solar power and wind power have become the primary sources of renewable energy. This transition has implications not just for environmental health and public health, but also for workers. Ensuring that the clean energy sector creates good family-supporting careers, invests in registered apprenticeship programs, and upholds local construction standards can help ensure a successful transition with broad-based economic prosperity.

Building a Strong Minnesota: An Analysis of Minnesota’s Union Construction Industry
23
In 2019, more than half of the state’s power came from zero-carbon sources and the state’s energy efficiency has increased by 22 percent since 2010. Minnesota has a significant amount of renewable resources and is one of the top 10 states with the highest capacity of wind production, which provided 18 percent of the state’s power generation in 2019 (MN Gov, 2016; BCSE, 2020). Investments in renewable energy and energy efficiency technologies may create new demand for workers in a range of occupations, including in manufacturing, construction, and installation. Research shows that every $1 billion invested in clean energy creates 7,300 jobs and $1.3 billion in economic activity compared to just 6,000 jobs and $1.2 billion in economic activity from fossil fuel power (Gigstad & Manzo, 2020). Job quality, however, is poor in the clean energy sector relative to the fossil fuel sector. Workers in the fossil fuel electric power generation industry earn 22 percent more than workers in the wind and solar industries of Minnesota, North Dakota, and South Dakota (Gigstad & Manzo, 2020). While these estimates from the U.S. Census Bureau include both blue-collar workers and white-collar employees (e.g., engineers), the pay penalty for clean energy workers can be linked to a lack of unionization. Years of collective bargaining in the traditional energy sector have produced worksites where hourly wages, health insurance coverage, retirement plans, and training contributions are better for workers. By contrast, the comparatively newer clean energy sector—and particularly subsegments like residential solar—are largely made up of smaller firms with little to no history of union representation (Jones et al., 2016). To attract, develop, and retain skilled workers, clean energy employers must compete with fossil fuel-based companies that tend to offer better pay and job security. One way to compete for skilled workers is to expand unionization in the clean energy sector. Clean energy projects in Minnesota are built without prevailing wages and other construction standards that are attached to public infrastructure projects. As with other types of infrastructure, labor accounts for a small share of total costs on clean energy projects—just 11 percent (Jones, 2020). For solar energy systems in particular, labor accounts for an even smaller share of total costs. According to the National Renewable Energy Laboratory (NREL) at the U.S. Department of Energy, labor costs on the average-sized 6.2-kilowatt residential solar system are 27 cents per watt DC, which represents just 10 percent of the total installation cost of $2.70 per watt DC. This means that typical residential project costs $16,740, but the labor to install the system amounts to just $1,674 on average. On a typical commercial solar system, labor installation costs accounts for 21 cents, which is 7 percent of the total cost benchmark ($1.75 per watt DC). Commercial systems include schools, office buildings, malls, retail stores, and government projects. On a utility-scale system that generates solar power that is fed into an electrical grid, labor installation costs average just 10 cents, which equates to 9 percent of the total cost ($1.25 per watt DC) (Fu et al., 2018). Utility-scale projects are large, span multiple acres of land, and are usually mounted in the ground. With labor installation costs averaging between 7 and 11 percent of total costs, attaching prevailing wage and other labor standards to clean energy projects would have a minimal impact on total construction and installation costs while improving labor productivity, strengthening Minnesota’s apprenticeship program, ensuring safer jobsites, and supporting work for local contractors (Jones, 2020). Minnesota has the opportunity to create middle-class jobs, lower consumer energy prices, and create a cleaner environment by investing in the clean energy sector. All construction projects receiving either state tax dollars or ratepayer-funded subsidies created by the State of Minnesota could reflect local compensation rates, quality standards, and economic development priorities by attaching prevailing wage and other labor standards.

Building a Strong Minnesota: An Analysis of Minnesota’s Union Construction Industry
24
CONCLUSION
Minnesota’s union construction industry promotes ladders of access into the middle class, funds the largest privately financed system of higher education in the state, and boosts economic activity in Minnesota. By raising construction workers wages, reducing economic inequality, and expanding health insurance coverage, the union construction industry boosts the economy by $2.7 billion per year and has a positive fiscal impact on public budgets across the state. Across Minnesota, the union construction industry reduces reliance on government assistance programs and increases income tax contributions among skilled construction workers. At the same time, real-world data from school construction projects in the Minneapolis-St. Paul metropolitan area reveal that union contractors are no more costly than nonunion contractors. This is because the union construction industry trains its workforce in joint labor-management apprenticeship programs that rival Minnesota’s public universities. As a result, union construction workers are more productive and union worksites are safer, with significantly fewer on-the-job fatalities. In an era when the state seeks to create family-sustaining jobs that can deliver top value for taxpayers, Minnesota’s more unionized construction industry offers a viable roadmap that can be applied to its burgeoning clean energy industry and to other sectors to promote a robust middle class and a strong economy.

Building a Strong Minnesota: An Analysis of Minnesota’s Union Construction Industry
25
SOURCES
Adler, Moshe. (2003). Prequalification of Contractors: The Importance of Responsible Contracting on Public Works Projects. Fiscal Policy Institute.
Allen, Steven. (1986). Unionization and Productivity in Office Building and Elementary and Secondary Schools. NBER Working Paper.
Allen, Steven. (1984). “Unionized Construction Workers are More Productive,” The Quarterly Journal of Economics, 99(2): 251-274.
Arnon, Alexander; Zheli He; and Jon Huntley. (2020). “Short-Run Economic Effects of the CARES Act.” Penn Wharton Budget Model (PWBM). University of Pennsylvania.
Associated General Contractors of Minnesota (AGCMN) (2021). “Member Login.”
Atalah, Alan. (2013) (a). “Comparison of Union and Nonunion Bids on Ohio School Facilities Commission Construction Projects,” International Journal of Economics and Management Engineering, 3(1): 29-35.
Atalah, Alan. (2013) (b). “Impact of Prevailing Wages on the Cost among the Various Construction Trades,” Journal of Civil Engineering and Architecture, 7(4): 670-676.
Azari-Rad, Hamid; Peter Philips; and Mark Prus. (2003). “State Prevailing Wage Laws and School Construction Costs,” Industrial Relations, 42(3): 445-457.
Azari-Rad, Hamid; Peter Philips; and Mark Prus. (2002). “Making Hay When It Rains: The Effect Prevailing Wage Regulations, Scale Economies, Seasonal, Cyclical and Local Business Patterns Have On School Construction Costs," Journal of Education Finance, 27: 997-1012.
Balistreri, Edward; Christine McDaniel; and Eina Vivian Wong. (2003). “An Estimation of U.S. Industry-Level Capital-Labor Substitution Elasticities: Support for Cobb-Douglas,” The North American Journal of Economics and Finance, 14: 343-356.
Belman, Dale and Peter Philips. (2005). Prevailing Wage Laws, Unions and Minority Employment in Construction, A Historical and Empirical Analysis.
Bertschy, Kathrin; M. Alejandra Cattaneo; and Stefan Wolter. (2009). “PISA and the Transition into the Labour Market.” LABOUR, 23(s1): 111-137.
Bilginsoy, Cihan. (2017). The Performance of ABC-Sponsored Registered Apprenticeship Programs in Michigan: 2000-2016. University of Utah.
Bilginsoy, Cihan. (2005). Wage Regulation and Training: The Impact of State Prevailing Wage Laws on Apprenticeship.
Bilginsoy, Cihan and Peter Philips. (2000). “Prevailing Wage Regulations and School Construction Costs: Evidence from British Columbia,” Journal of Education Finance, 24: 415-432.
Bivens, Josh; Lora Engdahl; Elise Gould; Teresa Kroeger; Celine McNicholas; Lawrence Mishel; Zane Mokhiber; Heidi Shierholz; Marni von Wilpert; Valerie Wilson; and Ben Zipperer. (2017). How Today’s Unions Help Working People: Giving Workers the Power to Improve Their Jobs and Unrig the Economy. Economic Policy Institute.
Blankenau, William and Steven Cassou. (2011). “Industry Differences in the Elasticity of Substitution and Rate of Biased Technological Change between Skilled and Unskilled Labor,” Applied Economics, 43: 3129-3142.
Bloomberg NEF. (2021). “Energy Transition Investment Hit $500 Billion in 2020 – For First Time.” Bloomberg.

Building a Strong Minnesota: An Analysis of Minnesota’s Union Construction Industry
26
Bruno, Robert; Emily E. LB. Twarog; and Brandon Grant. (2016). Advancing Construction Industry Diversity: A Pilot Study of the East Central Area Building Trades Council. University of Illinois at Urbana-Champaign.
Business Council for Sustainable Energy (BCSE). (2020). 2020 Minnesota Energy Factsheet.
Bureau of Economic Analysis (BEA). (2021). “Regional Data: GDP & Personal Income.” U.S. Department of Commerce.
Bureau of Labor Statistics. (2021) (a). “Occupational Employment Statistics: OES Data.” U.S. Department of Labor.
Bureau of Labor Statistics. (2021) (b). “Databases, Tables & Calculators by Subject: Employment.” U.S. Department of Labor.
Bureau of Labor Statistics. (2021) (c). “Databases, Tables & Calculators by Subject: Workplace Injuries.” U.S. Department of Labor.
Bureau of Labor Statistics. (2019). National Compensation Survey: Employee Benefits in the United States, March 2019. U.S. Department of Labor.
Center for Economic and Policy Research (CEPR). (2020). 2015-2019 CPS ORG Uniform Extracts, Version 2.5.
Census. (2021). 2017 Economic Census of Construction. U.S. Census Bureau.
Census. (2020). “2018 State & Local Government Finance Historical Datasets and Tables.” U.S. Census Bureau.
Census. (2012). “Economic Census – Tables: 2012.” U.S. Census Bureau.
Clark, Damon and Rene Fahr. (2002). The Promise of Workplace Training for Non-College-Bound Youth: Theory and Evidence from German Apprenticeship. Institute for the Study of Labor (IZA); University of Bonn.
Cohen, Patricia and Tiffany Hsu. (2020). “Pandemic Could Scar a Generation of Working Mothers.” The New York Times.
Destinations Career Academy of Wisconsin (DCAWI). (2021). “Welcome to Our School!”
Destinations Career Academy of Minnesota Virtual Academy (DCMNVA). (2021). “Welcome to Minnesota Virtual Academy!”
Dickson Quesada, Alison, Frank Manzo IV, Dale Belman, and Robert Bruno. (2013). A Weakened State: The Economic and Social Impacts of Repeal of the Prevailing Wage Law in Illinois. University of Illinois at Urbana-Champaign; Illinois Economic Policy Institute; Michigan State University.
Dun & Bradstreet (DNB). (2021). Dun & Bradstreet, Inc.
Duncan, Kevin. (2015) (a). “The Effect of Federal Davis-Bacon and Disadvantaged Business Enterprise Regulations on Highway Maintenance Costs,” Industrial and Labor Relations Review, 68(1): 212-237.
Duncan, Kevin. (2015) (b). “Do Federal Davis-Bacon and Disadvantaged Business Enterprise Regulations Affect Aggressive Bidding? Evidence from Highway Procurement Auctions," Journal of Public Procurement, 15(3): 291-316.
Duncan, Kevin. (2011). Economic, Fiscal and Social Impacts of Prevailing Wage in San Jose, California. Working Partnerships USA; Colorado State University-Pueblo.
Duncan, Kevin and Alex Lantsberg. (2015). How Weakening Wisconsin’s Prevailing Wage Policy Would Affect Public Construction Costs and Economic Activity. Colorado State University-Pueblo; Smart Cities Prevail.
Duncan, Kevin and Frank Manzo IV. (2016). The Economic, Fiscal, and Social Effects of Kentucky’s Prevailing Wage Law. Colorado State University-Pueblo; Midwest Economic Policy Institute.
Building a Strong Minnesota: An Analysis of Minnesota’s Union Construction Industry
27
Duncan, Kevin and Russell Ormiston. (2018). “What Does the Research Tell Us About Prevailing Wage Laws?” Labor Studies Journal, 44(2): 139-160.
Duncan, Kevin: Peter Philips; and Frank Manzo IV. (2017). Building America with Prevailing Wage: The Davis-Bacon Act Delivers Good Middle-Class Jobs, a Stronger Economy, and the Best Value for U.S. Taxpayers. Colorado State University-Pueblo; University of Utah; Illinois Economic Policy Institute.
Duncan, Kevin; Peter Philips; and Mark Prus. (2014). “Prevailing Wage Regulations and School Construction Costs: Cumulative Evidence from British Columbia,” Industrial Relations, 53(4): 593-616.
Duncan, Kevin; Peter Philips; and Mark Prus. (2012). “Using Stochastic Frontier Regression to Estimate the Construction Cost Efficiency of Prevailing Wage Laws,” Engineering, Construction and Architectural Management, 19(3): 320-334.
Duncan, Kevin; Peter Philips; and Mark Prus. (2009). “The Effects of Prevailing Wage Regulations on Construction Efficiency in British Columbia,” International Journal of Construction Education and Research, 5(2): 63-78.
Duncan, Kevin; Peter Philips; and Mark Prus. (2006). “Prevailing Wage Legislation and Public School Construction Efficiency: A Stochastic Frontier Approach,” Construction Management and Economics, 6: 625-634.
Duncan, Kevin and Jeffrey Waddoups. (2020). “Unintended Consequences of Nevada’s Ninety-Percent Prevailing Wage Rule,” Labor Studies Journal, 45(2): 1-20.
Farber, Henry; Daniel Herbst; Ilyana Kuziemko; and Suresh Naidu. (2018). Unions and Inequality Over the Twentieth Century: New Evidence from Survey Data. Princeton University; Columbia University.
Flood, Sarah; Miriam King; Renae Rodgers; Steven Ruggles; and J. Robert Warren. (2021). Integrated Public Use Microdata Series, Current Population Survey: Version 8.0 [dataset]. Minneapolis, MN.
Fu, Ran; David Feldman; and Robert Margolis. (2018). U.S. Solar Photovoltaic System Cost Benchmark: Q1 2018. National Renewable Energy Laboratory at the U.S. Department of Energy.
Gigstad, Jill and Frank Manzo IV. (2020). Building Good Jobs in the Great Plains Through Clean Energy Investments: Impacts in Minnesota, North Dakota, and South Dakota. Midwest Economic Policy Institute; Illinois Economic Policy Institute.
Herbert, Christopher; Daniel McCue; and Rocio Sanchez-Moyano. (2013). Is Homeownership Still and Effective Means of Building Wealth for Low-income and Minority Households? (Was it Ever?). Harvard University.
House Bill No. 2069. (2013). Legislature of the State of Kansas.
IMPLAN Group LLC. (2020). IMPLAN System (data and software).
Jones, Betony. (2020). “Prevailing Wage in Solar Can Deliver Good Jobs While Keeping Growth On Track.” University of California, Berkeley.
Jones, Betony; Peter Philips; and Carol Zabin. (2016). The Link Between Good Jobs and a Low Carbon Future: Evidence from California’s Renewables Portfolio Standard, 2002-2015. University of California, Berkeley.
Kaboub, Fadhel, and Kelsay, Michael. (2014). “Do Prevailing Wage Laws Increase Total Construction Costs?” Review of Keynesian Economics, 2(2): 189-206.
Kashiwagi, Dean; John Savicky; Kenneth Sullivan; Jacob Kovel; David Greenwood; and Charles Egbu. (2005). Is Performance-Based Procurement a Solution to Construction Performance? Arizona State University; Central Connecticut State University; Northumbria University; Glasgow Caledonian University.
Keller, Edward and William Hartman (2001). “Prevailing Wage Rates: The Effects on School Construction Costs, Levels of Taxation, and State Reimbursements,” Journal of Education Finance, 27(2): 713-728.

Building a Strong Minnesota: An Analysis of Minnesota’s Union Construction Industry
28
Kelsay, Michael. (2016). An Economic Analysis of the Impact of Kansas Repeal of Prevailing Wage Statutes in Sedgwick County, Kansas and Wyandotte County, Kansas. University of Missouri – Kansas City.
Kelsay, Michael and Frank Manzo IV. (2019). The Impact of Repealing West Virginia’s Prevailing Wage Law: Economic Effects on the Construction Industry and Fiscal Effects on School Construction Costs. University of Missouri – Kansas City; Midwest Economic Policy Institute.
Kim, Jaewhan; Chang Kuo-Liang; and Peter Philips. (2012). “The Effect of Prevailing Wage Regulations on Contractor Bid Participation and Behavior: A Comparison of Palo Alto, California with Four Nearby Prevailing Wage Municipalities,” Industrial Relations, 51(4): 874-891.
Laing, James; Jill Janocha Redmond; Michael Fiore; and Letitia Davis. (2019). Collecting Union Status for the Census of Fatal Occupational Injuries: A Massachusetts Case Study. Bureau of Labor Statistics (BLS) from the U.S. Department of Labor.
Li, Zhi; Chimedlkham Zorigtbaatar; Grbiel Pleités; Ari Fenn; and Peter Philips. (2019). “The Effect of Prevailing Wage Law Repeals and Enactments on Injuries and Disabilities in the Construction Industry,” Public Works Management & Policy, 24(4): 1-17.
Long, George. (2013). Differences Between Union and Nonunion Compensation, 2001–2011. U.S. Bureau of Labor Statistics (BLS).
Manzo IV, Frank. (2020). The Impact of Responsible Bidder Ordinances on Bid Competition and Public Construction Costs: Evidence from Illinois and Indiana, 2018-2019. Illinois Economic Policy Institute.
Manzo IV, Frank and Robert Bruno. (2021). Promoting Good Jobs and a Stronger Economy: How Free Collective-Bargaining States Outperform “Right-to-Work” States. Illinois Economic Policy Institute; University of Illinois at Urbana-Champaign.
Manzo IV, Frank and Robert Bruno. (2020). The Apprenticeship Alternative: Enrollment, Completion Rates, and Earnings in Registered Apprenticeship Programs in Illinois. Illinois Economic Policy Institute; University of Illinois at Urbana-Champaign.
Manzo IV, Frank and Kevin Duncan. (2018). An Examination of Minnesota’s Prevailing Wage Law: Effects on Costs, Training, and Economic Development. Midwest Economic Policy Institute; Colorado State University-Pueblo.
Manzo IV, Frank; Kevin Duncan; Jill Gigstad; and Nathaniel Goodell. (2020) (a). The Effects of Repealing Prevailing Wage in Wisconsin: Impacts on Ten Construction Market Outcomes. Midwest Economic Policy Institute; Colorado State University-Pueblo.
Manzo IV, Frank; Jill Gigstad; and Robert Bruno. (2020) (b). Prevailing Wage and the American Dream: Impacts on Homeownership, Housing Wealth, and Property Tax Revenues. Illinois Economic Policy Institute; University of Illinois at Urbana-Champaign.
Manzo IV, Frank, Alex Lantsberg, Kevin Duncan. (2016) (b). The Economic, Fiscal, and Social Impacts of State Prevailing Wage Laws: Choosing Between the High Road and the Low Road in the Construction Industry. Illinois Economic Policy Institute; Smart Cities Prevail; Colorado State University-Pueblo.
Manzo, Jill. (2016) (a). Construction Careers Versus Construction Jobs: A Case Study of Two Construction Sectors in the Twin Cities Region Analysis. Midwest Economic Policy Institute.
Manzo, Jill; Frank Manzo IV; and Robert Bruno. (2016) (a). The Impact of Construction Union Dues in Minnesota: An Organizational and Individual-Level Analysis. Midwest Economic Policy Institute; University of Illinois at Urbana-Champaign.

Building a Strong Minnesota: An Analysis of Minnesota’s Union Construction Industry
29
Manzo, Jill; Frank Manzo IV; and Robert Bruno. (2019). The Impact of Construction Apprenticeship Programs in Minnesota: A Return-on-Investment Analysis. Midwest Economic Policy Institute; University of Illinois at Urbana-Champaign.
Manzo, Jill; Frank Manzo IV; and Robert Bruno. (2018) (a). The State of the Unions 2018: A Profile of Unionization in Minnesota and in the United States. Midwest Economic Policy Institute; University of Minnesota; University of Illinois at Urbana-Champaign.
Manzo, Jill; Frank Manzo IV; and Robert Bruno. (2018) (b). State Prevailing Wage Laws Reduce Racial Income Gaps in Construction: Impacts by Trade, 2013-2015. Illinois Economic Policy Institute; University of Illinois at Urbana-Champaign.
McNichol, Elizabeth. (2019). “It’s Time for States to Invest in Infrastructure.” Center on Budget and Policy Priorities.
Minnesota Department of Labor and Industry (DLI). (2021). “Prevailing Wage: Definitions of Construction Types.” State of Minnesota.
Minnesota Department of Labor and Industry (DLI). (2017). A Guide to Minnesota’s Prevailing Wage Laws. State of Minnesota.
Minnesota Government (Gov). (2016). AWEA 2016 Report: Minnesota Is 6th in Nation for Total Wind Power Generated. State of Minnesota.
Minnesota Office of Higher Education (OHE). (2017). “Student Enrollment Data.” State of Minnesota.
Mishel, Lawrence and Matthew Walters. (2003). How Unions Help All Workers. Economic Policy Institute.
Nunn, Ryan; Jimmy O’Donnell; and Jay Shambaugh. (2019). The Shift in Private Sector Union Participation: Explanation and Effects. The Brookings Institution; The George Washington University.
Obernauer, Charlene. (2020). Deadly Skyline: An Annual Report on Construction Fatalities in New York State. New York Committee for Occupational Safety and Health (NYCOSH).
Occupational Safety and Health Administration (OSHA). (2021). “Industry SIC Results: NAICS 230000 – 239999 from 01/01/2019 to 12/31/2019 in Minnesota.” U.S. Department of Labor.
Office of Labor-Management Standards (OLMS). (2021). “Union Search.” U.S. Department of Labor.
Olinsky, Ben and Sarah Ayres. (2013). Training for Success: A Policy to Expand Apprenticeships in the United States. Center for American Progress.
Onsarigo, Lameck; Alan Atalah; Frank Manzo IV; and Kevin Duncan. (2017). The Economic, Fiscal, and Social Effects of Ohio’s Prevailing Wage Law. Kent State University; Bowling Green State University; Illinois Economic Policy Institute; Colorado State University-Pueblo.
Onsarigo, Lameck; Kevin Duncan; and Alan Atalah. (2020). “The Effect of Prevailing Wages on Building Costs, Bid Competition, and Bidder Behavior: Evidence from Ohio School Construction,” Construction Management and Economics, 38(10): 1-17.
Philips, Peter. (2015) (a). Indiana’s Common Construction Wage Law: An Economic Impact Analysis. University of Utah.
Philips, Peter. (2015) (b). Wisconsin’s Prevailing-Wage Law: An Economic Impact Analysis. University of Utah.
Philips, Peter. (2014). Kentucky’s Prevailing Wage Law: An Economic Impact Analysis. University of Utah.
Philips, Peter and David Blatter. (2017). Two Roads Diverge: Hidden Costs of the Low Wage Approach to Construction. University of Utah.

Building a Strong Minnesota: An Analysis of Minnesota’s Union Construction Industry
30
Philips, Peter, Garth Mangum, Norm Waitzman, Anne Yeagle. (1995). Losing Ground: Lessons from the Repeal of Nine "Little Davis-Bacon" Acts. University of Utah.
Reeves, Richard and Christopher Pulliam. (2020). “Middle Class Marriage Is Declining, and Likely Deepening Inequality.” The Brookings Institution.
Reed, Debbie; Albert Yung-Hsu Liu; Rebecca Kleinman; Annalisa Mastri; Davin Reed; Samina Sattar; and Jessica Ziegler. (2012). An Effectiveness Assessment and Cost-Benefit Analysis of Registered Apprenticeship in 10 States. Mathematica Policy Research. Submitted to the U.S. Department of Labor Employment and Training Administration (DOLETA).
Ryan, Paul. (2001). “The School-to-Work Transition: A Cross-National Perspective.” Journal of Economic Literature, 39(1): 34-92.
Ryan, Paul. (1998). “Is Apprenticeship Better? A Review of the Economic Evidence.” Journal of Vocational Education & Training, 50(2): 289-329.
Samek Lodovici, Manuela; Simona Comi; Federica Origo; Monica Patrizio; Nicoletta Torchio; Stefan Speckesser; and Jose Vila-Belda Montalt. (2013). The Effectiveness and Costs-Benefits of Apprenticeships: Results of the Quantitative Analysis. European Commission.
Schmitt, John. (2008). The Union Wage Advantage for Low-Wage Workers. Center for Economic and Policy Research.
Scuetz, Jenny. (2019). “Renting the American Dream: Why Homeownership Shouldn’t Be a Prerequisite for Middle-Class Financial Security.” The Brookings Institution.
SmartAsset. (2021). “Minnesota Income Tax Calculator.”
Sojourner, Aaron and Jose Pacas. (2018). The Relationship between Union Membership and Net Fiscal Impact. University of Minnesota; Institute of Labor Economics.
Sonn, Paul K and Tsedeye Gebreselassie. (2010). “The Road to Responsible Contracting: Lessons from States and Cities for Ensuring That Federal Contracting Delivers Good Jobs and Quality Services,” Berkeley Journal of Employment & Labor Law. 31(2): 460-488.
Stepick, Lina and Frank Manzo IV. (2021). The Impact of Oregon’s Prevailing Wage Rate Law: Effects on Costs, Training, and Economic Development. University of Oregon; Illinois Economic Policy Institute.
Vincent, Jeffrey and Paavo Monkkonen. (2010). “The Impact of State Regulations on the Costs of Public School Construction,” Journal of Education Finance, 35(4): 313-330.
Vitaliano, Donald. (2002). “An Econometric Assessment of the Economic Efficiency of State Departments of Transportation,” International Journal of Transportation Economics, 29(2): 167-180.
Waddoups, Jeffrey C. and David C. May. (2014). “Do Responsible Contractor Policies Increase Construction Bid Costs?” Industrial Relations, 53(2): 273-294.
Wage and Hour Division (WHD). (2021). “Dollar Threshold Amount for Contract Coverage.” U.S. Department of Labor.
Zandi, Mark. (2010). Testimony of Mark Zandi Before the House Budget Committee: “Perspectives on the Economy.” Moody’s Analytics.

Building a Strong Minnesota: An Analysis of Minnesota’s Union Construction Industry
31
COVER PHOTO CREDITS
F Armstrong Photography. (Accessed 2021). “Traffic cones on road with electronic arrow pointing to the right to divert traffic and white car in distance.” Stock photo from Shutterstock, Inc. subscription.
Monkey Business Images. (Accessed 2021). “Teacher Helping Students Training to Be Builders.” Stock photo from Shutterstock, Inc. subscription.
Stockr. (Accessed 2021). “Close view on the workers and the asphalting machines.” Stock photo from Shutterstock, Inc. subscription.
Tranmautritam. (Accessed 2021). “Man Working on Road.” Free photo from Canva.com.