building a world class treasury - worldtek travel · world financial symposium 2014 world financial...
TRANSCRIPT

World Financial Symposium 2014 World Financial Symposium 2014
Building a World
Class Treasury

World Financial Symposium 2014 World Financial Symposium 2014
Chair Opening
Vijay Panday
Director, Group Treasury and Risk
KLM

World Financial Symposium 2014 World Financial Symposium 2014
Treasury Priorities
2015 and Beyond
David Aldred Managing Director, Regional Head of Sales, Middle East, North
Africa, Turkey and Pakistan, Treasury and Trade Solutions
Citi

Treasury Priorities 2015 and Beyond
September 2014
Treasury and Trade Solutions
1st IATA World Financial Symposium, Abu Dhabi

We are Living in Challenging Times
Globalization Digitization Urbanization Regulation Rates Reputation
The world is changing
The operating environment is changing
Our clients’ needs and expectations are changing
5
All are relevant for aviation
Route & Fleet
Expansion. Impact
on Supply Chains
Mobile Internet &
Technology Impact
Growth of EM.
Africa MENA, Asia Carbon, Airport,
Congestion,
Passenger Rights
Source : IATA & Porter’s 5 Forces
EM Expansion, Fuel
and Fleet Expansion
Managing FX Risk
(acquiring/real time)
Competition,
Supplier
Relationships,
Brand and
Customer Service

Primary Sources: EIU, Roland Berger, United Nations Statistics, Forrester Research, Citi Analysis.
Globalization
Urbanization
Digitization
The Major Forces
Driving Change Past (1990) Present Future
US JPN DEU
Largest World Economies Largest World Economies Largest World Economies
43% World Population in Cities 52% World Population in Cities 60% World Population in Cities
9% World Population >60 Years Old 11% World Population >60 Years Old 17% world Population >60 Years old (2030)
Mobile Broadband Subscriptions: NONE Mobile Broadband Subscriptions: 1.4bn Mobile Broadband Subscriptions: 5bn (2017)
Internet Users: Nominal
Web Browser Introduced in 1992 Internet Users: 2.4bn
34% Global Penetration
Internet Users: 3.5bn (2017)
50% Global Penetration
0 1.4bn 5bn
17%
Exports Share of GDP
26%
Exports Share of GDP
33%
Exports Share of GDP
The Major Forces Driving Change
US CHN
JPN
CHN US IND
6

Primary Sources: IATA.
Globalization
Urbanization
Digitization
The Major Forces
Driving Change Past (1990) Present Future
Emerging Market Expansion Emerging Market Expansion Emerging Market Expansion
The Major Forces Driving Change - Aviation
7
Asia ME
Asia Asia ME
Fleet Expansion Fleet Expansion Fleet Expansion
59% Growth
35K New
Aircraft
Telephone Base Sales and
Customer Service
Internet for Ticketing and
Carrier Portals Becoming
Standard
End to End Solution for
Passengers Leveraging a
Handset
Relative High Cost of Travel and Low
Cargo Levels
Growth of Cities and a More Mobile Population
Is Leading to Increasing Air Travel Between Cities
Massive Investment In Infrastructure is Required to
Cope with the growth in Aviation
2050
16 Billion
500T
Cargo
2.5 Billion 40T Cargo <1 Billion <20T Cargo
20K Aircraft
$4.8
Trillion
Investment
<15K Aircraft

Key Treasury Trends & Themes
The following trends and themes are from Citi Treasury Diagnostics (CTD), a benchmarking tool designed to
help companies assess treasury and working capital management practices, and identify opportunities for
treasury departments to deliver more value to their firms.
Results from CTD provide a clear indication as to what is most important to treasury practitioners across the
globe as well as insights into both emerging and existing themes within the treasury management space.
Need for Speed:
Real-time Treasury
Management
Embedding Treasury:
Growth in Importance and
Scope
Continued Centralization:
Efficiency and Control
Performance Management:
Increasing Accountability
Risk Management:
Still in the Spotlight
Key Trends
8

5%
8%
11%
16%
16%
38%
4%
8%
11%
13%
18%
43%
Working Capital Management
Liquidity and Investments
Policy and Governance
Risk Management
Systems and Technology
Subsidiary Funding
Universe Industrials
Liquidity Funding
Risk & Capital Planning
Counterparty Risk
Organisational Structure
Receivable Processing
Payables Processing
Treasury Strategy
Funding. Upstreaming
Downstreaming process
Dividend and New Legal
Entity Process
ERP & TMS
Benchmarking Results
On average, best practice results were more readily achieved in areas where treasury plays a bigger role in
setting policy…
Achievement of Best in Class Performance (Above 75th Percentile)
…In areas requiring coordinated execution from subsidiaries and investment in technology, far fewer firms
were successful at achieving best practice results.
© 2014 Citibank, N.A.
Source: Citi Treasury Diagnostics, April 2014
9
Aviation
Cash Visibility. Forecasting Outside of IATA Settlements

Need for Speed: Real-time Treasury Management
Corporate treasury is keeping pace with the rapidly increasing drive to achieve access to immediate, complete,
and actionable data.
Treasurers are increasingly leveraging “real-time” information to make faster, more informed liquidity
and risk management decisions for the business.
Increasing emphasis on
daily visibility of cash flows
and short-term investments
80% of corporates reported
daily cash visibility over 75%
of total balances
85% of corporates reported
over 75% daily visibility to
short-term investments
This is consisently an area of
improvement for aviation and
is ranked 2nd and 3rd
Quartiles consitently
Visibility
Frequency of cash forecast
updates are increasing
across companies of all
sizes,
Among large companies,
33% are updating forecasts
daily, an 19% increase
between 2009 and 2013—
the fastest growing group
and likely due to wider
adoption of more
sophisticated treasury
technology
Wide spread of results.
50:50 Q1/Q2 and Q3/Q4
Forecasting
Increase in daily
concentration of cash into
a central pool
78% of corporates reported
daily concentration
Daily concentration of cash
is a practice more commonly
used by large companies
– 83% of large companes
versus 47% of small
companies
• Wide spread of results.
50:50 Q1/Q2 and Q3/Q4
Concentration
Corporate treasury
departments are leveraging
technology to automate
processes and increase
efficiencies
77% of companies reported
full or complete automation of
pooling processes
Nearly 30% of companies
reported greater than 95%
automatic matching of
receivables to customer
invoices, up 9% between 2009
and 2013
Consistent case for
improvement
Automation
Source: Citi Treasury Diagnostics; participants data through year-end 2013
Large companies = > $25 billion; small companies = < $2 billion 1
0

Embedding Treasury: Growth in Importance and Scope
While the role of the treasurer has become more complex and challenging over the last few years, corporate
treasury continues to progress as a strategic advisor and valued partner to the wider business.
Many functions, processes,
and activities are now more
firmly under the remit of
corporate treasury, including:
– Intercompany loan
administration
– Counterparty risk
management
– Supplier payments
– Financial guarantee
management
• Aviation – supplier payments
in bottom 2 quartiles on
average. Funding up-stream
and downstream is a
consitent area in need of
improvment
Scope
Treasury policies are
correspondingly broadening
with the expansion of the
treasury function
Consistently high treasury
policy coverage with regard
to financial risk management,
including:
– FX risk (89%)
– Liquidity risk (83%)
– Counterparty/credit risk
(78%)
– Interest rate risk (76%)
• Aviation – Procedures and
control is an area most
Treasurers identify as an
area needing improvement
Policy Coverage
Today’s treasurer has more
control than ever before
Expansion of type of balances
under the purview of treasury
– 62% of companies reported
including at least 75% of
operating flows in pooling
structure
Increasing ownership over
company-wide accounts (e.g.,
operating accounts)
– 63% of companies reported
complete control over non-
treasury accounts
– 24% increase between 2009
and 2013
• Aviation – generally ranked Q2
and above but some (EM)
limited to investments only
Control
Increasing treasury involvment
in coordination and oversight of
working capital management
– 65% of companies reported
direct and/or ad-hoc
involvement
– 19% increase between 2009
and 2013
Treasury is increasingly
leveraging working capital
flows/products to drive
efficiencies
– E.g., 29% of treasurers
reported use of supplier
finance programs, up 8%
from 2009
• Aviation – Transactions mainly
Q1 but Q2 for strategic working
capital
W/C Mgmt
The role of the treasurer has expanded to meet the new responsibilities of funding and raising liquidity,
understanding and managing risks, and supporting business units as successfully as possible.
Source: Citi Treasury Diagnostics; participants data through year-end 2013
Large companies = > $25 billion; small companies = < $2 billion 1
1

Continued Centralization: Efficiency and Control
Centralization remains at the forefront of priorities for corporate treasurers, who hope to continue realizing the
benefits of improved efficiency, transparency, and controls offered through centralized treasury activities.
As companies continue to expand their markets and operations abroad, treasurers have been faced with
the challenge of developing a treasury infrastructure capable of supporting the needs of a business that
is constantly evolving.
Corporates are shifting from
regional to global account
structures
Global mobilization of cash is a
trend consistent across
companies of all sizes
– Average of 10% increase
between 2009 and 2013
– Most favored by large
companies, 40% of which
reported global mobilization,
versus 19% of small
companies
• Aviation – generally ranked Q2
and below
Pooling & Mobilization
Centralization structures such
as In-House Banks, Netting
Centers, and Shared Service
Centers (SSC) continue to be
utilized by companies of all
sizes
– 61% of total respondents,
and 81% of large companies,
have established global
and/or regional SSCs to
support business processes
– Large companies are much
more likely to have an In-
House Bank (61%), vs. 22%
of small companies
Centralization
Majority of participants now use
electronic payments to complete
high volume vendor payments
and high value treasury payments
to drive increased efficiencies
Companies leveraging a treasury
workstation (vs. spreadsheets)
are significantly more likely to
achieve daily monitoring of
investment policy compliance
monitoring (61% vs. 22%)
Aviation – Consistently cite
improvements in the payables
process
Electronification
Source: Citi Treasury Diagnostics; participants data through year-end 2013
Large companies = > $25 billion; small companies = < $2 billion 1
2

Performance Management: Increasing Accountability
There is an appetite for stronger standards and increased oversight within corporate treasury, with a particular
emphasis on both internal and external performance management .
Substantial increase in
measurement of treasury
performance against quantifiable
KPIs as a proxy for accountability
– 66% increase between 2009
(10%) and 2013 (76%)
• Aviation – generally ranked Q2
and below
Treasury Performance
Measurement
Greater emphasis on formalizing
and documenting treasury
objectives and plans
– 74% increase bewteen 2009
(18%) and 2013 (92%)
• Aviation – Treasuries are typically
seeking to increase policy and
governance globally across their
finance and treasury functions.
Increasing dialogue with
Procuement. <75%.
Documentation
Within treasury departments, the
appetite for increased external
accountability has gained
popularity in recent years
58% of companies reported
conducting formal performance
reviews of their banking partners at
least on an annual basis. <50%.
Companies conducting quarterly
reviews increased 15% between
2009 (25%) and 2013 (40%). <25%
Bank Performance
Measurement
Across the wider economy, demand is growing for greater transparency and accountability. As a result,
corporate treasury has experienced substantive changes in practices and behaviors relating to both
internal and external accountability.
Internal External
Source: Citi Treasury Diagnostics; participants data through year-end 2013
Large companies = > $25 billion; small companies = < $2 billion 13

Risk Management: Still in the Spotlight
Treasurers are increasingly adopting a more comprehensive approach to risk management.
Emerging risk-centric
treasury organization
Increasing number of corporates
employing methodologies to set,
monitor and calculate the usage
of counterparty risk
– 67% of 2013 respondents
– 11% increase between
2009 and 2013
• Aviation – 60%+ ranked Q1
Counterparty Risk
Management
Treasurers are more diligently
monitoring and assessing
various financial risks
Most corporates reported
assessing both interest rate risk
and liquidity/funding risk, 79%
and 80%, respectively
Settlement risk is also receiving
increased attention from
corporate treasury
– Large companies were more
likely to monitor settlement
risk (50%), versus 16% of
small companies. Ave Q1
Assessment & Monitoring
Increasing emphasis on
business continuity, likely due
to treasury’s renewed focus on
comprehensive risk
management
72% of corporates reported
having a treasury business
continuity plan
Large firms were the most likely
to establish a formal treasury
business continuity plan
– 40% increase between
2009 (43%) and 2013
(83%)
Business Continuity
More and more corporate treasury departments are working to foster a risk-aware culture.
Source: Citi Treasury Diagnostics; participants data through year-end 2013
Large companies = > $25 billion; small companies = < $2 billion 14

What is Achievable? Treasury resource is not unlimited and a Treasurer must prioritise projects to ensure maximum impact for the
investment made. What is achievable over the short, medium and longer term for Treasurers?
SHORT TERM
Bank Rationalisation
Audit of bank account s and
benchmarking of existing cash
management structures
Visibility & Control of Cash
Review and implement
enhancements to Cash Pooling,
Cash Flow Forecasting and In-
House banking
FX Management
Dynamic, instant FX management
for the management of online
passenger ticket sales
MEDIUM TERM
Supplier Spend Analysis
Procurement and Treasury to agree
transformation of all non-fuel related
payment activity
Future Proofing Payment
Formats
Leverage XML when dealing with
banks. Eliminate multiple formats
with multiple banks
Governance & Control
Review and implement policies and
procedures to ensure consistent
treasury policies globally
LONG TERM
Supplier Finance
Managing supplier relationships to
protect the global supply chain and
enhance working Capital
Centralisation of all Treasury and
Commercial payments to One
Location
Design and implement a SSC
structure that delivers value &
efficiency across all business lines
ERP/TMS Strategy
Integration and elimination of non-
core systems to improve efficiency
and drive value. Transformation
Strategies are increasing.
15
All are possible now with payback. Timeline is an indication of the
resource requirement

Aviation Treasurer’s Scorecard – What Should it Look Like for 2015?
A Treasurer's Scorecard should be flexible and dynamic. From working with aviation clients globally, Citi
understands the following to be high priorities. As the planning process for 2015 begins the following are areas
worthy of consideration.
Key Result Area Key Performance Indicator Relevance to Corporate Strategy
and Potential Impact
Control & Visibility 1. Review bank Account Relationships and
Account Structures.
2. Is your Liquidity & Cash Management
Structure Maximising Potential?
A. Governance
B. Working Capital
C. Control & Audit
D. Risk Mitigation
E. Regulations
Treasury Impact on CFO
Centralisation & Working
Capital Projects
1. Develop a Transformational Blue-Print.
2. Implement Solutions to Increase Working
Capital for a) Fuel for b) Non-Fuel Spend
A. Supply Chain Management
B. Control & Audit
C. Risk Mitigation
D. Working Capital
E. Process Efficiency
Technology Strategy 1. What is Your TMS & ERP Strategy?
2. Bank Connectivity Plan?
3. Future Proof Links to Banks and 3rd Parties
A. Control & Audit
B. Risk Mitigation
C. Working Capital
D. Technology Blue Print
Partnership with Procurement 1. Understand the Projects that Procurement
are Working on.
2. Implement Solutions to Increase Efficiency
for Non-Fuel Spend
A. Working Capital
B. Supply Chain Management
C. Process Efficiency
D. Technology Blue Print
Innovation 1. Establish a Blue-Print With Strategic
Partners
2. What is the Road-Map for the Next 3-5
Years?
A. Competitiveness
B. Efficiency
C. Financial Impact
D. Process Efficiency
E. Technology Blue Print
Yield &
Self
Funding
Improve
DSO &
DPO
5-10 days
$ cost
Per Bank
$50.000
Removal
Of
Invoices
<EUR10
Item
Cost
16
?

What is the Business Case for Change?
Leveraging data analytics to run models to assess the financial and efficiency impact of new process solutions.
17
Relevant and personalised data analytics can significantly
enhance the internal sponsorship of a project

Recommendations for 2015 The Treasury function is at the hub of an airlines operations. However, demands on time and pressure on
resources requires prioritisation of projects.
18
1. Transparency - Agree a scorecard that is measurable, actionable and is in-line
with the key corporate strategic drivers
2. Strategic Partners – Ensure that your financial partners are seen as strategic and
are seen for the strengths they can bring to the table. Elevate 3rd party
relationships from provider to partner
3. Data Analytics – Demand and leverage analytics that are relevant and reinforces
the business case for a project
4. Prioritise Achievable Projects – Short, Medium and Longer term projects that
deliver measurable results will reinforce the significance of Treasury
5. Partner With Procurement – Significant economic and efficiency savings can be
unlocked. Synergies across the Aviation Supply Chain are achievable
6. Technology Integration – Align the Technology blue prints with Internal Business
Service providers (e.g. GBS) and Technology to maximise impact across the
group

1
Citi believes that sustainability is good business practice. We work closely with our clients, peer financial institutions, NGOs and other partners to finance solutions to climate change, develop industry standards, reduce our
own environmental footprint, and engage with stakeholders to advance shared learning and solutions. Highlights of Citi’s unique role in promoting sustainability include: (a) releasing in 2007 a Climate Change Position
Statement, the first US financial institution to do so; (b) targeting $50 billion over 10 years to address global climate change: includes significant increases in investment and financing of renewable energy, clean technology,
and other carbon-emission reduction activities; (c) committing to an absolute reduction in GHG emissions of all Citi owned and leased properties around the world by 10% by 2011; (d) purchasing more than 234,000 MWh of
carbon neutral power for our operations over the last three years; (e) establishing in 2008 the Carbon Principles; a framework for banks and their U.S. power clients to evaluate and address carbon risks in the financing of
electric power projects; (f) producing equity research related to climate issues that helps to inform investors on risks and opportunities associated with the issue; and (g) engaging with a broad range of stakeholders on the
issue of climate change to help advance understanding and solutions.
Citi works with its clients in greenhouse gas intensive industries to evaluate emerging risks from climate change and, where appropriate, to mitigate those risks.
efficiency, renewable energy and mitigation
© 2014 Citigroup Inc. All rights reserved. Citi and Citi and Arc Design are trademarks and service marks of Citigroup Inc. or its affiliates and are used and registered throughout the world.
IRS Circular 230 Disclosure: Citigroup Inc. and its affiliates do not provide tax or legal advice. Any discussion of tax matters in these materials (i) is not intended or written to be used, and cannot be used or
relied upon, by you for the purpose of avoiding any tax penalties and (ii) may have been written in connection with the "promotion or marketing" of any transaction contemplated hereby ("Transaction").
Accordingly, you should seek advice based on your particular circumstances from an independent tax advisor.
In any instance where distribution of this communication is subject to the rules of the US Commodity Futures Trading Commission (“CFTC”), this communication constitutes an invitation to consider entering
into a derivatives transaction under U.S. CFTC Regulations §§ 1.71 and 23.605, where applicable, but is not a binding offer to buy/sell any financial instrument.
Any terms set forth herein are intended for discussion purposes only and are subject to the final terms as set forth in separate definitive written agreements. This presentation is not a commitment to lend, syndicate a
financing, underwrite or purchase securities, or commit capital nor does it obligate us to enter into such a commitment, nor are we acting as a fiduciary to you. By accepting this presentation, subject to applicable law or
regulation, you agree to keep confidential the information contained herein and the existence of and proposed terms for any Transaction.
Prior to entering into any Transaction, you should determine, without reliance upon us or our affiliates, the economic risks and merits (and independently determine that you are able to assume these risks) as well as the legal,
tax and accounting characterizations and consequences of any such Transaction. In this regard, by accepting this presentation, you acknowledge that (a) we are not in the business of providing (and you are not relying on us
for) legal, tax or accounting advice, (b) there may be legal, tax or accounting risks associated with any Transaction, (c) you should receive (and rely on) separate and qualified legal, tax and accounting advice and (d) you
should apprise senior management in your organization as to such legal, tax and accounting advice (and any risks associated with any Transaction) and our disclaimer as to these matters. By acceptance of these materials,
you and we hereby agree that from the commencement of discussions with respect to any Transaction, and notwithstanding any other provision in this presentation, we hereby confirm that no participant in any Transaction
shall be limited from disclosing the U.S. tax treatment or U.S. tax structure of such Transaction.
We are required to obtain, verify and record certain information that identifies each entity that enters into a formal business relationship with us. We will ask for your complete name, street address, and taxpayer ID number.
We may also request corporate formation documents, or other forms of identification, to verify information provided.
Any prices or levels contained herein are preliminary and indicative only and do not represent bids or offers. These indications are provided solely for your information and consideration, are subject to change at any time
without notice and are not intended as a solicitation with respect to the purchase or sale of any instrument. The information contained in this presentation may include results of analyses from a quantitative model which
represent potential future events that may or may not be realized, and is not a complete analysis of every material fact representing any product. Any estimates included herein constitute our judgment as of the date hereof
and are subject to change without any notice. We and/or our affiliates may make a market in these instruments for our customers and for our own account. Accordingly, we may have a position in any such instrument at
any time.
Although this material may contain publicly available information about Citi corporate bond research, fixed income strategy or economic and market analysis, Citi policy (i) prohibits employees from offering, directly or indirectly,
a favorable or negative research opinion or offering to change an opinion as consideration or inducement for the receipt of business or for compensation; and (ii) prohibits analysts from being compensated for specific
recommendations or views contained in research reports. So as to reduce the potential for conflicts of interest, as well as to reduce any appearance of conflicts of interest, Citi has enacted policies and procedures designed to
limit communications between its investment banking and research personnel to specifically prescribed circumstances.

World Financial Symposium 2014 World Financial Symposium 2014
Treasury Technology Trends & Connectivity:
What Top Performing Airlines Must Have?
Christoph Feddern, Consultant, Senior Consultant, Treasury &
Finance Solutions, Zanders
Laurens Tijdhof, Director, Treasury & Finance Solutions,
Zanders

21
Abu Dhabi, 17th of September 2014 Laurens Tijdhof – Partner Christoph Feddern – Senior Consultant
Technology
Catalyst for Treasury Transformation
IATA Benchmarking Study 2014

22
1 Introduction
3
Key Results of IATA Benchmarking Study 2014 2
Conclusions
Agenda

23
• Zanders Treasury & Finance Solutions is founded in 1994
• Independent and specialised advisory firm
• Focusing on Treasury Management, Risk Management and Corporate Finance
• Over 150 qualified treasury consultants
• Advisory, interim, transaction and outsourcing services
• Offices located in The Netherlands, Belgium, United Kingdom and Switzerland
• Leading advisory firm in its area of expertise with a global client base
• Long-term relationships with corporations, financial institutions, public sector and NGOs based on highest levels of ethics and trust
“...Zanders believes that treasury and finance solutions should be advised in an independent, innovative and entrepreneurial manner based on thought leadership and conforming to the constantly changing demands of the market...”
Company Overview

24
Treasury Organization:
• Covers on average 31 countries (H: 150, L: 1)
• Covers on average 13 currencies (H: 60, L: 1)
• Large part of treasury activities are still decentralized (36%)
Recap IATA Benchmarking Study 2012
Treasury Centralization
Strategic Opportunities
Cash & Liquidity Management:
• Become more effective in cash flow forecasting (41%)
• Improve cash management (25%)
• Not measured against formal KPIs (74%)
Improve Availability of Data &
Management Info
Risk Management:
• Timeline and quality of information (58%)
• Availability of information (31%)
• Difficulty in quantifying risks (31%)
Improve Quality of Data &
Risk Quantification
Bank Relationship Management:
• Between 10 -30 banks (44%)
• More than 30 banks (38%)
• Average of 88 bank accounts (H: 1.500, L: 2)
Bank Rationalization
Treasury Technology:
• 61% does not use a treasury workstation!
• 57% does not use an ERP system
• 82% does not use SWIFT for bank connectivity
• 77% is looking at technology improvement
Treasury Automation

25
3rd Stage of Centralization
2nd Stage of Centralization
1st Stage of Centralization
Technology Driving the Next Stage of Treasury Centralization Split between Operations (Centralization) and Value Adding Activities (Business Integration)
Level of Centralization
Decentralized Cash Mgnt
by Subsidiaries
Local Liquidity Centralization
Regional and/or Global Liquidity Centralization
(Netting & IHB)
SSC, Payment & Collection Factory
Virtual Treasury (Centralized &
Paperless Operations,
together with Business
Integration)
Simplifying and/or Automating Treasury
Operations & Processes (Banking, eBAM, FSCM)
Internal Funding and/or Centralized
FX Mgnt
Status Quo (Average Airline)
Time

26
1 Introduction
3
Key Results of IATA Benchmarking Study 2014 2
Conclusions
Agenda

27
IATA Benchmarking Survey Composition
• Mainly European airlines responded; other regions are evenly represented
• 46% of respondents with turnover of less than USD 1bn p.a.
• Majority are ‘traditional’ airlines, however survey also includes low-cost carriers
• Survey focusing on IATA member and non-member airlines (56 responses)
20%
34%
46%
Annual Turnover (USD)
Large (>5bn)
Medium (1bn-5bn)
Small (<1bn)
44%
15%
13%
16%
13%
Geographical
Europe
APAC
Americas
Africa
MENA

28
• What’s the current size of your treasury team?
Treasury Organization at Airlines
- Strong correlation between turnover and size of treasury
- 9% of large airlines have a relatively small treasury team
- 27% of small airlines have a relatively large treasury team
• Which best describes your treasury structure?
- 55% of all airlines implemented a centralized model
- Large airlines tend to centralize into global treasury operations
- Majority of small airlines have
decentralized treasury activities
0%
10%
20%
30%
40%
50%
60%
70%
80%
90%
100%
Small (<1bn) Medium (1bn-5bn) Large (>5bn)
1-4 staff
5-9 staff
>10 staff
0%
10%
20%
30%
40%
50%
60%
70%
80%
90%
100%
Small (<1bn) Medium (1bn-5bn) Large (>5bn)
Local Treasury
Regional treasury teams
Regional treasury centers
Global Treasury

29
• Does your company perform cash pooling?
Cash & Liquidity Management (1)
- 59% of airlines make use of cash concentration structures
- ZBA pooling predominant; notional
and hybrid structures rarely used
- Relatively low level of cash pooling compared to other industries
- Cash pools are mostly bank administered (53%)
- Technology, either through ERP or
TMS, is only used by 39%
• What technology enables cash pooling?
0%
5%
10%
15%
20%
25%
30%
35%
40%
45%
No ZBA Notional hybrid
Large(>5bn)
Medium(1bn-5bn)
Small (<1bn)
53%
30%
9%
7%
Bank administered
Inhouse bank in TMS
Inhouse bank in ERPTreasury module
Other

30
Cash & Liquidity Management (2)
• Does your company conduct cash flow forecasting (CFF)?
- 89% of all airlines conduct cash flow forecasting
- 58% rolling and 31% static forecast
- Size and/or complexity of airlines are not related to the type of forecasting
• Which technology enables cash flow forecasting in your organization?
- 74% of all airlines use Excel as their main CFF tool
- Larger airlines tend to integrate CFF
into their TMS - Overall level of integration into TMS
or ERP Treasury Module is very low compared to other industries
11%
58%
31% No
Yes, rolling
Yes, static
0%
10%
20%
30%
40%
50%
60%
70%
80%
90%
100%
Small (<1bn) Medium (1bn-5bn) Large (>5bn)
ERP Treasury Module
TMS
Stand-alone tool
MS Excel

31
Risk Management
• Which risk classes do you actively manage?
- Financial risks are actively managed; liquidity risk is the top priority
- Importance of FX risk has declined from 85% to 61% (vs. 2012 survey)
- Commodity risk is managed by 43%
of the airlines (50% in 2012 survey)
• Which systems support you with your commodity risk management (CRM)?
- 54% of airlines (that manage commodity risk) use Excel and don’t have any CRM system
- 25% of airlines use best-of-breed CRM systems
- TMS or ERP Treasury usage for CRM is very low with only 14%
0%
10%
20%
30%
40%
50%
60%
70%
80%
0%
10%
20%
30%
40%
50%
60%
70%
80%
90%
100%
Small (<1bn) Medium (1bn-5bn) Large (>5bn)
ERP Treasury
MIS
TMS
others
none
Excel

32
• Which balance sheet financing options are used in your organization?
Corporate Finance
- Bank loans are the most preferred financing option (56% of airlines)
- Larger airlines tend to diversify their debt portfolio
- This development can be observed in other industries as well
• With regards to corporate finance, treasury technology is used to:
- Mainly used to record transactions and enter accounting entries
- 45% of airlines perform reporting and controlling tasks (i.e. headroom or covenant analysis)
- Corporate finance execution is typically done manually 0% 20% 40% 60% 80% 100%
Execute transactions
Report and control
Accounting
Record all transactions
0%
10%
20%
30%
40%
50%
60%
70%
80%
90%
100%
Small (<1bn) Medium (1bn-5bn) Large (>5bn)
Private placements
Mezzanine
Bonds
Bank loans

33
• How do you connect to your banking partners?
Bank Relationship Management
- E-banking tools are very popular, with usage by 65% of all airlines
- Host-to-host connectivity is used by 25%, while SWIFT only by 10%
- Corporate access to SWIFT is low compared to other industries
• Which technology enables the external payment process?
- 35% of airlines process payments centrally with a Shared Service Center (SSC) and/or Payment Factory (PF)
- 44% of airlines have a decentralized payment process
- Stand-alone payment tools are used by 42% of all airlines, ERP Treasury by 29% and TMS by 19%
0%
10%
20%
30%
40%
50%
60%
70%
80%
90%
100%
Processed locally,paid locally
Processed locally,paid centrally (PF)
Processed centrally,paid centrally
(SSC/PF)
other
TMS
ERP Treasury
Stand-alone tool
0%
10%
20%
30%
40%
50%
60%
70%
80%
90%
100%
Small (<1bn) Medium (1bn-5bn) Large (>5bn)
Other
SWIFT
Host-to-Host
E-banking

34
1 Introduction
3
Key Results of IATA Benchmarking Study 2014 2
Conclusions
Agenda

35
Treasury Technology Landscape at Airlines
• Type of technology solution: - No treasury workstation (i.e. MS Excel) reduced to 41% of airlines (in 2012 this was 61%) - Treasury Management System (TMS) is used by 37% of airlines - ERP Treasury module is used by 22% of airlines
• The choice of technology solution is driven by airline size and complexity: - TMS usage is divided by Sungard (25%), WSS (6%) and multiple other vendors (69%) - ERP Treasury modules are mainly implemented by medium-sized and large airlines, where
the choice for SAP is dominant (68%, compared to 32% Oracle)
0%
10%
20%
30%
40%
50%
60%
70%
80%
90%
100%
Small (<1bn) Medium (1bn-5bn) Large (>5bn)
Kyriba
GTreasury
WSS IT2
WSS City Financials
Sage XRT Universe
Reval
Other
Oracle PeopleSoft Treasury
Oracle EB Treasury
Bellin tm5
SAP Treasury
Sungard AvantGard Quantum
Sungard AvantGard Integrity
MS Excel

36
• On average and compared to other industries, the airlines are lagging somewhat behind the curve in terms of centralization and applied treasury technology
• Therefore we recommend to define a strategic treasury roadmap to become a best-in-class treasury value center
• Start your treasury transformation ambitions with a processes redesign:
– Focus on further centralization and simplification of the airline treasury organization (i.e. on average 27% of treasury activities are still decentralized)
– Combine this effort with standardization of treasury processes
• Then continue with evaluating and implementing the ‘right’ treasury technology solution:
– Ensure that the solution fits with your specific requirements (which are driven by airline size and treasury complexity)
– Focus on treasury automation (i.e. reduce manual and paper-based processes) and seamless integration with other systems
Is Your Airline Ready for the Next Step?

37
Zanders Netherlands Brinklaan 134 1404 GV Bussum The Netherlands T: +31 35 692 8989
Zanders UK 26 Grosvenor Gardens SW1W 0GT London United Kingdom T: +44 207 763 2510
Zanders Belgium Place de l’Albertine 2 1000 Brussels Belgium T: +32 2 213 84 00
Zanders Switzerland Gessnerallee 36 8001 Zürich Switzerland T: +41 44 577 70 10
Contact Details
Laurens J.A. Tijdhof Partner E: [email protected] M: +32 476 05 45 58 Christoph Feddern Senior Consultant E: [email protected] M: +41 76 388 59 04

38
Disclaimer
This presentation was prepared exclusively for the benefit and internal use of the recipient. It does not carry any right of publication or disclosure, in whole or in part, to any other party. This presentation is for discussion purposes only and is incomplete without reference to, and should be viewed solely in conjunction with, the oral briefing provided by Zanders. Neither this presentation nor any of its contents may be disclosed or used for any other purpose without the prior written consent of Zanders.

39 © 2014 Zanders Treasury and Finance Solutions www.zanders.eu

World Financial Symposium 2014 World Financial Symposium 2014
The Low Interest Environment and
the Future of Electronic Trading
Arjan Hes
Director, Client Acquisition
MyTreasury Ltd

My Kind of trading platform
The low interest environment and the future of
electronic trading

42

Treasury as a cost centre 43
• The cost per transaction has gone up when measured against interest
income
• Resource transaction costs rarely taken into account
• Platforms introduce operational efficiencies and risk controls
• Broadly same return and more / better control
• More time to focus on higher value part of Treasury

Trends with regards to electronic Term Deposit trading at banks 44
• FX e-trading has been around for well over 15 years
• Mature, well established, well understood models
• TD trading follows broadly similar model
• Banks have increasingly focussed on client profitability
• Some instances where banks removed lines for some TD clients
• Taking of deposits is a resource intensive low margin business
• A number of banks are implementing initiatives to roll out electronic deposit taking
• Most TD trades handled in the same way as FX trading through an RFQ model.
• More banks will follow as price pressures remains and clients demand it.

What is changing for Corporate Treasury 45
• Single bank multi product proprietary platforms are going to become less prevalent
• Single product multi provider platforms become less relevant
• Introduction of Joint ventures between single product platforms - marriage of convenience
rather than linking best in class technologies.
• Current trend is to launch multi-currency, multi-product platforms / add new markets on
proven technologies.
• Output files to not only integrate all data into a TMS but:
• Ability to convert data held in the TMS / ERP into trade files for execution simplifying the
route to market
• Ability to settle out of the trading app, rather than wait for trades to flow into the TMS.

How does this impact Treasury 46
• Multiple ways:
• Banks might prefer you to trade plain vanilla trades electronically
• Price differentials between telephone and e-trading will be reduced
or even inverted
• Are you looking for best in class technology per product (FX, TD,
MMF etc) or;
• Best multi product platform
• Conversation to get “lay of the land” will be a value add for the
banks rather than the pre-amble before any trade – not mutually
exclusive with technology
• Corporates and banks will always have objections to trading
electronically - what is your preference

What are Treasurers doing 47
• Looking closely at money market instruments
• Exploring and implementing best in class technology
• Cooperating in the design of relevant multi product
technology

48 Are Airline Treasures farther advanced
• We believe so due to the long term use of e-FX and MMF
trading
• Cultural risk aversion due to the nature of the business
• Tech savvy
• Size and negotiating power with banks to keep e-rates
competitive

49 What is happening around you
• Acceptance and proliferation of e-trading platforms has driven
further development and refinement
• Platforms becoming single provider multi-currency, multi-product
platform
• Development to use existing (TMS / ERP) data to create orders
• Removal of more fingers from keyboards
• Banks could unwittingly accelerate the spread of multi-product
platforms

50 Virgin Atlantic Experience
Key Investment Challenges • Daily operations efficiency- Money Market Funding was heavy and manual process
• Confirmation of Investment, performance assessment and reporting was time consuming
• Limited visibility on funding options
• Cost reduction environment where maintaining a low fee structure is essential
• Managing credit control and risk exposure
Investment portal selection based on • Daily and Trading Capabilities
• Risk Analytics
• Trade Confirmation (SWIFT confirmation was a priority)
• Magnitude of documentation and legal review
• Reconciliation
• Contingency Plan
“In order to make our operations efficient and allow more focus on strategy and
management decision, finding a technology solution was a necessity”
Khurram, Treasury Controller – Virgin Atlantic

In Conclusion
Demand from Treasurers and Banks to be more efficient is ultimately going
to accelerate the development and wider acceptance of e-trading platforms
for corporate cash. The low interest rate environment is just the catalyst.
51

Arjan Hes MyTreasury Limited 2 Broadgate London EC2M 7UR United Kingdom Tel: +44 (0) 20 7000 5162 Email: [email protected]

World Financial Symposium 2014 World Financial Symposium 2014
Networking Break

World Financial Symposium 2014 World Financial Symposium 2014
Managing Risk in a
New Environment
Vijay Panday, Director, Group Treasury and Risk, KLM
Eu-Jin Ang, Corporate Adivisory Group, RBS

17 September 2014
IATA WFS 2014 Treasury Track Managing risk in a new environment: QE, its tapering/unwinding,
& financing/risk management considerations
cib.rbs.com

I. What is QE?
How big has it been?
Could it be unwound?

57
The “new normal”: QE & other stimuli … any ends in sight?
Before 2008, central banks typically targeted medium-term inflation (“stable prices”) via …
Direct monetary expansion =
Quantitative Easing (QE)
• Fed QE1-3
• BoE QE1-3
• BoJ 2001-2006, since
2013
• ECB ABSPP announced
4 Sep (a CE response to
QE problem?)
Sovereign QE in 2015?
Approaches not focussed on money supply
• Refinancing/Liquidity Operations
(sovereigns & banks)
• Credit Easing (CE), including:
• Securities Market Programme (SMP)
Long Term Refinancing Operations
(LTRO) Outright Monetary Transactions
(OMT)
• Funding for Lending Scheme (FLS)
• Operation Twist, etc.
Ineffective when IRs near zero but deflationary pressures, requiring …
Conventiona
l monetary
policy
Un-
conventional
monetary
policy
• Banks’ reserve requirements
• Targeting short-term IRs through:
• IRs on reserves
• Buying (short term) government securities
• Collateralised lending (to banks)

58
What is QE?
Quantitative Easing (QE) is: • Central bank’s monetary stability operations that inject
(typically pre-determined amount of) money into
economy
• To increase money supply & hence inflation
• By buying bonds (usually sovereign debt, but possibly
other financial assets too)
Bank of
England
(BoE) creates
£ by crediting
its own bank
account
BoE buys
government
bonds (Gilts) in
the secondary
market from
Financial
Institutions (FIs)
FIs invest in corporate
bonds/equity or
increase lending.
Why? Gilts increase in
price (reduce in yield)
and become relatively
less attractive
Companies and
individuals
spend more
money in the
economy due to
cheaper & more
available capital
Later, when economy
has recovered and
deflation risks warded
off, BoE can sell Gilts
back into the secondary
market
How QE is supposed to work (simplified UK example)
• From bank & non-bank private sector entities (e.g.
pension funds or insurers)
• On an un-sterilised basis (i.e. creating net new
money via excess reserves)
• Also lowers yields (nominal & real) on risk-free
assets, encouraging investment into riskier
assets
Bonds
BoE
Secon-
dary
Market Equities,
Bonds,..
Goods
BoE BoE
Bonds
Secon-
dary
Market

59
US Fed balance sheet
Source: US Federal Reserve Board
0.0
0.5
1.0
1.5
2.0
2.5
3.0
3.5
4.0
4.5
Jan
07
Jul
07
Jan
08
Jul
08
Jan
09
Jul
09
Jan
10
Jul
10
Jan
11
Jul
11
Jan
12
Jul
12
Jan
13
Jul
13
Jan
14
Jul
14
US
D t
rilli
ons
Total Fed Assets US Treasury Securities Agency Debt + MBS
US Fed QE
QE1 QE2 QE3
Tapering
$1.24trn in
mortgage
securities
Target $0.6trn
in Treasuries
$40bn mortg.+
$45bn Treas.
monthly
Still buying,
but $5bn less
mortg.+ $5bn
less Treas.
each month

60
China, Japan & now Eurozone on stimulus …
US & UK stopping/stopped, rates to rise (& QE to unwind?) Central Banks’ balance sheet expansion Total central bank assets, USD trillions
CBs big govt. bond holder, depressing yields CB holdings of gov.securities, % of total (Q3 2013)
QE can cause distortions in
asset prices, investor behaviour & wealth distribution
61
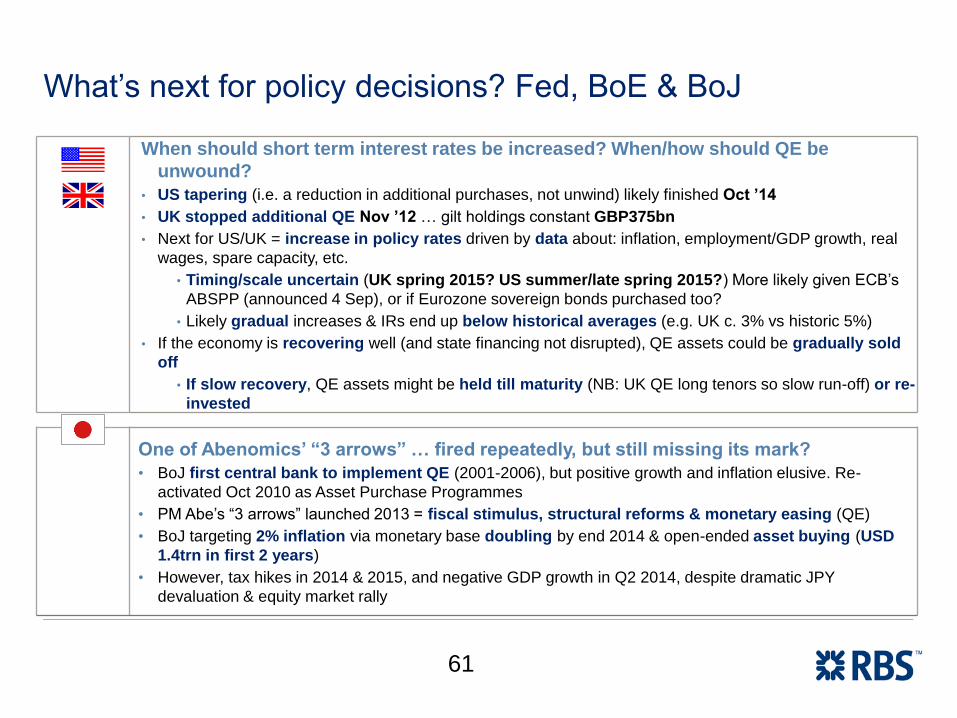
What’s next for policy decisions? Fed, BoE & BoJ
When should short term interest rates be increased? When/how should QE be
unwound?
• US tapering (i.e. a reduction in additional purchases, not unwind) likely finished Oct ’14
• UK stopped additional QE Nov ’12 … gilt holdings constant GBP375bn
• Next for US/UK = increase in policy rates driven by data about: inflation, employment/GDP growth, real
wages, spare capacity, etc.
• Timing/scale uncertain (UK spring 2015? US summer/late spring 2015?) More likely given ECB’s
ABSPP (announced 4 Sep), or if Eurozone sovereign bonds purchased too?
• Likely gradual increases & IRs end up below historical averages (e.g. UK c. 3% vs historic 5%)
• If the economy is recovering well (and state financing not disrupted), QE assets could be gradually sold
off
• If slow recovery, QE assets might be held till maturity (NB: UK QE long tenors so slow run-off) or re-
invested
One of Abenomics’ “3 arrows” … fired repeatedly, but still missing its mark?
• BoJ first central bank to implement QE (2001-2006), but positive growth and inflation elusive. Re-
activated Oct 2010 as Asset Purchase Programmes
• PM Abe’s “3 arrows” launched 2013 = fiscal stimulus, structural reforms & monetary easing (QE)
• BoJ targeting 2% inflation via monetary base doubling by end 2014 & open-ended asset buying (USD
1.4trn in first 2 years)
• However, tax hikes in 2014 & 2015, and negative GDP growth in Q2 2014, despite dramatic JPY
devaluation & equity market rally

62
What’s next for policy decisions? ECB
Eurozone recovery not on track → negative IRs + ABS QE; sovereign bond QE to come?
• The Eurozone after periphery sovereign-banking crises: low inflation/deflation (ECB “reaction
functions” also include “unanchored inflation expectations”); high unemployment; low growth; (arguably)
strong EUR; worrisome Debt/GDP ratios (e.g. Italy); uneven structural/fiscal/banking reforms;
constitutional & practical objections to (sovereign-bond) QE
• Increasingly zero/negative policy IRs (refi & depo rates)
• ABSPP (Asset-Backed Securities Purchase Programme) announced 4 Sep, details & first buying Oct:
• Provides both QE (for declining inflation) & CE (for credit market fragmentation & policy transmission to
the real economy, esp. SMEs)
• What could be bought? ABS backed by loans to non-financial private sector, incl. real estate (e.g.
ABS of auto & consumer loans/leases & credit cards, SME securitisations, RMBS & CMBS = residential
& commercial mortgage-backed securitisations)
• How much to be bought? Wait for Oct; potential universe ca. EUR850-875bn with ECB aim to re-
expand balance sheet to early 2012 levels (i.e. EUR2.7trn incl. tLTRO, when EUR2trn today)
• Sovereign QE?
• Door left open. If inflation forecasts fall further, could still buy liquid, nominal fixed-rate, central
government debt (of say 2y to 10y tenors)
• Likely only after ABSPP launch (Oct’14) + tLTRO (targeted Long-Term Refinancing Operation,
Sep/Dec’14) + bank AQR (Asset Quality Review)/stress tests (Nov’14)

II. QE’s impact on economies & markets
… and where might they revert to?

64
-8%
-6%
-4%
-2%
0%
2%
4%
6%
8%
10%
12%
14%
16%
Jan 05 Jan 06 Jan 07 Jan 08 Jan 09 Jan 10 Jan 11 Jan 12 Jan 13 Jan 14
US UK Eurozone Japan China India Brazil
GDP growth (annualised %)
Source: Bloomberg
GDP growth: QE curtails recession; less effective as stimulant?
• Global QE has probably shortened post-crisis recessions
• But stimulus effects on GDP growth have lags, and as markets/economies become conditioned,
arguably decreasing effectiveness of further doses
• What’s in store for global growth when there’re no further injections, or rates rise, or QE is unwound?
US QE1 US
QE2
US QE3

65
Year-on-year inflation (%)
Source: Bloomberg
Inflation: despite QE’s aims, deflation/low infl. fears persist
• UK inflation now below target, after years of overshooting
• But in most developed economies, low levels of inflation (and potential threats of deflation) are the
focus of monetary policy (conventional and unconventional)
• ECB just launched an ABS-focused QE programme … holding fire on a sovereign bond version
-3%-2%-1%0%1%2%3%4%5%6%7%
Jan
05
Jul
05
Jan
06
Jul
06
Jan
07
Jul
07
Jan
08
Jul
08
Jan
09
Jul
09
Jan
10
Jul
10
Jan
11
Jul
11
Jan
12
Jul
12
Jan
13
Jul
13
Jan
14
Jul
14
Jan
15
Jul
15
US CPI YoY (%) UK CPI EU Harmonized YoY (%) Euro stat EU HICP (%) Japan CPI YoY (%)
2%
target
US QE1 US
QE2
US QE3
Forecast

66
Term IRs – 10Y swap & real IRs
Source: Bloomberg
Interest rates: near historic lows … but for how much longer?
Central bank policy rates
Source: Bloomberg
Inflation (+ growth/employment) targets pre-crisis
→ effective zero IR policies
→“forward guidance” (inflation + employment)
→ back to “data-driven” US & UK policy?
• Central bank buying pushes bond prices up & yields
down
• EUR & GBP rates tend to follow the USD
• Fixed rates at/near historical lows mean very low
cost funding for corporates, but can make floating
rates less attractive
-2%
-1%
0%
1%
2%
3%
4%
5%
6%
Jan
07
Jul
07
Jan
08
Jul
08
Jan
09
Jul
09
Jan
10
Jul
10
Jan
11
Jul
11
Jan
12
Jul
12
Jan
13
Jul
13
Jan
14
Jul
14
Jan
15
USD 10Y swap rate GBP 10Y swap rate EUR 10Y swap rate
USD 10Y real rate GBP 10Y real rate EUR 10Y real rate
QE3
IRs decline
despite tapering
QE1 QE2
Tapering mooted
May’13
0%
1%
2%
3%
4%
5%
6%
Jan
07
Jul
07
Jan
08
Jul
08
Jan
09
Jul
09
Jan
10
Jul
10
Jan
11
Jul
11
Jan
12
Jul
12
Jan
13
Jul
13
Jan
14
Jul
14
Jan
15
US Fed Funds Target Rate UK BoE Official Base RateECB Main Refi Rate
QE1 QE2 QE3
Sovereign
Crisis

67
Bond yield spreads to benchmarks - iBoxx Non-Financial
Corporates & Travel/Leisure (basis points)
Source: iBoxx, RBS
Credit: benign borrowing conditions …for how much longer?
• Central banks buy bonds from
banks & the markets so that
created cash & reserve
balances can be lent on to the
real economy (e.g. capex)
• But much has instead built up
on bank balance sheets,
leading to spread compression
in loan markets & deposit
pricing. Corporate & consumer
deleveraging compounds this
• Excess liquidity will be
siphoned off as QE naturally
unwinds (e.g. bonds mature),
but this could take many years
• However, taper tantrums,
recent High Yield investor
exits, and secondary market
illiquidity (driven by regulation)
suggest good times could end
suddenly & disruptively
0
100
200
300
400
500
600
700
800
Jan
07
Jul
07
Jan
08
Jul
08
Jan
09
Jul
09
Jan
10
Jul
10
Jan
11
Jul
11
Jan
12
Jul
12
Jan
13
Jul
13
Jan
14
Jul
14
iBoxx.EUR.Corporates iBoxx.EUR.Travel&LeisureiBoxx.GBP.Corporates iBoxx.GBP.Travel&LeisureiBoxx.USD.$Corporates iBoxx.USD.$Travel&Leisure
QE1 QE2 QE3
Sovereign
Crisis

68
Equities: resurgent …as a beneficiary of QE
Equity markets (index levels)
Source: Bloomberg, Financial Times
• As yield on fixed income drops, investors have pursued other returns, driving equity market returns
• There appears a relationship between equity market gains & Fed purchases
0
2,000
4,000
6,000
8,000
10,000
Jan
07
Jul
07
Jan
08
Jul
08
Jan
09
Jul
09
Jan
10
Jul
10
Jan
11
Jul
11
Jan
12
Jul
12
Jan
13
Jul
13
Jan
14
Jul
14
Jan
15
0
5000
10000
15000
20000
25000
30000
35000
S&P 500 (L-axis) FTSE 100 (L-axis) DAX (L-axis)NIFTY (L-axis) NIKKEI 225 (R-axis) Hang Seng (R-axis)
QE1 QE2 QE3
Sovereign
Crisis

69
EM FX (per USD, Jan 2007 = 100)
Source: Bloomberg
Implied FX volatility (% p.a., vs USD)
Source: Bloomberg
FX: EM currencies hit by tapering;
could global FX volatility spike on QE unwind?
• At QE's inception fears were voiced about "currency
wars" and competitive devaluations
• However, significant weakening in developed
market currencies has not occurred (except
JPY)
• QE's boost to asset markets may have attracted
foreign investor & safe haven flows
• Meanwhile, FX option volatilities are near pre-crisis
lows (incl. EUR, as break-up fears have receded)
• A very benign period existed for EM
currencies from early 2012 through the first
hint of tapering in May 2013
• The ensuing EM FX sell off meant many
companies with significant EM exposures
have seen a material decrease in financial
results
0%
5%
10%
15%
20%
25%
30%
35%
40%
Jan
07
Jul
07
Jan
08
Jul
08
Jan
09
Jul
09
Jan
10
Jul
10
Jan
11
Jul
11
Jan
12
Jul
12
Jan
13
Jul
13
Jan
14
Jul
14
GBPUSD EURUSD USDJPY USDINR USDBRL
70
80
90
100
110
120
130
140
150
160
170
Jan
07
Jul
07
Jan
08
Jul
08
Jan
09
Jul
09
Jan
10
Jul
10
Jan
11
Jul
11
Jan
12
Jul
12
Jan
13
Jul
13
Jan
14
Jul
14
USDTRY USDBRL USDZAR USDINR USDIDR
QE3
Tapering fears Sovereign
Crisis Post Lehman
QE1 QE2 QE1 QE2 QE3
Tapering fears Sovereign
Crisis
Post Lehman
III. Implications/considerations for
funding, risk & transaction management

71
Financing considerations (I)
Be prepared – prudent principles for uncertain times
• Debt maturities well distributed
• Reduce risks of large maturities/re-financings coinciding with policy actions & market disruption
• Make the most of current conditions
• Especially loan pricing & debt market demand
• Adequate cash/liquidity
• For industry cycles, and tiding over market disruptions + operational surprises
Opportunities to diversify may still exist
• Floating rate notes (FRNs)
• QE taper/unwind impacts duration-sensitive bonds → rise in investor demand for FRNs (at tighter
margins)
• Convertible bonds
• QE supportive of equity (and vol) makes convertibles cost-attractive means to diversify funding.
Opportunity may diminish when QE stops/unwound

72
Financing considerations (II)
Prepare for return of FX volatility
• Currencies as volatile as historically (especially Emerging Markets)?
• FX translation (accounting) could impact net assets, foreign earnings, and thus credit ratings,
covenants and key performance metrics
• Is the currency mix of debt optimal?
• Currency of debt issuance
• FX demand/supply affects spreads of cross-currency basis swaps
• Financing strategy should take into account changes in relative attractiveness & credit usage of
debt issuance in a currency vs another currency + swaps
More than just financial debt …
• Pension liabilities
• Pension deficits are often included in rating agencies’ net debt metrics
• As bond yields (hence discount rates for pension liabilities) rise, pension deficits reduce
• However, opportunities to fund deficits at low IRs also diminished

73
Risk management considerations
Think ahead
• Ready, steady, swap
• Consider swaps to floating – in USD & GBP, could benefit from receiving a fixed rate above that of
recently issued debt; in EUR & JPY, floating IRs low for even longer
• Credit lines, documentation and other logistics in place to take advantage of IR moves
• In USD & GBP, consider pre-hedging IRs of future debt
• Forward-starting swap rates have risen, but still low
• Corporates could still benefit from hedging IRs beyond typical horizons
• Can be hedge accounting friendly
FX hedging relatively cost-attractive
• Re-visit FX hedging
• IR differentials still low; attractive FX forward carry may not last (especially in EURUSD)
• Review FX risks from transactional sources (e.g. jet fuel & aircraft purchases) & translational ones
(foreign earnings & assets)
• Re-consider options
• Relatively cheap with many implied FX vols near historic lows
• Less consuming of bank credit lines (than FX forwards)

74
Transaction management considerations
Efficiency & Effectiveness … even when things change or are in crisis
• Globally-standardised electronic banking solutions
• Security, visibility & control of cash flows across network
e.g. multi-currency transaction platform that benefits airlines & customers (such as RBS Micropay)
• Centralising treasury functions
• Efficiency, accuracy (reporting & reconciliation), reduced operational costs
e.g. payment factories
• Rationalising banking structures
• Reduce network systems/platforms/services & redundancies, avoid complex fee structures, improve
transparency, optimise working capital
e.g. cash pooling & netting, supply chain & receivables financing

75
Considerations for Treasuries
Attend to the fundamentals
• Treasury partnering Operations
• Good mutual understanding/communications – business cyclicality/surprises & financial risks
• Core banking relationships, especially domestic ones
• When liquidity scarce, likely to be lent locally
• Manage ancillary income distribution
• Manage credit lines
Best practice Treasury policies/practices/systems
• Fit for purpose
• Strategic alignment, “crisis” resilience & flexibility
• Centralised management information/controls
• To properly understand, decide & act
• Efficient
• Every dollar of cost/revenue counts, whether from transactional CFs, cash management, working
capital, etc.

76
This presentation has been prepared by The Royal Bank of Scotland plc or one of its affiliates (“RBS”) exclusively for internal consideration by the recipient (the “Recipient”) for information purposes only. This presentation is incomplete without reference to, and should be viewed solely in conjunction with, any oral briefing provided by RBS. The presentation is proprietary to RBS and may not be disclosed to, or referred to, by any third party or distributed, reproduced or used for any other purpose without the prior written consent of RBS. RBS is not and shall not be obliged to update or correct any information contained in this presentation. This presentation is provided for discussion purposes only and its content should not be treated as advice of any kind. This presentation does not constitute an offer or invitation to enter into any engagement or transaction or an offer or invitation for the sale, purchase, exchange or transfer of any securities or a recommendation to enter into any transaction, and is not intended to form the basis of any investment decision. Neither this presentation nor our analyses are, nor purport to be, appraisals or valuations of the assets, securities or business(es) of the Recipient or any transaction counterparty.
This presentation is based upon information provided to RBS by the Recipient and/or publicly available information. It reflects prevailing conditions and our initial views as at this date which we reserve the right to change. We have relied upon and assumed, without verification, the accuracy and completeness of all information available to us, whether from public sources or provided by or on behalf of the Recipient, including any statements with respect to projections or prospects of the Recipient and related assumptions. RBS accepts no responsibili ty or liability for (and no representation or warranty or assurance of any kind, express or implied, is or will be made as to or in relation to) the accuracy or completeness of such information, the contents of this presentation or any action taken or omitted by the Recipient or any other person as a result of receiving it. However, this shall not restrict, exclude, or limit any duty or liability to any person under any applicable laws or regulations of any jurisdiction which may not lawfully be disclaimed. The Recipient should not rely on any representations or undertakings inconsistent with the above paragraphs.
Nothing in this presentation constitutes a commitment to provide any formal advice or assistance to the Recipient or to enter into any transaction with the Recipient, which would be the subject of a separate mutually satisfactory engagement letter and/or other appropriate documentation between the Recipient and RBS. This presentation is not intended for distribution to retail clients (as defined in the Markets in Financial Instruments Directive (MiFID)) under any circumstances.
The Royal Bank of Scotland plc and its affiliates, connected companies, employees or clients may have an interest in financial instruments of the type described in this document and/or in related financial instruments. Such interest may include dealing in, trading, holding, or acting as market-makers in such instruments and may include providing banking, credit and other financial services to any company or issuer of securities or financial instruments referred to herein.
The Royal Bank of Scotland plc is authorised by the Prudential Regulation Authority and regulated by the Financial Conduct Authority and the Prudential Regulation Authority in the UK.
Agency agreements exist between different members of The Royal Bank of Scotland Group plc.
The Royal Bank of Scotland plc. Registered in Scotland No. 90312. Registered Office: 36 St Andrew Square, Edinburgh EH2 2YB.
The daisy device logo, RBS and The Royal Bank of Scotland are trade marks of The Royal Bank of Scotland Group plc.

World Financial Symposium 2014 World Financial Symposium 2014
Best Practices in Cash Management
& Effective Cash Forecasting
Friedrich Floto, Senior Vice President, Finance
Administration, Air Berlin PLC & Co. Luftverkehrs KG
Amin Moncef, Managing Director, Sapphire Innovation

World Financial Symposium 2014 World Financial Symposium 2014

World Financial Symposium 2014 World Financial Symposium 2014

World Financial Symposium 2014 World Financial Symposium 2014

World Financial Symposium 2014 World Financial Symposium 2014

World Financial Symposium 2014 World Financial Symposium 2014

World Financial Symposium 2014 World Financial Symposium 2014

World Financial Symposium 2014 World Financial Symposium 2014

World Financial Symposium 2014 World Financial Symposium 2014

World Financial Symposium 2014 World Financial Symposium 2014

World Financial Symposium 2014 World Financial Symposium 2014

World Financial Symposium 2014 World Financial Symposium 2014

World Financial Symposium 2014 World Financial Symposium 2014

World Financial Symposium 2014 World Financial Symposium 2014

World Financial Symposium 2014 World Financial Symposium 2014

World Financial Symposium 2014 World Financial Symposium 2014

World Financial Symposium 2014 World Financial Symposium 2014

World Financial Symposium 2014 World Financial Symposium 2014

World Financial Symposium 2014 World Financial Symposium 2014

World Financial Symposium 2014 World Financial Symposium 2014

World Financial Symposium 2014 World Financial Symposium 2014

World Financial Symposium 2014 World Financial Symposium 2014

World Financial Symposium 2014 World Financial Symposium 2014

World Financial Symposium 2014 World Financial Symposium 2014

World Financial Symposium 2014 World Financial Symposium 2014
How Can Treasury Add Value?
Roadmap to a World Class Treasury
Okan Bas, Treasury Manager, Turkish Airlines
Nirmal Govindadas, SVP, Corporate Treasury, Emirates
Peter Matza, Engagement Director, The Association of Corporate Treasurers
Edmar Lopes Neto, CFO, Gol Linhas Aereas intligents S.A
Ricky Thirion, Group Treasurer, Etihad Airways

World Financial Symposium 2014 World Financial Symposium 2014
Track Closure
Vijay Panday
Director, Group Treasury and Risk
KLM