building assessment of radon reduction interventions with
TRANSCRIPT

ORNL/TM-2020/1769
Building Assessment of Radon Reduction Interventions with Energy Retrofits Expansion (The BEX Study): Final Report
Paul W. Francisco Stacy Gloss Jonathan Wilson Yigang Sun Sherry L. Dixon Zachary Merrin Jill Breysse Ellen Tohn David E. Jacobs
September 2020
Approved for public release. Distribution is unlimited.

DOCUMENT AVAILABILITY Reports produced after January 1, 1996, are generally available free via US Department of Energy (DOE) SciTech Connect. Website www.osti.gov Reports produced before January 1, 1996, may be purchased by members of the public from the following source: National Technical Information Service 5285 Port Royal Road Springfield, VA 22161 Telephone 703-605-6000 (1-800-553-6847) TDD 703-487-4639 Fax 703-605-6900 E-mail [email protected] Website http://classic.ntis.gov/ Reports are available to DOE employees, DOE contractors, Energy Technology Data Exchange representatives, and International Nuclear Information System representatives from the following source: Office of Scientific and Technical Information PO Box 62 Oak Ridge, TN 37831 Telephone 865-576-8401 Fax 865-576-5728 E-mail [email protected] Website http://www.osti.gov/contact.html
This report was prepared as an account of work sponsored by an agency of the United States Government. Neither the United States Government nor any agency thereof, nor any of their employees, makes any warranty, express or implied, or assumes any legal liability or responsibility for the accuracy, completeness, or usefulness of any information, apparatus, product, or process disclosed, or represents that its use would not infringe privately owned rights. Reference herein to any specific commercial product, process, or service by trade name, trademark, manufacturer, or otherwise, does not necessarily constitute or imply its endorsement, recommendation, or favoring by the United States Government or any agency thereof. The views and opinions of authors expressed herein do not necessarily state or reflect those of the United States Government or any agency thereof.

ORNL/TM-2020/1769
Energy and Transportation Science Division
BUILDING ASSESSMENT OF RADON REDUCTION INTERVENTIONS WITH ENERGY RETROFITS EXPANSION (THE BEX STUDY): FINAL REPORT
Paul W. Francisco1 Stacy Gloss1
Jonathan Wilson2 Yigang Sun1
Sherry L. Dixon2 Zachary Merrin1
Jill Breysse2 Ellen Tohn3
David E. Jacobs2
1University of Illinois at Urbana-Champaign 2National Center for Healthy Housing 3Tohn Environmental Strategies
September 2020
Prepared by OAK RIDGE NATIONAL LABORATORY
Oak Ridge, TN 37831-6283 managed by
UT-BATTELLE, LLC for the
US DEPARTMENT OF ENERGY under contract DE-AC05-00OR22725

iii
CONTENTS
FIGURES ................................................................................................................................................ v TABLES ................................................................................................................................................ vi LIST OF ACRONYMS AND ABBREVIATIONS ................................................................................ vii EXECUTIVE SUMMARY .................................................................................................................. viii 1. INTRODUCTION ......................................................................................................................... 10
1.1 RADON ............................................................................................................................... 10 1.2 WEATHERIZATION .......................................................................................................... 10 1.3 PREVIOUS STUDIES ......................................................................................................... 11 1.4 CURRENT STUDY ............................................................................................................. 12
2. METHODOLOGY ........................................................................................................................ 13 2.1 STATE SELECTION ........................................................................................................... 13 2.2 SUBGRANTEE SELECTION ............................................................................................. 14 2.3 SUBGRANTEE TRAINING ................................................................................................ 14 2.4 MONITORING SITES / TESTING ...................................................................................... 15
2.4.1 Control Homes ........................................................................................................ 15 2.4.2 Treatment Homes .................................................................................................... 16 2.4.3 Treatment Home Retrofit Measures ......................................................................... 17 2.4.4 Selection Criteria ..................................................................................................... 17
2.5 INSTRUMENTATION ........................................................................................................ 18 2.5.1 Control Homes ........................................................................................................ 18 2.5.2 Treatment Homes .................................................................................................... 20
2.6 QUALITY CONTROL ........................................................................................................ 21 2.6.1 Radon Testing ......................................................................................................... 21 2.6.2 Radon Instrument/Equipment Testing, Inspection, and Maintenance ........................ 22 2.6.3 Non-Radon Field Data Quality Control Checks ........................................................ 22
2.7 ANALYSIS CALCULATIONS ........................................................................................... 22 2.7.1 Infiltration Calculations ........................................................................................... 22 2.7.2 Radon Changes – Arithmetic vs. Geometric Means .................................................. 23 2.7.3 Statistical Methods .................................................................................................. 24 2.7.4 Consideration of Outliers ......................................................................................... 25
2.8 PARTICIPANT NOTIFICATION ........................................................................................ 26 3. SAMPLE CHARACTERISTICS ................................................................................................... 28
3.1 LOCATIONS/RADON ZONES ........................................................................................... 28 3.2 SITE CHARACTERISTICS................................................................................................. 28 3.3 INTERVENTION WORK COMPLETED ............................................................................ 32
4. RESULTS ..................................................................................................................................... 35 4.1 MEASURED RADON LEVELS .......................................................................................... 35 4.2 CHANGE IN RADON LEVELS .......................................................................................... 40
4.2.1 Control Adjustment ................................................................................................. 40 4.2.2 Control-Adjusted Changes in Radon Levels, Arithmetic Means ............................... 43 4.2.3 Control-Adjusted Changes in Radon Levels, Geometric Means ................................ 44 4.2.4 Change in Radon Levels Explanatory-Variable Analyses ......................................... 45
4.3 LONG-TERM RADON MEASUREMENTS ....................................................................... 47 4.4 PERSISTENCE OF RADON IMPACTS .............................................................................. 48
5. DISCUSSION ............................................................................................................................... 51 6. CONCLUSIONS ........................................................................................................................... 52
6.1 PRECAUTIONARY MEASURE IMPLEMENTATION ...................................................... 52 6.2 CHANGES IN RADON ....................................................................................................... 52

iv
6.3 EXPLANATORY VARIABLES .......................................................................................... 52 6.4 PERSISTENCE.................................................................................................................... 53
7. RECOMMENDATIONS ............................................................................................................... 54 REFERENCES...................................................................................................................................... 55 APPENDIX A. DATA COLLECTION FORM .................................................................................... A-1 APPENDIX B. PARTICIPANT SAMPLE LETTER ........................................................................... B-1

v
FIGURES
Figure 1. US Environmental Protection Agency (EPA) radon zone map (EPA). ..................................... 11 Figure 2. Participating states in the BEX study....................................................................................... 13 Figure 3. Cable connecting printer port to Raspberry Pi computer. ......................................................... 19 Figure 4. Electret readout....................................................................................................................... 20 Figure 5. Outlier determination in BEX study homes. ............................................................................ 26 Figure 6. Decision flow for homes with pre-weatherization radon levels below 4 pCi/l. ......................... 27 Figure 7. BEX study site locations detail (Illinois, upper left; New Hampshire, upper right;
Colorado, middle left; Iowa, middle right; Pennsylvania, lower left; Tennessee, lower right). ....................................................................................................................................... 29
Figure 8. Foundation distribution across sample (LLL – lowest living level). ......................................... 30 Figure 9. Distribution of homes with exposed dirt prior to weatherization across sample. ....................... 31 Figure 10. Radon levels for all homes in the six states studied. ............................................................... 35 Figure 11. Measured indoor radon levels in treatment homes, pre-weatherization. .................................. 36 Figure 12. Measured indoor radon levels in treatment homes, post-weatherization. ................................ 36 Figure 13. Measured indoor radon levels in treatment homes, 1-year post-weatherization. ..................... 37 Figure 14. Control home radon levels over the winter of 2016–17. ......................................................... 41 Figure 15. Control home radon levels over the winter and spring of 2016–17. ........................................ 41 Figure 16. Control home radon levels in the winter of 2017. .................................................................. 42 Figure 17. Control home hourly radon levels from December 10, 2018 through January 7, 2019. ........... 42 Figure 18. Time between pre- and post-weatherization radon monitoring (left) and between pre-
weatherization and one-year follow-up radon monitoring (right)................................................ 49

vi
TABLES
Table 1. Examples demonstrating the difference in perceived outcomes using difference-of-differences vs. ratio-of-ratios ..................................................................................................... 23
Table 2. Radon zone sample distribution by study .................................................................................. 28 Table 3. Pre-weatherization housing characteristics by state ................................................................... 30 Table 4. Frequency of measures by state ................................................................................................ 33 Table 5. Significant variables from model to predict natural log-transformed pre-weatherization
basement radon (state not included as a predictor except where noted) ...................................... 38 Table 6. Significant variables from model to predict natural log-transformed pre-weatherization
first-floor radon (state not included as a predictor except where noted) ...................................... 39 Table 7. Changes in arithmetic mean radon from pre-weatherization to post-weatherization, pCi/l
(±90% confidence interval) ....................................................................................................... 43 Table 8. Relative changes in geometric mean radon from pre-weatherization to post-
weatherization and 90% confidence intervals ............................................................................ 44 Table 9. Geometric mean pre-weatherization radon and percent reduction in geometric mean
radon (control-adjusted) – lowest living level by state – outliers excluded ................................. 45 Table 10. Significant variables from the model used to predict natural log-transformed pre-post
changes in control-adjusted basement radon levels (state variable not included as a predictor except where noted) ................................................................................................... 46
Table 11. Significant variables from model to predict natural log-transformed pre-post changes in control-adjusted first floor radon levels (state variable not included as a predictor except where noted) ............................................................................................................................. 47
Table 12. Changes in geometric mean radon from post-weatherization to one-year and 90% confidence intervals .................................................................................................................. 49

vii
LIST OF ACRONYMS AND ABBREVIATIONS
ASHRAE American Society of Heating, Refrigeration, and Air-Conditioning Engineers BARRIER HUD-funded Building Assessment of Radon/Moisture Reduction with Energy Retrofits
study BEX BARRIER Expansion study Bq/m3 Becquerels per cubic meter CFM cubic feet per minute cpm counts per minute CRM continuous radon monitor DCF data collection form DOE US Department of Energy EPA US Environmental Protection Agency HUD US Department of Housing and Urban Development IAQ indoor air quality ICRT Indoor Climate Research & Training ID identification number LLL lowest living level NCHH National Center for Healthy Housing ORNL Oak Ridge National Laboratory pCi/l picocuries per liter PI principal investigator QC quality control RPD relative percent difference SD secure digital USB universal serial bus WAP Weatherization Assistance Program WPN Weatherization Program Notice

viii
EXECUTIVE SUMMARY
In partnership with the US Department of Energy (DOE) low-income Weatherization Assistance Program (WAP) and the US Environmental Protection Agency (EPA), a study was performed to assess whether current precautionary measures used by WAP are effective for preventing radon increases following weatherization. This work followed previous studies, including the Oak Ridge National Laboratory (ORNL) Indoor Air Quality (IAQ) Study that showed a statistically significant increase in radon levels in homes following weatherization (Pigg et al. 2014).
The WAP reduces energy costs for low-income households by improving energy efficiency of the home while maintaining health and safety. Air sealing tightens the building envelope, thus reducing air exchange and outdoor air supply. The replacement of atmospherically-vented appliances with models that draw combustion air directly from outdoors rather than from within the house also acts to decrease air infiltration into the home. It is theorized that indoor radon levels could increase as a result of these measures.
This study explored whether current, updated weatherization practices, including a package of simple, inexpensive precautionary measures currently implemented in the context of weatherization, limit radon exposures. This package of measures includes the installation of the following when applicable: mechanical ventilation, plastic ground covers over bare dirt foundation floors, and sealed sump pump covers.
The study was conducted in the following six states with the cooperation and partnership of WAP state Grantees and Subgrantees who administer the WAP: Illinois, New Hampshire, Colorado, Iowa, Pennsylvania, and Tennessee. This study included the measurement of radon levels on the first floor and in the basement (if present) of 276 treatment homes using Rad Elec E-Perm® electret ion chambers. The electrets were deployed for approximately two weeks at each home before weatherization, after weatherization, and one year later when possible. The changes in indoor radon levels measured in the treatment homes were adjusted based on data measured from 52 control homes in the same vicinity. These control adjustments were intended to account for influences due to environmental factors; the adjustments do not address differences in site factors such as mechanical systems operation. Treatment homes that experienced radon changes by more than a factor of three were considered to be outliers, which is consistent with Pigg et al. (2014).
The study results show that current practices have produced substantial benefit compared to previous practices, and that there are no statistically significant changes in indoor radon levels on the lowest living levels with these practices. Using what we consider to be the best analysis approach—control-adjusted geometric means with outliers removed—resulted in no change in the average indoor radon levels measured on the lowest living levels in WAP homes using current practices. Using the same approach as that used in the WAP IAQ study showed a 5% increase in indoor radon levels on the lowest living level, an increase that is not statistically significant. These results demonstrate a substantial improvement compared to the WAP IAQ study, which showed a 22% increase in control-adjusted arithmetic means that was statistically significant. The results do suggest that, on average, radon levels in basements have a greater potential to increase following weatherization than do radon levels on first floors.
Persistence was also evaluated by comparing control-adjusted post-weatherization radon levels to those measured one year later. This analysis found that further improvements in radon concentrations had occurred one year after weatherization had been conducted. For the 122 homes in which a one-year follow-up test was conducted, the lowest living levels experienced an average 10% reduction in radon levels compared to the levels measured post-weatherization, which was statistically significant. The mechanisms for these improvements are not clear, but when combined with the results comparing pre-

ix
and post-weatherization radon levels, this analysis suggests that there was a long-term radon level reduction of 5–10%.
Long-term radon tests (91+ days) were conducted in 26 homes in which the radon level on the lowest living level went from below 4 picocuries per liter (pCi/l) (148 Becquerels per cubic meter [Bq/m3]) prior to weatherization to above 4 pCi/l following weatherization. Test results showed that only four of these homes had long-term levels above 4 pCi/l. This implies that, while short-term tests may often be suitable to identify homes with inherently high or low radon levels, they are not sufficiently reliable to determine increases in radon due to retrofit in an individual home due to the variability of radon over time relative to the potential magnitude of retrofit-induced changes.
RECOMMENDATIONS
• Due to substantially reduced changes in radon levels associated with the package of precautionary measures implemented in the study compared with the changes found in the WAP IAQ study, especially in the lowest living levels, WAP should continue implementing this package of precautionary measures (when applicable) in locations where elevated radon levels are reasonably expected.
• The study showed that radon levels in basements have a greater potential to increase following weatherization than on first floors. As a result,
o WAP may consider requiring non-exhaust methods of ventilation (e.g., supply or balanced), or exhausting directly from the basement when sleeping facilities are located in basements, regardless of whether these basements have defined bedrooms.
o WAP may consider recommending non-exhaust methods of ventilation or
exhausting directly from the basement when the basement is the lowest living level, independent of whether sleeping facilities are located in the basement.
o In either case, since many contaminants can primarily be generated on above-grade floors, if basement exhaust is used it may be appropriate to install two fans: one in the basement and one above grade. If basement exhaust is installed, then it is imperative to ensure that any natural draft combustion appliances in the basement can still draft properly.

1. INTRODUCTION
In partnership with the US Department of Energy (DOE) low-income Weatherization Assistance Program (WAP) and the US Environmental Protection Agency (EPA), a study was performed on the impacts of weatherization on indoor radon levels. The study was conducted in six states with the cooperation and partnership of WAP state Grantees and Subgrantees who administer the WAP. The WAP reduces energy costs for low-income households by improving the energy efficiency of the home while maintaining health and safety. Weatherizing homes typically includes air sealing the building envelope, insulating attics and walls, making mechanical repairs, and replacing space and water heating systems. Energy retrofits are often accompanied by targeted health and safety measures related to the energy conservation measures being implemented.
Air sealing tightens the building envelope, thus reducing air exchange and outdoor air supply. It is theorized that indoor radon levels could increase as a result of these energy saving measures. In a previous Oak Ridge National Laboratory (ORNL) study of weatherization impacts on the indoor air quality (IAQ) of 500 homes, testing took place in 2010 and 2011, and average increases in radon levels were found in the homes (Pigg et al. 2014). The study described herein explored whether current, updated weatherization practices, including simple, inexpensive measures currently implemented in the context of WAP, limit radon exposures.
1.1 RADON
Radon is a naturally occurring, colorless, odorless radioactive gas. It is generated as part of the uranium decay chain and occurs naturally in soil and rock. It enters buildings through fractures and porous materials, and it can collect in high concentrations in certain areas. Radon exposure is considered the leading cause of lung cancer among nonsmokers and the second leading cause of lung cancer overall, causing an estimated 21,000 deaths annually in the United States, making it one of the leading causes of housing-related disease (EPA 2003). Studies combining data from several residential studies show definitive evidence of an association between residential radon exposure and lung cancer (Darby et al. 2005, Darby et al. 2006, Krewski et al. 2006).
The worldwide average indoor radon concentration is estimated at 1.3 picocuries per liter (pCi/l) (UNSCEAR 2008). As shown in Figure 1, housing with high radon concentrations is more prevalent in certain regions of the United States (US EPA https://www.epa.gov/radon/epa-map-radon-zones).
1.2 WEATHERIZATION
Energy conservation in residential structures is increasing in frequency and scope in an effort to alleviate the significant fraction of the nation’s energy consumption associated with residential building operation and to reduce associated energy costs for families. Common cost-effective home energy retrofits intentionally reduce air exchange through air sealing, resulting in a potential increase in indoor contaminant concentrations, including radon. It is also common for older combustion (e.g., natural gas, fuel oil, propane) heating systems, which use and exhaust house air for combustion, to be replaced with newer systems that bring combustion air directly from outdoors. This also has the side effect of reducing the air exchange rate in homes.
The WAP recognizes the need to consider health and safety as part of the retrofit process and mandates health and safety measures as appropriate. For example, DOE’s Weatherization Program Notice (WPN) 17-7 (and former 11-6), “Weatherization Health & Safety Guidance” (US DOE 2011, US DOE 2017), requires WAP projects to meet American Society of Heating, Refrigeration, and Air-Conditioning

Figure 1. US Environmental Protection Agency (EPA) radon zone map (EPA).
Engineers (ASHRAE) Standard 62.2 (ASHRAE 2016) for ventilation, as well as a requirement to cover exposed dirt with a vapor barrier. The ASHRAE requirement would increase dilution in above-grade spaces, and the requirement to use a vapor barrier may inhibit radon entry. Both of the WPN 11-6 and 17-7 guidance documents state that, in homes where radon may be present, precautions should be taken to reduce the likelihood of exacerbating radon issues.
The metric many retrofit programs use for radon differs from the usual comparison to a threshold. For example, EPA recommends mitigation at levels ≥ 4 pCi/l (CFR 1983). In many retrofit programs, including the WAP, the objective is to “do no harm”. Before weatherization, a home may have radon concentrations above the EPA threshold for mitigation, and while it would be desirable to mitigate this if possible, a pre-existing problem may not be treatable by a retrofit program. In the case of WAP, mitigation is not permitted per statute. Retrofit programs typically aim to not exacerbate an existing problem, which is consistent with the aims of the EPA Healthy Indoor Environment Protocols (US EPA 2011). Therefore, a post-retrofit radon level higher than 4 pCi/l but lower than the pre-retrofit level is considered an improvement.
1.3 PREVIOUS STUDIES
The results addressed in this study are the culmination of a series of field studies, as discussed below. The previous studies explored how radon levels changed in homes that underwent energy retrofits and described the effects of targeted radon migration prevention measures. These studies were done primarily in the context of the DOE WAP, but their results and conclusions readily apply to the broader home performance industry.

An IAQ assessment published by ORNL in 2014 (ORNL/TM-2014/170) as part of its national evaluation of the WAP found that homes weatherized by WAP in 2010 and 2011 had a statistically significant post-weatherization increase in arithmetic mean radon concentration of 0.44 ± 0.22 pCi/l (Pigg et al. 2014). This study is referred to as the WAP IAQ study throughout this report. Weatherized homes had a statistically significant increase of 0.44 pCi/l (22%) in control-adjusted arithmetic mean indoor radon concentration at the home’s lowest living level,1 with a 90% confidence interval of ±0.22 pCi/l (Pigg et al. 2017). In the WAP IAQ study, which included 285 treatment single-family homes and 162 control single-family homes, the basement was the lowest living level in one-third of the homes and the first floor was the lowest living level in the other two-thirds. A follow-up study assessed the impact of exhaust ventilation complying with ASHRAE Standard 62.2-2010 (ASHRAE 2010) on radon levels in 18 weatherization homes (Pigg 2014, ORNL-TM-2014/367) and found that the ventilation had a marked beneficial impact in many homes. However, the small sample size precluded statistically significant results.
Another study found that the post-weatherization radon levels in 51 homes that complied with the 2010 version of the ASHRAE 62.2 ventilation standard (ASHRAE 2010) declined 32% on the first floor, but increased by 29% in the basement (Francisco et al. 2017). These changes were statistically significant for both locations at a 90% confidence level.
The Building Assessment of Radon/Moisture Reduction with Energy Retrofits (BARRIER) study (Francisco et al. 2019) evaluated changes in radon in the context of weatherization in 98 treatment homes in two states when a set of precautionary measures was implemented, including exhaust ventilation, well-sealed ground covers, and sealed sump pump covers, whenever each was applicable. The BARRIER study found that that there were no statistically significant increases in radon in the lowest living level, in contrast to the WAP IAQ study findings. It was recommended that energy efficiency programs and projects should incorporate these measures, which include ventilation, well‐installed ground covers over bare dirt at the foundation level, and sealed sump pumps. These efforts can help maintain or improve health and safety in the home while achieving overall energy efficiency benefits. The BARRIER study was funded by the US Department of Housing and Urban Development (HUD).
1.4 CURRENT STUDY
This study, which is referred to as BEX (BARRIER Expansion), evaluates changes in radon in the context of retrofits carried out by WAP Subgrantees as currently implemented in an additional four states, and it combines the data and results with those from the original BARRIER study to produce a six-state sample. As a compilation of the BARRIER and BEX studies, the overall sample is increased by an additional 178 study homes, bringing the total sample size to 276 treatment homes. While the previous studies that were conducted after the WAP IAQ study focused on heating-dominated states in regions with a high percentage of basement foundation types, the BEX study also includes one state (Tennessee) with a substantial cooling load and with a majority of homes built on crawl space foundations. The core package of precautionary measures included (when applicable) mechanical ventilation, well-sealed ground covers over bare dirt, and sealed sump pumps. Other measures, such as sealing large cracks in foundations, may also have been taken, but these were not rigorously addressed. BEX was funded by DOE with co-funding from EPA.
1 The basement was considered the lowest living level if it had at least 80 square feet of finished area and/or was occupied for at least 8 hours per week.

2. METHODOLOGY
2.1 STATE SELECTION
In the BARRIER study, participating state WAP Subgrantees recruited homes in Illinois and New Hampshire. These states were selected due to relationships with the project team. Most Illinois homes were in the northwest portion of the state, which is in Radon Zone 1 (highest potential, expected average home radon level greater than 4 pCi/l [148 Becquerels per cubic meter (Bq/m3)]), although a set of homes was also measured in the Chicago area, which is in Radon Zone 2 (moderate potential, expected average home radon level between 2 and 4 pCi/l [74 to 148 Bq/m3]). All New Hampshire homes were in Radon Zone 2.
The BEX study builds on the BARRIER study through additional testing in four states, increasing both the sample size and the geographic scope of the study to six states in the United States. Figure 2 shows the six states included in the BEX study.
Figure 2. Participating states in the BEX study.
With the support of the US DOE WAP and state Grantees, four states—Colorado, Iowa, Pennsylvania, and Tennessee—were recruited for BEX. All monitoring locations in these four states were in either Radon Zone 1 (Colorado, Iowa, and Pennsylvania) or Radon Zone 2 (Tennessee). In addition to willingness and capacity to partner on the project, each state was selected for a specific reason:
• Colorado was selected because it was the state where the original EPA work was performed to measure radon levels in homes and to determine a mitigation action level, which was established as 4 pCi/l. The EPA conducted this work in the early 1980s due to questions regarding higher-than-expected lung cancer levels in families living near uranium mill tailings impoundments (CFR 1983).

• Iowa is considered to have the largest percentage of homes above the EPA action level of 4 pCi/l and the highest average statewide levels in a study of 30 states (White et al. 1992). The Iowa Department of Public Health states that Iowa is an “entirely zone 1 state” (https://idph.iowa.gov/radon/resources).
• Pennsylvania is thought to have some of the highest individual-home radon levels in the United States, with some homes having been measured at greater than 3,500 pCi/l.
• Tennessee has higher levels of radon than most states in the southern portion of the United States, based on the EPA Map of Radon Zones (see Figure 1) Tennessee provided an opportunity to conduct testing in a state with a larger cooling load than the other states included in the study, and in which most houses participating in the study would be built on crawl spaces.
2.2 SUBGRANTEE SELECTION
Iowa, Pennsylvania, and Colorado WAP Subgrantees were selected based on serving counties in Radon Zone 1. In Colorado, three Subgrantees participated, covering four regional locations, one of which was on the western side of the Rocky Mountains. The Subgrantee on the western side of the Rocky Mountains has very different geology, and often had much higher radon levels than those located along the Colorado front range to the east of the Rocky Mountains.
Three weatherization Subgrantees participated in Iowa, each of which was located in the central part of Iowa and had similar geography, although the southern Subgrantee’s territory was somewhat hillier and more rural. The Subgrantees were located northeast, northwest, and south of Des Moines.
In Pennsylvania, the four participating Subgrantees covered five geographical areas. One Subgrantee covered two geographical areas, and for purposes of reporting was considered as two separate Subgrantees due to the distance between offices and the separation between weatherization personnel, as well as the regional differences: one area was more urban and nearer to Harrisburg and the other was in a more rural region south of Harrisburg.
Tennessee geography includes each of the three EPA radon zones. The two Tennessee Subgrantees selected for the project serve homes in all three zones but are predominantly in Radon Zone 2. For the purpose of this project, homes from Radon Zone 2 were recruited.
2.3 SUBGRANTEE TRAINING
Subgrantee personnel designated to work on the project were provided training on study protocols through a number of conference calls and training site visits. Research project staff held kick-off meetings about the study by phone to explain general project requirements. For each state, a one-day, in-person meeting was held at a central location so that staff from each Subgrantee could attend. The principal investigator (PI) and/or a research specialist from the Illinois-based Indoor Climate Research & Training group (ICRT) attended and trained Subgrantee staff on the study’s purpose and procedures through a classroom session and an in-field site visit to demonstrate and review procedures. Subgrantee staff were trained on multiple aspects of the study, including:
• Background information about the radon study
• Background information on radon in homes, including risks and sources
• An introduction to all study forms, including the data collection form (DCF) and the participation agreement forms

• Instructions for completing the DCF version (shown in Appendix A) used by the additional four states
• Diagnostic tests required for both treatment and control homes to be recorded on the DCF
• Installation of continuous radon monitors in the control homes
• Deployment of passive radon samplers for the treatment homes
• Identification of appropriate placement locations for the samplers in homes
• Instructions for taking relevant photos
• Instructions on using a cloud-based online data sharing repository such as box.com for the project, and directions for naming and organizing files using that system
• Procedures for radon mitigation after post-testing is complete (if needed)
These in-person meetings were held with Subgrantee staff in all participating states. In addition, the research specialist visited each participating Subgrantee to review the project testing and data collection procedures. The research specialist also conducted site visits with the energy auditors to review the study procedures at a treatment home and a control home.
2.4 MONITORING SITES / TESTING
2.4.1 Control Homes
Since radon is highly variable with time, in part due to environmental factors such as outdoor temperature, simply comparing radon results before and after energy retrofit is inadequate to assess the impacts of retrofits. Pigg et al. (2017) found that energy upgrades through WAP using program rules from 2010 resulted in radon increases of about 22% in control-adjusted arithmetic means, whereas radon levels within a home can vary by a factor of five or more over time (Steck 2005 and as seen in this study’s control homes [see Section 4.2]). Because weather was different in pre- and post-weatherization periods for treatment homes, control homes were included in the study design. The BARRIER states included two control homes per Subgrantee (four in Chicago), for a total of twelve control homes across the two states. Ten control homes were recruited from each of the additional BEX states, with the goal of having these homes monitored for the duration of the testing seasons throughout the three-year study. In Pennsylvania, two additional control homes were monitored due to the addition of a Subgrantee in the second year of the study. Across the six states, there were then 54 control homes. Often, control homes came from a pool of personal contacts of the weatherization Subgrantee staff involved with the project and were non-WAP homes. Control homes were selected to be of similar construction as common treatment homes, especially regarding foundation type. In each project area, the fraction of control homes with basements vs. crawl spaces was intended to mirror the Subgrantee’s experience regarding prevalence of each foundation type in their client population. These control homes did not receive any energy upgrades over the course of the study and were not provided compensation for participation, but they were provided with a report of the radon levels measured in their homes. Residents were asked to keep doors and windows closed during monitoring periods. The changes in radon levels in the control homes were used to adjust the radon results in treatment homes for weather factors contributing to naturally occurring radon fluctuations in a home. Matching between treatment and control homes was based first on foundation type and second on proximity. The adjustments do not account for other factors that influence radon levels, such as how residents operate their homes (e.g. use of ventilation) or site-specific geology.

Control homes were assigned to each of the Subgrantees so that the control homes would be relatively near the weatherization homes of each Subgrantee. The number of control homes assigned to a given Subgrantee was proportional to the number of homes expected to be weatherized by that Subgrantee. Subgrantees that had fewer homes weatherized during their program year were expected to include fewer control homes.
2.4.2 Treatment Homes
Each of the additional four states was requested to produce 50 treatment homes for inclusion in the research study, for a target of 200 weatherized homes with both pre- and post-weatherization radon tests to provide sufficient power. The data from these homes would then be combined with data from the homes in the two states in the BARRIER study. This study aimed to have a relatively even distribution of homes between geographical areas tested by each Subgrantee. However, some Subgrantees provided more homes than others, depending on their state’s funding allocation, Subgrantee size, number of counties served, staffing levels, and general ability to weatherize homes in any given year. Another factor that contributed to the varying number of weatherized homes in the radon study among Subgrantees across the states was staff turnover, which resulted in re-training needs.
Radon tests were conducted in treatment homes before the weatherization/retrofit measures were installed. Reaching 50 post-tested homes for each state required pre-testing more than 50 homes, because radon levels were not known until after the pre-weatherization testing was complete, and some homes were ineligible since they were below the project’s minimum radon levels of 2.7 pCi/l in Radon Zone 1 regions and 1.5 pCi/l in Radon Zone 2 regions. The number of additional homes varied by state. For example, in Pennsylvania, about half of the homes tested before weatherization were removed from the study due to having radon levels below 2.7 pCi/l in the lowest living level. In contrast, over 80% of Iowa homes met the minimum threshold.
Pennsylvania had a policy to defer weatherization activities in homes with radon levels exceeding 4 pCi/l prior to weatherization. The research project team obtained permission from DOE to conduct the research in such homes via a waiver that allowed state training and technical assistance funds to be used for mitigation in participating project homes with post-weatherization radon levels exceeding 4 pCi/l.
Radon samplers were deployed for approximately two weeks at each home before and after retrofit, and another measurement was taken one year later when possible. Samplers at treatment homes were electret ion chambers (referred to as “electrets”). The research team specified that the post-weatherization radon test should be placed no earlier than 24 hours after the final inspection of the weatherization measures was conducted to allow systems in the house to settle into their new state of equilibrium. One-year post-weatherization was specified as testing the home for radon 1 year after the post-test.
In addition to recording electret information on DCFs, field staff entered data on the following characteristics of treatment homes:
• house exterior
• foundation
• kitchen and bathroom exhaust fans
• primary heating system
• water heating system

• house airflow diagnostics, including blower door tests, zone pressure diagnostics, and air handler–induced pressures, if applicable
• weatherization work completed
2.4.3 Treatment Home Retrofit Measures
All treatment homes qualified for weatherization and received energy retrofit measures. Measures implemented varied according to the energy auditors’ recommendations and the energy auditing software used in each state. Generally, weatherization homes received a suite of retrofits, including:
• Air-sealing and insulating work in the attic, exterior walls, foundations, and rim joists, which tightens the building envelope and reduces the airflow measured in cubic feet per minute (CFM) at 50 Pascals (Pa) using a blower door;
• Health and safety measures, including mechanical ventilation to meet ASHRAE 62.2 ventilation requirements (not required in the WAP IAQ study);
• Installation of sealed sump pit covers (not required in the WAP IAQ study);
• Space and water heating equipment may be replaced or repaired/tuned.
• Well-sealed ground cover installation in homes with crawlspaces and basements having bare dirt floors (less rigorous in the WAP IAQ study).
2.4.4 Selection Criteria
Treatment homes represented a convenience sample of WAP-participating homes, meaning that specific homes were not targeted but rather they were enrolled as they came into the program as long as they met the eligibility criteria. Homes were eligible for enrollment in the BEX study if they met the following criteria:
• Must be a single-family detached home.
• Must have a basement or crawl space present (no slab-on-grade homes). Homes with combination foundations of both a basement and one or more crawl space sections were eligible and were classified as basement homes because the presence of a basement typically corresponds to greater thermal and air connection between the foundation space and the first floor.
• Manufactured homes could only be included in the study if they were placed on a permanent dug foundation (either basement or crawl space). Manufactured homes, as typically set on a pad with metal skirting around the perimeter, were excluded.
• Homes in EPA Radon Zone 1 were required to have pre-retrofit radon levels of at least 2.7 pCi/l (100 Bq/m3) in the lowest living level.
• Homes in EPA Radon Zone 2 were required to have pre-retrofit radon levels of at least 1.5 pCi/l (55 Bq/m3) in the lowest living level. This eligibility criterion was added after initial pre-testing began in Tennessee, when it was determined that Tennessee had lower average radon levels than the other three states, which was consistent with being predominantly in Radon Zone 2. Eligibility in

Tennessee proved challenging with the 2.7 pCi/l criterion. This revised minimum value also matched the minimum qualification required for eligibility in the BARRIER study.
• Must not have any existing passive or active radon control systems in place.
• A signed occupant agreement was required for a home to participate.
The lowest living level could be either the basement or first floor, depending on the home. The basement qualified as the lowest living level if it was either suitable for occupancy or occupied. A basement was defined as being suitable for occupancy if the following criteria were met:
1. The floor area was 80+ square feet and the average ceiling height was 6+ feet,
2. 50% or more of the wall area was finished with a material other than bare or painted concrete or concrete block, and
3. At least one heating register or other permanent space heating source or heating outlet was present in the area.
An unfinished basement could be designated as occupied if the occupant stated that the space was occupied more than 8 hours per week. All finished basements qualified as the lowest living level in the home for purposes of evaluating radon results and determining eligibility for radon mitigation according to project rules. If the basement was neither occupied nor suitable for occupancy, then the lowest living level was the first floor of the home.
Generally, homes were recruited by a Subgrantee staff person (typically the energy auditor), who informed the weatherization client about the study during the initial energy audit visit. The homeowner / primary occupant was offered detailed information about the research study and the testing procedures, including the two-week radon test before and after weatherization activities and the two-week radon test one year later. The occupant was notified about compensation, including a $10 gift card for having the radon test before weatherization, a $20 gift card for the radon test after weatherization, and a $20 gift card for the radon test one year later. The occupant signed a participant agreement form and was provided a copy for their records.
The pre-retrofit radon levels were obtained following an initial test. Subgrantee partners were trained to return radon samplers as soon as possible for analysis. For homes that had initial radon levels below the eligibility threshold, Subgrantees were directed by research team members to remove the home from the study.
Because none of the homes were in Radon Zone 3 and the study excluded homes on slabs, mobile/manufactured homes without a permanent foundation, single-family attached homes, and multifamily units, the sample cannot be viewed as representative of the population of residences served by the WAP as a whole.
2.5 INSTRUMENTATION
2.5.1 Control Homes
Control homes were monitored using continuous radon monitors (CRMs) that recorded radon at hourly intervals. For any treatment home, the corresponding average radon level for the concurrent two-week period of data obtained from the CRMs was used for the adjustment. CRMs, which are much more

expensive than electrets, were used in control homes because it was not logistically practical to install a new set of electrets in control homes each time a new treatment home was instrumented. A comparison between CRM and electret ion chamber measurements (used in treatment homes) under closed-home conditions was conducted by the research team by placing CRMs and electrets in the same portion of a basement in a home with known elevated radon levels. This comparison found that the CRM and electret ion chamber measurements agreed to within about 5% over a two-week period.
Control homes with basements had CRMs installed in both the basement and on the first floor. Homes with crawlspaces only received a CRM on the first floor. Occupants were asked to participate for the duration of the three-year study; however, not all control home occupants agreed to participate in subsequent years. When a control home withdrew from the study, the Subgrantee associated with that home was tasked with finding a suitable replacement.
The CRM monitoring equipment used for control homes was the AccuStar RadStar RS300 (nominal sensitivity: 0.4 counts per minute [cpm]/pCi/l) connected to a Raspberry Pi computer that accepted a “continuous print” of hourly radon data from the CRM (see Figure 3). The on-board computer included a Wi-Fi universal serial bus (USB) network adapter to connect to a home Wi-Fi system when present. A Linux-based system that had been previously been developed for ICRT was installed on the computers.
Figure 3. Cable connecting printer port to Raspberry Pi computer.
When the CRM is set to “record on,” the hourly radon measurements print to a file that is saved to the Raspberry Pi every 24 hours. Each day a new file is saved, and the new data are appended to the previous file to minimize data losses. Because the CRMs do not have an internal clock, a research engineer added a real-time clock module to the Raspberry Pi circuit board. When the CRM data “prints”, software (called NodeRed) captures and records the time and radon measurement for each hour. All data files, which contained the CRM identification (ID), the hourly radon concentrations, and their timestamps, were also stored on an on-board secure digital (SD) card. The data in all the SD cards were downloaded and compiled into an Excel file after the instruments were shipped back to the project team after testing was complete.
All CRMs were prepared and shipped to participating Subgrantees for use in the project to be installed by the trained Subgrantee staff. The participating Subgrantees returned the CRMs to the project team for downloading and analysis at the end of the winter (Illinois, New Hampshire, Colorado, Iowa, and Pennsylvania) or summer (Tennessee) testing periods.

Control home data-logging had some reliability issues resulting from the following:
1. Power losses – the CRMs do not have internal batteries, so power outages led to gaps in the data and potential issues when automatically restarting once power returned
2. Cable failure or loose/separated connections
3. Software crashes
4. Incorrect installation procedures
In the analysis, data from control homes were only used for comparison to two-week treatment home measurements when data were present for at least 90% of the measurement period. For cases in which a control home’s data would otherwise have been used in comparison to data from a treatment home (except for missing data), the data from the next nearest control home with sufficient data were used. Comparisons between test periods (pre-to-post, and post-to-one year) used data from the same control home for both comparison periods.
2.5.2 Treatment Homes
Radon levels in each treatment home were measured using passive Rad Elec E-Perm® electret ion chambers (Kotrappa 1999) that provide the average radon level over the period of measurement. Unlike other radon samplers such as charcoal canisters, electret ion chambers (often referred to simply as electrets) use electrically charged media that discharge proportionally to the level of radon in the surrounding air.
Prior to shipping, electrets were cleaned using high-purity nitrogen from a compressed gas cylinder with a handheld nozzle, and their pre-deployment voltage was measured using a Rad Elec Inc. Electret Voltage Reader SPER-1 (E-Reader) (see Figure 4). The voltage readings were recorded in a notebook, along with the date and time of the measurement and the corresponding electret ID. Electrets were packed along with the data collection sheets to record the deployment information, and they were then shipped to weatherization Subgrantees.
Figure 4. Electret readout.
Instrumentation was supplied on a rotating basis. Weatherization Subgrantees generally received enough equipment to test three to five houses, depending on the size of the Subgrantee and the anticipated project

production. After the equipment was deployed and retrieved from the field, it was returned to ICRT. The cycle of preparing, shipping, receiving, and reading equipment was operationalized starting in 2016 through project completion in fall 2019. Equipment handling and data management protocols were followed throughout the project across equipment types.
In homes with only crawl spaces, electrets were deployed only on the first floor. In homes with basements, electrets were deployed on the first floor and in the basement. The research group specified a preference for the radon test to be conducted near the time that weatherization occurred, with the post-test to be deployed shortly after. Residents were instructed to keep windows closed throughout the testing periods.
Samplers were placed in open areas where they were unlikely to be disturbed. Samplers were required to be placed in locations meeting the following criteria:
• at least 20 feet from window air conditioners, ceiling fans, humidifiers or dehumidifiers; • at least 3 feet from exterior doors, windows, and ventilation ducts; • at least 1 foot from exterior walls; • at least 4 feet from heat sources (fireplaces, furnaces, and out of direct sunlight); • between 20 inches and 6 feet from the floor and >1 foot below the ceiling; • at least 4 inches from other objects (horizontally and vertically); and • not in high humidity areas such as bathrooms, kitchens, or laundry rooms.
Once sampling was complete, the electrets were retrieved by Subgrantee staff and were packed and shipped to ICRT, where the voltage levels were read out and radon levels were calculated. The site identifiers, placement locations, and deployment times of the electrets were recorded on the packaged data collection sheet and were entered into an electronic data collection form. The Subgrantee staff deploying the electrets in the home were also instructed to take photos of electret placement locations and all electret IDs. For each home, photos were uploaded to a secure Box.com site folder that was created as a repository for project forms, instructions, and site photos.
Electrets can be inadvertently discharged by inadvertent physical contact with the charged Teflon media during deployment or retrieval or by exposure to large dust or debris particles. To account for this, duplicate electrets were deployed at every sampling location. Inadvertent discharge tends to overestimate radon, so in accordance with the approved Quality Assurance Plan, if the two samplers had substantially different readings, then the lower reading was used. See Section 2.6.1 for additional details.
2.6 QUALITY CONTROL
2.6.1 Radon Testing
In treatment homes, staff deployed duplicate electrets on the first floor and in the basement. The duplicates were assessed using their relative percent difference (RPD)—the difference divided by the mean of the two measurements. For readings with an average of less than 4 pCi/l, the expected RPD was less than 25 percent, and for readings greater than 4 pCi/l, the expected RPD was less than 14 percent. The RPD limit was met in 49% of test results. When the RPD limit was not met, the lower value was generally used because accidental discharge is the primary failure mechanism for electrets, which leads to an overestimation of radon levels. In 1% of cases, when one electret measured close to zero while the other read a plausible value, the higher value was used. In many of these cases, photo evidence showed that one electret was not opened properly.

Blank electret samplers were placed randomly in 5% of homes alongside sampling instruments. Blanks that were not placed in the field were occasionally added to batches of samplers to ensure that the tests were reading zero correctly. Out of 92 blank tests, only three were out of specification, with one electret blank being fully discharged. In these three homes, the non-blank electret recordings did not indicate unreasonable errors, suggesting that the problem was with the electret blank itself.
Spike electrets to represent 3% of the total readings were provided by the manufacturer to ensure that the electret reader was measuring properly. Out of 43 spike tests, only one was out of specification.
The post- and one-year post measurements were retested if the quality assurance process indicated that both electret readings on a given level were suspect. Retesting was conducted at six homes.
2.6.2 Radon Instrument/Equipment Testing, Inspection, and Maintenance
Factory calibrations of the CRMs were conducted by their manufacturers once per year.
To ensure sample integrity throughout the collection and analysis process, ICRT included a list of sample IDs with each shipment to Subgrantees. Subgrantee staff compared the list of sampler IDs to the contents of the shipment and confirmed by email to ICRT that all samplers were received.
Trained Subgrantee personnel placed and retrieved all electrets, recording site IDs, sampler IDs, and dates and times of placement and retrieval on the appropriate Excel DCF. Within two business days of receipt, ICRT staff read the electric voltage and recorded results in a master file.
2.6.3 Non-Radon Field Data Quality Control Checks
The National Center for Healthy Housing (NCHH) quality control (QC) officer extracted summary data from each completed DCF and compiled a master DCF Excel file. In this master file, an Excel comparison program was used to check data completeness and validity and to run range checks for each DCF data point. At least quarterly, the NCHH QC officer ran this comparison program and reported a list of QC issues to the ICRT PI, who in turn resolved QC issues with field staff as needed and updated the QC issues list with corrections and clarifications. The NCHH QC officer then updated the DCF master file.
2.7 ANALYSIS CALCULATIONS
2.7.1 Infiltration Calculations
Natural infiltration in cubic feet per minute (CFM) was calculated using the model upon which the enhanced infiltration model in the ASHRAE Handbook of Fundamentals is based (ASHRAE 2016). This model uses a combination of indoor and outdoor temperatures and physical house characteristics, including building leakage, mechanical ventilation rate, and building height. Homes with continuous mechanical ventilation had half of the measured ventilation rate added to the calculated natural infiltration values. This is based on the model developed by Palmiter and Bond (1991).
For the BARRIER sites included in the earlier study, real-time indoor temperatures were measured using sensors located inside the houses. For the additional four states, indoor temperatures were not measured but were assumed to be 70°F, which was nearly identical to the average found in the WAP IAQ study. Outdoor temperatures were obtained from hourly data from nearby weather stations.

Individual building tightness was measured both before and after the retrofit work using blower door equipment to depressurize a house by 50 Pa while measuring the amount of airflow necessary to maintain that pressure difference (CFM50).
2.7.2 Radon Changes – Arithmetic vs. Geometric Means
There are two plausible methods for applying adjustments to treatment home results using control home results. One is the difference-of-differences approach used in the WAP IAQ study. In this approach, the change in arithmetic mean indoor radon levels from the pre- to post-retrofit periods is calculated for each of the treatment and control homes, and then the average difference between those two group differences is calculated. Negative values indicate a decrease in the arithmetic mean radon level for treatment homes.
The second method is the ratio-of-ratios approach. In this approach, the ratio of the post- to pre-weatherization radon levels is calculated for each treatment and control home, the treatment ratio is adjusted by the control ratio for each home, and then the geometric mean of these adjustments is calculated. This approach has the same concept as the difference-of-differences approach, except it assumes that the post-weatherization radon level has a relative change from the pre-weatherization radon level as opposed to an actual change. The geometric mean is more robust to outliers than the arithmetic mean. Values of less than 1 indicate a decrease in the geometric mean radon level for treatment homes.
Table 1 shows how these two approaches differ in their outcomes. The first row shows data for a treatment home that went from 6 pCi/l pre-retrofit to 9 pCi/l post-retrofit, with a corresponding control home that went from 3 pCi/l pre-retrofit to 5 pCi/l post-retrofit. The pre- and post-retrofit periods corresponded to those applicable to the treatment home, since the control home did not actually receive a retrofit. The last row of the table shows data that assume the same treatment home, but with a control home with much higher readings, going from 30 pCi/l pre-retrofit to 35 pCi/l post-retrofit.
Table 1. Examples demonstrating the difference in perceived outcomes using difference-of-differences vs. ratio-of-ratios
Unadjusted values (pCi/l) Difference (post-pre) (pCi/l)
Diff-of-diffs (pCi/l) Ratio (post/pre) Ratio-of-
ratios Treatment Control Treatment Control Trt-Ctrl Treatment Control Trt/Ctrl Pre Post Pre Post 6 9 3 5 3 2 1 1.5 1.67 0.9 6 9 30 35 3 5 -2 1.5 1.17 1.29
In the first case, the difference-of-differences approach shows that the treatment home increased by 1 pCi/l more than the control, so using this metric, indoor radon levels in the treatment home apparently fared “worse”. However, using the ratio-of-ratios approach, the treatment home only increased by 50% whereas the control home increased by 67%, so using this metric, indoor radon levels in the treatment home apparently fared “better”.
In the second case, the situation is reversed. The control home radon level increased by 5 pCi/l, which would imply that the treatment home fared “better” when using the difference-of-differences approach. However, the control home radon level only increased by 17%, implying that the treatment home fared “worse” when using the ratio-of-ratios approach.
The WAP IAQ study analysis used the difference-of-differences approach (arithmetic means) to describe the net (treatment-control) increase in home radon. However, the ratio-of-ratios (geometric means) may

be a better metric when analyzing changes in radon because they correspond to percentage changes rather than net changes. One might expect that a percentage change in a home’s air leakage would correspond more directly to a percentage change in radon levels. Furthermore, a 1 pCi/l change is large for a home that was initially at 3 pCi/l, but it is a much smaller impact in a home that was initially at 50 pCi/l, for example. The WAP IAQ study found that arithmetic changes were greater for homes with higher initial radon concentrations, which supports the use of geometric means.
In this report, net treatment effects are presented for radon changes using both arithmetic and geometric means. Although the WAP IAQ study used a difference-of-differences approach to describe net treatment effects, its modeling of the change in radon was based on the natural log-transformed ratio of post- to pre-weatherization radon, which is the ratio approach. Similarly, the change models in this report model the log-transformed ratio, but control-adjusted ratios are used, whereas the WAP IAQ study does not use control adjustment. As in the WAP IAQ study, this report models log-transformed pre-weatherization radon for the treatment group radon, which corresponds to the use of the geometric mean instead of the arithmetic mean.
2.7.3 Statistical Methods
Paired t-tests were used to test whether there were changes in the arithmetic mean indoor radon level for the treatment group or changes in control-adjusted arithmetic mean radon levels from pre- to post-weatherization. Paired t-tests on log-transformed radon levels were used to test whether there were changes in the geometric mean radon for the treatment group or changes in control-adjusted geometric mean radon level from pre- to post-weatherization. Two sample t-tests were used to test whether geometric mean pre-weatherization radon levels differed in treatment and control homes. Normality is not required for the t-tests concerning the radon levels or log-transformed radon levels considered. Regardless of the underlying distributions of the radon observations considered, t-tests are robust with the large sample sizes in this study. Analysis of variance was used to test whether variables such as the mean height of the home differed between states. Chi-squared tests were used to test whether nominal variables such as the presence or absence of ducts in the foundation space differed by state.
2.7.3.1 Pre-Weatherization Modeling
Stepwise and backward regressions were conducted to identify significant housing and environmental conditions and characteristics on natural log-transformed pre-weatherization indoor radon levels, and then the results from the two modeling approaches were combined to create one model for each sampling location (basements and first floors). Some of the potential predictors were associated with each other, such as total height of living space and total volume of living space, so care was taken to ensure that predictors were not just retained in the model due to their relationships with each other (i.e. due to multicollinearity). Multicollinearity is addressed by examining the other regression parameters when one variable was removed from the model and calculating variance inflation factors.. See Section 4.1 for a complete list of variables considered. Modeling excluded outliers (see Section 2.7.4).
The primary purpose of modeling was to identify housing and environmental conditions and characteristics on pre-weatherization indoor radon levels, so the state variable was not included as a potential predictor in the primary models. However, the models do not capture all the factors that could impact radon levels. Secondary models that added the state variable to the primary models were created to determine whether there were differences according to state beyond the housing and sampling characteristics and the conditions considered. The state variable was included as a 7-level variable, with Illinois separated into Chicago and Illinois except Chicago, and by state otherwise. Chicago was separated because it is in Radon Zone 2, and most Chicago testing occurred in the summer, whereas the other Illinois locations are in Radon Zone 1, and testing occurred in the heating season. If a significant predictor

in the primary model loses significance when the state variable is added, then radon is more closely related to the state variable than the predictor while controlling for the other variables retained in the model. If the state variable is a significant predictor, then the variables that lose significance are described when the state variable is added to the model.
To provide an accurate prediction of radon levels without eliminating a noticeable fraction of the study sample because of missing infiltration values, an intercept term was fit for missing infiltration values. These values were typically missing due to blower door tests not being performed, which happened in some cases such as when vermiculite insulation, which may contain asbestos, was located in an attic.
Pre-weatherization basement and first-floor models are presented in Tables 5 and 6, respectively. The parameter p-value in those tables is the p-value from the t-test that indicates if the parameter estimate is different from zero. For the categorical 4-level season variable—winter, fall, spring, and summer—the p-value from the type 3 F-test is presented to describe the overall significance of the variable. The modeling that was conducted assumed that residuals were normally distributed. Normal quantile plots were examined to confirm approximate log normality of the residuals.
2.7.3.2 Control-Adjusted Change in Radon Modeling
Control-adjusted changes in indoor radon levels were modeled analogous to the pre-weatherization modeling, except that treatment variables and changes in environmental conditions were also included as potential predictors. See Section 4.2.4 for a complete list of variables considered. Control-adjusted change basement and first floor models are presented in Tables 10 and 11, respectively.
2.7.4 Consideration of Outliers
In the WAP IAQ study, homes were excluded from the final explanatory variable analysis if their radon levels increased or decreased by more than a factor of three. These homes were excluded to prevent the extreme swings of radon that are primarily due to natural variability from having undue influence over the results. Results from previous studies do not support weatherization having an impact on indoor radon levels by as much as a factor of three. This concept is illustrated in Figure 5, which shows that the majority of treatment homes in the study had pre/post ratios between 0.3 and 3.0 (horizontal dashed lines), but that there were some homes outside of that range. Homes below 0.3 or above 3.0 were considered to be “outliers”.

Figure 5. Outlier determination in BEX study homes.
This report presents results with outliers removed and with the full sample, including outliers. We support the exclusion of outliers for both explanatory variable and pre-post change in radon analyses using the “factor of three” outlier rule since we do not believe that such results plausibly reflect the impact of weatherization activities.
2.8 PARTICIPANT NOTIFICATION
Draft notification letters for study participants were prepared using templates built into the study database. The statistician designed the notification letter database entry system to populate appropriate cells with the study ID, visit ID, and radon results for a given home. When the project first began, three separate letters were generated for (1) pre-weatherization radon results, (2) post-weatherization radon results, and (3) the one-year post-weatherization radon results in each home. Later in the project, the study team began including previous visits’ radon results in subsequent letters (e.g., pre-weatherization and post-weatherization results included in the one-year post-weatherization results letter), as well as a graph plotting the results (see Appendix B for a sample letter). The QC manager reviewed the draft notification letters, resolved any discrepancies with the study team, and provided electronic versions of the reviewed draft letters to the PI. The letters were reviewed, signed, and sent to the resident. The project team maintained a table documenting the date that each letter was sent.
Notification letters contained information regarding radon risks and remediation options. If measured levels were above the EPA-recommended action level of 4 pCi/l, then letters suggested considering remediation.
Per project design, if the pre-weatherization radon concentration in the lowest living level was below 4 pCi/l but the post-weatherization radon concentration was above 4 pCi/l, then the project team offered to perform a long-term (91+ day) post-weatherization test. If this long-term test confirmed that radon levels exceeded 4 pCi/l, then the project team offered to cover the cost of radon mitigation for the homeowner. Radon mitigation was not offered to control homes, homes that had post-weatherization

radon concentrations below 4 pCi/l, or homes that had a pre-weatherization radon concentration above 4 pCi/l. Figure 6 depicts the decision flow for homes with pre-weatherization radon levels below 4 pCi/l.
Figure 6. Decision flow for homes with pre-weatherization radon levels below 4 pCi/l.
The Pennsylvania WAP Grantee requested to offer the long-term radon tests any time a radon post-test showed results above 4 pCi/l. For cases in which the post-weatherization radon level was between 4 and 10 pCi/l, the Subgrantee provided a long-term test kit to be placed in the lowest living level for a duration of 91+ days. The research team worked with the state and DOE to negotiate a radon mitigation plan for study homes. In this plan, homes that had post-weatherization radon levels between 4 and 10 pCi/l would receive active mitigation if the 91+ day test confirmed levels above 4 pCi/l, and homes that had post-weatherization levels above 10 pCi/l would receive active mitigation without requiring follow-up testing. Pennsylvania used training and technical assistance funds for mitigation when both pre- and post-weatherization radon levels exceeded 4 pCi/l.
Radon level before weatherization is
below 4 pCi/l
After weatherization, less than 4 pCi/l Do not mitigate
After weatherization, greater than 4 pCi/l
Place long-term 91+ day test-kit in home
If result is <4 pCi/l, do not mitigate
If result is >4 pCi/l, contact radon
mitigation specialist for radon mitigation

28
3. SAMPLE CHARACTERISTICS
3.1 LOCATIONS/RADON ZONES
Table 2 shows the distribution of homes by EPA radon zone for the original WAP IAQ study and the BEX study. The WAP IAQ study included homes in all three radon zones, with just over half of the homes in Radon Zone 1. In the BEX study, about two-thirds of homes are in Radon Zone 1, with the rest in Radon Zone 2.
Table 2. Radon zone sample distribution by study
Radon zone WAP IAQ BEX 1 52% 67% 2 38% 33% 3 10% --
Figure 7 shows the locations of the BEX sites. In Figure 7, black dots correspond to control homes, and different colored triangles within the maps correspond to treatment homes from different WAP Subgrantees within the state.
3.2 SITE CHARACTERISTICS
Table 3 presents sample characteristics for the homes in the study prior to weatherization beginning, organized by state. The sample characteristics shown are focused on those likely connected to radon levels in homes. Because radon comes into homes from the soil, foundation construction details and exposed dirt are likely to influence how much radon can come into the home. The presence of forced air space conditioning systems can influence the pressure differences in the home due to duct leaks. Use of combustion for heating can also influence pressure differences if the combustion air is taken from within the home. Chicago is separated from the rest of Illinois homes in Table 3 because it had substantially different foundation characteristics and because it is in Radon Zone 2, whereas the rest of the Illinois homes were in Radon Zone 1.
Table 3 shows that the pre-weatherization average leakiness of homes was similar across different geographical regions, with the exception of Colorado, which had an average pre-weatherization airtightness of about two-thirds that of other states. Airtightness results are shown in units of cubic feet per minute at 50 Pascal depressurization (CFM50). There is substantial variation in leakiness among individual homes. Before weatherization, the tightest home in the study was 860 CFM50, and the leakiest home was 11,573 CFM50. Sixteen homes did not receive a blower door test as part of the project. Two reasons that were provided by Subgrantees regarding omitted blower door tests were the operation of wood-burning fireplaces/stoves and the presence of vermiculite insulation in the attic, which may contain asbestos.
Figure 8 shows the distribution of foundation types across the homes in the study. Basement homes are divided into two categories: those in which the basements were the lowest living level and those in which the first floor was the lowest living level. Across the entire sample, about 39% of homes had the basement as the lowest living level. Except in Colorado (about 60%) and Tennessee (less than 20%), all states had basements in 94% or more of homes, with all Pennsylvania homes having basements. Some homes also had another foundation section such as a crawl space under a portion of the home. In Chicago and Colorado, over half of the basements were occupied/occupiable. In all other states, less than half of the basements were occupied or occupiable, with Pennsylvania at 46% and the rest below 40%.

29
Figure 7. BEX study site locations detail (Illinois, upper left; New Hampshire, upper right; Colorado, middle left; Iowa, middle right; Pennsylvania, lower left; Tennessee, lower right). Colored triangles
correspond to treatment homes from difference Subgrantees. Black dots correspond to control homes. The red vertical line through the map of Colorado delineates the separate western and eastern portions for analysis.

30
Table 3. Pre-weatherization housing characteristics by state
Site Characteristics Reported by State
Characteristic NH (n=40)
IL (except Chicago)
(n=37)
Chicago (n=21)
CO (n=56)
IA (n=43)
PA (n=50)
TN (n=29)
All (n=276)
EPA radon zone 2 1 2 1 1 1 2 1 and 2 Mean blower door airtightness, CFM50* 3,480 3,514 3,658 2,324 3,326 3,588 3,315 3,233 Basement present 97.5% 94.6% 95.2% 60.7% 97.7% 100.0% 17.2% 81.5% Basement occupied or occupiable 30.0% 27.0% 57.1% 57.2% 39.5% 46.0% 3.4% 38.8% Exposed dirt pre-work 20.0% 37.8% 9.5% 55.4% 58.1% 24.0% 71.4% 40.7% Unsealed sump pump 32.5% 35.1% 33.3% 17.6% 27.9% 26.0% 10.7% 22.5% Poured concrete or brick walls 72.5% 33.5% 100% 87.5% 25.5% 4% 17.3% 46.8% Concrete block foundation walls 10.0% 40.5% 0.0% 12.5% 60.5% 72.0% 79.3% 40.2% Stone/rubble foundation walls 17.5% 27.0% 0.0% 0.0% 14.0% 24.0% 3.4% 13.0% Forced air heat 30.0% 89.2% 76.2% 76.8% 79.1% 28.0% 82.8% 63.8% Ducts in foundation 30.0% 83.8% 76.2% 73.2% 83.7% 28.0% 77.8% 63.1% Boiler heat 62.5% 5.4% 19.0% 12.5% 9.3% 36.0% 0.0% 21.7% Heat with gas/propane/oil 97.5% 91.9% 100.0% 87.5% 95.3% 78.0% 24.1% 83.3% * Eight homes in NH, one home in IL (except Chicago), one home in Chicago, one home in Colorado, one home in Pennsylvania, and four homes in Tennessee did not receive blower door tests. CFM50 means cubic feet per minute at 50 Pascals depressurization.
Figure 8. Foundation distribution across sample (LLL – lowest living level).
All CO IA ILChicago
ILother NH PA TN
Basement is LLL Basement home, 1st floor is LLLCrawl space home

31
Figure 9 shows the distribution across locations of the fraction of homes that had exposed dirt in their foundations prior to weatherization. About 40% of all homes had exposed dirt in foundations prior to weatherization, though there were regional differences. In Illinois and New Hampshire homes, less than 25% of all homes had exposed dirt in the crawl space or basement. Chicago, which had older homes and full basements, had less than 10% of homes with exposed dirt. In Colorado and Iowa, over 50% of homes had exposed dirt prior to weatherization, and in Tennessee, where there was a preponderance of crawl spaces, over 70% of homes had exposed dirt. Pennsylvania was similar to Illinois and New Hampshire, with 24% of homes having exposed dirt before weatherization.
Figure 9. Distribution of homes with exposed dirt prior to weatherization across sample.
Unsealed sump pumps were less common than exposed dirt overall, with less than one quarter of homes having an unsealed sump pump. In the Illinois and New Hampshire study homes, about one-third of all homes had unsealed sump pumps. In the two states that had a substantial fraction of homes with crawl spaces (Colorado and Tennessee), less than 20% of homes had unsealed sump pumps. In Iowa and Pennsylvania, just over one quarter of homes had unsealed sump pumps. The majority of homes had no sump pump at all; only a few homes started the study with sealed sump pumps.
Foundation wall type also varied by region. In New Hampshire most homes had poured concrete foundations. About one-quarter of New Hampshire homes had concrete block or stone/rubble foundations, with stone/rubble being more prevalent than concrete block. In Illinois, outside of Chicago, over two-thirds of homes had concrete block or stone/rubble, with concrete block being more common. Conversely, in Chicago, the majority of homes had poured concrete foundation walls, with a few having brick. Colorado also had a majority of homes with poured concrete foundations. In Iowa, Pennsylvania, and Tennessee, 75–96% of homes had concrete block or stone/rubble foundations, with 60–80% of them
All CO IA ILChicago
ILother NH PA TN
Exposed dirt pre-Wx No exposed dirt pre-WxGraphs by _varname

32
being concrete block. In the absence of large cracks, poured concrete and brick were expected to be more resistant to radon entry than concrete block, and it was also expected that concrete block would be more resistant to radon entry than stone/rubble.
In New Hampshire and Pennsylvania, under one-third of homes used forced-air heating. In New Hampshire, nearly two-thirds of homes had boilers. In Pennsylvania, about a third of homes had boilers and some had electric resistance baseboards. Conversely, over three-quarters of homes in all other states used forced-air for heating. In all locations, if forced-air systems were used for heating, then there were almost always ducts in the foundation space. This can be important for radon entry if there are duct leaks that change the pressure difference in the foundation space. For example, supply leaks to a basement could inhibit radon entry, whereas return leaks from a basement could increase radon entry. Duct leaks have also been associated with greater air exchange rates in homes.
Except for Tennessee, which had primarily electric space conditioning due to being more of a cooling climate, all other states primarily used natural gas, propane, or oil for heating. With the exception of Pennsylvania, in all heating-dominated states, 87.5% or more homes used fossil fuels for heating. Over 80% of New Hampshire homes used oil for heating.
3.3 INTERVENTION WORK COMPLETED
Table 4 summarizes the types of work completed on homes in the study that could impact indoor radon levels. The table shows the number of homes for which the measure was reported as having been implemented, except for air sealing, which was implemented in all homes. Covering bare dirt and sealing sump pumps are specified separately at the top of Table 4 since these are primary measures of interest in the study. Blower door results are also shown separately due to the focus on air sealing as a potential driver of radon change, with results shown for average pre- and post-weatherization readings, along with percentage reduction. Subgrantees did not report measures implemented for all homes, so the bottom portion of Table 4 has a smaller sample size than the other sections.
Table 4 shows that bare dirt was covered in a little more than a quarter of all homes. This was over two-thirds of the homes for which this was an eligible measure, reflecting the dominance of basements in most of the sample area. One common reason for dirt to not get covered was when it represented a small portion of the foundation space and had extremely limited access. For example, all Pennsylvania homes had basements, yet 11 homes also had some bare dirt. This often reflected a small crawl space under one portion of the home. Many, but not all, of these did get plastic ground covers.
Sump pumps were sealed in only about 13% of homes. However, this corresponds to over half of the 22.5% of homes that had an unsealed sump pump. In study homes for the four additional states, every state had at least 90% of homes that either did not have a sump pump or had the sump pump sealed after weatherization. In Illinois and New Hampshire sump pump sealing rates were lower. For those two states, project rules did not require all unsealed sump pits to be sealed, but Subgrantees called for a sealed sump pump cover to be added to the work order about half of the time when there was an unsealed sump pump present in the foundation space.
Overall, air sealing reduced blower door leakage rates by an average of 33%, with all but two states being within six percentage points of the overall average. The Chicago area homes, which were the leakiest homes on average, achieved an average of 47% reduction in air leakage. Colorado homes in the study, which were noticeably tighter than those in the other states, achieved a 22% average reduction in air leakage.

33
Table 4. Frequency of measures by state
Measures
State (number of homes) All
(n=276) % of all NH
(n=40)
IL (except Chicago)
(n=37)
Chicago (n=21)
CO (n=56)
IA (n=43)
PA (n=50)
TN (n=29)
Covered bare dirt or porous floors 4 7 2 26 24 5 9 77 28% Sealed sump pump cover 8 1 7 0 8 9 2 35 13% Air sealing results (n=32) (n=36) (n=20) (n=55) (n=43) (n=49) (n=25) (n=260) Pre-weatherization blower door test (CFM50) (arithmetic mean)
3,480 3,514 3,658 2,324 3,326 3,588 3,315 3,233
Post-weatherization blower door test (CFM50) (arithmetic mean)
2,121 2,366 1,943 1,804 2,092 2,609 2,162 2,166
Percent reduction 39% 33% 47% 22% 37% 27% 35% 33% Intervention (n=14) (n=9) (n=21) (n=55) (n=43) (n=50) (n=23) (n=215) Installation of ventilation 10 6 21 38 25 27 13 140 65% Air sealing at ceiling 11 8 21 41 40 38 13 172 80% Air sealing at walls 11 4 19 20 32 23 13 122 57% Air sealing of basement rim joist 12 5 13 7 31 35 0 103 48% Air sealing of basement/first floor 8 6 6 0 3 18 2 43 20% Air sealing of crawl/first floor 4 1 6 28 9 4 12 64 30% Air sealing of return ducts in basement 5 7 1 10 12 15 8 58 27% Air sealing of ducts in crawl space 3 3 3 21 6 3 19 58 27% Caulking of below-grade cracks in concrete 8 5 19 0 24 3 0 59 27% Sealing of large holes in below-grade walls or floors
5 5 3 2 21 9 1 46 21%
Air sealing interior crawl space accesses 1 1 5 15 6 1 3 32 15% Air sealing of crawl space rim joist 7 4 5 14 23 5 0 58 27% Replacement of atmospherically vented appliances with high-efficiency models
2 3 20 9 30 4 4 72 33%
Continuous or intermittent exhaust mechanical ventilation was installed in about two-thirds of homes. All homes followed the requirements of ASHRAE Standard 62.2-2013 (ASHRAE 2013) or later. (Basic requirements were unchanged from the 2013 to 2016 editions.) Because some homes were initially very leaky, they may have continued to be leaky enough following air sealing to not require mechanical ventilation according to the calculations from the ASHRAE standard.
General air sealing at the ceiling, walls, and basement rim joists was common in all homes, as expected, and was implemented 48–80% of the time.
Replacement of forced-air furnaces with high-efficiency models that draw combustion air directly from outside was the next most common measure, as it was performed in about 33% of homes, although there were strong regional differences. Chicago received this measure 95% of the time, and Iowa treatment homes received it 70% of the time. In non-Chicago Illinois, 33% of homes received this measure. No other state installed this measure more than 20% of the time. In New Hampshire, very few furnaces were replaced because most heating systems were boilers and not forced-air systems. Pennsylvania had a larger number of boilers than other states, and over 20% of the Pennsylvania homes used electricity or wood for heating. About three-quarters of the Tennessee homes in the study used electricity for heating.

34
The other tracked measures were only implemented in about 15–30% of the homes in the study. These measures were often state-dependent and were limited by the number of homes in which the measure was applicable. For example, Colorado and Tennessee naturally had the most measures implemented in crawl spaces, whereas caulking of below-grade cracks was mostly done in Chicago and Iowa.

35
4. RESULTS
The results presented in this section are an aggregation of the data from six states.
4.1 MEASURED RADON LEVELS
Figure 10 shows all the radon measurement results from treatment homes in the six states for pre-weatherization, post-weatherization, and one-year follow-up. Figures 11 to 13 provide these data as histograms for each period.
Figure 10. Radon levels for all homes in the six states studied.
Lower panel excludes results above 12.5 pCi/l for visual clarity of the majority of homes studied.

36
Figure 11. Measured indoor radon levels in treatment homes, pre-weatherization.
Figure 12. Measured indoor radon levels in treatment homes, post-weatherization.

37
Figure 13. Measured indoor radon levels in treatment homes, 1-year post-weatherization.
On average, pre-weatherization basement radon levels were about 50% higher than first-floor levels. Following weatherization, average basement radon levels averaged about two-thirds higher than first floor levels. As expected, since radon levels are known to be highly variable across the country, indoor radon levels also have wide variability. For the basement radon levels in this study, the mode is at about 5 pCi/l pre-weatherization and 4 pCi/l post-weatherization and one year following weatherization, with first-floor levels having a mode of about 3 pCi/l pre- and post-weatherization and 4 pCi/l one year following weatherization.
To understand the primary drivers of radon, an explanatory variable analysis model was developed using the pre-weatherization radon levels. This analysis necessarily does not include potential predictors such as soil moisture or temperature, since those were not measured in this study. The following variables were included as possible predictors:
• Season (winter, spring, summer, fall) • Presence of a crawl space (yes/no) • Unsealed sump pump (yes/no). “No” indicates a sealed pump or no pump • Ducts in the foundation space (yes/no) • Total volume of living space (ft3) • Total height of living space (ft) • Number of stories above grade • Presence of a crawl space (yes/no) • Temperature variables:
o Indoor to outdoor temperature difference = difference in the mean indoor and outdoor temperature during testing in Kelvin (indoor-outdoor)
o Ratio of the mean indoor to mean outdoor temperature during testing in Kelvin (indoor/outdoor)

38
• Pre-weatherization foundation connectivity class, defined as follows (use the worst case if there are multiple foundation spaces): o Class=1 (worst): The foundation has at least 10% exposed dirt or porous floor, and/or the
foundation wall is made of stone/rubble, and/or there is an unsealed sump pump o Class=2: The foundation wall is made of concrete block or there are significant below-grade
cracks o Class=3 (best): The foundation wall and floor are made of poured concrete, and none of the other
factors are present • Domestic hot water heater taking air from within the thermal boundary (uses atmospheric or induced
draft, or shared venting with furnace/boiler) (yes/no) • Furnace/boiler taking air from within the thermal boundary (uses atmospheric or induced draft)
(yes/no) • Drilled well present (yes/no) • Natural infiltration, which is a non-linear function of airtightness (blower door test result), the height
of the home, and the difference between indoor and outdoor temperatures (CFM).
As shown in Table 5, four factors were found to be statistically significant predictors of basement radon levels when state was not included as an explanatory variable: (1) season (p = 0.071), (2) having ducts in the foundation space (p = 0.007), (3) greater height of the home (p = 0.015), and (4) greater indoor-outdoor temperature difference (p < 0.001). The last three of these were all associated with lower basement radon, and all are associated with greater air exchange. Regarding season, summer radon levels were lower than autumn levels, which were in turn lower than winter and spring levels. When the state variable was included, the building height dropped out of significance (p = 0.140) due to the association between state and building height (bivariate p<0.001). The state variable was a significant predictor of radon levels (p = 0.002). The R2 value of 24.4% was higher for the state model than the model without the state variable, as expected. See Table 8 in Section 4.2.3 for pre-weatherization geometric means for the lowest living level.
Table 5. Significant variables from model to predict natural log-transformed pre-weatherization basement radon (state not included as a predictor except where noted)
Variable Levels Parameter estimate
Parameter p-value
Intercept 2.897 <.001** Ducts in foundation space Yes (vs. No) -0.273 0.007** Season Fall (Oct.–Nov.) vs. Winter (Dec.–Feb.) -0.397 0.050*
Spring (Mar.–Apr.) vs. Winter (Dec.–Feb.) -0.040 0.727 Summer (May–Sept.) vs. Winter (Dec.–Feb.)
-1.041 0.043**
Indoor-outdoor temperature difference (K)
-0.023 <.001**
Height of home (feet) Yes (vs. No) -0.025 0.015** R2=15.8%, n=184 When state is included: R2=24.4%
State significant p = 0.002** Height drops out p=0.141
* Significant at the 90% level ** Significant at the 95% level
The results in Table 5 show an interesting combination of predictors. On the one hand, winters and springs have statistically significant, higher radon levels than falls and summers, although it should be noted that all summer measurements were conducted in Radon Zone 2 locations (Tennessee and

39
Chicago). On the other hand, greater temperature differences between indoors and outdoors are associated with lower radon levels. This suggests that there are long-term seasonal variations that are separate from within-season variability. For example, winters may generally have higher radon levels, but within the winter period, colder temperatures lead to lower indoor radon levels. This is counter to the common assumption that radon levels are highest when it is coldest due to a greater stack effect pulling on the soil. This may be partly because there is also a greater overall infiltration rate for the home, and the increased air exchange more than compensates for any increase in radon entry. However, other unmeasured parameters may also have a substantial impact. The R2 indicates that only 15.8% of the variability in pre-weatherization basement radon is explained by the model. This is much lower than the R2 of 35.5% observed in the WAP IAQ study for the lowest living level. The lower R2 could be because this study’s model did not include the county-predicted geometric mean radon or other variables that had been included in the WAP IAQ model. The lower R2 could also be due to the inclusion of lower radon levels in the WAP IAQ study (see Section 2.4.4 for inclusion requirements) than seen in this study.
Table 6 shows explanatory variable analysis results for first floors.
Table 6. Significant variables from model to predict natural log-transformed pre-weatherization first-floor radon (state not included as a predictor except where noted)
Variable Levels Parameter estimate
Parameter p-value
Intercept 2.487 <.001** Season Fall (Oct.–Nov.) vs. Winter (Dec.–
Feb.) -0.417 0.029**
Spring (Mar.–Apr.) vs. Winter (Dec.–Feb.)
-0.069 0.495
Summer (May–Sept.) vs. Winter (Dec.–Feb.)
-0.856 <.001**
Domestic hot water draws air from living space
Yes (vs. No) -0.163 0.072*
Indoor-outdoor temperature difference (K)
-0.016 <.001**
Height of home (feet) -0.038 <.001** R2=16.6%, n=221 When state is included: R2=23.0% State significant p = 0.003**
Domestic hot water draws air from living space drops out p=0.510; in-out temperature difference drops out p=0.205
* Significant at the 90% level ** Significant at the 95% level
When the state variable was excluded from the analysis, the season (p < 0.001), the hot water heater drawing combustion air from within the home (p = 0.072), the greater height of the structure (p < 0.001), and the greater temperature difference (p < 0.001) were all statistically significant. Regarding seasons, summer radon levels were less than autumn levels, which were in turn lower than winter and spring levels. All of the other predictors were associated with lower radon levels. The R2 indicates that only 16.6% of the variability in pre-weatherization first floor radon is explained by the model. This is much lower than the R2 of 35.5% that was observed in the WAP IAQ study for the lowest living level. See Section 4.1 for discussion of the comparison to the WAP IAQ study results.

40
When the state variable was included, the hot water heater drawing combustion air from within the home and temperature difference dropped out of significance (p = 0.510 and p=0.205, respectively) due to their association with the state variable (both bivariate p<0.001). The R2 value of 23.0% was higher for the state model than the model without the state variable, as expected. See Table 8 in Section 4.2.3 for pre-weatherization geometric means for the lowest living level.
4.2 CHANGE IN RADON LEVELS
4.2.1 Control Adjustment
Since radon is known to vary significantly over time, the change in radon levels in treatment homes was adjusted using control homes that were measured using CRMs (see Sections 2.5.1 and 2.7.2 for a discussion of the adjustment process). In the BARRIER study, an analysis of control home data showed that, while they did help account for local weather effects, there are many other influences on radon concentrations for which the control homes cannot account. An example of this might be how much people use ventilation or keep interior doors closed. Given that the explanatory factor analysis showed that weather was important in explaining radon levels (indoor-outdoor temperature difference and season were each statistically significant in at least one dataset), it is clearly important to include controls in the analysis. However, it should be acknowledged that home-specific effects are likely important and are unaccounted for.
Appropriate controls sites for each treatment site were identified as those in the same geographic area with the same foundation type (basement or crawlspace) which also had data reported from the continuous radon monitor for at least 90% of the time that the treatment site’s passive sensors were deployed. Additional consideration was applied for the Colorado sites due to significant variation in the local geological features. The territory of one participating Colorado Subgrantee was predominantly in mountainous regions. Any treatment sites west of the Front Range peaks (approximated at -105.7 longitude) were only evaluated against control sites that were also in that area.
From those appropriate controls, the best control to use was selected as the nearest control site relative to each treatment site (the shortest linear distance based on World Geodetic System WGS84 ellipsoid).
For cases in which data overlap was less than 100% but above the 90% threshold, if another suitable control had higher overlap without substantially increasing the distance to the treatment site, then the higher overlap site was selected on a case by case basis (n=11).
In the absence of suitable controls with overlap during all three periods (pre-weatherization, post-weatherization, and 1-year follow-up), those controls with pre- and post-weatherization overlap were prioritized (n=8), resulting in some sites being without control adjustments during some periods.
Two sites did not have a suitable control that met the above criteria. For these sites, control data from the foundation space at one site was combined with the living level data from a different site to generate a “split control” to use for the analysis.
Figures 14–17 show examples of time-series data from individual control homes (daily averages for Figures 14–16 and hourly averages for Figure 17). These figures illustrate the degree to which radon levels can vary with time and between first floors and basements, although radon levels in these two locations do tend to track with each other.

41
Figure 14. Control home radon levels over the winter of 2016–17.
Figure 14 exemplifies a home in which radon levels in the basement and on the first floor both tended to be above the EPA action level of 4 pCi/l but that also frequently dropped below that level. There was an apparent cycle of approximately four days between peaks and valleys. In this home, radon was apparently well mixed so that the first floor had levels that were nearly 90% that of the basement.
Figure 15. Control home radon levels over the winter and spring of 2016–17.

42
Figure 15 shows a home that had a substantial decrease in typical indoor radon levels starting in late February. Throughout the measurement period, this home had levels above the EPA action level, but they fell by about half in late February. The fact that the levels remained high (often above 10 pCi/l) suggests that the windows remained closed.
Figure 16. Control home radon levels in the winter of 2017.
Figure 16 shows a home with generally low radon levels and with first-floor radon levels that were about half those in the basement. There appear to be about two cycles per week in which radon levels rise and fall.
Figure 17. Control home hourly radon levels from December 10, 2018 through January 7, 2019.

43
Figure 17 shows hourly values over about one month. This graph shows that there are both shorter- and longer-term variations, with hourly values varying by more than a factor of six. In addition to the spikes seen several times during the measurement period, there also appear to be smaller diurnal variations.
4.2.2 Control-Adjusted Changes in Radon Levels, Arithmetic Means
As stated previously, the WAP IAQ study analysis was conducted using control-adjusted arithmetic means based on a difference-of-differences approach. The results were presented with 90% confidence intervals. The primary analysis and results from that study also screened out outliers, which are defined as homes in which the radon level increased or decreased by more than a factor of 3. This screening avoided allowing individual homes with extreme results to obscure greater trends. It was this analysis that produced the result of an increase in radon of 0.44 pCi/l ± 0.22 pCi/l in the lowest living level, which corresponds to a 22% increase in control-adjusted arithmetic means relative to the pre-weatherization levels.
Prior to analysis, the indoor radon levels in treatment and control homes were analyzed to confirm that they were suitable matches. Pre-weatherization geometric mean radon levels for treatment and control homes are not statistically different for either basements or first floors, suggesting a good match in terms of general radon level (p-values 0.303 and 0.522, respectively).
Table 7 shows the change in indoor radon found in study homes in the six states expressed as arithmetic differences with 90% confidence intervals, for the lowest living level, and for basements and first floors separately. The first section shows data for homes with outliers removed using the same outlier definition used in the WAP IAQ study. The second section shows the data for all homes. Control home values correspond to the averages of the two-week periods that are concurrent with corresponding treatment home test periods.
The first columns in Table 7 show the pre-weatherization radon results for the treatment group. Average radon levels were higher in this study than those measured in the WAP IAQ study. This is partly because this study required a minimum radon level in the lowest living level to be eligible, whereas in the WAP IAQ study, there was no minimum eligibility requirement for inclusion.
Table 7. Changes in arithmetic mean radon from pre-weatherization to post-weatherization, pCi/l (±90% confidence interval)
Pre-weatherization Change (post-pre) p-value
Location n Treatment Control Treatment Control Net (Treat -Control) Treatment Net (Treat
-Control) Outliers removed
LLL 232 6.47 ± 0.77 6.94 ± 1.11 0.09 ± 0.36 -0.23 ± 0.31 0.32 ± 0.42 0.686 0.208 Basements 182 8.16 ± 1.09 8.82 ± 1.39 0.88 ± 0.55 -0.09 ± 0.42 0.97 ± 0.65 0.009**(+) 0.015**(+) First floors 233 5.54 ± 0.65 5.93 ± 1.01 -0.28 ± 0.30 -0.51 ± 0.27 0.23 ± 0.38 0.126 0.314
All data LLL 272 6.91 ± 0.98 7.24 ± 1.17 -0.12 ± 0.49 -0.45 ± 0.31 0.33 ± 0.54 0.680 0.311 Basements 217 8.69 ± 1.28 9.12 ± 1.44 0.61 ± 0.72 -0.27 ± 0.39 0.88 ± 0.76 0.164 0.057*(+) First floors 273 5.41 ± 0.58 6.25 ± 1.07 -0.23 ± 0.37 -0.72 ± 0.27 0.49 ± 0.45 0.312 0.074*(+)
* Significant at the 90% level ** Significant at the 95% level + Indicates that the change was an increase - Indicates that the change was a decrease

44
For lowest living levels—39% basements, 61% first floors—there are no statistically significant increases in control-adjusted radon levels following weatherization (p = 0.208 with outliers excluded, p = 0.311 for all homes). Apparent increases were about 0.3 pCi/l, which is just under 5% of pre-weatherization levels and substantially less than the 22% increase seen in the WAP IAQ study.
Basement changes show a statistically significant increase of 0.97 pCi/l (p = 0.015) in control-adjusted radon levels with outliers excluded, which is about 12% of the pre-weatherization level. When all homes are included, the combined dataset shows a statistically significant increase in radon levels of 0.88 pCi/l (p = 0.057) in the basement. This corresponds to about 10% of the pre-weatherization levels.
First-floor changes in control-adjusted radon levels are not statistically significant with outliers removed, with an apparent change of 0.23 pCi/l (p = 0.314). This corresponds to about 4% of the pre-weatherization level. When all homes are included, the combined dataset shows a statistically significant increase of 0.49 pCi/l (p = 0.074) on first floors. This corresponds to about 9% of pre-weatherization levels.
4.2.3 Control-Adjusted Changes in Radon Levels, Geometric Means
Table 8 shows the same type of data as in Table 7 except that it is represented as ratios instead of arithmetic differences (i.e., the ratio of post-weatherization radon to pre-weatherization radon). Radon levels are presented as geometric means, along with 90% confidence intervals. As discussed in Section 2.7.2, we believe that geometric means are more appropriate for this analysis.
Table 8. Relative changes in geometric mean radon from pre-weatherization to post-weatherization and 90% confidence intervals
Pre-weatherization Relative change (post/pre) p-value
Location n Treatment Control Treatment Control Net (Treat /Control) Treatment Net (Treat
/Control) Outliers removed
LLL 232 4.82 (4.47,5.20)
4.74 (4.33,5.20)
1.00 (0.95,1.05)
1.00 (0.97,1.04)
1.00 (0.94,1.06)
0.992 0.987
Basements 182 6.09 (5.59,6.63)
6.57 (6.02,7.17)
1.10 (1.04,1.15)
1.03 (0.99,1.06)
1.07 (1.01,1.14)
0.003**(+) 0.069*(+)
First floor 233 4.19 (3.89,4.51)
4.01 (3.66,4.38)
0.96 (0.92,1.00)
0.94 (0.91,0.98)
1.02 (0.96,1.07)
0.128 0.652
All data LLL 272 4.79
(4.44,5.16) 4.76 (4.36,5.19)
0.98 (0.93,1.03)
0.93 (0.89,0.98)
1.05 (0.97,1.12)
0.462 0.293
Basements 217 6.10 (5.61,6.63)
6.47 (5.94,7.04)
1.05 (0.98,1.11)
0.97 (0.94,1.01)
1.07 (1.00,1.15)
0.233 0.103
First floor 273 4.10 (3.83,4.39)
4.07 (3.74,4.43)
0.92 (0.87,0.98)
0.87 (0.83,0.92)
1.05 (0.97,1.14)
0.023**(-) 0.268
* Significant at the 90% level ** Significant at the 95% level + Indicates that the change was an increase - Indicates that the change was a decrease

45
There were no statistically significant changes in control-adjusted radon levels for lowest living levels based on geometric means. With outliers excluded, there was an apparent 0% change (p = 0.987). With all homes included, there was an apparent 5% increase (p = 0.293).
Basement radon levels show an increase of 7% with or without outliers. With outliers removed, the increase is statistically significant (p = 0.069). With all homes included, the increase is not statistically significant (p = 0.103).
There were no statistically significant changes in indoor radon levels in the first-floor data. With outliers excluded, there was an apparent increase of 2% (p=0.652), and for all homes, there was an apparent increase of 5% (p=0.268).
In an effort to understand drivers of changes in radon, the results for the lowest living level based on geometric means were also evaluated by state. The results are shown in Table 9. In this table, Colorado is separated by east and west of the front range due to the very different topography, weather, and radon levels in the two portions of the state.
With outliers removed, the only state that shows a statistically significant change in radon in the lowest living level is Tennessee, with a 30% decrease in radon relative to control homes. Both Colorado regions also showed a decline, but with more modest levels of change (7% and 14%) that were not statistically significant. This may point to the influence of crawl space homes, since Tennessee was the only state that was predominantly crawl spaces, and Colorado was the only other state with a substantial fraction of crawl space homes. Other states showed apparent radon increases in the lowest living level, but none were statistically significant.
Table 9. Geometric mean pre-weatherization radon and percent reduction in geometric mean radon (control-adjusted) – lowest living level by state – outliers excluded
State n Geometric mean pre-weatherization Percent change Significance
(p-value) New Hampshire 39 3.64 10% increase 0.247 Illinois (without Chicago) 30 4.06 1% increase 0.938 Chicago 9 2.20 29% increase 0.205 Colorado (east of Front Range) 40 5.38 7% decrease 0.277 Colorado (west of Front Range) 14 7.59 4% decrease 0.707 Iowa 37 6.08 12% increase 0.174 Pennsylvania 39 6.24 3% increase 0.717 Tennessee 24 3.72 30% decrease 0.007** All homes 232 4.82 0% change 0.987 All states except Tennessee 130 6.04 2% increase 0.692
4.2.4 Change in Radon Levels Explanatory-Variable Analyses
For explanatory variable analyses, the following variables were included as possible predictors of control-adjusted changes in indoor radon levels using ratios (post-weatherization/pre-weatherization radon):
• Treatment variables: o Sump pump sealed as part of weatherization (yes/no) o Bare dirt/porous floors in foundation were covered as part of weatherization (yes/no)

46
o The heating system was replaced with one that did not draw combustion air from the living space (yes/no)
o The domestic hot water system was replaced with one that did not draw combustion air from the living space (yes/no)
• Presence of a crawl space (yes/no) • Presence of an unvented crawl space (yes/no) • Ducts in the foundation space (yes/no) • Total volume of living space (ft3) • Total height of living space (ft) • Number of stories above grade • Reduction in percent dirt/porous floors foundation from pre-weatherization to post-weatherization • Temperature variables:
o Change in the indoor to outdoor temperature difference during testing in Kelvin (pre-weatherization indoor – pre-weatherization outdoor – [post-weatherization indoor – post-weatherization outdoor])
o Change in the mean outdoor temp in Kelvin (pre-weatherization – post-weatherization) o Ratio of pre-weatherization to post-weatherization mean outdoor temp in Kelvin (pre-
weatherization / post-weatherization) o Ratio of pre-weatherization to post-weatherization temperature component of infiltration
• The ratio of pre-weatherization to post-weatherization infiltration, including the contribution of installed mechanical ventilation.
4.2.4.1 Changes in Basement Radon Levels
Three variables are statistically significant in predicting changes in control-adjusted basement radon levels. Two are associated with greater increases in radon: greater reduction in infiltration (p = 0.002) and replacement of heating systems that no longer draw combustion air from the home (p = 0.004). Both of these variables are associated with reduced air exchange. The other significant variable was the presence of ducts in the basement (p = 0.074), which was associated with smaller increases (or decreases) of basement radon levels. The R2 indicates that only 10.9% of the variability in changes in control-adjusted radon in basements is explained by the model. This is similar to the R2 of 11.4% observed in the WAP IAQ study for non-control adjusted changes for the lowest living level with outliers removed. When the state variable was included, it was not significant (p=0.293) but the variable of having ducts in the foundation space drops out of significance (p=0.229) due to the association between the state and ducts variables (bivariate p<0.001).
Table 10. Significant variables from the model used to predict natural log-transformed pre-post changes in control-adjusted basement radon levels (state variable not included as a predictor except where noted)
Variable Levels Parameter estimate Parameter p-value Intercept 0.004 0.956 Ducts in foundation space Yes (vs. No) -0.133 0.075* Furnace/boiler no longer draws air from living space
Yes (vs. No) 0.286 0.004**
Infiltration ratio pre/post Slope 0.049 0.020** Intercept for missing infiltration 0.246 0.027**
R2=10.9%, n=184 When state variable is included: R2=14.6%
State variable is not significant p=0.293 Ducts in foundation space variable drops out p=0.229
* Significant at the 90% level ** Significant at the 95% level

47
4.2.4.2 Changes in First Floor Radon Levels
There were three statistically significant predictors of change in first-floor radon, all of which correlate to greater increases in first-floor radon levels. These predictors were (1) a greater change in indoor-outdoor temperature difference between pre- and post-weatherization measurement periods (p < 0.001), (2) a greater height of the home (p = 0.074), and (3) replacement of water heaters with models that no longer draw combustion air from inside the home (p = 0.044). The variables for the height of the home and water heater replacement both dropped out when the state variable was included in the model. The R2 indicates that only 10.0% of the variability in changes in control-adjusted radon in first floors is explained by the model. This is similar to the R2 of 11.4% observed in the WAP IAQ study for non-control–adjusted changes for the lowest living level with outliers removed.
When the state variable was included, it was not significant (p=0.178), but the variables for a hot water heater drawing air and change in indoor-outdoor temperature difference drop out of significance (p=0.180 and p=0.209, respectively) due to their association with the state variable (both bivariate p<0.001).
Table 11. Significant variables from model to predict natural log-transformed pre-post changes in control-adjusted first floor radon levels (state variable not included as a predictor except where noted)
Variable Levels Parameter estimate
Parameter p-value
Intercept -0.221 0.015** Hot water heater no longer draws air from living space
Yes (vs No) 0.175 0.044**
Change in temperature difference A (K) Yes (vs No) 0.015 <.001** Height of home (feet) 0.012 0.074* R2=10.0%, n=235 When state is included: R2=13.4% State not significant p = 0.178
Hot water heater draws air and change in indoor-outdoor temperature difference variables drop out (p=0.180 and p=0.209, respectively)
A= Pre-weatherization (indoor-outdoor) - Post-weatherization (indoor-outdoor) * Significant at the 90% level ** Significant at the 95% level
4.3 LONG-TERM RADON MEASUREMENTS
As described in Section 2.8, when pre-weatherization radon levels were below 4 pCi/l in the lowest living level and the corresponding post-weatherization results were above 4 pCi/l, the homes qualified for long-term (>90-day) radon tests to confirm indoor radon levels in the lowest living level above 4 pCi/l prior to mitigation. Pennsylvania had additional criteria that would trigger a long-term test. A total of 26 homes across the six states received long-term testing per standard study rules, and 17 homes received long-term testing under the Pennsylvania-specific rules.
Of the 26 homes that received long-term tests according to study rules, the average post-weatherization short-term test result was 5.8 pCi/l, with a maximum of 7.1 pCi/l. The average long-term test result was 2.8 pCi/l. Of the 26 homes, only four had long-term test results greater than 4 pCi/l and were thus eligible for mitigation using project funds.

48
For the 17 homes that received long-term tests according to the Pennsylvania-specific rules, five were eligible for long-term tests based on short-term measurements on the first floor, and 14 were eligible based on short-term measurements in the basement, with two homes being eligible on both levels. The average of the five short-term readings on the first floor was 5.9 pCi/l. Three of these homes had long-term test results on the first floor below 4 pCi/l, with an average of 1.9 pCi/l. The other two had long-term test results that were about 5% lower than the short-term test results and averaged 5.6 pCi/l.
For the 14 basements, the average short-term test result was 6.8 pCi/l and the average long-term test result was 5.9 pCi/l. Three of these basements had long-term readings below 4 pCi/l, with an average of 2.3 pCi/l compared to short-term results in these three basements averaging 4.3 pCi/l. For the remaining 11 basements, the average short-term result was 7.5 pCi/l, and the average long-term result was 6.9 pCi/l.
These results are consistent with the findings that (1) winters, when most homes were tested, have higher radon levels than other times of the year, and (2) that long-term averages were often lower since they are intended to better represent typical conditions.
4.4 PERSISTENCE OF RADON IMPACTS
In addition to analyzing the immediate impacts of weatherization on radon, the persistence of impacts were evaluated by measuring radon in homes 9–15 months following weatherization to determine whether the measures lose effectiveness over time. Figure 18 shows the elapsed time from pre- to post-weatherization measurements and from pre-weatherization to one-year measurements. Homes were generally tested the season after post-weatherization measurements were taken, though not always at the 12-month mark due to the need to accommodate Subgrantee and participant schedules. Two homes received one-year follow-up testing as soon as nine months after post-weatherization testing, and some follow-up testing occurred as late as 15 months after post-weatherization testing. The cluster of homes that are seen in Figure 18 to be a number of months later than the main group of homes were usually tested later at both post-weatherization and one-year stages. This is because the weatherization work was conducted between sampling seasons. For example, homes that received pre-weatherization radon testing in March may not have been weatherized in time for post-weatherization testing in the same season. One-year follow-up tests were scheduled to be in the sampling season following post-weatherization measurements. In a few cases, the one-year follow-up testing could not be conducted the following season, so they were performed two seasons later. This resulted in a few homes receiving their follow-up testing closer to two years after weatherization.
Follow-up radon testing was conducted for 121 first floors and 85 basements across the six states. Twelve basements and eleven first floors dropped out when outliers were removed. The follow-up sample size was lower than the post-weatherization sample size for two reasons. In some homes weatherization was conducted near the end of the study with insufficient time for follow-up sampling to be conducted. Furthermore, attrition is more likely with a longer follow-up period.
Table 12 shows the results of the follow-up analysis based on control-adjusted ratios of radon levels one year after weatherization to the post-weatherization readings.

49
Figure 18. Time between pre- and post-weatherization radon monitoring (left) and between pre-
weatherization and one-year follow-up radon monitoring (right). (Boxes indicate interquartile range; central line indicates median.)
Table 12. Changes in geometric mean radon from post-weatherization to one-year and 90% confidence intervals
Post-weatherization Relative change (one year/post) p-value
Location n Treatment Control Treatment Control Net (Treat /Control) Treatment Net (Treat
/Control) Outliers removed
LLL 111 4.67 (4.24,5.15)
4.76 (4.30,5.26)
0.91 (0.84,0.98)
1.01 (0.95,1.07)
0.90 (0.82,0.98)
0.042**(-) 0.041**(-)
Basements 77 6.36 (5.58,7.24)
6.53 (5.97,7.14)
0.93 (0.84,1.03)
0.99 (0.92,1.06)
0.94 (0.83,1.07)
0.247 0.457
First floor 110 3.97 (3.65,4.32)
3.87 (3.47,4.32)
0.96 (0.88,1.04)
1.04 (0.98,1.10)
0.92 (0.85,1.01)
0.420 0.141
All data LLL 122 4.43
(4.00,4.90) 4.52
(4.08,5.01) 0.95
(0.87,1.03) 1.06
(0.98,1.14) 0.90
(0.81,0.99) 0.269 0.067*(-)
Basements 85 5.81 (5.02,6.72) ±
0.68
6.41 (5.86,7.01)
1.04 (0.91,1.20)
1.00 (0.92,1.09)
1.04 (0.89,1.22)
0.616 0.680
First floor 121 3.75 (3.42,4.10)
3.70 (3.32,4.12)
1.00 (0.92,1.09)
1.10 (1.01,1.19)
0.91 (0.83,1.01)
0.982 0.129
* Significant at the 90% level ** Significant at the 95% level + Indicates that the change was an increase - Indicates that the change was a decrease

50
For most analyses, the control-adjusted geometric mean radon levels decreased during the follow-up period by up to 10%. When the data are analyzed for the lowest living level, the decrease in radon is about 10% and is statistically significant with outliers removed and for all homes (p = 0.041 and p = 0.067, respectively). When the analysis was conducted for basements, there was a 6% decrease with outliers removed and a 4% increase with all homes, but these changes were not statistically significant. For first floors, there were apparent decreases of 8% and 9% with outliers removed and for all homes, respectively. However, these changes were also not statistically significant. The mechanism by which any decreases occur is not known, and whether it is due to a longer time scale physical effect, the result of an occupant adaptation, or something else entirely.

51
5. DISCUSSION
The primary goal of this study was to assess whether current precautionary measures used by WAP are effective for preventing radon increases following weatherization. The study results show that current practices have indeed produced substantial benefit compared to previous practices, and there are no statistically significant changes in radon in the lowest living levels with these practices. While the mechanism is not clear, there are further reductions of radon in the lowest living levels of homes one year following weatherization.
The results of this study do not suggest that energy retrofits in homes cannot result in indoor radon increases in some homes. They do, however, support the continued implementation of the package of precautionary measures currently specified by WAP.
Metrics that were statistically significant regarding influence on radon changes following weatherization were predominantly those related to air exchange. However, not all variables related to air exchange were statistically significant, and many were not related to weatherization, such as the height of the home and changes in indoor-outdoor temperature difference.
The results also show that, while short-term tests may often be suitable to identify homes with inherently high or low radon levels, they are not sufficiently reliable to determine increases in radon due to retrofit in an individual home due to the variability of radon over time relative to the potential magnitude of retrofit-induced changes. short-term tests before and after weatherization cannot reliably determine when a home has increased from below the EPA action level of 4 pCi/l to above this level on a long-term basis. Of the 26 homes in which the radon level on the lowest living level went from below 4 pCi/l (148 Bq/m3) prior to weatherization to above 4 pCi/l following weatherization, and in which long-term testing was conducted, only four had long-term radon levels above 4 pCi/l. These results do not question the utility of short-term radon testing in homes as a screening tool.

52
6. CONCLUSIONS
6.1 PRECAUTIONARY MEASURE IMPLEMENTATION
Two weatherization measures that are thought to impact indoor radon levels are frequently implemented under WAP. Air leakage is reduced in all houses and was reduced by an average of 33% across the study sample. In about one-third of the homes in the study, atmospherically-vented appliances were replaced with models that draw combustion air directly from outdoors rather than from within the house, which acts to decrease air infiltration into the home.
The package of precautionary measures included in current WAP weatherization practices are measures that are frequently applicable to weatherized homes and that can be implemented with sufficient frequency to impact changes in indoor radon levels following weatherization. About two-thirds of homes received mechanical exhaust ventilation, one-third of homes had previously bare dirt covered with plastic ground covers, and about one-sixth of homes had sump pumps sealed.
6.2 CHANGES IN RADON
Using what we consider to be the best analysis approach—control-adjusted geometric means with outliers removed—results in an average 0% change in control-adjusted indoor radon levels for the lowest living level in WAP homes using current weatherization practices. Using other analysis approaches, including the same approach that was used in the WAP IAQ study, also results in no statistically significant increases in indoor radon levels in the lowest living level.
The most direct comparison to the primary WAP IAQ study employs arithmetic means with all homes for lowest living levels. For the six-state BEX study, the comparison result was a 0.33 ± 0.54 pCi/l increase, or 5% of the pre-weatherization level, and was not statistically significant. This is a major difference in findings from the WAP IAQ study, which found statistically-significant increases in arithmetic mean radon of 0.44 ± 0.22 pCi/l, (22% ± 11%). If outliers were removed from the analysis, then the result does not change, with a 0.32 ± 0.42 pCi/l increase, or 5% ± 6% of the pre-weatherization level, which is also not statistically significant. This result demonstrates that for the lowest living level, the precautionary measures included in these studies largely address increases in radon, and any remaining changes are not statistically significant.
On further analysis, there is evidence that radon levels increased in basements and that this was statistically significant. Regardless of whether outliers are included or not, and regardless of whether the analysis is done using arithmetic or geometric means, radon levels in basements increase 7–12%, which is statistically significant with three analysis approaches and near significance (p-value of 0.103) in the fourth approach. An increase in radon in basements is consistent with previous work that analyzed the impact of weatherization when mechanical ventilation was added (Francisco et al. 2017).
Using the standard study rules, only four of 26 homes that were eligible for long-term testing had long-term radon readings greater than 4 pCi/l on the lowest living level. These results show that long-term averages, which are intended to better represent typical conditions than short-term winter-time testing, are often lower than the short-term radon levels during the project sampling periods.
6.3 EXPLANATORY VARIABLES
Most explanatory variables that were evaluated did not show up as statistically significant predictors of either pre-weatherization radon levels or changes in radon. Those that were statistically significant tended to be associated with air exchange. These included change in infiltration rate, indoor-to-outdoor

53
temperature difference, whether combustion appliances drew combustion air from within the home, whether there were ducts in the foundation space, and the height of the home. Season also appeared to be a significant predictor of pre-weatherization radon levels. In general, characteristics that would lead to greater overall air exchange led to lower radon levels or lower changes in radon following retrofit.
Long-term seasonal variations were found, as well as separate, within-season variability. Winter and spring seasons had higher radon levels overall than fall and summer seasons, showing seasonal variability. However, within seasons, colder temperatures led to lower radon levels. This is counter to a common belief that colder temperatures lead to higher radon levels, and the exact cause of this association is not clear. It could be due to greater use of heating and cooling systems or greater dilution through natural infiltration. However, there may also be important variables that were not measured, such as soil temperature, moisture, and freezing.
6.4 PERSISTENCE
The results comparing control-adjusted post-weatherization radon levels to those from a year later show that there are decreases in indoor radon concentrations a year after weatherization has been performed. For the 122 homes in which a one-year follow-up test was conducted, lowest living levels experienced an average of a 10% reduction that was statistically significant. The mechanisms for these improvements are not clear.

54
7. RECOMMENDATIONS
• Due to substantially reduced changes in radon levels seen with the package of precautionary measures implemented in this study compared with results from the WAP IAQ study, especially in the lowest living level, WAP should continue implementing this package of precautionary measures when applicable in locations where elevated radon levels are reasonably expected.
• The study showed that radon levels in basements have a greater potential to increase following weatherization than on first floors. As a result,
o WAP may consider requiring non-exhaust methods of ventilation (e.g., supply or balanced), or exhausting directly from the basement when sleeping facilities are located in basements, regardless of whether these basements have defined bedrooms.
o WAP may consider recommending non-exhaust methods of ventilation or exhausting directly from the basement when the basement is the lowest living level, independent of whether sleeping facilities are located in the basement.
o In either case, since many contaminants can primarily be generated on above-grade floors, if basement exhaust is used it may be appropriate to install two fans: one in the basement and one above grade. If basement exhaust is installed, then it is imperative to ensure that any natural draft combustion appliances in the basement can still draft properly.

55
REFERENCES
ASHRAE. 2010. Ventilation and Acceptable Air Quality in Low-Rise Residential Buildings. ASHRAE: Atlanta, GA.
ASHRAE. 2013. Ventilation and Acceptable Indoor Air Quality in Residential Buildings. ASHRAE: Atlanta, GA.
ASHRAE. 2016. Ventilation and Acceptable Indoor Air Quality in Residential Buildings. ASHRAE: Atlanta, GA.
ASHRAE. 2016. 2016 ASHRAE Handbook - Fundamentals (I-P Edition). ASHRAE: Atlanta, GA.
CFR. 1983. 40 CFR Part 192: Standards for Remedial Actions at Inactive Uranium Processing Sites. Federal Register 48, p. 590-604.
Darby, S., D. Hill, A. Auvinen, J.M. Barros-Dios, H. Baysson, F. Bochicchio, H. Deo, R. Falk, F. Forastiere, M. Hakama, I. Heid, L. Kreienbrock, M. Kreuzer, F. Lagarde, I. Makelainen, C. Muirhead, W. Oberaigner, G. Pershagen, A. Ruano-Ravina, E. Ruosteenoja, A. S. Rosario, M. Tirmarche, L. Tomasek, E. Whitley, H. E. Wichmann, and R. Doll. 2005. “Radon in Homes and Risk of Lung Cancer: Collaborative Analysis of Individual Data from 13 European Case-Control Studies.” BMJ 330:223–7.
Darby, S., D. Hill, H. Deo, A. Auvinen, J.M. Barros-Dios, H. Baysson, F. Bochicchio, R. Falk, S. Farchi, A. Figueiras, M. Hakama, I. Heid, N. Hunter, L. Kreienbrock, M. Kreuzer, F. Lagarde, I. Makelainen, C. Muirhead, W. Oberaigner, G. Pershagen, E. Ruosteenoja, A. S. Rosario, M. Tirmarche, L. Tomasek, E. Whitley, H. E. Wichmann, and R. Doll. 2006. “Residential Radon and Lung Cancer: Detailed Results of a Collaborative Analysis of Individual Data on 7,148 Subjects with Lung Cancer and 14,208 Subjects without Lung Cancer from 13 Epidemiological Studies in Europe.” Scand. J. Work Environ. Health 32:Suppl. 1, 1–83.
Francisco, P. W., D. E. Jacobs, L. Targos, S. L. Dixon, J. Breysse, W. Rose, and S. Cali. 2017. “Ventilation and Housing Weatherization.” Indoor Air 27(2):463–477.
Francisco, P. W., S. Gloss, J. Wilson, W. Rose, Y. Sun, S.L. Dixon, J. Breysse, E. Tohn, and D. E. Jacobs. 2019. “Radon and Moisture Impacts from Interventions Integrated with Housing Energy Retrofits.” Accepted for publication in Indoor Air. DOI: 10.1111/ina.12616.
Iowa Department of Public Health. Resources. https://idph.iowa.gov/radon/resources. 2020. Accessed April 21, 2020.
Kotrappa, P. 1999. Review of Electret Ion Chamber Technology for Measuring Technologically Enhanced Natural Radioactivity. Rad. Elec. Inc. Frederick, MD. https://inis.iaea.org/collection/NCLCollectionStore/_Public/33/016/33016255.pdf. Accessed April 21, 2020.
Krewski, D., J. H. Lubin, J. M. Zielinski, M. Alavanja, V. S. Catalan, R. W. Field, J. B. Klotz, E. G. Letourneau, C. F. Lynch, J. L. Lyon, D. P. Sandler, J. B. Schoenberg, D. J. Steck, J. A. Stolwijk, C. Weinberg, and H. B. Wilcox. 2006. “A Combined Analysis of North American Case-Control Studies of Residential Radon and Lung Cancer.” J. Toxicol. Environ. Health A 69:533–597.
Palmiter, L. and T. Bond. 1991. “Interaction of Mechanical Systems and Natural Infiltration,” Proceedings of the AIVC Conference on Air Movement and Ventilation Control within Buildings, Ottawa, ON.

56
Pigg, S. 2014. National Weatherization Assistance Program Impact Evaluation: Impact of Exhaust-Only Ventilation on Indoor Radon and Humidity – A Field Investigation. Oak Ridge, TN: Oak Ridge National Laboratory report ORNL/TM-2014/367.
Pigg, S., D. Cautley, P.W. Francisco, B. Hawkins, and T. Brennan 2014. Weatherization and Indoor Air Quality: Measured Impacts in Single Family Homes under the Weatherization Assistance Program. Oak Ridge, TN: Oak Ridge National Laboratory report ORNL/TM-2014/170.
Pigg, S., D. Cautley, and P.W. Francisco. 2017. “Impacts of Weatherization on Indoor Air Quality: A Field Study of 514 Homes.” Indoor Air 28(2):307–317.
Steck, D. J. 2005. “Residential Radon Risk Assessment: How Well Is It Working in a High Radon Region?” In Proceedings of the 2005 AARST International Symposium. American Association of Radon Scientists and Technologists.
UNSCEAR. 2008. United Nations Scientific Committee on the Effects of Atomic Radiation. Sources-to-Effects Assessment for Radon in Homes and Workplaces. UNSCEAR 2008, Report to the General Assembly, with Scientific Annexes.: United Nations, New York.
US EPA. https://www.epa.gov/radon/epa-map-radon-zones. Accessed April 21, 2020.
US EPA. 2003. Assessment of Risks from Radon in Homes. Washington, DC: US Environmental Protection Agency, Office of Air and Radiation, Indoor Environments Division.
US EPA. 2011. Healthy Indoor Environment Protocols for Home Energy Upgrades. US Environmental Protection Agency, Office of Air and Radiation, Indoor Environments Division. https://www.epa.gov/sites/production/files/2014-12/documents/epa_retrofit_protocols.pdf. Accessed April 21, 2020.
US DOE. 2011. Weatherization Assistance Program Health and Safety Guidance. https://www.energy.gov/sites/prod/files/2015/12/f27/WAP-WPN-11-6.pdf. Accessed April 21, 2020.
US DOE. 2017. Weatherization Assistance Program Health and Safety Guidance. https://www.energy.gov/sites/prod/files/2017/08/f35/WPN%2017-7%20Table%20of%20Issues.pdf
White S. B., J. W. Bergsten B. V. Alexander, et al. 1992. Indoor 222Rn Concentrations in a Probability Sample of 43,000 Houses across 30 States. Health Phys. 62:41–50.

APPENDIX A. DATA COLLECTION FORM

A-2
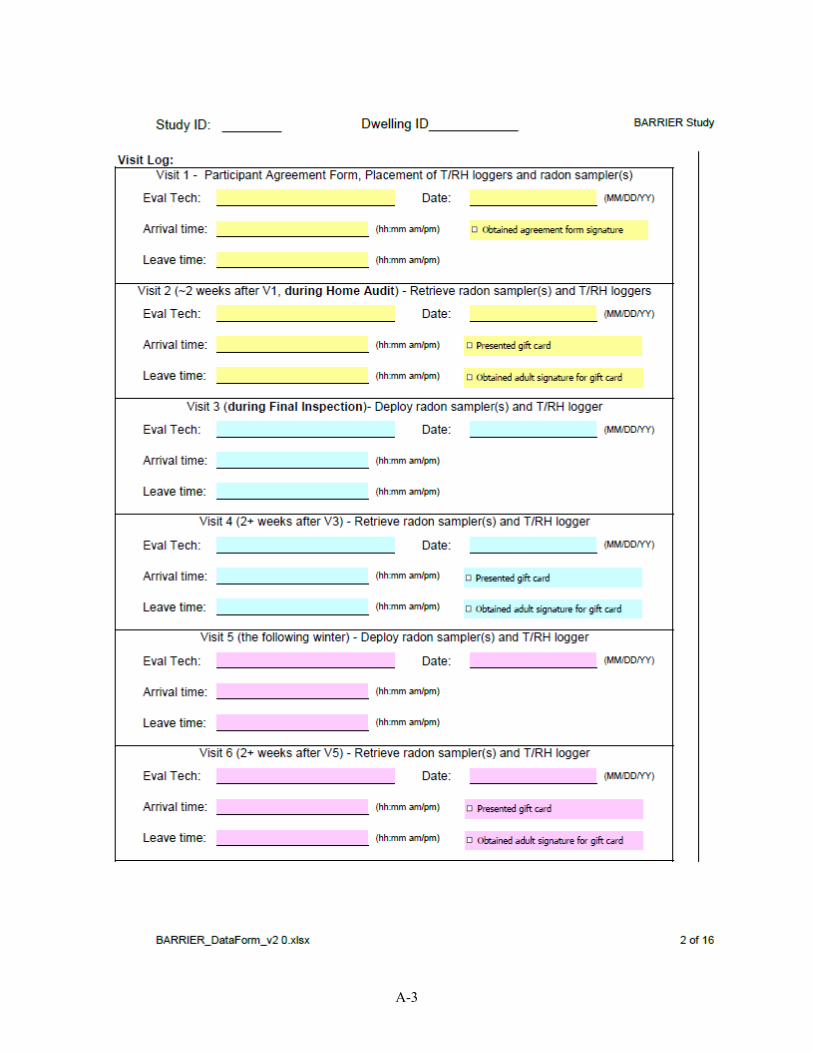
A-3

A-4

A-5

A-6

A-7

A-8

A-9

A-10

A-11
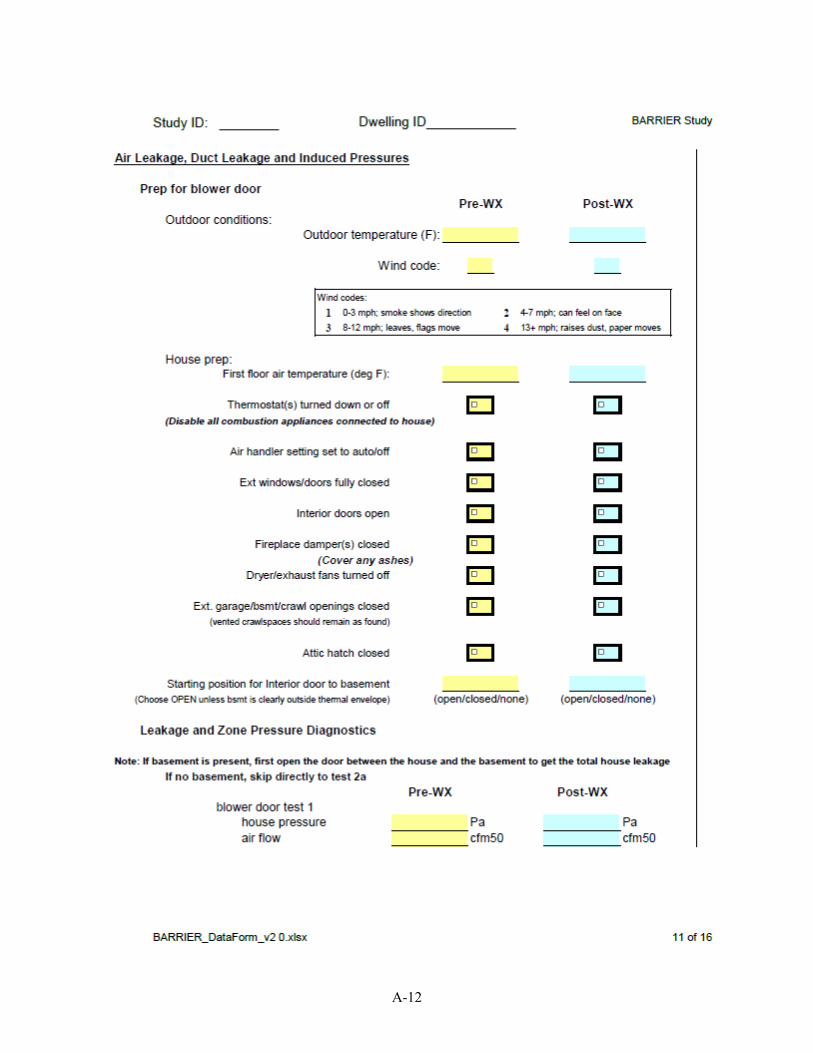
A-12

A-13

A-14

A-15

A-16

A-17

APPENDIX B. PARTICIPANT SAMPLE LETTER

B-2

B-3

B-4