building bridges - forest trends · building bridges: state of the voluntary carbon markets 2010:...
TRANSCRIPT

Building BridgesState of the Voluntary Carbon Markets 2010
Executive Summary
PREMIER SPONSORS
SPONSORS

About Ecosystem Marketplace and Bloomberg New Energy Finance
Ecosystem Marketplace, a project of the non-profit organization Forest Trends, is a leading source of information on environmental markets and payments for ecosystem services. Our publicly available information sources include annual reports, quantitative market tracking, weekly articles, daily news and newsletters designed for different payments for ecosystem services stakeholders. We believe that by providing solid and trustworthy information on prices, regulation, science and other market-relevant issues, we can help payments for ecosystem services and incentives for reducing pollution become a fundamental part of our economic and environmental systems, helping make the priceless valuable.
Ecosystem Marketplace’s work on the voluntary carbon markets is financially supported by the United States Agency for International Development, the David and Lucile Packard Foundation, the Norwegian Agency for Development Cooperation, UKaid from the Department for International Development and the Surdna Foundation.
Bloomberg New Energy Finance is the world’s leading independent provider of news, data, research and analysis to decision-makers in renewable energy, carbon markets, energy smart technologies, carbon capture and storage, and nuclear power. The group has staff of more than 130, based in London, Washington D.C., New York, Beijing, New Delhi, Cape Town, São Paulo, Singapore and Sydney.
Bloomberg New Energy Finance Insight Services provide deep market analysis to investors in wind, solar, bioenergy, geothermal, carbon capture and storage, energy efficiency and nuclear power. The group also offers dedicated services for each of the major emerging carbon markets: European, Global Kyoto, Australia and the US, where it covers the planned regional markets as well as potential federal initiatives and the voluntary carbon market. Bloomberg New Energy Finance Industry Intelligence provides access to the most comprehensive database of investors and investments in clean energy and carbon. The News and Briefing Service is the leading global news service focusing on clean energy investment. The group also undertakes custom research and runs senior-level networking events.
New Energy Finance Limited was acquired by Bloomberg L.P. in December 2009, and its services and products are now owned and distributed by Bloomberg Finance L.P., except that Bloomberg L.P. and its subsidiaries (BLP) distribute these products in Argentina, Bermuda, China, India, Japan and Korea.
Bloomberg New Energy Finance 731 Lexington Avenue New York, NY 10022 [email protected] www.newcarbonfinance.com www.newenergyfinance.com
Ecosystem Marketplace 1050 Potomac St., NW Washington, DC 20007 [email protected] www.ecosystemmarketplace.com www.forest-trends.org

Building Bridges:
State of the Voluntary Carbon Markets 2010
A Report by Ecosystem Marketplace & Bloomberg New Energy Finance
Katherine Hamilton, Milo Sjardin, Molly Peters-Stanley and Thomas Marcello
June 14, 2010
Copyright and Disclaimer:
© Bloomberg New Energy Finance is a service of Bloomberg LP, and Ecosystem Marketplace is a project of Forest Trends Association.
This document was prepared and based upon information supplied to Bloomberg New Energy Finance and Forest Trends’ Ecosystem Marketplace by participants in a market survey conducted by both parties. Neither Bloomberg New Energy Finance nor Ecosystem Marketplace represents or warrants the accuracy, suitability or content of the survey responses or the results of that survey as set out herein. It is the sole responsibility and obligation of the reader of this report to satisfy himself/herself as to the accuracy, suitability and content of the information contained herein. Bloomberg New Energy Finance and/or Ecosystem Marketplace (such terms taken to also include their respective affiliates, officers, directors, partners and employees) make no warranties and shall have no liability to the reader for any inaccuracy, representation or misrepresentation set out herein. The reader further agrees to hold both Bloomberg New Energy Finance and Ecosystem Marketplace harmless from and against any claims, loss or damage in connection with or arising out of any commercial decisions made on the basis of the information contained herein. The reader of this report is strongly advised not to use the content of this report in isolation, but to take the information contained herein together with other market information and to formulate his/her own views, interpretations and opinions thereon. The reader is strongly advised to seek appropriate legal and professional advice before entering into commercial transactions.
Acknowledgments:
This report is a compilation of the insights of a wide range of individuals across several continents. It would not be possible without the more than 200 individuals who shared valuable information about their organizations. This report is publicly available due to support from our premier sponsors ERA Ecosystems Restoration Associates and Forest Carbon Group; and sponsors Sustainable Carbon, Baker & McKenzie, Karbone, ORBEO, EcoSecurities and Evolution Markets.
The creation of this report has also required insights, time and financial support from dozens of people. They include, Philippe Ambrosi, Evan Ard, Michael Bennett, Izzet Bensusan, Eron Bloomgarden, Neil Braun, Nathan Clark, Erin Craig, Ben Dappen, Ann Espuelas, Robert Falls, Xing’an Ge, Gary Gero, Mary Grady, Katherine Graham, Lenny Hochschild, Lisa Hodes, Eduardo Guardia, Nancy Johnston, Ben Keogh, Alex Langer, Grattan MacGiffin, Brookly McLaughlin, Jenny Sumner, Kelly Moore Brands, Rachel Mountain, Matthew Owen, Nevena Pingarova, Josh Rea, Helen Robinson, Rick Saines, Rishi Seth, Jonathan Shopley, Joanna Silver, Caitlin Sparks, Michael Streck, Iida Tetsunari, Anne Thiel, Gabriel Thoumi, and Martijn Wilder. Thank you also to the staff at Forest Trends Ecosystem Marketplace and Bloomberg New Energy Finance.
Cover: Cover page generated by Melissa Tatge Creative. Map images generated by Molly Peters-
Stanley, other images iStockPhoto.

State of the Voluntary Carbon Markets 2010 | i
The year of 2009 was a tumultuous one for the voluntary carbon markets. First, the economic recession had a marked impact on the number of companies offsetting greenhouse gas (GHG) emissions. At the same time, unfolding new climate legislation in the United States led the actors engaged in the voluntary carbon markets to pursue their interest in generating credits viable under new compliance programs despite the markets’ highs and lows.
Throughout the year, while voluntary carbon market transaction volumes remained relatively small, the marketplace thrived as an incubator of innovative protocols, registries, alliances, and project types. In the context of the regulated markets, the voluntary carbon markets proved they could be “the size of a mouse but have the roar of a lion.” For example, proposed federal climate legislation in the United States and federal offset programs in Australia referenced standards developed in the voluntary carbon markets. Also, reduced emissions from deforestation (REDD), a project type still exclusive to the voluntary carbon markets, took center stage at the international climate negotiations in Copenhagen at the end of 2009.
Last year, many entities engaged in the voluntary carbon markets solely as a warm-up for the compliance big league. However, half the marketplace remains driven by “pure” voluntary buyers seeking to offset emissions. These buyers grew increasingly sophisticated, seeking specific credit types from specific locations. Despite the recession, numerous companies initiated offset programs or continued to commit to offsetting goals. However, the concept of offsetting has not lost its controversial edge, and many stakeholders continued to emphasize the importance of reducing internal emissions before purchasing offsets.
Amidst the highs and lows, the marketplace continued to mature at a sprint pace, building infrastructure to ensure accountability and quality, incubating carbon market innovation and developing new GHG emissions reduction projects.
Trades Collected from over 200 Suppliers This fourth annual “State of the Voluntary Carbon Markets” report is designed to give a market-wide perspective on trading volumes, credit prices, project types, locations, and the motivations of buyers in this market. Findings are based on data voluntarily reported by 200 offset suppliers, as well as exchanges and registries. Because of the challenges of inventorying and obtaining data from this disaggregated marketplace, numbers presented should be considered conservative.
Executive Summary

ii|State of the Voluntary Carbon Markets 2010
Voluntary Carbon Market Transactions Declined to 94 MtCO2e In 2009, suppliers reported a total volume of 93.7 MtCO2e transacted in the global voluntary carbon markets. Compared to the 126.6 MtCO2e transacted in 2008, volumes declined by 26%, although 2009 market volumes were still 39% above 2007 levels.
This drop in volume can be attributed to two major challenges. In response to the global financial crisis, companies cut back on discretionary funding for corporate social responsibility initiatives, including offsetting emissions. At the same time, the prospects for new compliance demand remained uncertain. In the United States, the American Clean Energy and Security Act of 2009 (Waxman-Markey) was approved by the House of Representatives in June and then stagnated in the Senate during the second half of the year. Uncertainty also surrounded the Australia Carbon Pollution Reduction Scheme (CPRS). On the United Nations Framework Convention on Climate Change (UNFCCC) front, negotiators continued to hammer out the details of financing REDD and its role within the carbon markets.
Almost half the voluntary market, 41.4 MtCO2e was transacted through the Chicago Climate Exchange (CCX) in the form of Carbon Financial Instruments (CFIs). In contrast to 2008, when CCX traded volumes grew by 202%, exchange-traded deals dropped 40% in 2009. The decrease was a result of a drop in speculative activity as well as a shift to the OTC market via privately negotiated transactions as buyers demanded specific offset credits in lieu of standardized CFIs. Looking at the overall CCX cap and trade system, i.e. both privately negotiated and exchange-traded deals, total trading volumes declined by 33% to 47 MtCO2e in 2009.
The other half of transaction volumes, 50.5 MtCO2e, was traded on the over-the-counter (OTC) market. Transaction volumes dropped 12% from 2008. For the purpose of this report, we consider the OTC market to represent all transactions related to offset project credits that have been negotiated bilaterally, i.e., outside of any exchange. This figure therefore also includes CCX credits that were transacted bilaterally, which contributed approximately 5.5 MtCO2e (11%) to the overall OTC volume.
OTC market volumes also include transactions tracked on other trading platforms such as the Chicago Climate Futures Exchange and Climex. Such trading platforms for credits generated specifically for the voluntary carbon markets gained traction last year, contributing 1.8 MtCO2e, or 2% of total transaction volumes in 2009—up tenfold from 0.2% in 2008.

State of the Voluntary Carbon Markets 2010 | iii
Figure 1: Transaction Volume Growth for the Voluntary Carbon Markets
Source: Ecosystem Marketplace, Bloomberg New Energy Finance. Note: CCX bilateral trades included in the OTC volume.
Overall, the voluntary carbon markets remain a small fraction (1%) of the size of the regulated markets. In 2009, the regulated carbon markets grew 7% and transacted 8,625 MtCO2e, valued at $144 billion. While the voluntary carbon markets did not grow at the same rate as the regulated markets they still had a greater value than Joint Implementation or the New South Wales Greenhouse Gas Abatement Scheme.
Total Market Value Decreased 47% to $387 Million The voluntary carbon markets transacted $387.4 million in 2009. Values dropped about 47% from 2008 when the market value was estimated at $728.1 million. The OTC market represented 84% of market value at $325.9 million. Transactions on the CCX equaled $49.8 million or 13% of the market.
Since OTC and CCX transaction volumes were roughly similar, this discrepancy in value was mostly due to significantly lower prices for credits transacted on the CXX. The average credit price on the OTC market declined by 12% from $7.3/tCO2e to $6.5/tCO2e. However, the CCX experienced a 73% drop in price from an average $4.4/tCO2e in 2008 to $1.2/tCO2e. Together with the volume decline, this diminished the CCX market value by 84%. Across the marketplace, credits transacted for as low as $0.3/tCO2e and as much as $111.0/tCO2e during 2009.
44
11 6 9 1016
4457
50
2 1
10
23
69
41 0.1
0.2
2
0
20
40
60
80
100
120
140
pre-2002 2002 2003 2004 2005 2006 2007 2008 2009
Exchanges (other) CCX OTC
127Mt
67Mt
26Mt
12Mt12Mt
6Mt
44Mt
11Mt
94Mt

iv|State of the Voluntary Carbon Markets 2010
Table 1: Transaction Volumes and Values, Global Carbon Market, 2008 and 2009
Markets
Volume (MtCO2e) Value (US$ million)
2008 2009 2008 2009
Voluntary OTC 57 51 420 326
CCX 69 41 307 50
Other Exchanges 0.2 2 2 12
Total Voluntary Markets 127 94 728 387
EU ETS 3,093 6,326 100,526 118,474
Primary CDM 404 211 6,511 2,678
Secondary CDM 1,072 1,055 26,277 17,543
Joint Implementation 25 26 367 354
Kyoto [AAU] 23 155 276 2,003
New South Wales 31 34 183 117
RGGI 62 813 241 2,667
Alberta’s SGER 3 5 34 61
Total Regulated Markets 4,713 8,625 134,415 143,897
Total Global Markets 4,840 8,719 135,143 144,284
Source: Ecosystem Marketplace, Bloomberg New Energy Finance, World Bank. Note: Figures may not add up due to rounding.
Methane Credits Were the Most Popular Project Type in OTC The vast majority of credits in the voluntary OTC market originate from offset projects. In 2009, methane destruction projects captured 41% of OTC market transactions, followed by forestry projects (24%), and renewable energy (17%). Compared to 2008, methane and forestry projects roughly doubled their market share at the expense of renewable energy.
Much like 2008, the bulk of credits originating from methane destruction came specifically from landfill projects, which constituted 31% of the market volume. Popular forestry projects included afforestation/reforestation (10%), reduced emissions from deforestation and degradation (7%) and improved forest management (3%). The bulk of renewable energy projects were split fairly evenly between wind developments (8%) and hydro projects (7%), most of which was run-of-river hydro.

State of the Voluntary Carbon Markets 2010 | v
Figure 2: Transaction Volume by Project Type, OTC 2009
Source: Ecosystem Marketplace, Bloomberg New Energy Finance.
Consistent with previous years, prices within project types varied significantly for individual transactions due to variables such as transaction size, standards and sellers’ position in the supply-chain. Overall, price trends by project type were very similar to those observed in 2008. The five highest-earning (by average credit price) project types on the market were predominantly renewable energy activities: solar ($33.8/tCO2e), biomass ($12.3/tCO2e), methane – other ($9.6/tCO2e), energy efficiency ($9.2/tCO2e) and wind ($8.7/tCO2e). These project types traditionally earn above-average prices because of their high costs of production and particular appeal to voluntary market buyers.
31%
10%
8%7%
7%
4%
4%
4%
3%
3%
3%
3%2%
1%1%1% 7%
Landfill
Affor/Refor
Wind
Run-of-river
Avoid. Def.
Livestock
EE & Fuelswitch
Coal mine
Geo-seq
Forest Mgmt
Allowance
Ag Soil
RE - all others
Wastewater
Agro-forestry
Remaining - all others
Not specified

vi|State of the Voluntary Carbon Markets 2010
Figure 3: Average Credit Price and Price Range by Project Type, OTC 2009
US$/tCO2e
Source: Ecosystem Marketplace, Bloomberg New Energy Finance.
Note: Based on 410 observations.
Supply Shifts to the US as the Dominant Credit Source With regard to regional credit origination in 2009, North America took the lead for the first time since 2006 with 56% of OTC transaction volume (up from 28% in 2008). In 2007 and 2008, Asia was the home of the most credits transacted. North America’s regained foothold can be attributed to strong pre-compliance activity in the US. The United States once again supplied more volume (24.2 MtCO2e, up from 15.0 MtCO2e in 2008) than any other single country. Following far behind was Latin America, which captured 16% (6.8 MtCO2e) of market share in 2009. Asia, which was the most common source of credits in 2008, found itself in third place (12%) for 2009 market share by volume, with India and China leading the Asian pack with 2.9 MtCO2e and 1.7 MtCO2e, respectively. Both nations have historically dominated Asian origination of verified emissions reductions (VERs) as well as Certified Emissions Reductions (CERs).
33.8
12.39.6 9.2 8.7
7.3 6.8 6.7 6.65.8 5.7 5.5 5.2 4.6 3.6 2.9 2.4 1.7 1.2 0.8 0.2
6.7 8.6
111 max
-
5
10
15
20
25
30
35
40
Sola
r (4)
Biom
ass (
15)
Met
hane
-ot
her (
4)
Ener
gy E
ffic
ienc
y (2
0)
Win
d (4
6)
Fore
st M
gmt (
8)
Land
fill (
66)
RE -
othe
r (14
)
Fuel
Sw
itch
(16)
Run-
of-r
iver
(26)
Live
stoc
k (2
8)
Coal
min
e (1
2)
Agro
-for
estr
y (5
)
Aff/
Ref (
51)
Was
tew
ater
(9)
Avoi
d. D
ef. (
10)
Geo
-seq
& In
d. G
as (4
)
Larg
e hy
dro
(5)
Ag S
oil (
25)
Oth
er la
nd-b
ased
(18)
Allo
wan
ce (1
5)
Oth
er (3
)
Not
spec
ified
(7)
Volume-weighted average price Maximum transaction price Minimum transaction price

State of the Voluntary Carbon Markets 2010 | vii
Figure 4: Transaction Volume by Project Location, OTC 2009
Source: Ecosystem Marketplace, Bloomberg New Energy Finance.
In 2009, leading standards solidified their market positions and settled into the voluntary carbon markets’ mainstream. Last year, much like in 2008, over 90% of credits transacted adhered to a third-party standard. About 18 third-party standards are currently active in the marketplace.
Standards, registries and exchanges have become critical tools for assuring quality and transparency. Last year saw many of these tools coalesce as standards and other infrastructure providers partnered to increase efficiency and liquidity across these platforms. Standards also developed a variety of new methodologies and reached out to new regions.
56%
16%
12%
5%
2%2%
1%1%5%
US
Latin America
Asia
Turkey
Africa
Canada
AU/NZ
EU
Mixed/Not Specified
Figure 5: Average Credit Price by Region, OTC 2008 vs. 2009 (US$/tCO2e)
Source: Ecosystem Marketplace, Bloomberg New Energy Finance.
8.29.5
14.9
5.1
8.9
7.0 6.9 7.3
10.0
13.9
10.49.8
8.0 7.7
5.95.3
4.3
2.2
0
2
4
6
8
10
12
14
16
(6) (5) (13) (25) (35) (19) (12) (26) (13) (11) (101) (6) (88) (118) (56) (35) (7) (3)
EU Turkey AU/NZ Africa Canada Asia United States
Latin America
Not specified
2008 2009

viii|State of the Voluntary Carbon Markets 2010
Much like for project type, prices varied significantly by project location. Overall, the highest average prices were credits originating in the European Union, Western Asia (represented solely by Turkey), Oceania and Africa. On average, the least expensive credits originated in Latin America and North America (the US in particular). Only three regions saw prices increase from 2008 to 2009— the EU (up 69%), Turkey, (up 9%) and Africa (up 57%). The biggest loss was seen in Latin America, where the price dropped 41% to $4.3/tCO2e, garnering the lowest average price among regions. Oceania (-34%) and the US (-23%) also saw lower prices in 2009.
The Voluntary Carbon Standard Fortified Its Market Lead, While CAR Played Pre-Compliance Lookout
The preferred third-party standards in 2009 were the Voluntary Carbon Standard (VCS) with 35% of transactions volume, followed by the Climate Action Reserve (CAR) at 31% and the CCX with another 12%. Together, the top three standards of 2009 had a larger piece of the market at 77% than the top three in 2008 (VCS, CAR and Gold Standard), which cornered 69% of the market. This trend confirms the consolidation that has been observed in the market for the past few years.
Figure 6: Standard Utilization, OTC 2009
Source: Ecosystem Marketplace, Bloomberg New Energy Finance.
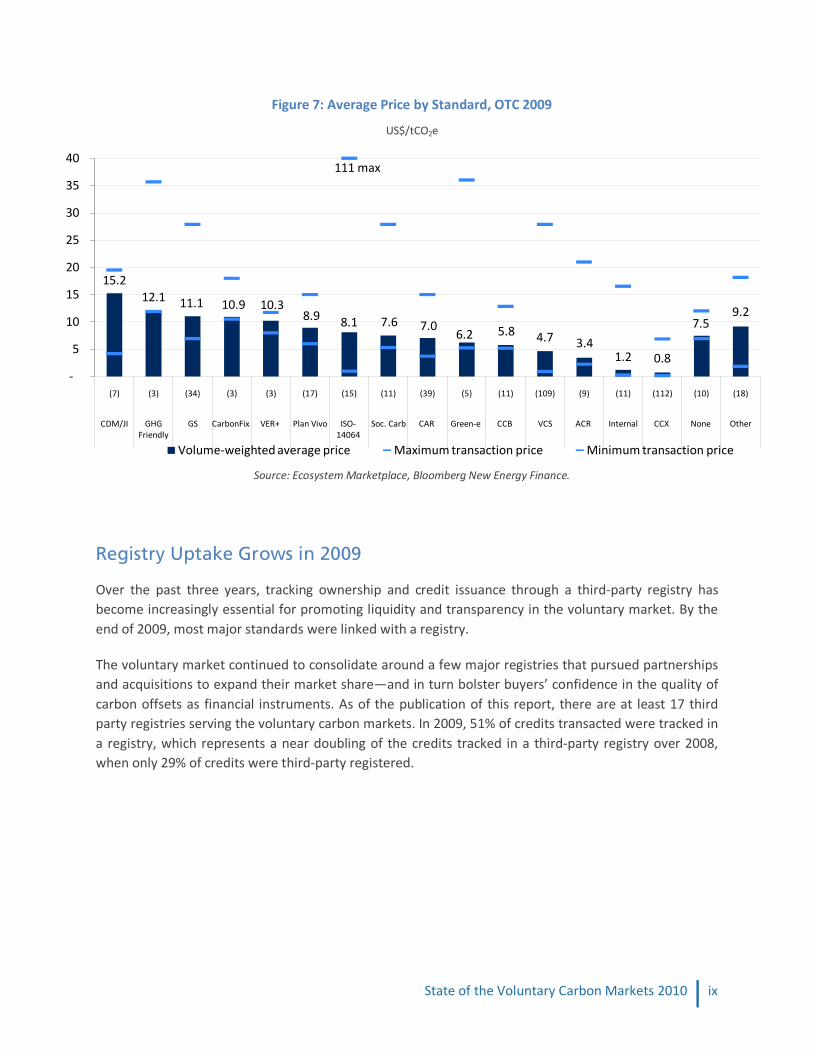
Every standard fetched a wide range of prices, varying roughly as much by standard as by project type. CDM/JI credits sold to voluntary buyers topped the list at $15.2/tCO2e, more than doubled the market-wide average OTC price in 2009, but nevertheless 29% less than in 2008.
Greenhouse Friendly credits garnered the next-highest average prices at $12.1/tCO2e. Also reaping above-average prices were Gold Standard ($11.1/tCO2e), as well as CarbonFix ($10.9/tCO2e) and Plan Vivo ($8.9/tCO2e), two standards developed solely for forestry projects. SOCIALCARBON credits stacked with VCS saw a slightly increased average price in 2009 ($7.6/tCO2e), which was again above-average due to buyers’ willingness to pay a premium for social and environmental co-benefits.
35%
31%
12%
7%
4%2.1%1.6% 1.3%
4% 2.4%VCS
CAR
CCX
Gold Standard
ACR
ISO-14064
Social Carbon
CCB
Internal
Other (all other standards)
Carbon Fix0.6%
Green-e Climate 0.5%
CDM/JI 0.4%
VER+ 0.2%
Plan Vivo 0.2%
GHG Friendly 0.2%
Other (non-descript) 0.3%
State of the Voluntary Carbon Markets 2010 | ix
Figure 7: Average Price by Standard, OTC 2009
US$/tCO2e
Source: Ecosystem Marketplace, Bloomberg New Energy Finance.
Registry Uptake Grows in 2009
Over the past three years, tracking ownership and credit issuance through a third-party registry has become increasingly essential for promoting liquidity and transparency in the voluntary market. By the end of 2009, most major standards were linked with a registry.
The voluntary market continued to consolidate around a few major registries that pursued partnerships and acquisitions to expand their market share—and in turn bolster buyers’ confidence in the quality of carbon offsets as financial instruments. As of the publication of this report, there are at least 17 third party registries serving the voluntary carbon markets. In 2009, 51% of credits transacted were tracked in a registry, which represents a near doubling of the credits tracked in a third-party registry over 2008, when only 29% of credits were third-party registered.
15.212.1 11.1 10.9 10.3
8.9 8.1 7.6 7.06.2 5.8 4.7 3.4
1.2 0.8
7.59.2
111 max
-
5
10
15
20
25
30
35
40
(7) (3) (34) (3) (3) (17) (15) (11) (39) (5) (11) (109) (9) (11) (112) (10) (18)
CDM/JI GHG Friendly
GS CarbonFix VER+ Plan Vivo ISO-14064
Soc. Carb CAR Green-e CCB VCS ACR Internal CCX None Other
Volume-weighted average price Maximum transaction price Minimum transaction price

x|State of the Voluntary Carbon Markets 2010
Figure 8: Transaction Volume by Registry, OTC 2008 vs. 2009
Source: Ecosystem Marketplace, Bloomberg New Energy Finance.
With the uptake of registries, this year we analyzed respondents’ transacted credits issued by different registries as well as individual registry reports of credits issued, but not necessarily transacted.
Figure 8 illustrates survey respondents’ registry usage by transacted volume in 2009. As standard-specific registries came online in 2009, the market share of these registered credits fairly accurately reflected the standards’ overall 2009 market share. For example, in March 2009, the VCS Registry System was launched which consists of three separate infrastructure providers—APX, Caisse des Depots and Markit. These registry providers saw considerable growth in 2009.
Suppliers reported that 21% of transacted credits were listed in the APX VCS registry. As with transaction volume, the CAR registry, serviced by APX, was a few percentage points behind with 17% (4.4 MtCO2e) of transacted credits in last year’s market (up from 12% in 2008). Another 10% were reported to have transacted via the Caisse des Depots VCS registry, and 8% via Markit (formerly TZ1) which services several standards such as VCS, SOCIALCARBON and Plan Vivo.
Within the OTC market, CCX saw sizeable growth in 2009 as CCX-registered credits claimed 15% of credits transacted via a registry in 2009, up from 4% in 2008. The CCX’s increased importance is a confluence of the greater availability of CCX bilateral trade data that informed this report (although this was minimal in previous years).
Alternatively, the American Carbon Registry fell from the top ranking in 2008 (24% market share) with only 7% of credits transacted through a registry in 2009. Behind the American Carbon Registry, the CDM/JI registry also saw a small market share (4% in both 2008 and 2009) despite the fact that registered volumes grew by 74% over the course of the year.
Since issuance is another key means of measuring the market share of registries, we also examined the total volume of credits issued, but not necessarily transacted, by several major registries in 2009. In this case, Markit took the lead with 10.1 MtCO2e issued by multiple standards, followed by the APX VCS registry (7.9 MtCO2e) and then Caisse des Depots (1.9 MtCO2e), and Gold Standard (2.0 MtCO2e)1
1 Serviced by APX.
.
21%
1%
17%
11%
15%
4%
10% 8%
8%
8%
5%
7%
22%
1%
14%
13%
34%
2009
2008
APX (VCS) CAR CCX Caisse des Depots Markit Gold Standard ACR Internal Other

State of the Voluntary Carbon Markets 2010 | xi
Figure 9: Transaction Volume vs. Issuance by Registry, OTC 2009 MtCO2e
Source: Ecosystem Marketplace, Bloomberg New Energy Finance.
Suppliers described the voluntary carbon market in 2009 as a buyers’ market—where buyers grew increasingly savvy about navigating the oversupplied alphabet soup of credits. A significant chunk of credits transacted in 2009 went to pre-compliance buyers focused on buying credits that might be eligible in a future compliance market. The other side of the market was driven by pure voluntary buyers focusing on charismatic carbon and/or offsetting on a budget.
Pure voluntary buyers with the intent to immediately retire the credits again took the lead as the main driver of transactions in 2009, capturing 48% of the market share (24 MtCO2e). This is up from 2008 when suppliers reported 32% of credits sold for retirement. Increased importance was seen for non-profit sector offsetting (at 7%, up from 1% in 2008) and businesses buying with a pre-compliance motive (23%, up from 1%).
Buyers in the United States supplanted European buyers as the dominant source of demand in the voluntary market in 2009. Respondents reported that the two regions combined purchased 90% of all offset credits, with European buyers (41%) falling behind US buyers (49%). In 2009, the US constituted the greatest market share of demand and supply (56%), reaffirming the important role that the pre-compliance market took on during the year. New Zealand and Australian buyers came in a very distant third to take home 4% of credits—most of these from domestic projects. The percentage of buyers in developing countries increased from 1% in 2008 to 4% in 2009.
10.1
7.9
2.9 2.92.0 1.9
0.2
2.0
5.6
1.9 2.5 2.0
4.4
0.020
2
4
6
8
10
12
Markit (multiple)
APX (VCS) American Carbon Registry
Caisse des Depots (VCS)
Gold Standard CAR Blue Registry
Issued Transacted

xii|State of the Voluntary Carbon Markets 2010
Market Participants Expect Continued Growth in Voluntary Carbon Markets In 2010, the prospects for US federal climate change legislation have declined significantly, while the economic recovery seems to be well underway. As a result, this year may see a relative shift away from the pre-compliance market and back towards the ‘pure’ voluntary markets, as was the case in previous years.
Survey respondents were highly positive about the prospects for the global voluntary markets and collectively believe transactions will increase to approximately 400 MtCO2e in 2012, 800 MtCO2e in 2015 and 1,200 MtCO2e in 2020. Whether this growth will actually be achieved remains to be seen, yet it does demonstrate a strong sense of optimism for future activity in the voluntary marketplace.
With respect to standards, most respondents intend to use the VCS (64%), followed closely by Gold Standard (42%), the Climate Action Reserve (34%) and the CDM (33%). This generally suggests a continuation of the trend of the past few years although the expected usage of the CDM is remarkable with the emergence of popular voluntary standards. Projected registry use largely follows standards, with the most popular choices being two of the three registries in the VCS Registry System—APX (43%) and Markit (36%)—followed by the Gold Standard (36%), CAR (33%) and the CDM/JI registry (26%).