building bridges: from conviction to employment · building bridges: from conviction to employment...
TRANSCRIPT
Council of State GovernmentsCriminal Justice Programs
Building Bridges: From Conviction to EmploymentA Proposal to Reinvest Corrections Savings in an Employment Initiative
ONE YEAR LATER
Submitted to: Representative William DysonChair, Appropriations CommitteeConnecticut General Assembly
February 18, 2004

Points of view, recommendations, or findings stated in this document are those of the authors and do notnecessarily represent the official position or policies of the Council of State Governments.
The Council of State Governments (CSG) is a non-profit, non-partisan organization that serves allelected and appointed officials in the three branches of state government. Founded in 1933, CSG is unique inboth its regional structure and its constituency-which includes state legislators, judges, and executive branchofficials. The organization is funded largely through state government dues.
Building Bridges: From Conviction to EmploymentA Proposal to Reinvest Corrections Savings in an Employment Initiative:
One Year Later
Table of Contents
Memorandum: Update to the “Building Bridges” Report . . . . . . . . . . . . . . . . . . . . . . . . . . . . . . . 3
Table 1: Changes in the Connecticut Prison Population . . . . . . . . . . . . . . . . . . . . . . . . . . . . . . . . 5
Table 2: Key Changes in Admissions and Releases, 2002 and 2003 . . . . . . . . . . . . . . . . . . . . . . . 6
Table 3: Cross Tab of Admit Types with Legal Status, Comparison of 2002 and 2003 . . . . . . . . 7
Table 4: Cross Tab of Release Types with Legal Status, Comparison of 2002 and 2003 . . . . . . . 8
Table 5: Average Length of Stay by Release Type, Comparison of 2002 and 2003 . . . . . . . . . . . 9
Historical Inmate Population by Gender and Legal Status (4 charts) . . . . . . . . . . . . . . . . . . . . . 10
Maps of Connecticut Prison Admissions and Expenditures by Jurisdiction (7 maps) . . . . . . . . 14
Memorandum: analysis of potential budget savings from implementation of HB 6694 . . . . . . . 22
Biographies of Contributors . . . . . . . . . . . . . . . . . . . . . . . . . . . . . . . . . . . . . . . . . . . . . . . . . . . . . 25
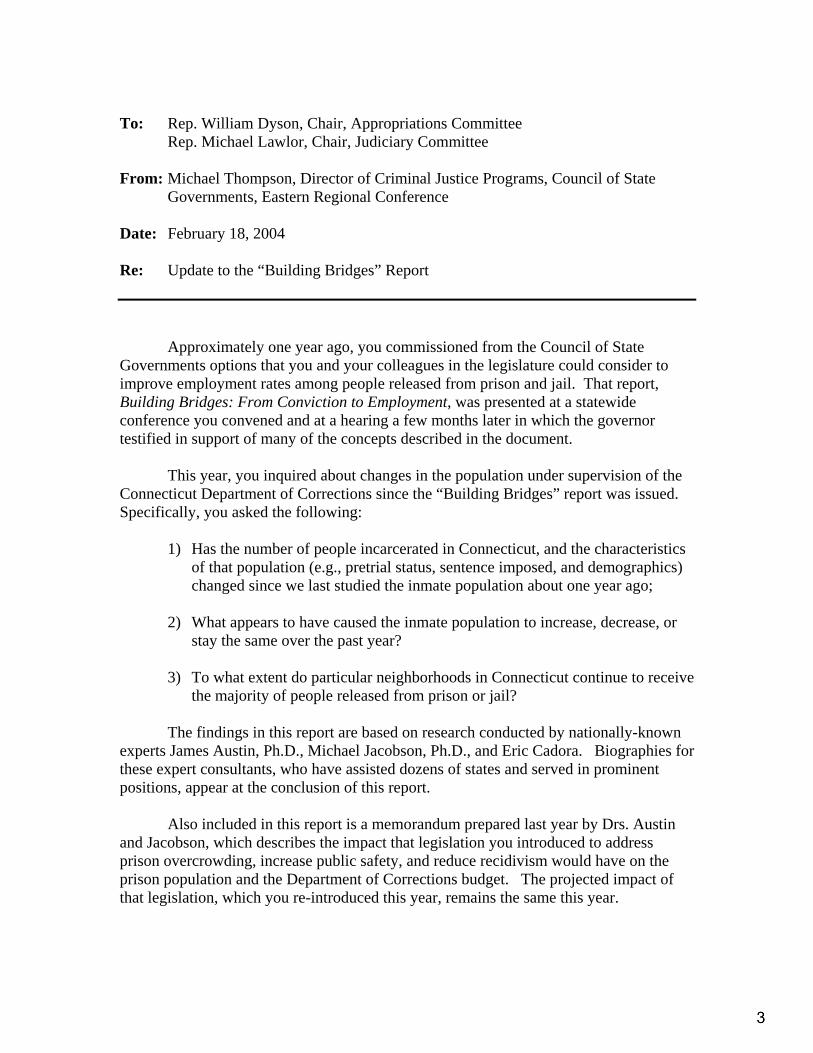
To: Rep. William Dyson, Chair, Appropriations Committee Rep. Michael Lawlor, Chair, Judiciary Committee From: Michael Thompson, Director of Criminal Justice Programs, Council of State
Governments, Eastern Regional Conference Date: February 18, 2004 Re: Update to the “Building Bridges” Report Approximately one year ago, you commissioned from the Council of State Governments options that you and your colleagues in the legislature could consider to improve employment rates among people released from prison and jail. That report, Building Bridges: From Conviction to Employment, was presented at a statewide conference you convened and at a hearing a few months later in which the governor testified in support of many of the concepts described in the document. This year, you inquired about changes in the population under supervision of the Connecticut Department of Corrections since the “Building Bridges” report was issued. Specifically, you asked the following:
1) Has the number of people incarcerated in Connecticut, and the characteristics of that population (e.g., pretrial status, sentence imposed, and demographics) changed since we last studied the inmate population about one year ago;
2) What appears to have caused the inmate population to increase, decrease, or
stay the same over the past year? 3) To what extent do particular neighborhoods in Connecticut continue to receive
the majority of people released from prison or jail?
The findings in this report are based on research conducted by nationally-known experts James Austin, Ph.D., Michael Jacobson, Ph.D., and Eric Cadora. Biographies for these expert consultants, who have assisted dozens of states and served in prominent positions, appear at the conclusion of this report.
Also included in this report is a memorandum prepared last year by Drs. Austin
and Jacobson, which describes the impact that legislation you introduced to address prison overcrowding, increase public safety, and reduce recidivism would have on the prison population and the Department of Corrections budget. The projected impact of that legislation, which you re-introduced this year, remains the same this year.

Data used to inform this research includes numbers provided by the Department of Corrections. Without their cooperation, this report would not have been possible. That said, the quality of data being recorded by the DOC and its capacity to analyze the data is extremely limited as compared to most state prison systems. These limitations make it impossible to issue reliable forecasts of future prison populations, evaluate the impact of past initiatives, and test the impact of proposed legislation and policies. The expert consultants note that the costs of upgrading the state’s research and planning capabilities are minimal as compared to how much money would be saved by improving the effectiveness of current correctional agency operations.
Compiled by James Austin, Ph.D.
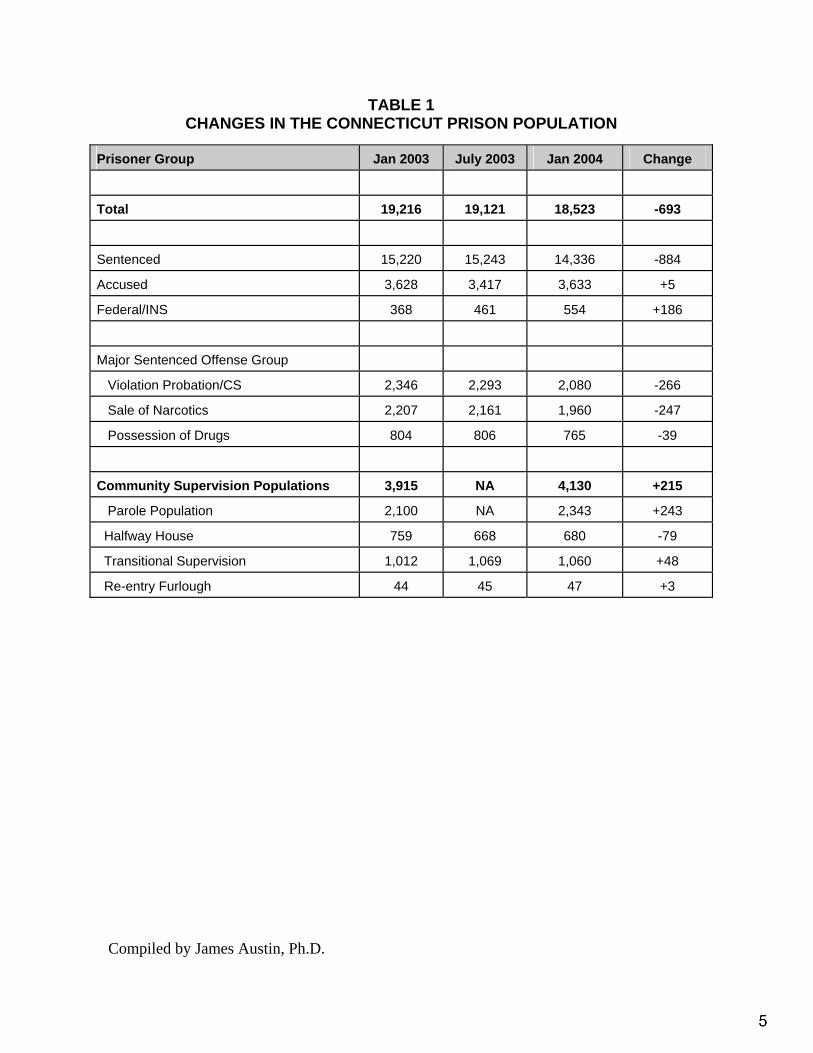
TABLE 1 CHANGES IN THE CONNECTICUT PRISON POPULATION
Prisoner Group Jan 2003 July 2003 Jan 2004 Change
Total 19,216 19,121 18,523 -693
Sentenced 15,220 15,243 14,336 -884
Accused 3,628 3,417 3,633 +5
Federal/INS 368 461 554 +186
Major Sentenced Offense Group
Violation Probation/CS 2,346 2,293 2,080 -266
Sale of Narcotics 2,207 2,161 1,960 -247
Possession of Drugs 804 806 765 -39
Community Supervision Populations 3,915 NA 4,130 +215
Parole Population 2,100 NA 2,343 +243
Halfway House 759 668 680 -79
Transitional Supervision 1,012 1,069 1,060 +48
Re-entry Furlough 44 45 47 +3
Compiled by James Austin, Ph.D.
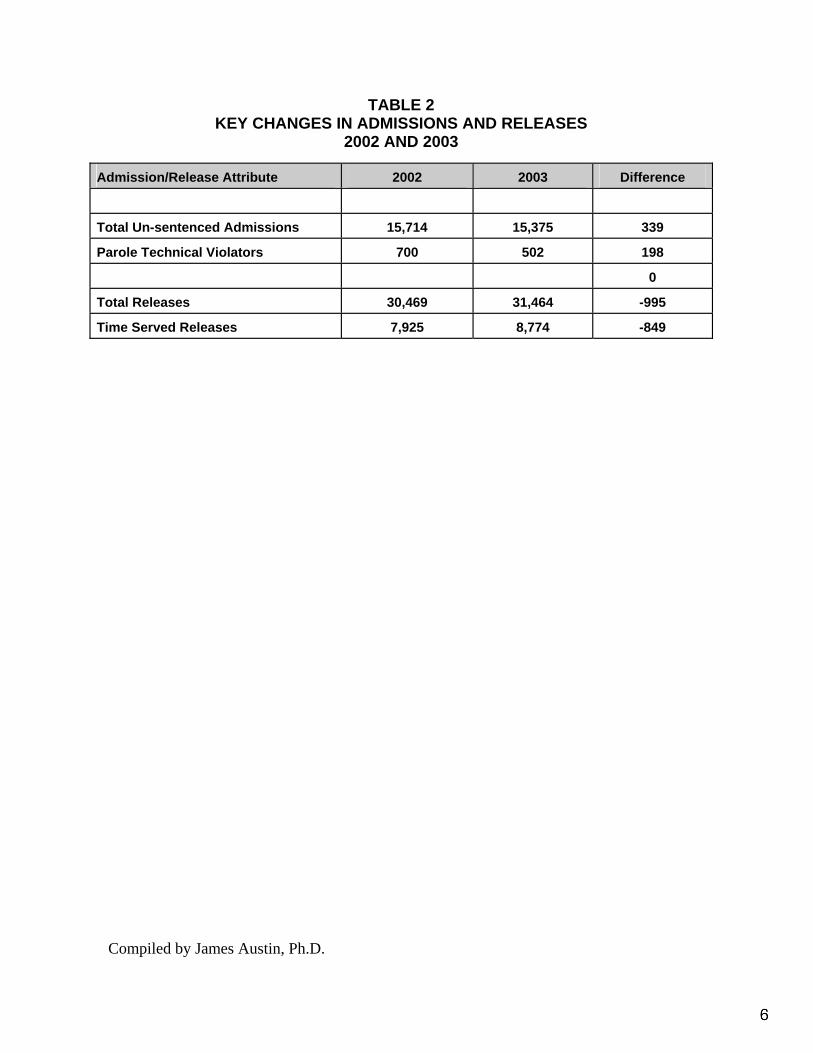
TABLE 2 KEY CHANGES IN ADMISSIONS AND RELEASES
2002 AND 2003
Admission/Release Attribute 2002 2003 Difference
Total Un-sentenced Admissions 15,714 15,375 339
Parole Technical Violators 700 502 198
0
Total Releases 30,469 31,464 -995
Time Served Releases 7,925 8,774 -849
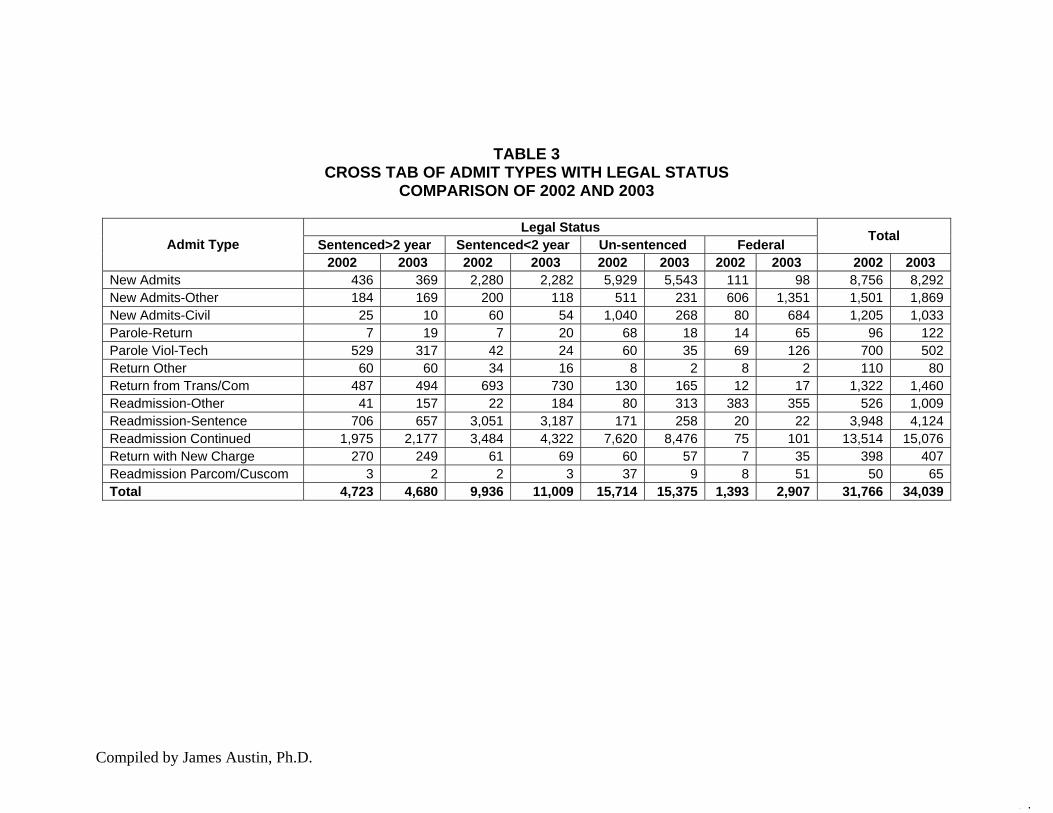
TABLE 3 CROSS TAB OF ADMIT TYPES WITH LEGAL STATUS
COMPARISON OF 2002 AND 2003
Legal Status Sentenced>2 year Sentenced<2 year Un-sentenced Federal Total Admit Type
2002 2003 2002 2003 2002 2003 2002 2003 2002 2003New Admits 436 369 2,280 2,282 5,929 5,543 111 98 8,756 8,292New Admits-Other 184 169 200 118 511 231 606 1,351 1,501 1,869New Admits-Civil 25 10 60 54 1,040 268 80 684 1,205 1,033Parole-Return 7 19 7 20 68 18 14 65 96 122Parole Viol-Tech 529 317 42 24 60 35 69 126 700 502Return Other 60 60 34 16 8 2 8 2 110 80Return from Trans/Com 487 494 693 730 130 165 12 17 1,322 1,460Readmission-Other 41 157 22 184 80 313 383 355 526 1,009Readmission-Sentence 706 657 3,051 3,187 171 258 20 22 3,948 4,124Readmission Continued 1,975 2,177 3,484 4,322 7,620 8,476 75 101 13,514 15,076Return with New Charge 270 249 61 69 60 57 7 35 398 407Readmission Parcom/Cuscom 3 2 2 3 37 9 8 51 50 65Total 4,723 4,680 9,936 11,009 15,714 15,375 1,393 2,907 31,766 34,039
Compiled by James Austin, Ph.D.
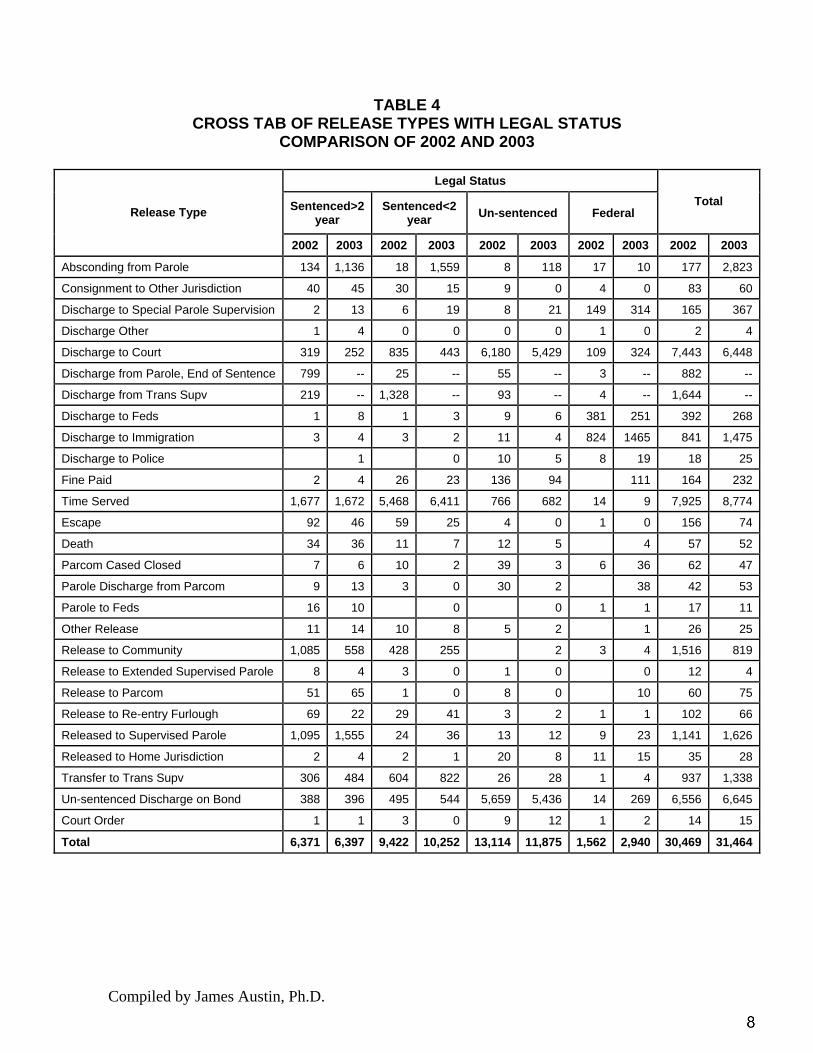
TABLE 4 CROSS TAB OF RELEASE TYPES WITH LEGAL STATUS
COMPARISON OF 2002 AND 2003
Legal Status
Sentenced>2 year
Sentenced<2 year Un-sentenced Federal
Total Release Type
2002 2003 2002 2003 2002 2003 2002 2003 2002 2003
Absconding from Parole 134 1,136 18 1,559 8 118 17 10 177 2,823
Consignment to Other Jurisdiction 40 45 30 15 9 0 4 0 83 60
Discharge to Special Parole Supervision 2 13 6 19 8 21 149 314 165 367
Discharge Other 1 4 0 0 0 0 1 0 2 4
Discharge to Court 319 252 835 443 6,180 5,429 109 324 7,443 6,448
Discharge from Parole, End of Sentence 799 -- 25 -- 55 -- 3 -- 882 --
Discharge from Trans Supv 219 -- 1,328 -- 93 -- 4 -- 1,644 --
Discharge to Feds 1 8 1 3 9 6 381 251 392 268
Discharge to Immigration 3 4 3 2 11 4 824 1465 841 1,475
Discharge to Police 1 0 10 5 8 19 18 25
Fine Paid 2 4 26 23 136 94 111 164 232
Time Served 1,677 1,672 5,468 6,411 766 682 14 9 7,925 8,774
Escape 92 46 59 25 4 0 1 0 156 74
Death 34 36 11 7 12 5 4 57 52
Parcom Cased Closed 7 6 10 2 39 3 6 36 62 47
Parole Discharge from Parcom 9 13 3 0 30 2 38 42 53
Parole to Feds 16 10 0 0 1 1 17 11
Other Release 11 14 10 8 5 2 1 26 25
Release to Community 1,085 558 428 255 2 3 4 1,516 819
Release to Extended Supervised Parole 8 4 3 0 1 0 0 12 4
Release to Parcom 51 65 1 0 8 0 10 60 75
Release to Re-entry Furlough 69 22 29 41 3 2 1 1 102 66
Released to Supervised Parole 1,095 1,555 24 36 13 12 9 23 1,141 1,626
Released to Home Jurisdiction 2 4 2 1 20 8 11 15 35 28
Transfer to Trans Supv 306 484 604 822 26 28 1 4 937 1,338
Un-sentenced Discharge on Bond 388 396 495 544 5,659 5,436 14 269 6,556 6,645
Court Order 1 1 3 0 9 12 1 2 14 15
Total 6,371 6,397 9,422 10,252 13,114 11,875 1,562 2,940 30,469 31,464
Compiled by James Austin, Ph.D.
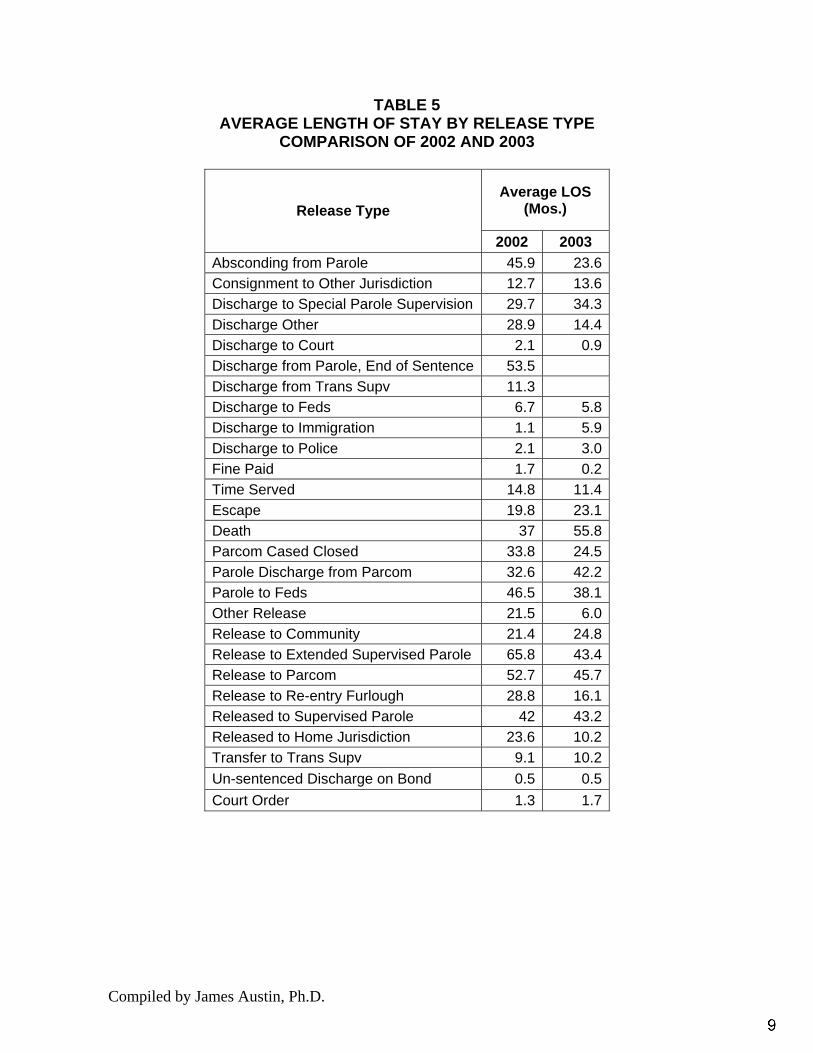
TABLE 5 AVERAGE LENGTH OF STAY BY RELEASE TYPE
COMPARISON OF 2002 AND 2003
Average LOS (Mos.) Release Type
2002 2003 Absconding from Parole 45.9 23.6 Consignment to Other Jurisdiction 12.7 13.6 Discharge to Special Parole Supervision 29.7 34.3 Discharge Other 28.9 14.4 Discharge to Court 2.1 0.9 Discharge from Parole, End of Sentence 53.5 Discharge from Trans Supv 11.3 Discharge to Feds 6.7 5.8 Discharge to Immigration 1.1 5.9 Discharge to Police 2.1 3.0 Fine Paid 1.7 0.2 Time Served 14.8 11.4 Escape 19.8 23.1 Death 37 55.8 Parcom Cased Closed 33.8 24.5 Parole Discharge from Parcom 32.6 42.2 Parole to Feds 46.5 38.1 Other Release 21.5 6.0 Release to Community 21.4 24.8 Release to Extended Supervised Parole 65.8 43.4 Release to Parcom 52.7 45.7 Release to Re-entry Furlough 28.8 16.1 Released to Supervised Parole 42 43.2 Released to Home Jurisdiction 23.6 10.2 Transfer to Trans Supv 9.1 10.2 Un-sentenced Discharge on Bond 0.5 0.5 Court Order 1.3 1.7
Compiled by James Austin, Ph.D.
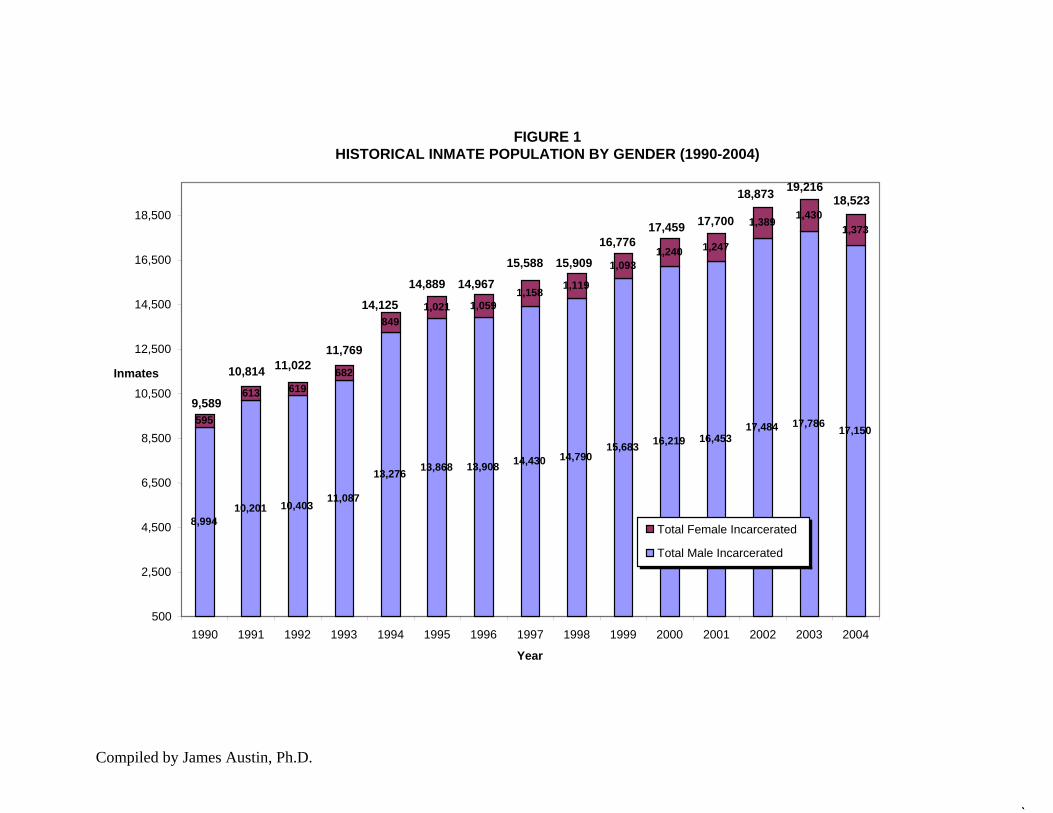
FIGURE 1 HISTORICAL INMATE POPULATION BY GENDER (1990-2004)
19,21618,873 18,52318,500 1,43017,700 1,38917,459 1,373
16,776 1,2471,24016,500 1,093 15,588 15,909
14,889 14,967 1,1191,15814,500 14,125 1,0591,021
849
12,500 11,76911,022 10,814
8,994 10,201 10,403 11,087
13,276 13,868 13,908 14,430 14,79015,683 16,219 16,453
17,484 17,786 17,150595
613 619 682
10,500 Inmates
9,589
8,500
6,500
4,500 Total Female Incarcerated
Total Male Incarcerated2,500
500 1990 1991 1992 1999 1993 1994 1995 1996 1997 1998 2000 2001 2002 2003 2004
Year
Compiled by James Austin, Ph.D.

FIGURE 2 HISTORICAL PRISON POPULATION BY LEGAL STATUS (1990-2004)
19,21618,87319,000 18,523
17,70017,45916,776
17,000 15,90915,588
15,22014,96714,889 14,84515,000 14,36414,125
14,33614,23013,483
13,000 12,37012,04011,769 11,659
9,589
10,814 11,022
4,187
7,740
1,849 1,813 1,859 2,134
2,466 2,849 2,9533,369 3,539 3,293 3,095
3,4704,028
3,628
9,001 9,163 9,635
12,014 12,219
11,000 Inmates
Total Incarcerated9,000
Total Accused/Feds
7,000 Total Sentenced
5,000
3,000
1,000 1990 1991 1992 1999 1993 1994 1995 1996 1997 1998 2000 2001 2002 2003 2004
Year
Compiled by James Austin, Ph.D.
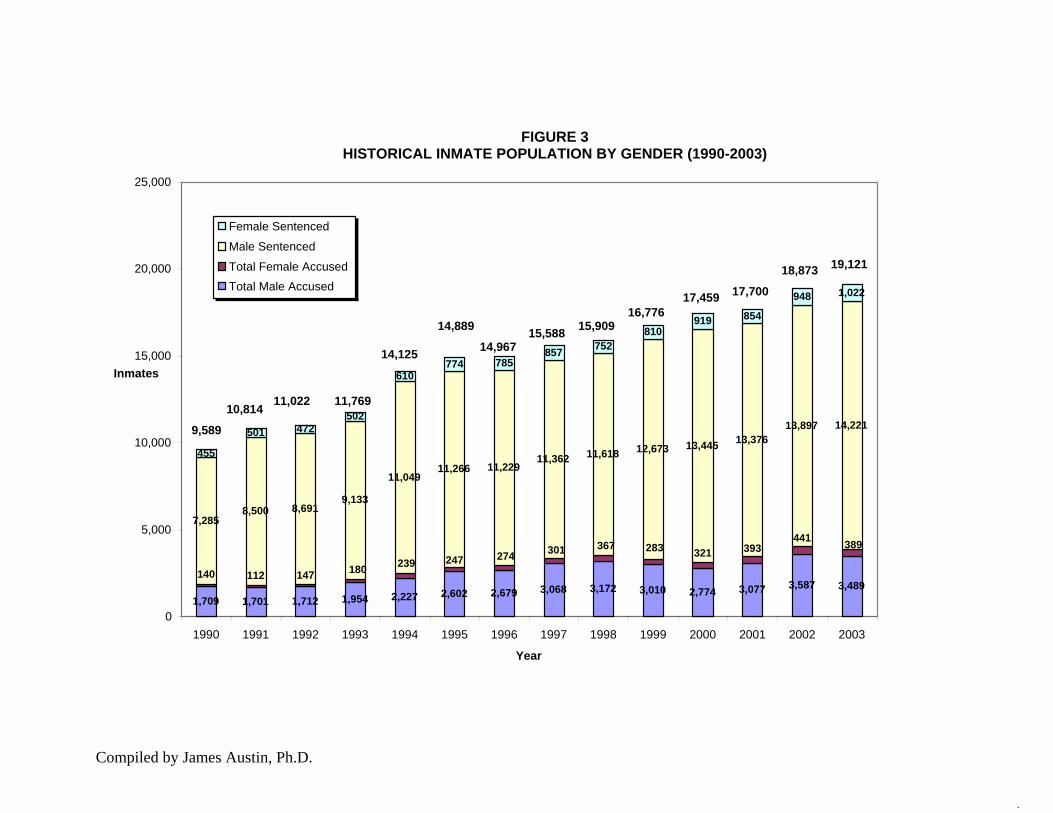
FIGURE 3 HISTORICAL INMATE POPULATION BY GENDER (1990-2003)
25,000
Female Sentenced
Male Sentenced 19,12120,000 Total Female Accused 18,873
Total Male Accused 17,700 1,02294817,45916,776 854919
1,709 1,701 1,712 1,954 2,227 2,602 2,679 3,068 3,172 3,010 2,774 3,077 3,587 3,489
7,285 8,500 8,691 9,133
11,04911,266 11,229
11,362 11,618 12,673 13,445 13,37613,897 14,221
455 501 472
502
610774 785
857 752 15,909 14,889 81015,588
14,96715,000 14,125
Inmates
11,022 11,76910,814 9,589
10,000
5,000 441
367 389283 393301 321274247239140 180147 112
0 1990 1991 1992 1998 1993 1994 1995 1996 1997 1999 2000 2001 2002 2003
Year
Compiled by James Austin, Ph.D.
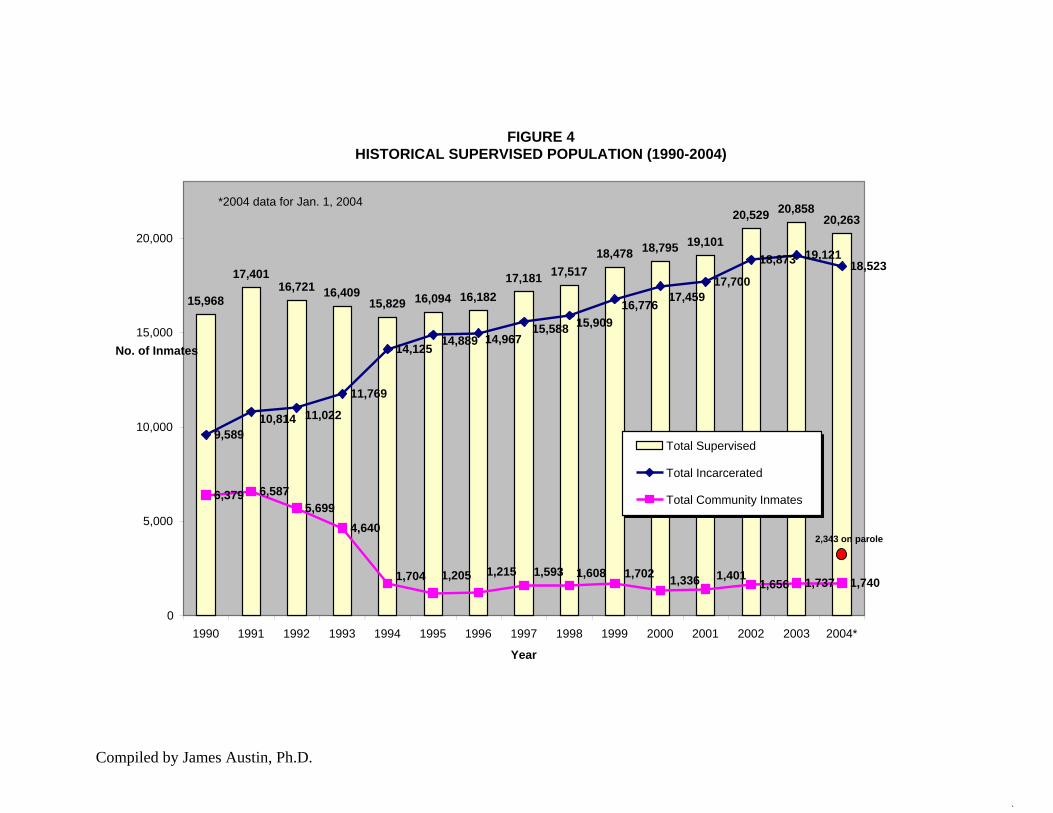
FIGURE 4 HISTORICAL SUPERVISED POPULATION (1990-2004)
*2004 data for Jan. 1, 2004 20,85820,529 20,26320,000 19,10118,79518,478 19,12118,873 18,52317,401 17,51717,181 17,70016,721 16,409
15,968 16,182 17,45916,09415,829 16,77615,909
15,000 15,58814,96714,889
No. of Inmates 14,125
11,769
10,814 11,02210,000 9,589
Total Supervised
Total Incarcerated6,587 6,379 Total Community Inmates5,699
5,000 4,6402,343 on parole
1,215 1,593 1,608 1,7021,205 1,4011,704 1,336 1,737 1,7401,656
0 1990 1991 1992 1999 1993 1994 1995 1996 1997 1998 2000 2001 2002 2003 2004*
Year
Compiled by James Austin, Ph.D.
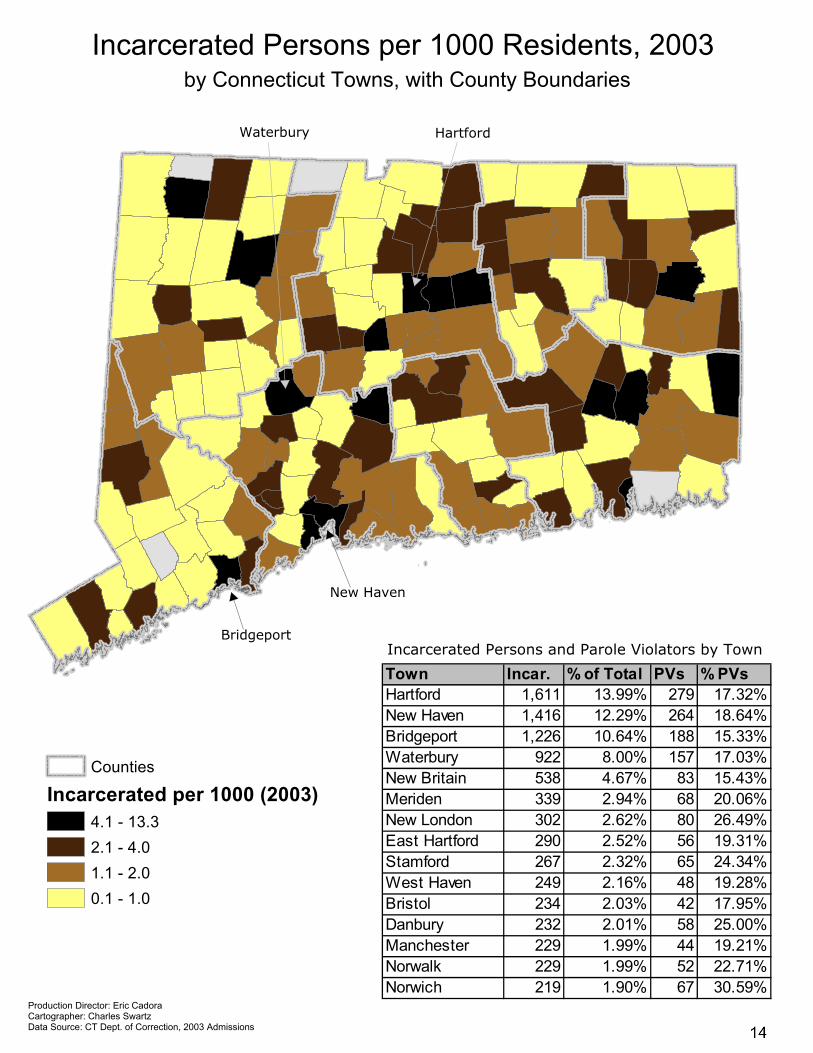
New Haven
Bridgeport
HartfordWaterbury
Incarcerated Persons per 1000 Residents, 2003by Connecticut Towns, with County Boundaries
Counties
Incarcerated per 1000 (2003)4.1 - 13.32.1 - 4.01.1 - 2.00.1 - 1.0
Incarcerated Persons and Parole Violators by Town
Town Incar. % of Total PVs % PVsHartford 1,611 13.99% 279 17.32%New Haven 1,416 12.29% 264 18.64%Bridgeport 1,226 10.64% 188 15.33%Waterbury 922 8.00% 157 17.03%New Britain 538 4.67% 83 15.43%Meriden 339 2.94% 68 20.06%New London 302 2.62% 80 26.49%East Hartford 290 2.52% 56 19.31%Stamford 267 2.32% 65 24.34%West Haven 249 2.16% 48 19.28%Bristol 234 2.03% 42 17.95%Danbury 232 2.01% 58 25.00%Manchester 229 1.99% 44 19.21%Norwalk 229 1.99% 52 22.71%Norwich 219 1.90% 67 30.59%
Production Director: Eric CadoraCartographer: Charles SwartzData Source: CT Dept. of Correction, 2003 Admissions
New Haven
Bridgeport
HartfordWaterbury
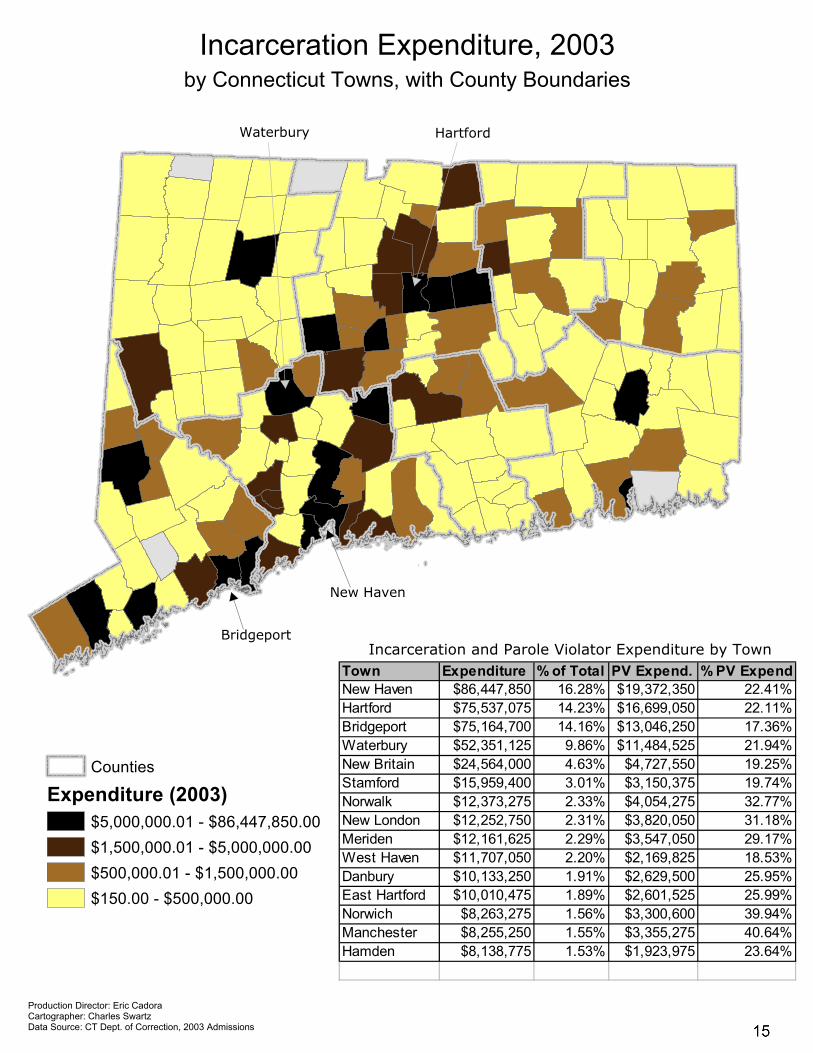
Incarceration Expenditure, 2003by Connecticut Towns, with County Boundaries
Counties
Expenditure (2003)$5,000,000.01 - $86,447,850.00$1,500,000.01 - $5,000,000.00$500,000.01 - $1,500,000.00$150.00 - $500,000.00
Incarceration and Parole Violator Expenditure by Town
Production Director: Eric CadoraCartographer: Charles SwartzData Source: CT Dept. of Correction, 2003 Admissions
Town Expenditure % of Total PV Expend. % PV ExpendNew Haven $86,447,850 16.28% $19,372,350 22.41%Hartford $75,537,075 14.23% $16,699,050 22.11%Bridgeport $75,164,700 14.16% $13,046,250 17.36%Waterbury $52,351,125 9.86% $11,484,525 21.94%New Britain $24,564,000 4.63% $4,727,550 19.25%Stamford $15,959,400 3.01% $3,150,375 19.74%Norwalk $12,373,275 2.33% $4,054,275 32.77%New London $12,252,750 2.31% $3,820,050 31.18%Meriden $12,161,625 2.29% $3,547,050 29.17%West Haven $11,707,050 2.20% $2,169,825 18.53%Danbury $10,133,250 1.91% $2,629,500 25.95%East Hartford $10,010,475 1.89% $2,601,525 25.99%Norwich $8,263,275 1.56% $3,300,600 39.94%Manchester $8,255,250 1.55% $3,355,275 40.64%Hamden $8,138,775 1.53% $1,923,975 23.64%
No
rth
Me
ad
ow
sN
ort
h M
ea
do
ws
No
rth
Ea
st
No
rth
Ea
st
Blu
e H
ills
Blu
e H
ills
As
ylu
m H
ill
As
ylu
m H
ill
We
st
En
dW
es
t E
nd
Up
pe
r A
lba
ny
Up
pe
r A
lba
ny
Cla
y A
rse
na
lC
lay
Ars
en
al
Do
wn
tow
nD
ow
nto
wn
Fro
g H
oll
ow
Fro
g H
oll
ow
Pa
rkv
ille
Pa
rkv
ille
Be
hin
d t
he
Ro
ck
sB
eh
ind
th
e R
oc
ks
So
uth
We
st
So
uth
We
st
So
uth
En
dS
ou
th E
nd
So
uth
Me
ad
ow
sS
ou
th M
ea
do
ws
Ba
rry
Sq
ua
reB
arr
y S
qu
are
Sh
eld
on
S
he
ldo
n
Ch
art
er
Oa
kC
ha
rte
r O
ak
So
uth
S
ou
th
Gre
en
Gre
en
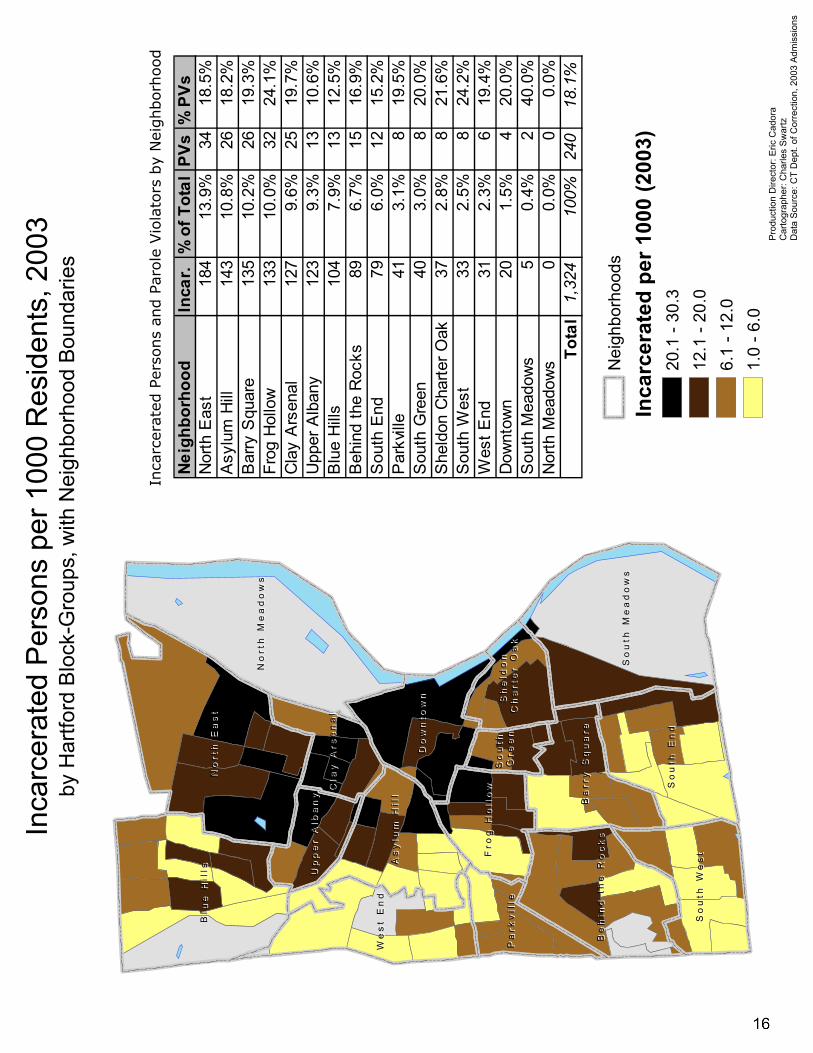
Inca
rcer
ated
Per
sons
per
100
0 R
esid
ents
, 200
3by
Har
tford
Blo
ck-G
roup
s, w
ith N
eigh
borh
ood
Boun
darie
s
Nei
ghbo
rhoo
ds
Inca
rcer
ated
per
100
0 (2
003)
20.1
- 30
.312
.1 -
20.0
6.1
- 12.
01.
0 - 6
.0Pr
oduc
tion
Dire
ctor
: Eric
Cad
ora
Car
togr
aphe
r: C
harle
s Sw
artz
Dat
a So
urce
: CT
Dep
t. of
Cor
rect
ion,
200
3 Ad
mis
sion
s
Neig
hbor
hood
Inca
r.%
of T
otal
PVs
% P
VsN
orth
Eas
t18
413
.9%
3418
.5%
Asy
lum
Hill
143
10.8
%26
18.2
%B
arry
Squ
are
135
10.2
%26
19.3
%Fr
og H
ollo
w13
310
.0%
3224
.1%
Cla
y A
rsen
al12
79.
6%25
19.7
%U
pper
Alb
any
123
9.3%
1310
.6%
Blu
e H
ills
104
7.9%
1312
.5%
Beh
ind
the
Roc
ks89
6.7%
1516
.9%
Sou
th E
nd79
6.0%
1215
.2%
Par
kvill
e41
3.1%
819
.5%
Sou
th G
reen
403.
0%8
20.0
%S
held
on C
harte
r Oak
372.
8%8
21.6
%S
outh
Wes
t33
2.5%
824
.2%
Wes
t End
312.
3%6
19.4
%D
ownt
own
201.
5%4
20.0
%S
outh
Mea
dow
s5
0.4%
240
.0%
Nor
th M
eado
ws
00.
0%0
0.0%
Tota
l1,324
100%
240
18.1%
Inca
rcer
ated
Per
sons
and P
arole
Vio
lato
rs b
y N
eighbor
hood

No
rth
Ea
st
No
rth
Ea
st
No
rth
Me
ad
ow
sN
ort
h M
ea
do
ws
So
uth
Me
ad
ow
sS
ou
th M
ea
do
ws
So
uth
En
dS
ou
th E
nd
So
uth
We
st
So
uth
We
st
Be
hin
d t
he
Ro
ck
sB
eh
ind
th
e R
oc
ks
Ba
rry
Sq
ua
reB
arr
y S
qu
are
So
uth
So
uth
Gre
en
Gre
en
Sh
eld
on
S
he
ldo
n
Ch
art
er
Oa
kC
ha
rte
r O
ak
Fro
g H
oll
ow
Fro
g H
oll
ow
Do
wn
tow
nD
ow
nto
wn
As
ylu
m H
ill
As
ylu
m H
ill
We
st
En
dW
es
t E
nd
Pa
rkv
ille
Pa
rkv
ille
Blu
e H
ills
Blu
e H
ills U
pp
er
Alb
an
yU
pp
er
Alb
an
y
Cla
y A
rse
na
lC
lay
Ars
en
alIn
carc
erat
ion
Expe
nditu
re, 2
003
by H
artfo
rd B
lock
-Gro
ups,
with
Nei
ghbo
rhoo
d Bo
unda
ries
Nei
ghbo
rhoo
ds
Expe
nditu
re (2
003)
$1,2
00,0
00.0
1 - $
2,96
5,05
0.00
$600
,000
.01
- $1,
200,
000.
00$2
50,0
00.0
1 - $
600,
000.
00$4
,500
.00
- $25
0,00
0.00 Prod
uctio
n D
irect
or: E
ric C
ador
aC
arto
grap
her:
Cha
rles
Swar
tzD
ata
Sour
ce: C
T D
ept.
of C
orre
ctio
n, 2
003
Adm
issi
ons
Inca
rcer
atio
n E
xpen
diture
by
Nei
ghborh
ood
Neig
hbor
hood
Expe
nditu
re%
of T
otal
PV E
xpen
d.%
Of E
xpen
d.U
pper
Alb
any
$8,2
10,5
5012
.7%
$802
,500
9.8%
Nor
th E
ast
$8,1
92,4
7512
.7%
$1,8
72,3
7522
.9%
Frog
Hol
low
$7,2
31,1
2511
.2%
$2,2
99,5
0031
.8%
Bar
ry S
quar
e$7
,093
,350
11.0
%$1
,227
,375
17.3
%A
sylu
m H
ill$5
,856
,075
9.1%
$1,5
75,0
0026
.9%
Cla
y A
rsen
al$5
,737
,950
8.9%
$1,1
88,3
7520
.7%
Blu
e H
ills
$5,0
87,1
757.
9%$5
90,2
5011
.6%
Beh
ind
the
Roc
ks$4
,952
,775
7.7%
$967
,500
19.5
%S
outh
End
$3,2
30,7
005.
0%$7
96,0
5024
.6%
She
ldon
Cha
rter O
ak$2
,124
,375
3.3%
$728
,250
34.3
%P
arkv
ille
$1,7
40,7
502.
7%$4
07,6
2523
.4%
Sou
th W
est
$1,4
17,7
252.
2%$4
08,3
7528
.8%
Sou
th G
reen
$1,2
91,1
252.
0%$3
00,7
5023
.3%
Dow
ntow
n$1
,159
,350
1.8%
$923
,625
79.7
%W
est E
nd$1
,134
,900
1.8%
$367
,875
32.4
%S
outh
Mea
dow
s$1
10,6
250.
2%$8
1,37
573
.6%
Nor
th M
eado
ws
$00.
0%$0
0.0%
Tota
l$64,571,025
100.
0%$14,536,800
22.5
%
We
stv
ille
We
stv
ille
We
sth
ills
We
sth
ills
Ne
wh
all
vil
leN
ew
ha
llv
ille
Pro
sp
ec
t H
ill
Pro
sp
ec
t H
ill
Fa
ir H
av
en
Fa
ir H
av
en
He
igh
tsH
eig
hts
Ea
st
Sh
ore
Ea
st
Sh
ore
Lo
ng
Wa
rfL
on
g W
arf
Ch
urc
h S
t. S
ou
thC
hu
rch
St.
So
uth
Hil
l (4
Cit
y P
oin
t)H
ill
(4 C
ity
Po
int)
Ed
ge
wo
od
Ed
ge
wo
od
We
st
Riv
er
We
st
Riv
er
Be
av
er
Hil
lsB
ea
ve
r H
ills
Dix
we
llD
ixw
ell Y
ale
Ya
le
Ea
st
Ro
ck
Ea
st
Ro
ck
CB
DC
BD
Wo
os
ter
Wo
os
ter
Sq
ua
reS
qu
are
Dw
igh
tD
wig
ht
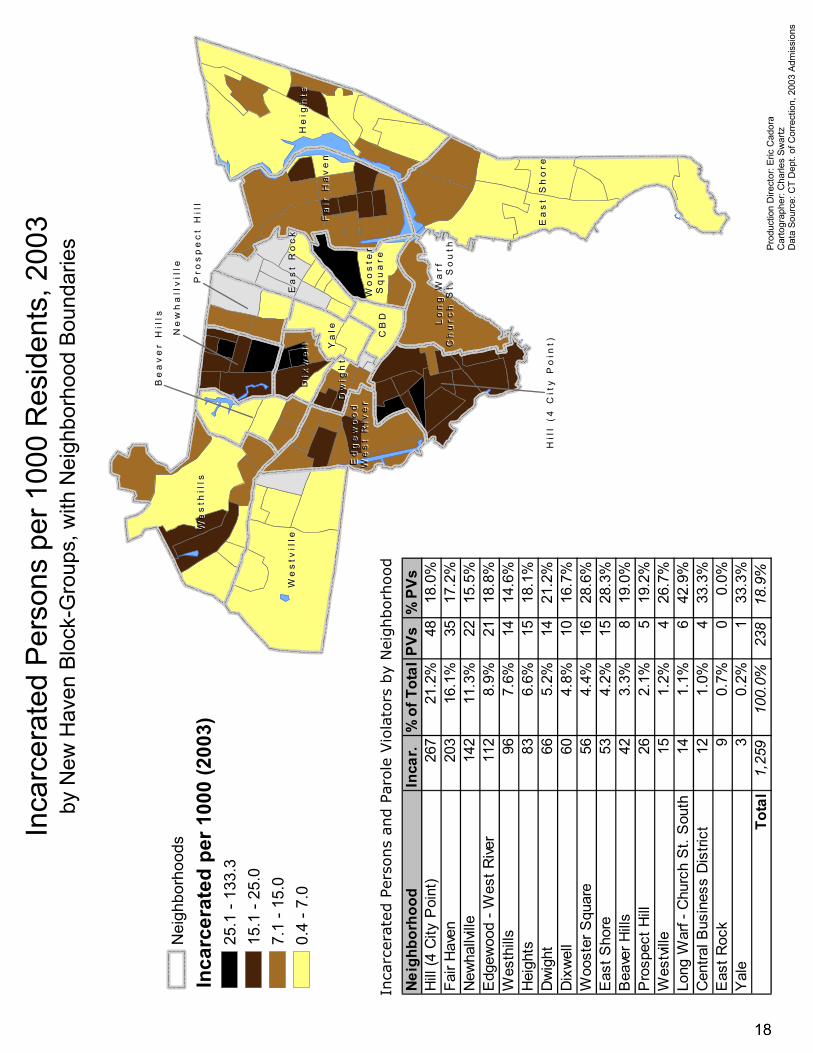
Nei
ghbo
rhoo
ds
Inca
rcer
ated
per
100
0 (2
003)
25.1
- 13
3.3
15.1
- 25
.07.
1 - 1
5.0
0.4
- 7.0
Inca
rcer
ated
Per
sons
and P
arole
Vio
lato
rs b
y N
eighborh
ood
Prod
uctio
n D
irect
or: E
ric C
ador
aC
arto
grap
her:
Cha
rles
Swar
tzD
ata
Sour
ce: C
T D
ept.
of C
orre
ctio
n, 2
003
Adm
issi
ons
Inca
rcer
ated
Per
sons
per
100
0 R
esid
ents
, 200
3by
New
Hav
en B
lock
-Gro
ups,
with
Nei
ghbo
rhoo
d Bo
unda
ries
Neig
hbor
hood
Inca
r.%
of T
otal
PVs
% P
VsH
ill (4
City
Poi
nt)
267
21.2
%48
18.0
%Fa
ir H
aven
203
16.1
%35
17.2
%N
ewha
llvill
e14
211
.3%
2215
.5%
Edg
ewoo
d - W
est R
iver
112
8.9%
2118
.8%
Wes
thill
s96
7.6%
1414
.6%
Hei
ghts
836.
6%15
18.1
%D
wig
ht66
5.2%
1421
.2%
Dix
wel
l60
4.8%
1016
.7%
Woo
ster
Squ
are
564.
4%16
28.6
%E
ast S
hore
534.
2%15
28.3
%B
eave
r Hill
s42
3.3%
819
.0%
Pro
spec
t Hill
262.
1%5
19.2
%W
estv
ille
151.
2%4
26.7
%Lo
ng W
arf -
Chu
rch
St.
Sou
th14
1.1%
642
.9%
Cen
tral B
usin
ess
Dis
trict
121.
0%4
33.3
%E
ast R
ock
90.
7%0
0.0%
Yal
e3
0.2%
133
.3%
Tota
l1,259
100.0%
238
18.9%
We
sth
ills
We
sth
ills
We
stv
ille
We
stv
ille
He
igh
tsH
eig
hts
Ea
st
Sh
ore
Ea
st
Sh
ore
Fa
ir H
av
en
Fa
ir H
av
en
Lo
ng
Wa
rfL
on
g W
arf
Ch
urc
h S
t. S
ou
thC
hu
rch
St.
So
uth
Wo
os
ter
Wo
os
ter
Sq
ua
reS
qu
are
Ea
st
Ro
ck
Ea
st
Ro
ck
Pro
sp
ec
t H
ill
Pro
sp
ec
t H
ill
Ne
wh
all
vil
leN
ew
ha
llv
ille
Ed
ge
wo
od
Ed
ge
wo
od
We
st
Riv
er
We
st
Riv
er
Hil
l (4
Cit
y P
oin
t)H
ill
(4 C
ity
Po
int)
Dw
igh
tD
wig
ht
Dix
we
llD
ixw
ell Y
ale
Ya
le CB
DC
BD
Be
av
er
Hil
lsB
ea
ve
r H
ills
Nei
ghbo
rhoo
ds
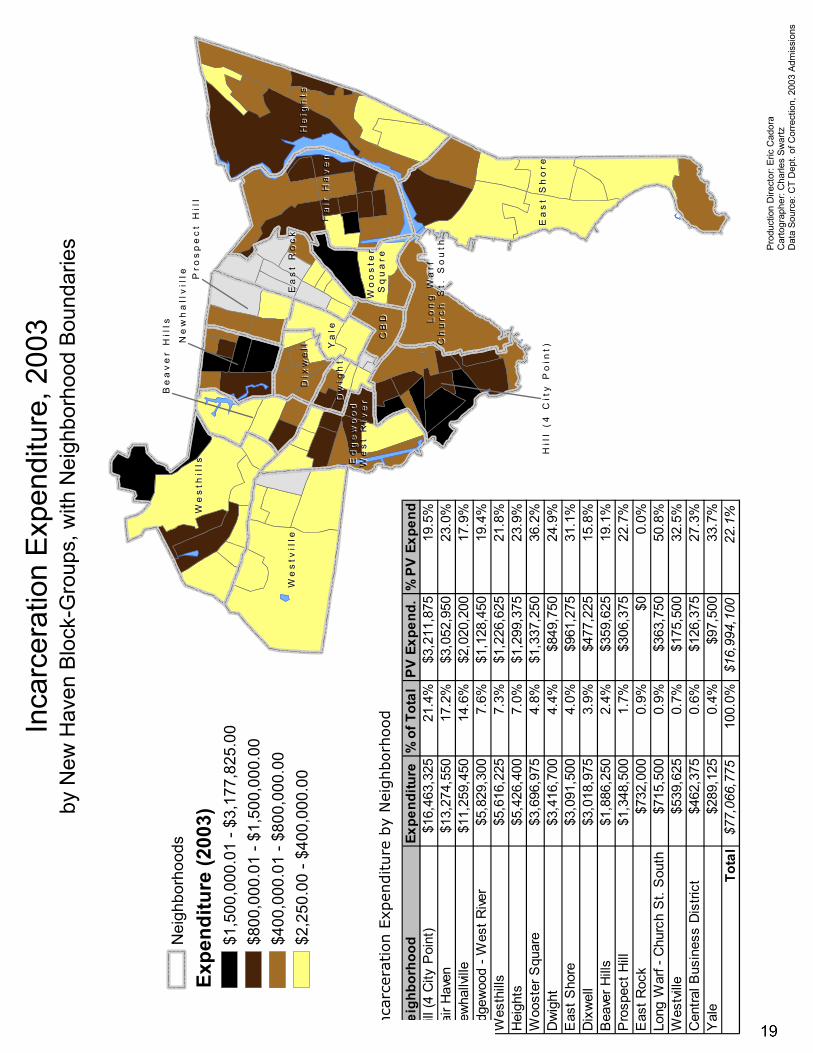
Expe
nditu
re (2
003)
$1,5
00,0
00.0
1 - $
3,17
7,82
5.00
$800
,000
.01
- $1,
500,
000.
00$4
00,0
00.0
1 - $
800,
000.
00$2
,250
.00
- $40
0,00
0.00
Inca
rcer
ation E
xpen
diture
by
Nei
ghborh
ood
Prod
uctio
n D
irect
or: E
ric C
ador
aC
arto
grap
her:
Cha
rles
Swar
tzD
ata
Sour
ce: C
T D
ept.
of C
orre
ctio
n, 2
003
Adm
issi
ons
Inca
rcer
atio
n Ex
pend
iture
, 200
3by
New
Hav
en B
lock
-Gro
ups,
with
Nei
ghbo
rhoo
d Bo
unda
ries
Neig
hbor
hood
Expe
nditu
re%
of T
otal
PV E
xpen
d.%
PV
Expe
ndH
ill (4
City
Poi
nt)
$16,
463,
325
21.4
%$3
,211
,875
19.5
%Fa
ir H
aven
$13,
274,
550
17.2
%$3
,052
,950
23.0
%N
ewha
llvill
e$1
1,25
9,45
014
.6%
$2,0
20,2
0017
.9%
Edg
ewoo
d - W
est R
iver
$5,8
29,3
007.
6%$1
,128
,450
19.4
%W
esth
ills
$5,6
16,2
257.
3%$1
,226
,625
21.8
%H
eigh
ts$5
,426
,400
7.0%
$1,2
99,3
7523
.9%
Woo
ster
Squ
are
$3,6
96,9
754.
8%$1
,337
,250
36.2
%D
wig
ht$3
,416
,700
4.4%
$849
,750
24.9
%E
ast S
hore
$3,0
91,5
004.
0%$9
61,2
7531
.1%
Dix
wel
l$3
,018
,975
3.9%
$477
,225
15.8
%B
eave
r Hill
s$1
,886
,250
2.4%
$359
,625
19.1
%P
rosp
ect H
ill$1
,348
,500
1.7%
$306
,375
22.7
%E
ast R
ock
$732
,000
0.9%
$00.
0%Lo
ng W
arf -
Chu
rch
St.
Sou
th$7
15,5
000.
9%$3
63,7
5050
.8%
Wes
tvill
e$5
39,6
250.
7%$1
75,5
0032
.5%
Cen
tral B
usin
ess
Dis
trict
$462
,375
0.6%
$126
,375
27.3
%Y
ale
$289
,125
0.4%
$97,
500
33.7
%To
tal$77,066,775
100.
0%$16,994,100
22.1%
Hil
l (4
Cit
y P
oin
t)H
ill
(4 C
ity
Po
int)
Lo
ng
Wa
rfL
on
g W
arf
Ch
urc
h S
t. S
ou
thC
hu
rch
St.
So
uth
Fa
ir H
av
en
Fa
ir H
av
en
Wo
os
ter
Sq
ua
reW
oo
ste
r S
qu
are
Prod
uctio
n D
irect
or: E
ric C
ador
aC
arto
grap
her:
Cha
rles
Sw
artz
Dat
a So
urce
: CT
Dep
t. of
Cor
rect
ion,
200
3 Ad
mis
sion
san
d U
S C
ensu
s Bu
reau
, 200
0 C
ensu
s D
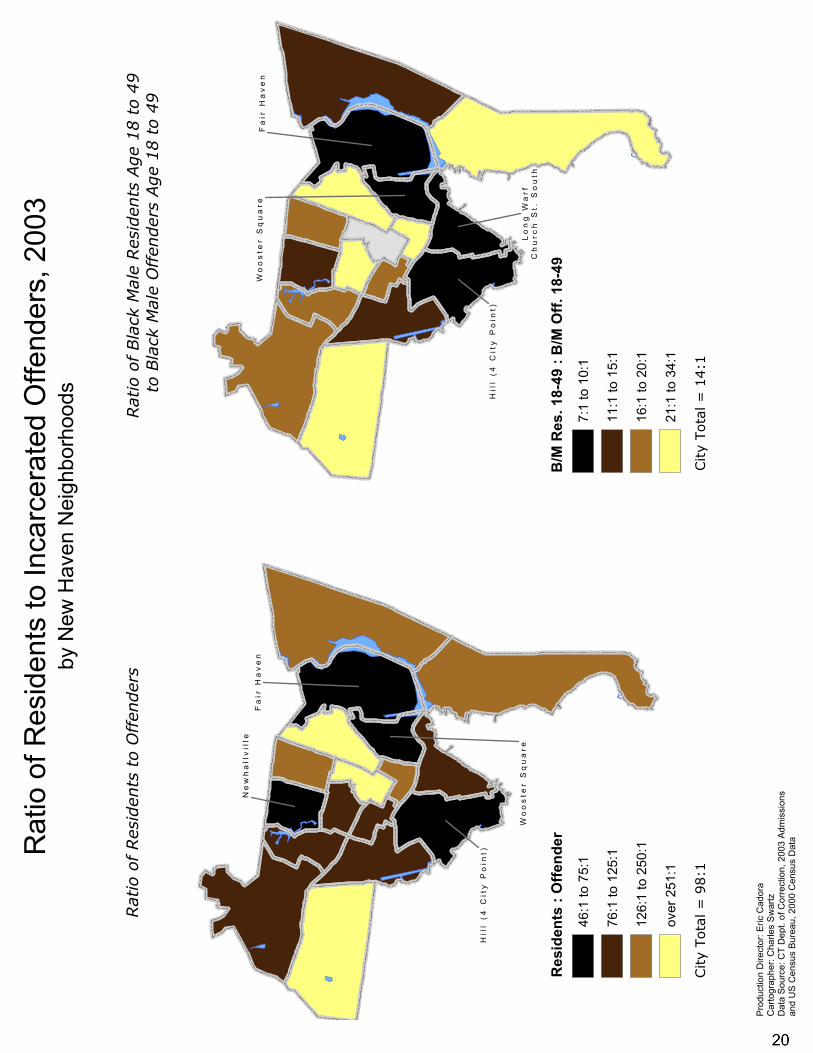
ataRat
io o
f Res
iden
ts to
Inca
rcer
ated
Offe
nder
s, 2
003
by N
ew H
aven
Nei
ghbo
rhoo
ds
Hil
l (4
Cit
y P
oin
t)H
ill
(4 C
ity
Po
int)
Ne
wh
all
vil
leN
ew
ha
llv
ille
Fa
ir H
av
en
Fa
ir H
av
en
Wo
os
ter
Sq
ua
reW
oo
ste
r S
qu
are
Res
iden
ts :
Offe
nder
46:1
to 7
5:1
76:1
to 1
25:1
126:
1 to
250
:1
over
251
:1
B/M
Res
. 18-
49 :
B/M
Off.
18-
49
7:1
to 1
0:1
11:1
to 1
5:1
16:1
to 2
0:1
21:1
to 3
4:1
Rat
io o
f Res
iden
ts t
o O
ffen
der
sRat
io o
f Bla
ck M
ale
Res
iden
ts A
ge
18 t
o 4
9
to B
lack
Mal
e O
ffen
der
s Age
18 t
o 4
9
City
Tota
l =
98:1
City
Tota
l =
14:1
Note: Some reported figures will be different regarding total numbers incarcerated and total expenditures for New Haven and Hartford when reported in the state maps of Connecticut as compared to the city maps of New Haven and Hartford. The difference is a result of geocoding techniques. When geocoding towns for the state maps, the "town" field was used to count instances of incarceration and to calculate expenditures – these are nearly 100 percent accurate. When geocoding neighborhoods for the city maps, the "street address" fields were used, in which case approximately 10 percent of the street addresses were not geocoded due to inaccurate data. The result is that the totals in the city maps will be slightly smaller than those in the state maps. Production Director: Eric Cadora Cartographer: Charles Swartz Data Source: CT Dept. of Correction, 2003 Admissions

TO: Representative William R. Dyson, Chairperson Senator Toni N. Harp, Chairperson Senator Joan V. Hartley, Vice Chairperson Representative Annette Carter, Vice Chairperson Representative Konstantinos Diamantis, Vice Chairperson Representative Sandy Nofis, Vice Chairperson Representative Christel H. Truglia, Vice Chairperson Senator Robert L. Genario, Ranking Member Representative Peter A. Metz, Ranking Member
Appropriations Committee Representative Michael P. Lawlor, Chairperson Senator Andrew J. McDonald, Chairperson Senator Christopher S. Murphy, Vice Chairperson Representative Christopher R. Stone, Vice Chairperson Senator John A. Kissel, Ranking Member Representative Robert Farr, Ranking Member Judiciary Committee Connecticut General Assembly FROM: James Austin, The Institute on Crime, Justice and Corrections, George
Washington University Michael Jacobson, John Jay College of Criminal Justice DATE: April 3, 2003 RE: Raised HB 6694 Building Bridges: From Conviction to Employment
We are writing to offer an initial analysis of the potential budget savings that can result from implementation of many of the proposals contained in General Assembly Bill 6694. We offer our estimate of cost savings for the proposals that will have a specific and quantifiable reduction in prison beds.
It is important to note a couple of key assumptions when reviewing this analysis. First, we are using a per-diem cost of $50 to calculate savings to the Department of Correction. Though the average daily cost per prisoner is about $74, we believe that using a more “marginal” savings reflects the reality that there are some administrative, managerial and support costs that are so fixed that even significant bed reductions will not save the “fully loaded” cost of $74 per day.
Second, many of these savings will take at least two and perhaps more years to fully phase in. The savings figures presented here reflect the fully annualized savings of each of the proposals.
Finally, it must be remembered that a huge management and organizational effort will be required in order to achieve some of the savings especially for the proposal that is designed to divert probation violators from prison into alternative community based sanctions. The cost savings estimates are as follows:
Proposal: Inmates required to serve at least 50 percent of their court-imposed sentence who are not discretionarily released by the board shall be automatically released upon serving 75 percent of their sentence.
Prison Bed and Savings Impact: Approximately 1,750 beds at an annual savings of $31.9 million.
Proposal: Inmates required to serve at least 85 percent of their court-imposed sentence shall be automatically released upon meeting that requirement.
Prison Bed and Savings Impact: Approximately 400 beds at an annual savings of $7.3 million
Proposal: The judicial branch’s Court Support Services Division, the Board of Parole, and the Department of Correction collectively will develop an incremental sanctions policy for technical violations. Prison Bed and Savings Impact: Approximately 490 beds – this is based on our last estimate that suggested the state reduce the number of technical violators by 25 percent – at an annual savings of $8.9 million.
These three proposals combine to save 2650 prison beds at a total (and conservative) annual savings of $48.1 million.
This analysis does not include bed savings that would result from a variety of other proposals contained in the legislation but for which the bed impact is currently unknown. Additionally, it does not include bed savings from reducing the amount of time that probation technical violators spend in prison (this proposal is not currently included in the legislation). If, for example, this group spent, on average, three months fewer in prison, there would be a savings of approximately 340 beds at an annual savings of $6.2 million.
The potential for the bed and fiscal savings to grow beyond these estimates is substantial. The total annual savings of $48 million is based on a conservative per-diem figure and includes only the bed savings that we have been able to specifically calculate and leaves out others for which the savings are less calculable but real nonetheless and doesn’t include other efforts at bed savings such as reducing the length of stay for technical probation violators.
At savings of this magnitude the state should reinvest a significant proportion of these funds into both community-based programs and the neighborhoods receiving the majority of people released from prison. Some reinvestment must be made in order to achieve some of these savings in the first place (such as creating the alternatives to prison for technical violators) and other kinds of investment can be used to strengthen the communities from which these prisoners come to help ensure that fewer of them go to or return to prison. cc: Members of the Appropriations Committee Members of the Judiciary Committee
James Austin
Director, Institute on Crime, Justice, and Corrections, George Washington University
Dr. James Austin is the director of the Institute on Crime, Justice, and Corrections at the George Washington University in Washington, D.C. Prior to joining the GWU, he was the Executive Vice President of the National Council on Crime and Delinquency where he was employed for 20 years. He began his career in corrections in 1970 when he was employed by the Illinois Department of Corrections as a correctional sociologist at the Joliet and Stateville prisons.
Dr. Austin was named by the American Correctional Association as its 1991 recipient of the Peter P. Lejin's Research Award. In 1999 he received the Western Society of Criminology Paul Tappin award for outstanding contributions in the field of criminology. Since 2000, he has served as the Chair of American Society of Criminology National Policy Committee.
Dr. Austin has authored numerous publications including three books. His most recent book, It's About Time: America's Imprisonment Binge, was first published in 1996 (co-authored with Dr. John Irwin). The third edition was published this spring.
Each year the ICJC is awarded approximately $1.5 million in research contracts from federal and state correctional agencies. Many State departments of correction, including those in Texas, Georgia, and California, have sought Dr. Austin's assistance in analyzing their prison population. Dr. Austin has also directed studies in 25 states that entail projections of correctional populations based on current and proposed sentencing reforms. In addition, the ICJC has recently conducted national evaluations of "Three Strikes and You're Out" laws, the privatization of prisons, juveniles in adult corrections, and prison classification systems. In 1999 Dr. Austin was designated by the U.S. Department of Justice's Civil Rights Division to serve as the Federal Monitor to oversee major reforms in the Georgia juvenile correctional system.
BIOGRAPHIES OF PRESENTERS

Michael P. Jacobson
Professor, John Jay College of Criminal Justice
Dr. Michael P. Jacobson teaches at the City University of New York Graduate Center and the John Jay College of Criminal Justice in the Department of Law, Police Science, and Criminal Justice Administration. He has also served on the Graduate Faculty of the Wagner School of Public Administration at New York University, where he taught courses on public policy analysis and governmental budgeting. He has a Ph.D in Sociology from the CUNY Grad Center.
Dr. Jacobson retired from government administration in 1997. He had been appointed Correction Commissioner in 1996 by Mayor Rudolph W. Giuliani, after serving as Acting Correction Commissioner beginning in January 1995. While Acting Correction Commissioner, he continued to serve as Commissioner of the New York City Probation Department, having been appointed to that position in 1992.
Prior to his appointment as Probation Commissioner, he served as Deputy Budget Director at the City’s Office of Management and Budget, where he worked for seven years. He previously served as Deputy Director of the Mayor’s Arson Strike Force for five years, where he helped plan and coordinate the City’s anti-arson strategies.
For two decades, Dr. Jacobson has specialized in the field of criminal justice, particularly in the areas of financial issues, technology initiatives, multi-agency operations and victims’ rights. He also is a member of the Vera Institute of Justice Board of Trustees.