building energy simulation using measured … · initiatives to improve energy ... measured global...
TRANSCRIPT
BUILDING ENERGY SIMULATION USING MEASURED AND MODELED HOURLY SOLAR RADIATION DATA
Kevin K.W. Wan †, Ching L. Tsang, and Joseph C. Lam
Building Energy Research Group, Department of Building and Construction, City University Of Hong
Kong, Hong Kong SAR, China ABSTRACT Building energy simulation has proved useful in the development of building energy codes (especially performance-based) and subsequent code compliance checking. A weather year is required for the hourly computation of heating/cooling loads and corresponding energy consumption. Many locations have measured daily solar radiation data, but not hourly. Attempts were made to model hourly global solar radiation (GSR) data from measured daily values using the Liu and Jordan method for Harbin, Beijing, Shanghai, Kunming and Hong Kong. These cities are in the five major climate zones of China, namely, severe cold, cold, hot summer and cold winter, mild, and hot summer and warm winter. Statistical analysis of the measured and modeled hourly solar radiation was carried out. The root-mean-squared error ranges from 7 to 13%. Two weather years – one with measured hourly solar radiation and the other modeled data were developed for each city. Generic office buildings were also developed based on the local energy codes. Hourly simulations were conducted to assess the impact of using modeled solar radiation data on the heating/cooling loads. Building heating and cooling loads using modeled hourly GSR tend to be slight higher (on average, 2 to 3%) than those with the measured data. KEYWORDS Modeled hourly solar radiation, Climatic zones, Building energy simulation, China INTRODUCTION Total energy use in China rose from 603 million tonnes of standard coal equivalent in 1980 to 1320 in 2001, representing an average annual increase of 3.8% during that 22-year period (Wang 2003). It was estimated that buildings stocks accounted for about 27% of total national energy use in mainland China during the period of 1999-2001, and is projected to increase to about 35% in 2020. With rapid economic growth, there is a growing desire for better indoor built environment, particularly in winter space heating and summer comfort cooling, and it is estimated that heating, ventilation and air-conditioning (HVAC) accounted for some 65% of the energy use in the building sector (Lang 2002, Yao et al. 2005). It is envisaged that the building sector will continue to be a key energy end-user in the years ahead. One way to alleviate the ever growing demand for energy is to have more energy-efficient building designs and proper building energy conservation programmes. There have been a number of studies and initiatives to improve energy efficiency of residential buildings (Gao et al. 2004, Feng 2004, Lang 2004) and non-domestic premises (Ministry of Construction 2005) by introducing new building regulations with tighter requirements in the thermal and energy performance of the building envelope and better operation efficiency of the building services installation. Office building development is one of the fastest growing areas in the building sector, especially in major cities such as Beijing and Shanghai. Per unit floor area, energy use in large commercial development with full air-conditioning can be 10-20 times that in residential buildings and is therefore a priority area in building energy conservation
† Corresponding Author: Tel: + 852 2194 2746 , Fax: + 852 2788 7612 E-mail address: [email protected]

programmes (Jiang 2005). Because of the climatic diversity in China, the designs of these buildings and their thermal performances could vary a great deal. Computer building energy simulation is an acceptable technique for assessing the dynamic interactions between the external climates, the building envelopes and the HVAC systems, and has been playing an important role in the designs and analysis of energy-efficient buildings and the development of performance-based building energy codes (Hien et al. 2000). A key element in building energy simulation is the 8760 hourly records of weather data (dry-bulb temperature, wet-bulb temperature, global solar radiation, wind speed and wind direction). Information on solar radiation is important for cooling load determination and the corresponding design and analysis of air-conditioning systems, especially in tropical and sub-tropical climates where solar heat gain through fenestrations is often the largest component of the building envelope cooling load (Lam 2000). However, many locations have measured daily solar radiation data, but not hourly. The primary aim of this work was to model hourly solar radiation data from measured daily values using the Liu and Jordan method (Liu and Jordan 1960) for major climatic zones in China and investigate its impacts on the thermal and energy performance of office buildings using energy simulation techniques.
Figure 1. Major thermal climatic zones and sub-zones CLIMATIC ZONES China covers an area stretching between a latitude of 20oN to 50oN, from the subtropical zones in the south to the temperate zones (including warm-temperate and cool-temperate) in the north (Zhao 1986). The maximum solar altitudes vary a great deal and there is a large diversity in climates, especially the temperature distributions during winters. China also has a complex topography ranging from mountainous regions to flat plains. This diversity and complexity have led to many different regions with distinct climatic features. There are numerous ways to classify different climatic types or zones according to different criteria using different climatic variables and indices. In terms of the thermal design of buildings, there are five major climates, namely severe cold, cold, hot summer and cold winter, mild, and hot summer and warm winter (Ministry of Construction 1993). This simple climate classification is concerned mainly with conduction heat gain/loss and the corresponding thermal insulation issues. The zoning criteria are mainly based on the average temperatures in the coldest and hottest months of the year. The numbers of days that the daily average temperature is below 5oC or above 25oC are counted as the complementary indices for determining the zones. Figure 1 shows an overall layout of the five major climates. Because of the varying topography and hence elevations, there are nine regions – both the severe cold and cold climates have three regions. A major city within each of the five climatic zones was selected for the analysis. These are Harbin (severe cold), Beijing (cold), Shanghai (hot summer & cold winter), Kunming (mild) and Hong Kong (hot summer and warm winter).
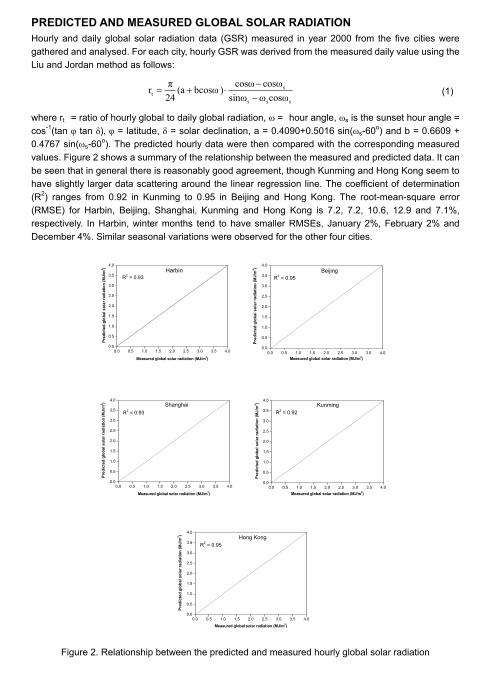
PREDICTED AND MEASURED GLOBAL SOLAR RADIATION Hourly and daily global solar radiation data (GSR) measured in year 2000 from the five cities were gathered and analysed. For each city, hourly GSR was derived from the measured daily value using the Liu and Jordan method as follows:
sss
st cosωωsinω
cosωcosω) bcosω(a24πr
−−
⋅+= (1)
where rt = ratio of hourly global to daily global radiation, ω = hour angle, ωs is the sunset hour angle = cos-1(tan φ tan δ), φ = latitude, δ = solar declination, a = 0.4090+0.5016 sin(ωs-60o) and b = 0.6609 + 0.4767 sin(ωs-60o). The predicted hourly data were then compared with the corresponding measured values. Figure 2 shows a summary of the relationship between the measured and predicted data. It can be seen that in general there is reasonably good agreement, though Kunming and Hong Kong seem to have slightly larger data scattering around the linear regression line. The coefficient of determination (R2) ranges from 0.92 in Kunming to 0.95 in Beijing and Hong Kong. The root-mean-square error (RMSE) for Harbin, Beijing, Shanghai, Kunming and Hong Kong is 7.2, 7.2, 10.6, 12.9 and 7.1%, respectively. In Harbin, winter months tend to have smaller RMSEs, January 2%, February 2% and December 4%. Similar seasonal variations were observed for the other four cities.
0.0 0.5 1.0 1.5 2.0 2.5 3.0 3.5 4.00.0
0.5
1.0
1.5
2.0
2.5
3.0
3.5
4.0
R2 = 0.93
Pred
icte
d gl
obal
sol
ar ra
diat
ion
(MJ/
m2 )
Measured global solar radiation (MJ/m2)
Harbin
0.0 0.5 1.0 1.5 2.0 2.5 3.0 3.5 4.00.0
0.5
1.0
1.5
2.0
2.5
3.0
3.5
4.0
R2 = 0.95
Pred
icte
d gl
obal
sol
ar ra
diat
ion
(MJ/
m2 )
Measured global solar radiation (MJ/m2)
Beijing
0.0 0.5 1.0 1.5 2.0 2.5 3.0 3.5 4.00.0
0.5
1.0
1.5
2.0
2.5
3.0
3.5
4.0
R2 = 0.93
Pred
icte
d gl
obal
sol
ar ra
diat
ion
(MJ/
m2 )
Measured global solar radiation (MJ/m2)
Shanghai
0.0 0.5 1.0 1.5 2.0 2.5 3.0 3.5 4.00.0
0.5
1.0
1.5
2.0
2.5
3.0
3.5
4.0
R2 = 0.92
Pred
icte
d gl
obal
sol
ar ra
diat
ion
(MJ/
m2 )
Measured global solar radiation (MJ/m2)
Kunming
0.0 0.5 1.0 1.5 2.0 2.5 3.0 3.5 4.00.0
0.5
1.0
1.5
2.0
2.5
3.0
3.5
4.0
R2 = 0.95
Pred
icte
d gl
obal
sol
ar ra
diat
ion
(MJ/
m2 )
Measured global solar radiation (MJ/m2)
Hong Kong
Figure 2. Relationship between the predicted and measured hourly global solar radiation
BUILDING ENERGY SIMULATIONS Building energy simulation was conducted using the simulation tool VisualDOE4.1 (VisualDOE 2004). Two major inputs were developed for each of the five cities – hourly weather databases and generic office building designs. Hourly weather databases For each city, two weather year files (both in DOE-2 weather file format) containing 8760 hourly records of weather data - dry-bulb temperature, wet-bulb temperature, GSR, wind speed and wind direction – were developed, one with measured hourly global solar radiation and the other predicted. Generic office buildings A base-case office building was developed to serve as a baseline reference for comparative energy studies. The base-case was a 35 m x 35 m, 40-storey building with curtain walling design, 3.4 m floor-to-floor height and 40% window-to-wall ratio. The total gross floor area is 49000 m2 (41600 m2 air-conditioned and 7840 m2 non-air-conditioned). The air-conditioned space had five zones - four at the perimeter and one interior with an occupancy density of 8 m2/person, a lighting load density of 18 W/m2 and an equipment load density of 13 W/m2. The indoor design conditions were 26oC with 40-65% relative humidity in the summer and 20oC during winter. Infiltration rate was set at 0.45 air change per hour throughout the year. The building and its lighting system operated on an 11-hour day (07:00-18:00) and 5-day week basis. Details of the base-case building can be found in Lam et al. (2006). Obviously, each city would have rather different building envelope design to suit the local climates. For instance, heat loss is a key design consideration in Harbin, and as such walls and roofs tend to have substantial thermal insulation. In subtropical Hong Kong, however, office buildings are cooling-dominated, where solar heat gain is by far the largest component of the building envelope cooling load. Thermal insulation to the external walls is, therefore, less important. The Design Standard for Energy Efficiency of Public Buildings was used to develop generic building envelope designs that would meet the minimum requirements in the thermal designs for the four cities on the mainland (Ministry of Construction 2005). For Hong Kong, the Code of Practice on the overall thermal transfer value (OTTV) was adopted (Buildings Department 1995). Table 1 shows a summary of the key building envelope parameters. Different orientations have different maximum allowable shading coefficients;
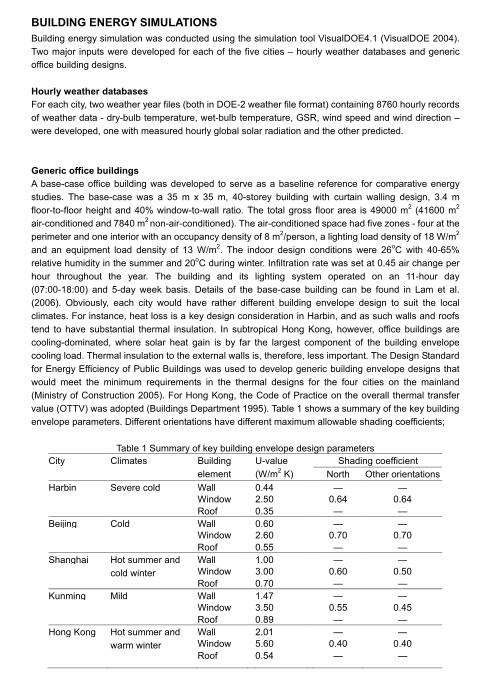
Table 1 Summary of key building envelope design parameters Shading coefficient City Climates Building
element
0
0U-value (W/m2 K)
0
0 North Other orientations Harbin Wall 0.44 — — Window 2.50 0.64 0.64
Severe cold
Roof 0.35 — — Beijing Wall 0.60 — — Window 2.60 0.70 0.70
Cold
Roof 0.55 — — Shanghai Wall 1.00 — — Window 3.00 0.60 0.50
Hot summer and cold winter
Roof 0.70 — — Kunming Wall 1.47 — — Window 3.50 0.55 0.45
Mild
Roof 0.89 — — Hong Kong Wall 2.01 — — Window 5.60 0.40 0.40
Hot summer and warm winter
Roof 0.54 — —
north-facing windows are allowed to have higher shading coefficients. The HVAC system was developed based on the local design code for HVAC (Ministry of Construction 2003). Briefly, the system was a four-pipe fan coil type with winter and summer set point temperatures of 20oC and 26oC, respectively for all five cities. Chilled water was provided by water-cooled centrifugal chillers with a coefficient of performance of 4.7 (heat rejection through cooling towers), and space heating from natural gas-fired hot water boilers with a thermal efficiency of 89%. Same system type was used for all five cities but with different sizes according to the individual system peak cooling and heating loads. SIMULATION RESULTS Hour-by-hour building energy simulations were conducted for the five cities. A total of 10 simulation runs were carried out - two simulations per city, one with the measured global solar radiation and the other the predicted data. The computed results were analysed and compared in three aspects – building heating and cooling loads, building cooling load components, and peak system heating and cooling loads.
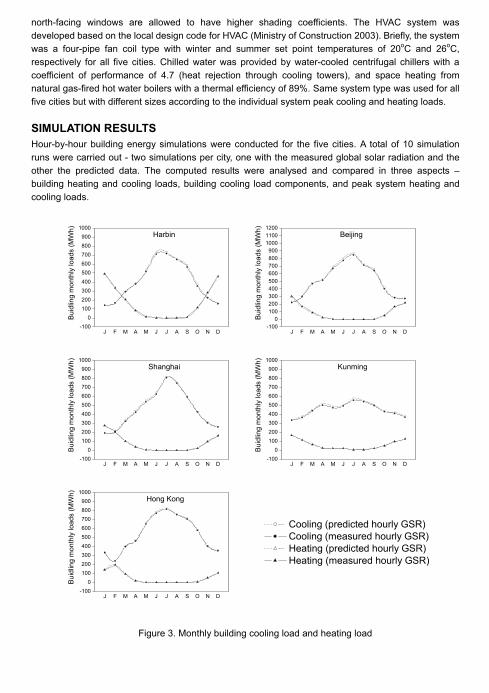
Figure 3. Monthly building cooling load and heating load
J F M A M J J A S O N D-100
0100200300400500600700800900
1000
Bui
dlin
g m
onth
ly lo
ads
(MW
h) Harbin
J F M A M J J A S O N D-100
0100200300400500600700800900
100011001200
Bui
dlin
g m
onth
ly lo
ads
(MW
h) Beijing
J F M A M J J A S O N D-100
0100200300400500600700800900
1000
Bui
dlin
g m
onth
ly lo
ads
(MW
h) Shanghai
J F M A M J J A S O N D-100
0100200300400500600700800900
1000
Bui
dlin
g m
onth
ly lo
ads
(MW
h) Kunming
J F M A M J J A S O N D-100
0100200300400500600700800900
1000
Bui
dlin
g m
onth
ly lo
ads
(MW
h) Hong Kong
-- -- -- -- -- -- -- -- -- -- -- ---10001002003004005006007008009001000
Cooling (predicted hourly GSR) Cooling (measured hourly GSR) Heating (predicted hourly GSR) Heating (measured hourly GSR)
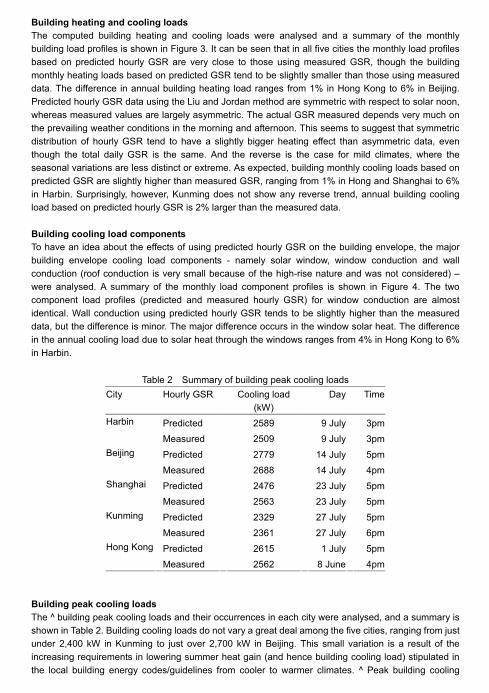
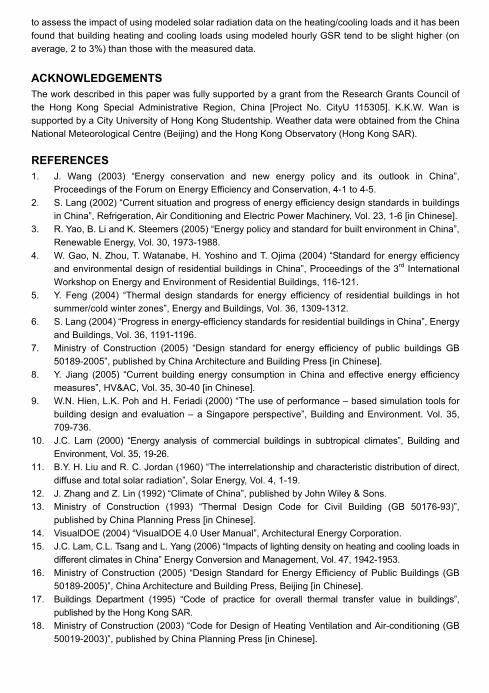
Building heating and cooling loads The computed building heating and cooling loads were analysed and a summary of the monthly building load profiles is shown in Figure 3. It can be seen that in all five cities the monthly load profiles based on predicted hourly GSR are very close to those using measured GSR, though the building monthly heating loads based on predicted GSR tend to be slightly smaller than those using measured data. The difference in annual building heating load ranges from 1% in Hong Kong to 6% in Beijing. Predicted hourly GSR data using the Liu and Jordan method are symmetric with respect to solar noon, whereas measured values are largely asymmetric. The actual GSR measured depends very much on the prevailing weather conditions in the morning and afternoon. This seems to suggest that symmetric distribution of hourly GSR tend to have a slightly bigger heating effect than asymmetric data, even though the total daily GSR is the same. And the reverse is the case for mild climates, where the seasonal variations are less distinct or extreme. As expected, building monthly cooling loads based on predicted GSR are slightly higher than measured GSR, ranging from 1% in Hong and Shanghai to 6% in Harbin. Surprisingly, however, Kunming does not show any reverse trend, annual building cooling load based on predicted hourly GSR is 2% larger than the measured data. Building cooling load components To have an idea about the effects of using predicted hourly GSR on the building envelope, the major building envelope cooling load components - namely solar window, window conduction and wall conduction (roof conduction is very small because of the high-rise nature and was not considered) – were analysed. A summary of the monthly load component profiles is shown in Figure 4. The two component load profiles (predicted and measured hourly GSR) for window conduction are almost identical. Wall conduction using predicted hourly GSR tends to be slightly higher than the measured data, but the difference is minor. The major difference occurs in the window solar heat. The difference in the annual cooling load due to solar heat through the windows ranges from 4% in Hong Kong to 6% in Harbin. Building peak cooling loads The ^ building peak cooling loads and their occurrences in each city were analysed, and a summary is shown in Table 2. Building cooling loads do not vary a great deal among the five cities, ranging from just under 2,400 kW in Kunming to just over 2,700 kW in Beijing. This small variation is a result of the increasing requirements in lowering summer heat gain (and hence building cooling load) stipulated in the local building energy codes/guidelines from cooler to warmer climates. ^ Peak building cooling
Table 2 Summary of building peak cooling loads City Hourly GSR Cooling load
(kW) Day Time
Predicted 2589 9 July 3pmHarbin Measured 2509 9 July 3pm Predicted 2779 14 July 5pmBeijing Measured 2688 14 July 4pm Predicted 2476 23 July 5pmShanghai Measured 2563 23 July 5pm Predicted 2329 27 July 5pmKunming Measured 2361 27 July 6pm Predicted 2615 1 July 5pmHong Kong Measured 2562 8 June 4pm
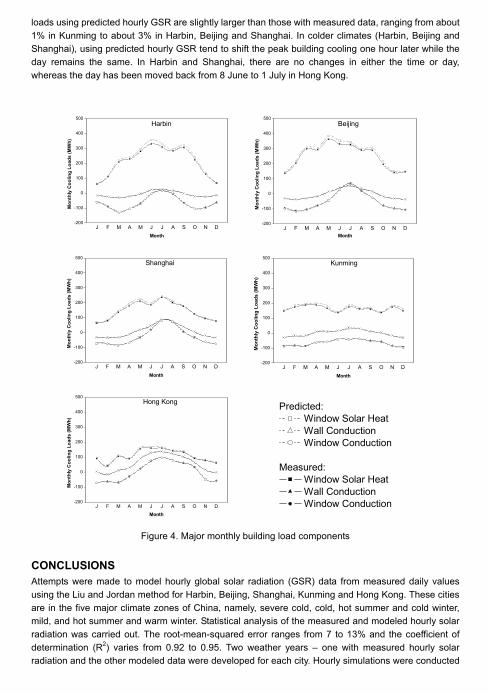
loads using predicted hourly GSR are slightly larger than those with measured data, ranging from about 1% in Kunming to about 3% in Harbin, Beijing and Shanghai. In colder climates (Harbin, Beijing and Shanghai), using predicted hourly GSR tend to shift the peak building cooling one hour later while the day remains the same. In Harbin and Shanghai, there are no changes in either the time or day, whereas the day has been moved back from 8 June to 1 July in Hong Kong.
J F M A M J J A S O N D-200
-100
0
100
200
300
400
500
Mon
thly
Coo
ling
Load
s (M
Wh)
Month
Harbin
J F M A M J J A S O N D-200
-100
0
100
200
300
400
500
Mon
thly
Coo
ling
Load
s (M
Wh)
Month
Beijing
Figure 4. Major monthly building load components CONCLUSIONS Attempts were made to model hourly global solar radiation (GSR) data from measured daily values using the Liu and Jordan method for Harbin, Beijing, Shanghai, Kunming and Hong Kong. These cities are in the five major climate zones of China, namely, severe cold, cold, hot summer and cold winter, mild, and hot summer and warm winter. Statistical analysis of the measured and modeled hourly solar radiation was carried out. The root-mean-squared error ranges from 7 to 13% and the coefficient of determination (R2) varies from 0.92 to 0.95. Two weather years – one with measured hourly solar radiation and the other modeled data were developed for each city. Hourly simulations were conducted
J F M A M J J A S O N D-200
-100
0
100
200
300
400
500
Mon
thly
Coo
ling
Load
s (M
Wh)
Month
Hong Kong
J F M A M J J A S O N D-200
-100
0
100
200
300
400
500
Mon
thly
Coo
ling
Load
s (M
Wh)
Month
Shanghai
J F M A M J J A S O N D-200
-100
0
100
200
300
400
500
M
onth
ly C
oolin
g Lo
ads
(MW
h)
Month
Kunming
Predicted: Window Solar Heat Wall Conduction Window Conduction
Measured: Window Solar Heat Wall Conduction Window Conduction
to assess the impact of using modeled solar radiation data on the heating/cooling loads and it has been found that building heating and cooling loads using modeled hourly GSR tend to be slight higher (on average, 2 to 3%) than those with the measured data. ACKNOWLEDGEMENTS The work described in this paper was fully supported by a grant from the Research Grants Council of the Hong Kong Special Administrative Region, China [Project No. CityU 115305]. K.K.W. Wan is supported by a City University of Hong Kong Studentship. Weather data were obtained from the China National Meteorological Centre (Beijing) and the Hong Kong Observatory (Hong Kong SAR). REFERENCES 1. J. Wang (2003) “Energy conservation and new energy policy and its outlook in China”,
Proceedings of the Forum on Energy Efficiency and Conservation, 4-1 to 4-5. 2. S. Lang (2002) “Current situation and progress of energy efficiency design standards in buildings
in China”, Refrigeration, Air Conditioning and Electric Power Machinery, Vol. 23, 1-6 [in Chinese]. 3. R. Yao, B. Li and K. Steemers (2005) “Energy policy and standard for built environment in China”,
Renewable Energy, Vol. 30, 1973-1988. 4. W. Gao, N. Zhou, T. Watanabe, H. Yoshino and T. Ojima (2004) “Standard for energy efficiency
and environmental design of residential buildings in China”, Proceedings of the 3rd International Workshop on Energy and Environment of Residential Buildings, 116-121.
5. Y. Feng (2004) “Thermal design standards for energy efficiency of residential buildings in hot summer/cold winter zones”, Energy and Buildings, Vol. 36, 1309-1312.
6. S. Lang (2004) “Progress in energy-efficiency standards for residential buildings in China”, Energy and Buildings, Vol. 36, 1191-1196.
7. Ministry of Construction (2005) “Design standard for energy efficiency of public buildings GB 50189-2005”, published by China Architecture and Building Press [in Chinese].
8. Y. Jiang (2005) “Current building energy consumption in China and effective energy efficiency measures”, HV&AC, Vol. 35, 30-40 [in Chinese].
9. W.N. Hien, L.K. Poh and H. Feriadi (2000) “The use of performance – based simulation tools for building design and evaluation – a Singapore perspective”, Building and Environment. Vol. 35, 709-736.
10. J.C. Lam (2000) “Energy analysis of commercial buildings in subtropical climates”, Building and Environment, Vol. 35, 19-26.
11. B.Y. H. Liu and R. C. Jordan (1960) “The interrelationship and characteristic distribution of direct, diffuse and total solar radiation”, Solar Energy, Vol. 4, 1-19.
12. J. Zhang and Z. Lin (1992) “Climate of China”, published by John Wiley & Sons. 13. Ministry of Construction (1993) “Thermal Design Code for Civil Building (GB 50176-93)”,
published by China Planning Press [in Chinese]. 14. VisualDOE (2004) “VisualDOE 4.0 User Manual”, Architectural Energy Corporation. 15. J.C. Lam, C.L. Tsang and L. Yang (2006) “Impacts of lighting density on heating and cooling loads in
different climates in China” Energy Conversion and Management, Vol. 47, 1942-1953. 16. Ministry of Construction (2005) “Design Standard for Energy Efficiency of Public Buildings (GB
50189-2005)”, China Architecture and Building Press, Beijing [in Chinese]. 17. Buildings Department (1995) “Code of practice for overall thermal transfer value in buildings”,
published by the Hong Kong SAR. 18. Ministry of Construction (2003) “Code for Design of Heating Ventilation and Air-conditioning (GB
50019-2003)”, published by China Planning Press [in Chinese].