building for the future - bdo · agri-agra financing category; from the development bank of the...
TRANSCRIPT

Building for the Future
2006 Annual Report
Equitable PCI Bank TowersMakati Avenue cor. H.V. dela Costa St.
Makati CityTel. No. 840-7000
www.equitablepcib.com

Financial Highlights 1 | To Our Stockholders 2 | Performance Highlights 6 | Review of Operations 8 | Philippine Economic Performance 22 | Statement of Management Responsibility 24 | Independent Auditor’s Report 25 | Statements of Condition 26 | Statements of Income 28 | Statements of Changes in Equity 30 | Statements of Cash Flows 34 | Notes to Financial Statements 37 | Board of Directors 112 | Management Committee 114 | Senior Officers 115 | Senior Officers Subsidiaries & Affiliates 116 | Branch Directory 118 | Products and Services 127
Contents
Pro
du
ced
by
Equ
itab
le P
CI B
ank
Co
rpo
rate
Co
mm
un
icat
ion
s G
rou
p |
Phot
ogra
phy:
Wig
Tys
man
s | D
esig
n an
d C
once
pt: X
pre
ss M
edia
Ph
ilip
pin
es, I
nc.
| Pr
intin
g: T
ran
spri
nt

AT YeAr-end (in million pesos)
for The YeAr (in million pesos, except earnings per share)
2006 Equitable PCI Bank Annual Report | 01
financial highlights
earnings per share
04 05 06
net income
04 05 06
total resources
04 05 06
total liabilities
04 05 06
capital funds
04 05 06
04 05 06
total revenue
16,7
29
20,2
05 23,4
29 2,51
3
2,79
7
3,44
6
3.72
4.16
4.89
310,
562
312,
051
345,
141
267,
944
274,
554
297,
660
42,6
18
37,4
97
47,4
81

Consolidation of strengths, refocusing of core competencies, and reinforcement of strategic advantages – these took the forefront as Equitable PCI Bank maneuvered through another challenging year. The positive results we attained in 2006 strengthened our thrust toward building on a dynamic new synergy for a solid future.
Building a foundation of strength Our financial report for 2006 underscore the strong foundation we built as our business units pursued growth and leadership in our identified core areas. The Bank posted a net income of P3.27 Billion in 2006, representing a healthy 17% increase from the previous year’s net income of P2.8 Billion. The significant increase in our non-interest income and the modest improvement in our net interest income buoyed the bottom line.
Non-interest income surged 24% to P12.5 Billion. We continued to expand our fee-based income by leveraging on our solid business franchise in branch banking, remittances, trust banking, bancassurance, credit cards, and corporate cash management. Further, by cautiously navigating through the turbulent emerging market environment in the second quarter and riding on the downtrend in interest rates in the latter half of the year, we bolstered our trading and foreign exchange gains as we judiciously managed our investment portfolio.
Net interest income improved 3% to P11 Billion in spite of tight interest spreads that hounded the interest differential business during the year. Interest income for the year climbed 3% to P19.6 Billion. Interest income on loans and receivables inched up 2% to P11.8 Billion even as interest rates dipped due to bigger loan volumes.
The Bank’s total resources reached P345.14 Billion, representing an 11% increase over the 2005 level. Asset growth is evident in the Bank’s net loans and receivables, which grew by 15% to P161.4 Billion as a result of successful corporate strategies targeted at the higher-margin middle market and consumer loan accounts. The Bank’s short-term assets also increased with the liquidity brought about by higher deposits and the sale of assets.
Building a robust market presenceThe positive figures are indicative of the strengthened relationships that the various business segments have established and nurtured with their respective client bases. Branch Banking units reported vigorous expansion in both deposits and loans for the year. Harnessing our vast branch network to generate incremental low-cost deposits, the Bank saw total deposits registering a 16% growth to P240.1 Billion.
Institutional Banking concentrated on maintaining portfolio quality, offering value-added financial packages, and contributing to the Bank’s profitability. Equally significant was the Bank’s sustained support to small and medium enterprises, which again received recognition from various financing institutions, namely: from the Land Bank of the Philippines, “Most Outstanding Countryside Partner” under the Commercial Banks/GFI category for the fourth year in a row, thus elevating the Bank to a Hall of Fame Award, and “Most Outstanding Countryside Partner” under the
02 | Building for the Future
to our stockholders

2006 Equitable PCI Bank Annual Report | 03
* The Board of Directors of Equitable PCI Bank accepted with regret the resignation of Mr. Buenaventura effective January. 1, 2007
corazon s. de la PazChairperson
teresita sy-cosonVice Chairperson
rene J. Buenaventura *President & Chief Executive Officer

Agri-Agra Financing category; from the Development Bank of the Philippines, “Most Active Loan Syndicator” for wholesale lending facilities; from the Small Business Guarantee and Finance Corporation, “Distinguished Partner” under the wholesale lending program for small and medium enterprises; and from the Philippine Export-Import Credit Agency (TIDCORP), “Special Citation” for being a loyal participating financial institution/partner since 1991.
Treasury and Trust Banking exemplified dependability and competitiveness in spite of shifting grounds in their respective industries. Treasury’s volume and income targets were not only met but even surpassed during the year, and the Bureau of Treasury nodded approval by recognizing the Bank as one of the best Government Securities Eligible Dealers. Meanwhile, Trust followed through on the Money Market Funds launch as well as beefed up the overall volume of Unit Investment Trust Funds.
Moreover, Equitable Savings Bank leaped three places in 2006 alone to claim its spot as the sixth largest thrift bank in the country, attaining double-digit growth in its key financial indicators.
Our bancassurance business is earning high praise as well, with our Philamlife partnership yielding over 90% increase in more profitable regular premiums on just our third year. We look forward to building further on this collaboration and ensuring its continued success.
Rounding out the Bank’s strong performance were satisfactory results from the subsidiaries in insurance brokerage, credit card, leasing and finance, and investment
banking, all of which contributed toward reinforcing the Bank’s presence in these important business niches.
Building a great futureOver-all, the clearest validation of the Bank’s successful execution of its strategies in 2006 was the impressive growth in its return on equity, which rose to 14.4% from 10.57% in 2005, as well as in its return on assets, which increased to 1.06% from 0.88% the previous year. Moreover, the Bank’s share price registered at P83 at yearend-2006, showing a one-year gain of 41%.
A major part of our story for 2006 was the series of corporate developments involving the merger plan with Banco de Oro (BDO). In August 2006, the Tender Offer from SM Investments Corporation and related companies generated participation from shareholders with total shares of 374.9 million equivalent to 51.6% of EPCI’s total shares. The sellers included GSIS with 13.55%, SSS with 25.84%, and other individual shareholders with 1.34%. The participation of the SSS in the Tender Offer, however, is subject to the resolution of the case pending in the Supreme Court. EBCII also agreed to sell its 78.8 million EPCI common shares, which represent about 10.8% of total shares, under the same terms and conditions as the Tender Offer.
In October, the sale of the shares under the Tender Offer was consummated through cross trades at the Philippine Stock Exchange; this gave the SM group an effective 55.8% ownership stake in the Bank, which could go up to 81.6% if the SSS stake is included. In November 2006, the Board of Directors of Equitable PCI Bank, Inc. (EPCI) approved the merger plan and endorsed this to
04 | Building for the Future

the shareholders for ratification. The plan, as approved by the shareholders on 27th December 2006, provided that EPCI shares will be swapped for BDO shares at a ratio of 1.8 BDO shares for every EPCI share. Upon final approval of the concerned regulatory agencies, BDO will be the surviving entity and the merged bank will be named Banco de Oro-EPCI, Inc.
The financial and corporate developments of the past year reinforce the Bank’s position to fully reap merger benefits with Banco de Oro and address Basel II requirements. Boosted by the infusion of fresh capital, the Bank attained a Capital Adequacy Ratio of 15.5% as of end-2006, giving us the necessary financial heft to comply with the more stringent Basel II provisions upon implementation in July 2007.
We thus anticipate forthcoming developments with much excitement and confidence. Our “merger of equals” between EPCI and BDO has begun with an integration work plan designed to ensure that the competitive advantages and market leadership of both banks would be preserved and built into the new entity. We expect that the resulting consolidation of resources, talents, and networks will pave the path to greater stability, expertise, and accessibility that our banking public can rely on. Knowing the greater expectations we now face, we are just as determined to provide an even better and stronger response. We are indeed fortunate to be able to count on our shareholders, management, officers, and employees to collectively support our vision to build this Bank’s great future.
CORAZON S. DE LA PAZChairperson
TERESITA SY-COSONChairperson of the Executive Committee
RENE J. BUENAVENTURAPresident & Chief Executive Officer
2006 Equitable PCI Bank Annual Report | 05
Equitable PCI Bank Named Reader’s Digest Gold Winner Twice in a RowFor two years in a row, the Bank is recognized as Reader’s Digest Gold Trusted Brand for 2006 in the local bank category, attesting to the Bank’s continuous customer service excellence combined with its leadership in most of its markets, including consumer finance, credit and payment cards, leasing, middle market and small business lending, trust banking and remittances.
EPCIB is DBP’s Most Active Loan SyndicatorThe Development Bank of the Philippines recently named Equitable PCI Bank as the Most Active Loan Syndicator for its wholesale lending facilities. The Bank was responsible for arranging loan deals under the Domestic Shipping modernization Program, JBIC 5, and the Environmental Infrastructure Support Credit Program II.
Express Padala Ties Up with Multimoney TXEquitable PCI Bank forged a remittance agreement with Multimoney TX (MMT), a leading provider of money transfer worldwide, to service the remittance needs of Overseas Filipino Workers in the United Kingdom, providing convenience and greater accessibility to send remittances to their beneficiaries.
Equitable PCI Bank Supports BSP’s Advocacy ProgramThe Monetary Board of the Bangko Sentral ng Pilipinas (BSP) created the Currency Management Committee (CuMC) to ensure efficient production, delivery distribution and circulation of notes and coins. CuMC has encouraged banks and other sectors of society to help in BSP’s special advocacy efforts to effect an efficient recirculation of our coins. The project has gained the support of the Bankers Association of the Philippines (BAP), Chamber of Thrift Banks (CTB), Rural Bankers Association of the Philippines (RBAP), Bank Marketing Association of the Philippines (BMAP), Philippine Retailers Association (PRA), Pondong Pinoy and charitable institutions.
PCI Leasing Reports Industry-leading PerformancePCI Leasing and Finance, Inc. (PCILF), one of the largest leasing and finance companies, and a subsidiary of the Equitable PCI Bank Group, reaffirmed its dominance across all indicators. PCILF ranked no. 1 in total resources, which reached P8.25 billion for the year, total portfolio in the industry at P7.31 billion and the largest leasing portfolio in the industry at P3.77 billion, total loans and leased booked at P9.97 billion, ending the year with a net income of P393.8 million. All these attributed to its quality, cost efficient operations, aggressive marketing strategies and a solid parent-bank support.
Equitable PCI Bank Leads Land Bank’s Outstanding CLF PartnersThe Bank reaffirmed its support in promoting countryside development when it was cited as Land Bank of the Philippines (LBP) Outstanding Countryside Loan Fund (CLF) Program Partner in its Commercial Banks/GFI category for four consecutive years. This feat earned for the Bank the prestigious Hall of Fame award. EPCIB’s strong support in fostering countryside development reflected its support to the growth of economy as a whole.
Performance highlights 2006
06 | Building for the Future

Bank Named Most Valuable Partner in Housing FinanceHome Guaranty Corporation (HGC) named Equitable PCI Bank as the “Most Valued Partner in Housing Finance”. The Bank was recognized by HGC as one of its loyal industry partners that support its thrust to operate a credit guaranty program in support of the government’s effort to promote home ownership.
Equitable PCI Bank Named SSS Best Collecting Commercial BankEquitable PCI Bank further intensifies its long streak of achievements when it was named “Balikat ng Bayan Awardee” for being Social Security System (SSS) Best Collecting Commercial Bank for 2006. This award reflects the trust and confidence of SSS clients and the banking community in Equitable PCI Bank.
Equitable CardNetwork Launches Travel Card Titanium MasterCardEquitable CardNetwork (ECN) and MasterCard launched an excellent card designed for travelers, the Equitable PCI Bank Travel Card Titanium MasterCard, loaded with a comprehensive range of exemplary travel and lifestyle benefits like great travel deals, exclusive privileges from Poloair Travel and Tours and support from Mastercard’s extensive global services, making the card an ideal travel companion.
EPCIB is SBGFC’s Distinguished PartnerThe Small Business Guarantee and Finance Corporation (SBGFC) has cited Equitable PCI Bank as one of its Distinguished Partners, the 5th citation given to Bank this year by the funding agencies, in recognition of the Bank’s active participation under its Wholesale Lending Program and its contribution in promoting the growth and development of the small and medium enterprises throughout the country.
Equitable PCI Bank Celebrates Its 56th Year The Bank on its 56th Anniversary has transformed itself to a major player in the banking industry by equally recognizing its achievements. The 56th Anniversary celebration likewise served as a perfect venue to unveil the first EPCI Bank Institutional Audio-Visual Presentation. The AVP highlighted the Bank’s banner products and services, its various divisions and outstanding milestones through the years, as it establishes itself as the best bank to do business with.
Equitable PCI Bank Stockholders Approve Merger with Banco de Oro Universal BankEquitable PCI Bank stockholders have approved the merger of Equitable PCI with Banco De Oro Universal Bank in a brief special meeting of stockholders with approval of both Board of Directors of the two entities and their respective stockholders. The name of the surviving institution will be Banco de Oro – EPCI, Inc.
2006 Equitable PCI Bank Annual Report | 07

08 | Building for the Future
“
“Revenues from deposits grew by 11% and consumer loans rose by 18%
2006 Equitable PCI Bank Annual Report | 09
review of oPerations
Building for the future requires, to start with, reinforcing a solid foundation that will ensure strength, growth, and sustainability over time. The various business units and subsidiaries of Equitable PCI Bank paved this with impressive results in their respective areas in 2006. By marshalling their resources and expertise toward opportunities for increased synergy and success, they also firmed up the Bank’s platform for an even stronger future.
Retail Banking SegmentConcluding a year marked by astounding financial achievements in deposits, consumer loans, and remittances, the Retail Banking Segment (RBS) rose to the challenge of serving as a core growth engine for the Bank. It validated its elevation to segment status as the RBS units – strategically grouped as Branch Banking (composed of the Elite Banking Division, Personal Banking Division, Transaction Banking Division and Equitable Savings Bank); Consumer Finance Division; Remittance Division and support units – all drew on teamwork and group intelligence to effectively manage the customer experience.
Various support activities revitalized the sales and service-oriented, customer-focused set-up of RBS. Branch Banking units, in particular, rode on enhanced relationships to boost deposit levels. Total deposits increased by 14% from 2005 figures. RBS also managed a healthy income mix from its funds- and non-funds-based products and services. Revenues from deposits grew by 11%, and consumer loans rose by 18%. Moreover, fee-based business continued to contribute a sizeable portion to the RBS income.
The consumer lending division saw new bookings surge over 43% from the previous year, as more competitive interest rates improved the pricing structure and the Bank’s sales force responded positively to the internal incentive program. Home loans were up 29% from 2005; further, some 20% of total home loans granted in 2006 were fresh new loans, generated from tie-ups with developers. On the other hand, the nationwide Deals-on-Wheels sales campaign that covered Metro Manila and seven provincial branches successfully beefed up auto loans. Aside from these efforts, wholesale lending under the Contract to Sell financing program continued to expand almost 19%.
Equitable Savings Bank (ESB), the consumer lending arm of the commercial bank, celebrated its 10th year in the thrift banking industry. Ranked 9th in 2004, ESB is now the 6th largest thrift bank in terms of total resources. It continued to expand its reach by opening five more branches in 2006, bringing its total branch network to 40.
In 2006, ESB posted a 48% increase in net income compared to 2005. Total resources registered a 38% growth over the previous year’s level due to an increase in net loans portfolio by 40%. Likewise, total deposits grew by 45%, with savings and demand deposits up by 28%
and 33%, respectively. With its 2006 net worth 20% higher than in 2005, ESB moved decisively towards its vision of being among the most profitable, top-tier consumer savings banks in the country.
The celebration of Express Padala’s 25th anniversary in 2006 set the tone for various marketing communications efforts, product promotions, and other exciting initiatives to address the unique needs of our overseas Filipino workers. Express Pinoy, a savings account for self-allottees, was launched in Italy in February 2006 and in the United Arab Emirates in May 2006. Express Padala continued to outpace the industry with a 17% growth in transactions and over 22% growth in dollar value.
In the bancassurance business, RBS has surpassed the one billion mark in total premiums in just three years of partnership with Philamlife. In 2006, it introduced Preferred Peso Plus, Lifeguard, Total Preferred Health Assure, and A & H Accishield – products that addressed the market’s growing need for quality insurance. The Bank’s collaboration with Philamlife, which yielded over 90% growth in more profitable regular premiums, is considered by AIG as one of its best partnerships in Asia. The RBS bancassurance business has actually contributed 25% to Philamlife’s total new business for 2006. Total commissions increased by over 60% as a result of over 100% growth in regular premium commissions. For the non-life insurance business, RBS generated close to P260 Million in net premiums for the Bank’s brokerage subsidiary – another remarkable feat, coming from almost nil just five years ago.
RBS took a more proactive role in strengthening the development, promotion, and delivery of products and services as a means to enhance income contribution to the Bank. It launched TREASURESaver via an ESB promo in January 2006. Next in line was ONE Plus, a checking account with tiered interest rates, which premiered in April 2006; it was followed in July 2006 by Dollar ONE, a dollar-denominated checking account. Alongside product line-up expansion, RBS implemented deposit generation campaigns for its managed products, including internal promos such as “Pabuenas sa CASA,” “Hit or Miss,” and the re-run of CASA REAPeat.
Further strengthening the established foundations of the customer-centric set-up required intensive training programs to enhance the soft skills of customer-interfacing personnel. RBS thus conducted trainings focused on propagating the Sales & Service quality culture and enhancing supervisory expertise, personal effectiveness, and business knowledge. Some 2,446 trainees participated in 10 programs offered in 2006. To sustain the knowledge, skills, and attitude emphasized in the culture-building efforts of RBS, the Morning Briefing Agenda was institutionalized at the branch level. Daily discussions were held on topics ranging from Customer

“
“
In 2006, PCI Capital’s Average Return on Assets and Average Return on Equity stood at 16.6% and 16.9%, respectively
10 | Building for the Future

2006 Equitable PCI Bank Annual Report | 11
Service, Product Information & Updates both for RBS and non-RBS products and services, to administrative concerns and bank policies and procedures.
To drive the sales and service delivery of RBS, performance reviews for both Transaction Banking and Personal Banking Divisions were regularly conducted as a support and feedback structure. Activities concentrated on enhancing personnel performance, particularly sales and service improvement plans.
To consistently provide customers with a positive and pleasant experience, RBS monitored the service interactions through the Video Mystery Shopper Program (MSP), Telephone Monitoring Program (TMP), and Branch Upkeep Program (BUP). While the TMP and BUP continued to show high ratings, a more noteworthy performance can be seen in the MSP results as the overall average performance of branches increased from 86% in 2005 to 91% in 2006. Further program enhancements and additional monitoring tools are eyed for a holistic customer feedback management. Complementing these are branch expansion strategies designed to better serve the increasing client base. For commercial branches, seven were relocated, 13 were renovated, and 26 more were relaid-out during the year.
Major improvements in business processes and capabilities were also implemented in 2006. In pursuit of the “Single Customer View,” the Branch Integrated Front-end System Project prepared the branch infrastructure and ensured its integration with other windows-based systems of the Bank. Existing OS/2-based Platform and New Tellering Systems were replaced by the Integrated Customer Management System (ICMS) Sales & Service, a Windows and browser-based system that provided additional functionalities and capabilities to support frontline personnel. By year end, 228 out of the 408 commercial branches in Metro Manila and Luzon had been converted.
Also implemented in all Equitable PCI Bank branches as early as the first quarter of the year was the Online Signature Verification System, which enabled tellers and other authorized branch personnel to accept inter-branch transactions and do real-time verification of the customer’s signature in the most expeditious way.
While already a leader in the remittance business, RBS continued to dominate as it executed Phase 1 of the New Remittance System, a web-based application and integrated remittance system. It aimed to improve operational efficiency and ensure near real-time crediting and sending of remittances by providing seamless interfaces among the systems currently used by the Express Padala Center (EPC), Foreign Desk Offices (FDO), foreign and local tie-ups, maritime agencies, and branches in processing remittance transactions. As of yearend, majority of the FDOs and tie-ups of EPC had been migrated to the new system.
All these achievements, while they validate the strategies the Segment has employed in the past years, more importantly point toward the challenges that RBS must yet overcome. And it will do so, armed with the unflagging determination to reinforce its strengths and contribute further to the Bank’s growth.
Institutional Banking Navigating through an economic climate of excess liquidity, low inflation, and low interest rates brought on by weak corporate market demand for financing of expansions and acquisitions in 2006, Corporate Banking achieved a loan portfolio growth of 14%. It focused primarily on the refinancing of outstanding term loans as well as conversion of foreign debt, mostly U.S. dollar denominated, taking advantage of the appreciating Philippine peso over the US dollar currency for the benefit of its corporate clients.
Even as margins for almost all loans and financial products compressed, Corporate Banking contributed significantly to the over-all profitability of the Bank mainly by generating financial assets with longer tenors and therefore wider spreads. It identified and remedied weak accounts to protect the high credit quality of its loan portfolio.
As the principal banker of the country’s top corporations, Corporate Banking stepped up to its role as the major cross-selling base of the Bank. It drew on synergies in cash management, investment banking, trust, credit card operations, consumer loans, and insurance. Funding from low-cost deposit balances of the top corporates also grew by 5%. It foresees a sustained, active participation in and support of projects undertaken by the top corporates, maximizing the collateral businesses while staying vigilant to ensure high portfolio quality.
As the Bank’s bridge to the middle-market customers, predominantly enterprises that are typically led by the owners/successors, and the Chinese-Filipino business community, Commercial Banking (Combank) capitalized on institutional strengths and value-added financial packages to achieve loan growth of 4% in 2006. It overcame generally sluggish demand, re-emphasizing profitability to earn a manageable net interest margin. Moreover, it harnessed its strategic locations in Metro Manila and key provincial regions to readily address its clients’ needs as well as spot new businesses in its respective niches. It beefed up its accounts portfolio and offered non-traditional lending products such as bond issuance and enrollment in the USDA General Sales Manager Commodity Financing Program.
Combank aims to nurture and grow increased business from its long-term relationships with its customers. Vital to this is its effective bundling of financial services as well as its capability to offer customers cross-border service through the Hong Kong Branch.

“
“Trust Banking successfully launched the EPCIB Money Market Funds and increased the overall UITF volume by 39.16%
12 | Building for the Future

2006 Equitable PCI Bank Annual Report | 13
Equally keen attention was devoted to the other end of the business spectrum. With 21 lending units nationwide servicing a network of 408 branches, the Small Business Division strengthened its presence with a portfolio base of P3.44 Billion as of yearend. Its strategy of catering to the credit requirements of existing depositors while maintaining its emphasis on high-quality accounts, the Division provided business loan financing to over 2,500 of its depositors. Low-cost deposits provided a 50% deposit-to-loan ratio.
As a parallel effort to further improve portfolio quality and address credit risks, the Small Business Credit Committee, composed of seasoned credit officers of the Bank, was formed. In addition, ESB’s Account Management Unit was made part of the Small Business Division. The year’s highlights also included another citation by the Small Business Guarantee and Finance Corporation (SBGFC). It named the Bank a Distinguished Partner under SBGFC’s wholesale lending program for small and medium enterprises, recognizing, once again, the Bank’s continuing contribution to the development of SMEs.
Credit Products and Subsidiaries Group The Specialized Lending Department continued to build on its strong track record in the specialized lending market in 2006. It sourced third-party funding for working capital and business expansion of various companies in manufacturing, trading, services, agro-processing, food processing, and shipping. Moreover, even increased competition could not hold it back from propelling the Bank to six awards from various funding and guarantee institutions.
For the fourth straight year, the Land Bank of the Philippines (LBP) cited the Bank as Most Outstanding Countryside Partner under the Commercial Banks/GFI category – thus elevating the Bank to a Hall of Fame Award. LBP also awarded the Bank as Most Outstanding Countryside Partner under the Agri-Agra Financing category. These awards lauded the Bank’s active use of the CLF and ALF programs.
Likewise, the Development Bank of the Philippines cited the Bank as Most Active Loan Syndicator for its wholesale lending facilities. On the other hand, the Small Business Guarantee and Finance Corporation named the Bank as its Distinguished Partner under its wholesale lending program for small and medium enterprises, citing the Bank’s contribution to SME growth and development. Lastly, the Philippine Export-Import Credit Agency (TIDCORP) conferred a Special Citation to the Bank for being a loyal participating financial institution and continuing partner under its guarantee programs since 1991.
Put together, these awards and citations create a strong testament to the Bank’s solid commitment to promote countryside development and help entrepreneurs realize their business goals.
Extensive use of automation-related infrastructure and resources helped Credit Policy and Support Division (CPSD) fulfill its tasks of providing lending units with credit support services such as collateral appraisal and credit investigation as well as safeguarding loan portfolio health through meaningful credit policies and effective credit risk management.
CPSD spearheaded the initial implementation of the Central Liability System (CLS), a system it designed and developed as a repository of all data pertaining to credit risk exposures – thus serving as the single customer view system of the Bank and providing a potent tool for better portfolio management. CLS is positioned to be the Bank’s platform for credit risk management data; it also provides critical support in determining Probabilities of Default, Loss Given Default, and Exposure at Default, which are vital inputs to ensuring compliance with regulatory and economic capital requirements.
CPSD continually reviews and manages the risk rating structure, including the use of the Moody’s Risk Advisor System. It has updated the peer database, an important component of the Moody’s risk rating model as the accounts’ financial performances are compared against their industry peers. Moreover, it enhanced delivery channels for appraisal and credit investigation, thereby enabling proper management of work volume while meeting turnaround time commitments to internal customers.
CPSD will continue to capitalize on available automation resources and explore other systems for improved productivity and efficiency. It will also actively use training programs to beef up skills and competencies, with the end-view of providing quality credit support and credit risk management services to the Bank.
Treasury GroupIn a year characterized by market volatility, Treasury Group continued to be a reliable force in both the non-proprietary and proprietary trading covering multi-currency fixed-income securities, foreign exchange and derivatives through market reach expansion, product diversification, and focus on client satisfaction. Its head office-based sales team plus nine money centers located in strategic areas nationwide boosted its capability to distribute multi-currency fixed-income and foreign exchange products to service the needs of the clients. The group thus exceeded its volume and income targets and further enhanced the competitiveness of its major units, namely Treasury Marketing, Trading, Fund Management, Product/Systems Development, and Correspondent Banking.
With the aim of maximizing its strengths by focusing on key disciplines, the Treasury organization was streamlined in August 2006. It created the Derivatives Trading/Investment Division, mainly responsible for generating trading and net interest income on derivative/structured

““FASTeller flexed its muscle with a nationwide network of 690 and a cardholder base of 2.14 million by year-end 2006
14 | Building for the Future

2006 Equitable PCI Bank Annual Report | 15
transactions, while the domestic and foreign securities trading/investment functions were likewise merged into one Division. The Derivatives Division actively traded and invested in multi-currency derivative/structures and other innovative global investment products, effectively diversifying investment outlets. The Fixed-Income Division traded in multi-currency bonds and dominated the domestic fixed-income government securities market, gaining acclaim again from the Bureau of Treasury as one of the best Government Securities Eligible Dealers (GSED). In Foreign Exchange trading, the Bank likewise ranked among the most active foreign exchange dealers in the Philippine Dealing System.
Treasury Marketing Division added another money center to the Bank’s vast distribution network. It also introduced new products and offered clients a wider array of investment and hedging instruments to suit their needs.
Through the ALCO process, the Unibank Fund Management Division implemented sound asset/liability management strategies and led the initiative of generating liquidity, funding, and market risk hedging for the Bank. It efficiently employed pricing and gapping strategies to minimize the cost of generating funds, maximize return on funds, and reduce intermediation costs through the use of its various licenses.
The Product, Technology and Information Division spearheaded system improvements for greater operational efficiency. It also actively supported the business units in launching and managing products, comprehensive updates on market-moving news for Bank management and clients.
Correspondent Banking, while aggressively developing new business relationships with various counterparty banks, continued to be instrumental in facilitating trade and non-trade lines for the Bank.
Building on the progress achieved over the past years, the Treasury Group remains fully committed to upgrading its skills and capabilities to keep pace with global standards.
Trust Banking Group2006 was a specially challenging year for the Trust industry. After years of serving the financial needs of the investing public, the common trust funds bowed out in compliance with the BSP mandate. Traditional trust accounts were overhauled to align with the revised regulations governing Living Trust accounts. The newly launched Unit Investment Trust Funds were put to a test when the investment climate changed in May.
The Trust Banking Group bravely faced these challenges. It successfully launched the EPCIB Money Market Funds and increased the overall UITF volume by 43%. Personal Trust business grew by 6% amid the low interest rate environment and methodical revisions in portfolio management.
Corporate Trust showed remarkable improvement both quantitatively and qualitatively. Total assets expanded by 11%, translating to an average annual growth of 17% over the last five years. Its exceptional fund management acumen was underscored when EPCIB Trust Banking delivered the best ROI to 9 out of 10 full discretion accounts co-managed with other trustee banks.
The Bank was awarded service contracts in major investment banking deals, thereby reaffirming its leadership in the fiduciary business. It was appointed Escrow Agent, Receiving and Custodian Bank of two stock issues out of the five offered to the public. The group was also designated as successor transfer agent of an actively traded property issue, successfully dislodging a major competitor trustee from the post. Responding to opportunities in the booming property sector, the Special Trust Division launched the EPCIB Property Escrow +.
The Group complemented its business activities with parallel efforts fulfilling its duties as a responsible corporate citizen. It conducted the third successful run of “The Art of Raising Funds, The Science of Making It Grow” in Davao, where religious, educational and other non-profit organizations in Mindanao learned fund-raising and fund management skills. In line with its commitment to the community of advocacy groups, Trust was a guest institution in the Second Fund-Raising Congress and a major sponsor of the Kyra Awards, the biennial awards that recognize organizations and individuals that exemplify best practices in fund-raising in the Philippines.
Trust Banking has set its sights on blazing trails with innovative products and services through a renewed thrust to implement market-relevant activities and service delivery improvements. These and the added advantages of the power of synergy make the Group strongly positioned to claim a greater share of the investment pie and to attain total customer satisfaction.
Operations GroupThe various support units built on process improvements and cost reduction initiatives during the year. Transaction Processing Division enhanced customer service by implementing the Advanced Loan System and Trade Innovation, which enabled the Bank to phase out its homegrown legacy systems for loans and trade finance. Meanwhile, Treasury Services and Operations Department participated in the PDEX Fixed Income Straight-Through-Processing System, which made deals settlement more efficient, and enhanced systems to meet the stringent reportorial requirements under BSP 524.
Branch operations support relied on technology to simplify and speed up various transactions. Deposit Account Reconciliation Department automated Branch Totals uploading and centralized the reconciliation of Cash on Hand-ATM for both onsite and provincial cash hubs. Clearing and Settlements, on the other hand,

16 | Building for the Future
““Equitable CardNetwork ended 2006 on a high note with net income surging by 13% over the previous year. It remains one of the leading credit card issuers and the largest merchant acquirer with over 42% market share

2006 Equitable PCI Bank Annual Report | 17
propagated the Electronic Check Referral System to the provincial branches, thus transmitting check images digitally and accelerating verification of incoming checks. Cash Operations, in automating the SSS-Disability/Death and Retirement payments, freed up capacity for other services. In compliance with the projected mid-2008 SWIFT upgrades, Test and Cable Department prepared to accept message format revisions and connectivity.
The Division also embarked on the Digital Imaging Project, which will be interfaced with all major systems of the Support Units by 2007. Its imaging, indexing, and archiving capabilities ensure that document retrieval can now be on demand, thereby meeting customer expectations more efficiently.
Direct Banking reported hefty figures for the Bank’s technology-supported products and services. On the ATM front, FASTeller flexed its muscle with a nationwide network of 690 and a cardholder base of 2.14 million by yearend 2006. Total transactions processed showed an 11% increase over 2005 levels; some 70% of these were On-Us transactions. On-Us and Issuer transactions inched up 5% over the previous year; 60% of these were withdrawals.
Phonebanking showed steady growth, with higher digits for FASTPhone transactions and SMS. FASTNet records also rose, even as enrolled users decreased after inactive accounts were purged mid-year. The E-Payment gateway facilitated tax collections totaling about 21% more than in 2005. Another important customer information channel, the Bank’s Call Center, handled and addressed phoned-in requests and inquiries.
Technology-related services likewise showed clear support to the Bank’s leadership in the remittance business. Voice authorization for Moneygram transactions increased by 22% from year-ago levels. Meanwhile, voice authorization for Xoom money transfers held steady as high-volume branches received direct access to Xoom for payment authorization.
EBC Insurance Brokerage, Inc.EBC Insurance Brokerage, Inc. (EIBI) ended 2006 as one of the top five insurance brokers in the country. Based on an industry report released by the Insurance Commission, EIBI ranked fourth largest in commission income earned for the year. Its total annual commission income showed a 21% growth from 2005 levels. Meanwhile, with the uptrend in overall business volume and efficient management of operational costs, EIBI’s operating income increased by 5.3%.
Providing competitive insurance packages and programs for Bank clients and the open market, EIBI handled business referrals from the branches through Project i2 as well as from the various Bank lending units, all of which
contributed to the overall growth in revenues. Project i2 is the referral-based insurance and incentive program of EIBI and the Bank’s Retail Banking Segment. Two main products, the Car-A-Sure and the Home-a-Sure, are primarily sold by the Bank’s Personal and Transaction Banking branch managers.
In 2007, EIBI will continue to promote retail insurance sales mainly through the Bank’s Personal Banking branch managers. It intends to sustain Project i2 as well as sow other sources of insurance business such as referrals from the lending units, Bank affiliates, and the open market.
Special Projects, Asset Management, and Legal GroupSpecial Projects and Advisory Division (SPAAD) led in trimming non-performing loans, managing distressed credits, and disposing of the Bank’s acquired assets. Following a minor reorganization undertaken to improve efficiency through synergy, it now includes Corporate Credit Management Division (CCMD) as well.
The Group delivered strong financial results in reducing losses, contributing profits, and shrinking the Bank’s non-performing loan (NPL) portfolio to below industry norms. SPAAD surpassed its budget by reducing its total NPL’s by 8%. Acquired Assets likewise exceeded their benchmark in disposing of ROPOA’s successfully through direct marketing and auctions.
Transforming distressed credits back into manageable risks and maximizing SPV Law incentives remain the core mandate of the Group. Its target is to continually bring down distressed accounts to single digit levels. With a more efficient organization and well-grounded strategies, SPAAD moves not only to protect but also to promote shareholder wealth.
Human Resources DivisionIts impressive delivery of internal customer service alongside organizational and human resource programs that drove employee and team performance and excellence made 2006 a banner year for the Human Resources Division (HRD).
In the 2006 PENTAD Appreciation and Excellence (APEX) Awards, HRD received the On Demand Service Provider Award for the effective use of automation in servicing internal and/or external customers. The On Demand Service Provider Award recognized the Employee Self-Service (ESS)-My Notices, an electronic facility that significantly improved HR service delivery through the real-time enterprise-wide personalized communication facility. It also cut processes’ turnaround time and produced cost management benefits. Also in 2006, the ESS was adjudged by the Personnel Management Association of the Philippines as one of the finalist HR projects for 2006.

““As a responsible corporate citizen, the Bank lent its strength to projects benefitting the communities that most need steadying hand and guiding vision of the business sector
18 | Building for the Future

2006 Equitable PCI Bank Annual Report | 19
HRD also implemented programs to motivate and promote employee effectiveness in the workplace. It extended ESS service delivery through My Overtime and My Training modules, the intranet Training Calendar, as well as Fastlog, a new facility that instantly records employee attendance via the intranet homepage. Maintaining employee health was given careful attention as well with the Bank-wide Keep ‘N Shape program, which encouraged employee engagement in wellness programs, seminars, and activities.
At the enterprise level, HRD supported the unibank’s Rewards and Recognition Programs through the Retail Banking Sales Conference Awards and the APEX Pentad Head Office and Subsidiaries Awards to recognize teams and individuals who delivered outstanding work performance. HRD also continued to implement other organizational development programs such as Teambuilding, the KABALIKAT (an HR partnering program with the line units), KAMUSTAHAN for new hirees, and the 2006 Internal Customer Satisfaction Surveys (ICSS). HRD actively tapped internal resources from the line as Subject Matter Experts for employee training and development.
Technical training programs such as the Officership Training Program with specialized tracking for head office operations and support units and the Core Credit and Management Training Program for marketing units were also successfully launched in 2006. Further, the Cebu Training Center was inaugurated during the first quarter to cater to the training needs of Visayas and Mindanao offices and branches. Representatives of Management and the Employee’s Union signed the new Collective Bargaining Agreement (CBA) in 2006, and its economic provisions were immediately implemented. As industrial relations were strengthened, it also helped to reinforce the harmonious and efficient operations of the Bank.
The HRD initiatives and achievements in 2006 reflect the Bank’s emphasis on nurturing employee welfare and career advancement while maximizing team potential and unity.
Equitable CardNetworkEquitable CardNetwork (ECN) ended 2006 on a high note with net income surging by 13 % over the previous year. It remains one of the leading credit card issuers and the largest merchant acquirer, with over 42% market share. ECN’s aggressive push in both card issuance and acquisition as well as in maintaining credit quality translated to excellent financial results while keeping overall operating expenses within budget.
ECN plans to grow the loyal cardholder base by at least 20%, with additional boost coming from the Bank’s large branch network and ECN’s competitive suite of credit card products. Among these is the Equitable Travel
Card Titanium MasterCard, the most elite travel card in the country. Having been upgraded to Titanium level, it gives the company the capacity to offer its cardholders maximum spending power as well as unequaled perks and privileges. ECN has further lined up various cross-sell and merchant partnership initiatives targeted to BDO’s and SM’s retail customer networks.
Merchant acquisition also expanded its coverage beyond traditional market establishments. ECN was the first card company to introduce the remote payment system, an innovative facility that uses mobile technology to wirelessly connect to Equitable Card Network and process card transactions in real time. Remote Payment enables the cardholders to do business even in the remotest locations in the country.
PCI Leasing & FinanceOn its 25th year, PCI Leasing soared with its effective combination of product and service quality, cost-efficient operations, and aggressive marketing strategies. Total resources were double those of the next player, while its loan and leasing portfolio – boosted by bank referral business and new growth areas, remained unchallenged. The 19% increase in total resources was due mainly to the P8.9 Billion net loans and leasing portfolio level, a 21% growth over the previous year. PCI Leasing thus ended the year with the highest net income in its industry, surpassing the prior year’s level by 12%.
The Productivity Improvement Committee spearheaded various cost rationalization projects, trimming operating expenses by 2%. Meanwhile, the company successfully executed strategies that took full advantage of its service capabilities, far-reaching network, and solid parent-bank support. Following through on the deployment of a marketing team in General Santos at the start of the year, it applied a similar tack in Isabela and Naga City – and once again enjoyed positive results. PCI Leasing also continued to harness advanced technology for developing new service applications, while devoting equal attention to strengthening customer relations by optimizing workflow and marketing channels.
Beyond the investments in technology and resources, PCI Leasing recognizes that its greatest strength lies in its people. A team of highly skilled and competent professionals represents its most valuable assets. To reinforce their skills, a series of training seminars and briefings were again conducted during the year. Participants included even personnel outside of the marketing units, and were coached for product awareness, thus enhancing the company’s over-all capability to cross-sell products.
Guided by the vision to continue evolving as a top-quality finance company with a solid base, all of PCI Leasing’s branches contributed significantly towards generating new clients and promoting its products and services

20 | Building for the Future
““Strengthening established foundations of the customer-centric set-up geared towards synergistic business results and excellent customer experience continued to be the overriding goal of Retail Banking

2006 Equitable PCI Bank Annual Report | 532006 Equitable PCI Bank Annual Report | 21
nationwide. To date, 12 branches/marketing teams are strategically located nationwide to better serve our clients and maximize potential growth areas.
With the industry-leading results recorded in 2006, PCI Leasing is more than well-prepared for the business opportunities it foresees in the Banco de Oro-Equitable PCI Bank merger. The synergy generated by such a fusion of leaders means that the company will command the most extensive market reach and the widest product offerings. It intends to capitalize on these advantages to achieve even greater strength in the industry.
PCI Capital CorporationPCI Capital Corporation, the Bank’s investment banking arm, focused on providing clients with a wide array of capital market products such as equity and debt underwriting, dollar and peso loan syndication, project finance, private equity, trading and brokering of financial assets, and financial advisory services.
In 2006, PCI Capital continued to build on its strength in the midst of strong debt and equity markets recovery fueled by a relatively more stable economy and political landscape. It led or participated in major financial transactions involving over P62.0 billion in debt and equity – over three and a half times more than the previous year.
Among others, PCI Capital acted as: Joint Issue Manager for the P12 Billion Corporate Notes Issue of Manila Electric Company; Joint Issue Manager for the P2.8 Billion Corporate Notes Issue of Globe Telecom, Inc.; Joint Arranger for the P3.0 Billion Term Loan for Holcim Phils., Inc.; and Arranger for the P1.5 Billion Term Loan for DMCI Holdings, Inc. During the year, PCI Capital likewise acted as the Domestic Coordinator for the P12 Billion Follow-on Offer of Universal Robina Corporation; Underwriter for the P5.8 Billion Perpetual Preferred Shares Issue of Ayala Corporation; Co-Lead Manager for the P19 Billion IPO of PNOC-Energy Development Corp.; Underwriter for the P1.5 Billion Follow-on Offer of Chemrez Technologies, Inc.; and Co-Lead Underwriter for the P1.5 Billion Preferred Shares Issue of Aboitiz Equity Ventures, Inc.
In 2006, PCI Capital’s Average Return on Assets and Average Return on Equity stood at 16.6% and 16.9%, respectively.
With the merger of Banco de Oro and EPCIBank, the investment banking subsidiary of the merged bank gains an even stronger platform to enhance its league-leading position in the underwriting business. Its expanding customer base of securities issuers can look forward to a diverse array of novel financing structures, while investors are assured of quality investment opportunities that only PCI Capital can offer.
Corporate CommunicationsAs the information medium within the Bank as well as between the Bank and its various target audiences, the Corporate Communications (Corcomm) Division spearheaded various initiatives in internal communications, public/media relations, advertising, community relations, marketing communications, as well as corporate social responsibility.
Corcomm provided timely and relevant information within the Equitable PCI Bank community through the Bank’s official publications and media channels. It also managed and maintained the websites of the Bank and its subsidiaries. In 2006, it launched the Equitable Savings Bank website and created a new web link for Cash Management.
Communication is integral to the promotion of the Bank’s corporate image. In line with institutional strategies, Corcomm drove the concepts for advertising, promotions and sales that enhanced the Bank’s franchise and created powerful brands for its products and services. Institutional and product campaigns for the year included Consumer Finance Own It, ESB Institutional Ad, Deals On Wheels, and Reader’s Digest Trusted Brand Award for EPCIBank. Accolades reaped by the Bank as well as milestones in its financial performance, product promotions, and major tie-ups received publicity as well. Tapping new media technology, Corcomm deployed various Bank product ads and promotions through electronic billboards situated in high-traffic sites in Metro Manila.
In support of the Bank’s business units, Corcomm staged major events such as RBG National Sales Conference, the Pentad Appreciation and Excellence Awards, Anniversary Service Awards, Friendship Cup Clients Appreciation Golf Tournament, Stockholders’ Meeting, and Senior Officers Welcome Rites. The Division also managed the Bank’s sports development programs and hobby clubs, as well as coordinated activities and events at the Chapel of Our Lady of Guadalupe, the Francisco Santiago Hall, and the Antonio Molina Hall.
Beyond the everyday requirements of managing corporate communications, the Division represented the Bank in its corporate social responsibility efforts, believing as it does that building for the future demands much more. As a responsible corporate citizen, the Bank lent its strength to projects benefiting the communities that most need the steadying hand and guiding vision of the business sector. It participated in relief operations and medical missions to respond to families blighted by natural disasters, such as the communities hit by Typhoon Reming in Bicol in mid-2006.
Over the longer term, the Bank is looking at more sustainable programs that help people not only survive, but thrive in developing their potential and building self-sufficiency.

Powered by consumption and the services sector, the Philippine economy grew by 5.4% in 2006, surpassing the 5.0% rise in Gross Domestic Product (GDP) in 2005. Meanwhile, the 15.4% real growth in net factor income from abroad, pushed by record-high migrant remittances, lifted the country’s Gross National Product (GNP) growth to 6.2% from 5.6% In 2005.
Personal consumption spending was the country’s main growth engine, recorded at +5.5% in 2006 from 4.9% in 2005. Higher OFW remittances, easing inflation, and a strong peso provided the underlying strength to personal spending growth. Led by electronics (+8.4%), exports improved on its 4% rise in 2005 to gain a hefty 14% in 2006, even as non- electronics exports contributed to the sector’s strong performance. Meanwhile, imports mirrored the faster economic pace last year, rising 8.7% from 7.7%. Despite operating on a reenacted budget, the government grew its expenditures by 5.7% in 2006 from 4% in 2005, spurred by the fourth-quarter surge in spending following the passage of a supplemental budget in the latter part of last year. Real investments recovered from the 6% decline in 2005 to rise 2.1% in 2006. Production showed broad-based growth in 2006. Services remained the biggest contributor to GDP with a 6.3% expansion, as the continuing boom in Business Process Outsourcing (BPOs), low interest rates, and decelerating inflation benefited specific sectors (e.g., communications, real estate and property, finance, retail trade, and private services). The agricultural sector grew by a higher 4.1% in 2006 from 1.8% in 2005, as it recovered from the impact of the El Niño. Growth could have been higher if not for the destructive typhoons in the fourth quarter, which curtailed output. Meanwhile, the industry sector posted a 4.8% increase, led by manufacturing (+5.4%) which rode on steady domestic and foreign demand, and construction (+4.6%) which benefited from low interest rates and the real estate recovery.
The government posted an over-performance on the fiscal front for the fourth consecutive year as the budget gap shrank to an eight-year low of P62.2 Billion, which was half the programmed level for 2006 and 57.6% lower than the level in 2005. A robust 20% growth in revenues as the government realized the gains from the RVAT and other fiscal reforms, complemented by a prudent 8.1% rise in spending in the absence of a 2006 budget, contributed to the small fiscal gap. The deficit-to-GDP ratio further improved to -1.04% from -2.7% in 2005; meanwhile, the primary surplus (government revenues net of interest payments) rose to P247.9 Billion or 4.1% of GDP, from P153.3 Billion or 2.9% of GDP in 2005. This build-up in primary surplus means more government funds could be spent for economic and social services. The government’s improving fiscal finances allowed it to cut its borrowing requirements. At the same time, the country experienced slowing inflation and excess system liquidity – the latter stemming from increased foreign flows and furthered by the Monetary Board’s re-introduction of the tiered interest rate scheme in November 2006. All these developments kept a tight rein on interest rates last year. The average benchmark 91-day Treasury bill rate fell to 5.3% in 2006 from 6.4% in 2005. Meanwhile, the inflation rate followed a continuing downtrend starting in April after hitting a high of 7.6% in February and March to reflect the one-off price increases resulting from the RVAT. By December, the inflation rate settled at 4.3%, the lowest in two-and-a-half years.
Increased foreign capital flows on revitalized investor confidence and the robust expansion in OFW remittances lifted the peso to its highest level in six years to P49.13, representing more than 7% appreciation versus the US dollar. The volume of OFW remittances coursed through the banking system last year jumped 19.4% to a record high $12.8 Billion from $10.8 Billion in 2005. The BSP reported that the total volume of OFW remittances, including the estimated 10% coursed through non-official channels, amounted to $14.0 Billion in 2006.
PhiliPPine economic Performance in 2006 and ProsPects for 2007
22 | Building for the Future

“ “
The deficit-to-GDP ratio further improved to -1.04% from -2.7% in 2005; meanwhile, the primary surplus (government revenues net of interest payments) rose to P247.9 Billion or 4.1% of GDP, from P153.3 Billion or 2.9% of GDP in 2005.
In a sense, the government’s markedly improved fiscal performance set off a virtuous cycle that further strengthened the country’s macroeconomic fundamentals. Borrowing costs fell as yields on Philippine bonds and securities dropped given improving fiscal finances and reduced need for borrowings. Dollar inflows accelerated in step with foreign confidence, building up the country’s reserves ($22.5 Billion in 2006) and enabling the government to make debt prepayments totaling $2.1 Billion. The country’s debt-to-GDP ratio thus improved, falling to 64% from 72% in 2005.
As a result, international credit rating agencies upgraded the country’s outlook to “stable” from “negative”. Further upgrades in actual credit ratings, however, remain contingent on the country’s ability to sustain the improvement in its debt indicators. Amid the positive developments, the Philippine composite index emerged as the 5th best performing market in Asia, surging 42% to finish at a 10-year best of 3,020.70 in 2006. The Philippines was definitely back on the investors’ radar screens. Moving forward, increased economic growth in 2007 is expected to be driven by consumption and amplified by
public infrastructure spending on the back of continuing progress in fiscal position (the government hopes to strike a balanced budget by 2008). Higher government spending should generate the desired multiplier effects on incomes and job creation, furthering investments and credit demand. The property upcycle, largely propelled by low interest rates as well as the OFW and BPO markets, serves as a driver of loan demand.
Certain risks, however, may cloud the economic outlook this year. A slowing US economy poses a growing concern given its negative implications on Philippine export performance. A US Fed rate hike on fresh inflation pressures could trigger an exodus of funds to the US, weighing on the peso. The volatility in the global financial and capital markets has highlighted the fact that the country does not remain immune to changing investor risk appetites. If prolonged, the disquiet about emerging markets could prompt monetary action from the BSP (e.g., raise interest rates) to quell capital flight. Meanwhile, political noise could be renewed on the unfavorable conduct of the mid-term elections, as well as the success of the opposition to wrest a majority of the congressional seats needed to pass an impeachment case against President Arroyo.
2006 Equitable PCI Bank Annual Report | 23

24 | Building for the Future
STATEMENT OF MANAGEMENT’S RESPONSIBILITY
SECURITIES AND EXCHANGE COMMISSIONSEC Building, EDSA GreenhillsSan Juan, Metro Manila
The Management of Equitable PCI Bank, Inc. and its subsidiaries is responsible for all information and representations contained in the financial statements as of December 31, 2006 and 2005 and for the years then ended. The financial statements have been prepared in conformity with generally accepted accounting principles in the Philippines and reflect amounts that are based on the best estimates and informed judgment of management with an appropriate consideration to materiality.
In this regard, Management maintains a system of accounting and reporting which provides for the necessary internal controls to ensure that transactions are properly authorized and recorded, assets are safeguarded against unauthorized use or disposition and liabilities are recognized. The Management likewise discloses to the company’s audit committee and to its external auditor: (i) all significant deficiencies in the design or operation of internal controls that could adversely affect its ability to record, process, and report financial data; (ii) material weaknesses in the internal controls; and (iii) any fraud that involves management or other employees who exercise significant roles in internal controls.
The Audit Committee and the Board of Directors review the financial statements before such statements are approved and submitted to the stockholders of the Bank.
Sycip Gorres Velayo & Co., the independent auditors appointed by the stockholders, has examined the financial statements of Equitable PCI Bank, Inc. and its subsidiaries in accordance with generally accepted auditing standards in the Philippines and has expressed its opinion on the fairness of presentation upon completion of such examination, in its report to the Board of Directors and stockholders.
CORAZON S. DE LA PAZChairperson
RENE J. BUENAVENTURAPresident & Chief Executive Officer
RICARDO V. MARTINExecutive Vice President & Comptroller

2006 Equitable PCI Bank Annual Report | 25
The Stockholders and the Board of DirectorsEquitable PCI Bank, Inc.
We have audited the accompanying consolidated financial statements of Equitable PCI Bank, Inc. and Subsidiaries (the Group) and the parent company financial statements of Equitable PCI Bank, Inc. (the Parent Company) which comprise the statements of condition as of December 31, 2006 and 2005, and the statements of income, statements of changes in equity and statements of cash flows for each of the three years in the period ended December 31, 2006, and a summary of significant accounting policies and other explanatory notes.
Management’s Responsibility for the Financial Statements
Management is responsible for the preparation and fair presentation of these financial statements in accordance with Philippine Financial Reporting Standards. This responsibility includes: designing, implementing and maintaining internal control relevant to the preparation and fair presentation of financial statements that are free from material misstatement, whether due to fraud or error; selecting and applying appropriate accounting policies; and making accounting estimates that are reasonable in the circumstances.
Auditors’ Responsibility
Our responsibility is to express an opinion on these financial statements based on our audits. We conducted our audits in accordance with Philippine Standards on Auditing. Those standards require that we comply with ethical requirements and plan and perform the audit to obtain reasonable assurance whether the financial statements are free from material misstatement.
An audit involves performing procedures to obtain audit evidence about the amounts and disclosures in the financial statements. The procedures selected depend on the auditor’s judgment, including the assessment of the risks of material misstatement of the financial statements, whether due to fraud or error. In making those risk assessments, the auditor considers internal control relevant to the entity’s preparation and fair presentation of the financial statements in order to design audit procedures that are appropriate in the circumstances, but not for the purpose of expressing an opinion on the effectiveness of the entity’s internal control. An audit also includes evaluating the appropriateness of accounting policies used and the reasonableness of accounting estimates made by management, as well as evaluating the overall presentation of the financial statements.
We believe that the audit evidence we have obtained is sufficient and appropriate to provide a basis for our audit opinion.
Opinion
In our opinion, the financial statements present fairly, in all material respects, the financial position of the Group and of the Parent Company as of December 31, 2006 and 2005, and their financial performance and their cash flows for each of the three years in the period ended December 31, 2006 in accordance with Philippine Financial Reporting Standards.
SYCIP GORRES VELAYO & CO.
Wilson P. TanPartnerCPA Certificate No. 76737SEC Accreditation No. 0100-AR-1Tax Identification No. 102-098-469PTR No. 0267394, January 2, 2007, Makati City
March 20, 2007
INDEPENDENT AUDITORS’ REPORT

26 | Building for the Future
Consolidated Parent CompanyDecember 31
2006 2005 2006 2005
ASSETSCash and Other Cash Items (Notes 14 and 18) P8,663,488 P7,541,236 P8,381,197 P7,199,793Due from Bangko Sentral ng Pilipinas
(Notes 14 and 18) 23,262,456 7,232,106 22,611,472 6,917,169Due from Other Banks (Notes 6 and 18) 6,520,845 4,676,319 3,801,286 3,842,373Interbank Loans Receivable and Securities Purchased
Under Resale Agreements (Notes 18 and 31) 27,572,262 18,199,624 27,732,262 18,199,624
Securities at Fair Value Through Profit or Loss (Notes 7 and 18) 22,761,419 26,061,882 22,621,745 25,921,031
Available-for-Sale Investments (Notes 7 and 18) 9,620,736 17,108,772 7,828,016 15,358,057Held-to-Maturity Investments (Notes 7, 14 and 18) 29,903,374 32,483,945 29,552,707 32,200,964Loans and Receivables (Notes 8, 18, 19 and 28) 161,431,665 140,187,890 140,945,119 132,590,379Property and Equipment (Notes 9 and 18) At cost 5,085,455 5,283,628 4,361,059 4,694,238 At appraised value 4,412,676 4,500,557 4,406,236 4,406,236Investments in Subsidiaries and Associates (Notes 10 and 18) 204,227 290,772 8,498,329 8,965,584Investment Properties (Notes 11 and 18) 17,875,203 18,436,362 15,165,141 15,932,951Goodwill (Notes 3 and 18) 15,680,124 15,680,124 15,680,124 15,680,124Other Assets (Notes 12 and 18) 12,147,895 14,368,369 9,235,144 11,602,514
P345,141,825 P312,051,586 P320,819,837 P303,511,037
LIABILITIES AND EQUITYLiabilitiesDeposit Liabilities (Notes 14, 18 and 28) P240,099,250 P206,664,245 P231,963,428 P202,154,155Bills Payable (Notes 15 and 18) 20,155,857 29,705,735 14,325,120 27,198,167Outstanding Acceptances (Note 18) 960,980 615,944 960,980 615,944Manager’s Checks and Demand Drafts
Outstanding (Note 18) 1,422,304 912,091 1,293,530 891,704Accrued Interest Payable (Note 18) 1,051,145 794,639 620,818 526,999Accrued Taxes and Other Expenses (Notes 18 and 24) 3,111,319 2,311,484 1,851,859 1,580,717Subordinated Notes Payable (Notes 16 and 18) 9,691,113 10,474,797 9,691,113 10,474,797Other Liabilities (Notes 17 and 18) 21,168,553 23,075,237 17,211,958 19,019,762
P297,660,521 P274,554,172 P277,918,806 P262,462,245
STATEMENTS OF CONDITION(Amounts in Thousands)

2006 Equitable PCI Bank Annual Report | 27
Consolidated Parent CompanyDecember 31
2006 2005 2006 2005
EQUITY ATTRIBUTABLE TO EQUITY HOLDERS OF THE PARENT COMPANY
Common Stock (Note 19) P7,270,033 P7,270,033 P7,270,033 P7,270,033Capital Paid in Excess of Par Value 36,416,709 37,395,672 37,395,672 37,395,672Surplus Reserve (Notes 19 and 25) 605,943 558,396 605,943 558,396Surplus (Deficit) (Note 25) 167,679 (3,049,953) (4,316,750) (5,953,851)Parent Company Shares Held by a Subsidiary
(Notes 19 and 33) – (7,466,950) – –Net Unrealized Gain on Available-for-Sale
Investments (Notes 7 and 31) 596,517 548,127 596,517 548,127Share in Net Unrealized Gain on Available-for-Sale
Investments of a Subsidiary (Notes 7 and 31) 101,297 15,436 – –Share in Revaluation Increment on Land of a
Subsidiary (Note 9) 12,336 8,323 – –Revaluation Increment on Property (Note 9) 1,349,616 1,349,616 1,349,616 1,349,616Accumulated Translation Adjustment (208,055) (119,362) – (119,201)
46,312,075 36,509,338 42,901,031 41,048,792MINORITY INTEREST 1,169,229 988,076 – –
47,481,304 37,497,414 42,901,031 41,048,792P345,141,825 P312,051,586 P320,819,837 P303,511,037
See accompanying Notes to Financial Statements.
STATEMENTS OF CONDITION(Amounts in Thousands)

28 | Building for the Future
Consolidated Parent CompanyYears Ended December 31
2006 2005 2004 2006 2005 2004INTEREST INCOME Loans and receivables (Notes 8 and 28) P11,845,659 P11,622,190 P10,153,123 P9,596,687 P9,897,930 P8,455,505Trading and investment securities
(Note 7) 6,520,362 5,399,839 4,409,653 6,447,867 5,321,506 4,258,945Interbank loans receivable and
securities purchased under resale agreements 640,829 1,405,277 1,097,891 635,689 1,374,735 1,107,502
Deposits with other banks and others 632,268 623,816 988,590 391,732 360,269 400,315
19,639,118 19,051,122 16,649,257 17,071,975 16,954,440 14,222,267INTEREST AND FINANCE CHARGES Deposit liabilities (Notes 14 and 28) 6,253,512 5,528,979 5,005,618 5,870,775 5,248,890 4,780,818Bills payable, borrowings and others (Note 15) 2,422,811 2,872,954 2,722,002 2,179,763 2,736,508 2,660,761
8,676,323 8,401,933 7,727,620 8,050,538 7,985,398 7,441,579NET INTEREST INCOME 10,962,795 10,649,189 8,921,637 9,021,437 8,969,042 6,780,688Service fees and commission income 5,695,782 4,927,951 4,408,239 2,860,933 2,782,369 2,399,632Trading gains - net (Note 7) 2,533,799 1,120,139 415,761 2,484,166 1,098,211 324,637Foreign exchange gains - net 813,865 670,382 290,079 701,177 665,630 194,545Other operating income (Note 22) 3,423,408 2,838,131 2,694,134 2,924,066 2,174,838 2,643,134TOTAL OPERATING INCOME 23,429,649 20,205,792 16,729,850 17,991,779 15,690,090 12,342,636Compensation and fringe benefits (Notes 20 and 28) 4,320,679 3,814,804 3,348,972 3,662,660 3,232,974 2,778,298Provision for impairment and credit losses (Note 13) 4,127,322 2,857,922 4,130,165 4,096,631 1,996,690 3,089,528Occupancy and other equipment-related expenses (Note 21) 1,909,069 1,819,071 1,618,273 1,678,784 1,637,611 1,402,259Depreciation and amortization (Notes 9 and 11) 1,399,137 1,326,926 1,326,546 1,084,484 1,059,006 1,082,173Taxes and licenses (Note 24) 1,589,498 1,446,358 1,149,867 1,242,949 1,127,960 877,771Other expenses (Note 23) 5,104,466 3,966,991 3,696,167 3,376,761 2,589,888 2,312,986TOTAL OPERATING EXPENSES 18,450,171 15,232,072 15,269,990 15,142,269 11,644,129 11,543,015INCOME BEFORE SHARE IN NET INCOME OF ASSOCIATES AND INCOME TAX 4,979,478 4,973,720 1,459,860 2,849,510 4,045,961 799,621SHARE IN NET INCOME (LOSSES) OF ASSOCIATES (Note 10) 22,739 562 (21,748) – – –INCOME BEFORE INCOME TAX 5,002,217 4,974,282 1,438,112 2,849,510 4,045,961 799,621PROVISION FOR (BENEFIT FROM) INCOME TAX (Note 24) 1,555,885 2,176,436 (1,075,730) 1,045,661 1,703,455 (1,557,869)NET INCOME P3,446,332 P2,797,846 P2,513,842 P1,803,849 P2,342,506 P2,357,490(Forward)
STATEMENTS OF INCOME(Amounts In Thousands except Earnings Per Share)

2006 Equitable PCI Bank Annual Report | 29
ConsolidatedYears Ended December 31
2006 2005 2004Attributable to:Equity holders of the Parent Company (Note 30) P3,265,179 P2,698,385 P2,412,080Minority interest 181,153 99,461 101,762
P3,446,332 P2,797,846 P2,513,842Basic/Diluted Earnings Per Share Attributable to Equity
Holders of the Parent Company (Note 30) P4.89 P4.16 P3.72
See accompanying Notes to Financial Statements.
STATEMENTS OF INCOME(Amounts In Thousands except Earnings Per Share)

30 | Building for the Future
Consolidated
Equity Attributable to Equity Holders of the Parent Company
CommonStock
(Note 19)
Capital Paid in
Excess of Par Value
SurplusReserve
(Note 25)
Surplus(Deficit)
(Note 25)
Parent Company
Shares Held by a
Subsidiary
Net UnrealizedGain (Loss)
on Available-for-Sale
Investments(Note 7)
Share in NetUnrealized Gain (Loss)
on Available-for-Sale
Investments of a Subsidiary
(Note 7)
Share inRevaluation
Increment onLand of a
Subsidiary
RevaluationIncrement on
Property(Note 9)
AccumulatedTranslation
Adjustment TotalMinority Interest
Total Equity
Balance at January 1, 2006 P7,270,033 P37,395,672 P558,396 (P3,049,953) (P7,466,950) P548,127 P15,436 P8,323 P1,349,616 (P119,362) P36,509,338 P988,076 P37,497,414
Translation adjustment during the year – – – – – – – – – (88,693) (88,693) – (88,693)
Net gain (loss) during the year on available-for-sale investments – – – – – 48,390 85,861 – – – 134,251 – 134,251
Adjustment on revaluation increment – – – – – – – 4,013 – – 4,013 – 4,013
Income and expenses for the year recognized directly in equity – – – – – 48,390 85,861 4,013 – (88,693) 49,571 – 49,571
Net income for the year – – – 3,265,179 – – – – – – 3,265,179 181,153 3,446,332
Total income and expenses for the year – – – 3,265,179 – 48,390 85,861 4,013 – (88,693) 3,314,750 181,153 3,495,903
Sale of Parent Company shares held by a subsidiary – (978,963) – – 7,466,950 – – – – – 6,487,987 – 6,487,987
Transfer to surplus reserve – – 47,547 (47,547) – – – – – – – – –
Balance at December 31, 2006 P7,270,033 P36,416,709 P605,943 P167,679 P– P596,517 P101,297 P12,336 P1,349,616 (P208,055) P46,312,075 P1,169,229 P47,481,304
Balance at December 31, 2004 P7,270,033 P37,395,672 P510,356 P2,604,888 (P7,466,950) (P5,979) (P48,581) P8,441 P1,350,177 P20,151 P41,638,208 P980,157 P42,618,365
Cumulative effect of change in accounting for Financial instruments - Philippine Accounting Standard (PAS) 39 (Note 2) – – – (7,868,984) – 68,903 – – – – (7,800,081) (91,542) (7,891,623)
Balance at January 1, 2005 7,270,033 37,395,672 510,356 (5,264,096) (7,466,950) 62,924 (48,581) 8,441 1,350,177 20,151 33,838,127 888,615 34,726,742
Translation adjustment during the year – – – – – – – – – (139,513) (139,513) – (139,513)
Net gain during the year on available-for-sale investments – – – – – 485,203 64,017 – – – 549,220 – 549,220
Adjustment on revaluation increment – – – – – – – (118) (561) – (679) – (679)
Income and expenses for the year recognized directly in equity – – – – – 485,203 64,017 (118) (561) (139,513) 409,028 – 409,028
Net income for the year – – – 2,698,385 – – – – – – 2,698,385 99,461 2,797,846
Total income and expenses for the year – – – 2,698,385 – 485,203 64,017 (118) (561) (139,513) 3,107,413 99,461 3,206,874
Transfer to surplus reserve – – 48,040 (48,040) – – – – – – – – –
Dividends paid – – – (436,202) – – – – – – (436,202) – (436,202)
Balance at December 31, 2005 P7,270,033 P37,395,672 P558,396 (P3,049,953) (P7,466,950) P548,127 P15,436 P8,323 P1,349,616 (P119,362) P36,509,338 P988,076 P37,497,414
Balance at December 31, 2003 P7,270,033 P37,395,672 P451,977 P234,933 (P7,466,950) (P980) (P63,374) P2,417 P1,321,143 P– P39,144,871 P878,395 P40,023,266
Translation adjustment during the year – – – – – – – – – 20,151 20,151 – 20,151
Net unrealized gain (loss) during the year – – –
– – (4,999) 14,793 – – – 9,794 – 9,794
Adjustment on revaluation increment – – – – – – – 6,024 40,087 – 46,111 – 46,111
Income and expenses for the year recognized directly in equity – – – – – (4,999) 14,793 6,024 40,087 20,151 76,056 – 76,056
Net income for the year – – – 2,412,080 – – – – – – 2,412,080 101,762 2,513,842
Total income and expenses for the year – – – 2,412,080 – (4,999) 14,793 6,024 40,087 20,151 2,488,136 101,762 2,589,898
Transfer from revaluation increment – – – 16,254 – – – – (11,053) – 5,201 – 5,201
Transfer to surplus reserve – – 58,379 (58,379) – – – – – – – – –
Balance at December 31, 2004 P7,270,033 P37,395,672 P510,356 P2,604,888 (P7,466,950) (P5,979) (P48,581) P8,441 P1,350,177 P20,151 P41,638,208 P980,157 P42,618,365
STATEMENTS OF CHANGES IN EQUITY(In Thousand Pesos)

2006 Equitable PCI Bank Annual Report | 31
Consolidated
Equity Attributable to Equity Holders of the Parent Company
CommonStock
(Note 19)
Capital Paid in
Excess of Par Value
SurplusReserve
(Note 25)
Surplus(Deficit)
(Note 25)
Parent Company
Shares Held by a
Subsidiary
Net UnrealizedGain (Loss)
on Available-for-Sale
Investments(Note 7)
Share in NetUnrealized Gain (Loss)
on Available-for-Sale
Investments of a Subsidiary
(Note 7)
Share inRevaluation
Increment onLand of a
Subsidiary
RevaluationIncrement on
Property(Note 9)
AccumulatedTranslation
Adjustment TotalMinority Interest
Total Equity
Balance at January 1, 2006 P7,270,033 P37,395,672 P558,396 (P3,049,953) (P7,466,950) P548,127 P15,436 P8,323 P1,349,616 (P119,362) P36,509,338 P988,076 P37,497,414
Translation adjustment during the year – – – – – – – – – (88,693) (88,693) – (88,693)
Net gain (loss) during the year on available-for-sale investments – – – – – 48,390 85,861 – – – 134,251 – 134,251
Adjustment on revaluation increment – – – – – – – 4,013 – – 4,013 – 4,013
Income and expenses for the year recognized directly in equity – – – – – 48,390 85,861 4,013 – (88,693) 49,571 – 49,571
Net income for the year – – – 3,265,179 – – – – – – 3,265,179 181,153 3,446,332
Total income and expenses for the year – – – 3,265,179 – 48,390 85,861 4,013 – (88,693) 3,314,750 181,153 3,495,903
Sale of Parent Company shares held by a subsidiary – (978,963) – – 7,466,950 – – – – – 6,487,987 – 6,487,987
Transfer to surplus reserve – – 47,547 (47,547) – – – – – – – – –
Balance at December 31, 2006 P7,270,033 P36,416,709 P605,943 P167,679 P– P596,517 P101,297 P12,336 P1,349,616 (P208,055) P46,312,075 P1,169,229 P47,481,304
Balance at December 31, 2004 P7,270,033 P37,395,672 P510,356 P2,604,888 (P7,466,950) (P5,979) (P48,581) P8,441 P1,350,177 P20,151 P41,638,208 P980,157 P42,618,365
Cumulative effect of change in accounting for Financial instruments - Philippine Accounting Standard (PAS) 39 (Note 2) – – – (7,868,984) – 68,903 – – – – (7,800,081) (91,542) (7,891,623)
Balance at January 1, 2005 7,270,033 37,395,672 510,356 (5,264,096) (7,466,950) 62,924 (48,581) 8,441 1,350,177 20,151 33,838,127 888,615 34,726,742
Translation adjustment during the year – – – – – – – – – (139,513) (139,513) – (139,513)
Net gain during the year on available-for-sale investments – – – – – 485,203 64,017 – – – 549,220 – 549,220
Adjustment on revaluation increment – – – – – – – (118) (561) – (679) – (679)
Income and expenses for the year recognized directly in equity – – – – – 485,203 64,017 (118) (561) (139,513) 409,028 – 409,028
Net income for the year – – – 2,698,385 – – – – – – 2,698,385 99,461 2,797,846
Total income and expenses for the year – – – 2,698,385 – 485,203 64,017 (118) (561) (139,513) 3,107,413 99,461 3,206,874
Transfer to surplus reserve – – 48,040 (48,040) – – – – – – – – –
Dividends paid – – – (436,202) – – – – – – (436,202) – (436,202)
Balance at December 31, 2005 P7,270,033 P37,395,672 P558,396 (P3,049,953) (P7,466,950) P548,127 P15,436 P8,323 P1,349,616 (P119,362) P36,509,338 P988,076 P37,497,414
Balance at December 31, 2003 P7,270,033 P37,395,672 P451,977 P234,933 (P7,466,950) (P980) (P63,374) P2,417 P1,321,143 P– P39,144,871 P878,395 P40,023,266
Translation adjustment during the year – – – – – – – – – 20,151 20,151 – 20,151
Net unrealized gain (loss) during the year – – –
– – (4,999) 14,793 – – – 9,794 – 9,794
Adjustment on revaluation increment – – – – – – – 6,024 40,087 – 46,111 – 46,111
Income and expenses for the year recognized directly in equity – – – – – (4,999) 14,793 6,024 40,087 20,151 76,056 – 76,056
Net income for the year – – – 2,412,080 – – – – – – 2,412,080 101,762 2,513,842
Total income and expenses for the year – – – 2,412,080 – (4,999) 14,793 6,024 40,087 20,151 2,488,136 101,762 2,589,898
Transfer from revaluation increment – – – 16,254 – – – – (11,053) – 5,201 – 5,201
Transfer to surplus reserve – – 58,379 (58,379) – – – – – – – – –
Balance at December 31, 2004 P7,270,033 P37,395,672 P510,356 P2,604,888 (P7,466,950) (P5,979) (P48,581) P8,441 P1,350,177 P20,151 P41,638,208 P980,157 P42,618,365

32 | Building for the Future
Parent Company
Common Stock(Note 19)
Capital Paid in Excess
of Par Value
SurplusReserve
(Note 25)
Surplus(Deficit)
(Note 25)
Parent Company Shares
Held by a Subsidiary
Net UnrealizedGain (Loss) onAvailable-for-
SaleInvestments
(Note 7)
Share in NetUnrealized Loss
on Available-for-sale
Investments of a Subsidiary
(Note 7)
Share inRevaluation
Increment onLand of a
Subsidiary
RevaluationIncrement
on Property (Note 9)
AccumulatedTranslation
AdjustmentTotal
Equity
Balance at January 1, 2006 P7,270,033 P37,395,672 P558,396 (P5,953,851) P– P548,127 P– P– P1,349,616 (P119,201) P41,048,792
Translation adjustment adjusted to surplus – – – (119,201) – – – – 119,201 –
Net loss during the year on available-for-sale investments – – – – – 48,390 – – – – 48,390
Income and expenses for the year recognized directly in equity – – – (119,201) – 48,390 – – – 119,201 48,390
Net income for the year – – – 1,803,849 – – – – – – 1,803,849
Total income and expenses for the year – – – 1,684,648 – 48,390 – – – 119,201 1,852,239
Transfer to surplus reserve – – 47,547 (47,547) – – – – – – –
Balance at December 31, 2006 P7,270,033 P37,395,672 P605,943 (P4,316,750) P– P596,517 P– P– P1,349,616 P– P42,901,031
Balance at December 31, 2004 P7,270,033 P37,395,672 P510,356 (P979,994) P– (P5,979) P– P– P1,350,177 P20,151 P45,560,416
Cumulative effect of change in accounting for
Financial instruments - PAS 39 (Note 2) – – – (6,832,121) – 49,174 – – – – (6,782,947)
Balance at January 1, 2005 7,270,033 37,395,672 510,356 (7,812,115) – 43,195 – – 1,350,177 20,151 38,777,469
Translation adjustment during the year – – – – – – – – – (139,352) (139,352)
Net gain during the year on available-for-sale investments – – – – – 504,932 – – – – 504,932
Adjustment on revaluation increment – – – – – – – – (561) – (561)
Income and expenses for the year recognized directly in equity – – – – – 504,932 – – (561) (139,352) 365,019
Net income for the year – – – 2,342,506 – – – – – – 2,342,506
Total income and expenses for the year 2,342,506 504,932 (561) (139,352) 2,707,525
Transfer to surplus reserve – – 48,040 (48,040) – – – – – – –
Dividends declared – – – (436,202) – – – – – – (436,202)
Balance at December 31, 2005 P7,270,033 P37,395,672 P558,396 (P5,953,851) P– P548,127 P– P– P1,349,616 (P119,201) P41,048,792
Balance at December 31, 2003 P7,270,033 P37,395,672 P451,977 (P3,295,359) P– (P980) P– P– P1,321,143 P– P43,142,486
Translation adjustment during the year – – – – – – – – – 20,151 20,151
Net unrealized loss during the year – – – – – (4,999) – – – – (4,999)
Adjustment on revaluation increment – – – – – – – – 40,087 – 40,087
Income and expenses for the year recognized directly in capital funds – – – – – (4,999) – – 40,087 20,151 55,239
Net income for the year – – – 2,357,490 – – – – – – 2,357,490
Total income and expenses for the year – – 2,357,490 – (4,999) – – 40,087 20,151 2,412,729
Transfer from revaluation increment – – – 16,254 – – – – (11,053) – 5,201
Transfer to surplus reserve – – 58,379 (58,379) – – – – – – –
Balance at December 31, 2004 P7,270,033 P37,395,672 P510,356 (P979,994) P– (P5,979) P– P– P1,350,177 P20,151 P45,560,416
See accompanying Notes to Financial Statements.
STATEMENTS OF CHANGES IN EQUITY(In Thousand Pesos)

2006 Equitable PCI Bank Annual Report | 33
Parent Company
Common Stock(Note 19)
Capital Paid in Excess
of Par Value
SurplusReserve
(Note 25)
Surplus(Deficit)
(Note 25)
Parent Company Shares
Held by a Subsidiary
Net UnrealizedGain (Loss) onAvailable-for-
SaleInvestments
(Note 7)
Share in NetUnrealized Loss
on Available-for-sale
Investments of a Subsidiary
(Note 7)
Share inRevaluation
Increment onLand of a
Subsidiary
RevaluationIncrement
on Property (Note 9)
AccumulatedTranslation
AdjustmentTotal
Equity
Balance at January 1, 2006 P7,270,033 P37,395,672 P558,396 (P5,953,851) P– P548,127 P– P– P1,349,616 (P119,201) P41,048,792
Translation adjustment adjusted to surplus – – – (119,201) – – – – 119,201 –
Net loss during the year on available-for-sale investments – – – – – 48,390 – – – – 48,390
Income and expenses for the year recognized directly in equity – – – (119,201) – 48,390 – – – 119,201 48,390
Net income for the year – – – 1,803,849 – – – – – – 1,803,849
Total income and expenses for the year – – – 1,684,648 – 48,390 – – – 119,201 1,852,239
Transfer to surplus reserve – – 47,547 (47,547) – – – – – – –
Balance at December 31, 2006 P7,270,033 P37,395,672 P605,943 (P4,316,750) P– P596,517 P– P– P1,349,616 P– P42,901,031
Balance at December 31, 2004 P7,270,033 P37,395,672 P510,356 (P979,994) P– (P5,979) P– P– P1,350,177 P20,151 P45,560,416
Cumulative effect of change in accounting for
Financial instruments - PAS 39 (Note 2) – – – (6,832,121) – 49,174 – – – – (6,782,947)
Balance at January 1, 2005 7,270,033 37,395,672 510,356 (7,812,115) – 43,195 – – 1,350,177 20,151 38,777,469
Translation adjustment during the year – – – – – – – – – (139,352) (139,352)
Net gain during the year on available-for-sale investments – – – – – 504,932 – – – – 504,932
Adjustment on revaluation increment – – – – – – – – (561) – (561)
Income and expenses for the year recognized directly in equity – – – – – 504,932 – – (561) (139,352) 365,019
Net income for the year – – – 2,342,506 – – – – – – 2,342,506
Total income and expenses for the year 2,342,506 504,932 (561) (139,352) 2,707,525
Transfer to surplus reserve – – 48,040 (48,040) – – – – – – –
Dividends declared – – – (436,202) – – – – – – (436,202)
Balance at December 31, 2005 P7,270,033 P37,395,672 P558,396 (P5,953,851) P– P548,127 P– P– P1,349,616 (P119,201) P41,048,792
Balance at December 31, 2003 P7,270,033 P37,395,672 P451,977 (P3,295,359) P– (P980) P– P– P1,321,143 P– P43,142,486
Translation adjustment during the year – – – – – – – – – 20,151 20,151
Net unrealized loss during the year – – – – – (4,999) – – – – (4,999)
Adjustment on revaluation increment – – – – – – – – 40,087 – 40,087
Income and expenses for the year recognized directly in capital funds – – – – – (4,999) – – 40,087 20,151 55,239
Net income for the year – – – 2,357,490 – – – – – – 2,357,490
Total income and expenses for the year – – 2,357,490 – (4,999) – – 40,087 20,151 2,412,729
Transfer from revaluation increment – – – 16,254 – – – – (11,053) – 5,201
Transfer to surplus reserve – – 58,379 (58,379) – – – – – – –
Balance at December 31, 2004 P7,270,033 P37,395,672 P510,356 (P979,994) P– (P5,979) P– P– P1,350,177 P20,151 P45,560,416
See accompanying Notes to Financial Statements.

34 | Building for the Future
Consolidated Parent CompanyYears Ended December 31
2006 2005 2004 2006 2005 2004CASH FLOWS FROM OPERATING ACTIVITIESIncome before income tax P5,002,217 P4,974,282 P1,438,112 P2,849,508 P4,045,961 P799,621Adjustments for:Provision for impairment and
credit losses (Note 13) 4,127,322 2,857,922 4,130,165 4,096,631 1,996,690 3,089,528Depreciation and amortization (Notes 9 and 11) 1,399,137 1,344,671 1,344,291 1,084,484 1,059,006 1,082,173Gain on disposal of investment
properties (Note 22) (926,181) (487,459) (83,394) (848,215) (389,649) (82,895)Realized trading gain (590,929) − − (564,670) − −Amortization of premium/discount 275,154 − − 317,902 − −Gain on sale of property and equipment (Note 22) (106,953) (90,961) (34,085) (89,355) (85,809) (26,947)Share in net (income) losses of associates (Note 10) (22,739) (562) 21,748 − − −Changes in operating assets and liabilities: Decrease (increase) in amounts of: Interbank loans receivable and securities purchased under resale agreements 948,968 1,501,333 (3,113,205) 948,968 (2,093,001) (3,113,205) Securities at fair value through profit or loss 3,300,463 (8,013,885) – 3,299,286 (4,503,393) – Trading account securities – – 303,127 – 47,697 Loans and receivables (24,978,012) (1,485,415) – (11,010,343) 3,988,063 – Receivable from customers – – (22,258,548) – – (18,097,635) Other assets 7,308,818 (1,379,842) (2,413,939) 239,407 (125,824) (449,905) Increase (decrease) in amounts of: Deposit liabilities 33,435,005 13,143,906 7,476,137 29,809,273 12,581,057 6,267,786 Accrued interest payable 256,506 242,230 – 93,819 98,068 – Accrued taxes and other expenses 757,547 542,827 (139,729) 284,397 442,979 (448,991) Manager’s checks and demand drafts outstanding 510,213 29,946 (61,154) 401,826 29,632 (40,777) Other liabilities (1,906,684) (1,146,171) 8,989,162 (1,807,803) (2,606,854) 7,083,531Net cash generated (used in) from operations 28,789,852 12,032,822 (4,401,312) 29,105,115 14,436,926 (3,890,019)Income taxes paid (1,010,482) (625,184) (747,883) (582,619) (477,287) (345,648)Net cash provided by (used in) operating activities P27,779,370 P11,407,638 (P5,149,195) P28,522,496 P13,959,639 (P4,235,667)(Forward)
STATEMENTS OF CASH FLOWS(In Thousand Pesos)

2006 Equitable PCI Bank Annual Report | 35
Consolidated Parent CompanyYears Ended December 31
2006 2005 2004 2006 2005 2004CASH FLOWS FROM INVESTING
ACTIVITIESAcquisitions of: Available-for-sale investments (P31,526,419) P– P– (P30,873,159) P– P– Available-for-sale securities – – (5,537,822) – – (5,532,837) Held-to-maturity investments (40,171,936) (3,079,423) – (40,171,936) (4,197,748) – Investment in bonds, and
other debt instruments – – (4,886,175) – – (5,272,516) Property and equipment
(Note 9) (1,675,359) (1,101,064) (2,427,461) (697,393) (701,530) (1,989,159) Investments in subsidiaries
and associates 3,000 – – – – – Investment properties
(Note 31) (8,645) – – (8,645) – –Proceeds from sale/maturity of: Available-for-sale
investments 38,994,327 3,643,001 – 38,876,260 4,914,297 – Held-to-maturity
investments 42,502,291 – – 42,502,291 – – Investment in bonds, and
other debt instruments – – – – – Property and equipment 924,665 381,242 1,488,590 236,351 110,856 1,303,490 Investments in subsidiaries
and associates – 428,235 363,439 – (3,165,350) 1,122,001 Investment properties 2,485,966 2,154,426 2,573,407 2,241,656 1,954,967 2,195,902Net cash provided by (used in)
investing activities 11,527,890 2,426,417 (8,426,022) 12,105,425 (1,084,508) (8,173,119)CASH FLOWS FROM
FINANCING ACTIVITIESAvailments of bills payable 76,514,022 161,544,780 – 74,318,598 159,728,148 172,165,543Settlement of bills payable (82,073,268) (157,377,564) – (81,540,439) (155,306,306) (162,029,523)Increase (decrease) in amounts of: Bills payable (3,990,632) 1,548,509 (5,559,940) (5,651,206) 361,708 (15,084,335) Outstanding acceptances 345,036 (6,986,372) 6,418,944 345,036 (6,986,372) 6,418,944Repayment of subordinated
bonds (783,684) (620,618) 156,343 (783,684) (620,618) 156,343Dividend paid (Note 19) – (436,202) – – (436,202) –Net cash provided by (used in)
financing activities (9,988,526) (2,327,467) 1,015,347 (13,311,695) (3,259,642) 1,626,972NET INCREASE (DECREASE)
IN CASH AND CASH
EQUIVALENTS 29,318,734 11,506,588 (12,559,870) 27,316,226 9,615,489 (10,781,814)CASH AND CASH
EQUIVALENTS AT
BEGINNING OF YEARCash and other cash items 7,541,236 8,721,441 8,673,595 7,199,793 8,471,498 8,509,893Due from Bangko Sentral ng
Pilipinas 7,232,106 2,316,093 5,305,743 6,917,169 2,059,639 5,129,645Due from other banks 4,676,319 7,701,330 8,592,021 3,842,373 6,114,500 7,136,031Interbank loans receivable and
securities purchased
under resale agreements
(Note 31) 16,106,623 5,310,832 14,038,207 16,106,623 7,804,832 14,456,714P35,556,284 P24,049,696 P36,609,566 P34,065,958 P24,450,469 P35,232,283
(Forward)
STATEMENTS OF CASH FLOWS(In Thousand Pesos)

36 | Building for the Future
Consolidated Parent CompanyYears Ended December 31
2006 2005 2004 2006 2005 2004CASH AND CASH EQUIVALENTS AT END OF YEARCash and other cash items P8,663,488 P7,541,236 P8,721,441 P8,381,197 P7,199,793 P8,471,498Due from Bangko Sentral ng Pilipinas 23,262,456 7,232,106 2,316,093 22,611,472 6,917,169 2,059,639Due from other banks 6,520,845 4,676,319 7,701,330 3,801,286 3,842,373 6,114,500Interbank loans receivable and securities purchased under resale agreements (Note 31) 26,428,229 16,106,623 5,310,832 26,588,229 16,106,623 7,804,832
P64,875,018 P35,556,284 P24,049,696 P61,382,184 P34,065,958 P24,450,469
OPERATIONAL CASH FLOWS FROM INTEREST AND DIVIDENDS
Consolidated Parent CompanyYears Ended December 31
2006 2005 2004 2006 2005 2004
Interest received P19,531,648 P19,499,849 P16,635,750 P16,984,868 P17,423,407 P14,216,162Interest paid 8,419,817 8,159,703 8,134,159 7,956,719 7,887,330 7,942,182Dividend received 97,278 90,513 61,479 1,120,052 460,635 1,156,607
See accompanying Notes to Financial Statements.
STATEMENTS OF CASH FLOWS(In Thousand Pesos)

NOTES TO FINANCIAL STATEMENTS
2006 Equitable PCI Bank Annual Report | 37
1. Corporate Information
Equitable PCI Bank, Inc. (the Parent Company) is a universal bank incorporated in the Philippines, with registered office address at Equitable PCI Bank Tower I, Makati Avenue corner H.V. de la Costa Street, Salcedo Village, Makati City. The Parent Company and its subsidiaries (the Group) are engaged in the business of banking, financing, leasing, real estate, insurance and stock brokering and other related services to personal, commercial, corporate and institutional clients through a network of 409 local and international branches, offices and agencies. The Group’s products and services include deposit-taking, lending and related services, treasury and capital market operations, trade services, payments and cash management, and trust services.
The accompanying financial statements of the Group and of the Parent Company were authorized for issue by the Parent Company’s Board Audit Committee and confirmed by the Board of Directors (BOD) in its meeting on March 20, 2007.
2. Summary of Significant Accounting Policies
Basis of Preparation The accompanying financial statements have been prepared on a historical cost basis except for securities at fair value
through profit or loss (FVPL), available-for-sale (AFS) investments, land, and derivative financial instruments that have been measured at fair value. The financial statements are presented in Philippine pesos, and all values are rounded to the nearest thousand pesos (P000) except when otherwise indicated.
The financial statements of the Parent Company reflect the accounts maintained in the Regular Banking Unit (RBU) and Foreign Currency Deposit Unit (FCDU). For financial reporting purposes, FCDU accounts and foreign currency-denominated accounts in the RBU are translated into their equivalents in Philippine pesos. The financial statements individually prepared for these units are combined after eliminating inter-unit accounts.
Statement of ComplianceThe financial statements of the Group and of the Parent Company have been prepared in compliance with Philippine Financial Reporting Standards (PFRS).
Basis of ConsolidationThe consolidated financial statements include the financial statements of the Parent Company and the following wholly-owned and majority-owned subsidiaries:
Subsidiary
Effective Percentage
of Ownership
Country of
IncorporationFinancial Markets: EBC Investments, Inc. (EBCII) and Subsidiaries 100 Philippines Equitable PCI Bank Cayman Limited (EPCI Cayman) 100 Cayman Island Equitable Savings Bank, Inc. (ESB) 100 Philippines Express Padala (HK) Ltd. (EPHK) 100 Hong Kong Jardine Equitable Finance Corp. (JEFC) 100 Philippines PCI Capital Corporation (PCI Capital) and Subsidiaries 100 Philippines PCIB Europe S.p.A. (PCIB S.p.A) 100 Italy PCI Express Padala (HK) Limited (Express Padala HK) 100 Hong Kong PCI Express Padala - L.A. (Express Padala L.A.) 100 United States of America PCI Express Padala Frankfurt 100 Germany PCI Express Padala (Rotterdam) B.V. 100 Netherlands Equitable Card Network, Inc. (ECN) and Subsidiaries 90 Philippines PCI Leasing and Finance, Inc. (PCI Leasing) 85 PhilippinesInsurance Brokerage: EBC Insurance Brokerage, Inc. (EIBI) 100 Philippines PCI Insurance Brokers, Inc. (PCI Insurance) 100 PhilippinesSecurities Brokerage: PCIB Securities, Inc. (PCIB Securities) 100 PhilippinesReal Estate: PCIB Properties, Inc. (PCIB Properties) 100 Philippines PCI Realty Corporation (PCI Realty) 100 Philippines Equimark-NFC Development Corporation (Equimark) 60 PhilippinesOthers: EBC Strategic Holdings Corp. (ESHC) and Subsidiaries 100 Philippines Equitable Data Center, Inc. (EDCI) 100 Philippines PCI Automation Center, Inc. (PCI Automation) 100 Philippines Maxicare 60 Philippines

NOTES TO FINANCIAL STATEMENTS
38 | Building for the Future
The consolidated financial statements are prepared for the same reporting year of the Parent Company using consistent accounting policies.
All significant intra-group balances, transactions, income and expenses and profits and losses resulting from intra-group transactions are eliminated in full in the consolidation.
Subsidiaries are fully consolidated from the date on which control is transferred to the Group. Control is achieved where the Group has the power to govern the financial and operating policies of an entity so as to obtain benefits from its activities. Consolidation of subsidiaries ceases when control is transferred out of the Group or Parent Company.
The consolidated financial statements include the accounts of special purpose vehicles (SPV) namely, Philippine Investment One (PIO), Philippine Investment Two (PIT), and Cameron Granville Asset Management, Inc. (CGAM) in accordance with Philippine Interpretation SIC-12, Consolidation of Special Purpose Entity (SPE). The Parent Company sold certain assets to PIO, PIT and CGAM under transactions that qualified, and was approved by the BSP, as legal true sale (see Notes 8 and 12). While the Group has no equity interest in PIO, PIT and CGAM, it retains majority of the residual risks related to PIO, PIT and CGAM or their assets in order to obtain benefits from their activities.
The results of subsidiaries acquired or disposed of during the year are included in the consolidated statement of income from the date of acquisition or up to the date of disposal, as appropriate.
Minority InterestsMinority interests represent the portion of profit or loss and the net assets not held by the Group and are presented separately in the consolidated statement of income and within equity in the consolidated statement of condition, separately from parent shareholders’ equity. Acquisitions of minority interests are accounted for using the entity concept method, whereby the difference between the consideration and the book value of the share of the net assets acquired is recognized as an equity transaction.
Changes in Accounting Policies The accounting policies adopted are consistent with those of the previous financial year except as follows:
Amendments to PFRSs and Philippine Interpretations effective in 2006 The Group has adopted the following amendments to PFRS and Philippine Interpretation during the year. Adoption of
these revised standards and interpretations did not have any significant effect on the Group. They did, however, give rise to additional disclosures in the financial statements.
• Philippine Accounting Standard (PAS) 19, Amendment–Employee Benefits• PAS 21, Amendment–The Effects of Changes in Foreign Exchange Rates• PAS 39, Amendments–Financial Instruments: Recognition and Measurement• Philippine Interpretation IFRIC–4, Determining Whether an Arrangement Contains a Lease
Philippine Interpretation early adoptedThe Group has early adopted Philippine Interpretation IFRIC–9, Reassessment of Embedded Derivatives.
The principal effects of these changes, if any, are as follows:
PAS 19, Employee BenefitsAmendment for actuarial gains and losses, group plans and disclosures. As of January 1, 2006, the Group adopted the amendments to PAS 19. As a result, additional disclosures on the financial statements are made, starting in 2006, to provide information about trends in the assets and liabilities in the defined benefit plans and the assumptions underlying the components of the defined benefit cost. This change has no recognition nor measurement impact, as the Group chose not to apply the new option to recognize actuarial gains and losses outside of the statement of income.

NOTES TO FINANCIAL STATEMENTS
2006 Equitable PCI Bank Annual Report | 39
PAS 21, The Effects of Changes in Foreign Exchange RatesAmendment for net investment in a foreign operation. As of January 1, 2006, the Group adopted the amendments to PAS 21. As a result, all exchange differences arising from a monetary item that forms part of the Group’s net investment in a foreign operation are recognized in a separate component of equity in the consolidated financial statements regardless of the currency in which the monetary item is denominated. This change has no significant impact on the financial statements.
PAS 39, Financial Instruments: Recognition and MeasurementAmendment for financial guarantee contracts. This amended the scope of PAS 39 to require financial guarantee contracts that are not considered to be insurance contracts to be recognized initially at fair value and to be remeasured at the higher of the amount determined in accordance with PAS 37, Provisions, Contingent Liabilities and Contingent Assets and the amount initially recognized less, when appropriate, cumulative amortization recognized in accordance with PAS 18, Revenue. This amendment did not have any significant impact on the financial statements.
Amendment for cash flow hedge accounting of forecast intra-group transactions. This amended PAS 39 to permit the foreign currency risk of a highly probable intra-group forecast transaction to qualify as the hedged item in a cash flow hedge, provided that the transaction is denominated in a currency other than the functional currency of the entity entering into that transaction and that the foreign currency risk will affect the consolidated statement of income. As the Group currently has no such transactions, the amendment did not have any significant impact on the financial statements.
Amendment for the fair value option. This amended PAS 39 to restrict the use of the option to designate at inception any financial asset or any financial liability to be measured at fair value through the income statement. The Bank has reassessed its existing FVPL investments, including documentation of the specific conditions allowing the continued FVPL classification of such investments. The Bank complied with the requirements of this amendment.
Philippine Interpretation IFRIC–4, Determining Whether an Arrangement Contains a LeaseThis Interpretation provides guidance in determining whether an arrangement contains a lease to which lease accounting must be applied. This Interpretation has no significant impact on the financial statements.
Philippine Interpretation IFRIC–9, Reassessment of Embedded DerivativesThis Interpretation becomes effective for financial years beginning on or after June 1, 2006. It establishes that the date to assess the existence of an embedded derivative is the date an entity first becomes a party to the contract, with reassessment only if there is a change to the contract that significantly modifies the cash flows. The Group assessed that adoption of this Interpretation has no significant impact on the financial statements.
Foreign Currency TranslationThe consolidated financial statements are presented in Philippine pesos, which is the Parent Company’s functional currency. Each entity in the Group determines its own functional currency and items included in the financial statements of each entity are measured using that functional currency.
Transaction and balancesThe books of accounts of the RBU are maintained in Philippine pesos, while those of the FCDU are maintained in US dollar. For financial reporting purposes, the monetary assets and liabilities of the FCDU and foreign currency-denominated monetary assets and liabilities in the RBU are translated in Philippine pesos based on the Philippine Dealing System (PDS) closing rate prevailing at end of the year and foreign currency-denominated income and expenses, at the average PDS weighted average rate (PDSWAR) for the year. Foreign exchange differences arising from restatements of foreign currency-denominated assets and liabilities are credited to or charged against income in the period in which the rates change. Non-monetary items that are measured in terms of historical cost in a foreign currency are translated using the exchange rates as at the dates of the initial transactions. Non-monetary items measured at fair value in a foreign currency are translated using the exchange rates at the date when the fair value was determined.

NOTES TO FINANCIAL STATEMENTS
40 | Building for the Future
Group companiesAs at the reporting date, the assets and liabilities of subsidiaries and the overseas branch are translated into the Parent Company’s presentation currency (the Philippine peso) at the rate of exchange prevailing on the statement of condition date, and their income and expenses are translated at the weighted average exchange rates for the year. Exchange differences arising on translation are taken directly to a separate component of equity (under Accumulated Translation Adjustment). On disposal of a foreign entity, the deferred cumulative amount recognized in equity relating to that particular foreign operation is recognized in the statement of income.
Financial instruments Date of recognition Purchases or sales of financial assets that require delivery of assets within the time frame established by regulation or
market convention are recognized on the settlement date. Derivatives are recognized on trade date (i.e., the date that the Group commits to purchase or sell). Deposits, amounts due to banks and customers and loans are recognized when cash is received by the Group or advanced to the borrowers. For stockbroker subsidiaries, PCIB Securities and Armstrong Securities, Inc. (ASI), securities transactions and the related commission income and expense are recorded on a trade date.
Initial recognition of financial instrumentsAll financial assets, including trading and investment securities and loans and receivables, are initially recognized at fair value. Except for securities at FVPL, the initial measurement of financial assets includes transaction costs. The Group classifies its financial assets in the following categories: securities at FVPL, held-to-maturity (HTM) investments, AFS investments, and loans and receivables. The classification depends on the purpose for which the investments were acquired and whether they are quoted in an active market. Management determines the classification of its investments at initial recognition and, where allowed and appropriate, re-evaluates such designation at every reporting date.
Determination of fair valueThe fair value for financial instruments traded in active markets at the statement of condition date is based on their quoted market prices or dealer price quotations (bid price for long positions and ask price for short positions), without any deduction for transaction costs. When current bid and asking prices are not available, the price of the most recent transaction provides evidence of the current fair value as long as there has not been a significant change in economic circumstances since the time of the transaction.
For all other financial instruments not listed in an active market, the fair value is determined by using appropriate valuation techniques. Valuation techniques include net present value techniques, comparison to similar instruments for which market observable prices exist, option pricing models, and other relevant valuation models.
Derivatives recorded at FVPLThe Parent Company and some of its subsidiaries are counterparties to derivative contracts, such as currency forwards, currency swaps, and interest rate swaps. These derivatives are entered into as a service to customers and as a means of reducing or managing their respective foreign exchange and interest rate exposures, as well as for trading purposes. Such derivative financial instruments are initially recorded at fair value on the date at which the derivative contract is entered into and are subsequently remeasured at fair value. Any gains or losses arising from changes in fair values of derivatives (except those accounted for as accounting hedges) are taken directly to the statement of income and are included in ‘Trading gains - net’. Derivatives are carried as assets when the fair value is positive and as liabilities when the fair value is negative.
For the purpose of hedge accounting, hedges are classified primarily as either: a) a hedge of the fair value of an asset, liability or a firm commitment (fair value hedge); or b) a hedge of the exposure to variability in cash flows attributable to an asset or liability or a forecasted transaction (cash flow hedge). In 2006 and 2005, the Group did not apply hedge accounting treatment for its derivatives transactions.

NOTES TO FINANCIAL STATEMENTS
2006 Equitable PCI Bank Annual Report | 41
The Group has certain derivatives that are embedded in host financial (such as structured notes, debt investments, and loan receivables) and non-financial (such as purchase orders and service agreements) contracts. These embedded derivatives include credit default swaps (which are linked either to a single reference entity or a basket of reference entities), barrier options, and calls and puts in debt instruments, which include structured notes and deposits; conversion options in loans receivable; call options in certain long-term debt, and foreign currency - denominated derivatives in debt instruments, purchase orders and service agreements.
Embedded derivatives are bifurcated from their host contracts and carried at fair value with fair value changes being reported through profit or loss, when the entire hybrid contracts (composed of both the host contract and the embedded derivative) are not accounted for as securities at FVPL, and when their economic risks and characteristics are not closely related to those of their respective host contracts.
Other financial assets or financial liabilities held for trading Other financial assets or financial liabilities held for trading are recorded in the statement of condition at fair value.
Changes in fair value relating to the held-for-trading positions are recognized in ‘Trading gains - net’. Interest earned or incurred is recorded as interest income or expense, respectively, while dividend income is recorded in other operating income when the right to receive payment has been established.
Included in this classification are debt securities which have been acquired principally for the purpose of selling or repurchasing in the near term.
Financial assets or financial liabilities at FVPL Financial assets or financial liabilities classified in this category are designated by management on initial recognition when
the following criteria are met:
• The designation eliminates or significantly reduces the inconsistent treatment that would otherwise arise from measuring the assets or liabilities or recognizing gains or losses on them on a different basis; or
• The assets and liabilities are part of a group of financial assets, financial liabilities or both which are managed and their performance are evaluated on a fair value basis, in accordance with a documented risk management or investment strategy; or
• The financial instrument contains an embedded derivative, unless the embedded derivative does not significantly modify the cash flows or it is clear, with little or no analysis, that it would not be separately recorded.
Financial assets and financial liabilities at FVPL are recorded in the statement of condition at fair value. Changes in fair value on financial assets and liabilities designated as FVPL are recorded in ‘Trading gains - net’. Interest earned or incurred is recorded in interest income or expense, respectively, while dividend income is recorded in other operating income according to the terms of the contract, or when the right of payment has been established.
‘Day 1’ profitWhere the transaction price in a non-active market is different to the fair value from other observable current market transactions in the same instrument or based on a valuation technique whose variables include only data from observable market, the Group recognizes the difference between the transaction price and fair value (a Day 1 profit) in the statement of income in ‘Trading gains - net’. In cases where use is made of data which is not observable, the difference between the transaction price and model value is only recognized in the statement of income when the inputs become observable or when the instrument is derecognized. For each transaction, the Group determines the appropriate method of recognizing the ‘Day 1’ profit amount.

NOTES TO FINANCIAL STATEMENTS
42 | Building for the Future
HTM investmentsHTM investments are quoted non-derivative financial assets with fixed or determinable payments and fixed maturities for which the Group’s management has the positive intention and ability to hold to maturity. Where the Group sells other than an insignificant amount of HTM investments, the entire category would be tainted and reclassified as AFS investments. After initial measurement, HTM investments are subsequently measured at amortized cost using the effective interest rate method, less impairment in value. Amortized cost is calculated by taking into account any discount or premium on acquisition and fees that are an integral part of the effective interest rate. The amortization is included in ‘Interest income’ in the statement of income. Gains and losses are recognized in income when the HTM investments are derecognized and impaired, as well as through the amortization process. The losses arising from impairment of such investments are recognized in the statement of income under ‘Provision for impairment and credit losses’. The effects of restatement of foreign currency-denominated HTM investments are recognized in the statement of income.
Loans and receivables, amounts due from BSP and other banksClassified as Loans and Receivables are ‘Due from Bangko Sentral ng Pilipinas’ (BSP), ‘Due from other banks’, and ‘Loans and receivables’. These are financial assets with fixed or determinable payments that are not quoted in an active market. They are not entered into with the intention of immediate or short-term resale and are not classified as ’other financial assets held for trading’, designated as ‘AFS investments’ or ‘financial assets designated at FVPL’.
Loans and receivables also include receivables arising from transactions on credit cards issued directly by ECN. Collection of receivables from credit cardholders of other banks is guaranteed by those banks with tie-up arrangements with ECN. ‘Loans and receivables’ also include the aggregate rental on finance lease transactions. Unearned income on finance lease transactions is shown as a deduction from ‘Loans and receivables’ (included in ‘Unearned discount’).
After initial measurement, ‘Loans and Receivables’, ‘Due from BSP’ and ‘Due from other banks’ are subsequently measured at amortized cost using the effective interest rate method, less allowance for impairment losses. Amortized cost is calculated by taking into account any discount or premium on acquisition and fees that are an integral part of the effective interest rate. The amortization is included in ‘Interest income’ in the statement of income. The losses arising from impairment of such loans and receivables are recognized in ‘Provision for impairment and credit losses’ in the statement of income.
AFS investmentsAFS investments are those investments which are designated as such or do not qualify to be classified as designated as FVPL, HTM investments or loans and receivables. They are purchased and held indefinitely, and may be sold in response to liquidity requirements or changes in market conditions. They include equity investments, money market papers and other debt instruments.
After initial measurement, AFS investments are subsequently measured at fair value. The effective yield component of AFS debt securities, as well as the impact of restatement on foreign currency-denominated AFS debt securities, is reported in earnings. The unrealized gains and losses arising from the fair valuation of AFS investments are excluded net of tax from reported earnings and are reported as ‘Net unrealized gain or loss on AFS investments’ (net of tax where applicable) in the equity section of the statement of condition.
When the security is disposed of, the cumulative gain or loss previously recognized in equity is recognized as ‘Trading gains - net’ in the statement of income. Interest earned on holding AFS investments are reported as interest income using the effective interest rate. Dividends earned on holding AFS investments are recognized in the statement of income as ‘Other operating income’ when the right of payment has been established. The losses arising from impairment of such investments are recognized as ‘Provisions on impairment and credit losses’ in the statement of income.
Bills payable and other borrowed funds Issued financial instruments or their components, which are not designated at FVPL are classified as liabilities under ‘Bills
payable’ or other appropriate financial liability accounts, where the substance of the contractual arrangement results in the Group having an obligation either to deliver cash or another financial asset to the holder, or to satisfy the obligation other than by the exchange of a fixed amount of cash or another financial asset for a fixed number of own equity shares. The components of issued financial instruments that contain both liability and equity elements are accounted for separately, with the equity component being assigned the residual amount after deducting from the instrument as a whole the amount separately determined as the fair value of the liability component on the date of issue.

NOTES TO FINANCIAL STATEMENTS
2006 Equitable PCI Bank Annual Report | 43
After initial measurement, bills payable and similar financial liabilities not qualified as and not designated as FVPL, are subsequently measured at amortized cost using the effective interest rate method. Amortized cost is calculated by taking into account any discount or premium on the issue and fees that are an integral part of the effective interest rate.
Prior to January 1, 2005, investment securities were accounted for as follows:
Trading Account Securities (TAS) TAS, which consist of government and private debt and equity securities, are purchased and held principally with the
intention of selling them in the near term. These securities are carried at fair value; realized and unrealized gains and losses on these instruments are recognized in ‘Trading gains – net’ in the statement of income. Interest earned on debt instruments is reported as ‘Interest Income’.
When a security is transferred from TAS, the unrealized holding gain or loss at the date of the transfer is not reversed and is recognized in the statements of income immediately.
Available- for-Sale Securities (ASS)Securities are classified as ASS when purchased and held indefinitely, i.e., neither held to maturity nor for trading purposes, where the Group anticipates to sell in response to liquidity requirements or in anticipation of changes in interest rates or other factors. ASS are carried at fair market value and any unrealized gains or losses are reported as a separate component of equity.
After initial recognition, investments which are classified as ASS are measured at fair value. Gains or losses are recognized as a separate component of equity until the investment is sold, collected or otherwise disposed of, or until the investment is determined to be impaired, at which time the cumulative gain or loss previously reported in capital funds is included in the statement of income.
Investment in Bonds and Other Debt Instruments (IBODI)IBODI are debt securities where the Group has the positive intent and ability to hold to maturity. These securities are carried at amortized cost on a straight-line basis; realized gains and losses are included in ‘Trading gains – net’ in the statement of income.
When a debt security is transferred into ASS from IBODI, the unrealized holding gain or loss at the date the transfer shall be excluded from reported earnings and reported as a separate component of equity until realized.
The cumulative effect of adopting PAS 32 and 39 charged to surplus as of January 1, 2005 consists of:
ConsolidatedParent
CompanyRecognition of additional impairment losses (P6,663,892) (P5,627,029)Recognition of fair value changes on embedded derivatives at transition date (1,160,688) (1,160,688)Take up of the effect of change from straight line to effective interest method (19,872) (19,872)Net effect of reclassification of securities (24,532) (24,532)
(P7,868,984) (P6,832,121)
The net effect of the reclassification from other financial assets to AFS investments and vice versa on ‘Net unrealized gain (loss) on AFS investments’ amounted to P 68.9 million as of January 1, 2005.

NOTES TO FINANCIAL STATEMENTS
44 | Building for the Future
Derecognition of Financial Assets and LiabilitiesFinancial assetA financial asset (or, where applicable a part of a financial asset or part of a group of financial assets) is derecognized where:
1. the rights to receive cash flows from the asset have expired;2. the Group retains the right to receive cash flows from the asset, but has assumed an obligation to pay them in full
without material delay to a third party under a “pass-through” arrangement; or3. the Group has transferred its rights to receive cash flows from the asset and either (a) has transferred substantially all
the risks and rewards of the asset, or (b) has neither transferred nor retained the risk and rewards of the asset but has transferred the control of the asset.
Where the Group has transferred its rights to receive cash flows from an asset or has entered into a pass-through arrangement, and has neither transferred nor retained substantially all the risks and rewards of the asset nor transferred control of the asset, the asset is recognized to the extent of the Group’s continuing involvement in the asset. Continuing involvement that takes the form of a guarantee over the transferred asset is measured at the lower of original carrying amount of the asset and the maximum amount of consideration that the Group could be required to repay.
Financial liabilityA financial liability is derecognized when the obligation under the liability is discharged or cancelled or expired. Where an existing financial liability is replaced by another from the same lender on substantially different terms, or the terms of an existing liability are substantially modified, such an exchange or modification is treated as a derecognition of the original liability and the recognition of a new liability, and the difference in the respective carrying amounts is recognized in profit or loss.
Repurchase and reverse repurchase agreementsSecurities sold under agreements to repurchase at a specified future date (‘repos’) are not derecognized from the statement of condition. The corresponding cash received, including accrued interest, is recognized on the statement of condition as a loan to the Group, reflecting the economic substance of such transaction. The Group has no repurchase agreements as of December 31, 2006 and 2005.
Conversely, securities purchased under agreements to resell at a specified future date (‘reverse repos’) are not recognized on the statement of condition. The corresponding cash paid, including accrued interest, is recognized on the statement of condition as ‘Securities Purchased Under Resale Agreements’ (SPURA), and is considered a loan to the counterparty. The difference between the purchase price and resale price is treated as interest income and is accrued over the life of the agreement using the effective interest rate method.
Securities Lending and BorrowingSecurities lending and borrowing transactions are usually collateralized by securities or cash. The transfer of the securities to counterparties is only reflected on the statement of condition if the risk and rewards of ownership are also transferred. Cash advanced or received as collateral is recorded as an asset or liability.
Securities borrowed are not derecognized on the statement of condition, unless they are sold to third parties, in which case the obligation to return the securities is recorded as a trading liability and measured at fair value with any gains or losses included in ‘Trading gains - net’.

NOTES TO FINANCIAL STATEMENTS
2006 Equitable PCI Bank Annual Report | 45
Impairment of Financial Assets The Group assesses at each statement of condition date whether there is objective evidence that a financial asset or group of financial assets is impaired. A financial asset or a group of financial assets is deemed to be impaired if, and only if, there is objective evidence of impairment as a result of one or more events that has occurred after the initial recognition of the asset (an incurred loss event) and that loss event (or events) has an impact on the estimated future cash flows of the financial asset or the group of financial assets that can be reliably estimated. Evidence of impairment may include indications that the borrower or a group of borrowers is experiencing significant financial difficulty, default or delinquency in interest or principal payments, the probability that they will enter bankruptcy or other financial reorganization and where observable data indicate that there is measurable decrease in the estimated future cash flows, such as changes in arrears or economic conditions that correlate with defaults.
Loans and receivablesFor loans and receivables carried at amortized cost, the Group first assesses whether objective evidence of impairment exists individually for financial assets that are individually significant, or collectively for financial assets that are not individually significant. If the Group determines that no objective evidence of impairment exists for individually assessed financial asset, whether significant or not, it includes the asset in a group of financial assets with similar credit risk characteristics and collectively assesses for impairment. Those characteristics are relevant to the estimation of future cash flows for groups of such assets by being indicative of the debtors’ ability to pay all amounts due according to the contractual terms of the assets being evaluated. Assets that are individually assessed for impairment and for which an impairment loss is, or continues to be, recognized are not included in a collective assessment for impairment.
If there is objective evidence that an impairment loss has been incurred, the amount of the loss is measured as the difference between the assets’ carrying amount and the present value of the estimated future cash flows (excluding future credit losses that have not been incurred). The carrying amount of the asset is reduced through use of an allowance account and the amount of loss is charged to the statement of income. Interest income continues to be recognized thereafter based in the interest rate used to discount the future cash flows for the purpose of measuring the impairment loss. Loans, together with the associated allowance accounts, are written off when there is no realistic prospect of future recovery and all collateral has been realized. If, in a subsequent year, the amount of the estimated impairment loss decreases because of an event occurring after the impairment was recognized, the previously recognized impairment loss is reduced by adjusting the allowance account. If a future write-off is later recovered, any amounts formerly charged are credited to the ‘Provision for impairment and credit losses’ account.
The present value of the estimated future cash flows is discounted at the financial asset’s original effective interest rate. If a loan has a variable interest rate, the discount rate for measuring any impairment loss is the current effective interest rate, adjusted for the original credit risk premium. The calculation of the present value of the estimated future cash flows of a collateralized financial asset reflects the cash flows that may result from foreclosure less costs for obtaining and selling the collateral, whether or not foreclosure is probable.
For the purpose of a collective evaluation of impairment, financial assets are grouped on the basis of such credit risk characteristics as industry, collateral type, past-due status and term.
Future cash flows in a group of financial assets that are collectively evaluated for impairment are estimated on the basis of historical loss experience for assets with credit risk characteristics similar to those in the Group. Historical loss experience is adjusted on the basis of current observable data to reflect the effects of current conditions that did not affect the period on which the historical loss experience is based and to remove the effects of conditions in the historical period that do not exist currently. Estimates of changes in future cash flows reflect, and are directionally consistent with changes in related observable data from period to period (such changes in property prices, payment status, or other factors that are indicative of incurred losses in the Group and their magnitude). The methodology and assumptions used for estimating future cash flows are reviewed regularly by the Group to reduce any differences between loss estimates and actual loss experience.

NOTES TO FINANCIAL STATEMENTS
46 | Building for the Future
HTM investmentsFor HTM investments, the Group assesses whether there is objective evidence of impairment. If there is objective evidence that an impairment loss has been incurred using the original effective interest rate of the investment, the amount of the loss is measured as the difference between the asset’s carrying amount and the present value of estimated future cash flows (excluding future expected credit losses that have not yet been incurred). The carrying amount of the asset is reduced through use of an allowance account and the amount of loss is charged to the statement of income. Interest income continues to be recognized based on the original effective interest rate of the asset.
If, in a subsequent year, the amount of the estimated impairment loss decreases because of an event occurring after the impairment was recognized, any amounts formerly charged are credited to ‘Provisions for impairment and credit losses’ account in the statement of income and the allowance account, reduced. The HTM investments, together with the associated allowance accounts, are written off when there is no realistic prospect of future recovery and all collateral has been realized.
AFS investmentsFor AFS investments, the Group assesses at each statement of condition date whether there is objective evidence that a financial asset or group of financial assets is impaired.
In case of equity investments classified as AFS investments, this would include a significant or prolonged decline in the fair value of the investments below its cost. Where there is evidence of impairment, the cumulative loss - measured as the difference between the acquisition cost and the current fair value, less any impairment loss on that financial asset previously recognized in the statement of income - is removed from equity and recognized in the statement of income. Impairment losses on equity investments are not reversed through the statement of income. Increases in fair value after impairment are recognized directly in equity.
In the case of debt instruments classified as AFS investments, impairment is assessed based on the same criteria as financial assets carried at amortized cost. Interest continues to be accrued at the original effective interest rate on the reduced carrying amount of the asset and is recorded as part of Interest income in the statement of income. If, in subsequent year, the fair value of a debt instrument increases and the increase can be objectively related to an event occurring after the impairment loss was recognized in the statement of income, the impairment loss is reversed through the statement of income.
Restructured loansWhere possible, the Group seeks to restructure loans rather than to take possession of collateral. This may involve extending the payment arrangements and the agreement of new loan conditions. Once the terms have been renegotiated, the loan is no longer considered past due. Management continuously reviews restructured loans to ensure that all criteria are met and that future payments are likely to occur. The loans continue to be subject to an individual or collective impairment assessment, calculated using the loan’s original effective interest rate. The difference between the recorded value of the original loan and the present value of the restructured cash flows, discounted at the original effective interest rate, is recognized in ‘Provisions for impairment and credit losses’ in the statement of income.
Offsetting Financial InstrumentsFinancial assets and financial liabilities are offset and the net amount reported in the statement of condition if, and only if, there is a currently enforceable legal right to offset the recognized amounts and there is an intention to settle on a net basis, or to realize the asset and settle the liability simultaneously. This is not generally the case with master netting agreements, and the related assets and liabilities are presented gross in the statement of condition.
Terminal Value of Leased Assets and Deposits on Finance LeasesThe terminal value of a leased asset, which approximates the amount of guaranty deposit paid by the lessee at the inception of the lease, is the estimated proceeds from the sale of the leased asset at the end of the lease term. At the end of the lease term, the terminal value of the leased asset is generally applied against the guaranty deposit of the lessee when the lessee decides to buy the leased asset.

NOTES TO FINANCIAL STATEMENTS
2006 Equitable PCI Bank Annual Report | 47
Revenue RecognitionRevenue is recognized to the extent that it is probable that economic benefits will flow to the Group and the revenue can be reliably measured. The following specific recognition criteria must also be met before revenue is recognized:
Interest income For all financial instruments measured at amortized cost and interest bearing financial instruments classified as AFS
investments, interest income is recorded at the effective interest rate, which is the rate that exactly discounts estimated future cash payments or receipts through the expected life of the financial instrument or a shorter period, where appropriate, to the net carrying amount of the financial asset or financial liability. The calculation takes into account all contractual terms of the financial instrument (for example, prepayment options), including any fees or incremental costs that are directly attributable to the instrument and are an integral part of the effective interest rate, but not future credit losses. The adjusted carrying amount is calculated based on the original effective interest rate. The change in carrying amount is recorded as interest income.
Once the recorded value of a financial asset or group of similar financial assets has been reduced due to an impairment loss, interest income continues to be recognized based on the effective interest rate used to discount the future recoverable cash flows.
Fee and commission incomeThe Group earns fee and commission income from diverse range of services it provides to its customers. Fee income can be divided into the following two categories:
a. Fee income earned from services that are provided over a certain period of time
Fees earned for the provision of services over a period of time are accrued over that period. These fees include investment fund fees, custodian fees, fiduciary fees, commission income, credit related fees, asset management fees, portfolio and other management fees, and advisory fees. However, loan commitment fees for loans that are likely to be drawn down are deferred (together with any incremental costs) and recognized as an adjustment to the effective interest rate on the loan.
b. Fee income from providing transaction services
Fees arising from negotiating or participating in the negotiation of a transaction for a third party - such as underwriting fees, corporate finance fees, and brokerage fees for the arrangement of the acquisition of shares or other securities or the purchase or sale of businesses - are recognized on completion of the underlying transaction. Fees or components of fees that are linked to a certain performance are recognized after fulfilling the corresponding criteria. Loan syndication fees are recognized in the statement of income when the syndication has been completed and the Group retains no part of the loans for itself or retains part at the same effective interest rate as for the other participants.
DividendsDividend income is recognized when the Group’s right to receive payment is established.
Trading gains - netResults arising from trading activities including all gains and losses from changes in fair value for financial assets and financial liabilities held for trading.
Rental IncomeRental income arising from leased properties is accounted for on a straight-line basis over the lease terms on ongoing leases and is recorded in the statement of income under ‘Other operating income’.
Commissions earned on credit cards Commissions earned on credit cards are taken up as income upon receipt from member establishments of charges arising
from credit availments by credit cardholders. These commissions are computed based on certain agreed rates and are deducted from amounts remittable to member establishments.
NOTES TO FINANCIAL STATEMENTS
48 | Building for the Future
Purchases by the credit cardholders, collectible on installments basis, are recorded at the cost of the items purchased plus certain percentage of cost. The excess over cost is credited to ‘Unearned discount’ and is shown as a deduction from ‘Loans and receivables’ in the consolidated statement of condition. The unearned discount is taken up to income over the installment terms and is computed using the effective interest method.
Income on direct financing leases and receivables financed Income on loans and receivables financed with short-term maturities is recognized using the effective interest method.
Interest and finance fees on finance leases and loans and receivables financed with long-term maturities and the excess of the aggregate lease rentals plus the estimated terminal value of the leased equipment over its cost are credited to unearned discount and amortized over the term of the note or lease using the effective interest rate method. Unearned income ceases to be amortized when receivables become past due.
Cash and Cash Equivalents For purposes of reporting cash flows, cash and cash equivalents include cash and other cash items, amounts due from BSP
and other banks, and interbank loans receivable (IBLR) and SPURA (Note 31) with original maturities of three months or less from dates of placements and that are subject to insignificant risk of changes in value.
Receivables from Special Purpose VehiclesReceivables from SPVs in the Parent Company financial statements included under ‘Other Assets’ are stated at the face value of the related note reduced by allowance for credit losses. The allowance for credit losses is determined based on the difference between the outstanding principal amount and the recoverable amount which is the present value of the future cash flows expected to be received in payment of the receivable.
Investments in Subsidiaries and AssociatesInvestments in subsidiaries
Subsidiaries pertain to all entities over which the Group has the power to govern the financial and operating policies generally accompanying a shareholding of more than one half of the voting rights. The existence and effect of potential voting rights that are currently exercisable or convertible are considered when assessing whether the Group controls another entity.
Investments in associatesAssociates pertain to all entities over which the Group has significant influence but not control, generally accompanying a shareholding of between 20% and 50% of the voting rights. Investments in associates are accounted for under the equity method of accounting in the consolidated financial statements. The Group’s share of its associates’ post-acquisition profits or losses is recognized in the consolidated statement of income, and its share of post-acquisition movements in the associates’ equity is recognized directly in equity. The cumulative post-acquisition movements are adjusted against the carrying amount of the investment. When the Group’s share of losses in an associate equals or exceeds its interest in the associate, including any other unsecured receivables, the Group does not recognize further losses, unless it has incurred obligations or made payments on behalf of the associate.
In the Parent Company financial statements, investments in subsidiaries and associates are carried at cost, less impairment in value.
Property and Equipment Depreciable properties including buildings, leasehold improvements, and furniture, fixtures and equipment are stated at
cost less accumulated depreciation and amortization, and any impairment in value. Such cost includes the cost of replacing part of the property and equipment when the cost is incurred, if the recognition criteria are met but excludes repairs and maintenance costs.

NOTES TO FINANCIAL STATEMENTS
2006 Equitable PCI Bank Annual Report | 49
Land is stated at appraised value less any impairment in value. The appraised values were determined by professionally qualified, independent appraisers in 2002 for the Parent Company and 2004 for the subsidiaries. The Parent Company is currently undergoing appraisal of land items. The revaluation increment resulting from revaluation of land is credited to ‘Revaluation increment on property’ under the equity section, net of applicable deferred income tax.
Depreciation is calculated on the straight-line method over the estimated useful life of the depreciable assets. The estimated useful lives of the depreciable assets are as follows:
Buildings 50 yearsFurniture, fixtures and equipment 3-5 yearsLeasehold improvements 3-5 years or the terms of the related leases, whichever is shorter
The depreciation and amortization method and useful life are reviewed periodically to ensure that the method and period of depreciation and amortization are consistent with the expected pattern of economic benefits from items of property and equipment.
An item of property and equipment is derecognized upon disposal or when no future economic benefits are expected from its use or disposal. Any gain or loss arising on derecognition of the asset (calculated as the difference between the net disposal proceeds and the carrying amount of the asset) is included in the statement of income in the year the asset is derecognized.
Investment PropertiesInvestment properties are measured initially at cost, including transaction costs. An investment property acquired through an exchange transaction is measured at fair value of the asset acquired unless the fair value of such an asset cannot be measured in which case the investment property acquired is measured at the carrying amount of asset given up. Foreclosed properties are classified under investment properties from foreclosure date.
Subsequent to initial recognition, depreciable investment properties are carried at cost less accumulated depreciation and impairment in value.
Investment properties are derecognized when they have either been disposed of or when the investment property is permanently withdrawn from use and no future benefit is expected from its disposal. Any gains or losses on the retirement or disposal of an investment property are recognized in the statement of income in ‘Other operating income’ in the year of retirement or disposal.
Expenditures incurred after the investment properties has been put into operations, such as repairs and maintenance costs, are normally charged to income in the period in which the costs are incurred.
Depreciation is calculated on a straight-line basis using the remaining useful lives from the time of acquisition of the investment properties but not to exceed:
Buildings 50 yearsCondominium units 40 years
Transfers are made to investment properties when, and only when, there is a change in use as evidenced by ending of owner occupation, commencement of an operating lease to another party or ending of construction or development. Transfers are made from investment properties when, and only when, there is a change in use as evidenced by commencement of owner occupation or commencement of development with a view to sale.
Real Estate Properties Real estate properties included under Other assets are stated at lower of cost and net realizable value.

NOTES TO FINANCIAL STATEMENTS
50 | Building for the Future
Intangible Assets and GoodwillExchange Trading Rights
Exchange trading rights (included in the consolidated other investments under Other Assets) was acquired, together with Philippine Stock Exchange (PSE) shares, in exchange for the exchange membership seat under the conversion program of the PSE. The exchange trading rights are carried at the amount allocated from the original cost of the exchange membership seat (after a corresponding allocation was made to the value of the PSE shares) less any allowance for impairment loss. PCIB Securities and ASI do not intend to sell their respective exchange trading right in the near future.
The exchange trading right is deemed to have an indefinite useful life as there is no foreseeable limit to the period over which the asset is expected to generate net cash inflows for the Group. It ceased to be amortized on January 1, 2004 but will be tested annually for any impairment in realizable value. Any impairment loss is charged directly to statement of income (see accounting policy on Impairment of Non-Financial Assets).
GoodwillAny excess of the cost of acquisition over the fair values of the identifiable net assets acquired is recognized as goodwill. Goodwill represents the excess of the acquisition cost of the former PCI Bank, which was merged with the Parent Company in 1999, over the fair value of its identifiable net assets at the date of acquisition. Following initial recognition, goodwill is measured at cost less any accumulated impairment losses. Goodwill is reviewed for impairment annually (see accounting policy on Impairment of Non-Financial Assets).
Impairment of Non-Financial Assets At each reporting date, the Group assesses whether there is any indication that its non-financial assets may be impaired. When an indicator of impairment exists or when an annual impairment testing for an asset is required, the Group makes a formal estimate of recoverable amount. Recoverable amount is the higher of an asset’s (or cash-generating unit’s) fair value less costs to sell and its value in use and is determined for an individual asset, unless the asset does not generate cash inflows that are largely independent of those from other assets or groups of assets, in which case the recoverable amount is assessed as part of the cash generating unit to which it belongs. Where the carrying amount of an asset (or cash generating unit) exceeds its recoverable amount, the asset (or cash generating unit) is considered impaired and is written down to its recoverable amount. In assessing value in use, the estimated future cash flows are discounted to their present value using a pre-tax discount rate that reflects current market assessments of the time value of money and the risks specific to the asset (or cash generating unit).
An impairment loss is charged to operations in the year in which it arises, unless the asset is carried at a revalued amount, in which case the impairment loss is charged to the revaluation increment of the said asset.
For non-financial assets excluding goodwill, an assessment is made at each reporting date as to whether there is any indication that previously recognized impairment losses may no longer exist or may have decreased. If such indication exists, the recoverable amount is estimated. A previously recognized impairment loss is reversed only if there has been a change in the estimates used to determine the asset’s recoverable amount since the last impairment loss was recognized. If that is the case, the carrying amount of the asset is increased to its recoverable amount. That increased amount cannot exceed the carrying amount that would have been determined, net of depreciation, had no impairment loss been recognized for the asset in prior years. Such reversal is recognized in the statement of income unless the asset is carried at a revalued amount, in which case the reversal is treated as a revaluation increase. After such a reversal, the depreciation expense is adjusted in future years to allocate the asset’s revised carrying amount, less any residual value, on a systematic basis over its remaining life.
The following criteria are also applied in assessing impairment of specific assets:
GoodwillGoodwill is reviewed for impairment, annually or more frequently if events or changes in circumstances indicate that the carrying value may be impaired.

NOTES TO FINANCIAL STATEMENTS
2006 Equitable PCI Bank Annual Report | 51
Impairment is determined for goodwill by assessing the recoverable amount of the cash-generating unit (or group of cash-generating units) to which the goodwill relates. Goodwill sometimes cannot be allocated on a non-arbitrary basis to individual cash-operating units, but only to the groups of cash-generating units. As a result, the lowest level within the Parent Company at which the goodwill is monitored for internal management purposes sometimes comprises a number of cash-generating units to which the goodwill relates but cannot be allocated. Where the recoverable amount of the cash-generating unit (or group of cash-generating units) is less than the carrying amount of the cash-generating unit (or group of cash-generating units) to which goodwill has been allocated (or to the aggregate carrying amount of a group of cash-generating units to which the goodwill relates but cannot be allocated), an impairment loss is recognized immediately in the statement of income. Impairment losses relating to goodwill cannot be reversed for subsequent increases in its recoverable amount in future periods. The Group performs its annual impairment test of goodwill as at December 31.
Intangible assetsIntangible assets with indefinite useful lives are tested for impairment annually as of December 31 either individually or at the cash-generating unit level, as appropriate.
Intangible assets with finite lives are assessed for impairment whenever there is an indication that the intangible asset may be impaired.
Leases The determination of whether an arrangement is, or contains a lease is based on the substance of the arrangement and
requires an assessment of whether the fulfillment of the arrangement is dependent on the use of a specific asset or assets and the arrangement conveys a right to use the asset. A reassessment is made after inception of the lease only if one of the following applies:
a. There is a change in contractual terms, other than a renewal or extension of the arrangement;b. A renewal option is exercised or extension granted, unless that term of the renewal or extension was initially included
in the lease term;c. There is a change in the determination of whether fulfillment is dependent on a specified asset; or,d. There is a substantial change to the asset.
Where a reassessment is made, lease accounting shall commence or cease from the date when the change in circumstances gave rise to the reassessment for scenarios (a), (c), or (d) above; and at the date of renewal or extension period for scenario (b).
For arrangements entered into prior to January, 1, 2005, the date of inception is deemed to be January 1, 2005 in accordance with the transitional requirements of Philippine Interpretation IFRIC-4.
Group as LesseeFinance leases, which transfer to the Group substantially all the risks and benefits incidental to ownership of the leased item, are capitalized at the inception of the lease at the fair value of the leased property or, if lower, at the present value of the minimum lease payments and included in Property and equipment account with the corresponding liability to the lessor included in Other liabilities account. Lease payments are apportioned between the finance charges and reduction of the lease liability so as to achieve a constant rate of interest on the remaining balance of the liability. Finance charges are charged directly to ‘Interest expense’.
Capitalized leased assets are depreciated over the shorter of the estimated useful lives of the assets or the respective lease terms, if there is no reasonable certainty that the Group will obtain ownership by the end of the lease term.
Leases where the lessor retains substantially all the risks and benefits of ownership of the asset are classified as operating leases. Operating lease payments are recognized as an expense in the statement of income on a straight-line basis over the lease term.

NOTES TO FINANCIAL STATEMENTS
52 | Building for the Future
Group as LessorFinance leases, where the Group transfers substantially all the risk and benefits incidental to ownership of the leased item to the lessee, are included in the statement of condition under Loans and Receivables account. A lease receivable is recognized at an amount equivalent to the net investment (asset cost) in the lease. All income resulting from the receivable is included in ‘Interest income’ in the statement of income.
Leases where the Group does not transfer substantially all the risks and benefits of ownership of the assets are classified as operating leases. Initial direct costs incurred in negotiating operating leases are added to the carrying amount of the leased asset and are recognized over the lease term on the same basis as the rental income. Contingent rents are recognized as revenue in the period in which they are earned.
Pension BenefitsThe Group is covered by a noncontributory defined benefit retirement plan.
The retirement cost of the Parent Company and its subsidiaries namely ECN, EBCII, ESB, EDCI, PCI Capital, EIBI, PCI Leasing, PCIB Securities and PCI Automation is determined using the projected unit credit method. Under this method, the current service cost is the present value of retirement benefits payable in the future with respect to services rendered in the current period.
The liability recognized in the statement of condition in respect of defined benefit pension plans (see Note 20) is the present value of the defined benefit obligation at the statement of condition date less the fair value of plan assets, together with adjustments for unrecognized actuarial gains or losses and past service costs. The defined benefit obligation is calculated annually by an independent actuary using the projected unit credit method. The present value of the defined benefit obligation is determined by discounting the estimated future cash outflows using interest rate on government bonds that have terms to maturity approximating the terms of the related retirement liability. Actuarial gains and losses arising from experience adjustments and changes in actuarial assumptions are credited to or charged against income when the net cumulative unrecognized actuarial gains and losses at the end of the previous period exceeded 10% of the higher of the defined benefit obligation and the fair value of plan assets at that date. These excess gains or losses are recognized over the expected average remaining working lives of the employees participating in the plan.
Past service costs, if any, are recognized immediately in income, unless the changes to the pension plan are conditional on the employees remaining in service for a specified period of time (the vesting period). In this case, the past service costs are amortized on a straight-line basis over the vesting period.
The defined benefit asset or liability comprises the present value of the defined benefit obligation less past service costs not yet recognized and less the fair value of plan assets out of which the obligations are to be settled directly. The value of any asset is restricted to the sum of any past service cost not yet recognized and the present value of any economic benefits available in the form of refunds from the plan or reductions in the future contributions to the plan.
Most of the officers and staff of EPHK, ESHC, JEFC and PCIB Properties are seconded from the Parent Company. Accordingly, the retirement benefits of these officers and employees are determined and provided for by the Parent Company and are charged against income for the period.
Provisions Provisions are recognized when the Group has a present obligation (legal or constructive) as a result of a past event and
it is probable that an outflow of resources embodying economic benefits will be required to settle the obligation and a reliable estimate can be made of the amount of the obligation. Where the Group expects some or all of a provision to be reimbursed, for example, under an insurance contract, the reimbursement is recognized as a separate asset but only when the reimbursement is virtually certain. The expense relating to any provision is presented in the statement of income, net of any reimbursement. If the effect of the time value of money is material, provisions are determined by discounting the expected future cash flows at a pre-tax rate that reflects current market assessments of the time value of money and, where appropriate, the risks specific to the liability. Where discounting is used, the increase in the provision due to the passage of time is recognized as an interest expense.

NOTES TO FINANCIAL STATEMENTS
2006 Equitable PCI Bank Annual Report | 53
Contingent liabilities and contingent assetsContingent liabilities are not recognized in the financial statements but are disclosed unless the possibility of an outflow of resources embodying economic benefits is remote. Contingent assets are not recognized but are disclosed in the financial statements when an inflow of economic benefits is probable.
Income TaxesDeferred tax is provided, using the balance sheet liability method, on all temporary differences at the statement of condition date between the tax bases of assets and liabilities and their carrying amounts for financial reporting purposes.
Deferred tax liabilities are recognized for all taxable temporary differences, including asset revaluations. Deferred tax assets are recognized for all deductible temporary differences, carry forward of unused tax credits from the excess of minimum corporate income tax (MCIT) over the regular income tax, and unused net operating loss carryover (NOLCO), to the extent that it is probable that sufficient taxable profit will be available against which the deductible temporary differences and carry forward of unused tax credits from MCIT and unused NOLCO can be utilized. Deferred income tax, however, is not recognized on temporary differences that arise from the initial recognition of an asset or liability in a transaction that is not a business combination and, at the time of the transaction, affects neither the accounting income nor taxable income.
Deferred tax liabilities are not provided on non-taxable temporary differences associated with investments in domestic subsidiaries and associates. With respect to investments in foreign subsidiaries and associates, deferred tax liabilities are recognized except where the timing of the reversal of the temporary difference can be controlled and it is probable that the temporary difference will not reverse in the foreseeable future.
The carrying amount of deferred tax assets is reviewed at each statement of condition date and reduced to the extent that it is no longer probable that sufficient taxable profit will be available to allow all or part of the deferred income tax asset to be utilized. Unrecognized deferred tax assets are reassessed at each statement of condition date and are recognized to the extent that it has become probable that future taxable profit will allow the deferred tax asset to be recovered.
Deferred tax assets and liabilities are measured at the tax rates that are applicable to the period when the asset is realized or the liability is settled, based on tax rates (and tax laws) that have been enacted or substantively enacted at the statement of condition date.
Current tax and deferred tax relating to items recognized directly in equity is also recognized in equity and not in the statement of income.
Deferred tax assets and deferred tax liabilities are offset if a legally enforceable right exists to set off current tax assets against current tax liabilities and deferred taxes related to the same taxable entity and the same taxation authority.
Treasury shares and contracts on own shares Own equity instruments which are acquired (treasury shares) are deducted from equity and accounted for at weighted
average cost. Parent Company share held by a subsidiary is treated to similar treasury shares in the consolidated financial statements. No gain or loss is recognized in the statement of income on the purchase, sale, issue or cancellation of the Parent Company’s own equity instruments.
Earnings Per ShareBasic earnings per share (EPS) is computed by dividing net income for the year by the weighted average number of common shares outstanding during the year after giving retroactive effect to stock dividends declared and stock rights exercised during the year, if any. The Group does not have any dilutive potential common shares.
Dividends on common sharesDividends on common shares are recognized as a liability and deducted from equity when approved by the shareholders of the Parent Company. Dividends for the year that are approved after the statement of condition date are dealt with as an event after the statement of condition date.

NOTES TO FINANCIAL STATEMENTS
54 | Building for the Future
Subsequent EventsAny post-year-end event that provides additional information about the Group’s position at the statement of condition date (adjusting event) is reflected in the financial statements. Post-year-end events that are not adjusting events, if any, are disclosed when material to the financial statements.
Segment Reporting The Group’s operating businesses are organized and managed separately according to the nature of the products and
services provided, with each segment representing a strategic business unit that offers different products and serves different markets. Financial information on business segments is presented in Note 26. Substantial of the Group’s assets producing revenues are located in the Philippines (i.e., one geographical location). Therefore, geographical segment information is no longer presented.
Fiduciary Activities Assets and income arising from fiduciary activities together with related undertakings to return such assets to customers
are excluded from the financial statements where the Parent Company acts in a fiduciary capacity such as nominee, trustee or agent.
Future Changes in Accounting Policies The Group has not applied the following PFRS and Philippine Interpretations which are not yet effective for the year ended December 31, 2006:
PFRS 7, Financial Instruments: Disclosures, and the complementary amendment to PAS 1, Presentation of Financial Statements: Capital Disclosures (effective for annual periods beginning on or after January 1, 2007)PFRS 7 introduces new disclosures to improve the information about financial instruments. It requires the disclosure of qualitative and quantitative information about exposure to risks arising from financial instruments, including specified minimum disclosures about credit risk, liquidity risk and market risk, as well as sensitivity analysis to market risk. It replaces PAS 30, Disclosures in the Financial Statements of Banks and Similar Financial Institutions, and the disclosure requirements in PAS 32, Financial Instruments: Disclosure and Presentation. It is applicable to all entities that report under PFRS. The amendment to PAS 1 introduces disclosures about the level of an entity’s capital and how it manages capital. The Group is currently assessing the impact of PFRS 7 and the amendment to PAS 1 and expects that the main additional disclosures will be the sensitivity analysis to market risk and the capital disclosures required by PFRS 7 and the amendment to PAS 1. The Group will apply PFRS 7 and the amendment to PAS 1 in 2007.
PFRS 8, Operating Segments (effective for annual periods beginning on or after January 1, 2009)This PFRS adopts a management approach to reporting segment information. The information reported would be that which management uses internally for evaluating the performance of operating segments and allocating resources to those segments. Such information may be different from that reported in the statement of condition and statement of income and companies will need to provide explanations and reconciliations of the differences. PFRS 8 will replace PAS 14, Segment Reporting. The Group will assess the impact of the standard on its current manner of reporting segment information.
Philippine Interpretation IFRIC-7, Applying the Restatement Approach under PAS 29, Financial Reporting in Hyperinflationary Economies (effective for annual periods beginning on or after March 1, 2006)This Interpretation provides guidance on how to apply PAS 29 when an economy first becomes hyperinflationary, in particular the accounting for deferred income tax. The Interpretation has no significant impact on the financial statements of the Group.
Philippine Interpretation IFRIC-8, Scope PFRS 2 (effective for annual periods beginning on or after May 1, 2006)This Interpretation requires PFRS 2 to be applied to any arrangements where equity instruments are issued for consideration which appears to be less than fair value. As equity instruments are only issued to employees in accordance with the employee share scheme, the Interpretation has no significant impact on the financial position of the Group.
NOTES TO FINANCIAL STATEMENTS
2006 Equitable PCI Bank Annual Report | 55
Philippine Interpretation IFRIC-10, Interim Financial Reporting and Impairment (effective for annual periods beginning on or after November 1, 2006)This Interpretation prohibits the reversal of impairment losses on goodwill and AFS equity investments recognized in the interim financial reports even if impairment is no longer present at the annual statement of condition date. This Interpretation has no significant impact on the financial statements of the Group.
Philippine Interpretation IFRIC-11, PFRS 2 Group and Treasury Share Transactions (effective for annual periods beginning on or after March 1, 2007)This Interpretation requires arrangements whereby an employee is granted rights to an entity’s equity instruments to be accounted for as an equity-settled scheme by the entity even if (a) the entity chooses or is required to buy those equity instruments (e.g., treasury shares) from another party, or (b) the shareholder(s) of the entity provide the equity instruments needed. It also provides guidance on how subsidiaries, in their separate financial statements, account for such schemes when their employees receive rights to the equity instruments of the parent. The Group currently does not have any stock option plan and therefore, does not expect this Interpretation to have significant impact on its financial statements.
Philippine Interpretation IFRIC-12, Service Concession Arrangements (effective for annual periods beginning on or after January 1, 2008)This Interpretation covers contractual arrangements arising from private entities providing public services and is not relevant to the Group’s current operations.
3. Significant Accounting Judgments and Estimates
The preparation of the financial statements in accordance with PFRS requires the Group to make estimates and assumptions that affect the reported amounts of assets, liabilities, income and expenses and disclosure of contingent assets and contingent liabilities. Future events may occur which will cause the assumptions used in arriving at the estimates to change. The effects of any change in estimates are reflected in the financial statements as they become reasonably determinable.
Judgments and estimates are continually evaluated and are based on historical experience and other factors, including expectations of future events that are believed to be reasonable under the circumstances.
Judgmentsa) Operating leases
The Group has entered into commercial property leases on its investment property portfolio. The Group has determined that it retains all the significant risks and rewards of ownership of these properties which are leased out on operating leases.
b) SPEsThe Group sponsors the formation of SPEs primarily for the purpose of allowing clients to hold investments and for asset securitization transactions. The Group consolidates SPEs that it controls. Control over SPEs is assessed based on benefits test in accordance with SIC 12. As it can sometimes be difficult to determine whether the Group does control an SPE, it makes judgments about its exposure to the risks and rewards, as well as about its ability to make operational decisions for the SPE in question. In many instances, elements are present that, considered in isolation, indicate control or lack of control over an SPE, but when considered together make it difficult to reach a clear conclusion. In such cases, the SPE is consolidated.
c) Fair value of financial instrumentsWhere the fair values of financial assets and financial liabilities recorded in the statement of condition cannot be derived from active markets, they are determined using internal valuation techniques using generally accepted market valuation models. The inputs to these models are taken from observable markets where possible, but where this is not feasible, estimates are used in establishing fair values. These estimates may include considerations of liquidity, volatility, and correlation.

NOTES TO FINANCIAL STATEMENTS
56 | Building for the Future
d) HTM investmentsThe classification under HTM investments requires significant judgment. In making this judgment, the Group evaluates its intention and ability to hold such investments to maturity. If the Group fails to keep these investments to maturity other than in certain specific circumstances - for example, selling an insignificant amount close to maturity - it will be required to reclassify the entire portfolio as AFS investments. The investments would therefore be measured at fair value and not at amortized cost.
e) Financial assets not quoted in an active marketThe Group classifies financial assets by evaluating, among others, whether the asset is quoted or not in an active market. Included in the evaluation on whether a financial asset is quoted in an active market is the determination on whether quoted prices are readily and regularly available, and whether those prices represent actual and regularly occurring market transactions on an arm’s length basis.
Estimatesa) Impairment losses of loans and receivables
The Group reviews its impaired loans and receivables at each reporting date to assess whether additional provision for credit losses should be recorded in the statement of income. In particular, judgment by management is required in the estimation of the amount and timing of future cash flows when determining the level of allowance required. Such estimates are based on assumptions about a number of factors and actual results may differ, resulting in future changes to the allowance.
In addition to specific allowance against individually significant loans and receivables, the Group also makes a collective impairment allowance against exposures which, although not specifically identified as requiring a specific allowance, have a greater risk of default than when originally granted. This collective allowance is based on changes in factors that are indicative of incurred losses, such as deterioration in payment status, underlying property prices, among others.
As of December 31, 2006 and 2005 allowance for credit losses on loans and receivables amounted to P11.5 billion and P11.4 billion, respectively, for the Group, and P9.6 billion and P9.0 billion, respectively, for the Parent Company. As of December 31, 2006 and 2005, loans and receivables are carried at P161.4 billion and P140.2 billion, respectively, for the Group and P140.9 billion and P132.6 billion, respectively, for the Parent Company (see Note 8).
b) Fair values of structured debt instruments and derivativesThe fair values of structured debt instruments and derivatives that are not quoted in active markets are determined using internal valuation techniques. Where internal valuation techniques are used to determine fair values, they are validated and periodically reviewed by market risk management and other qualified personnel independent of the business. All models are reviewed before they are used, and models are calibrated to ensure that outputs reflect actual data and comparative market prices. To the extent practical, models use observable data; however for models requiring inputs on other market factors, management uses estimates. Changes in assumptions about these factors could affect reported fair value of financial instruments. Refer to Notes 4 and 29 for the information on the carrying amounts of these instruments.
c) Valuation of unquoted equity investmentsValuation of unquoted equity investments is normally based on one of the following:
• recent arm’s length market transactions;• current fair value of another instrument that is substantially the same;• the expected cash flows discounted at current rates applicable for items with similar terms and risk characteristics;
or• other valuation models.

NOTES TO FINANCIAL STATEMENTS
2006 Equitable PCI Bank Annual Report | 57
The determination of the cash flows and discount factors for unquoted equity investments requires significant estimation. The Group calibrates the valuation techniques periodically and tests them for validity using either price from observable current market transactions in the same instrument or from other available observable market data. Refer to Note 7 for the information on the carrying amounts of these investments.
d) Impairment of AFS equity investmentsThe Group treats AFS equity investments as impaired when there has been a significant or prolonged decline in the fair value below its cost or where other objective evidence of impairment exists. The determination of what is ‘significant’ or ‘prolonged’ requires judgment. The Group treats ‘significant’ generally as 20% or more and ‘prolonged’ as greater than 6 months for quoted equity securities. In addition, the Group evaluates other factors, including normal volatility in share price for quoted equities and the future cash flows and the discount factors for unquoted equities.
Refer to Note 7 for the information on the carrying amounts of these investments.
(e) Recognition of deferred income taxesDeferred tax assets are recognized for all unused tax losses to the extent that it is probable that taxable profit will be available against which the losses can be utilized. Significant management judgment is required to determine the amount of deferred tax assets that can be recognized, based upon the likely timing and level of future taxable profits together with future tax planning strategies.
The Group has been in a tax loss position over the past several years. However, estimates of future taxable income indicate that certain temporary differences will be realized in the future. As discussed in Note 24, recognized deferred tax assets as of December 31, 2006 and 2005 amounted to P5.3 billion and P5.8 billion, respectively, for the Group and P5.0 billion and P5.4 billion, respectively, for the Parent Company. As of December 31, 2006 and 2005, no deferred tax assets have been set up on deductible temporary differences amounting to P8.8 billion and P3.2 billion, respectively, for the Group and P6.3 billion and P2.6 billion, respectively, for the Parent Company.
(f) Present value of retirement obligationThe cost of defined benefit pension plan and other post-employment benefits is determined using actuarial valuations. The actuarial valuation involves making assumptions about discount rates, expected rates of return on assets, future salary increases, mortality rates and future pension increases. Due to the long term nature of these plans, such estimates are subject to significant uncertainty.
The expected rate of return on plan assets of 9.0% as of December 31, 2006 and 2005 was based on the average historical return of the fund assets. The assumed discount rates were determined using the market yields on Philippine government bonds with terms consistent with the expected employee benefit payout as of statement of condition date. Refer to Note 20 for the details of assumption used in the calculation.
As of December 31, 2006 and 2005, the present value of the retirement obligation amounted to P3.4 billion and P1.7 billion, respectively, for the Group and P3.1 billion and P1.5 billion, respectively for the Parent Company (see Note 20).
(g) Impairment of non-financial assetsProperty and Equipment and Investment PropertiesThe Group assesses impairment on assets whenever events or changes in circumstances indicate that the carrying amount of an asset may not be recoverable. The factors that the Group considers important which could trigger an impairment review include the following:
• significant underperformance relative to expected historical or projected future operating results;• significant changes in the manner of use of the acquired assets or the strategy for overall business; and• significant negative industry or economic trends.
The Group recognizes an impairment loss whenever the carrying amount of an asset exceeds its recoverable amount. The recoverable amount is computed using the value in use approach. Recoverable amounts are estimated for individual assets or, if it is not possible, for the cash-generating unit to which the asset belongs.

NOTES TO FINANCIAL STATEMENTS
58 | Building for the Future
As of December 31, 2006, the carrying value of the property and equipment and investment properties amounted to P9.5 billion and P17.9 billion, respectively, for the Group and P8.8 billion and P15.2 billion, respectively, for the Parent Company. As of December 31, 2005, the carrying value of the property and equipment and investment properties amounted to P9.8 billion and P18.4 billion, respectively, for the Group and P9.1 billion and P15.9 billion, respectively, for the Parent Company (see Notes 9 and 11).
GoodwillThe Parent Company’s management conducts an annual review for any impairment in value of the goodwill. The impairment on the goodwill is determined by comparing (a) the carrying value of goodwill plus the net tangible assets of the merged bank and (b) the company value composed of the present value of the annual projected cash flows for five years and the present value of the terminal value of the merged bank computed under the discounted cash flow method. The Bank uses the Weighted Average Cost of Capital (WACC) as the discount rate, as this is the required rate of return for an investment consisting of more than one form of capital (debt and equity).
As of December 31, 2006 and 2005, goodwill amounted to P15.7 billion.
4. Fair Value Measurement
The methods and assumptions used by the Group in estimating the fair value of the financial instruments are:
Cash equivalents and short-term investments - Carrying amounts approximate fair values due to the relatively short-term maturities of these investments.
Debt securities - Fair values are generally based upon quoted market prices. If the market prices are not readily available, fair values are estimated using either values obtained from independent parties offering pricing services or adjusted quoted market prices of comparable investments or using the discounted cash flow methodology.
Quoted equity securities - Fair values are based on quoted prices published in markets.
Unquoted equity securities - Fair values could not be reliably determined due to the unpredictable nature of future cash flows and the lack of suitable methods of arriving at a reliable fair value.
Loans and receivables - Fair values of loans are estimated using the discounted cash flow methodology, using the Group’s current incremental lending rates for similar types of loans.
Liabilities - The fair value of quoted debt instruments are based on quotes obtained from an independent pricing service. For unquoted instruments, fair values are estimated using the discounted cash flow methodology using the Group’s current incremental borrowing rates for similar borrowings with maturities consistent with those remaining for the liability being valued.
Derivative instruments - Fair values are estimated based on quoted market prices, prices provided by independent parties or acceptable valuation models.

NOTES TO FINANCIAL STATEMENTS
2006 Equitable PCI Bank Annual Report | 59
The following tables summarize the carrying amounts and fair values of the Group’s and the Parent Company’s financial assets and liabilities as of December 31, 2006 and 2005:
2006Consolidated Parent Company
Carrying Value Fair Value Carrying Value Fair valueFinancial AssetsCash and other cash items P8,663,488 P8,663,488 P8,381,197 P8,381,197Due from BSP 23,262,456 23,262,456 22,611,472 22,611,472Due from other banks 6,520,845 6,520,845 3,801,286 3,801,286IBLR and SPURA 27,572,262 27,572,262 27,732,262 27,732,262Securities at FVPL 22,761,419 22,761,419 22,621,745 22,621,745AFS investments 7,681,665 7,681,665 6,925,663 6,925,663Unquoted AFS equity investments 1,939,071 NA * 902,353 NA *HTM investments 29,903,374 32,024,603 29,552,707 31,662,507Loans and receivables 161,431,665 154,057,642 140,945,119 130,885,182Investments in subsidiaries and associates 310,511 310,511 11,754,200 12,397,605Receivables from SPVs – – 3,336,056 3,336,056Inter office float items - net 2,247,833 2,247,833 2,105,288 2,125,288Financial LiabilitiesDeposit liabilities 240,099,250 240,099,250 231,963,428 231,963,428Bills payable 20,155,857 20,218,453 14,325,120 14,387,715Outstanding acceptances 960,980 960,980 960,980 960,980Manager’s checks and demand
drafts outstanding 1,422,304 1,422,304 1,293,530 1,293,530Accrued interest payable 1,051,145 1,051,145 620,818 620,818Subordinated notes payable 9,691,113 10,271,785 9,691,113 10,271,785Other liabilities 17,211,167 17,211,167 15,749,837 15,749,887
*not available

NOTES TO FINANCIAL STATEMENTS
60 | Building for the Future
2005Consolidated Parent Company
Carrying Value Fair Value Carrying Value Fair valueFinancial AssetsCash and other cash items P7,541,236 P7,541,236 P7,199,793 P7,199,793Due from BSP 7,232,106 7,232,106 6,917,169 6,917,169Due from other banks 4,676,319 4,676,319 3,842,373 3,842,373IBLR and SPURA 18,199,624 18,199,624 18,199,624 18,199,624Securities at FVPL 26,061,882 26,061,882 25,921,031 25,921,031AFS investments 14,616,414 14,616,414 14,597,154 14,597,154Unquoted AFS equity investments 2,492,358 NA * 760,903 NA *HTM investments 32,483,945 33,258,308 32,200,964 32,955,536Loans and receivables 140,187,890 140,322,534 132,590,379 132,834,372Investments in subsidiaries and associates 290,772 290,772 11,050,975 11,126,628Interoffice float items - net 3,310,905 3,310,905 3,211,309 3,211,309Receivables from SPVs – – 3,336,056 3,336,056
Financial LiabilitiesDeposit liabilities 206,664,245 206,664,245 202,154,155 202,154,155Bills payable 29,705,735 29,760,434 27,198,167 27,252,866Outstanding acceptances 615,944 615,944 615,944 615,944Manager’s checks and demand drafts outstanding 912,091 912,091 891,704 891,704Accrued interest payable 794,639 794,639 526,999 526,999Subordinated notes payable 10,474,797 11,116,489 10,474,797 11,116,489Other liabilities 18,147,700 18,147,700 16,940,819 16,940,619
*not available
5. Financial Risk Management Objectives and Policies
a. Credit Risk and Concentration of Assets and Liabilities and Off-Balance Sheet ItemsCredit risk is the risk that one party to a financial instrument will fail to discharge an obligation and cause the other party to incur a financial loss. The Group manages credit risk by setting limits for individual borrowers, and groups of borrowers and industry segments. The Group also monitors credit exposures, and continually assesses the creditworthiness of counterparties. In addition, the Group obtains security where appropriate, enters into master netting agreements and collateral arrangements with counterparties, and limits the duration of exposures.
In compliance with BSP requirements, the Group established in 2005 an internal credit risk rating system for the purpose of measuring credit risk for every exposure in a consistent manner as accurately as possible and uses the risk information for business and financial decision-making. The Group adopted the Bankers’ Association of the Philippines model which has been approved by the BSP as a minimum standard for an internal risk rating system under BSP Circular No. 439. The system has two components namely a) Borrower Risk Rating System which provides an assessment of credit risk without considering the security arrangements and b) Facility Risk Rating which is an account rating taking into account the collateral and other credit risk mitigants. The rating scale consists of 10 grades, 6 of which fall under unclassified accounts and 4 classified accounts according to regulatory provisioning guidelines.

NOTES TO FINANCIAL STATEMENTS
2006 Equitable PCI Bank Annual Report | 61
In 2005, the Group also employed the use of Credit Scorecards in assessing its loan accounts. The scorecards were developed jointly with third party service providers using data from its own portfolio and wealth experience in Consumer Finance.
Credit risk in respect of derivative financial instruments is limited to those with positive fair values, which are included under Securities at FVPL. As a result, the maximum credit risk, without taking into account the fair value of any collateral and netting agreements, is limited to the amounts on the statement of condition plus credit commitments.
Concentrations arise when a number of counterparties are engaged in similar business activities, or activities in the same geographic region, or have similar economic features that would cause their ability to meet contractual obligations to be similarly affected by changes in economic, political or other conditions. Concentrations indicate the relative sensitivity of the Group’s performance to developments affecting a particular industry or geographic location. The distribution of assets, liabilities, and off-balance sheet items by geographic region and industry sector of the Group and the Parent Company as of December 31, 2006 and 2005 follows:
2006Consolidated
Assets LiabilitiesCredit
Commitments(In Thousands)
Geographic Region: Philippines P291,954,711 P275,090,119 P97,203,643Asia 30,361,614 19,053,980 411,855Europe 16,277,201 3,498,622 1,312United States 6,548,299 17,800 382,875Total P345,141,825 P297,660,521 P97,999,685Industry Sector: Trading and manufacturing P150,896,003 P142,096,851 P49,787,862Banks and financial institutions 133,885,319 61,716,651 17,494,185Consumers 25,711,781 35,115,269 6,284,094Construction and real estate 25,212,098 21,125,996 8,247,758Others 9,436,624 37,605,754 16,185,786
P345,141,825 P297,660,521 P97,999,685
2005Consolidated
Assets LiabilitiesCredit
Commitments(In Thousands)
Geographic Region: Philippines P275,896,370 P257,466,728 P122,195,630Asia 11,061,920 11,376,415 1,496,753Europe 23,511,283 5,312,314 3,196United States 1,582,013 398,715 5,324Total P312,051,586 P274,554,172 P123,700,903(Forward)

NOTES TO FINANCIAL STATEMENTS
62 | Building for the Future
2005Consolidated
Assets LiabilitiesCredit
Commitments(In Thousands)
Industry Sector: Trading and manufacturing P169,782,517 P157,992,862 P57,793,452Banks and financial institutions 85,295,003 23,877,098 26,964,411Consumers 9,529,734 14,295,583 7,637,449Construction and real estate 21,920,976 35,585,327 13,226,734Others 25,523,356 42,803,302 18,078,857
P312,051,586 P274,554,172 P123,700,903
2006Parent Company
Assets LiabilitiesCredit
Commitments(In Thousands)
Geographic Region: Philippines P268,825,182 P255,785,657 P97,190,186Asia 29,797,721 18,682,255 411,855Europe 16,048,139 3,450,211 1,312United States 6,148,795 683 382,875Total P320,819,837 P277,918,806 P97,986,228Industry Sector: Trading and manufacturing P147,243,139 P133,123,109 P49,778,581Banks and financial institutions 125,403,813 58,362,949 17,492,526Consumers 17,614,375 30,848,987 6,284,006Construction and real estate 22,330,500 19,454,316 8,247,758Others 8,228,010 36,129,445 16,183,357
P320,819,837 P277,918,806 P97,986,228
2005Parent Company
Assets LiabilitiesCredit
Commitments(In Thousands)
Geographic Region: Philippines P268,260,240 P246,325,621 P122,171,674Asia 10,328,027 10,642,521 1,496,753Europe 23,340,757 5,265,914 3,196United States 1,582,013 228,189 5,324Total P303,511,037 P262,462,245 P123,676,947Industry Sector: Trading and manufacturing P169,276,818 P157,930,184 P57,773,672Banks and financial institutions 84,554,559 23,523,760 26,962,752Consumers 9,431,164 14,295,583 7,637,361Construction and real estate 17,008,451 28,591,165 13,226,734Others 23,240,045 38,121,553 18,076,428
P303,511,037 P262,462,245 P123,676,947

NOTES TO FINANCIAL STATEMENTS
2006 Equitable PCI Bank Annual Report | 63
b. Market Risk Market risk is the risk of loss to future earnings, to fair values or to future cash flows that may result from changes in
the price of a financial instrument. The value of a financial instrument may change as a result of changes in interest rates, foreign currency exchange rates, commodity prices, equity prices and other market changes. The Group’s market risk originates from its holdings in foreign exchange instruments, debt and equity securities and derivatives.
The Market Risk Management Unit is responsible for the identification and measurement of market risk under the supervision of the Risk Management Committee of the BOD. Market risk management for the Trading Book is measured using Value at Risk (VaR).
In 2001, the Parent Company commenced computation of its VaR, in certain trading activities and began benchmarking its market risk practices to industry standards. The VaR method is a procedure for estimating the probability of portfolio losses exceeding some specified proportion based on a statistical analysis of historical market price trends, correlations and volatilities. VaR estimates the potential decline in the value of a portfolio, under normal market conditions, for a given “confidence level” over a specified holding period.
In calculating VaR, the Parent Company uses a 99% confidence level and a 1 day holding period for a liquid market. This means that, statistically, the Group’s losses on trading operations will exceed VaR on 2.5 days out of 250 trading business days. The validity of the VaR model is verified through back testing, which examines how frequently actual daily losses exceeds daily VaR. The Parent Company measures and monitors the VaR and profit and loss on a daily basis.
c. Interest Rate RiskThe Group follows a prudent policy on managing its assets and liabilities so as to ensure that its exposure to fluctuations in interest rates is kept within acceptable limits.
As a substantial proportion of the Group’s total loan portfolio is for a term of more than four years, and the majority of the balance of its medium-term portfolio is on a floating-rate basis. As of December 31, 2006 and 2005, 42% and 65.7%, respectively, of the Group’s total loan portfolio comprised of floating rate loans which are repriced periodically by reference to the transfer pool rate which reflects the Bank’s internal cost of funds. As a result of these factors, the Group exposure to interest rate fluctuations and other market risk is significantly reduced. The Group, in keeping with banking industry practice, aims to achieve stability and lengthen the term structure of its deposit base while providing adequate liquidity to cover transactional banking requirements of customers. No interest is paid on demand accounts, which as of December 31, 2006 and 2005 accounted for 4.9% and 4.1%, respectively of total deposits, except for a demand account product which pays a rate of interest equal to that payable on regular savings accounts of the Parent Company. Rates on savings accounts and time deposit accounts, which constituted 73.2% and 20.1%, respectively, as of December 31, 2006 and 69.0% and 25.3%, respectively, as of December 31, 2005 of total deposits are set by different criteria. Savings account rates are set by reference to prevailing market rates while rates on time deposits and special savings accounts are usually priced by reference to rates applicable to prevailing rates on Philippine Treasury Bills and other money market instruments or, in the case of foreign currency deposits, SIBOR (Singapore interbank offered rate) and other benchmark dollar deposit rates in the Asian and international money markets with similar maturities.

NOTES TO FINANCIAL STATEMENTS
64 | Building for the Future
The following table provides for the average effective interest rates (in %) by period of maturity or repricing of the Group and the Parent Company as of December 31, 2006 and 2005:
2006Consolidated Parent Company
Less than3 Months
3 Monthsto 1 Year
Greater than
1 YearLess than 3 Months
3 Monthsto 1 Year
Greaterthan
1 YearPeso-DenominatedAssetsDue from BSP 4.89% – – 5.78% – –Due from other banks 3.09% – – – – –IBLR and SPURA – – – – – –Securities at FVPL 6.39% 6.06% 8.92% 7.21% 5.64% 7.44%AFS investments – – – – – –HTM investments 5.47% 10.14% 9.05% 5.47% 10.14% 7.72%Loans and receivables 11.14% 12.53% 13.47% 6.70% 11.23% 10.15%LiabilitiesDeposit liabilities 3.42% 3.80% 7.49% 2.94% 4.25% 6.47%Bills payable 5.86% 5.66% 8.58% 4.97% 6.13% 9.38%Foreign Currency-DenominatedAssetsDue from other banks 2.41% – – – – –IBLR and SPURA 6.11% – 7.02% 7.26% – 7.02%Securities at FVPL 6.78% – 9.29% 6.78% – 9.29%AFS investments – 8.17% 7.04% – 8.17% 7.04%HTM investments 3.49% 7.50% 7.27% 3.49% 7.50% 7.27%Loans and receivables 8.71% 7.49% 7.28% 5.71% 7.49% 7.28%LiabilitiesDeposit liabilities 3.32% 4.48% 3.44% 4.77% 7.58% 3.44%Bills payable 5.29% 5.41% 6.99% 5.29% 5.41% 6.99%
2005Consolidated Parent Company
Less than3 Months
3 Monthsto 1 Year
Greater than
1 YearLess than 3 Months
3 Monthsto 1 Year
Greaterthan
1 YearPeso-DenominatedAssetsDue from BSP 4.00% – – 4.00% – –Due from other banks 3.60% – – – – –IBLR and SPURA – – – – – –Securities at FVPL 5.59% 8.12% 10.03% 6.98% 8.83% 9.64%AFS investments – – – – – –HTM investments 6.32% 8.46% 9.70% 6.32% 8.46% 8.81%Loans and receivables 9.07% 9.84% 9.72% 7.93% 9.84% 9.91%(Forward)

NOTES TO FINANCIAL STATEMENTS
2006 Equitable PCI Bank Annual Report | 65
2005Consolidated Parent Company
Less than3 Months
3 Monthsto 1 Year
Greater than
1 YearLess than 3 Months
3 Monthsto 1 Year
Greaterthan
1 YearLiabilitiesDeposit liabilities 2.00% 5.10% 7.88% 3.10% 3.97% 7.41%Bills payable 6.76% 7.98% – 5.71% 7.98% 8.37%Foreign Currency-DenominatedAssetsDue from other banks – – – – – –IBLR and SPURA 4.22% 6.48% 6.61% 4.22% 6.48% 6.61%Securities at FVPL 7.97% 4.20% 9.95% 7.97% 4.20% 9.95%AFS investments – – 7.03% – – 7.03%HTM investments 5.80% – 8.42% 5.80% – 8.42%Loans and receivables 5.89% 7.01% 5.18% 5.89% 7.01% 5.18%LiabilitiesDeposit liabilities 3.10% 3.97% 7.41% 2.66% 1.58% 2.54%Bills payable 5.71% 7.98% 8.37% 4.22% 4.64% 6.99%
The method by which the Group measures the sensitivity of its assets and liabilities to interest rate fluctuations is by way of Earnings-at-Risk. This analysis provides the Group with a measure of the impact of changes in interest rates on the accrual portfolio i.e. the risk exposure of future accounting income. The repricing gap is calculated by distributing the statement of condition into tenor buckets according to the time remaining to maturity or next repricing date and then obtaining the difference between the total of the repricing (interest sensitive) assets and repricing (interest sensitive) liabilities.
A gap is considered negative when the amount of interest rate sensitive liabilities exceeds the amount of interest rate sensitive assets. A gap is considered positive when the amount of interest rate sensitive assets exceeds the amount of interest rate sensitive liabilities. Accordingly, during a period of rising interest rates, a company with a positive gap would be better positioned than one with a negative gap to invest in or hold higher yielding assets more quickly than it would need to refinance its interest-bearing liabilities. During a period of falling interest rates, a company with a positive gap would tend to see its assets repricing at a faster rate than one with a negative gap, which may restrain the growth of its net income or result in a decline in net interest income.
The following table sets forth the repricing gap position of the Group and the Parent Company as of December 31, 2006 and 2005:
2006Consolidated
Up to 1 Month
1 to 3Months
3 to 6Months
6 to 12Months
Greater than 1 Year Total
(in Millions)AssetsTotal loans and receivables P80,463 P37,366 P4,504 P8,120 P30,979 P161,432Total investments 7,241 7,881 1,048 2,199 42,298 60,667Placements with other banks 33,667 982 163 – – 34,812Total assets P121,371 P46,229 P5,715 P10,319 P73,277 P256,911(Forward)

NOTES TO FINANCIAL STATEMENTS
66 | Building for the Future
2006Consolidated
Up to 1 Month
1 to 3Months
3 to 6Months
6 to 12Months
Greater than 1 Year Total
(in Millions)
LiabilitiesDeposit liabilities P76,471 P29,869 P7,177 P7,481 P2,194 P123,192Bills payable 14,008 323 380 769 4,676 20,156Other liabilities 2,167 4,689 784 – 14,689 22,329Total liabilities 92,646 34,881 8,341 8,250 21,559 165,677Asset-liability gap P28,725 P11,348 (P2,626) P2,069 P51,718 P91,234
2005Consolidated
Up to 1 Month
1 to 3Months
3 to 6Months
6 to 12Months
Greater than 1 Year Total
(in Millions)
AssetsTotal loans and receivables P101,022 P27,192 P1,991 P1,489 P8,494 P140,188Total investments 17,957 14,318 4,215 6,789 32,376 75,655Placements with other banks 9,806 5,725 1,032 – 1,637 18,200Total assets 128,785 47,235 7,238 8,278 42,507 234,043LiabilitiesDeposit liabilities 94,158 24,181 6,733 4,878 61 130,011Bills payable 17,158 2,742 231 4,921 4,654 29,706Other liabilities – – – – 10,475 10,475Total liabilities 111,316 26,923 6,964 9,799 15,190 170,192Asset-liability gap P17,469 P20,312 P274 (P1,521) P27,317 P63,851
2006Parent Company
Up to 1 Month
1 to 3Months
3 to 6Months
6 to 12Months
Greater than 1 Year Total
(in Millions)
AssetsTotal loans and receivables P72,170 P34,544 P3,695 P12,223 P18,313 P140,945Total investments 5,678 7,761 1,048 2,197 42,104 58,788Placements with other banks 30,210 981 163 – – 31,354Total assets 108,058 43,286 4,906 14,420 60,417 231,087LiabilitiesDeposit liabilities 73,418 28,492 7,083 7,376 103 116,472Bills payable 10,170 244 173 83 3,655 14,325Other liabilities 879 2,032 784 – 14,688 18,383Total liabilities 84,467 30,768 8,040 7,459 18,446 149,180Asset-liability gap P23,591 P12,518 (P3,134) P6,961 P41,971 P81,907
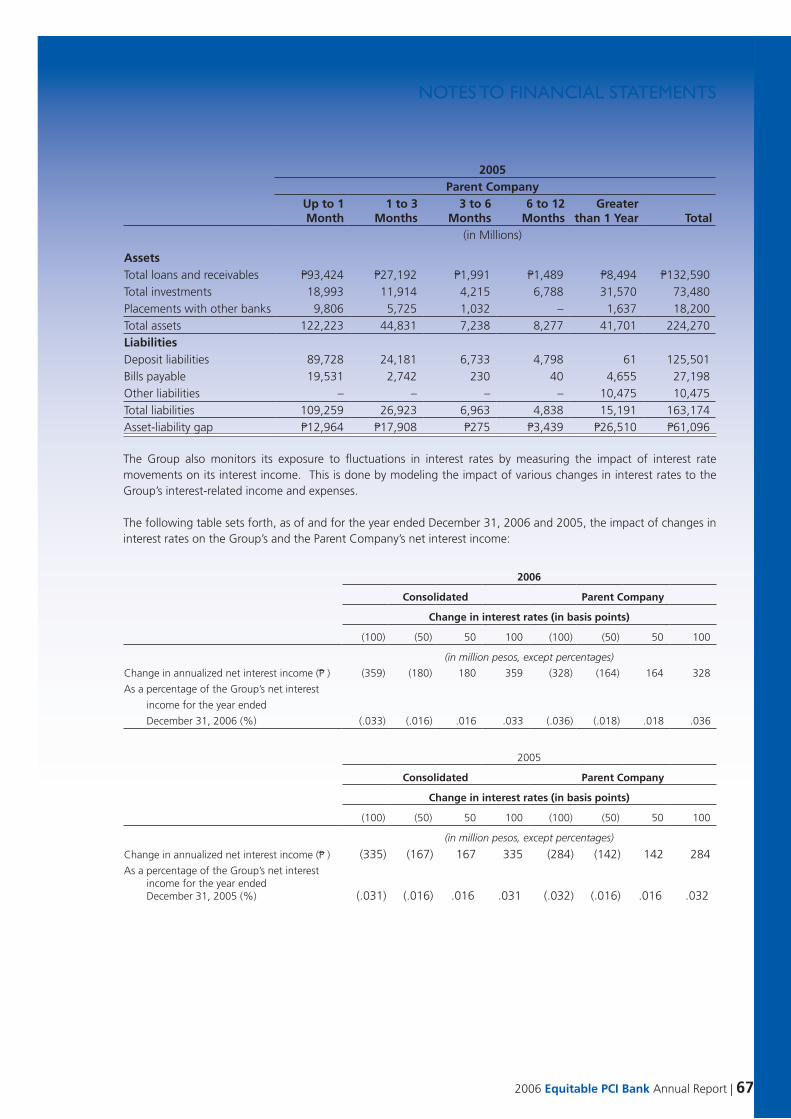
NOTES TO FINANCIAL STATEMENTS
2006 Equitable PCI Bank Annual Report | 67
2005Parent Company
Up to 1 Month
1 to 3Months
3 to 6Months
6 to 12Months
Greater than 1 Year Total
(in Millions)
AssetsTotal loans and receivables P93,424 P27,192 P1,991 P1,489 P8,494 P132,590Total investments 18,993 11,914 4,215 6,788 31,570 73,480Placements with other banks 9,806 5,725 1,032 – 1,637 18,200Total assets 122,223 44,831 7,238 8,277 41,701 224,270LiabilitiesDeposit liabilities 89,728 24,181 6,733 4,798 61 125,501Bills payable 19,531 2,742 230 40 4,655 27,198Other liabilities – – – – 10,475 10,475Total liabilities 109,259 26,923 6,963 4,838 15,191 163,174Asset-liability gap P12,964 P17,908 P275 P3,439 P26,510 P61,096
The Group also monitors its exposure to fluctuations in interest rates by measuring the impact of interest rate movements on its interest income. This is done by modeling the impact of various changes in interest rates to the Group’s interest-related income and expenses.
The following table sets forth, as of and for the year ended December 31, 2006 and 2005, the impact of changes in interest rates on the Group’s and the Parent Company’s net interest income:
2006
Consolidated Parent Company
Change in interest rates (in basis points)
(100) (50) 50 100 (100) (50) 50 100
(in million pesos, except percentages)
Change in annualized net interest income (P ) (359) (180) 180 359 (328) (164) 164 328
As a percentage of the Group’s net interest
income for the year ended
December 31, 2006 (%) (.033) (.016) .016 .033 (.036) (.018) .018 .036
2005
Consolidated Parent Company
Change in interest rates (in basis points)
(100) (50) 50 100 (100) (50) 50 100
(in million pesos, except percentages)
Change in annualized net interest income (P ) (335) (167) 167 335 (284) (142) 142 284As a percentage of the Group’s net interest income for the year ended December 31, 2005 (%) (.031) (.016) .016 .031 (.032) (.016) .016 .032

NOTES TO FINANCIAL STATEMENTS
68 | Building for the Future
d. Foreign Currency RiskForeign currency liabilities generally consist of foreign currency deposits in the Parent Company’s FCDU accounts made in the Philippines or which are generated from remittances to the Philippines by Filipino expatriates and overseas Filipino workers who retain for their own benefit or for the benefit of a third party, foreign currency deposit accounts with the Parent Company and foreign currency-denominated borrowings appearing in the regular books of the Parent Company.
Foreign currency deposits are generally used to fund the Parent Company’s foreign currency-denominated loan and investment portfolio in the FCDU. Banks are required by the BSP to match the foreign currency assets with the foreign currency liabilities held through FCDUs. In addition, the BSP requires a 30% liquidity reserve on all foreign currency liabilities held through FCDUs.
The Group’s policy is to maintain foreign currency exposure within acceptable limits and within existing regulatory guidelines. The Group believes that its profile of foreign currency exposure on its assets and liabilities is within limits for a financial institution engaged in the type of business in which the Group is engaged.
The table below summarizes the Group’s and Parent Company’s exposure to foreign exchange risk as of December 31, 2006 and 2005. Included in the table are the Group’s and the Parent Company’s assets and liabilities at carrying amounts (categorized by currency).
Information relating to the outstanding notional amounts of the Group’s and the Parent Company’s foreign currency derivatives (currency swaps and forwards are shown in Note 29)
2006Consolidated
USD Others Total(In Thousands)
AssetsDue from other banks P3,741,556 P1,111,244 P4,852,800IBLR and SPURA 20,843,356 3,135,640 23,978,996Securities at FVPL 8,812,057 24,930 8,836,987AFS investments 5,005,780 1,018,948 6,024,728HTM investments 22,496,849 437 22,497,286Loans and receivables 15,202,601 6,624,237 21,826,838Other assets 3,968,996 (1,557,797) 2,411,199 Total assets 80,071,195 10,357,639 90,428,834LiabilitiesDeposit liabilities 57,623,312 5,334,273 62,957,585Bills payable 5,692,241 53,720 5,745,961Manager’s checks and demand drafts outstanding – 5,372 5,372Accrued taxes, interest and other expenses 293,381 143,112 436,493Other liabilities 15,708,714 90,085 15,798,799 Total liabilities 79,317,648 5,626,562 84,944,210Net exposure P753,547 P4,731,077 P5,484,624

NOTES TO FINANCIAL STATEMENTS
2006 Equitable PCI Bank Annual Report | 69
2005Consolidated
USD Others Total(In Thousands)
AssetsDue from other banks P3,228,474 P613,798 P3,842,272IBLR and SPURA 13,103,366 2,310,238 15,413,604Securities at FVPL 17,477,320 – 17,477,320AFS investments 14,060,780 – 14,060,780HTM investments 16,248,906 135,978 16,384,884Loans and receivables 7,041,663 537,258 7,578,921Other assets 1,049,147 8,840,343 9,889,490 Total assets 72,209,656 12,437,615 84,647,271LiabilitiesDeposit liabilities 58,219,403 4,775,256 62,994,659Bills payable 14,548,521 7,075,899 21,624,420Manager’s checks and demand drafts outstanding – 2,364 2,364Accrued taxes, interest and other expenses 4,088 140,705 144,793Other liabilities 15,436,904 299,568 15,736,472 Total liabilities 88,208,916 12,293,792 100,502,708Net exposure (P15,999,260) P143,823 (P15,855,437)
2006Parent Company
USD Others Total(In Thousands)
AssetsDue from other banks P3,098,190 P663,512 P3,761,702IBLR and SPURA 20,574,622 3,135,640 23,710,262Securities at FVPL 8,812,057 24,930 8,836,987AFS investments 5,005,780 1,018,948 6,024,728HTM investments 22,442,262 437 22,442,699Loans and receivables 14,644,551 6,366,426 21,010,977Other assets 3,551,302 (1,557,797) 1,993,505 Total assets 78,128,764 9,652,096 87,780,860LiabilitiesDeposit liabilities 57,345,463 5,334,273 62,679,736Bills payable 5,103,701 53,720 5,157,421Manager’s checks and demand drafts outstanding – 5,372 5,372Accrued taxes, interest and other expenses 292,994 133,661 426,655Other liabilities 15,545,688 47,568 15,593,256 Total liabilities 78,287,846 5,574,594 83,862,440Net exposure (P159,082) P4,077,502 P3,918,420

NOTES TO FINANCIAL STATEMENTS
70 | Building for the Future
2005Parent Company
USD Others Total(In Thousands)
AssetsDue from other banks P3,228,474 P613,798 P3,842,272IBLR and SPURA 13,103,366 2,310,238 15,413,604Securities at FVPL 17,477,320 – 17,477,320AFS investments 14,060,780 – 14,060,780HTM investments 16,248,906 135,978 16,384,884Loans and receivables 6,989,776 537,258 7,527,034Other assets 1,049,147 8,840,343 9,889,490 Total assets 72,157,769 12,437,615 84,595,384LiabilitiesDeposit liabilities 58,219,403 4,775,256 62,994,659Bills payable 14,548,521 7,075,899 21,624,420Manager’s checks and demand drafts outstanding – 2,364 2,364Accrued taxes, interest and other expenses 4,088 140,705 144,793Other liabilities 15,436,904 299,568 15,736,472 Total liabilities 88,208,916 12,293,792 100,502,708Net exposure (P16,051,147) P143,823 (P15,907,324)
6. Due from Other Banks
The Parent Company has deposits with a certain foreign bank which serve as guarantee for the performance of its obligation relating to the loans assigned to such foreign bank in the same amount. The Parent Company has authorized the foreign bank to withdraw from the deposit an amount equivalent to any principal repayment that is received by the Parent Company from the borrower.
The balance of the Parent Company’s deposits with the foreign bank and the assigned loans, which is net of withdrawals by the foreign bank for repayments received by the Parent Company from the borrower, amounted to:
2006 2005 (In Thousands)
In US dollars 76,722 69,769Peso equivalent 3,761,682 3,702,106
7. Trading and Investment Securities
Securities at FVPL consist of the following:
Consolidated Parent Company2006 2005 2006 2005
(In Thousands)Held-for-trading P15,372,121 P10,165,385 P15,232,447 P10,024,534Designated FVPL 7,228,228 15,748,398 7,228,228 15,748,398Derivative asset 161,070 148,099 161,070 148,099
P22,761,419 P26,061,882 P22,621,745 P25,921,031

NOTES TO FINANCIAL STATEMENTS
2006 Equitable PCI Bank Annual Report | 71
As of December 31, 2006 and 2005, held-for-trading securities include net unrealized gain of P 799.8 million and P 338.4 million, respectively, for the Group, and P 783.8 million and P 338.4 million, respectively, for the Parent Company.
As of December 31, 2006 and 2005, designated FVPL include net unrealized gain of P 281.0 million and P 437.5 million, respectively, both for the Group and the Parent Company.
AFS investments consist of the following:
Consolidated Parent Company2006 2005 2006 2005
(In Thousands)Debt securities: Government P2,276,255 P6,672,417 P2,245,238 P6,353,000 Private 2,799,184 2,360,603 2,799,184 2,360,603 BSP – 641,567 – 641,567 Structured 980,305 4,705,610 980,305 4,705,610
6,055,744 14,380,197 6,024,727 14,060,780Equity securities: Quoted 1,625,921 236,217 900,936 536,374 Unquoted 1,939,071 2,492,358 902,353 760,903 3,564,992 2,728,575 1,803,289 1,297,277
P9,620,736 P17,108,772 P7,828,016 P15,358,057
As of December 31, 2006, AFS investment is net of accumulated unrealized gains of P640.2 million and P549.7 million for the Group and the Parent Company, respectively. As of December 31, 2005, AFS investment is net of accumulated unrealized gains of P563.6 million and P548.1 million, for the Group and the Parent Company, respectively.
For the year ended December 31, 2006 and 2005, realized gain from sale of AFS investments amounted to P590.9 million and P214.7 million respectively, for the Group, of which P564.7 million and P192.8 million, respectively, pertain to the Parent Company.
HTM investments consist of the following:
Consolidated Parent Company2006 2005 2006 2005
(In Thousands)
Government bonds P16,208,552 P9,160,506 P16,153,965 P9,160,506BSP treasury bills 6,282,959 15,165,569 6,281,771 15,165,011Private bonds 6,584,626 7,423,708 6,289,734 7,128,816Treasury notes 827,237 746,631 827,237 746,631
29,903,374 32,496,414 29,552,707 32,200,964Less allowance for impairment losses (Note 13) – 12,469 – –
P29,903,374 P32,483,945 P29,552,707 P32,200,964
HTM investments include US dollar-denominated bonds amounting to US$457 million (P22.5 billion) and US$306 million (P16.4 billion) as of December 31, 2006 and 2005, respectively.

NOTES TO FINANCIAL STATEMENTS
72 | Building for the Future
As of December 31, 2006 and 2005, the market values of HTM investments are as follows:
Consolidated Parent Company2006 2005 2006 2005
(In Thousands)
Government bonds P18,467,443 P9,938,118 P18,412,857 P9,938,118BSP treasury bills 6,112,204 15,120,204 6,112,204 15,119,647Private bonds 6,607,636 7,448,238 6,300,126 7,146,023Treasury notes 837,320 751,748 837,320 751,748
P32,024,603 P33,258,308 P31,662,507 P32,955,536
Peso-denominated HTM investments bear nominal annual interest rates ranging from 4.0% to 14.5% in 2006 and 2005, for foreign currency-denominated HTM investments, annual interest rate range from 7.5% to 11.4% in 2006 and 2005.
Interest income on trading and investment securities consists of:
Consolidated Parent Company2006 2005 2004 2006 2005 2004
(In Thousands)FVPL P2,801,490 P639,231 P269,549 P2,799,525 P636,016 P254,802AFS 824,803 1,882,997 142,235 784,252 1,869,895 139,774HTM 2,894,069 2,877,611 3,997,869 2,864,090 2,815,595 3,864,369
P6,520,362 P5,399,839 P4,409,653 P6,447,867 P5,321,506 P4,258,945
8. Loans and Receivables
This account consists of:
Consolidated Parent Company2006 2005 2006 2005
(In Thousands)
Loans and discounts (Note 32) P111,829,197 P103,282,242 P95,205,143 P89,733,599Lease receivables 5,336,432 4,173,388 – –
117,165,629 107,455,630 95,205,143 89,733,599Less unearned discount 2,307,378 2,184,886 670,231 1,103,569
114,858,251 105,270,744 94,534,912 88,630,030Customers’ liabilities on acceptances,
letters of credit and trust receipts 16,770,725 18,520,703 16,770,725 18,520,703Bills purchased 12,352,539 13,869,770 12,327,552 13,850,233Receivables from cardholders 4,569,754 3,675,087 – –
148,551,269 141,336,304 123,633,189 121,000,966Unquoted debt securities 9,733,349 2,546,567 9,377,997 1,896,567Other receivables (Note 19) 14,743,195 7,820,967 17,552,266 18,739,392
173,027,813 151,703,838 150,563,452 141,636,925Less client’s equity 100,837 89,269 – – allowance for credit losses (Note 13) 11,495,311 11,426,679 9,618,333 9,046,546
P161,431,665 P140,187,890 P140,945,119 P132,590,379

NOTES TO FINANCIAL STATEMENTS
2006 Equitable PCI Bank Annual Report | 73
The Parent Company’s loan receivables from customers amounting to P810.7 million and P827.1 million as of December 31, 2006 and 2005, respectively, were pledged as collaterals with the BSP to secure borrowings under rediscounting privileges. In addition, loan receivables from customers amounting to P3.8 billion and P4.9 billion as of December 31, 2006 and 2005, respectively, have been rediscounted under the Development Bank of the Philippines (DBP), Land Bank of the Philippines (LBP) and Social Security System (SSS) rediscounting facilities (see Note 15).
Consolidated loans and discounts include loans sold by the Parent Company to SPVs amounting to P3.3 billion (see Note 12) and ESB loans sold to CGAM on April 1, 2005 amounting to P621.0 million. Investment properties sold by ESB to LNC on April 12, 2005 amounting to P98.0 million are included under Investment properties (see Note 11).
In exchange for the loans and investment properties (see Note 11), ESB received SPV Notes and cash of P60.0 million and P23.1 million, respectively, for the sale of loans and P39.2 million and P4.2 million, respectively, for the sale of ROPA. On June 24, 2005 and July 8, 2005, the Closing Certificate was signed between ESB and CGAM and ESB and LNC, respectively, to implement and make effective the SPA on loans and investment properties as of April 1, 2005 and April 12, 2005, respectively. Accordingly, ESB received SPV Notes amounting to P60.0 million for loans from CGAM and P39.2 million for investment properties from LNC. Total loans transferred to CGAM amounted to P621.0 million. Investment properties transferred to LNC amounted to P98.0 million.
Unquoted debt securities consist of:
Consolidated Parent Company2006 2005 2006 2005
(In Thousands)
Structured notes P 7,539,132 P – P 7,539,132 P –Peace bonds 1,370,079 1,255,276 1,370,079 1,255,276Home Insurance Guarantee Corp. bonds 302,444 302,362 302,444 302,362Global Ispat Holdings, Inc. (GIHI) and Global
Steelworks International, Inc. (GSII) 136,388 200,836 136,388 200,836Others 385,306 788,093 29,954 138,093
P 9,733,349 P 2,546,567 P 9,377,997 P 1,896,567
Unquoted debt securities include the subordinated notes representing investments in GIHI and GSII which assumed the liabilities of National Steel Corporation (NSC). On October 15, 2004, GIHI and GSII (SPV companies), and the NSC Creditors entered into an agreement which sets forth the terms and conditions upon which the NSC Creditors have agreed to accept zero-interest coupon notes in the aggregate amount of P12.3 billion to be issued by SPV companies in settlement of the liabilities of NSC. The zero-interest coupon notes were issued in two tranches, namely, (a) Tranche A Note in the principal amount of P2.0 billion and (b) Tranche B Note in the principal amount of P10.3 billion, which notes are secured by a first ranking mortgage and security interest over the NSC plant assets and stand-by letters of credit by the SPV companies in accordance with the schedule in the agreement. On October 15, 2004, the Parent Company received Tranche A Note at principal amount of P78.3 million and Tranche B Note at principal amount of P328.2 million in exchange of the outstanding receivable from NSC of P549.5 million. The Parent Company carried the subordinated notes at discounted values using a discount rate of 13.2%. The carrying value of such investments as of December 31, 2006 and 2005 amounted to P136.4 million and P200.8 million, respectively.
Also included under unquoted debt securities are structured notes that contain embedded derivatives which the Group has assessed to be closely related to the host debt investments. The Group has also assessed that these financial instruments are not quoted in an active market and these structures are mostly principal protected which have interest rate indices as underlying derivatives where the return on the structured notes will not result to at least twice what the market return would be for a contract with the same terms as the host contract and the initial rate of return on the host contract. Given that these structures are not quoted in an active market, their fair values are determined using valuation techniques utilizing generally accepted market valuation models.
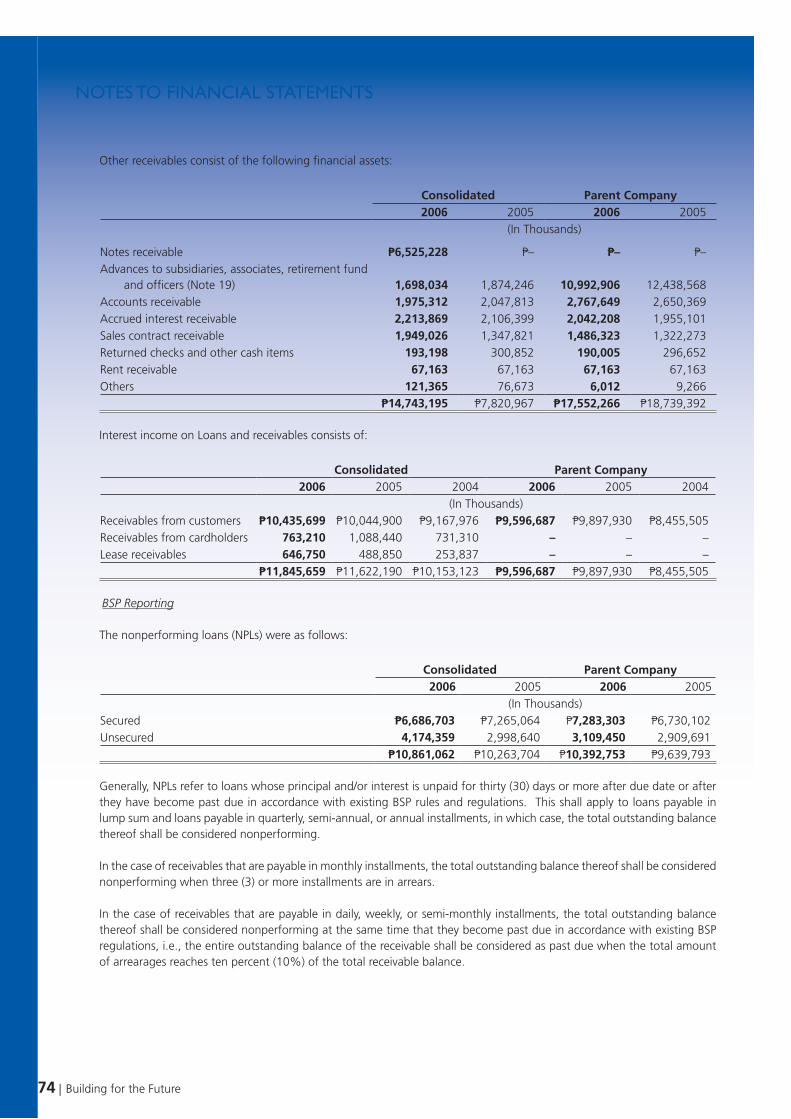
NOTES TO FINANCIAL STATEMENTS
74 | Building for the Future
Other receivables consist of the following financial assets:
Consolidated Parent Company2006 2005 2006 2005
(In Thousands)
Notes receivable P6,525,228 P– P– P–Advances to subsidiaries, associates, retirement fund
and officers (Note 19) 1,698,034 1,874,246 10,992,906 12,438,568Accounts receivable 1,975,312 2,047,813 2,767,649 2,650,369Accrued interest receivable 2,213,869 2,106,399 2,042,208 1,955,101Sales contract receivable 1,949,026 1,347,821 1,486,323 1,322,273Returned checks and other cash items 193,198 300,852 190,005 296,652Rent receivable 67,163 67,163 67,163 67,163Others 121,365 76,673 6,012 9,266
P14,743,195 P7,820,967 P17,552,266 P18,739,392
Interest income on Loans and receivables consists of:
Consolidated Parent Company2006 2005 2004 2006 2005 2004
(In Thousands)Receivables from customers P10,435,699 P10,044,900 P9,167,976 P9,596,687 P9,897,930 P8,455,505Receivables from cardholders 763,210 1,088,440 731,310 – – –Lease receivables 646,750 488,850 253,837 – – –
P11,845,659 P11,622,190 P10,153,123 P9,596,687 P9,897,930 P8,455,505
BSP Reporting
The nonperforming loans (NPLs) were as follows:
Consolidated Parent Company2006 2005 2006 2005
(In Thousands)Secured P6,686,703 P7,265,064 P7,283,303 P6,730,102Unsecured 4,174,359 2,998,640 3,109,450 2,909,691
P10,861,062 P10,263,704 P10,392,753 P9,639,793
Generally, NPLs refer to loans whose principal and/or interest is unpaid for thirty (30) days or more after due date or after they have become past due in accordance with existing BSP rules and regulations. This shall apply to loans payable in lump sum and loans payable in quarterly, semi-annual, or annual installments, in which case, the total outstanding balance thereof shall be considered nonperforming.
In the case of receivables that are payable in monthly installments, the total outstanding balance thereof shall be considered nonperforming when three (3) or more installments are in arrears.
In the case of receivables that are payable in daily, weekly, or semi-monthly installments, the total outstanding balance thereof shall be considered nonperforming at the same time that they become past due in accordance with existing BSP regulations, i.e., the entire outstanding balance of the receivable shall be considered as past due when the total amount of arrearages reaches ten percent (10%) of the total receivable balance.

NOTES TO FINANCIAL STATEMENTS
2006 Equitable PCI Bank Annual Report | 75
Receivables are classified as nonperforming in accordance with BSP regulations, or when, in the opinion of management, collection of interest or principal is doubtful. Receivables are not reclassified as performing until interest and principal payments are brought current or the loans are restructured in accordance with existing BSP regulations, and future payments appear assured.
Restructured receivables which do not meet the requirements to be treated as performing receivables shall also be considered as NPLs.
Current bank regulations allow banks with no unbooked valuation reserves and capital adjustments required by the BSP to exclude from nonperforming classification those receivables from customers classified as Loss in the latest examination of the BSP which are fully covered by allowance for credit losses, provided that interest on said loans shall not be accrued. Accordingly, NPLs not fully covered by allowance for credit losses as of December 31, 2006 and 2005 follow:
Consolidated Parent Company2006 2005 2006 2005
(In Thousands)NPLs P10,861,062 P10,263,704 P10,392,753 P9,639,793Less NPLs fully provided with allowance
for impairment losses 3,167,612 2,575,367 2,821,816 2,455,439P7,693,450 P7,688,337 P7,570,937 P7,184,354
Restructured loans of the Parent Company as of December 31, 2006 and 2005 amounted to P6.8 billion and P7.4 billion, respectively.
The Parent Company’s loan portfolio includes non-risk loans, as defined under BSP regulations, totaling P15.6 billion and P19.8 billion as of December 31, 2006 and 2005, respectively.
As of December 31, 2006 and 2005, 66.2% and 65.7%, respectively, of the total loan receivable from customers of the Group are subject to periodic interest repricing. Remaining receivables from customers earn annual fixed interest rates ranging from 0.15% to 49.90% for peso-denominated loans and from 1.75% to 10.5% for foreign currency-denominated loans in 2006 and from 2.0% to 49.9% for peso-denominated loans and from 1.7% to 11.0% for foreign currency-denominated loans in 2005.
The following table shows information relating to loans and receivables (at gross amounts) by collateral:
Consolidated2006 2005
Amount(In Thousands) %
Amount(In Thousands) %
Secured by: Real estate P35,534,814 20.24 P31,484,283 20.43 Trust receipts 15,912,498 9.06 17,435,352 11.32 Bank deposits 11,296,819 6.43 14,335,478 9.30 Chattel 10,241,457 5.83 12,121,517 7.87 Shares of stock 4,097,976 2.34 2,232,489 1.45 Mortgage trust indenture 4,074,573 2.32 5,743,778 3.73 Warehouse receipts 6,060 0.00 6,887 0.00 Marginal deposit – 0.00 28,096 0.02 Others 2,635,627 1.50 4,045,117 2.63
83,799,824 47.72 87,432,997 56.75Unsecured 91,816,518 52.28 66,644,014 43.25
P175,616,342 100.00 P154,077,011 100.00

NOTES TO FINANCIAL STATEMENTS
76 | Building for the Future
Parent Company2006 2005
Amount(In Thousands) %
Amount(In Thousands) %
Secured by: Real estate P25,236,047 16.66 P26,645,105 18.64 Trust receipts 15,912,498 10.50 17,435,352 12.20 Bank deposits 11,285,418 7.45 14,128,463 9.89 Shares of stock 4,096,910 2.70 2,230,408 1.56 Mortgage trust indenture 4,074,573 2.69 5,660,445 3.96 Chattel 2,942,340 1.94 3,357,027 2.35 Warehouse receipts 6,060 0.00 6,887 0.00 Margin deposits – 0.00 28,096 0.02 Others 2,635,628 1.75 4,045,117 2.83
66,189,474 43.69 73,536,900 51.45Unsecured 85,325,359 56.31 69,391,879 48.55
P151,514,833 100.00 P142,928,779 100.00
Information on the concentration of credit (at gross amounts) as to economic activity and industry sub-sectors follow:
Consolidated2006 2005
Amount(In Thousands) %
Amount(In Thousands) %
Other community, social and personal services P40,367,402 22.97 P17,924,759 11.63Wholesale and retail 27,863,210 15.87 34,158,987 22.17Financial intermediation, renting and business activities 22,453,983 12.79 25,316,420 16.43Manufacturing: Consumer goods 19,345,449 11.02 14,572,055 9.46 Intermediate goods 16,468,989 9.38 14,538,767 9.44 Capital goods 14,437,310 8.22 12,020,224 7.80Transport, storage and communications 10,273,320 5.85 10,999,100 7.14Real estate 8,760,621 4.99 8,337,593 5.41Electricity, gas and water 6,895,365 3.93 7,492,051 4.86Agriculture, hunting and forestry 2,332,286 1.33 1,799,452 1.17Construction 1,430,494 0.81 993,306 0.64Mining and quarrying 1,227,037 0.70 1,723,624 1.12Others 3,760,876 2.14 4,200,673 2.73
P175,616,342 100.00 P154,077,011 100.00

NOTES TO FINANCIAL STATEMENTS
2006 Equitable PCI Bank Annual Report | 77
Parent Company2006 2005
Amount(In Thousands) %
Amount(In Thousands) %
Financial intermediation, renting and business activities P31,800,375 20.99 P25,399,334 17.77Wholesale and retail 25,901,904 17.10 32,617,141 22.82Manufacturing: Consumer goods 19,090,434 12.60 14,465,580 10.12 Intermediate goods 13,804,691 9.11 13,475,522 9.43 Capital goods 13,745,331 9.07 11,313,112 7.92Other community, social and personal services 16,144,668 10.65 13,672,395 9.57Real estate 8,539,891 5.64 8,063,609 5.64Transport, storage and communications 8,504,715 5.61 9,311,319 6.51Electricity, gas and water 6,502,022 4.29 7,290,709 5.10Agriculture, hunting and forestry 2,223,370 1.47 1,749,660 1.22Construction 1,020,353 0.67 682,040 0.48Mining and quarrying 1,011,640 0.67 1,388,140 0.97Others 3,225,439 2.13 3,500,218 2.45
P151,514,833 100.00 P142,928,779 100.00
The BSP considers that credit concentration risk exists when the total loan exposure to a particular industry or economic sector exceeds 30% of the total loan portfolio.
9. Property and Equipment
The composition of and movements in this account follow:
Consolidated2006
At Appraised
Value At Cost
Land BuildingsLeasehold
Improvements
Furniture,Fixtures and
Equipment Total(In Thousands)
Cost/Appraised ValueBalance, at beginning of year P4,500,557 P4,335,489 P464,830 P7,632,313 P12,432,632Additions – 99,198 7,513 1,568,648 1,675,359Disposals (87,881) (492,117) (3,618) (365,707) (861,442)Balance, at end of year 4,412,676 3,942,570 468,725 8,835,254 13,246,549Accumulated Depreciation and
AmortizationBalance, at beginning of year – 1,948,536 – 5,200,468 7,149,004Depreciation and amortization – 117,898 114,935 910,868 1,143,701Disposals – (54,861) (3,453) (73,297) (131,611)Reclassification – (749,186) (498) 749,684 –Balance, at end of year – 1,262,387 110,984 6,787,723 8,161,094Net Book Value, at end of year P4,412,676 P2,680,183 P357,741 P2,047,531 P5,085,455

NOTES TO FINANCIAL STATEMENTS
78 | Building for the Future
Consolidated2005
At Appraised
Value At Cost
Land BuildingsLeasehold
Improvements
Furniture,Fixtures and
Equipment Total(In Thousands)
Cost/Appraised ValueBalance, at beginning of year P4,447,904 P3,974,279 P448,776 P7,894,939 P12,317,994Additions 133,928 384,117 133,329 449,690 967,136Disposals (81,275) (22,907) (18,467) (712,316) (753,690)Balance, at end of year 4,500,557 4,335,489 563,638 7,632,313 12,531,440Accumulated Depreciation and
AmortizationBalance, at beginning of year – 1,777,047 – 5,117,303 6,894,350Depreciation and amortization – 173,926 106,479 608,227 888,632Disposals – (2,437) (7,671) (525,062) (535,170)Balance, at end of year – 1,948,536 98,808 5,200,468 7,247,812Net Book Value, at end of year P4,500,557 P2,386,953 P464,830 P2,431,845 P5,283,628
Parent Company2006
At Appraised
Value At Cost
Land BuildingsLeasehold
Improvements
Furniture,Fixtures and
Equipment Total(In Thousands)
Cost/Appraised ValueBalance, at beginning of year P4,406,236 P3,675,001 P341,251 P6,282,280 P10,298,532Additions – 89,528 34,969 572,896 697,393Disposals – (4,283) (3,571) (301,693) (309,547)Balance, at end of year 4,406,236 3,760,246 372,649 6,553,483 10,686,378Accumulated Depreciation and
AmortizationBalance, at beginning of year – 1,817,510 – 3,786,784 5,604,294Depreciation and amortization – 112,247 99,706 671,622 883,575Disposals – (249) (3,453) (158,848) (162,550)Reclassification – (749,186) (498) 749,684 –Balance, at end of year – 1,180,322 95,755 5,049,242 6,325,319Net Book Value, at end of year P4,406,236 P2,579,924 P276,894 P1,504,241 P4,361,059

NOTES TO FINANCIAL STATEMENTS
2006 Equitable PCI Bank Annual Report | 79
Parent Company2005
At Appraised
Value At Cost
Land BuildingsLeasehold
Improvements
Furniture,Fixtures and
Equipment Total(In Thousands)
Cost/Appraised ValueBalance, at beginning of year P4,406,236 P3,581,118 P393,103 P6,427,176 P10,401,397Additions – 105,749 64,417 531,364 701,530Disposals – (11,866) (17,610) (676,260) (705,736)Balance, at end of year 4,406,236 3,675,001 439,910 6,282,280 10,397,191Accumulated Depreciation and
AmortizationBalance, at beginning of year – 1,708,822 – 3,816,540 5,525,362Depreciation and amortization – 111,126 106,479 640,675 858,280Disposals – (2,438) (7,820) (670,431) (680,689)Balance, at end of year – 1,817,510 98,659 3,786,784 5,702,953Net Book Value, at end of year P4,406,236 P1,857,491 P341,251 P2,495,496 P4,694,238
The cost of land of the Parent Company, ECN and ESB amounted to P2.5 billion, P76.5 million and P9.0 million, respectively.
10. Investments in Subsidiaries and Associates
This account consists of investments in:
Consolidated Parent Company2006 2005 2006 2005
(In Thousands)At equity: Acquisition cost of: Wholly and majority-owned (Note 2)
ESB P– P– P2,981,049 P2,981,049 PCI Leasing – – 1,854,073 1,854,073PCI Capital – – 1,719,483 1,719,483ESHC – – 1,351,654 1,351,654 EBCII – – 1,203,225 500,000 ECN – – 736,250 736,250 PCIB Properties – – 891,692 891,692 Express Padala HK – – 215,282 215,282 JEFC – – 50,000 50,000 Equimark – – 44,997 44,997
Maxicare – – 43,593 43,593EDCI – – 40,000 40,000PCIB Securities – – 39,177 39,177EPCI Cayman – – 38,399 38,399PCI Realty – – 33,510 33,510PCIB S.p.A. – – 32,921 32,921Express Padala L.A. – – 26,494 26,494EPHK – – 27,956 27,956PCI Insurance – – 7,800 7,800PCI Automation – – 7,443 7,443Others – – 3,320 3,320
(Forward)

NOTES TO FINANCIAL STATEMENTS
80 | Building for the Future
Consolidated Parent Company2006 2005 2006 2005
(In Thousands)Significantly owned:
Jardine Land, Inc. (JLI) (20%) P232,000 P232,000 P232,000 P232,000 Taal Land, Inc. (33%) 170,382 170,382 170,382 170,382 Medilink Network, Inc. (40%) – 3,000 – – PCI Travel Corporation (35%) 4,424 4,424 – – Unicorn First Properties (UFP) (35%) 3,500 3,500 3,500 3,500
410,306 413,306 11,754,200 11,050,975 Accumulated equity in net losses: Balance at beginning of year (122,534) (123,096) – – Equity in net income for the year 22,739 562 – – Balance at end of year (99,795) (122,534) – –
310,511 290,772 11,754,200 11,050,975Less allowance for impairment losses (Note 13) 106,284 – 3,255,871 2,085,391
P204,227 P290,772 P8,498,329 P8,965,584
On January 18, 2005, the BOD of PCI Leasing approved the declaration of cash dividends at P0.20 per share or P196.6 million in favor of stockholders of record as of February 1, 2005 and 12.0% stock dividends equivalent to P1.2 billion in favor of stockholders of record as of March 23, 2005. Such declaration was approved by SEC on March 10, 2005.
On January 18, 2005, the BOD of PCI Capital approved the declaration of 19.05% stock dividends amounting to P200.0 million. Such declaration was approved by BSP on March 10, 2005.
On January 24, 2005, the BOD of ECN declared stock dividends amounting to P475.0 million and cash dividends of P20 per share or P300.0 million to all stockholders of record as of February 1, 2005.
On March 31, 2006 and April 25, 2006, the BOD of PCI Capital approved the declaration of cash dividends in favor of stockholders of record as of March 31, 2006 and April 25, 2006, respectively at P0.40 per share or P500.0 million, approved by BSP on May 25, 2006 and paid on June 29, 2006, and P0.12 per share or P150.0 million approved by BSP on November 2, 2006 payable on December 20, 2006, respectively.
On April 4, 2006, the BOD of ECN approved the declaration of cash dividends amounting to P400.0 million or P20.25 per share paid in two tranches, 50% on May 15, 2006 and the balance on June 15, 2006, in favor of stockholders of record as of December 31, 2005.
On January 17, 2006 the BOD of EIBI approved the declaration of cash dividends at P33.33 per share or P20.0 million to be distributed to stockholders of record as of January 17, 2006 and to be paid equally in April 17, 2006 and June 30, 2006. On April 25, 2006, the BOD of EIBI approved the declaration of additional cash dividends at P83.33 per share or P50.0 million to be distributed to stockholders of record as of December 31, 2005 to be paid as follows: P15.0 million on May 2, 2006, P15.0 million on July 14, 2006 and P20.0 million on August 15, 2006.

NOTES TO FINANCIAL STATEMENTS
2006 Equitable PCI Bank Annual Report | 81
11. Investment Properties
The composition and movements in this account follow:
Consolidated2006 2005
LandBuildings and
Improvements Total LandBuildings and
Improvements Total(In Thousands)
CostBalance at beginning of year P13,438,147 P6,277,774 P19,715,921 P14,430,391 P6,151,376 P20,581,767Additions 599,600 273,739 873,339 585,684 328,547 914,231Transfers/disposals (1,193,555) (438,154) (1,631,709) (1,577,928) (202,149) (1,780,077)Balance at end of year 12,844,192 6,113,359 18,957,551 13,438,147 6,277,774 19,715,921Accumulated depreciation and amortizationBalance at beginning of year – 737,299 737,299 – 625,689 625,689Depreciation and amortization – 205,000 205,000 – 206,253 206,253Transfers/disposals – (71,923) (71,923) – (94,643) (94,643)Balance at end of year – 870,376 870,376 – 737,299 737,299Allowance for impairment losses (Note 13) – 211,972 211,972 – 542,260 542,260Net Book Value P12,844,192 P5,031,011 P17,875,203 P13,438,147 P4,998,215 P18,436,362
Buildings and improvements of the Group include properties held by SPV.
Parent Company2006 2005
LandBuildings and
Improvements Total LandBuildings and
Improvements Total(In Thousands)
CostBalance at beginning of
year P11,335,855 P5,264,637 P16,600,492 P12,271,443 P5,217,707 P17,489,150Additions 725,419 203,513 928,932 467,608 209,052 676,660Transfers/disposals (1,118,848) (314,069) (1,432,917) (1,403,196) (162,122) (1,565,318)Balance at end of year 10,942,426 5,154,081 16,096,507 11,335,855 5,264,637 16,600,492Accumulated
depreciation and amortization
Balance at beginning of year – 667,541 667,541 – 486,006 486,006
Depreciation and amortization – 180,192 180,192 – 181,535 181,535
Transfers/disposals – (39,479) (39,479) – – –Balance at end of year – 808,254 808,254 – 667,541 667,541Allowance for
impairment losses (Note 13) – 123,112 123,112 – – –
Net Book Value P10,942,426 P4,222,715 P15,165,141 P11,335,855 P4,597,096 P15,932,951

NOTES TO FINANCIAL STATEMENTS
82 | Building for the Future
The details of the net book value follow:
Consolidated Parent Company2006 2005 2006 2005
(In Thousands)Real estate properties acquired in settlement of loans and receivables P14,665,907 P15,171,105 P11,955,845 P12,667,694Bank premises leased to third parties and held for capital appreciation 3,209,296 3,265,257 3,209,296 3,265,257
P17,875,203 P18,436,362 P15,165,141 P15,932,951
Investment properties include investment property sold by ESB to LNC on April 12, 2005 amounting to P98.0 million.
The aggregate fair values of the investment properties of the Group and the Parent Company are P19.0 billion and P16.1 billion, respectively, as of December 31, 2006 and P19.7 billion and P16.6 billion, respectively, as of December 31, 2005.
The fair values of the Group’s investment property have been arrived at on the basis of recent sales of similar properties in the same areas as the investment properties and taking into account the economic conditions prevailing at the time the valuations were made.
12. Other Assets
This account consists of:
Consolidated Parent Company2006 2005 2006 2005
(In Thousands)Deferred tax assets - net (Note 24) P5,298,287 P5,781,329 P4,950,985 P5,427,283Real estate properties 4,522,600 4,700,608 583,041 459,262Interoffice float items - net 2,247,833 3,310,905 2,125,288 3,211,309Prepayments 267,631 341,278 150,622 284,877Net pension asset (Note 20) 54,596 112,643 – 61,416Assets held for sale 51,362 206,295 – 167,229Other investments 15,252 19,972 6,388 11,719Receivables from SPVs – – 3,336,056 3,336,056Miscellaneous (Note 29) 2,815,624 2,259,217 1,649,772 1,313,095
15,273,185 16,732,247 12,802,152 14,272,246Less allowance for impairment losses (Note 13) 3,125,290 2,363,878 3,567,008 2,669,732
P12,147,895 P14,368,369 P9,235,144 P11,602,514
As of December 31, 2006 and 2005, interoffice float items outstanding for more than 180 days (net debit balance) for which a full provision has been established amounted to P1.8 billion and P164.1 million, respectively. Management believes that no material unreserved losses will be incurred by the Parent Company on interoffice float items.
In 2005, the Parent Company entered into joint ventures for the development of foreclosed assets to generate profit upon completion of the project. As of December 31, 2006 and 2005, these joint ventures are in the initial stage of development. Properties invested in joint ventures are included under Real estate properties.
Other investments include exchange trading rights. Under the PSE rules, all exchange trading rights are pledged at its full value to the PSE to secure the payment of all debts due to other members of the PSE arising out of or in connection with the present or future members’ contracts.

NOTES TO FINANCIAL STATEMENTS
2006 Equitable PCI Bank Annual Report | 83
The carrying values of the investment in PSE shares and the exchange trading right in the accounts of PCIB Securities and Armstrong Securities were as follows:
2006 2005 (In Thousands)
AFS investments - PSE shares P28,000 P15,000Exchange trading rights 7,835 7,835
P35,835 P22,835
As of December 31, 2006 and 2005, the latest transacted price of the exchange trading right (as provided by the PSE) amounted to P5.0 million and P3.5 million, respectively. As of December 31, 2006, the market value of the PSE shares based on quoted price is P280 per share.
Management believes that adequate allowance for impairment losses has been made on Other Assets and does not anticipate any material adverse effect on the financial statements upon the realization of these assets.
Receivables from SPVs represent the amount due from sale of certain nonperforming assets (NPAs) of the Parent Company to SPVs.
The Parent Company entered into sale and purchase agreements (SPA) under the provisions of Republic Act (RA) No. 9182, “The Special Purpose Vehicle (SPV) Act of 2002,” for the sale of its loans and Real and Other Properties Acquired (ROPA) as follows:
Loans and receivables sold to PIO amounted to P8.3 billion on November 26, 2004 and ROPA to PIT amounted to P2.2 billion on December 15, 2004. On March 15, 2005 and March 28, 2005, the Closing Certificate was signed between the Parent Company and PIO and Parent Company and PIT, respectively, to implement and make effective the SPA on loans and receivables and ROPA. In exchange for the loans and receivables and ROPA, the Parent Company received SPV notes and cash of P1.0 billion and P100 million, respectively, for loans and receivables; and P1.8 billion and P350 million, respectively, for ROPA. The SPV Notes are payable over ten years in accordance with the accounts arrangement included in the SPA.
Loans and receivables sold to CGAM amounted to P4.8 billion on April 1, 2005. On June 24, 2005, the Closing Certificate was signed between the Parent Company and CGAM to implement and make effective the SPA on loans and receivables. In exchange for the loans, the Parent Company received SPV Notes and cash of P560.0 million and P325.0 million, respectively.
The more significant terms of the sale are as follows:
a. Certain NPAs of the Parent Company were purchased by the SPV for a total consideration of P4.1 billion.
b. The agreed purchase price of the NPAs was as follows:
i. An initial amount of P0.5 billion, booked as part of Accounts Receivable under Other Assets in 2004, was subsequently paid in the same year. For the NPAs sold in 2005, cash of P0.3 billion was received.
ii. The balance of P3.3 billion, through issuance of SPV Notes (the Notes), which shall be paid based on a cash flow waterfall arrangement and interest rate of 20% and 50% per annum on the P2.7 billion and P0.6 billion, respectively, was received.

NOTES TO FINANCIAL STATEMENTS
84 | Building for the Future
13. Allowance for Impairment and Credit Losses
Changes in the allowance for impairment losses follow:
Consolidated Parent Company2006 2005 2006 2005
(In Thousands)Balance at beginning of year AFS investments P443,388 P– P182,434 P– HTM investments 12,469 17,696 – 15,645 Loans and receivables 11,426,679 11,528,181 9,046,546 11,263,087 Investments in subsidiaries and associates – – 2,085,391 1,288,849 Investment properties 542,260 – – – Other assets 2,363,878 4,045,310 2,669,732 1,371,731
14,788,674 15,591,187 13,984,103 13,939,312Provisions for impairment and credit losses 4,127,322 2,857,922 4,096,631 1,996,690Accounts written off (1,144,216) (1,334,369) (285,884) (54,163)Reversals and other adjustments (1,656,696) (2,326,066) (1,090,526) (1,897,736)Balance at end of year AFS investments 1,176,227 443,388 140,000 182,434 HTM investments (Note 7) – 12,469 – – Loans and receivables (Note 8) 11,495,311 11,426,679 9,618,333 9,046,546 Investments in subsidiaries and associates (Note 10) 106,284 – 3,255,871 2,085,391 Investment properties (Note 11) 211,972 542,260 123,112 – Other assets (Note 12) 3,125,290 2,363,878 3,567,008 2,669,732
P16,115,084 P14,788,674 P16,704,324 P13,984,103
With the foregoing level of allowance for impairment losses, management believes that the Group has sufficient allowance to cover any losses that the Group may incur from the noncollection or nonrealization of its loans and receivables and other risk assets.
14. Deposit Liabilities
This account consists of:
Consolidated Parent Company2006 2005 2006 2005
(In Thousands)Demand P15,950,754 P11,755,328 P15,844,053 P11,675,256Savings 175,780,755 142,339,247 169,781,795 139,346,953Time 48,367,741 52,569,670 46,337,580 51,131,946
P240,099,250 P206,664,245 P231,963,428 P202,154,155
Of the total deposit liabilities of the Group as of December 31, 2006 and 2005, 51.8% and 53.4%, respectively, are subject to periodic interest repricing. Remaining deposit liabilities earn annual fixed interest rates ranging from 0.5% to 4.0% in 2006 and 2005.
Under existing BSP regulations, non-FCDU deposit liabilities of the Parent Company are subject to liquidity reserve equivalent to 11% starting July 15, 2005 (under BSP Circular 491) and statutory reserve equivalent to 10%. In addition, ESB, a thrift bank, is subject to liquidity and statutory reserves equivalent to 2% and 6%, respectively, on its deposit liabilities. As of December 31, 2006 and 2005, the Parent Company and ESB are in compliance with such regulations.

NOTES TO FINANCIAL STATEMENTS
2006 Equitable PCI Bank Annual Report | 85
The total liquidity and statutory reserves, as reported to BSP, are as follows:
Consolidated Parent Company2006 2005 2006 2005
(In Thousands)Cash P7,295,508 P6,446,396 P7,155,192 P6,348,612Due from BSP 23,262,456 7,232,106 22,611,472 6,917,169HTM investments 7,214,041 15,734,486 7,199,228 15,601,911
P37,772,005 P29,412,988 P36,965,892 P28,867,692
15. Bills Payable
This account consists of borrowings from:
Consolidated Parent Company2006 2005 2006 2005
(In Thousands)Local banks P5,075,842 P2,500,818 P– P–Senior notes 4,877,178 5,254,791 4,877,178 5,254,791Foreign banks 4,542,462 16,258,421 4,542,462 16,258,421BSP 791,441 827,070 791,441 827,070Others 4,868,934 4,864,635 4,114,039 4,857,885
P20,155,857 P29,705,735 P14,325,120 P27,198,167
Interbank borrowings with foreign and local banks are mainly short-term borrowings. Peso borrowings are subject to annual fixed interest rates ranging from 4.6% to 12.7% in 2006 and 5.0% to 13.0% in 2005; for foreign denominated borrowings, annual fixed interest rates range from 4.0% to 5.7% in 2006 and 1.9% to 7.0% in 2005.
Interest Expense on Bills payable, borrowings and others consists of:
Consolidated Parent Company2006 2005 2004 2006 2005 2004
(In Thousands)Bills payable P1,068,438 P1,203,030 P988,403 P825,390 P847,246 P927,162Borrowings 318,758 329,206 – 318,758 329,206 –Others (Note 16) 1,035,615 1,340,718 1,733,599 1,035,615 1,560,056 1,733,599
P2,422,811 P2,872,954 P2,722,002 P2,179,763 P2,736,508 P2,660,761
Bills payable - BSP mainly represent term borrowings availed through normal open market transactions with the BSP. These are collateralized by eligible receivables from customers. Bills payable - others mainly represent funds obtained from DBP, LBP and SSS, which the Parent Company relends to borrowers availing of certain financing programs of these institutions.
On November 23, 2004, the Parent Company’s BOD approved the issuance of senior bonds. Relative to this, on February 18, 2005 the Parent Company issued US$100 million, 6.5% senior notes due 2008. The issuance of the bonds under the terms approved by the BOD was approved by the BSP on January 31, 2005.

NOTES TO FINANCIAL STATEMENTS
86 | Building for the Future
Among the significant terms and conditions of the issuance of the senior notes are:
a. Issue price at 99.3% of the principal amount;
b. The senior notes bear interest at the rate of 6.5% per annum from and including February 18, 2005 to but excluding February 19, 2008. Interest will be payable semi-annually in arrears on February 19 and August 19 of each year, commencing August 19, 2005, except that the first payment of interest will be in respect of the period from and including February 18, 2005 but excluding August 19, 2005;
c. The senior notes will constitute direct, senior, unconditional, and unsecured obligations of the Parent Company and claims in respect of the notes shall at all times rank pari passu and without any preference among themselves. The payment obligations of the Parent Company under the senior notes shall at all times rank at least equally with all other present and future unsecured and unsubordinated obligations of the Parent Company, including liabilities in respect of deposits;
d. The Parent Company may redeem the senior notes in whole but not in part at redemption price equal to 100% of the principal amount of the Notes together with accrued and unpaid interest to the date fixed for redemption upon the occurrence of certain changes affecting taxation in the Philippines, as more particularly specified in the covering offering circular;
e. The 2008 senior notes are not guaranteed or insured by the PDIC and are not deposit liabilities of the Parent Company.
16. Subordinated Notes Payable
On October 15, 2002, the Parent Company’s BOD approved the raising of Lower Tier 2 capital through the issuance in the international capital market of subordinated bonds maturing in 10 years but with a call option exercisable after 5 years subject to the provisions of BSP Circular No. 280. The bonds bear a coupon rate of 9.4% per annum with provision for step-up after five (5) years.
The issuance of the foregoing subordinated notes under the terms approved by the BOD was approved by the BSP under Monetary Board (MB) Resolution No. 1660 dated November 12, 2002, as amended by MB Resolution No. 753 dated May 29, 2003.
Relative to this, on May 16, 2003 and June 5, 2003, the Parent Company issued US$130.0 million and US$70.0 million, respectively, 9.4% subordinated notes due 2013. Among the significant terms and conditions of the issuance of the subordinated notes are:
a. Issue price at 98.7% and 101.5% of their principal amount;
b. The subordinated notes bear interest at the rate of 9.4% per annum from and including May 23, 2003 to but excluding July 1, 2008. Unless the call option is exercised, the interest rate from and including July 1, 2008 to but excluding July 1, 2013 will be reset at the U.S. Treasury rate plus 10.8% per annum. Interest will be payable semi-annually in arrears on January 1 and July 1 of each year, commencing July 1, 2003;
c. The subordinated notes will constitute direct, unconditional, unsecured and subordinated obligations of the Parent Company and will at all times rank pari passu and without any preference among themselves but in priority to the rights and claims of holders of all classes of equity securities of the Parent Company including holders of preference shares (if any);

NOTES TO FINANCIAL STATEMENTS
2006 Equitable PCI Bank Annual Report | 87
d. The Parent Company may redeem the subordinated notes in whole but not in part at redemption price equal to 100% of the principal amount of the subordinated notes together with accrued and unpaid interest on July 1, 2008, subject to the prior consent of the BSP and the compliance by the Parent Company with the prevailing requirements for the granting by the BSP of its consent therefore;
e. Each noteholder by accepting a 2013 subordinated note will irrevocably agree and acknowledge that (i) it may not exercise or claim any right of set-off in respect of any amount owed to it by the Parent Company arising under or in connection with the subordinated notes and (ii) it shall, to the fullest extent permitted by applicable law, waive and be deemed to have waived all such rights of set-off; and
f. The subordinated notes are not deposits of the Parent Company and are not guaranteed or insured by the Parent Company or any party related to the Parent Company or the Philippine Deposit Insurance Corporation (PDIC) and they may not be used as collateral for any loan made by the Parent Company or any of its subsidiaries or affiliates. Also, the subordinated notes may not be redeemed at the option of the noteholders.
As of December 31, 2006 and 2005, the Parent Company was in compliance with the terms and conditions upon which the subordinated notes have been issued.
17. Other Liabilities
This account consists of:
Consolidated Parent Company2006 2005 2006 2005
(In Thousands)Bills purchased - contra P11,977,501 P13,496,370 P11,952,514 P13,476,833Accounts payable 3,607,344 2,902,767 2,174,173 1,718,790Deposits on lease contracts 1,531,877 1,332,267 – –Payment order payable 867,659 792,788 867,659 792,788Unearned income and other deferred credits 712,835 2,843,981 111,396 490,638Sundry and other credits 334,580 284,043 333,619 283,201Margin deposits 168,084 222,682 168,084 222,682Withholding tax payable 160,510 171,784 104,912 113,244Due to Bangko Sentral ng Pilipinas 142,887 51,570 140,676 48,845Derivative liability 113,112 397,480 113,112 397,480Deferred tax liability (Note 24) 111,671 57,139 – –Net pension liability (Note 20) 39,288 5,650 27,177 –Miscellaneous 1,401,205 516,716 1,218,636 1,475,261
P21,168,553 P23,075,237 P17,211,958 P19,019,762

NOTES TO FINANCIAL STATEMENTS
88 | Building for the Future
18. Maturity Profile of Assets and Liabilities
The following tables present the assets and liabilities by contractual maturity and settlement dates as of December 31, 2006 and 2005:
Consolidated2006 2005
Due WithinOne Year
Due BeyondOne Year Total
Due WithinOne Year
Due BeyondOne Year Total
(In Thousands)Financial AssetsCash and other cash
items P8,663,488 P– P8,663,488 P7,541,236 P– P7,541,236Due from BSP 23,262,456, – 23,262,456 7,232,106 – 7,232,106Due from other banks 6,520,845 – 6,520,845 4,676,319 – 4,676,319IBLR and SPURA 26,428,229 1,144,033 27,572,262 16,637,243 1,562,381 18,199,624Securities at FVPL 15,533,191 7,228,228 22,761,419 10,313,484 15,748,398 26,061,882AFS investments 5,766,872 5,030,091 10,796,963 3,503,952 14,048,208 17,552,160HTM investments
(Note 7) 6,703,454 23,199,920 29,903,374 16,339,358 16,157,056 32,496,414Unquoted debt
securities classified as loans (Note 8) 340,493 9,674,007 10,014,500 86,582 2,648,270 2,734,852
Loans and receivables - gross (Note 8) 125,449,373 40,152,469 165,601,842 108,231,222 43,110,935 151,342,157
Investments in subsidiaries and associates – 310,511 310,511 – 290,772 290,772
Other assets: Interoffice float
items - net (Note 12) 2,247,833 – 2,247,833 3,310,905 – 3,310,905
220,916,234 86,739,259 307,655,493 177,872,407 93,566,020 271,438,427Nonfinancial AssetsProperty and
equipment 1,161,446 8,336,685 9,498,131 858,280 8,925,905 9,784,185Investment properties
(Note 11) 205,000 17,882,175 18,087,175 181,535 18,797,087 18,978,622Goodwill – 15,680,124 15,680,124 – 15,680,124 15,680,124Other assets - gross
(Note 12) 13,025,352 – 13,025,352 13,421,342 – 13,421,34214,391,798 41,898,984 56,290,782 14,461,157 43,403,116 57,864,273
Less: Allowance for impairment and credit losses (Note 13) 16,115,084 14,788,674
Unearned interest and discounts 2,689,366 2,462,440
18,804,450 17,251,114P235,308,032 P128,638,243 P345,141,825 P192,333,564 P136,969,136 P312,051,586

NOTES TO FINANCIAL STATEMENTS
2006 Equitable PCI Bank Annual Report | 89
Consolidated2006 2005
Due WithinOne Year
Due BeyondOne Year Total
Due WithinOne Year
Due BeyondOne Year Total
(In Thousands)Financial LiabilitiesDeposit liabilities
(Note 14) P232,220,116 P7,879,134 P240,099,250 P194,733,210 P11,931,035 P206,664,245Bills payable (Note 15) 11,538,389 8,617,468 20,155,857 19,774,196 9,931,539 29,705,735Deposit on lease
contracts 424,0971,107,780
1,531,877 268,303 1,063,964 1,332,267Outstanding
acceptances 960,980 –
960,980 615,944 – 615,944Manager’s checks
and demand drafts outstanding 1,422,304
–1,422,304 912,091 – 912,091
Accrued interest payable 1,051,145
–1,051,145 794,639 – 794,639
Subordinated notes payable – 9,691,113 9,691,113 – 10,474,797 10,474,797
Other liabilities (Note 17):
Bills purchased - contra 11,977,501 – 11,977,501 13,496,370 – 13,496,370
Accounts payable 3,603,122 4,222 3,607,344 2,902,767 – 2,902,767 Derivative liability 113,112 – 113,112 397,480 – 397,480 Payment order
payable 867,659 –
867,659 792,788 – 792,788 Sundry and other
credits 334,580 –
334,580 284,043 – 284,043 Margin deposits 168,084 – 168,084 222,682 – 222,682 Due to BSP 142,887 – 142,887 51,570 – 51,570
264,823,976 27,299,717 292,123,693 235,246,083 33,401,335 268,647,418Nonfinancial
LiabilitiesAccrued taxes and
other expenses 3,111,319 – 3,111,319 2,311,484 – 2,311,484Other Liabilities 2,313,838 111,671 2,425,509 3,538,131 57,139 3,595,270
P270,249,133 P27,411,388 P297,660,521 P241,095,698 P33,458,474 P274,554,172
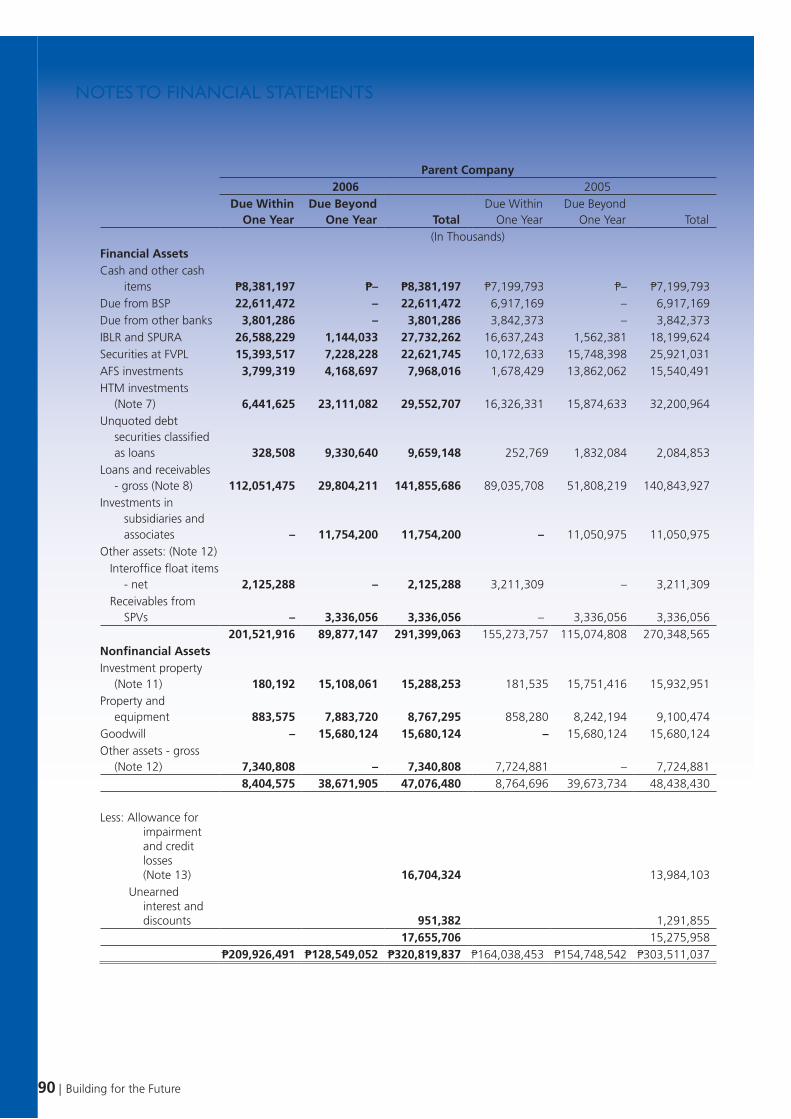
NOTES TO FINANCIAL STATEMENTS
90 | Building for the Future
Parent Company2006 2005
Due WithinOne Year
Due BeyondOne Year Total
Due WithinOne Year
Due BeyondOne Year Total
(In Thousands)Financial AssetsCash and other cash
items P8,381,197 P– P8,381,197 P7,199,793 P– P7,199,793Due from BSP 22,611,472 – 22,611,472 6,917,169 – 6,917,169Due from other banks 3,801,286 – 3,801,286 3,842,373 – 3,842,373IBLR and SPURA 26,588,229 1,144,033 27,732,262 16,637,243 1,562,381 18,199,624Securities at FVPL 15,393,517 7,228,228 22,621,745 10,172,633 15,748,398 25,921,031AFS investments 3,799,319 4,168,697 7,968,016 1,678,429 13,862,062 15,540,491HTM investments
(Note 7) 6,441,625 23,111,082 29,552,707 16,326,331 15,874,633 32,200,964Unquoted debt
securities classified as loans 328,508 9,330,640 9,659,148 252,769 1,832,084 2,084,853
Loans and receivables - gross (Note 8) 112,051,475 29,804,211 141,855,686 89,035,708 51,808,219 140,843,927
Investments in subsidiaries and associates – 11,754,200 11,754,200 – 11,050,975 11,050,975
Other assets: (Note 12) Interoffice float items
- net 2,125,288 – 2,125,288 3,211,309 – 3,211,309 Receivables from
SPVs – 3,336,056 3,336,056 – 3,336,056 3,336,056201,521,916 89,877,147 291,399,063 155,273,757 115,074,808 270,348,565
Nonfinancial AssetsInvestment property
(Note 11) 180,192 15,108,061 15,288,253 181,535 15,751,416 15,932,951Property and
equipment 883,575 7,883,720 8,767,295 858,280 8,242,194 9,100,474Goodwill – 15,680,124 15,680,124 – 15,680,124 15,680,124Other assets - gross
(Note 12) 7,340,808 – 7,340,808 7,724,881 – 7,724,8818,404,575 38,671,905 47,076,480 8,764,696 39,673,734 48,438,430
Less: Allowance for impairment and credit losses (Note 13) 16,704,324 13,984,103
Unearned interest and discounts 951,382 1,291,855
17,655,706 15,275,958P209,926,491 P128,549,052 P320,819,837 P164,038,453 P154,748,542 P303,511,037

NOTES TO FINANCIAL STATEMENTS
2006 Equitable PCI Bank Annual Report | 91
Parent Company2006 2005
Due WithinOne Year
Due BeyondOne Year Total
Due WithinOne Year
Due BeyondOne Year Total
(In Thousands)Financial LiabilitiesDeposit liabilities
(Note 14) P226,557,311 P5,406,117 P231,963,428 P192,142,998 P10,011,157 P202,154,155Bills payable (Note 15) 5,698,032 8,627,088 14,325,120 17,266,628 9,931,539 27,198,167Outstanding
acceptances 960,980 –
960,980 615,944 – 615,944Manager’s checks
and demand drafts outstanding 1,293,530 – 1,293,530 891,704 – 891,704
Accrued interest payable 620,818
–620,818 526,999 – 526,999
Subordinated notes payable – 9,691,113 9,691,113 – 10,474,797 10,474,797
Other liabilities: (Note 17)
Bills purchased - contra 11,952,514
–11,952,514 13,476,833 – 13,476,833
Accounts payable 2,169,951 4,222 2,174,173 1,718,790 – 1,718,790 Payment order
payable 867,659 –
867,659 792,788 – 792,788 Sundry and other
credits 333,619 –
333,619 283,201 – 283,201 Margin Deposits 168,084 – 168,084 222,682 – 222,682 Due to BSP 140,676 – 140,676 48,845 – 48,845 Derivative liability 113,112 – 113,112 397,480 – 397,480
250,876,286 23,728,540 274,604,826 228,384,892 30,417,493 258,802,385Nonfinancial
LiabilitiesAccrued taxes and
other expenses 1,851,859 – 1,851,859 1,580,717 – 1,580,717Other Liabilities 1,462,121 – 1,462,121 2,079,143 – 2,079,143
P254,190,266 P23,728,540 P277,918,806 P232,044,752 P30,417,493 P262,462,245
19. Equity
The Parent Company’s capital stock consists of:
2006 2005 2004(In Thousands)
Common stock - P10 par value Authorized - 1,000,000,000 shares Issued - 727,003,345 shares P7,270,033 P7,270,033 P7,270,033
The Parent Company shares are listed in the PSE.

NOTES TO FINANCIAL STATEMENTS
92 | Building for the Future
As of December 31, 2006 and 2005, surplus reserves consist of (in thousands):
2006 2005 2004Reserve for trust business P325,219 P277,672 P229,631Contingencies 261,428 261,428 261,428Self-insurance 15,000 15,000 15,000Other surplus reserves 4,296 4,296 4,297Total P605,943 P558,396 P510,356
Surplus reserves for self-insurance represents the amount set aside to cover for losses due to fire, defalcation by and other unlawful acts of the Parent Company’s personnel or third parties.
Parent Company Shares Held by a Subsidiary account represents 78,807,098 shares of the Parent Company purchased by EBCII, its investment house subsidiary. These are carried at acquisition cost of P7.47 billion. In the Parent Company financial statements, such shares are shown as advances to subsidiaries and are carried at the same amount. In its letter dated October 25, 2005, the BSP required EBCII to sell the EPCIB shares or consider the reversal of the accounting entries in the books of EPCIB and EBCII pertaining to these transactions as options for retiring the shares. On March 31, 2006, the Parent Company’s BOD approved the reversal of the accounting entries in the books of the Parent Company to effect the cancellation of its advances to EBCII. The BOD agreed, with the confirmation of its external legal counsel, that such cancellation is legally feasible and will serve to restore to the Parent Company the shares held by its subsidiary against a corresponding elimination of the Parent Company’s advances to EBCII. On August 31, 2006, EBCII accepted the binding offer of Ms. Teresita T. Sy on behalf of the Sy Family and/or their nominees in keeping with the intent of the Parent Company to have the shares sold as early as possible in a manner that assures fairness and transparency, and in compliance with the directive of the BSP. The sale of 78,807,098 common shares of the Parent Company at P92.00 per share or a total consideration of P7,250,253,016 is payable in cash as follows:
Downpayment on closing date 10% P725,025,301.608 months from closing date 10% 725,025,301.6016 months from closing date 10% 725,025,301.6024 months from closing date 70% 5,075,177,111.20
On September 19, 2006, the Parent Company’s BOD accepted the binding offer of Ms. Teresita T. Sy. On September 25, 2006, EBCII entered into a Sale and Purchase of Shares Agreement with SM Investments Corporation, in concert with its affiliates covering the 78,807,098 common shares of the Parent Company. On October 2, 2006, the closing date, subject shares were cross-sold in the PSE subject to the terms approved by the respective BODs of EBCII and the Parent Company.
On November 6, 2006, the respective BOD of the Parent Company and Banco de Oro, Inc. (BDO) approved and endorsed to their respective shareholders a Plan of Merger for the merger of the Parent Company and BDO with BDO as the surviving entity. The merger shall be effected through a swap of shares whereby BDO shall issue 1.8 of its share for each Parent Company’s share. The Merged Bank will be known as Banco de Oro - EPCI, Inc.
The Plan of Merger was approved by the respective shareholders of the Parent Company and BDO in separate meetings on December 27, 2006. Thereafter, the Plan of Merger and related documents shall be submitted to SEC and BSP for approval. The Parent Company expects the legal merger to be effected within the first quarter of 2007.
In 2005, ESB’s 2004 financial statements were restated to charge against the 2004 beginning Surplus the following: (a) capital deficiency of MDB as of December 31, 2003 amounting to P764.0 million (and include the 2004 restated results of operations amounting to P293.5 million in the 2004 results of operations of the merged entity); and (b) unamortized capitalized losses of MDB in 2004 amounting to P198.6 million (and reverse the amortization of such capitalized net losses in 2004 amounting to P39.7 million).

NOTES TO FINANCIAL STATEMENTS
2006 Equitable PCI Bank Annual Report | 93
On January 18, 2005, the Parent Company’s BOD approved the declaration of cash dividends at the rate of sixty centavos (P0.60) per share or P436.2 million. Such declaration was approved by BSP on April 1, 2005.
The determination of the Parent Company’s compliance with regulatory requirements and ratios is based on the amount of the Parent Company’s unimpaired capital (regulatory capital) as reported to the BSP, which is determined on the basis of regulatory accounting practices which differ from PFRS in some respects.
Specifically, under existing banking regulations, the combined capital accounts of each commercial bank should not be less than an amount equal to ten percent (10%) of its risk assets. Risk assets is defined as total assets less cash on hand, due from BSP, loans covered by hold-out on or assignment of deposits, loans or acceptances under letters of credit to the extent covered by margin deposits and other non-risk items determined by the MB of the BSP.
Under BSP Circular No. 360, effective July 1, 2003, the capital-to-risk assets ratio (CAR) is to be inclusive of a market risk charge. Using this formula, the CAR of the Group was 15.5% and 11.3% as of December 31, 2006 and 2005, respectively, while that of the Parent Company was 11.2% and 10.0% (as restated), respectively.
In compliance with BSP regulations, 10% of the Parent Company’s profit from trust business is appropriated to surplus reserve. This annual appropriation is required until the surplus reserves for trust business equals 20% of the Parent Company’s authorized capital stock.
20. Retirement Plans
The Group has separate funded noncontributory defined benefit retirement plans covering substantially all its officers and regular employees. Under these retirement plans, all covered officers and employees are entitled to cash benefits after satisfying certain age and service requirements.
The Group’s annual contribution to the retirement plan consists of a payment covering the current service cost, amortization of the unfunded actuarial accrued liability and interest on such unfunded actuarial liability.
The following table shows the actuarial valuation results of the Parent Company and some of its subsidiaries as of January 1, 2006 and 2005:
January 1, 2006Actuarial Assumptions
Date of Actuarial Valuation Report
Average Remaining
Working Life
Expected Return on
AssetsSalary Rate
IncreaseDiscount
Rate
Future Pension
IncreasesParent Company January 1, 2006 15 9% 5% 11% –PCI Leasing January 1, 2006 15 9% 5% 11% –ECN January 1, 2006 26 9% 12% 12% –ESB January 1, 2006 14 9% 5% 11% –PCI Capital January 1, 2006 14 9% 5% 11% –EIBI January 1, 2006 14 9% 5% 11% –PCIB Securities January 1, 2006 11 9% 5% 11% –PCI Automation January 1, 2006 14 9% 5% 11% –EDCI January 1, 2006 15 9% 5% 11% –Maxicare January 1, 2006 30 11% 13% 12% –

NOTES TO FINANCIAL STATEMENTS
94 | Building for the Future
January 1, 2005Actuarial Assumptions
Date of Actuarial Valuation Report
Average Remaining
Working Life
Expected Return on
AssetsSalary Rate
IncreaseDiscount
Rate
Future Pension
IncreasesParent Company January 1, 2005 15 9% 5% 14% –PCI Leasing January 1, 2006 15 9% 5% 14% –ECN January 1, 2006 26 11% 10% 12% –ESB January 1, 2006 14 9% 5% 14% –PCI Capital January 1, 2006 14 9% 5% 14% –EIBI January 1, 2006 15 9% 5% 14% –PCIB Securities January 1, 2006 11 9% 5% 14% –PCI Automation January 1, 2006 14 9% 5% 14% –EDCI January 1, 2006 15 9% 5% 14% –Maxicare January 1, 2006 30 11% 13% 12% –
Discount rates used to arrive at the present value of the obligation of the Parent Company and some of its subsidiaries as of December 31, 2006 and 2005 are as follows:
December 312006 2005
Parent Company 7% 11%PCI Leasing 7% 11%ECN 8% 12%ESB 7% 11%PCI Capital 7% 11%EIBI 7% 11%PCIB Securities 7% 11%PCI Automation 7% 11%EDCI 7% 11%Maxicare 7% 12%
The overall expected rate of return on plan assets is determined based on the market prices prevailing on that date applicable to the period over which the obligation is to be settled.
The prepaid retirement cost recognized in the Group and the Parent Company’s statement of condition is as follows (in thousands):
Consolidated Parent2006 2005 2006 2005
Present value of funded obligation P3,370,883 P1,691,015 P3,053,866 P1,478,560Fair value of plan assets (1,474,584) (1,189,181) (1,183,969) (950,039)
1,896,299 501,834 1,869,897 528,521Unrecognized transition liability (416,806) (555,654) (416,460) (555,279)Unrecognized actuarial losses (1,503,510) (58,692) (1,426,260) (34,658)Unrecognized actuarial assets due to ceiling test 8,709 5,519 – –Net pension liability (asset) (P15,308) (P106,993) P27,177 (P61,416)

NOTES TO FINANCIAL STATEMENTS
2006 Equitable PCI Bank Annual Report | 95
Net pension liability (asset) is included in the statement of condition as follows (in thousands):
Consolidated Parent2006 2005 2006 2005
Net pension asset (P54,596) (P112,643) (P–) (P61,416)Net pension liability 39,288 5,650 27,177 –
(P15,308) (P106,993) P27,177 (P61,416)
The movements in the prepaid retirement cost recognized in the Group and the Parent Company’s statement of condition follow (in thousands):
Consolidated Parent2006 2005 2006 2005
Balance at beginning of year (P106,993) (P48,831) (P61,416) P–Retirement expense 348,856 363,960 318,757 349,147Contribution paid (257,171) (422,122) (230,164) (410,563)Balance at end of year (P15,308) (P106,993) P27,177 (P61,416)
Changes in the present value of the defined benefit obligation are as follows (in thousands):
Consolidated Parent2006 2005 2006 2005
Balance at beginning of year P1,691,015 P1,384,391 P1,478,560 P1,253,712Interest cost 186,972 193,815 162,641 175,520Current service cost 127,127 99,496 102,799 85,172Benefits paid (216,398) (192,524) (205,169) (166,483)Actuarial loss 1,582,167 205,837 1,515,035 130,639Balance at end of year P3,370,883 P1,691,015 P3,053,866 P1,478,560
The movements in the fair value of plan assets recognized follow (in thousands):
Consolidated Parent2006 2005 2006 2005
Balance at beginning of year P1,189,181 P771,396 P950,039 P559,613Expected return on plan assets 108,046 70,985 85,503 50,365Contribution paid by employer 257,171 422,122 230,164 410,563Benefits paid (216,398) (192,524) (205,169) (166,483)Actuarial gains 136,584 117,202 123,432 95,981Balance at end of year P1,474,584 P1,189,181 P1,183,969 P950,039
The Group and the Parent Company expects to contribute P581.8 million and P553.4 million, respectively, to its defined benefit pension plan in 2007.

NOTES TO FINANCIAL STATEMENTS
96 | Building for the Future
The major categories of plan assets as a percentage of the fair value of total plan assets are as follows:
Consolidated Parent2006 2005 2006 2005
Debt instruments 73% 71% 71% 70%Investments in real estate 11% 14% 14% 18%Equity instruments 10% 7% 10% 7%Other assets 6% 8% 5% 5%
The Group and the Parent Company opted to adopt the prospective approach in accounting for transition liability of P694.3 million and P694.1 million, respectively, when it adopted PAS 19 in 2005. Such amount is being amortized over five (5) years beginning January 1, 2005.
The amounts included in Compensation and Fringe Benefits in the Group and Parent Company’s statements of income are as follows (in thousands):
Consolidated Parent2006 2005 2006 2005
Current service cost P127,127 P99,496 P102,799 P85,172Interest cost 186,972 193,815 162,641 175,520Expected return on plan assets (108,046) (70,985) (85,503) (50,365)Amortization of transition liability 138,850 138,850 138,820 138,820Net actuarial gain (loss) recognized during the year 764 (703) – –Effect of asset ceiling test 3,189 3,487 – –
P348,856 P363,960 P318,757 P349,147Actual return on plan assets P243,690 P188,188 P208,936 P146,346
Amounts for the current and previous years are as follows (in thousands):
Consolidated Parent2006 2005 2006 2005
Present value of funded obligation P3,370,883 P1,691,015 P3,053,866 P1,478,560Fair value of plan assets (1,474,584) (1,189,181) (1,183,969) (950,039)Deficit 1,896,299 501,834 1,869,897 528,521Experience adjustment on plan assets (136,584) (117,202) (123,432) (95,981)Experience adjustment on plan liabilities 526,439 (184,967) 530,713 (212,336)
21. Lease Contracts
The Parent Company leases the premises occupied by some of its branches, including those of its subsidiaries. The lease contracts are for periods ranging from 1 to 20 years and are renewable at the Group’s option under certain terms and conditions. Various lease agreements include escalation clauses, most of which bear an annual rent increase of 5% to 10%. As of December 31, 2006 and 2005, the Group has no contingent rent payable.
Total rent expense (included under Occupancy and other equipment-related expenses) incurred by the Group amounted to P702.2 million P603.1 million and P581.5 million in 2006, 2005 and 2004, respectively, of which P521.5 million, P502.1 million and P495.5 million in 2006, 2005 and 2004, respectively, was incurred by the Parent Company.

NOTES TO FINANCIAL STATEMENTS
2006 Equitable PCI Bank Annual Report | 97
Future minimum lease rentals payable under non-cancelable operating leases follow:
Consolidated Parent2006 2005 2006 2005
(In Thousands)Within one year P299,142 P267,120 P271,613 P251,085After one year but not more than five years 838,684 853,559 833,314 836,591After more than five years 219,564 233,367 182,739 233,367
P1,357,390 P1,354,046 P1,287,666 P1,321,043
The Group has entered into commercial property leases on the Group’s surplus offices. These non-cancelable leases have remaining non-cancelable lease terms of between 1 and 15 years.
Total rent income earned (included under Other operating income) by the Group amounted to P124.6 million, P110.2 million and P128.1 million in 2006, 2005 and 2004, respectively, of which P141.5 million, P128.2 million and P138.0 million in 2006, 2005 and 2004, respectively, were earned by the Parent Company.
Future minimum rentals receivable under non-cancelable operating leases are as follows:
Consolidated Parent2006 2005 2006 2005
(In Thousands)Within one year P97,990 P99,551 P94,597 P95,393After one year but not more than five years 137,860 145,993 137,860 137,043After more than five years 7,459 7,612 7,459 7,612
P243,309 P253,156 P239,916 P240,048
22. Other Operating Income
This account consists of:
Consolidated Parent Company2006 2005 2004 2006 2005 2004
(In Thousands)Gain on disposal of investment
properties P926,181 P487,459 P83,394 P848,215 P389,649 P82,895Trust fees (Note 25) 621,243 629,570 724,335 621,243 629,570 724,335Rent of investment properties
and equipment (Note 21) 571,714 599,095 128,140 141,536 128,221 137,996
Gain on sale of property and equipment 106,953 90,961 34,085 89,355 85,809 26,947
Dividends 100,457 150,163 61,479 1,120,052 460,635 1,156,607Rent from safety deposit boxes 25,688 19,401 19,831 24,911 19,401 19,831Others 1,071,172 861,482 1,642,870 78,754 461,553 494,523
P3,423,408 P2,838,131 P2,694,134 P2,924,066 P2,174,838 P2,643,134

NOTES TO FINANCIAL STATEMENTS
98 | Building for the Future
23. Other Expenses
This account consists of:
Consolidated Parent Company2006 2005 2004 2006 2005 2004
(In Thousands)Transaction dues P474,337 P386,981 P458,219 P174,621 P178,744 P174,561Insurance - PDIC 422,581 398,752 376,991 407,350 378,603 354,417Litigation and assets acquired 376,679 327,131 360,982 321,718 298,283 297,357Professional fees 382,341 263,906 254,204 174,614 146,220 152,071Communication 342,045 364,903 373,567 235,857 274,259 261,825Entertainment, amusement
and recreation (EAR) (Note 24) 291,031 198,787 170,872 262,787 174,431 148,876
Freight 286,177 140,863 28,672 263,265 128,269 20,791Traveling 220,107 216,037 199,442 137,810 128,502 120,153Advertising 219,676 570,121 486,507 69,195 81,708 52,979Stationery and Office Supplies 207,409 193,792 174,061 127,738 126,054 93,060Fuel and Lubricant 187,103 182,563 165,253 142,144 138,936 126,839Assessment Fees 141,417 147,571 138,932 141,206 147,351 138,708Others 1,553,563 575,584 508,465 918,456 388,528 371,349
P5,104,466 P3,966,991 P3,696,167 P3,376,761 P2,589,888 P2,312,986
24. Income and Other Taxes
Under Philippine tax laws, the RBU of the Parent Company and its domestic subsidiaries are subject to percentage and other taxes (presented as Taxes and Licenses in the statement of income) as well as income taxes. Percentage and other taxes paid consist principally of gross receipts tax or GRT and documentary stamp taxes. Income taxes include the corporate income tax, as discussed below, and final taxes paid at the rate of 20%, which is a final withholding tax on gross interest income from government securities and other deposit substitutes.
Under current tax regulations, the Regular Corporate Income Tax (RCIT) rate is 32%. Interest allowed as a deductible expense is reduced by an amount equivalent to 38% of interest income subjected to final tax. In addition, current tax regulations provide for the ceiling on the amount of EAR that can be claimed as a deduction against taxable income. Under the regulation, EAR allowed as deductible expense for a service company like the Parent Company is limited to the actual EAR paid or incurred but not to exceed 1% of net revenue. The regulations also provide for Minimum corporate Income Tax (MCIT) of 2% on modified gross income and allow net operating loss carry over (NOLCO). The Parent Company and Group MCIT and NOLCO may be applied against the Parent Company’s and Group’s income tax liability and taxable income, respectively, over a three-year period from the year of inception.
RA No. 9337, An Act Amending National Internal Revenue Code, provides that the RCIT rate shall be 35% until December 31, 2008. Starting January 1, 2009 the RCIT rate shall be 30%. The interest allowed as a deductible expense is reduced by 42% (formerly 38%) of interest income subjected to final tax under the 35% corporate tax regime and 33% under the 30% corporate tax regime. It also provides for the change in GRT rate from 5% to 7%. However, such amendments were the subject of a temporary restraining order by the Supreme Court. On October 8, 2005, the Supreme Court ruled that RA No. 9337 is constitutional and effective on November 1, 2005.

NOTES TO FINANCIAL STATEMENTS
2006 Equitable PCI Bank Annual Report | 99
FCDU offshore income (income from non-residents) is tax-exempt while gross onshore income (income from residents) is subject to 10% income tax. In addition, interest income on deposit placements with other FCDUs and offshore banking units (OBUs) is taxed at 7.5%. RA No. 9294, which became effective in May 2004, provides that the income derived by the FCDU from foreign currency transactions with non-residents, OBUs, local commercial banks including branches of foreign banks is tax-exempt while interest income on foreign currency loans from residents other than OBUs or other depository banks under the expanded system is subject to 10% income tax.
Provision for (benefit from) income tax consists of:
Consolidated Parent Company2006 2005 2004 2006 2005 2004
(In Thousands)Current* P1,052,770 P664,896 P768,759 P569,363 P493,068 P366,524Deferred 503,115 1,511,540 (1,844,489) 476,298 1,210,387 (1,924,393)
P1,555,885 P2,176,436 (P1,075,730) P1,045,661 P1,703,455 (P1,557,869)
* Includes income taxes of foreign subsidiaries and branches
Components of the net deferred tax assets (included in Other Assets) follow:
Consolidated Parent2006 2005 2006 2005
(In Thousands)Credited to operationsTax effects of: Allowance for impairment losses P4,811,267 P4,103,747 P4,571,780 P3,817,815 NOLCO 766,849 1,933,046 634,508 1,828,595 Unamortized past service costs 308,637 297,067 302,655 292,580 Capitalized interest (100,133) (102,904) (100,133) (102,904) Lease income/expense differential 97,965 (35,344) 78,641 93,475 Investment properties 22,602 (159,105) 104,357 (159,105) Others (47,313) 135,909 (62,416) 48,357MCIT 16,820 187,320 – 186,877
5,876,694 6,359,736 5,529,392 6,005,690Charged against equity Revaluation increment in property (578,407) (578,407) (578,407) (578,407)
P5,298,287 P5,781,329 P4,950,985 P5,427,283
Components of the net deferred tax liabilities (included in Other Liabilities) follow:
Consolidated Parent2006 2005 2006 2005
(In Thousands)Credited to operationsTax effects of: Lease income/expense differential P148,581 P128,839 P– P– Allowance for impairment losses (91,140) (74,712) – – Unamortized past service costs (1,008) (223) – – Fair value increase of investment properties (1,317) – – – Others 10,674 (8,187) – –
65,790 45,717 – –Charged against equity – – AFS unrealized gain 45,881 11,422 – –
P111,671 P57,139 P– P–

NOTES TO FINANCIAL STATEMENTS
100 | Building for the Future
The Parent Company and certain subsidiaries did not recognize deferred tax assets on the following temporary differences:
Consolidated Parent2006 2005 2006 2005
(In Thousands)NOLCO P6,289,722 P2,449,625 P5,697,607 P2,143,843Allowance for impairment losses 1,930,428 368,174 – –Accrued leave credits 374,501 349,501 374,501 349,501MCIT 233,896 6,213 217,156 –Others – 71,653 – 71,653
P8,828,547 P3,245,166 P6,289,264 P2,564,997
Management believes that it is not likely that these temporary differences will be realized in the future.
A reconciliation between the statutory income tax and provision for (benefit from) income tax follows:
Consolidated Parent Company2006 2005 2004 2006 2005 2004
Statutory income tax 35.00% 32.50% 32.00% 35.00% 32.50% 32.00%Tax effects of: Nondeductible expenses 27.62 6.28 7.77 61.27 7.72 27.46 FCDU income (28.73) (20.96) (51.90) (50.41) (25.77) (93.35) Tax-exempt and tax-paid income (25.90) (12.55)
(32.55) (54.22) (15.43)
(47.35)
Nondeductible interest expense 4.60 3.48
17.89 8.08 4.28
13.86
Others - net 18.51 35.00 (48.01) 36.98 38.80 (127.45)Provision for (benefit from) income tax 31.10% 43.75%
(74.80%) 36.70% 42.10%
(194.83%)
Income tax payable included under Accrued Taxes and Other Expenses amounted to P344.6 million and P302.3 million for the Group and P76.6 million and P89.9 million for the Parent Company as of December 31, 2006 and 2005, respectively. Allowable EAR of the Parent Company for tax deduction amounted to P188.5 million and P175.8 million (included in Other expenses in the statement of income) in 2006 and 2005, respectively.
The details of the Group’s NOLCO and MCIT follow:
Inception Year Amount Used/Expired Balance Expiry Year(In Thousands)
NOLCO 2003 P1,211,421 P1,211,421 P– 2006 2004 316,198 – 316,198 2007 2005 3,193,948 – 3,193,948 2008 2005 3,910,006 – 3,910,006 2010 2006 1,320,592 – 1,320,592 2009
P9,952,165 P1,211,421 P8,740,744(Forward)

NOTES TO FINANCIAL STATEMENTS
2006 Equitable PCI Bank Annual Report | 101
Inception Year Amount Used/Expired Balance Expiry Year(In Thousands)
MCIT 2003 P28,316 P28,316 P– 2006 2004 80,503 – 80,503 2007 2005 84,714 – 84,714 2008 2006 85,499 – 85,499 2009
P279,032 P28,316 P250,716
The details of the Parent Company’s NOLCO and MCIT follow:
Inception Year Amount Used/Expired Balance Expiry Year(In Thousands)
NOLCO 2003 P1,182,806 P1,182,806 P– 2006 2004 94,530 – 94,530 2007 2005 2,670,856 – 2,670,856 2008 2005 3,910,006 – 3,910,006 2010 2006 1,137,242 – 1,137,242 2009
P8,995,440 P1,182,806 P7,812,634MCIT 2003 P27,694 P27,694 P– 2006 2004 73,385 – 73,385 2007 2005 72,809 – 72,809 2008 2006 70,962 – 70,962 2009
P244,850 P27,694 P217,156
25. Trust Operations
Securities and other properties (other than deposits) held by the Parent Company in fiduciary or agency capacities for clients (and beneficiaries) are not included in the accompanying statement of condition since these are not assets of the Parent Company.
Government securities with total face value of P808.7 billion and P981.8 million as of December 31, 2006 and 2005, respectively, are deposited with the BSP in compliance with existing banking regulations relative to the trust functions of the Parent Company. The carrying values of the government securities with the BSP amounted to P827.2 billion and P986.2 million as of December 31, 2006 and 2005.
Additionally, a certain percentage of the Parent Company’s trust income is transferred to Surplus Reserve until such reserve for trust functions amounts to 20% of the Parent Company’s authorized capital stock. No part of such Surplus Reserve shall at any time be paid out as dividends.
Also, in accordance with BSP regulations, the common trust funds managed by the Parent Company’s trust department maintain reserve deposit account with the BSP and government securities to meet the reserve requirement on peso-denominated common trust funds and other similarly managed funds. As of December 31, 2006 and 2005, the balance of the BSP reserve deposit account amounted to P78.0 million and P2.7 billion, respectively, while government securities amounted to P22.1 million and P3.0 billion, respectively.

NOTES TO FINANCIAL STATEMENTS
102 | Building for the Future
26. Segment Information
The Group’s operating businesses are organized and managed separately according to the nature of services provided and the different markets served with a segment representing a strategic business unit. The Group’s business segments are as follows:
Consumer and Retail Banking - principally handling individual customers’ deposits, and providing consumer type loans, overdrafts, credit card facilities and fund transfer facilities;
Commercial Banking - principally handling commercial customers’ deposits, and providing products and services to its commercial middle market customers, mainly small-medium-sized enterprises;
Corporate Banking - principally handling loans and other credit facilities and deposit and current accounts for corporate and institutional customers;
Investment Banking - principally arranging structured financing, and providing services relating to privatizations, initial public offerings, mergers and acquisitions; and
Treasury - principally providing money market, trading and treasury services, as well as the management of the Parent Company’s funding operations by use of treasury bills, government securities and placements and acceptances with other banks, through treasury and wholesale banking.
These segments are the basis on which the Group reports its primary segment information. Other operations of the Group comprise the operations and financial control groups. Transactions between segments are conducted at estimated market rates on an arm’s length basis. Interest is charged against or credited to business segments based on a pool rate, which approximates the marginal cost of funds.
Segment information of the Group for the year ended December 31, 2006, 2005 and 2004 follows:
2006
Consumer and Retail
BankingCommercial
BankingCorporate
BankingInvestment
Banking Treasury Others Total
Gross income P7,987,313 P5,246,980 P3,640,728 P440,851 P10,260,664 P4,552,176 P32,128,712
Segment result P4,534,605 P919,902 P1,030,771 P299,885 P3,528,486 P441,466 P10,755,115
Unallocated costs 5,775,637
Profit from operations 4,979,478
Equity in net income of associates 22,739
Income before tax 5,002,217
Income tax expense (1,555,885)
Minority interest (181,153)
Net income for the year attributable to the Parent Company P3,265,179
Other Information
Segment assets P46,323,463 P54,133,155 P53,963,305 P3,077,024 P111,857,861 P50,657,824 P320,012,632
Intra-segment assets 4,850,617
Investments in associates 204,227
Unallocated assets 20,074,349
Total assets P345,141,825
Segment liabilities P43,412,080 P48,340,215 P43,566,943 P2,970,873 P112,087,482 P47,282,928 P297,660,521
Other Segment Information
Depreciation and amortization P789,190 P40,034 P7,420 P5,745 P54,653 P502,095 P1,399,137
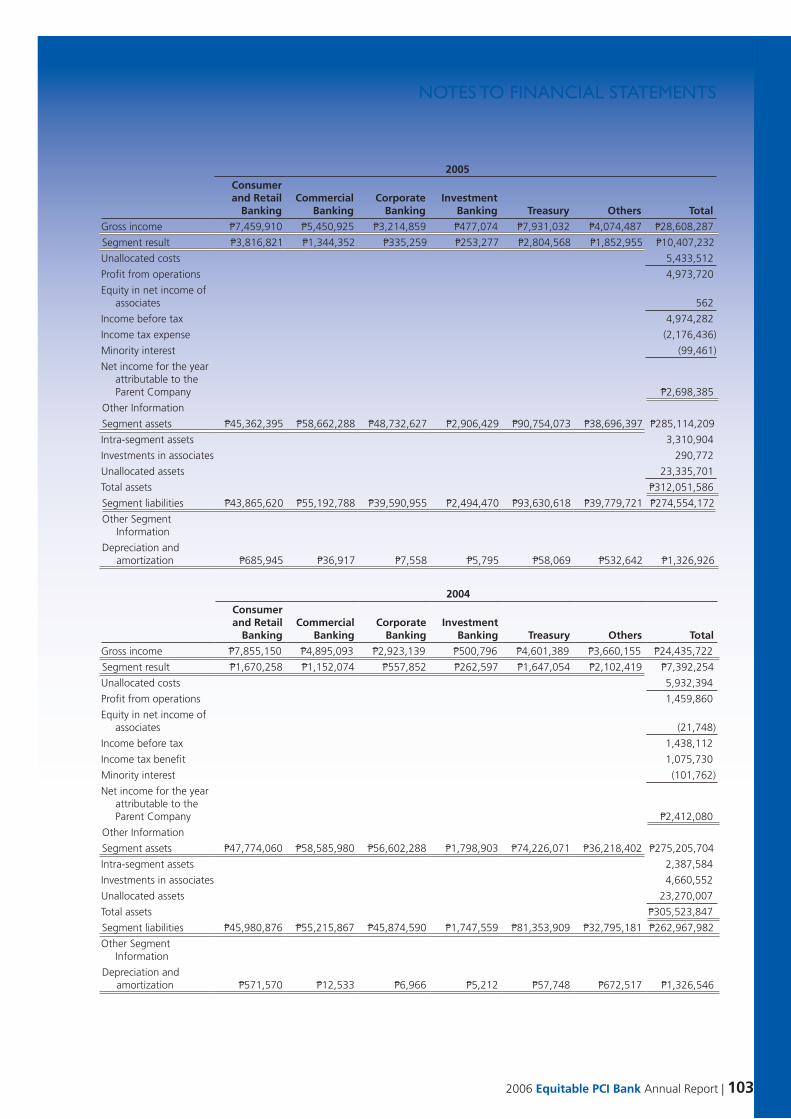
NOTES TO FINANCIAL STATEMENTS
2006 Equitable PCI Bank Annual Report | 103
2005
Consumer and Retail
BankingCommercial
BankingCorporate
BankingInvestment
Banking Treasury Others Total
Gross income P7,459,910 P5,450,925 P3,214,859 P477,074 P7,931,032 P4,074,487 P28,608,287
Segment result P3,816,821 P1,344,352 P335,259 P253,277 P2,804,568 P1,852,955 P10,407,232
Unallocated costs 5,433,512
Profit from operations 4,973,720
Equity in net income of associates 562
Income before tax 4,974,282
Income tax expense (2,176,436)
Minority interest (99,461)
Net income for the year attributable to the Parent Company P2,698,385
Other Information
Segment assets P45,362,395 P58,662,288 P48,732,627 P2,906,429 P90,754,073 P38,696,397 P285,114,209
Intra-segment assets 3,310,904
Investments in associates 290,772
Unallocated assets 23,335,701
Total assets P312,051,586
Segment liabilities P43,865,620 P55,192,788 P39,590,955 P2,494,470 P93,630,618 P39,779,721 P274,554,172
Other Segment Information
Depreciation and amortization P685,945 P36,917 P7,558 P5,795 P58,069 P532,642 P1,326,926
2004
Consumer and Retail
BankingCommercial
BankingCorporate
BankingInvestment
Banking Treasury Others Total
Gross income P7,855,150 P4,895,093 P2,923,139 P500,796 P4,601,389 P3,660,155 P24,435,722
Segment result P1,670,258 P1,152,074 P557,852 P262,597 P1,647,054 P2,102,419 P7,392,254
Unallocated costs 5,932,394
Profit from operations 1,459,860
Equity in net income of associates (21,748)
Income before tax 1,438,112
Income tax benefit 1,075,730
Minority interest (101,762)
Net income for the year attributable to the Parent Company P2,412,080
Other Information
Segment assets P47,774,060 P58,585,980 P56,602,288 P1,798,903 P74,226,071 P36,218,402 P275,205,704
Intra-segment assets 2,387,584
Investments in associates 4,660,552
Unallocated assets 23,270,007
Total assets P305,523,847
Segment liabilities P45,980,876 P55,215,867 P45,874,590 P1,747,559 P81,353,909 P32,795,181 P262,967,982
Other Segment Information
Depreciation and amortization P571,570 P12,533 P6,966 P5,212 P57,748 P672,517 P1,326,546

NOTES TO FINANCIAL STATEMENTS
104 | Building for the Future
27. Commitments and Contingent Liabilities
In the normal course of business, the Group enters into various commitments and incurs contingent liabilities that are not presented in the accompanying financial statements. The Group does not anticipate any material losses as a result of these commitments and contingent liabilities.
The following is a summary of the commitments and contingent liabilities at their equivalent peso contractual amounts as of December 31, 2006 and 2005:
Consolidated Parent2006 2005 2006 2005
(In Thousands)Trust department accounts (Note 25) P73,226,292 P109,694,557 P73,226,292 P109,694,557Unused commercial letters of credit 9,884,944 8,182,676 9,884,944 8,167,676Inward bills for collection 9,803,298 3,078,970 9,803,298 3,078,970Guarantees issued 2,668,030 443,320 2,668,030 443,320Committed credit line 1,043,326 625,603 1,043,326 625,603Late deposits/payments received 647,541 665,908 638,260 660,259Outward bills for collection 514,647 846,962 512,988 846,777Traveler’s check unsold 123,003 136,590 123,003 136,590Confirmed export letters of credit 25,445 22,791 25,445 22,791Others 63,159 3,526 60,642 404
The Group has pending claims and/or is a defendant in legal actions arising from normal business activities including sale of a subsidiary. Management and its legal counsel believe that these actions are without merit or that the ultimate liability, if any, resulting from such actions will not materially affect the Group’s financial position.
The Parent Company has received tax assessments from the Bureau of Internal Revenue on two industry issues. In addition, the Parent Company has pending tax assessments from the BIR on FCDU taxation, which is also an industry issue. The Parent Company, through its tax counsels, is contesting these assessments and pre-assessments on the ground that the factual situations were not considered which, if considered, will not give rise to material tax deficiencies.
28. Related Party Transactions
Parties are considered to be related if one party has the ability, directly or indirectly, to control the other party or exercise significant influence over the other party in making financial and operating decisions. Parties are also considered to be related if they are subjected to common control or common significant influence. Related parties may be individuals or corporate entities. Transactions between related parties are based on terms similar to those offered to non-related parties.
In the ordinary course of business, the Group has loan transactions with investees and with certain directors, officers, stockholders and related interests (DOSRI). Existing banking regulations limit the amount of individual loans to DOSRI, 70% of which must be secured, to the total of their respective deposits and book value of their respective investments in the Group. In the aggregate, loans to DOSRI generally should not exceed the respective total regulatory capital or 15% of total loan portfolio, whichever is lower.

NOTES TO FINANCIAL STATEMENTS
2006 Equitable PCI Bank Annual Report | 105
BSP Circular No. 423 dated March 15, 2004 amended the definition of DOSRI accounts. The following table shows information relating to the loans, other credit accommodations and new guarantees classified as DOSRI accounts under regulations existing prior to said circular, and new DOSRI loans, other credit accommodations granted under said circular as of December 31, 2006 and 2005 (amounts in thousands):
Consolidated Parent2006 2005 2006 2005
Total outstanding DOSRI accounts P905,635 P1,037,822 P905,635 P1,037,822Percent of DOSRI accounts granted prior to effectivity
of BSP Circular No. 423 to total loans 0.25% 0.58% 0.29% 0.62%Percent of DOSRI accounts granted after effectivity of
BSP Circular No. 423 to total loans 0.26% 0.10% 0.30% 0.10%Percent of DOSRI accounts to total loans 0.52% 0.67% 0.60% 0.73%Percent of unsecured DOSRI accounts to total DOSRI
accounts 19.37% 16.96% 19.37% 16.96%Percent of past due DOSRI accounts to total DOSRI
accounts − − − −Percent of nonaccruing DOSRI accounts to total
DOSRI accounts 17.87% 15.32% 17.87% 15.32%
On January 31, 2007, BSP Circular No. 560 was issued providing the rules and regulations that govern loans, other credit accommodations and guarantees granted to subsidiaries and affiliates of banks and quasi-banks. Under the said circular, the total outstanding exposures to each of the bank’s subsidiaries and affiliates shall not exceed 10% of bank’s net worth, the unsecured portion of which shall not exceed 5% of such net worth. Further, the total outstanding exposures to subsidiaries and affiliates shall not exceed 20% of the net worth of the lending bank. BSP Circular No. 560 is effective February 15, 2007.
The following table shows information relating to the loans, other credit accommodations and guarantees, as well as availments of previously approved loans and committed credit lines not considered DOSRI accounts prior to the issuance of said circular but are allowed a transition period of two years from the effectivity of said circular or until said loan, other credit accommodations and guarantees become past due, or are extended, renewed or restructured, whichever comes later (amounts in thousands):
Consolidated Parent2006 2005 2006 2005
Total outstanding non-DOSRI accounts granted prior to BSP Circular No. 423 P11,384,258 P15,151,472 P11,384,258 P15,151,472
Percent of unsecured non-DOSRI accounts granted prior to BSP Circular No. 423 to total loans 6.48% 9.83% 7.51% 10.60%
Percent of past due non-DOSRI accounts granted prior to BSP Circular No. 423 to total loans − − − −
Percent of nonaccruing non-DOSRI accounts granted prior to BSP Circular No. 423 to total loans 6.01% 8.27% 6.97% 8.92%
Other related party transactions entered into under the normal course of business include the availment of computer services, securities and currency trading, insurance brokerage and management contract services rendered by certain member companies of the Group.
The significant intercompany transactions and outstanding balances of the Group were eliminated in consolidation.
Total interest income on DOSRI loans amounted to P120.2 million, P193.0 million and P1.8 million in 2006, 2005 and 2004, respectively.
Deposit liabilities of associates and other related parties amounted to P31.4 million and P31.7 million as of December 31, 2006 and 2005, respectively. Related interest expense amounted to P0.1 million both in 2006 and 2005.
The retirement fund of the Parent Company’s employees amounting to P1,111.3 million and P950.0 million as of December 31, 2006 and 2005, respectively, is being managed by the Parent Company’s Trust Banking Group.

NOTES TO FINANCIAL STATEMENTS
106 | Building for the Future
The following table shows the related party transactions included in the consolidated financial statements:
Elements of Transaction
Related Party RelationshipNature of Transaction
Statement of ConditionAmount Statement of Income Amount
2006 2005 2006 2005 2004(In Thousands)
Gratuity Fund Retirement Fund
Advances to subsidiaries, associates and related parties P11,952 P4,530 P− P− P−
JLI AssociateLoans
receivable 6,034 36,204 − − −Accrued
interest receivable 88 538 − − −
Interest income − − 521 5,384 5,446
The remuneration of directors and other members of key management of the Group and Parent Company are as follows:
Consolidated Parent Company2006 2005 2004 2006 2005 2004
(In Thousands)Short-term benefits P267,267 P228,464 P207,330 P201,411 P172,417 P157,597Post-employment benefits 35,280 40,654 17,735 32,050 38,990 7,130
P302,547 P269,118 P225,065 P233,461 P211,407 P164,727
29. Derivative Financial Instruments
The table below shows the fair values of derivative financial instruments, recorded as derivative assets or derivative liabilities, together with the notional amounts. The notional amount is the amount of a derivative’s underlying asset, reference rate or index and is the basis upon which changes in the value of derivatives are measured. The notional amounts indicate the volume of transactions outstanding as of December 31, 2006 and 2005 and are not indicative of either market risk or credit risk.
2006
Assets LiabilitiesAverage
Forward RateNotional Amount
(In Thousands) (In Thousands)Freestanding derivatives:Currency forwards*BOUGHT: JPY P− P987 118.60 765,000 GBP 632 − 1.96 2,800
USD − 110,600 49.64 196,352EUR 447 − 1.31 3,300
Others 202 − − 17,237SOLD: USD 148,507 − 49.53 317,200 JPY 2,480 − 118.34 1,175,000 EUR − 1,166 1.31 4,400 Others 118 359 − 7,530Interest rate swap** − − − 30,000Embedded derivatives*** 8,684 − − 20,000
P161,070 P113,112

NOTES TO FINANCIAL STATEMENTS
2006 Equitable PCI Bank Annual Report | 107
2005
Assets LiabilitiesAverage
Forward RateNotional Amount
(In Thousands) (In Thousands)Freestanding derivatives:Currency forwards*BOUGHT: JPY P6,355 P– 119.41 P– USD 230 321,135 56.16 225,658 EUR 240 2,796 1.19 7,440 GBP – 182 1.74 175 Others 19 185 – 10,028SOLD: USD 131,010 – 53.11 82,818 JPY 6,796 2,625 118.12 1,675 GBP 1,458 – 1.76 850 Others 1,991 57 – 2,414Interest rate swap** – – – 30,000Embedded derivatives*** – 70,500 – 90,000
P148,099 P397,480
* The notional amounts pertain to the original currency except for the ‘Others’, which represent the equivalent US$ amounts of other currencies.
** Under the swap agreement, the Parent Company pays a fixed swap rate of 9.85% and receives a floating rate based on an interest benchmark. As of December 31, 2006 and 2005, the outstanding notional amount is P30.0 million, with an insignificant fair value.
*** These include credit default swaps and optionalities with no close economic relationship with the host structured debt instruments. As of December 31, 2006 and 2005, the outstanding notional amounts of these derivatives amounted to P20.0 million and US$90.0 million, respectively, with underlying instruments such as credit linkage to reference entities and interest rate indices.
Embedded derivatives of hybrid instruments that are classified or designated as at FVPL are not bifurcated. Where the hybrid instruments are not classified or designated as at FVPL, but the embedded derivatives are deemed to be clearly and closely related to the economic risks and characteristics of the host contracts, no bifurcation of the derivatives is applied.
30. Financial Performance
EPS amounts attributed to equity holdings of the Parent Company were computed as follows (in thousands, except EPS):
2006 2005 2004a. Net income attributable to equity holders of the Parent Company P3,265,179 P2,698,385 P2,412,080b. Weighted average number of outstanding common shares
of the Parent Company 668,060 648,196 648,196c. Basic EPS (a/b) P4.89 P4.16 P3.72
As of 2006, 2005 and 2004, there were no shares of stocks that have a dilutive effect on the basic EPS of the Group.

NOTES TO FINANCIAL STATEMENTS
108 | Building for the Future
The following basic ratios measure the financial performance of the Group:
2006 2005 2004Where average equity and average asset include revaluation
increment and goodwill, respectively Return on average equity (ROE) 8.22% 6.40% 5.84% Return on average assets (ROA) 1.01% 0.83% 0.83%Where average equity and average asset exclude revaluation
increment and goodwill, respectively ROE 14.40% 10.57% 11.65% ROA 1.06% 0.88% 1.04%Net interest margin on average earning assets 4.31% 4.35% 4.21%
For purposes of computing ROE and ROA, average of month-end balances of equity and assets, respectively, were used.
31. Notes to Cash Flows Statements
The following is a summary of certain non-cash investing activities that relate to the analysis of the statement of cash flows:
Consolidated Parent Company2006 2005 2004 2006 2005 2004
(In Thousands)Unrealized gain (loss)
on AFS P697,814 P563,563
P54,560 P596,517 P548,127
(P5,979)Additions to investment
properties in settlement of loans 864,694 914,231
– 920,287 676,660
–
The amount of IBLR and SPURA considered as cash and cash equivalents follows:
Consolidated Parent Company2006 2005 2004 2006 2005 2004
(In Thousands)IBLR and SPURA P27,572,262 P18,199,624 P17,364,767 P27,732,262 P18,199,624 P19,858,767Less IBLR and SPURA not considered as cash and
cash equivalents 1,144,033 2,093,001 12,053,935 1,144,033 2,093,001
12,053,935P26,428,229 P16,106,623 P5,310,832 P26,588,229 P16,106,623 P7,804,832

NOTES TO FINANCIAL STATEMENTS
2006 Equitable PCI Bank Annual Report | 109
32. Other Matters
The BODs of ESB and MDB approved the Plan of Merger of ESB and MDB (with ESB as the surviving corporation) on November 23, 2004 and November 18, 2004, respectively. Thereafter, the shareholders of ESB and MDB approved such Plan of Merger on November 23, 2004 and December 6, 2004, respectively. Under the Plan of Merger, owing to the capital deficiency of MDB, ESB will not issue any shares of stock to the shareholders of MDB.
On December 28, 2004, the BSP approved the merger between ESB and MDB subject to certain administrative conditions, which include, among others, submission to the BSP of the Philippine Deposit Insurance Corporation’s (PDIC’s) written consent to the merger. Among others, the incentives approved by the BSP follow:
a. Conversion of the MDB Head Office and the 13 MDB branches closed in 2004 into ESB branches and their relocation within a period of one year from date of merger;
b. Transfer of all rights, privileges, immunities, permits, licenses, franchises and powers of MDB to ESB except for (a) the FCDU license, which has been revoked by BSP effective March 7, 2004 and (b) the trust license provided that the merged bank should comply first with all the prerequisites under Circular No. 348 dated August 20, 2002;
c. ESB will retain MDB’s trust license with the required trust duties of at least P500,000 in MDB’s name on deposit with BSP to be transferred to ESB;
d. Amortization of all merger costs, including retrenchment costs for a period not exceeding five years;
e. Capital infusion by the Parent Company of P1.0 billion into ESB;
f. Conversion of the Parent Company’s outstanding interbank call loans and advances granted to MDB into ESB common shares subject to compliance with the procedural requirements and various bank regulatory ceilings and subject to the SEC approval;
g. Temporary relief for six months from the compliance with the prescribed capital adequacy ratio and the 20% ceiling on the nonperforming loans to total loans ratio if such ratios are not complied with as a result of the merger;
h. Revaluation of bank premises, improvements and bank equipment, with the appraisal increment forming part of capital provided that the merged bank will meet the existing capital requirement after all the adjustments are taken up in the books of accounts of the merged bank but before considering appraisal increments;
i. Access to rediscounting window up to a ceiling of 150% of adjusted capital accounts for a period of one year, reckoned from the date of merger, provided the merged bank meets the required net worth to risk assets ratio and all of the other requirements for rediscounting; and
j. Any right or privilege granted to MDB under its Rehabilitation Plan previously approved by the Monetary Board (MB) or under any special authority granted by the MB shall continue to be in effect.
On December 29, 2004, the SEC approved the Articles and Plan of Merger of MDB and ESB.
On January 19, 2005, the PDIC gave consent to the merger of ESB and MDB subject to the following conditions:
a. MDB shall submit a certification to PDIC within 30 days from PDIC notification of its consent to the merger, that its depositors and creditors have been given notice of the i) merger proposal; ii) full implications of ESB’s absorption of MDB’s deposits liabilities; iii) depositors’ option to either withdraw their deposits from MDB or maintain their accounts with ESB as surviving entity; and

NOTES TO FINANCIAL STATEMENTS
110 | Building for the Future
b. Letter of Guaranty from the Parent Company, which wholly owns ESB, that part of the committed fresh capital infusion in the amount of P1.0 billion would be immediately infused into ESB to assure funding for any withdrawal of MDB deposits and payment of MDB’s other liabilities as they fall due.
Pursuant to the Plan of Merger, the effective date of merger was December 29, 2004, the date the SEC approved the Articles and Plan of Merger. The merger constituted a tax-free reorganization and has been accounted for under the pooling of interest method.
On April 7, 2006, the Board Audit Committee of ESB, pursuant to the specific authority granted to it by its BOD, approved the equity restructuring of ESB. Equity restructuring is available to a non-distressed corporation seeking to eliminate the deficit in its capital account by applying against it a portion of capital paid in excess of par value equivalent to the deficit.
On April 20, 2006, the MB of the BSP in its Resolution No. 513, decided to interpose no objection to the request of ESB for equity restructuring of its capital accounts, subject to the following conditions:
1. The equity restructuring must be disclosed in all subsequent financial statements of ESB for a period of at least three (3) years; and
2. ESB shall submit to the BSP the SEC’s approval of the equity restructuring, within five banking days from ESB’s receipt thereof.
On June 26, 2006, the SEC approved the equity restructuring wiping out ESB’s deficit as of December 31, 2005 amounting to P731.6 million against the Capital Paid in Excess of Par Value amounting to P1,671.7 million. Provided, that the remaining P940.1 million Capital in Excess of Par Value shall not be used to wipe out losses that may be incurred in the future without prior approval of the SEC.

NOTES TO FINANCIAL STATEMENTS
2006 Equitable PCI Bank Annual Report | 111
33. Subsequent events
On January 23, 2007, the Parent Company’s BOD resolved to fold its subsidiary, ECN, into the Parent Company or into the surviving entity resulting from the merger between the Parent Company and BDO, as may be appropriate, for reasons of cost efficiency and economies of scale.
On February 22, 2007, the Parent Company’s BOD granted Management the authority and discretion to determine the manner and time of the implementation of the following corporate actions, taking into consideration the best interest of the Parent Company and subject to applicable statutory and regulatory requirements:
1. The sale or disposal of the Parent Company’s equity investments in certain publicly listed and non-listed corporations, the engagement of the services of a broker to handle the equity placement of the listed shares, and the engagement of the services of an investment/portfolio manager to implement the sale and disposition of the non-listed shares;
2. The sale or dissolution of certain non-operating non-stock companies;3. The consolidation, integration or merger of its two (2) IT company subsidiaries,
PCI Automation and EDCI, with the latter as the surviving entity;4. The consolidation, integration, or merger of Equitable Exchange, Inc. with its parent company EBC Investments, Inc.,
once the merger between BDO and the Parent Company receives approval from the appropriate regulatory bodies; and
5. The consolidation, integration, or merger of PCI Capital and EBC Capital Corporation with the merged Banco de Oro-EPCI Inc., after the latter receives the necessary approvals from the appropriate regulatory bodies.
Also, on February 2, 2007, the BOD of ECN approved the declaration of cash dividends amounting to P846.0 million or P42.84 per share, payable on or before April 15, 2007 to all stockholders of record as of December 31, 2006.

Board of directors
corazon s. de la PazChairperson
teresita sy-cosonVice Chairperson
rene J. Buenaventura *President & Director
nazario s. cabuquit Jr.Director
antonio a. hensonDirector
edmundo l. tanDirector
ricardo c. leongMember
teodoro B. montecilloMember
ma. luz c. generosoDirector
Josefina n. tanDirector
advisory Board
112 | Building for the Future
* The Board of Directors of Equitable PCI Bank accepted with regret the resignation of Mr. Buenaventura effective January 1, 2007

ramon J. JabarDirector
Jesus g. tironaDirector
winston f. garciaVice Chairman
ferdinand martin g. romualdezVice Chairman
fulgencio s. factoran Jr.Director
antonio c. PacisMember
alberto v. reyesMember
2006 Equitable PCI Bank Annual Report | 113
reynaldo P. PalmieryDirector
Peter d. garrucho Jr. Director
sabino e. acut Jr.Corporate Secretary

management committee
eduardo J. katigbak Jr.*Executive Vice President
gerard lee B. coExecutive Vice President
ricardo v. martinExecutive Vice President
antonio n. cotocoSenior Executive Vice President
sergio ll. naranjilla Jr.Executive Vice President
Bienvenido m. Juat Jr.Executive Vice President
dennis B. velasquezExecutive Vice President
aristotle l. villarazaExecutive Vice President
marvin v. faustoSenior Vice President
rebecca s. torresSenior Vice President
Jonathan c.B. goSenior Vice President
clarissa g. ocampoExecutive Adviser for Corporate Planning
rene J. BuenaventuraPresident & CEO
walter c. wassmerSenior Executive Vice President
114 | Building for the Future
* Served until December 31, 2006

senior officers *
2006 Equitable PCI Bank Annual Report | 115
* As of December 31, 2006
CHAIRPERSONCorazon S. de la Paz
PRESIDENT & CEORene J. Buenaventura
SENIOR EXECUTIVEVICE PRESIDENTSAntonio N. Cotoco Walter C. Wassmer
EXECUTIVEVICE PRESIDENTSGerard Lee B. CoBienvenido M. Juat, Jr., TreasurerEduardo J. Katigbak, Jr.Ricardo V. Martin, Chief Financial ControllerDennis B. VelasquezAristotle L. Villaraza
SENIORVICE PRESIDENTSUrsula A. Alano, Deputy TreasurerShirley S. AngManolo C. ArzadonAntonina M. CabuyadaoRamon S. DavidMarvin V. Fausto, Trust OfficerLesmes L. Garate Jonathan C.B. GoNenita C. IndiongcoJeanette S. JavellanaEmerenciana H. LuistroAnnie H. NgoVirgilio C. PamatmatJose Pastor Z. PunoDomingo A. Ramos, Jr. Ricardo V. Reynoso, Jr.Arsenio L. SeverinoRichard Benedict S. SoGrace A. SumalpongRobert W. SyRebecca S. Torres, Chief of StaffEdward G. WenceslaoMa. Teresita Susana L. Yap
FIRST VICE PRESIDENTSGerard M. Aguirre Maritess B. Antonio Victor C. Arboleda Onofre D. Avellanosa Rita V. Buendia Ma. Evangeline A. Buhay Marilou L. Cesario Susie S. Cham Noel D. Dizon Rolando D. Esguerra Paul A. Evora III Belinda C. Fernandez Renato S. Gongora Myrianne Joan D. Gonzales Ma. Elena L. Jao Ma. Cecilia G. Lantin Norman Lee
Alan David L. Matutina Merceditas P. Montesclaros Jose G. Nuguid Maria Rhoda B. Orsolino Jose Alfredo G. Pascual Cerwina Elenore A. Santos Ma. Theresa S. Simbul Virginia N. Sy Edwin R. Tajanlangit Rosola A. Vivas Joy T. Yap Margaret L. Yu
VICE PRESIDENTSBelinda C. Abad Jocelyn D. Agas Regina Flor V. Alba Melissa A. Alcantara Ma. Milagros R. Alindogan Maria Carina S. Antonio Layne Y. Arpon Flor Melissa P. Artillaga Jose Luis F. Bautista Marites A. Bautista Mary Assumpta Gail C. Bautista Pedro C. Bautista, Jr. Maria Eleanor B. Briones Bernard M. Carague Aurora M. Castro Leticia T. Chua Milagros K. Chua Peter D. Clemente Elizabeth E. Coronel Edna Christine P. Cruz Rolando L. Dillague Albert G. Dizon George R. Dosado Lamberto B. del Fonso, Jr. Alexander G. Francisco Genevieve W.J. Go Judy L. Go Patrick Warren D. Go Francisco Javier E. Jose Rafael Martin C. Lara Cesar F. Lazo Estela L. Lim Maurice D. Lim Gertrudes J. Lumain Roy Allan V. Magturo Angelita C. Manulat Felix A. Martin Jessie A. Matibag Ma. Bella C. Paguiligan Ma. Aurora G. Panopio Grace Socorro V. Peczon Romeo J. Pulido, Jr. Victorina S. Ros Emily D. Samoy Rolando S. Santos Joel Jovencio E. Sarreal Gregorio C. Severino Celia M. Sotto Alejandro R. Sumayao Antonio U. Tan Divina N. Tan Marites L. TanRichard R. Tan Don Elecci B. Torno Rosanna F. de Vera
Francisco B. Vista, Jr. Antonio Juan C. Yñiguez, Compliance Officer Aimee A. Yu Alice C. Yu
ASSISTANTVICE PRESIDENTSKara Q. Abrogar Jose Emilio M. Alcalde Allen D. Alcantara Rogelio C. Alcantara Edgardo L. Alcaraz Susan G. Almendral Apollo R. Alquiza William A. Amelliam Leticia L. Ang-Ley Elpidio R. Angeles, Jr. Ma. Ophelia R. Angeles Apolinario E. Aquino Ronald C. Arceo Aldamuel S. Armonio Susan Marie J. Atienza Jerome I. Austria Chona M. Azucena Francisco DC. Bacierto, Jr. Janet B. Bagnes Gerardo I. Banzon Regina Anne S. Basilio Rodora V. Bautista Lizza G. Baylon Edgardo F. Blanco Evangeline G. Borja Ramon B. Borja Ma. Eloisa S. Britanico Carlos L. Buenaventura Julius O. Buendia Benilda G. Cabardo Victor Geronimo S. Calo Emmanuel A. Camua Cheryl A. Capili Ma. Corazon N. Casanova Marilou N. Cayanan Veronica T. Chan Go Anthony W. Chi-hung Christine T. Chow Maria Clara D. Chua Riasa A. Chua Salva Fe S. Cirilos Lorie S. Co Joselito B. Cobarrubias Raul B. Cruz Zosimo C. Dimacuha Ma. Lirio E. Du Ma. Fe H. Dy Francis Javier P. Ejercito Joel M. Escala Samuel C. Esguerra Elizabeth G. Estrada Ma. Elena J. Fernandez Marirose A. Fernando Dominador J. Francisco Marcelita I. Geollegue Rommel S. Gomez Gerardo Gabriel A. Gregorio Lalaine C. de Guzman Agnes F. Jamias Marietta M. Jamilla Armando P. Jardeleza
Tomas K. Javier Simeon S. Jumaquio Michelette S. Legaspi Lilian Leslie T. Lim Alberto V. Lizares Vicente T. Lopez Ramon R. Loreto, Jr. Nelia R. Lumanog Joseph Gerard E. Mabilog Vivian D. Malonjao Rebecca C. Marcelo Carina M. Matute Ariel T. Melo Maria Socorro P. Meñez Vicente L. Miciano, Jr. Dalisay S. Molas Francis Ali B. Morales Mary Ann R. Munar Jasmine E. Navarra Who B. Olandez Josefa P. Ortiz Rebecca C. Paguia Arnaldo Emerito E. Palad Jocelyn T. Paz Cyrus M. Polloso Geraldine S. Punzalan Raoul L. Reniedo Evangeline P. Reyes Joseph Nestor T. Reyes Pamela Ann S. Reyes Roberto H. Reyes Antonio D. Roña Ma. Consuelo S. Ruffy Maria Rosario L. Salazar Arsenia S. Santos Maria Lourdes T. Santos Ma. Corazon L. Simbulan Ronaldo J. Soriano Catherine C. Tan Grace C. Tan Diosdado R. Teh Marilyn G. Tin Ma. Rosita J. Tinio Margarita M. Tobias Lourdes S. Turno Josephine G. Valdez Blandina Uvyhilda B. Vicente Glicerio C. Vicente Luzviminda M. Vidal Raul B. Vivas Adora A. Yanga Shakira C. Yu Noel Z. Yuseco Paulino L. Yusi
EXECUTIVE ADVISERFOR CORPORATEPLANNINGClarissa Emerita G. Ocampo

Armstrong sECurItIEs, InC.
PresidentELEANOR M. HILADO
EBC InsurAnCE BrokErAgE, InC.
PresidentSERGIO LL. NARANJILLA JR.
First Vice President & General ManagerLEONEL M. MERCADO
Assistant Vice President & Marketing HeadMARIVIC S. ROJAS
EBC mAnAgEmEnt, InC.
PresidentSERGIO LL. NARANJILLA JR.
EBC InVEstmEnts, InC.
PresidentSERGIO LL. NARANJILLA JR.
EBC strAtEgIC HoLDIngs CorPorAtIon
PresidentSERGIO LL. NARANJILLA JR.
EQuItABLE CArDnEtWork, InC.
Officer-in-ChargeDENNIS B. VELASQUEZ
Senior Vice PresidentMARILI M. TIOSECO
First Vice PresidentsMA. OPHELIA LL. CAMIÑARICARDO M. CELESTINO HARRISON C. GUE
Vice Presidents CESARIO C. DAYEGOTERESITA M. SILBORPHILLIP L. SO
Assistant Vice Presidents MA. TERESA R. ATIENZABENEDICT BELTRANLELISA BOUAZZIEDMUND S. CHANANNA MARIE CRUZLILY ANN C. CUENCOMARC ANDRE P. HERNANDOCAROLINE S. LABRADORROBERTO MANALANSANSUSAN P. MIRANDAARNOLD STEPHEN SANIANORICHARD WENCESLAO
EQuItABLE EXCHAngE, InC.
ChairmanBIENVENIDO M. JUAT JR.
PresidentROBERTO E. LAPID
DirectorsURSULA A. ALANOBELINDA C. FERNANDEZEDWARD G. WENCESLAO
Compliance OfficerJOSE G. NUGUID
Acting TreasurerRENATO G. OÑATE
EQuItABLE sAVIngs BAnk
President & CEORAMON S. DAVID
Executive Vice PresidentJONATHAN C.B. GO
Assistant Vice PresidentsMA. CRIZELDA T. ARAMBULOMA. ALMA RUTH M. PARAISO
EXPrEss PADALA IntErnAtIonAL, InC.
PresidentRENE J. BUENAVENTURA
mAXICArE HEALtHCArE CorPorAtIon
ChairmanROBERTO K. MACASAET, M.D.
President & CEOJOSE PASTOR Z. PUNO
TreasurerSERGIO LL. NARANJILLA JR.
Assistant Treasurer/ Vice PresidentRONALD G. BASAS
Senior Vice PresidentJOSEPHINE AGUILAR
Vice PresidentVICTOR TANJUAKIO
Assistant Vice PresidentCHRISTIAN CRISTOBAL
Corporate SecretaryEDUARDO DE LOS ANGELES
Assistant Corporate SecretaryMARTIN P. SAMSON
PCIB sECurItIEs, InC.
President & CEOERLASTER C. SOTTO
Senior Vice President & General ManagerGABRIEL U. LIM
Assistant Vice PresidentsNILO C. SAMPAYOMA. CAROLINA T. SANTANA
PCI CAPItAL CorPorAtIon
President & CEOERLASTER C. SOTTO
Senior Vice PresidentGABRIEL U. LIM
First Vice PresidentsELEANOR M. HILADOARNOLD E. OLIVA
Vice PresidentNOEMI T. VILLANUEVA
PCI LEAsIng AnD FInAnCE, InC.
President & CEOMANOLO C. ARZADON
Senior Vice PresidentROBERTO E. LAPID
First Vice PresidentVICENTE C. RALLOS
Vice PresidentsMARLO R. CRUZCONSTANTE C. LAPUZRENATO G. OÑATE
Assistant Vice PresidentsROSARIO C. CRISOSTOMOFLORECITA R. GONZALESDANTE B. JULIANMA. THERESA M. SORIANO
PHILAm EQuItABLE LIFE AssurAnCE ComPAnY, InC.
President & CEOSTEPHEN J. CLARK
Vice PresidentsCHRIS A. CABOGNASONCYNTHIA B. NONO
Senior Assistant Vice PresidentJESSELYN V. OCAMPO
Assistant Vice PresidentsBLESILDA S. BESABEIMELDA L. FORTUGALEZADINAH P. OGATIS
senior officers suBsidiaries & affiliates
116 | Building for the Future

Armstrong sECurItIEs, InC.Equitable PCI Bank TowersMakati Avenue cor. H.V. Dela Costa St. Makati CityTel. 8407000
EBC InsurAnCE BrokErAgE, InC.Equitable PCI Bank Tower IIMakati Ave. cor. H.V. Dela Costa St. Makati CityTel. 878-4535 loc. 2467 / 2454 / 2111
EBC InVEstmEnts, InC.Equitable PCI Bank Towers, Makati Ave. cor. H.V. Dela Costa St., Makati CityTel. 8407000 loc. 2111
EBC strAtEgIC HoLDIngsCorPorAtIonEquitable PCI Bank Bldg.262 Juan Luna St., Binondo, ManilaTel. 8407000 loc. 6566
EQuItABLE CArD nEtWork, InC.203 Salcedo Street, Legaspi Village Makati CityTel. 8125861 to 67
EQuItABLE DAtA CEntEr, InC.Equitable PCI Bank Tower II, Makati Ave. cor. H. V. Dela Costa St., Makati CityTel. 8407000
EQuItABLE EXCHAngE, InC.Equitable PCI Bank Tower I, Makati Ave. cor. H.V. Dela Costa St., Makati CityTel. 8784395
EQuItABLE PCI BAnk CAYmAn, LtD.Coutts Cayman Ltd., P.O. Box 707 Georgetown, Grand Cayman Caymand IslandsTel. 1-345-9454777
EQuItABLE sAVIngs BAnk, InC.G/F Equitable PCI Bank Bldg. 2Ortigas Ave. cor. Roosevelt St.Greenhills, San Juan, MMTel. 7267799
EXPrEss PADALAIntErnAtIonAL, InC.(formerly EBC Interlink Int’l., Inc.) Equitable PCI Bank Bldg.262 Juan Luna St., Binondo, ManilaTel. 8407000 loc. 6566
JArDInE EQuItABLE FInAnCE CorPorAtIon222 JDI Bldg., Gil Puyat Avenue Makati CityTel. 8407000 loc. 6566
mAXICArE HEALtHCArECorPorAtIon19th Flr., Medical Plaza MakatiAmorsolo cor. Dela Rosa Sts.Legaspi Vill., Makati CityTel. 8120561
PCI CAPItAL CorPorAtIonEquitable PCI Bank Tower I, Makati Ave. cor. H. V. Dela Costa St., Makati CityTel. 8407000
PCI LEAsIng AnD FInAnCE, InC.PCI Leasing Centre, Corinthian Gardens Ortigas Ave., Quezon CityTel. 6356416
PCIB ProPErtIEs, InC.Equitable PCI Bank Tower I, Makati Ave. cor. H. V. Dela Costa St., Makati CityTel. 8407000 loc. 6566
PCIB sECurItIEs, InC.Equitable PCI Bank Tower I, Makati Ave. cor. H. V. Dela Costa St., Makati CityTel. 8407000
PHILAm EQuItABLE LIFE AssurAnCE CorPorAtIon9th Flr., Equitable PCI Bank Tower IIMakati Ave., cor. H.V. Dela Costa St.Makati CityTel. 8912613
ProPErtY CArE, InC.Equitable PCI Bank Tower II, Makati Ave. cor. H. V. Dela Costa St., Makati CityTel. 8407871
strAtEgIC ProPErtYHoLDIngs, InC.Equitable PCI Bank Bldg.262 Juan Luna St., Binondo, Manila Tel. 8407000 loc. 6566
tHE sIgn oF tHE AnVIL, InC.Equitable PCI Bank Tower I, Makati Ave. cor. H. V. Dela Costa St., Makati CityTel. 8407000
suBsIDIArY oFFICEs
honG KonG
EXPRESS PADALA (HK) LTD.Shops 332-333, 3/F Worldwide Plaza 19 Des Voeux Road, Central, Hong Kong Tels. (00852) 2877-3776, 2877-3534 Fax No. (00852) 2845-0712
EXPRESS PADALA (HK) LTD.Shop 246, 2/F Worldwide Plaza 19 Des Voeux Road, Central, Hong Kong Tel. (00852) 2525-4936
EXPRESS PADALA (HK) LTD.Shop 232, 2/F Worldwide Plaza 19 Des Voeux Road, Central, Hong Kong Tels. (00852) 2525-5629, 2525-4268 (00852) 2525-7160 Fax No. (00852) 2526-9025
EXPRESS PADALA (HK) LTD.Shop 159, G/F Lik Sang Plaza 269 Castle Peak Road, Tsuen Wan New Territories, Hong Kong Tels. (00852) 2412-0399, 2412-0693 Fax No. (00852) 2414-7938
EXPRESS PADALA (HK) LTD.Shop 19, G/F Richland Garden138 Wu Chui Road. Tsuen MunNew Territories, Hong KongTels. (00852) 2458-7588, 2458-7268Fax No. (00852) 2441-1703
MACAU
EXPRESS PADALA (MACAU) LTD. Tin Tac Bldg. Rua Dos Cules No. 6, R/C, MacauTels. (00853) 373-324, 374-385Fax No. (00853) 374-394
ITALY
EXPRESS PADALA (ITALIA)SpA BOLOGNAVia C. Boldrini 1240121 Bologna, ItaliaTel. (0039051) 251-992Fax No. (0039051) 248-759
EXPRESS PADALA (ITALIA)SpA - FLORENCEVia San Zanobi 5-7/R50129 Firenze, ItaliaTel. (0039055) 462-5225Fax No. (0039055) 462-0636
EXPRESS PADALA (ITALIA)SpA - MESSINA2/F Via Dogali No. 2098123 Messina, ItaliaTel. (0039090) 228-6232Fax No. (0039090) 651-3823
EXPRESS PADALA (ITALIA)SpA - MILANVia Santa Maria Segreta 620123 Milano, ItaliaTel. (003902) 725-2161Fax No. (003902) 862-795
EXPRESS PADALA (ITALIA)SpA - ROMEVia Vicenza 5/A, Interior 2A00185 Roma, ItaliaTel. (003906) 445-7724, 446-0395, 446-3956Fax No. (003906) 446-0393
EXPRESS PADALA (ITALIA)SpA - TORINOVia San Pio V. 7/B10125 Torino, ItaliaTel. (0039011) 669-0007Fax No. (0039011) 668-0085
GerMAnY
EQUITABLE PCI EXPRESS PADALA(Deutschland), GmbHGrosse Friedberger Strasse 660313 Frankfurt, Am Main, GermanyTel. (004969) 720-07010 to 13Fax No. (004969) 720-07070
UNITED STATES
EXPRESS PADALA (U.S.A.), INC.Headquarters 2365 S. Azusa Ave. West Covina, California 91792Tel. (00800) 472-3252Fax No. (00866) 372-3252
EXPRESS PADALA (U.S.A.), INC. LA-Vermont 215 South Vermont AvenueLos Angeles, California 90004Tel. (001213) 229-4404Fax No. (001213) 229-0893
EXPRESS PADALA (U.S.A.), INC. – SF 4815 Mission St.San Francisco, California94122 USATel. (001415) 587-9495 to 97Fax No. (001415) 587-9498
rEPrEsEntAtIVE oFFICEs
frAnCe
EQUITABLE PCI BANK PARIS25 Boulevard des Capucines75002 Paris, FranceTel. (00331) 5375-1142, 4446Fax No. (00331) 5375-1143
GreeCe
EQUITABLE PCI BANK ATHENS24 Kifissias Ave., AmbelokipiAthens, 11525 GreeceTel. (0030210) 748-0329Fax No. (0030210) 748-0937
ISrAeL
EQUITABLE PCI BANK ISRAEL4th Flr. Shop 4412 New TachanaMerkazit, 108 Levinsky St.Tel Aviv, 66052 IsraelTel. (009723) 639-0163 / 537-9294Fax No. (009723) 687-0150
DEsk oFFICEs
SAUdI ArABIA
EQUITABLE PCI BANK RIYADHAl Rajhi Express Padala CenterAl Rajhi Banking & Inv’t. Corp.2/F Batha Shopping CenterP.O. Box 28 CR 96 Riyadh, KSATel. (09661) 405-0694, 404-3188Fax No. (09661) 405-3591
EQUITABLE PCI BANK JEDDAHAl Rajhi Express Padala CenterAl Rajhi Banking & Inv’t. Corp.Mezzanine Flr. Queen’s Bldg.Jeddah, KSATels. (009662) 644-1000 ext. 215,284 / 642-7151Fax No. (009662) 643-8542
EQUITABLE PCI BANK ALKHOBARAl Rajhi Express Padala CenterAl Rajhi Banking & Inv’t. Corp.King Saud St., P.O. Box 1362,Alkhobar 31952 KSATel. (009663) 898-6629, 894-3898Fax No. (009663) 864-9758
suBsidiaries and affiliates
international remittance offices
2006 Equitable PCI Bank Annual Report | 117

118 | Building for the Future
BRANCH DIRECTORY
METRO MANILABRANCHES
2nd Avenue-Grace ParkBaliuag Transit Bldg.199 Rizal Ave. Ext. cor. 2ndAvenue, 1400 Caloocan CityFax 3618934Tels. 3646286 / 36422213668625
8th Avenue-Grace ParkRizal Avenue ExtensionGrace Park, Caloocan CityFax 3611299 / 3611622Tels. 3635674 / 36356653611626 / 3635628
9th Avenue-Grace Park414 Rizal Avenue ExtensionGrace Park, 1400Caloocan CityFax 3649148Tels. 3611208 / 36112153657308 / 3633581
11th Avenue-Grace Park1619 Rizal Ave. Ext. cor.11th Ave. 1400Caloocan CityFax 3611421Tels. 3661978 / 36619273661980 / 3612098
A. Arnaiz-San LorenzoL & R Bldg.1018 A. Arnaiz Ave.Makati CityFax 8430522Tels. 8877670 / 84305338443045
A. de Jesus-EDSA474 Edsa cor. B. Serranoand A. De Jesus Sts.1403 Cal. CityFax 3633845Tels. 3665638 To 393668714 / 3667462
A. Linao-Paco1635-1641 Dart St.Paco ManilaFax 5360357Tels. 5256521 / 53603595241455 / 5360358
A. Santos-South ExpressUnits E & F8385 Dr. A. Santos Ave.Parañaque, Metro ManilaFax 8294179Tels. 8262932 / 8294178 to 82
ABS CBN MotherIgnacia St.Stall No. 25, South WingGround Floor ELJCC Bldg.Sgt. E.A. Esguerra Ave.Corner Mother Ignacia St.Quezon CityFax 9256736Tels. 9256731 / 41110909256732 / 92567359201411
Acropolis-E. Rodriguez Jr.Grd. Flr. ACO Bldg.191 E. Rodriguez Jr. Ave.Bagumbayan, Quezon CityFax 4404368Tels. 4404371 / 44043704404372 / 6384556
ADB Avenue-OrtigasRobinson’s PCI Bank TowerADB Ave., Ortigas Center1600 Pasig CityFax 6342119Tels. 6342131 / 6342125 6342116 / 6366642
Adriatico-San Andres St.Adriatico Executive CenterAdriatico St., Ermita, ManilaFax 5235866Tels. 5367514 / 5367517
Agno-Banawe202-204 Banauecor. Agno Sts.1103 Quezon CityFax 7124742Tels. 4136471 / 4136470 7819811
Aguirre-BF ParañaqueRGM Building326 Aguirre AvenueB.F. Homes, ParañaqueFax 8250045Tels. 8250043 / 82500448202731 / 8202730
Alabang Town CenterG/F, New EntertainmentComplex, Alabang TownCenter, Ayala AlabangMuntinlupa CityTels. 7720152 / 77201537720151
Alfaro-Salcedo VillagePCCI Bldg., 118 Alfaro St.Salcedo Village1227 Makati CityFax 8176635Tels. 8152988 / 81530168153014 / 8172617
Almanza Uno - Las PinasAlong Alabang-Zapote Road (near SM Southmall)Almanza Uno, Las PinasTel No. 801-6357 / 801-6359801-6399 / 801-6414
Amoranto-Banawe650 N. S. Amoranto Ave.1114 Sienna, Quezon CityFax 7124702Tels. 7112633 / 41598647123947 / 41598657819812
Anonas-KamiasAnonas St. cor. K6 St.East Kamias1102 Quezon CityFax 9220460Tels. 9122408 / 92266039155315 / 4265623
Asia Tower-PaseoG/F Asia Tower, cor.Paseo De Roxas andBenavidez Sts.1229 Makati CityFax 7509888Tels. 7506888 / 84103828410384 / 84103858410245
Atrium-Makati AvenueG/F Atrium of Makati Bldg.Makati Ave., Makati CityFax 8114281Tels. 8114456 / 81142828114283 to 86
Aurora Blvd.-AnnapolisAnnapolis St.cor. Aurora Blvd. Cubao1109 Quezon CityFax 9125384Tels. 9125381 / 91233319129125 / 43778389129371
Ayala Triangle 1GM-B (G/F) Tower 1Ayala Triangle, Ayala Ave.Makati CityFax 8919897Tels. 8919950 / 89198968919948 to 50
Bagtican-Pasong TamoUnit 102 G/F Pryce CenterCond. 1179 Chino Roces Ave.cor. Bagtican St.San Antonio Vill., Makati CityFax 8991063Tels. 8991059 / 89910618991052 / 8991053
Balintawak-EDSAUnit 17-19 ANPN PlazaKm. 12 EDSA, BalintawakQuezon CityFax 4555806Tels. 3309622 / 45558073309623
Bambang-Rizal Avenue1607 Alvarez St., cor. RizalAve. Sta. Cruz 1003 ManilaFax 7117734Tels. 4936160 / 71188117427258
Batangas St.-Rizal Avenue2200 Rizal Ave.cor. Batangas St.Sta. Cruz, ManilaTelefax 7313671Tels. 731-5962 / 73136674936172 / 7418734
Beacon Plaza-Shaw Blvd.UG 105 - 106 Beacon PlazaShaw Blvd., cor. Ideal St.Mandaluyong CityFax 7261107Tels. 7262364 / 72623147262450 / 72623727237445
Bel Air-Gil PuyatCountry Space 1 Cond. Bldg.Sen. Gil Puyat Ave.Bel-Air Village1209 Makati CityFax 8152013Tels. 8152012 / 75102388923276
Better Living-Bicutan43 Doña Soledad Ave.Better Living Subd.Don Bosco, ParañaqueFax 8236338Tels. 8246767 / 82467708246771
Bicutan-South SuperHighwayColumbian MotorsCompound, Km.16 WestService Road, South SuperHi-way, Bicutan 1700Parañaque, Metro ManilaFax 8233932Tels. 8235486 / 8236965
Big R-Robinson’s NovalichesLevel 1 Big R LobbyRobinson’s Place NovalichesQuirino Highway, Q.C.Fax 9354890Tels. 9354895 / 93548929354891
Blue Ridge-KatipunanUpper Ground Floor LevelMarmico Bldg.223 Katipunan Rd.Brgy. MilagrosaQuezon CityFax 4379178Tels. 4379198 / 91313509958753
Blumentritt-San JuanLot 11-B, Blk. 127Blumentritt cor. Sto Toribio Sts.San Juan, Metro ManilaFax 7441277Tels. 7237360 / 72779517443464 / 72719317239540
Brixton Hill-G. AranetaG/F ILO Bldg.,195 G. Araneta Ave.Quezon CityFax 7143547Tels. 7147688 / 71439887153005 / 41446837141570
Broadway Centrum-Aurora Blvd.Br. Centrum Cond.Aurora Blvd., cor. Doña JuanaRodriguez St., 1112 ValenciaQuezon CityFax 7244821Tels. 7269372 / 72745227233107
C. Palanca-Quiapo132 Carlos Palanca St.Quiapo, ManilaFax 7336329Tels. 7336334 / 73363427336337 / 7338971
Capitol-PasigShaw Blvd.,cor. Danny Floro St.Pasig CityFax 6363824Tels. 6341330 / 63402806341328 / 6388242
Carmen Planas-Padre Rada1033-1035 C. Planas St.1012 Tondo, ManilaFax 2451648Tels. 2452240 / 24523232430193
Central Market-V. Fugoso117 V. Fugoso St. cor. Sulu St.1003 Sta. Cruz, ManilaTelefax 7350664Tels. 7343048 / 7343610
Century Park-AdriaticoCentury Park Hotel cor.Adriatico & Vito Cruz Sts.1004 Malate, ManilaFax 5251607Tels. 4006632 / 53690855242829
Clavel-Elcano706-708 Elcano St.1006 Binondo, ManilaFax 2426019Tels. 2426057 / 24296562429650 / 24468872426395
Coastal Road-UniwideRoxas Blvd., ParañaqueMetro ManilaFax 8790088Tels. 8790086 / 87900848790090
Cordillera-Quezon Ave.Quezon Ave.cor. Cordillera St.Quezon CityFax 7317286Tels. 7317285 / 73172844132316 / 4123785
Dasmariñas St.-BinondoPCI Bank Bldg.Dasmariñas St.Binondo 1006 ManilaFax 2429438Tels. 2429413 / 24294152429389 / 24293952429436
Dela Rosa-RadaAce Bldg.,cor. Dela Rosa &Rada Sts., Legaspi Village1229 Makati CityFax 8172323Tels. 8154163 / 81349128933644 / 89387708931495

2006 Equitable PCI Bank Annual Report | 119
Dian-Gil PuyatG/F Equitable PCI Bank Bldg.Sen. Gil Puyat Avenue cor.Dian St., Makati CityFax 8453239Tels. 8444244 / 88915648442554 / 8432529
Domestic Road-PasayCaltex CompoundNAIA cor. Domestic Road1300 Pasay CityFax 8512210Tels. 8515361 / 85122428515360 / 8512230
Don Antonio-CommonwealthDon Antonio Sports CenterDon Antonio Heigths Subd.Quezon CityFax 9313215Tels. 9315212 / 93113599512125
Don Jose-FairviewUnits 2&3, CPE Bldg.1Lot 9 Blk.11 Don MarianoMarcos Ave. FairviewQuezon CityFax 4287150Tels. 9303738 / 42871929303738
Doña Manuela 5-Las PiñasG/F R-A-J Villafuerte Bldg.279 Alabang-zapote RoadLas Pinas, Metro ManilaFax 8748671Tels. 8748674 / 87161018748645 / 87486038748632 / 8748607
DPC Place-Chino RocesG/F (Unit 102) of DPC Place2322 Chino Roces Ave.Makati CityFax 8898625Tels. 8898689 / 88986268898687 - PABX
Eastwood City-LibisPortion Of Unit D,G/F Techno Plaza One OrchardRoad Eastwood CityLibis, Quezon CityFax 4401797Tels. 6673160 / 6673054
EDSA East-KalookanL&E Bldg., EDSA cor. Gen.Concepcion St. Kalookan CityFax 3305832Tels. 3678751 / 33058343305835 / 36773363628317
Enterprise Center-Ayala Ave.3rd Level (Near Escalator Access To Ayala Ave.), Tower 1The Enterprise Center6766 Ayala Ave., Makati CityFax 8865500Tels. 8865498 / 8865499
Equitable PCI Tower 1PCI Bank Bldg., Tower IMakati Ave. cor. H. V. DelaCosta St., 1227 Makati CityFax 8784640Tels. 8784631 / 87846428784641 / 87846378784638 8407974
España-Blumentritt2101-2103 Espana Ave.cor. Blumentritt St.1008 Sampaloc, ManilaFax 7315101Tels. 7413274 / 73280167416709 / 7413274
Evangelista-MakatiEvangelista St.cor. Gen. Lacuna St. Bangkal1233 Makati CityFax 8449278Tels. 8931810 / 84492768882497
Forest Hills-NovalichesLot 2 D 1 Quirino Ave.Novaliches, Quezon CityFax 9371152Tels. 4173432 / 93709899371313 / 9354636
Gandara-Soler1268 Soler St.cor. S. Padilla St.1006 Binondo, ManilaFax 2448041Tels. 2448097 / 24480392476887
Glori-Del Monte627 Del Monte Ave.San Franciso Del MonteQuezon CityFax 3656804Tels. 3677159 / 36785263656801 to 02
Greenhills Shopping CenterPCI Bank Bldg.,Greenhills Shopping CenterSan Juan, Metro ManilaFax 7242065Tels. 7233312 / 7210515 7233316
Harrison Plaza-A. MabiniG/F Mabini WingHarrison PlazaA. Mabini St., MalateTelefax 4043824Tel. 4043823
Hemady-Aurora Blvd.708 Aurora Blvd.cor. Hemady St.New Manila 1110Quezon CityFax 7218665Tels. 7246185 / 72425067248909
Heroes Hill-Quezon Ave.1052 Quezon Ave.1103 Quezon CityFax 3724917Tels. 4133779 / 37249163724936
Herrera St.-Salcedo VillageUnit # 2, G/f, Chatham HouseHerrera St., cor. Valero &San Agustin Sts.Salcedo Village, Makati CityFax 8434297Tels. 8434365 / 84342658434231 / 8434310
IBM Plaza-LibisG/F IBM Plaza, Eastwood CityE. Rodriguez Jr., Ave.Libis, Quezon CityFax 4210528Tels. 3951017 / 42105304210201 / 9958538
Intramuros-Magallanes DriveG/F Chamber of CommerceBldg., #3 Magallanes DriveIntramuros, ManilaFax 5277574Tels. 5257633 / 52779645278585 / 5210397
Jaka II-Legaspi St.G/F 150 Jaka II Bldg.Legaspi St., Legaspi Village1229 Makati CityFax 8178657Tels. 8170160 / 89356258172970
Juan Luna-Binondo Center262 Juan Luna St.Binondo, ManilaFax 2430252 / 2430222Tels. 2415946 / 24302292415774 / 24157692415782
Kalentong-Shaw Blvd.56 Shaw Blvd.1550 Mandaluyong CityFax 5323420Tels. 5317044 / 71814045341959
Kamias RoadTrinidad Bldg., Kamias Roadcor. K-J St., Quezon CityFax 4264417Tels. 4264414 / 42644189297965
Karuhatan-McArthurHighwayKm.13 McArthur Highway1441 KaruhatanValenzuela, Metro ManilaFax 2914783Tels. 2914784 To 852921711 / 2911828
La Fuerza Plaza-Chino RocesUnit 14, La Fuerza PlazaChino Roces Ave., Makati CityFax 8937851Tels. 8671549 / 89378598107134
La Huerta-Parañaque0422 Quirino Ave.Corner J. Ferrer St.La Huerta, ParañaqueMetro ManilaFax 8296005Tels. 8261087 / 8262368
Lapu Lapu-NorthbayNorth Bay Blvd. Ext. cor.Lapu-Lapu Ave.1485 Navotas, Metro ManilaFax 2821014Tels. 2816460 / 28166652821015 to 16
Leveriza-Libertad212 Libertad St., Pasay CityMetro ManilaFax 8331149Tels. 8318190 / 83311438315889 / 8314977
Libertad-TaftMCF Bldg. 2250 Taft Ave.cor. College Road, Pasay CityFax 5519238Tels. 8333069 / 83330698316630 / 8327216
Ligaya-Boni Ave.654 Boni Ave.1550 Mandaluyong CityFax 7462747Tels. 5340570 / 53431335343134
Loyola Heights-KatipunanGround & 2nd FloorsSt. Mark’s Realty Bldg.Katipunan Ave.cor. B. Gonzales St.Loyola Heights, Quezon CityFax 4260237Tels. 4266546 / 43485464260201 / 4348580
Luzon St.-MasangkayMasangkay cor. Luzon St.Tondo, ManilaFax 2545056Tels. 2524456 / 25211492548296 / 25400322562360
M. de Santos-Ilaya632 M. de Santos St.,ManilaFax 2431827Tels. 2431826 / 24318312431830 / 24318292431828
Makati Avenue-AyalaL. V. Locsin Bldg.Ayala Ave. cor. Makati Ave.1228 Makati CityFax 8404529Tels. 8177180 / 81872868164051 - PABX8177455 - PABX
Makati Cinema SquareMakati Cinema SquarePasong Tamo1229 Makati CityFax 8442641Tels. 8111447 / 81115238111458 / 8441990
Malabon-Rizal Avenue694 Rizal Ave.1404 MalabonMetro ManilaFax 2815346Tels. 2810995 / 28105362810538 / 28109492812478
Malanday-McArthurHighwayKm.17 McArthur HighwayMalanday, 1405 ValenzuelaMetro ManilaFax 4437541Tels. 4437539 / 44375402770111
Manuela Metropolis-AlabangUnit G 33, ManuelaMetropolis SouthSuperhighway, AlabangInterchange, Muntinlupa CityFax 8072289Tels. 8072290 / 80722858072286 / 80722888072291
Marcos-Sumulong HighwayKingsville Commercial ArcadeMarcos Highway 1870Antipolo, RizalFax 6454934Tels. 6681296 / 64553236458156 / 6455323
Marikina-J. P. Rizal265 Jose Rizal St. Sta. Elena1800 Marikina CityFax 6461796Tels. 6461798 / 64617996463717
Marulas-McArthur HighwayLot 16 & 17 McArthurHighway, ValenzuelaMetro ManilaFax 2932711Tels. 2916089 / 29160582916046 / 29327082932710

120 | Building for the Future
BRANCH DIRECTORY
Masangkay-C. M. Recto1029-1031 JP Bldg.Masangkay cor. Tronqued St.Sta. Cruz, ManilaFax 2440186Tels. 2440185 / 24418062441808 / 2443056
Matalino-DilimanG/F, J & L Bldg. Matalino St.Diliman, Quezon CityFax 4342768Tels. 9219956 / 43427634342764
Mayon-N. RoxasNo. 241 Mayon Ave.cor. Nicanor Roxas St.1161 Quezon CityFax 7402058Tels. 7402118 / 74389397438936
MC Home Depot-Fort BonifacioG/F (CS 183) MC HomeDepot-Fort Bonifacio Branch32nd St. cor. Bonifacio Ave.Fort Bonifacio, Global CityTaguigFax 8187905Tels. 8152463 / 8181972
Medical Plaza-LegaspiVillageUnit 101, G/F Medical PlazaMakati, Amorsolo St.cor. dela Rosa St.Legaspi Village, Makati CityFax 8132585Tels. 7505547 / 75055458132739 / 8864247
Meralco Center-OrtigasMeralco CompundOrtigas Ave. 1604Pasig CityFax 6316360Tels. 6225809 / 63158534210530
Metro Point Mall-PasayUnit 102 G/F Metro Point MallEDSA cor. Taft Ave.Pasay CityFax 8333758Tels. 8335072 / 8335607
Mindanao Avenue-CongressionalCongressional Avenue Ext.cor. Mindanao AvenueQuezon CityFax 9252627Tels. 9252626 / 92526304552394 / 9252629
Morning Star-Gil PuyatG/F Morning Star Center Bldg.347 Sen. Gil J. Puyat Ave.Makati CityFax 8998265Tels. 8903148 / 89982428903152 To 53
N. Roxas-BanaweUnit 397-A & Unit 71-FBanawe cor. N. Roxas St.Quezon CityFax 7433459Tels. 7437545 / 74375527437545
NAIA 1Arrival Area, Ninoy AquinoInternational AirportN. Aquino Ave.1705 NAIA ParañaqueMetro ManilaFax 8320117Tels. 8796201 / 8771405687714057 / 8771109loc. 4056
Neptune-Makati Ave.101 Neptune St.cor. Makati Ave. 1209Makati CityFax 8972174Tels. 8966062 / 89726948972718 / 8978483
New Farmers Plaza-EDSA3F Concourse AreaNew Farmers Plaza EdsaAraneta Center, Quezon CityFax 9950206Tels. 9950207
New Manila-E. Rodriguez Sr.Unit 1G & 2E284 Doña Anita Bldg.E. Rodriguez Sr. Ave.Quezon CityFax 4106654Tels. 4106655 / 72431887274988 / 41066514106656
New Sta. Lucia East-CaintaSta. Lucia East Grand MallMarcos Highwaycor. Felix Ave. 1900Cainta, RizalFax 6815171Tels. 6815296 / 6815172
New York-EDSAEDSA cor. New York St.Cubao 1111 Quezon CityFax 4373645Tels. 9123670 / 9957747
Notre Dame-Aurora Blvd.Aurora Blvd., cor. Notre DameSt. Cubao 1110 Quezon CityFax 9119833Tels. 9135025 / 91350209119108
One Corporate Plaza-A. Arnaiz845 One Corporate Plaza Bldg.Pasay Road, Makati CityFax 8135808Tels. 8135817 / 81358118129001
Ortigas 1-Exchange RoadG/F PSE Center, ExchangeRoad, Ortigas CommercialComplex, Pasig CityFax 6363728Tels. 6352902 to 056363729 / 63661536366154
Ortigas Avenue-GreenhillsEBC Bldg., Ortigas Ave.cor. Roosevelt Ave., GreenhillsSan Juan, Metro ManilaFax 7212574Tels. 7224238 / 72676567227244 / 72676537213641 / 7227237
Ortigas Avenue-PasigNew Rosario OrtigasCommercial Arcade42 Ortigas Ave., Pasig CityFax 9167454Tels. 9167455 / 64052716405272 / 6433995
Ortigas Avenue-San JuanUnits 102-103 Sunrise Cond.Ortigas Avenue 1500San Juan, Metro ManilaFax 7249405Tels. 7211909 / 72150247219180
Ortigas Avenue Ext.-CaintaUnits 7-9 FairtradeCommercial CenterOrtigas Ave. ExtensionCainta, RizalFax 6586575Tels. 6566581 / 65676906609663
Ortigas-EDSASEC Bldg., EDSAcor. Florida St.Mandaluyong CityFax 7210224Tels. 7210224 / 72751617253163
Pacific Star-MakatiG/F Pacific Star Bldg.Sen. Gil Puyat Ave.cor. Makati Ave., Makati CityFax 8115225Tels. 8115568 / 8115938 to 418115567 / 8133731
Padre Faura-A. MabiniA. Mabini cor. Padre Faura Sts.1000 Ermita, ManilaFax 5234879Tels. 5233173 / 52801575258928
Parañaque Cable-A. SantosParañaque Cable TV Bldg.8210 Dr. A. Santos Ave.ParañaqueFax 8201617Tels. 8201614 / 82016158201620 / 8201621
Parañaque-N. Aquino Ave.JJM Bldg., 2 N. Aquino Ave.Sto. Nino, ParañaqueMetro ManilaFax 854-4792Tels. 854-4789 / 8544835854-4791
Pasay-EDSA507 EDSA cor. B. Garcia St.1300 Pasay CityFax 8314493Tels. 8317741 / 83368328336834
Paseo-Equitable PCI TowerEquitable Bank Tower8751 Paseo de RoxasMakati CityFax 8860015Tels. 8860016 / 81302998860010 to 12
Paseo-Gil PuyatEBC Bldg., Paseo de Roxascor. Gil Puyat Ave.Makati CityFax 8976149Tels. 8953949 / 89500558950059 / 8909531
Pasig Blvd. Ext.-RosarioAlong Pasig Blvd. Ext.Rosario, Pasig CityFax 6419174Tels. 6415828 / 64279366428406 to 09
Paso de Blas-North Expressway97 Paso de Blas 1400Valenzuela, Metro ManilaFax 2940697Tels. 2940699 / 43212094441752 / 2940699
PCI Leasing CentrePCI Leasing CentreOrtigas Ave., Quezon CityFax 6361758Tels. 6318683 / 6361758
Pedro Gil-A. Mabini1567-1571 Salud Bldg.Pedro Gil cor. A. Mabini St.Ermita, ManilaFax 4007364Tels. 4007363 / 525-61215219506
Perea-PaseoG/F Universal Re Bldg.106 Paseo de RoxasMakati CityFax 8162220Tels. 8171845 / 81799808186355 / 8159032
Philamlife Ave.-Las PiñasAlabang-Zapote RoadPamplona Tres, 1740 Las PiñasMetro ManilaFax 8743892Tels. 8728167 / 87403258744252 / 8743809
Pioneer Highlands-MadisonUnit 01 (Facing Madison St.)Lower G/F Globe TelecomPlaza 1 Bldg. Pioneercor. Madison Sts.Mandaluyong CityFax 7463805Tels. 6347933 / 74638067460081
Pitimini-RooseveltEBC Bldg. Roosevelt Ave.cor. Pitimini St.SFDM, Quezon CityFax 3725987Tels. 4126138 / 37259874121745 / 3725988
Plaza Calderon-Pedro GilG/F Unit C, Harmonic SevenBldg., 2332-2334 Pedro Gilcor. Vesta St., Sta. AnaManilaFax 5646548Tels. 5626816 / 56268415634803
Plaza Sta. Cruz-Dasmariñas St.377 Plaza Sta. Cruz1003 Sta. Cruz, ManilaFax 7333018Tels. 7333001 / 73330037333004 / 7343812
POEA-EDSAPOEA Bldg.EDSA cor. Ortigas Ave.Mandaluyong CityFax 7245966Tels. 7245943
Port Area-South Harbor13th St. cor. Atlanta St.South Harbor1018 Port Area, ManilaFax 5270695Tels. 5270717 / 52707935211302
President’s Avenue-BF ParañaquePresident’s Ave.cor. J. Elizalde St., BF HomesParañaque, Metro ManilaFax 8508571 / 8508572Tels. 8091677 / 84208958094976 / 8427395
Pres. Quirino-TaftG/F FFW Bldg.1943 Taft Ave., Malate, ManilaFax 5232640Tels. 5262654 / 52326575264068
Pritil-Tondo1815 N. Zamora St.1012 Tondo, ManilaFax 2545248Tels. 2525762 / 25510502545028 / 2525899

2006 Equitable PCI Bank Annual Report | 121
Project 7-EDSALobby of EPCIBBalintawak Branch ANPN Plaza, Km 12, EDSA, Balintawak, Quezon CityFax 3301708Tels. 3301657 / 33017133301707
Q.I.-E. Rodriguez Sr.G/F Ablaza Bldg.117 E. Rodriguez Ave.Quezon CityFax 7328290Tels. 7401091 / 74019067421340 / 4111091
Quiapo-Quezon Blvd.Quezon Blvd.1001 Quiapo, ManilaFax 7336040Tels. 7336249 / 7340477to 787350953
Quinta Market-QuiapoQuezon Blvd.cor. C. Palanca St.Quiapo, ManilaFax 7359592Tels. 73595917359593 to 95
R. Salas-Roxas BoulevardS & L Bldg., Roxas Blvd.cor. Romero Salas St.Ermita, ManilaFax 4508297Tels. 5248469 / 4508300
Redemptorist Road-BaclaranRedemptorist Road, BaclaranParañaque, M. M.Fax 8320042Tels. 8525169 / 83328448538326
Reina Regente-C.M. RectoC.M. Rectocor. Reina RegenteBinondo ManilaFax 2447318Tels. 2457141 / 24439652443993 to 94
Reliance St.-EDSAG/F Paragon PlazaEDSA cor. Reliance St.Mandaluyong CityFax 6389069Tels. 6389070 / 63890666389072
Reposo-MakatiEBC Bldg., J.P. Rizalcor. N. Garcia (FormerlyReposo) Makati CityFax 8978652 / 962437Tels. 8978655 / 8978648 to 518961790
Richville Center-Ayala AlabangRichville cor. Centre Inc.1314 Commerce Ave. Ext.Fax 8978655Tels. 8093868 / 80442018093322 - PABX
Robinson’s Galleria-OrtigasRobinson’s GalleriaOrtigas Ave. 1602Quezon CityFax 6329866Tels. 9105484 / 63298216339215
Robinsons-Metro EastLevel 1 (L1 160 & 162)Robinson’s Metro EastMarcos Highway, Pasig CityFax 6829114Tels. 6829112 / 68291176829115
Robinson’s Place-CaintaEPCIBank Taytay-NationalHighway BranchKorte Rosario RestaurantTaytay National HighwayIlog Pugad, Brgy. San JuanTaytay RizalTelefax 6557891Tels. 6557891 / 65581446601939
Robinson’s Place-ManilaG/F Robinson’s MallPedro Gil cor. M. Orosa Sts.Ermita, ManilaFax 5367898Tels. 5256430 / 53679635367901 / 5367902
Rockwell Center-MakatiLot 3 Block 7 Rockwell DriveRockwell Center, PoblacionMakati CityFax 7298816Tels. 8981746 / 8981742 to 437298814 / 8990815
Ronquillo-Sta. CruzUnit I, G/f Carmen Bldg.Ronquillo St., Sta CruzManilaFax 7359302Tels. 7359303 / 73490157359303 to 06
Rufino-AyalaG/f Rufino Bldg.Ayala Ave. Cor Herrera St.1226 Makati CityFax 8124214 / 8124243Tels. 8154536 / 81313588101439
Rustan’s-CubaoRC-01A, Times Square Ave.near cor. Gen. Roxas St.,Araneta Center1109 Quezon CityFax 4385564Tels. 4383350 / 43855659958572
Salcedo St.-Legaspi VillageEBC Bldg., 203 Salcedo St.Legaspi Village, Makati CityFax 8126144Tels. 8126145 / 81258738125874
Sales St.-Raon545 Sales St.,cor. G. Puyat St.1016 Sta. Cruz, ManilaFax 7336673Tels. 7337961 / 73376567336679 / 73378667337785
San Miguel Center-OrtigasG/F SMPPI CorporateCentre Bldg., St. Francis Ave.1554 Mandaluyong CityFax 6387002Tels. 9100976 / 91109776387001
San Sebastian-C. M. Recto2070 C.M. Recto St.1008 Sampaloc, ManilaFax 7369059Tels. 7348889 / 73496827330267 / 7346679
Sangandaan-KalookanNo. 628 A. Mabini St. 1408Sangandaan, Caloocan CityTelefax 2852738Tels. 2852737 / 28855252885540 / 2853776
Scout Albano-Quezon Avenue1488 Quezon Ave.1103 South TriangleQuezon CityFax 4108092Tels. 3731611 / 41080933723321
Scout Tobias-Timog35-A Timog Ave.Quezon CityFax 4101940Tels. 3740732 / 41019393714363 / 3743167
Sct. Limbaga-T. Morato102 & 103 The ForumTomas Morato Ave.cor. Scout Limbaga St.1103 Quezon CityFax 9289671Tels. 9281982 / 92819459226623
Severino-C. M. RectoCor. C.M. Recto Ave. &Severino Sts.1001 Quiapo, ManilaFax 7339819Tels. 7331094 / 7334126
Shangri-La Plaza Mall-EDSAUnit #129-a, Level 1Shangri-La Plaza MallEDSA cor. Shaw Blvd.Mandaluyong CityFax 6334187Tels. 6382692 / 68769446334187
Shaw Blvd.-StanfordEBC Bldg., Shaw Blvd.cor. Stanford St.Mandaluyong, Metro ManilaFax 7238707Tel. 7238705
Sienna-Del Monte409 Del Monte Ave.1114 Sienna, Quezon CityFax 3671641Tels. 4149000 / 41490014147373 / 36716423671640
Singalong-Pedro Gil1080 cor. Pedro Gil &Singalong Sts. 1007Paco, ManilaFax 5253249Tels. 5237290 / 52305415213647 / 52576445257640
Sixto Antonio-PasigSixto Antonio Ave.cor. R. Bedaña St.Pasig CityFax 6410619Tels. 6410610 / 64106206404957
SM City-FairviewSM City FairviewQuirino Highwaycor. Regalado Ave.Fairview, Quezon CityTelefax 4171056Tels. 9350688 / 41790229350688 / 9389259
SM North EDSASM Center ComplexNorth EDSA 1105Quezon CityFax 9286932Tels. 9272090 / 92965099278645 / 45665784566579
Soler-Reina Regente1087 Soler St., ManilaFax 2435827Tels. 2441166 / 24411442441146 / 2441165
St. Ignatius-Katipunan134 Katipunan Ave.St. Ignatius VillageQuezon CityFax 4371215Tels. 4371211 / 43712134371212 / 9128177
St. James-A. SantosDr. A. Santos Ave.Sucat, 1700 ParañaqueMetro ManilaFax 8269401Tels. 8203446 / 82082118208210
Sto. Cristo-Binondo565 & 567 Sto. Cristo St.Binondo, ManilaTelefax 2420333Tels 2448955 / 24489542448078
Sto. Niño St.-Roosevelt284 Roosevelt Ave.San Francisco del Monte1105 San AntonioQuezon CityFax 3722310Tels. 4111475 / 4108079 / 803722310 / 3747901
Strata 100-OrtigasG/F, Strata 100 Bldg.Emerald Avenue, Pasig CityFax 6327084Tels. 6383670 / 63273756312851 / 63161546331250
Sumulong-MarikinaAmang Rodriguez Ave.Metro ManilaFax 6469650Tels. 6462041 / 64799336462061/6422414
T. Alonzo-Arranque733 T. Alonzo St., ManilaFax 7369493Tels. 7334648 / 73346577334653 / 7334655
T. Alonzo-OngpinUnit 564 & 566, Gel TowerT. Alonzo Street , ManilaTelefax 7331459Tels. 7331483 / 733-95567331461
T. Morato-Kamuningcor. Kamuning &Tomas Morato, Quezon CityFax 4161809Tels. 9278907 / 41618104161808 / 9204724
Tabora-M. de Santos817 Tabora St.1006 Binondo, ManilaFax 2447404Tels. 2446201 / 24468332440198 / 2424189
Taytay-National HighwayKorte Rosario RestaurantTaytay National HighwayIlog Pugad, Brgy. San JuanTaytay, RizalFax 658-6575Tels. 6586574 / 66068706586574 / 28634952864262

122 | Building for the Future
BRANCH DIRECTORY
Tierra Nueva-AlabangSycamore ArcadeAlabang-Zapote NationalRoad 1702 AlabangMuntinlupa CityFax 8070660Tels. 8421406 / 8423255
Times Plaza-U. N. AvenueUnit G-2B, Times Plaza Bldg.Taft Ave. cor. U.N. Ave.Ermita, ManilaFax 4041447Tels. 4041403 / 40414305219792
Timog-EDSANo.134 Timog Ave.Quezon CityFax 9284263Tels. 9284269 / 9229031
T. M. Kalaw-Luneta707 T. M. Kalaw St.cor. Churruca St.Ermita, ManilaFax 5254868Tels. 5256590 / 52448495258378 / 5211266
Tutuban Centermall-C.M. RectoM1-B055 B, G/F CentermallBldg., Tutuban CenterC.M. Recto Ave., ManilaFax 2524236Tels 2544503 / 2524236
U. N. Avenue-J. BocoboEBC Bldg., U.N. Ave.cor. J. Bocobo St., Ermita Manila Fax 5252003Tels. 5249661 to 655212721 / 52465305252033
Valle Verde-E. Rodriguez Jr.Unit 7&8 Cathay Builder’sCorp. Bldg., E. Rodriguez Jr.Ave. cor. Carlo J. Caparas St.Bo. Ugong, Pasig CityFax 6711296Tels. 6711271 / 67105239143350 / 67116096711863
Villa Mendoza-A. Santoscor. Villa Mendoza Subd.Road & Dr. A. Santos Ave.1700 ParañaqueMetro ManilaFax 8266487Tels. 8200019 / 82558718265789
Villar-Salcedo VillageEurovilla 111 CondominiumVillar St., cor. Alfaro St.1227 Makati CityFax 8941049Tels. 8941048 / 81250708181681
Virgo Drive-NorthbayMelandrea III Bldg.Northbay Blvd.Near cor. Virgo DriveNavotas M.M.Fax 2821009Tels. 2829801 / 28377402829802 to 04
Visayas Avenue-Project 657 Visayas Ave.(near Sanville Subdivision)Quezon CityFax 9278710Tels. 9277373 / 4557220
Vito Cruz-TaftBankard Bldg., 2422 Taft Ave.1004 Malate, ManilaTelefax 5260034Tels. 5247926 / 52273695211205
Waltermart-Makati2nd Floor, 790 WaltermartCenter Makati, Chino RocesAvenue cor. Arnaiz AvenueMakati CityTelefax 8873367Tels. 8871560 / 8446561
Washington-Gil PuyatG/F Keystone Bldg.220 Gil Puyat Ave.Makati CityFax 8932183Tels. 8932180 / 84413258440045
West Avenue-Del Monte40 West Ave.1104 West TriangleQuezon CityFax 3714669Tels. 41280493714672 to 734128048
West Trade Center-West AvenueUnit #1, G/F West TradeCenter, West Ave.Quezon CityFax 4158949Tels. 9253446 to 484158947 / 4264214
Ylaya-Padre Rada940-942 Ilaya St.Tondo ManilaFax 2450107Tels. 2421110 / 24502832421652 / 2455478
Zaragosa-Carmen Planas921 Carmen Planas St.cor. Zaragosa St.Tondo, ManilaFax 2455207Tels. 2434879 / 24348822434881
LUZON BRANCHES
A. Banzon-BalangaAntonio Banzon St.2100 Balanga, BataanTelefax 7914205Tels. (047) 2372070(047) 2372150
A. Mabini-BiñanRey Bldg., A. Mabini St.Poblacion 4024Biñan, LagunaFax (049) 5119926Tels. (049) 51199245117788 / 5116386
Abanao Square-BaguioAbanao Square, Abanaocor. Zandueta Sts. Baguio CityFax (074) 4422791Tels. (074) 30435674426027 / 4426028
Aguinaldo Highway-DasmarinasG/F Digital Bldg.Gen. Emilio AguinaldoHighway, Dasmariñas CaviteFax (046) 8502214Tels. (046) 85022128504041 to 42
Alaminos-PangasinanMarcos Avenue, PalamisAlaminos, PangasinanFax (075) 5515632Tels. (075) 5515691-925515615 / 5527106
Alexander-UrdanetaAlexander St., Poblacion2428 Urdaneta, PangasinanFax (075) 5682615Tels. (075) 62424035688238 / 56882416242837
Antorcha-BalayanAntorcha St., BalayanBatangasFax (043) 9211059Tels. (043) 21146869211059 / 9213974
Apalit-PampangaG/F Quintos Bldg.McArthur HighwaySan Vicente, Apalit PampangaTelefax (045) 8791248Tels. (045) 87912473028510
Aparri-Rizal St.Rizal cor. Balisi (Macanaya)Aparri, CagayanFax (078) 8228779Tels. (078) 82283048882516 / 8882011
Bacoor-Aguinaldo HighwayGen. E. Aguinaldo HighwayPanapaan, Bacoor, CaviteFax (046) 4176752Tels. (046) 4173169 /4172998
Bagbaguin-Sta. MariaGov. Halili Ave., BagbaguinSta. Maria, BulacanFax (044) 6414131Tels. (044) 64120996411799 / 64118996412851
Balagtas-McArthurHighwayMcArthur HighwayBrgy. San Juan3016 Balagtas, BulacanFax (044) 6934342Tels. (044) 69329606931685 / 6933406
Balibago-Angeles CityG/F Lawrence PlazaMcarthur Highwaynear cor. Charlot St. BalibagoAngeles CityFax (045) 6257647Tels. (045) 62577758924187 / 8924230
Balintawak St.-Laoagcor. Rizal & Balintawak Sts.2900 Laoag City, Ilocos NorteFax (077) 7714021Tels. (077) 77203157720121 / 7721123
Bangued-AbraUnit 12, The Rosario Bldg.Taft St. cor. Magallanes St.2800 Bangued, AbraFax (074) 7528093Tels. (074) 75252747528094 / 6620001
Batac-WashingtonAoigan Bldg.Washington St., Batac 2906Ilocos NorteFax (077) 7923375Tels. (077) 79230926171556 / 6711038
Bay City Mall-Batangas CityUnit T-9, G/F Bay City MallD. Silang cor. C. Tirona &P. Burgos Sts., Batangas CityTels. (043) 7236900 /7231200 / 7238900
Binakayan-Kawit1497 Natioanal RoadBinakayan 4104 Kawit, CaviteFax (046) 4345676Tels. (046) 43445754344585 / 4345984
Bonifacio St.-TuguegaraoBonifacio St.,Tuguegarao, CagayanFax (078) 8440708Tels. (078) 84626918442124 /84413528442405 / 8441912
Cabuyao-J. P. RizalG/F Lim-Bell Business CenterJ.P. Rizal St., Cabuyao LagunaFax (049) 5314335Tels. (049) 53141085314109 / 5314362
Caceres-NagaE. Angeles cor. Caceres Sts.Naga City, Camarines SurFax (054) 8111232Tels. (054) 47312158111234 / 4733136
Calapan-J. P. RizalJ. P. Rizal St., 5200 CalapanOriental MindoroFax (043) 2884666Tels. (043) 28841044411540 / 4411553
Candelaria-Rizal St.Rizal cor. Valle Sts.Candelaria, QuezonFax (042) 5859092 / 7417085Tels. (042) 7411326 to 277411084 to 857411463 / 7411465
Candon-National HighwayNational Hi-way cor. Abaya St.2710 Candon, Ilocos SurFax (077) 7426410Tels. (077) 74241577426551
Carmen-PangasinanMcArthur HighwayCarmen East 2441Rosales, PangasinanTelefax (075) 5822925Tels. (075) 58273725827305 / 5822836
Castro-LaoagPichay Bldg., J. P. Rizalcor. A. Castro Sts., Laoag CityTelefax (077) 7716098Tels. (077) 77160987715433 / 7720266
Cauayan-IsabelaG/F Omega Cinema MaharlikaHighway Cauayan, IsabelaFax (078) 6522421Tels. (078) 65212896521290 / 6522330
Centennial-ClarkfieldCentennial RoadClark Special Eco. ZoneBalibago, 2009Angeles City, PampangaFax (045) 5995667Tels. (045) 59934875995666 / 59956688934107 / 8934149
C.M. Recto-Lipa131 C. M Recto St.4217 Lipa City, BatangasFax (043) 7561515Tels. (043) 75623137566848 / 7566847

2006 Equitable PCI Bank Annual Report | 123
Concepcion-TarlacL. Jaena cor. L. Cortes Sts.San Nicolas 2316Concepcion, TarlacFax (045) 9230034Tels. (045) 92307929230630
Congreso-MalolosPaseo del CongresoSan Agustin 3000Malolos, BulacanTelefax (044) 7910631Tels. (044) 79162867919241 / 6623411
Daet-Camarines NorteJ. Lukban cor. Moreno Sts.Poblacion DaetCamarines NorteTelefax (054) 7214300Tels. (054) 44025005712956 / 72143004402488
Daraga-Rizal St.Rizal St., 4501 Daraga, AlbayFax (052) 8240272Tels. (052) 82418588241992 / 4833729
Dasmariñas Techno Park-CaviteGovernor’s DriveBrgy. Paliparan IDasmariñas, CaviteFax (046) 9722175Tels. (02)5298138 / 5298137
Dolores-San FernandoMcarthur HighwayDolores 2000San Fernando, PampangaFax (045) 9615286Tels. (045) 86008849612907 / 9634084
Enriquez-LucenaEnriquez cor. Evangelista St.Lucena CityFax (042) 3737799Tels. (042) 37377983737793 / 3737792
EPZA-CaviteCavite EPZA Compound4106 Rosario, CaviteFax (046) 4372642Tels. (046) 43726434376866 / 4376267
F. Tañedo-Tarlac CityF. Tanedo cor. Juan Luna St.Tarlac CityFax (045) 9821299Tels. (045) 98277909821298
FCIE Dasmariñas-CaviteGovernor’s DriveBrgy. LangkaanDasmariñas, CaviteFax (046) 4021134Tels. (046) 40211334021135
Fernandez-Dagupan CityA. B. Fernandez Ave.2400 Dagupan CityPangasinanFax (075) 5222791Tels. (075) 51559095152469 / 52227925235441
Gateway Business Park-CaviteGateway Business ParkC. Delos Reyes Ave.4107 Gen. Trias, CaviteFax (046) 4330178Tels. (046) 43302784330180 / 4330179
Gen. Luna-NagaGen. Luna St.4400 Naga CityCamarines SurFax (054) 4737913Tels. (054) 81121574738498 / 47390168118091
Governor’s Drive-CarmonaMotorola Phils., Inc CompoundCarmona National RoadBo. Maduya 4116Carmona, CaviteTelefax (046) 6992124Tels. (046) 43017734303270 / 2425208(Laguna Line)
Hagonoy-BulacanG/F Ang Puso ng HagonoyShopping Center PlazaHagonoy, BulacanTelefax (044) 7933519Tels. (044) 79335197933518 / 7933520
Highway 1-IrigaContreras Bldg., cor. Highwayand Ortigas St., San Roque4431 Iriga City, Camarines SurFax (054) 4560069Tels. (054) 65503052993649 / 65503432992380 / 2992329
Ilagan-IsabelaAlong Maharlika HighwayCalamagui 2nd Ilagan, IsabelaFax (078) 6223503Tels. (078) 62226536223603
Imus-Aguinaldo HighwayG/F DCR Building, AguinaldoHighway, 4103 Imus, CaviteFax (046) 4713214Tels. (046) 87572424710989 / 47110898757243
J. Luna-Tarlac CityJ. Luna St. near cor.McArthur Tarlac, TarlacFax (045) 9823192Tels. (045) 98290059825539 / 9823119
J. Orosa-BauanJ. Orosa St., 4201Bauan, BatangasFax (043) 7271515Tels. (043) 7271514
J. P. Rizal-BaliwagJ. P. Rizal St. San JoseBaliwag, BulacanFax (044) 7661225Tels. (044) 76612247663172 / 6732562
Kumintang-Batangas CityNational HighwayBrgy. Kumintang IlayaBatangas City, BatangasFax (043) 7231698Tels. (043) 72301977234579 / 9800433
La Trinidad-BenguetS & B Bldg., Km. 4 Balili2601 La Trinidad, BenguetTelefax (074) 4221092Tels. (074) 42210934222461 / 3091517
Lingayen-Pangasinan80 Avenida Rizal EastLingayen, PangasinanFax (075) 5428003Tels. (075) 66212835428004 / 6621284
Lipa-RotondaC.M. Recto Ave., Lipa CityFax (043) 7563898Tels. (043) 75628699814757 / 75628089814316 / 7570820 to 21
M. Belen-Silang194 J. Rizal cor. M. Belen St.Silang, CaviteTelefax (046) 4141048Tels. (046) 4141643 to 444142108 to 094141047 to 48
Magsaysay-BaguioG/f Golden Court Bldg.258 Magsaysay Ave.Baguio CityFax (074) 4438138Tels. (074) 44381374449924 / 4435028
Maharlika Road-CabanatuanMaharlika Roadnear cor. Sanciangco St.Cabanatuan CityFax (044) 4643946Tels. (044) 46339854633408 / 4633264
Malhacan-MeycauayanBrgy. Northern HillsMalhacan, MeycauayanBulacanFax (044) 6953131Tels. (044)69531446953927 / 22837666953143
Marilao-McArthur HighwayUnit I-3 Cecilia CommercialComplex Abangan NorteMcArthur Highway3019 Marilao, BulacanTelefax (044) 7113405Tels. (044) 71134057111609 / 2996883
Megacenter Mall-CabanatuanUnit 49-B Upper G/FMegacenter MallGen. Tinio & Melencio Sts.Cabanatuan CityTelefax (044) 4633271Tels. (044) 46331434633160 / 4633285
Miranda-Angeles CityPcib Bldg., Miranda St.Angeles City, PampangaFax (045) 8887373Tels. (045) 88777128877378 / 88772423234103 / 8880102(02) 2468373
Muñoz-Nueva EcijaT. Delos Santos St.3119 Muñoz, Nueva EcijaFax (044) 4560356Tels. (044) 45608924560893 / 4560123
NE Pacific Mall-CabanatuanGround Level, Unit CM-2NE Pacific Mall, Km.111Maharlika HighwayCabanatuan City, Nueva EcijaTelefax (044) 4642026Tels. (044) 46420264642025
Nepo Mart-Angeles CityG/F Angeles Business CenterTeresa Ave., Nepo MartComplex Angeles CityFax (045) 322-4478Tels. (045) 88883353224478 / 88861198881522
North-Calamba CrosssingCalamba Crossing NationalHighway 4027Calamba, LagunaFax 5454706 to 08Tels. (049) 5455981(049) 54547095208847
Obando-J. P. RizalJ.P. Rizal St. BarangayCatanghalan, ObandoBulacanFax (044) 2940689Tels. (044) 29227752940690 / 2943784
Olivarez Plaza-Los BañosOlivarez Plaza Cinema &Supermarket Complex alongNational HighwayBrgy. Batong MalakeLos BañosFax (049) 5366355Tels. (049) 53663575366358 / 52083635364765
Olongapo-Rizal Avenue2043 Rizal Ave., 20th PlaceWest Bajac Bajac 2200Olongapo City, ZambalesFax (047) 2222250Tels. (047) 22294732223974 / 2245063
P. Burgos-Batangas CityRizal Ave. cor. P. Burgos St.4200 Batangas, Batangas CityFax (043) 7235974Tels. (043) 7235975 to 77
P. Burgos-Cavite Citycor. P. Burgos & P. Julio Sts.Caridad, 4100 Cavite CityFax (046) 4310755Tels. (046) 43102574310143
Pacita-San PedroG/F M. Allen Bldg., Km. 31Old National HighwaySan Pedro, LagunaFax 8684998Tels. 8684994 / 52028598682130 / 8684997
Paniqui-TarlacM. H. Del Pilar St.McArthur Highway2307 Paniqui, TarlacFax (045) 9310298Tels. (045) 93118439311808 / 9310355
Perez-Dagupan CityPerez Blvd, 2400Dagupan City, PangasinanFax (075) 522-4474Tels. (075) 52246245227830 / 5155201
Plaza Burgos-GuaguaYabut Bldg., Plaza Burgos2003 Guagua, PampangaTelefax (045) 9000194Tels. (045) 90002139004454 / 9010629
Plaza Maestro-ViganG/F Plaza MaestroCommercial ComplexBurgos & Florentino Sts.Vigan City, Ilocos SurTelefax (077) 7223934Tels. (077) 72239687223974 / 72239677223930

124 | Building for the Future
BRANCH DIRECTORY
Poblacion-Sta. MariaM. De Leon St., Poblacion3022 Sta. Maria, BulacanTelefax 6414725Tels. (044) 6411548(044) 6411578
Pulilan Junction-BulacanDoña Remedios HighwayPulilan JunctionPulilan BulacanFax (02) 2998329Tels. (044) 6702112(044) 6760225
Puregold-ClarkfieldPuregold Duty Free(Expansion) Bldg.Claro M. Recto HighwayClark Special Economic ZoneClark Field, PampangaFax (045) 5993283Tels. (045) 59932875993284 / 5993285
Quezon Avenue-LucenaQuezon Ave. cor. Profugo St.Lucena City, QuezonFax (042) 3735930Tels. (042) 71034687104176 / 7102916
Rizal Avenue-Puerto Princesa261 Rizal Ave., 5300Puerto Princesa CityPalawanFax (048) 4344243Tels. (048) 43442444332491 / 4344242
Rizal St.-Legaspi CityRizal St., 4500Legaspi City, AlbayFax (052) 4807361Tels. (052) 48079568202413 / 2146356
Rizal St.-San PabloG/F Farcon Bldg.Rizal Ave. cor. Lopez Jaena St.San Pablo CityFax (049) 5611881Tels. (049) 56118805611882 to 85
Robinson’s Place-Dasmariñas CaviteLevel 1 Robinson’s Place-Dasmariñas, AguinaldoHighway cor. Governor’sDrive, Dasmariñas CaviteFax (046) 4162062Tels. (046) 85219898521990 / 4162063
Robinson’s Place-LipaLevel 1, Space L1-177Robinson’s Place-LipaLipa Highway, Lipa CityBatangasFax (043) 7573063Tels. (043) 75730624042018
Robinson’s Place-Sta. RosaLevel 1, Space 014 (G/F Level)Robinson’s Sta. RosaSta. Rosa National HighwaySta. Rosa, LagunaTels. (049) 53444855344484 / 5344486
Robinson’s Starmills-PampangaLevel 1, Seaport Gate LobbyRobinson’s Starmills PampangaOlongapo-gapan RoadSan Fernando City, PampangaTelefax (045) 6363527Tels. (045) 63635276363528
Roxas-Isabela23 Osmeña RoadBantug Mallig Plain 3320Roxas, IsabelaTelefax (078) 6427166Tels. (078) 642-7166642-8638 / 6428636
Rustan’s-LagunaTechnoparkG/F Rustan’sSta. Rosa Bldg. (North Wing)Laguna TechnoparkAyala Land, Brgy. Don JoseSta. Rosa, LagunaFax (049) 5208455Tels. 5413074 / 5413075
Salvador-GuimbaAfan Salvador St.3115 Guimba, Nueva EcijaFax (044) 6112058Tels. (044) 61100566110058 / 9430212
San Agustin-San FernandoMcArthur HighwayBgy. San AgustinSan Fernando, PampangaTelefax (045) 9635194Tels. (045) 96351949635193 / 9635241
San Carlos-PangasinanPalaris St., 2420San Carlos, PangasinanFax (075) 5324522Tels. (075) 53245225323845
San Fernando-La UnionQuezon Ave. 2500San Fernando, La UnionFax (072) 7001388Tels. (072) 242023924247897001387 / 70013922424643
San Jose-Nueva EcijaMaharlika Road 3121San Jose City, Nueva EcijaFax (044) 5111527Tels. (044) 94713769472998-99
San Juan-BatangasMarasigan cor. Kalayaan Sts.cor. San Juan, BatangasFax (043) 5754287Tels. (043) 57542875754319 / 3413029
San Juan St.-ViracSan Juan cor. Rizal Sts.4800 Virac, CatanduanesFax (052) 8111717Tels. (052) 8112229 to 318111434
San Rafael-BulacanKm. 60 Cagayan Valley RoadCruz na Daan, San RafaelBulacanFax (044) 6771548Tels. (044) 67715516771545 / 67715496771550
Sanciangco-CabanatuanSanciangco St.Cabanatuan CityFax (044) 4630020Tels. (044) 46409094635853 / 6003251
Santiago-IsabelaMaharlika Highwaycor. Quezon Ave. VictoryNorte Santiago City, IsabelaFax (078) 6828245Tels. (078) 68259466828592 / 68274146824060 / 6827439
Session Road-BaguioG/F National Life Bldg.Session Road, Baguio CityFax (074) 4422583Tels. (074) 44382014423818 / 4438202
Sindalan-San Fernando CityPalm Bldg., McArthurHighway, SindalanSan Fernando City, PampangaFax (045) 8600278Tels. (045) 63641136364114
Solano-Nueva VizcayaNational HighwaySolano Nueva VizcayaTelefax (078) 32677543267283
Sorsogon-Rizal St.Jomil Bldg., Rizal St.Sorsogon, SorsogonFax (056) 2112100Tels. (056) 21123912111821 / 4215110
Sta. Cruz-LagunaAlong Regidor St.Sta. Cruz, LagunaFax (049) 8080226Tels. (049) 80802388080239 / 80802298080233 / 8080241
Sta. Rosa-South ExpressNational RoadPulong, Sta. Cruz 4026Sta. Rosa, LagunaTelefax (02) 8864738Fax (049) 8372941Tels. (02) 52081985390295
Sto. Tomas-BatangasMaharlika HighwaySan AntonioSto. Tomas, BatangasFax (043) 7786361Tels. (043) 31803887780535
Tabaco-AlbayAlong Ziga Ave.Tabaco, AlbayFax (052) 4877777Tels. (052) 48777554877744
Tagaytay - RotondaFarblyn Tower, Emilio Aguinaldo Highway,TagaytayTel No. (046) 413-0355 413-0352 / 413-0353
Talavera-Nueva EcijaMaharlika Highway, Talavera, Nueva EcijaFax (044) 4111276Tels. (044) 95114224111738 / 9511401
Tanauan-A. MabiniA. Mabini St., Tanauan4232 BatangasFax (043) 7782137Tels. (043) 77826827782137 / 77804384050710 / 4050711
Times Square-Subic420 Rizal Highway Subic BayFreeport Zone, 2200Olongapo City, ZambalesFax (047) 2527420Tels. (047) 25229392527070 / 2527050
Tinio-GapanTinio St., 3105 GapanNueva EcijaFax (044) 4862288Tels. (044) 48622354860556 / 48603054863345 / 6040266
Vigan-Quezon Avenuecor. Bonifacio St.& Quezon Ave. 2900Vigan, Ilocos SurFax (077) 7222582Tels. (077) 72217807221781 / 7222581
Waltermart-CalambaG/F Waltermart CalambaReal St., Barangay RealCalamba, LagunaFax (049) 5457250Tels. (049) 54572525457251 to 55
Waltermart-Sta. RosaSan Lorenzo Drivecor. Balibago Road. Brgy.Balibago 4026Sta. Rosa, LagunaTelefax (049) 8374977Tels. (049) 83749765344630 / 5344631(02) 5208683
Zamora-MeycauayanZamora St., Barrio CalvarioMeycauayan, BulacanFax (044) 8409140Tels. (044) 22831332283907 / 22836488403718 / 8401386
VISAYAS BRANCHES
A.S. Fortuna-MandaueUnits 3 & 4, Mirhan Bldg.A.S. Fortuna St.cor. 8 Road DriveMandaue City, CebuFax (032) 3461532Tels. (032) 34370954161567 / 34615323437095
Allen-Catbalogandel Rosario St. cor. Allen Ave.6700 Catbalogan, SamarFax 055) 5439110Tels. (055) 25154773561706 / 2515541
Araneta-BacolodAraneta cor. Gonzaga Sts.6100 Bacolod CityNegros OccidentalTelefax (034) 4341233Tels. (034) 43412334342754 / 43427514342753 / 4342752
Banilad-Cebu CityG/F PDI CondominiumArchbishop Reyes Ave.Banilad, Cebu CityFax (032) 2340182Tels. (032) 23401862340184 / 23401894162077
Binalbagan-NegrosOccidentalBiscom CompoundBinalbagan, NegrosOccidentalFax (034) 3888270Tels. (034) 3888258742-8470

2006 Equitable PCI Bank Annual Report | 125
Bogo-CebuP. Rodriguezcor. San Vicente Sts.6010 Bogo, Cebu City, CebuTelefax (032) 2512032Tels. (032) 25120304348900
Borromeo-Cebu CityMagallanes cor. Borromeo Sts.Cebu CityFax (032) 2538823Tels. (032) 25561652563583 / 2537449
Burgos-OrmocCor. Burgos & Rizal Sts.Ormoc City, LeyteFax (053) 5619759Tels. (053) 25548942557948 / 2554894
C. P. Garcia Ave.-TagbilaranC. P. Garcia Ave.cor. H. Grupo St.6300 Tagbilaran City, BoholFax (038) 2353373Tels. (053) 41149215019890
Cabahug-CadizCabahug St. 6121 CadizNegros OccidentalFax (034) 4930510Tels. (034) 49304794930667
Capitol Shopping-BacolodBenigno Aquino DriveCapitol Shopping, Bacolod CityNegros OccidentalFax (034) 43532114342446Tels (034) 43450574342448 / 43532164334484 / 4353212
Cebu-Ayala CenterS#185 Retail Level 1South Entry, Ayala CenterCebu, Cebu BusinesPark, Cebu CityFax (032) 2339620Tels. (032) 23396212339623 / 2339627
Central-IloiloIznart Street(Lot 317-B-2-A-1)5000 Iloilo City, IloiloTelefax (033) 3377210Tels. (033) 33504173351105 / 3377210
Colon-DumagueteColon St. fronting Bldg. Vof City Public Market,Poblacion, Dumaguete CityTelefax (035) 2254462Tels. (035) 22544622255022 / 22547874227513 / 2257660
Downtown-Roxas CityRoxas Ave.Roxas City, CapizFax (036) 6210054Tels. (036) 62118886210210 / 6210112
EPZA-MactanMactan - EPZA Compound6000 Lapu-lapu City, CebuFax (032) 3403912Tels. (032) 3412250 / 603403700 / 4955151
Escalante-NegrosOccidentalNational Highway, EscalanteNegros OccidentalFax (034) 4540125Tels. (034) 45401247247022
F. Gonzales-Cebu CityF. Gonzalescor. Magallanes Sts.Cebu CityFax (032) 2532245Tels. (032) 2536266 /2532246 / 4148088
F. Ramos-Cebu City143 F. Ramos St.6000 Cebu City, CebuFax (032) 2551515Tels. (032) 25509592536545 / 4125808
Fuente Osmeña-Cebu CityFuente Osmeña RotundaCebu CityFax (032) 2554035Tels. (032) 25540342554036
Gatuslao-Bacolod26 & 28 Gov. V. Gatuslao St.Bacolod City, NegrosOccidentalFax (034) 4333378Tels. (034) 4333464 to 66
Goldenfield-BacolodGoldenfield CommercialComplex, Araneta HighwaySingcang, Bacolod CityNegros OccidentalFax (034) 4351495Tels. (034) 43305094343738 / 433-0511
Gorordo-Cebu CityGorordo Ave., Lahug 6000Cebu City, CebuFax (032) 2314054Tels. (032) 23130672330001 / 2335767
Gov. Villavert-AntiqueCarretas cor. Solana St.Panay Islands5700 San Jose, AntiqueFax (036) 5408398Tels. (036) 32020023201814 / 5407770
Hilado-BacolodHilado cor. F.Y. Manalo Sts.6100 Bacolod CityNegros OccidentalTelefax (034) 4351441Tels. (034) 43320074347698 / 4323365
Hinigaran-NegrosOccidentalAguinaldo cor. Rizal Sts.Hinigaran, 6106Negros OccidentalTelefax (034) 3917794Tels. (034) 39177957407384
Iloilo-Quezon St.Lots 3 & 5 Quezon St.Iloilo CityFax (033) 3370870Tels. (033) 33505953350594 / 3350597
Iznart-IloiloIznart St., 5000Iloilo City, IloiloFax (033) 3350669Tels. (033) 33690193377795 / 3351301
Jaro-IloiloArguelles cor. Rizal Sts.Jaro, Iloilo City, IloiloFax (033) 3208172Tels. (033) 32970923208171 / 3295290
Juan Luna-Cebu CityGokongwei Bldg.Juan Lunacor. Lapu-lapu Sts., 6000Cebu City, CebuFax (032) 2536861Tels. (032) 25446934121800
Kabankalan-NegrosOccidentalGuanzon St. Kabankalan6111 Negros OccidentalFax (034) 4712246Tels. (034) 471214647121474712146
Kalibo - AklanAlong XIX Martyrs Street,Kalibo, AklanTelefax (036) 268-8610Tels. (036) 2688612 / 26886132627000 / 2688611
Lacson-BacolodLacson cor. Galo Sts.6100 Bacolod CityNegros OccidentalFax (034) 4354531Tels. (034) 4354531 to 324333451
Ledesma-IloiloLedesma St. 5000Iloilo City, IloiloTelefax (033) 3363315Tels. (033) 33813873351117
Magallanes-Cebu CityMagallanes cor. Plaridel Sts.6000 Cebu CityFax (032) 2538572Tels. (032) 25484672551728 / 4123398
Mandalagan-LacsonG/F Sta. Clara Estate BuildingLacson St., MandalaganBacolod CityFax (034) 4412443Tels. (034) 44111514410216
MEZ II-Lapu lapu CityUnit 204 NGA Bldg. 2Pueblo VerdeMEZ II, Basak, Lapu lapu CityFax (032) 3415833Tels. (032) 3415833341-5834 / 341-5835
North Reclamation-Cebu CityBlk. 20-A cor. Port Centre Ave.& San Jose de la MontañaNorth Reclamation AreaCebu CityFax (032) 2320328-29Tels. (032) 2320321-24
North Road-CebuNational HighwayLabogon Mandaue City, CebuFax (032) 3451061Tels. (032) 3451017 to 183451090 / 3453394
North-MandaueNational HighwayMandaue CityFax (032) 3461061Tels. (032) 34559913455993 / 3462180
Oppus-MaasinTomas Oppus St.6600 MaasinSouthern LeyteFax (053) 3812032Tels. (053) 38125723812495 / 5708585
Osmeña Blvd.-Cebu CityOsmeña Blvd.cor. Ma. Cristina St.6000 Cebu City, CebuFax (032) 2530659Tels. (032) 25446542542803 / 2544643
Rosario-LacsonLot 296-B-7, Lacson St.cor. Rosario St., Bacolod CityNegros OccidentalFax (034) 4330234Tels. (034) 4337991 to 934332654
Salazar-TaclobanSalazar St. Tacloban CityLeyte 6500Fax (053) 3256672Tels. (053) 32550943212728 / 3212985
San Carlos-NegrosOccidentalS. Carmona St. cor. Rizal St.San Carlos CityNegros OccidentalFax (034) 3125657Tels. (034) 31251403125263 / 7299581
Silay-FigueroaFigueroa cor. Rizal St.Silay City, 6116Negros OccidentalTelefax (034) 4953787Tels. (034) 49537877149149
SM City-IloiloLower G/F Unit No. 73SM City IloiloBenigno Aquino Ave.Jaro-West DiversionMandurriao, Iloilo CityFax (033) 3200123Tels. (033) 32002153200247 / 3200745
South-MandaueNational Highway6014 Mandue City, CebuFax (032) 3467915Tels. (032) 34601013452458 / 3464689
Tabo-an-Cebu CityT. Abella St.San Nicolas Central6000 Cebu CityFax (032) 2611378Tels. (032) 26144232614422 / 26113772614421
Tacloban-Rizal AvenueRoqson Bldg. Rizal Ave.cor. P. Burgos St. 6500Tacloban City, LeyteFax (053) 5238075Tels. (053) 52380155230366 / 3214265
Valeria-IloiloValeria cor. Solis Sts.5000 Iloilo City, IloiloFax (033) 3364467Tels. (033) 33644653379219 / 3379257
Victorias-NegrosOccidentalPoblacion Victorias6119 Negros OccidentalFax (034) 3992746Tels. (034) 39927463993616 / 3993617

126 | Building for the Future
BRANCH DIRECTORY
MINDANAO BRANCHES
Agdao-Davao CityLapu-lapu St., 8000 AgdaoDavao City, Davao Del SurFax (082) 3003024Tels. (082) 2216205 305-9111
Alunan Highway-TacurongAlunan Highway, 9800Tacurong Sultan KudaratTelefax (064) 2003035Tels. (064) 47702072003134 / 4770055
Bajada-Davao CityAna Socorro BuildingJ.P. Laurel St., BajadaDavao CityFax (082) 3009814Tels. (082) 22441373055778 / 3008975
Bangoy-Davao CityR. Magsaysay Ave.cor. Bangoy St., 8000 DavaoCity, Davao Del SurFax (082) 2211251Tels. (082) 22144802272802 / 22721138407329 ext. 0187
Bankerohan-Davao CityNicolas I Bldg., Quirino Ave.8000 Davao CityDavao Del SurTelefax (082) 2214365Tels. (082) 30558042214951 / 2214365
C. M. Recto-Davao City383 Claro M. Recto St.Davao City 8000Fax (082) 2263147Tels. (082) 22106712277351 / 22785912263703 / 2263723
Cogon-Cagayan de OroPres. S. Osmeña cor. RamonChavez Sts., Cogon 9000Cagayan De OroMisamis OrientalFax (08822) 724567(088) 8565702Tels. (08822) 724568 / 726412(088) 8563728
Del Pilar-IliganB.C. Labao cor. Del Pilar St.Iligan CityTelefax (063) 2239450Tels. (063) 22394462239447 / 2239448
Digos-Rizal AvenueRizal Avenue, Zone IIDigos, Davao Del SurFax (082) 5534764Tels. (082) 55374395532931
Dipolog-Quezon AvenueQuezon Ave., 9100 DipologCity Zamboanga Del NorteFax (065) 2128164Tels. (065) 21223412128163 (dial up )2122339
F. S. Pajares-PagadianF. S. Pajaras Ave., PagadianCity 7016 Zamboanga Del SurFax (062) 2141744Tel. (062) 2141745
Gaisano-ButuanG/F, Unit 1-14, GaisanoButuan, J. Aquino Blvd.cor. J. Rosales Ave.Butuan City, Agusan del NorteFax (085) 8151868Tels. (085) 81518673417827 / 3418078
Gingoog-National HighwayNat’l Highway, 9014Gingoog CityMisamis OrientalTelefax (088) 8610201Tels. (088) 8611104(08842) 7595 / 73138610460
Ipil-ZamboangaNational Highway, IpilZamboanga Del SurTelefax (062) 3332380Tel. (062) 3332380
Isulan-National Highway#075 National HighwayKalawag 2, IsulanSultan KudaratFax (064) 4710015Tels. (064) 47100262013247
Jaycee Avenue-MidsayapJaycee Ave., MidsayapNorth Cotabato 9410Fax (064) 2298327Tels. (064) 22975892297590
KCC Mall-General SantosUnit 018G/F KCC Mall of GensanJose Catolico Sr. Ave.General Santos CityCotabatoTelefax (083) 3022958Tels. (083) 30173273017330 / 5529808
Kabacan-Rizal AvenueRizal Ave., National Highway9407 KabacanNorth CotabatoTelefax (064) 2482118Tels. (064) 24821192482432
Kidapawan-Quezon Blvd.Quezon Blvd., 9400Kidapawan North CotabatoTelefax (064) 2881687Tels. (064) 27830182881689 / 2783018
Lapasan-Cagayan de OroC. M. Recto HighwayLapasan, 9000 Cagayan deOro City, Misamis OrientalFax (088) 8563234Tels. (088) 85632338563235 / (08822) 725253
Mabini St.-MatiRizal cor. Mabini Sts.8200 Mati, Davao OrientalTelefax (087) 3883336Tels. (087) 3883219
Magallanes St.-SurigaoMagallanes cor. San NicolasSts. 8400 Surigao CityFax (086) 8260293Tels. (086) 231-72262317541 / 826-34252317270
Makakua-CotabatoMakakua St.9600 Cotabato CityMaguindanaoFax (064) 4212713Tels. (064) 42149804212069 / 42149344215819
Mayor Jalardon - Zamboanga CityMayor Jalardon Avenue, Brgy. Canelar,Zamboanga CityTel No. (062) 991-0924 992-3892
Montilla-ButuanMontilla Blvd.near cor. Lopez Jaena St.Butuan City,Agusan del NorteTelefax (085) 3427055Tels. (085) 81544308154429 / 81544313426245 / 3415240
Oroquieta-WashingtonWashington St., OroquietaCity, 7207 Misamis OccidentalTelefax (088) 5311532Tels. (088) 5311121 to 225312171
Ozamis-Rizal AvenueRizal Ave., 7200 Ozamis CityMisamis OccidentalFax (088) 5211529Tels. (088) 52100295210039
Pendatun-Gen. SantosG/F Sydney Hotel. Pioneer St.cor, Magsaysay Ave.8400 Gen. Santos CityS. CotabatoFax (083) 3023180Tels. (083) 55362523023179 / 55220625536252 / 5522963
Pioneer St.-Gen. SantosNational Hi-way cor. RoxasAve., 9500 Gen. Santos CityS. CotabatoFax (083) 3010226Tels. (083) 55222425522675 / 3021690
Quezon Avenue-IliganQuezon Ave., 9200Iligan City, Lanao Del NorteFax (063) 2216545Tels. (063) 22134402213685
R. Alunan-KoronadalR. Alunan Ave.cor. Osmeña St. KoronadalSouth CotabatoTelefax (083) 2282219Tels. (083) 22825412282323 / 2282540
R. Magsaysay Ave.-Davao CityRamon Magsaysay Ave.cor. Lizada St., 8000Davao City, Davao Del SurFax (082) 2220071Tels. (082) 22101262244193 / 30085282254045
Rizal St.-ZamboangaRizal St., Zamboanga City7000 Zamboanga Del SurTelefax (062) 9911476Tels. (062) 9914804
Robinsons-Cagayan de OroLevel 2, RobinsonsCagayan De Oro, RosarioCresent cor. Florentino St.Limketkai ComplexCagayan De Oro CityFax (088) 8567117Tels. (088) 85671158567116
San Pedro-Davao CityG/F KDC Bldg., San PedroStreet, Davao CityDavao Del SurFax (082) 2218186Tels. (082) 22182212271251 / 3055805
Santiago St.-Gen. SantosIreneo Santiago Blvd.9500 Gen. Santos CitySouth CotabatoTelefax (083) 5522603Tels. (083) 55221465522404 / 5535618
Sta. Ana-Davao CityMonteverde cor. F. BangoySts., 8000 Davao CityDavao Del SurFax (082) 2263690Tels. (082) 22746382214746 / 30558102274638
Tagum-Rizal St.577 Rizal St., 8100 TagumDavao Del NorteTelefax (084) 2173664Tels. (084) 21736642173469 / 2184691
Toril-Davao CityAgton St., Toril, Davao CityTelefax (082) 2912276Tels. (082) 29122783010107
Valencia-BukidnonM. L. Quezon St.cor. Ginuyuran Rd.8709 Valencia, BukidnonFax (088) 8282148Tels. (088) 82833312222185
Vamenta-Cagayan de OroV. Castro St., Carmen District9000 CDO, Misamis OrientalFax (088) 8581133Tels. (08822) 723676 / 722660
Velez-Cagayan de OroVelez Road corAbujuela St.Cagayan de OroFax (088) 8564792Tels. (088) 8571943(08822) 729360723745
FOREIGN BRANCH
HONG KONG7/F Silver Fortune Plaza No. IWellington St., CentralHong KongFax (00852) 2810005028698677Tels. (00852) 2522999328680323

2006 Equitable PCI Bank Annual Report | 127
EQUITABLE SAVINGS BANK
METRO MANILA BRANCHES
Alabang HillsRBC Corporate CentreDon Jesus Blvd.Barangay Cupang MuntinlupaFax 8429006Tels. 7723693 / 36947723695 / 7723693
BF Resort-Las PiñasESB Bldg. Blk.4Lot 9 BF Resort DrivePhase 4, BF Resort VillageLas PiñasFax 8738918Tels. 8738925 / 8738923
Concepcion-MarikinaESB Bldg. Bayanbayanan Ave.corner Molave St.Concepcion, MarikinaFax 9973832Tels. 9973835 / 9973824
Dapitan-SampalocDapitan cor. Ma. Cristina Sts.Sampaloc, ManilaFax 7318544Tels. 7431202
Don A. Roces AvenueRotary Center Bldg.Don A. Rocescor. Mother IgnaciaBgy. Laging HandaQuezon CityFax 4169395Tels. 3763341 / 4150691
Farmer’s CubaoUnit III, G/F SampaguitaTheatre Bldg., along Gen.Araneta & Gen. Roxas Sts.Cubao, Quezon CityFax 9118228Tels. 9118822 / 4385563
Gen T. De Leon - Valenzuelaalong Gen. T. De Leon Street, Valenzuela CityTels. 2923365 / 29233672923512
GreenhillsG/F Equitable PCI Bank Bldg.llOrtigas Ave. cor. RooseveltGreenhills, San JuanMetro ManilaFax 7218353Tels. 7258375 / 72675577267604
Isidora HillsESB Bldg.Pook Ligaya Riding GroundInterneighborhood RoadIsidora Hills Subd.Brgy. Holy SpiritQuezon CityFax 9517744Tels. 9517741 / 77439517742
Magallanes-MakatiMaga Center, 1016 SanAntonio St., Paseo deMagallanes, Brgy. MagallanesMakati CityTels. 7570391 / 03927570394 / 0393
Mayon-Amoranto489 Units A& B Mayon St., Sta. Mesa Heights, Quezon CityFax 4133697 Tels. 742-6013 / 742-5201
Moonwalk-MervilleG/F Seal I Bldg.Armstrong Ave.cor. Yosemite St.Moonwalk Subd.Parañaque CityFax 7760690Tels. 7760692 / 7760691
Muñoz-Roosevelt352 Roosevelt Ave.San Francisco, Del MonteQuezon CityFax 4110405Tels. 4110475 / 3736884
Pasig-A. MabiniG/F CFM Bldg.No. 97 A. Mabini St.Pasig CityFax 6426834Tels. 6412298 / 6423755
Pasig-KapitolyoG/F Cabarrus Bldg.No. 9 East Capitol DriveBarrio Kapitolyo,Pasig CityFax 7477003Tels. 6388577 / 6388574
PaterosG/F Milaor Bldg., Almeda St.Poblacion, Pateros, M.M.Fax 6439467Tels. 6439463
Poblacion - MuntinlupaGrd. Flr. Elizabeth Center Bldg. National Road Poblacion, MuntinlupaFax 8614364 Tels. 8614366 / 8614367
Shorthorn-Project 8ESB Bldg. No. 41 ShorthornSt,Brgy. Toro, Project 8Quezon CityFax 9260827Tels. 9260840 / 9260819
Talipapa-NovalichesG/F No. 388 Quirino HighwayBrgy. Talipapa, NovalichesQuezon CityFax 9300081Tels. 9300027
Tandang SoraG/F D & B Royal Midway Plaza# 419 Tandang SoraBarangay, CuliatQuezon CityFax 4567473Tels. 9329329 4567478 / 7472
Teacher’s VillageG/F Luisa 2 Bldg.107 Maginhawa St.Teachers Village, Quezon CityFax 4338716Tels. 4336780 / 4338720
Wilson-GreenhillsESB Bldg. Wilsoncor. Wilson RoadGreenhills, San Juan, M. M.Fax 7245856Tels. 7273764 / 3943
Xavierville AvenueG/F Xavierville SquareCondominium, 38 XaviervilleAvenue, Loyola HeightsQuezon CityFax 9298028Tels. 4341019 / 9298069
LUZON BRANCHES
AngelesPlaza Rafael I151-D Sto. Rosario St.Sto. Domingo, Angeles CityTels. (045) 88712128870404
BiñanKm. 35 National Highway, San Antonio, Biñan, LagunaTels. (049) 5118023(049) 5116952
Cavite CityESB Bldg. P. Burgos Ave.Caridad, Cavite CityFax (046) 5040086Tels. (046) 5040134
Circumferential Road-AntipoloCircumferential Roadcorner F. Manalo St.Antipolo City, RizalTels. 6965205 / 6965212
LucenaNo. 505 Quezon Avenue Ext.Brgy. Gulang-Gulang,Lucena City, QuezonTels. (042) 3737127(042) 3735573
Masinag-AntipoloESB Bldg. Sumulong HighwayMasinag Mayamot, AntipoloFax 6824199Tels. 6824194 / 6824198
Pallocan West-Batangas CityManuela Pastor Ave.Pallocan West, Batangas CityTels. (043) 7238162(043) 7237814
Tapuac-Dagupan CityUnits 8-10 Mother GoosePlay School Bldg., McArthurHighway, Tapuac DistrictDagupan City, PangasinanTels. (075) 5236330(075) 5236331(075) 5235630
Taytay RizalESB Bldg. East Road, TaytayRizal (near Taytay BagongPalengke)Fax 2863271Tels. 6605393 / 6605392
VISAYAS BRANCHES
Banilad - CebuGovernor M. Cuenco, Banilad, Cebu CityTels. (032) 3433669(032) 3433640
DumagueteSta. Rosa St., DumagueteCity, Negros OrientalTelefax (035) 2262537Tels. (035) 42259004225903
Gorordo-Salinas Drive Cebu117 Gorordo Ave.Lahug, Cebu CityTels. (032) 23209142314581
Lopue’s East - Bacolod CityUnits 24 & 25 Lopue’s East Center, Annex Bldg., Carlos Hilado National Hi-way, Brgy Villamonte, Bacolod CityTels. (034) 434-9671(034) 4343554 (034) 4349319
Tabuc Suba-IloiloRoger’s BldgMc Arthur HighwayTabuc Suba, Iloilo CityTels. (033) 2314581(033) 2330156
MINDANAO BRANCHES
C. M. Recto-CDO BranchESB Bldg.Claro M. Recto Ave.Cagayan De Oro City 9000Fax (088) 8562617Tels. 088) 85640678564013
Davao-MatinaNo. 36 Peacenest Bldg.Ecoland Subd, Quimpo Blvd.Matina, DavaoFax (082) 2975360Tels. (082) 2990172 (082) 2975360
Lobregat Highway-ZamboangaYubenco Star Mall, Maria Clara Lobregat Highway, Brgy, Putik Zamboanga CityTels. (062) 9841192(062) 9840895

128 | Building for the Future
I. INDIVIDUALA. CONSUMER FINANCINGAuto Loans (also available at
Equitable Savings Bank)1 Own-A-Car2 Own-A-Car Plus
Housing Loans (also available at Equitable Savings Bank)1 Own-A-Home2 Own-A-Home Plus3 Own-A-Home Special4 Own-A-Home Stretch
Multi-purpose Loans1 Credit-On-The-House Credit Line
2 Credit-On-The-House Term Loan (also available at Equitable Savings Bank)
B. DISBURSEMENT SERVICESDemand Deposits
1 Peso Demand Depositsa Regular Checking Account
(also available at Equitable Savings Bank)
b ONE Accountc ONE Plus (also available at
Equitable Savings Bank)d Automatic Transfer
Arrangement (also available at Equitable Savings Bank)
2 Foreign Currency Demand Deposita Dollar One
Debit Cards1 FASTcard Regular2 FASTcard Premium3 FASTcard Payroll4 Express Padala FASTcard5 Singpost CashHome FASTcard6 FASTeller VISA Electron Card
Demand DraftsManager’s Check / Cashier’s Check
/ Gift Check (also available at Equitable Savings Bank)
Traveller’s Check
C. ELECTRONIC PRODUCTSFASTeller Automated Teller Machine
(also available at Equitable Savings Bank)
FASTNet Online BankingFASTNet e-Payment GatewayFASTPhoneFASTPhone SMS
D. FUND TRANSFER SERVICESDomestic Telegraphic Transfer (also
available at Equitable Savings Bank)FX Telegraphic Transfer (also
available at Equitable Savings Bank)Interbank Funds Transfer via ATM
(also available at Equitable Savings Bank)
Interbranch Funds Transfer (also available at Equitable Savings Bank)
Electronic Peso Clearing SystemPhilippines Domestic Dollar Transfer
SystemReal Time Gross Settlement
E. HEALTH CARE (through Maxicare
Healthcare Corp.)Annual Check-up
Dental CareEmergency CareIn-Patient CareOut-Patient CarePreventive Health Care
F. LEASING AND FINANCING (through
PCI Leasing & Finance Inc.)Amortized Commercial/Consumer
LoansInstallment Paper PurchaseLeasingReceivables DiscountingReceivables Factoring
G. LIFE INSURANCE (through Philam
Equitable Life Assurance Co.)Preferred FlexisecurePreferred Multiply Peso and DollarPreferred Guardian DollarPreferred Peso PlusPreferred Dollar PlusPreferred HealthShieldPreferred Trio Peso and DollarPreferred Total HealthAssureA & H ProductsGroup Life Products
H. PAYMENT PRODUCTS AND SERVICES
(through Equitable CardNetwork, Inc.)Retail Cards
1 VISA2 MasterCard3 JCB4 American Express
VISA ElectronI. PERSONAL TRUSTLiving Trust Accounts Long-Term Revocable Trust Accounts
J. REMITTANCE SERVICESDirect DepositSingpost CasHome FASTcardExpress Padala FASTcardExpress Padala Remittance Services
1 Advise and Pay/ Payanywhere2 Credit to EPCIB Accounts3 Credit to Other Banks4 Door-to-Door Cash Delivery
Express PadaloadExpress PinoyMoneyGramOFW E-cardXoom.comTravelex
K. SAVINGSPeso Deposits
1 Regular Savings Account-Passbook (also available at Equitable Savings Bank)
2 FASTeller Savings Account3 SpeedTeller Savings Account
(only at Equitable Savings Bank)
4 TREASURESaver (also available at Equitable Savings Bank)
5 SSS Pensioner Savings Account (also available at Equitable Savings Bank)
6 Express Padala Savings Account 7 Optimum (also available at
Equitable Savings Bank)
8 SA Plus ; Special SA Plus9 Peso Time Deposit10 HighSaver11 SpeedSaver (only at Equitable
Savings Bank)12 MoneyMax Flex13 SureSaver Flex (only at Equitable
Savings Bank)Foreign Currency Deposit
1 U.S. Dollar Savings Account (also available at Equitable Savings Bank)
2 Other Foreign Currency Savings Account
3 U.S. Dollar Time Deposit (also available at Equitable Savings Bank)
4 Other Foreign Currency Time Deposit
5 Dollar ONE
L. TREASURYDomestic Fixed Income Securities
1 Fixed Rate Treasury Notes2 Government Corporate
Receivables3 Private Corporate Receivables4 Retail Treasury Bonds5 Treasury Bills
Foreign Fixed Income Securities1 Maxihedge
Foreign Exchange Transactions1 Foreign Exchange Swap
Contracts2 Forward Contracts3 Spot Contracts
M. UNIT INVESTMENT TRUST FUNDSEPCIB GS FundEPCIB US Dollar FundEPCIB Equity FundEPCIB Peso Money Market FundEPCIB Dollar Money Market Fund
N. COLLECTION SERVICESPost-dated Checks Warehousing
(also available at Equitable Savings Bank)
Safety Deposit Box (also available at Equitable Savings Bank)
Government Agency Collection Service (also available at Equitable Savings Bank)
Final Credit Service
O. ANCILLARY SERVICESBank Statement Request through
ATMPhonecards / Prepaid Cards through
Electronic Channels
P. NON-LIFE INSURANCE (through EBC Insurance Brokerage, Inc.) Home-A-Sure Car-A-Sure
II. CORPORATEA. CHECKING AND SAVINGS
ACCOUNTS Clearing Arrangements
1 NOW Clearing / Demand Deposit2 Night Depository3 Demand Drafts / Manager’s
Checks / Cashier’s Checks / Gift Checks
PRODUCTS AND SERvICES

2006 Equitable PCI Bank Annual Report | 129
Peso Demand Deposits 1 Automatic Transfer Arrangement
(also available at Equitable Savings Bank)
2 ONE Account3 ONE Plus (also available at
Equitable Savings Bank)4 Regular Checking Account (also
available at Equitable Savings Bank)
Savings Accounts 1 Foreign Currency Deposits
a U.S. Dollar Savings Account (also available at Equitable Savings Bank)
b Other Foreign Currency Savings Account
c U.S. Dollar Time Deposit (also available at Equitable Savings Bank)
d Other Foreign Currency Time Deposit
e U.S. Dollar ONE2 Peso Deposits
a HighSaver b Peso Time Deposit (also
available at Equitable Savings Bank)
c Regular Savings Account-Passbook (also available at Equitable Savings Bank)
d Optimum ( also available at Equitable Savings Bank)
e SA Plus; Special SA Plusf SpeedSaver (only at
Equitable Savings Bank)B. CASH MANAGEMENT SOLUTIONS Collection Solutions
1 OTC and Electronic Consumer FASTPay
2 Corporate FASTCollect3 Mobile Cash / Check Transport
Service (MCTS)4 Post-Dated Check Warehousing
Payables Solutions1 MC and Corporate Check
FASTWrite2 FASTeTransfer supplier’s bills
payment3 FAST Remit4 Payroll Services
FAST Access Electronic PlatformGovernment-Related Services
1 SSS Sickness, Maternity and Employee Compensation (only at Equitable Savings Bank)
FASTNet e-Payment Gateway
C. CORPORATE FINANCINGMulti-Currency Loan Facilities
1 Credit-Linked LoansTerm Loans
1 Project Financing2 Developmental Loans3 Special Funding Program
Trade Finance1 Imports
a Letters of Creditb Documents Against
Acceptancec Documents Against
Payment
d Open Account Arrangement
e Shipside Bonds / Bank Guarantees
f Trust Receipts2 Domestic
a Domestic Bills Purchaseb Inventory Financingc Supplier’s Credit Purchase
Facilityd Receivables Purchase Facility
3 Exports a Advising of LC Openings /
Amendmentsb Documents Collection
i Documents Against Acceptance
ii Documents Against Payments
iii Open Account Arrangement
c Pre-Export Financing / Packing Credit
d Export Billse Export LC Confirmation
Working Capital Loans1 Credit Line (also available at
Equitable Savings Bank)2 Post Dated Check
Discounting (also available at Equitable Savings Bank)
3 Back-to-Back Loans or 1:1 Loans (also available at Equitable Savings Bank)
Other Products1 Standby Letter of Credit 2 Committed Credit Line
(also available at Equitable Savings Bank)
D. Corporate Housing Loan Tie-up/Contract-to-Sell (CTS) Financing / Auto Fleet Financing / Corporate Personal Loan Tie-upAuto Fleet Financing ProgramContract to Sell (CTS) FinancingPersonal Loan Program
E. CORPORATE TRUSTEmployee Benefit Trust
1 Customized Employee Benefit Trust
2 Merit & Merit Plus PlansCorporate Investment Services
1 Investment Management Account
2 Pre-Need Company Funds3 Revocable Trust Account4 Institutional Funds
Special Trust1 Bonds Issued Under Trust2 Collateral / Mortgage Trust3 Court Trusts & Guardianships4 Custodianship5 Escrows6 Life Insurance Trusts7 Loan / Security Agency8 Non-Voting Trust9 Private Estate Planning10 Special Purpose Trust
Corporate Agency Services1 Settlement Bank2 Transfer Agency / Registrar3 Paying Agency4 Receiving Agent for Initial Public
Offerings5 Escrow Agent for Locked-up
Shares
F. HEALTH CARE (through Maxicare Healthcare Corp.)Annual Check-UpDental CareEmergency CareIn-Patient CareOut-Patient CarePreventive Health Care
G. INVESTMENT BANKING (through PCI Capital Corporation)Fixed Income Securities
Underwriting 1 Commercial Papers/Bonds/
Corporate Notes2 Preferred Shares
Equity Securities Underwriting1 Initial Public Offering2 Rights Offering3 Warrants Issue
Financial AdvisoryInvestment InstrumentsMulti-Currency Loan SyndicationPrivate Equity PlacementSecurities Brokering & DealershipSecuritization of Financial Assets
H. LEASING AND FINANCING (through PCI Leasing & Finance Inc.)Amortized Commercial/Consumer
LoansInstallment Paper PurchaseLeasingReceivables DiscountingReceivables Factoring
I. NON-LIFE INSURANCE (through EBC Insurance Brokerage, Inc.)Property Insurance (Industrial /
Commercial All Risks) Business Interruption or Loss of
Profit InsuranceEngineering Insurance
1 Contractors All Risk2 Erection All Risk3 Electronic Equipment or
Computer Insurance4 Machinery Breakdown
Marine Insurance1 Cargo Insurance2 Hull Insurance3 Liability Insurance4 Inland Marine
Public / General Liability InsuranceCrime Insurance
1 Fidelity Insurance2 Money, Securities & Payroll
Insurance3 Burglary, Robbery & Theft
Insurance4 Bankers Blanket Bond
Miscellaneous Insurance1 Floater Insurance2 Golfers Insurance3 Livestock Insurance

130 | Building for the Future
Employee Benefits1 Personal Accident2 Travel Accident3 Group Life Insurance4 Group Hospitalization
Bonds (Judicial and Non-Judicial Bond) 1 Superseadeas Bond2 Replevin Bond3 Attachment Bond4 Bid Bond5 Guarranty Bond6 Performance Bond
Mortgage Redemtion Insurance (MRI)
J. PAYMENT PRODUCTS & SERVICES (through Equitable CardNetwork, Inc.)Affinity Card/Co-BrandingCorporate CardMerchant Acquisition
K. SPECIAL LENDINGFunding Facilities
1 Countryside Loan Fund I & II
2 Countryside Loan Fund III3 Industrial Guarantee & Loan
Fund (Regular & Special)4 Industrial Guarantee & Loan
Fund (Short-Term Rediscounting)5 Domestic Shipping
Modernization Program II6 Environmental Infrastructure
Support Credit Program II7 Japan Bank for International
Cooperation (JBIC) Information Technology & Industry Support Loan
8 Overseas Economic Cooperation Fund (OECF)/ Industrial & Support Services Expansion Program
9 SBGFC - SME Funding for Investments in Regional Markets
10 SBGFC - SME Funding Access for Short-Term Loans
11 SSS Special Financing Program12 SSS Industry Loan Program13 SSS Hospital Financing Program14 SSS Special Financing Program
for Schools15 SSS Tourism Financing Program
Guarantee Facilities1 SBGFC - Guarantee for
Enterprises in Manufacturing & Services
2 SBGFC - Guarantee Lines for Anchor Industries
3 SBGFC - Guarantee Resources for Agribusiness Investments
4 TIDCORP - General Facility Program
5 TIDCORP - Omnibus Guarantee Line under the General Facility Program
6 TIDCORP - Pre-Shipment Export Finance Guarantee Program & Post-Shipment Export Risk Guarantee Program (PERG)
7 TIDCORP - Term Loan Guarantee Program
8 LGUGC - Electric Cooperative Partial Credit Guarantee
L. STRUCTURED PRODUCTSSpecialized Financial Services
1 Asset Conversion2 Corporate Re-Engineering3 Financial Advisory4 Forfaiting5 Restructuring for Corporates6 Structured Trade Finance
a. Export Credit Agencyb. GSM LC Arbitrage
7 Syndicated Debt ConsolidationStructured Trade Finance & Onshore/
Offshore Syndication1 Long-Term Equipment Financing2 Long-Term Project Financing3 Onshore/Offshore Syndication
M. TRADE FINANCEExports
1 Advising of LC Openings/Amendments
2 Documents Sent for Collectiona. Documents vs. Acceptance
b. Documents vs. Paymentsc. Open Acccount
Arrangementd. Negotiations vs. Letters of
Credit 3 Export Bills4 Export LC Confirmation5 Inward Remittances
Imports1 Documents Against Acceptance2 Documents Against Payment3 Letters of Credit (Imports/
Domestic)4 Open Account Arrangement5 Shipside Bonds/Bank Guarantees6 Trust Receipts7 Invoice Financing
N. TREASURYDomestic Fixed Income Securities
1 Fixed Rate Treasury Notes2 Retail Treasury Bonds3 Treasury Bills
Foreign Fixed Income Securities1 Maxihedge
Foreign Exchange Transactions1 Foreign Exchange Swap
Contracts2 Forward Contracts3 Spot Contracts
III. SMALL BUSINESSA. WORKING CAPITAL LOANSCredit-On-Hand Post-Dated Check DiscountingLoans vs Deposits (1:1 or Back to
back loans)Foreign/Domestic Bills PurchaseRevolving Promissory NoteCommitted Credit Line
B TERM OR AMORTIZED COMMERCIAL
LOAN(also available at Equitable Savings Bank and PCI Leasing and Finance Inc.)
C TRADE FACILITIESImport Letters of CreditExport Bills PurchaseExport Packing CreditForeign/Domestic Standby Letters of
CreditLoans vs Trust Receipts
D LEASING AND FINANCING (Through PCI Leasing & Finance, Inc.)LeasingReceivables DiscountingReceivables Factoring
E TRUST SERVICESEmployee Benefit Trust
1 Customized Employee Benefit Trust
2 Merit & Merit Plus PlansUnit Investment Trust Fund (UITF)
1 EPCIB GS Fund2 EPCIB U.S. Dollar Fund3 EPCIB Equity Fund4 EPCIB Peso Money Market Fund5 EPCIB Dollar Money Market
Fund
BRANCH DIRECTORY