building information modeling: state-of-the-art practice ... · building information modeling:...
TRANSCRIPT

Building Information Modeling: State-of-the-Art Practice and Research
Martin FischerProfessor, Civil and Environmental Engineeringand (by courtesy) Computer ScienceDirector, Center for Integrated Facility Engineering (CIFE)Stanford Universityhttp://www.stanford.edu/[email protected] Member, Royal Swedish Academy of Engineering Sciences
Thanks to the CIFE community.
Presentation Outline
• Introduction to the Center for Integrated Facility Engineering (CIFE)
• What is Building Information Modeling (BIM)?• What can you expect from using BIM?• How is BIM used today?• How will BIM be used tomorrow?

CIFE Development and Background
• 100% funded by industry– Building owners– Design and construction
companies– Software and hardware vendors
• 1988-2000– Building Information Modeling
(BIM)
• 2000-2010– Virtual Design and Construction
(VDC)
• 2010+– Integrated Facility Engineering– Breakthrough performance
3

The CIFE community (industry, academia) invents the next
practice togetherPractice
Research
Education

A good product (design) enables the following efficient and effective processes:• Construction• Operations and maintenance• Users’ business operations
And enhances the project’s• Environmental and social context, and• Contributes to learning how to do a similar
project even better next time

Income
Cost
Time Design-Construction
Costs Facility Maintenance Costs Building Operations Costs
Business Operations Costs
Income from Facility
1
2
3
4
5
Ideally, we could analyze complete product/process models for every major decision instantly

What does a BIM look like?
Visual Representation of the Building
Data about the Building
Slide Content Courtesy Optima, Scottsdale, AZ

BIM is the first technology that combines data and visualization
Visualization
Social Interface with Stakeholders
Conceptual project planning & design
Design
Procurement
Construction
Start-up
Operations
Data
Interface with Engineering and Project Control and Management Systems
8 (c) 2012

ICEBIM+ ProcessCurrent State Process, T5 Rebar Detailing for Construction
Des
ign
Man
ufac
ture
Engi
neer
ing
Release CADdwg, rebar
schedule (*.CSF)in Documentum
Documentcontrol delay
(1 week)
Preliminarydesign GA drawings
Refine RC detailsand concept for
buildability/detailing
Use model todevelop and
communicatemethods
Prepare RC detaildrawings(drafting)
Check andcoordinate detail
drawings
CAD check(1d/dwg)
Check againstengineering calcs
(.5d /dwg)
Independent finalcheck & sign off
(2 weeks)
Building controlcheck & sign off
(BAA, time?)
Release paper P4dwgs & bar
bendingschedules
Rebar factorystarts bending
Pre-assembly
Ship to site
Draft spec
Comment onspec
Update spec Release spec
Model rebarcomponent (Use
digitalPrototyping tool)
Issue and resolveTQ’s (Technical
Queries)
AutoCAD CAD RC IDEAS Arma +
Design input/changes
Technology:
Detailedengineering
designinformation
Site assembly
Preliminary drafting2 weeks
Back drafting1 week
Checking2 weeks
Document control1 weekTimeline:
NOTE: Drawings are batched into sections-then subdivided into building components.Each component is an assembly package,e.g. rail box floor, wall, etc.
The number of drawing sheets per buildingcomponent vary depending on the work. OnART for example, each component mayconsist of 8-15 GA drawings and 8-15 RCdetail drawings.
All of the GA drawings are complete -pend ing changes f rom other des igndisciplines
NOTE: Design changesduring detailing (from:architecture, baggage,s y s t e m s , e t c . ) a r eupsetting RC drawingdevelopment.
Other / None/Unknown
Preliminary RCdetailing
Iterativeprocess
Consists of:engineeringcalculations,sketches, etc.
Most of the checkingprocess is doneconcurrently with RCdetail development.
BAA building controlaccepts the opinionof the independentdesign check - anddoes not perform acheck of its own
Asse
mbl
y
Existing Process - 6 weeks
Client/Business Objectives
Project Objectives
Virtual Design and Construction (VDC)


Collaborative 3D modeling to avoid construction problems: Case
Example from a Mining Project
Leonardo Rischmoller Visiting Scholar, Civil & Env. Eng.,
Stanford University

Introduction to VDC
Center for Integrated Facility Engineering
Mining Project in ChileSlides from Prof. Leonardo RischmollerUniversity of Talca

Introduction to VDC
Center for Integrated Facility Engineering

Introduction to VDC
Center for Integrated Facility Engineering
Mining Project in ChileSlides from Prof. Leonardo RischmollerUniversity of Talca

Introduction to VDC
Center for Integrated Facility Engineering
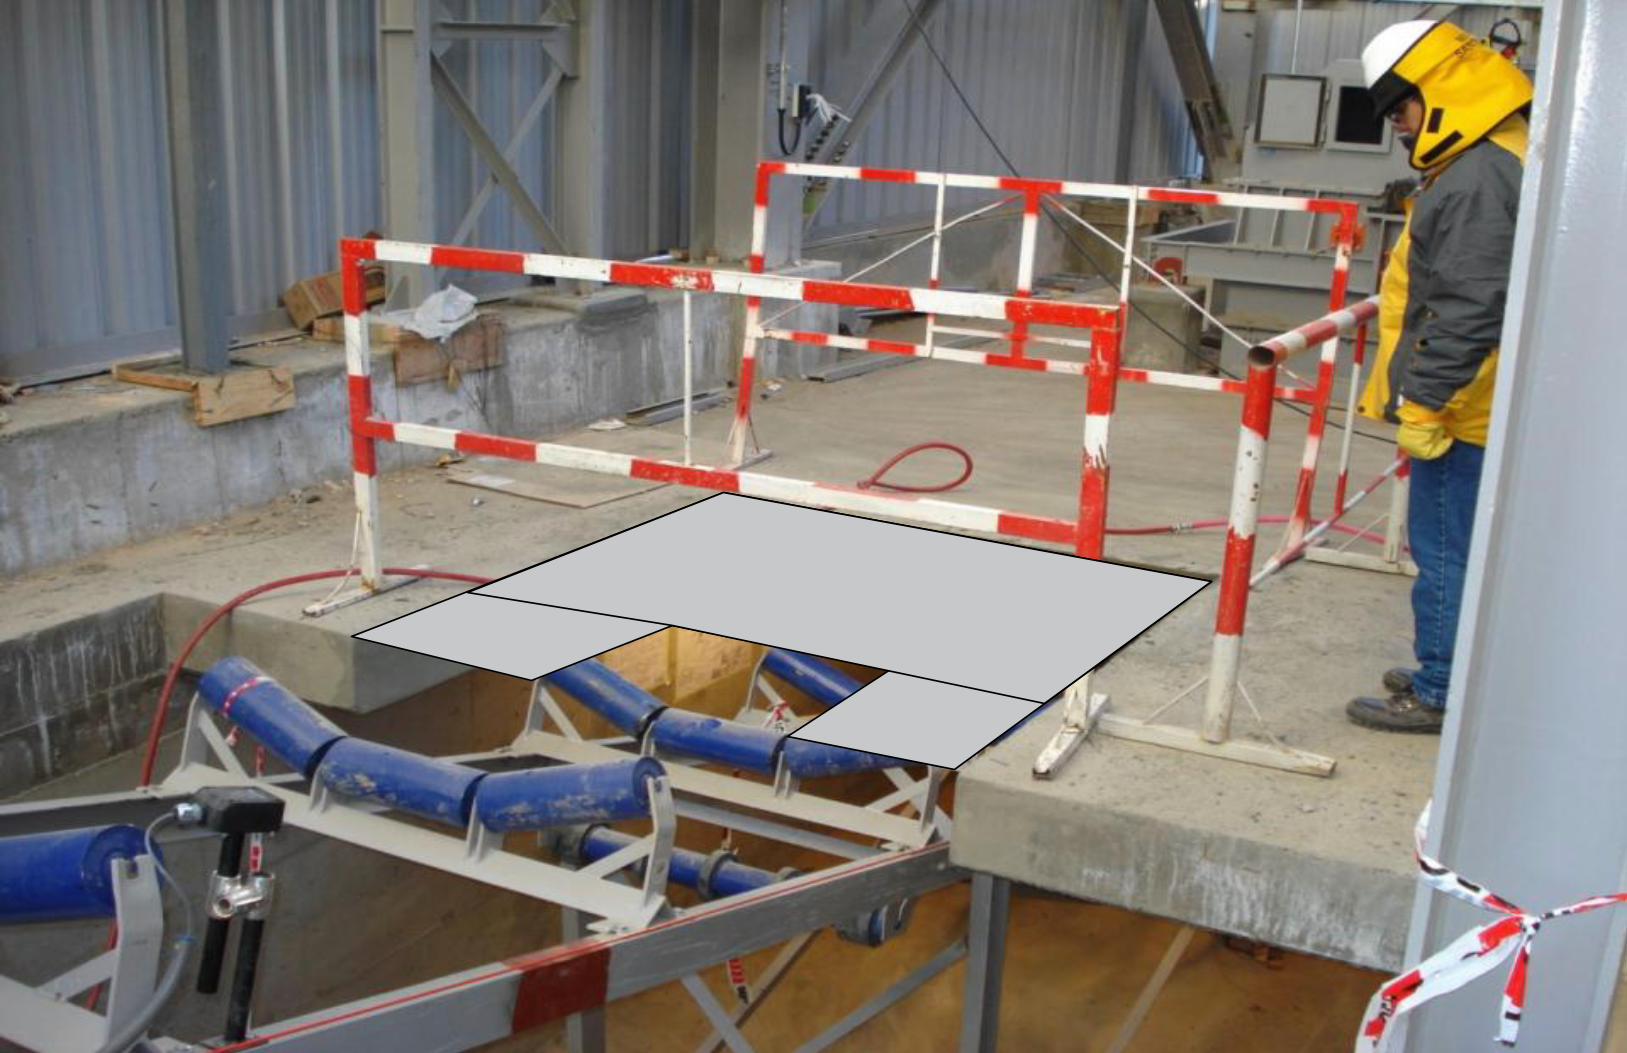
CLIENTE:¿Cómo van a Solucionar ese problema?
CONTRATISTA:Vamos a realizar una perforación a la placa …

Introduction to VDC
Center for Integrated Facility Engineering
GERENCIA DE PROYECTO:Es una buena solucion!

Introduction to VDC
Center for Integrated Facility Engineering
INGENIERIA:La perforacion no afectaria el comportamiento de la estructura

Introduction to VDC
Center for Integrated Facility Engineering
dramatic reduction in decision latency, or the time between posing a questionand having information with sufficient quality that it can be used to make a
design decision (t, $, Quality, …)
Using an incomplete product model
Introduction to VDC
Center for Integrated Facility Engineering

Introduction to VDC
Center for Integrated Facility Engineering

Introduction to VDC
Center for Integrated Facility Engineering

Introduction to VDC
Center for Integrated Facility Engineering

Introduction to VDC
Center for Integrated Facility Engineering

Introduction to VDC
Center for Integrated Facility Engineering
Problema:Bombas inaccesibles al puente grua

Introduction to VDC
Center for Integrated Facility Engineering

Introduction to VDC
Center for Integrated Facility Engineering

Introduction to VDC
Center for Integrated Facility Engineering
¿US$?
Extra cost if contracting3D Engineering
Costs of problemsduring construction
using traditional Design

Introduction to VDC
Center for Integrated Facility Engineering
90
10100
85.512.0
97.5
+20%=12
-4.5- 5%
85.5
90.0 -2.5%

PBS OCA 3D-4D-BIM Program
GSA’s National 3D-4D-BIM Program
From introduction in 2003 to pilots and technology/guidance development,
to upper management policy and budgetto GSA national program deployment and support
to US national standardsto international agreements
Mandated Requirement on all GSA Projects since 2006100+ Projects To Date16 National “IDIQ” Contracts up to $30 million each

PBS ODC 3D-4D-BIM Program
Business Case & Priorities — GSA BIM Guide Series
01—Overview
02—Spatial Program Validation
03—3D Imaging
04—4D Phasing
05—Energy Performance and Operation
06—Circulation and Security Validation
07—Building Elements
08—Facility Management

PBS OCA 3D-4D-BIM Program
Automated Program Validation
PBS OCA 3D-4D-BIM Program
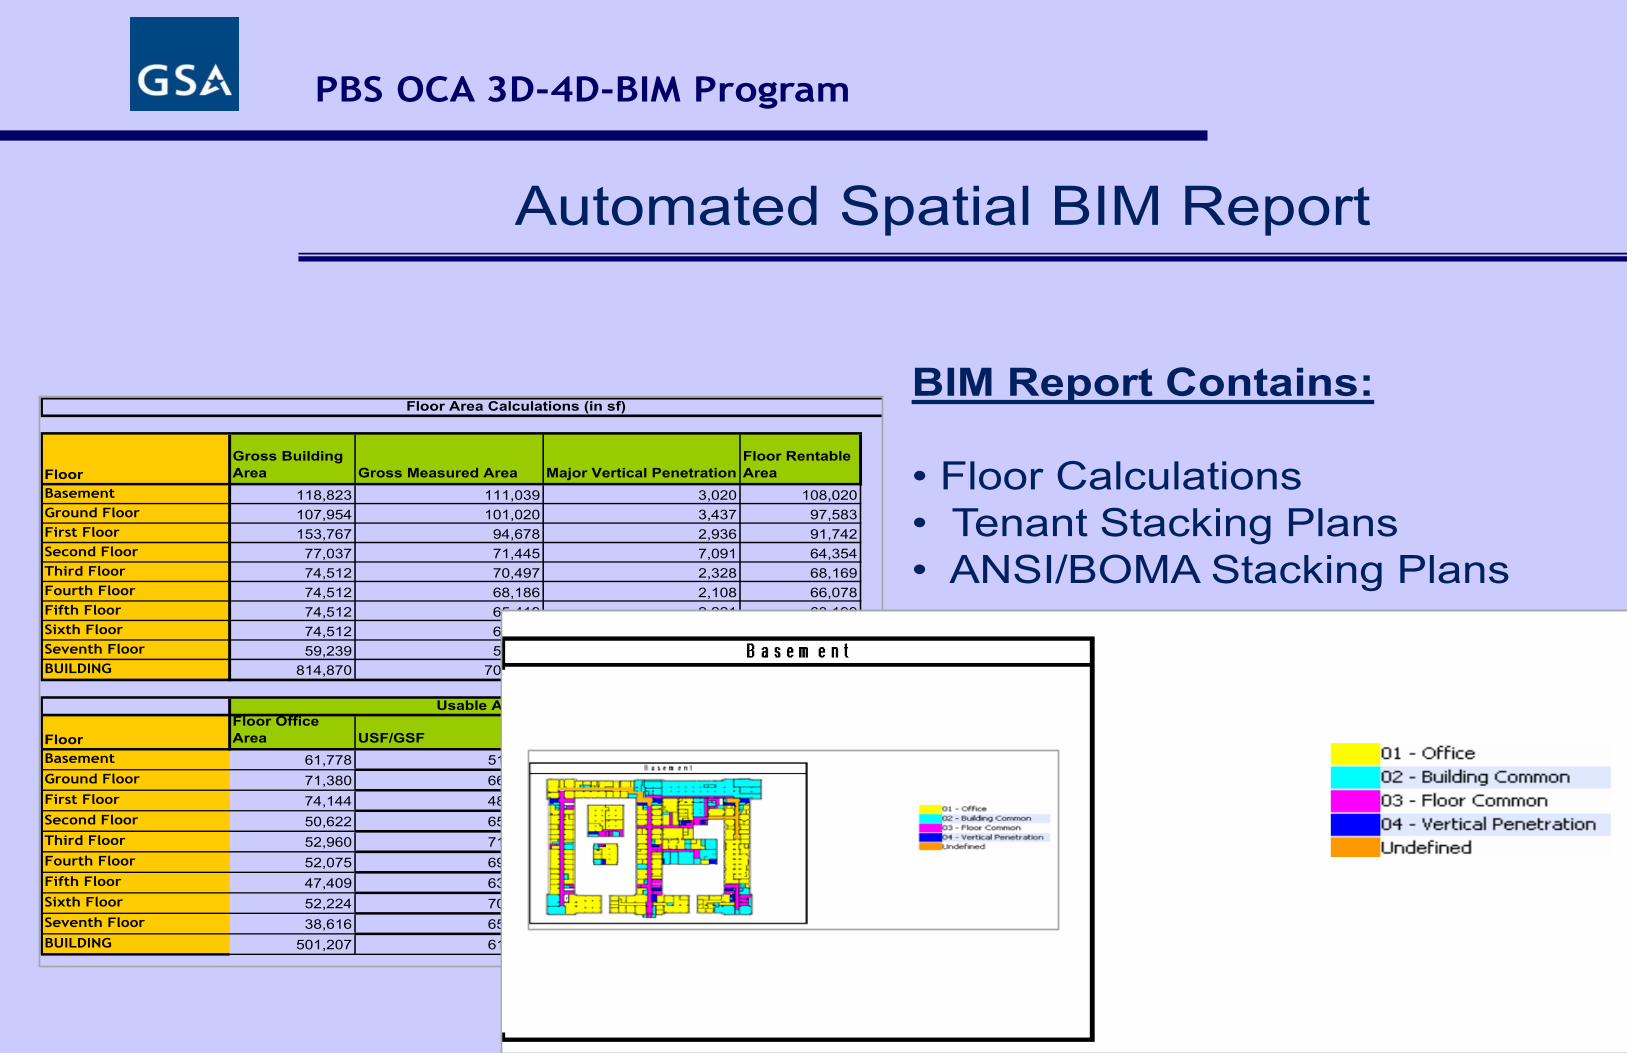
Automated Spatial BIM Report
FloorGross Building Area Gross Measured Area Major Vertical Penetration
Floor Rentable Area
Basement 118,823 111,039 3,020 108,020Ground Floor 107,954 101,020 3,437 97,583First Floor 153,767 94,678 2,936 91,742Second Floor 77,037 71,445 7,091 64,354Third Floor 74,512 70,497 2,328 68,169Fourth Floor 74,512 68,186 2,108 66,078Fifth Floor 74,512 65,419 2,221 63,199Sixth Floor 74,512 69,727 2,251 67,476Seventh Floor 59,239 51,591 1,676 49,915BUILDING 814,870 703,602 27,067 676,534
FloorFloor Office Area USF/GSF
Floor Building Common Area
Floor Usable Area
Basement 61,778 51.99% 26,395 88,176Ground Floor 71,380 66.12% 4,122 75,513First Floor 74,144 48.22% 3,473 79,020Second Floor 50,622 65.71% 3,565 55,847Third Floor 52,960 71.08% 2,801 55,764Fourth Floor 52,075 69.89% 2,538 54,613Fifth Floor 47,409 63.63% 2,579 50,363Sixth Floor 52,224 70.09% 1,484 53,718Seventh Floor 38,616 65.19% 3,795 42,462BUILDING 501,207 61.51% 50,752 555,477
Usable Areas
Floor Area Calculations (in sf)BIM Report Contains:
• Floor Calculations• Tenant Stacking Plans• ANSI/BOMA Stacking Plans
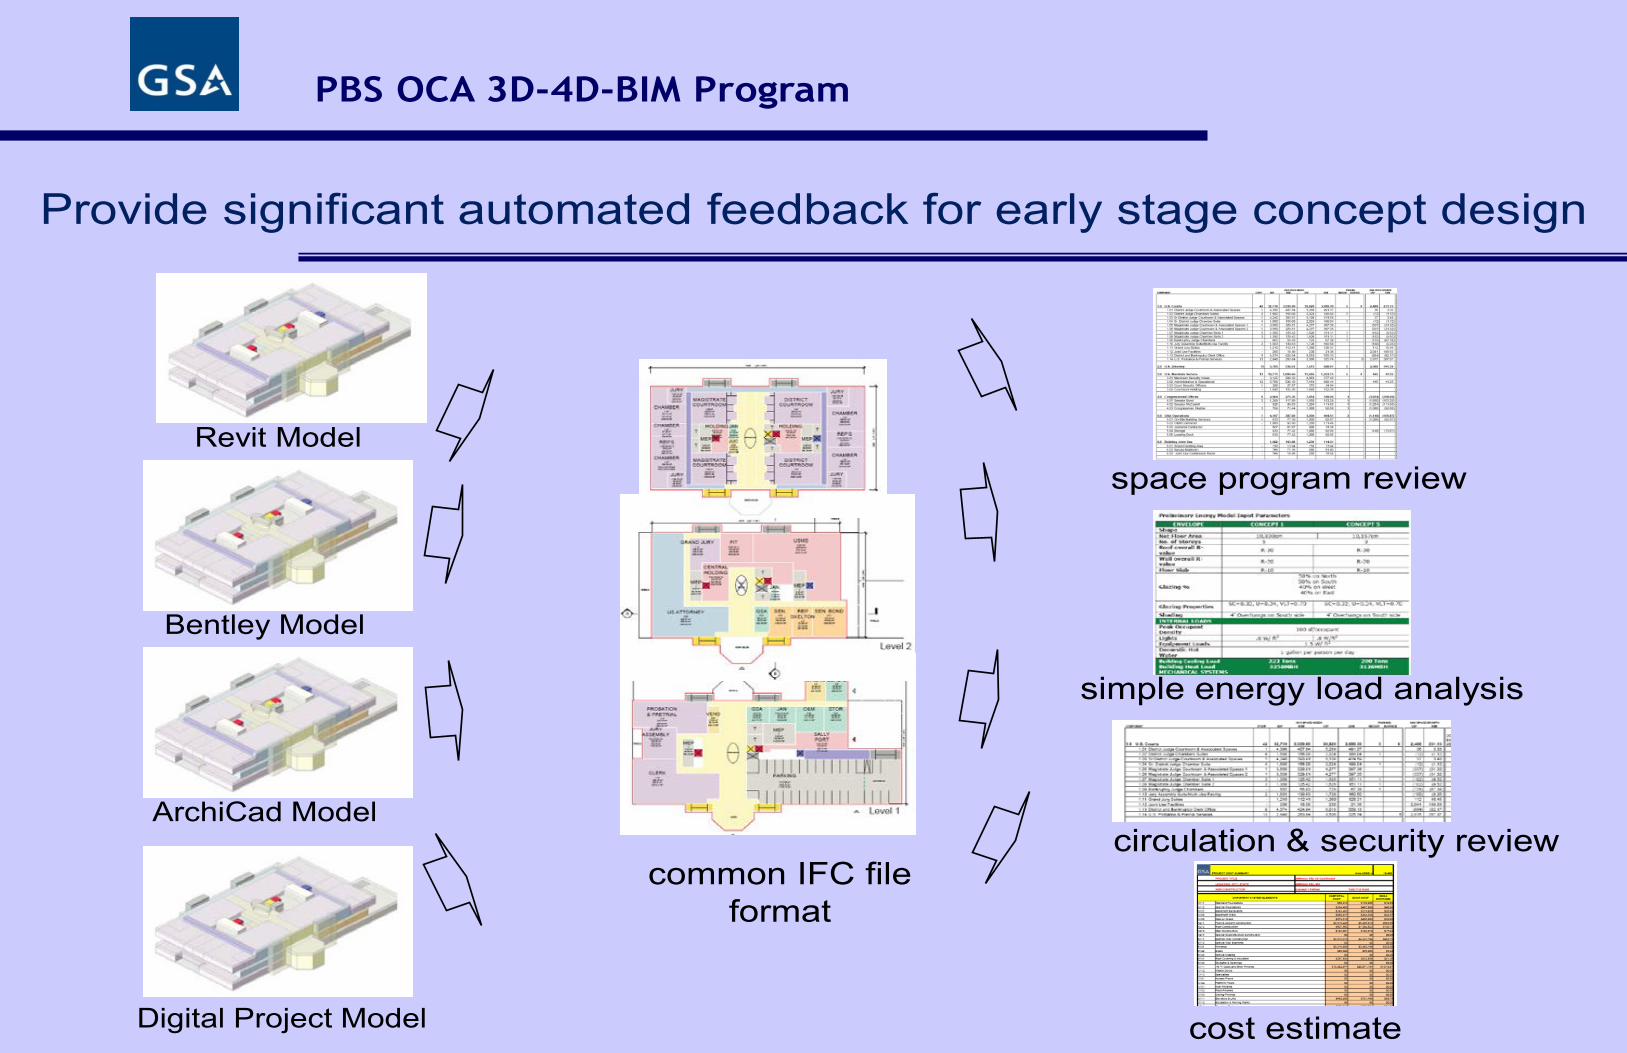
PBS OCA 3D-4D-BIM Program
Revit Model
Bentley Model
ArchiCad Model
Digital Project Model
common IFC file format
space program review
simple energy load analysis
circulation & security review
cost estimate
Provide significant automated feedback for early stage concept design

Introduction to Product Management through BIM
Center for Integrated Facility Engineering
Check all circulation paths in a buildingOn a 6-story courthouse, approximately 27,000 routes were tested using 302circulation rules in approximately 10 seconds.
Slide courtesy GSA, work carried at GA Tech with sponsorship by the GSA
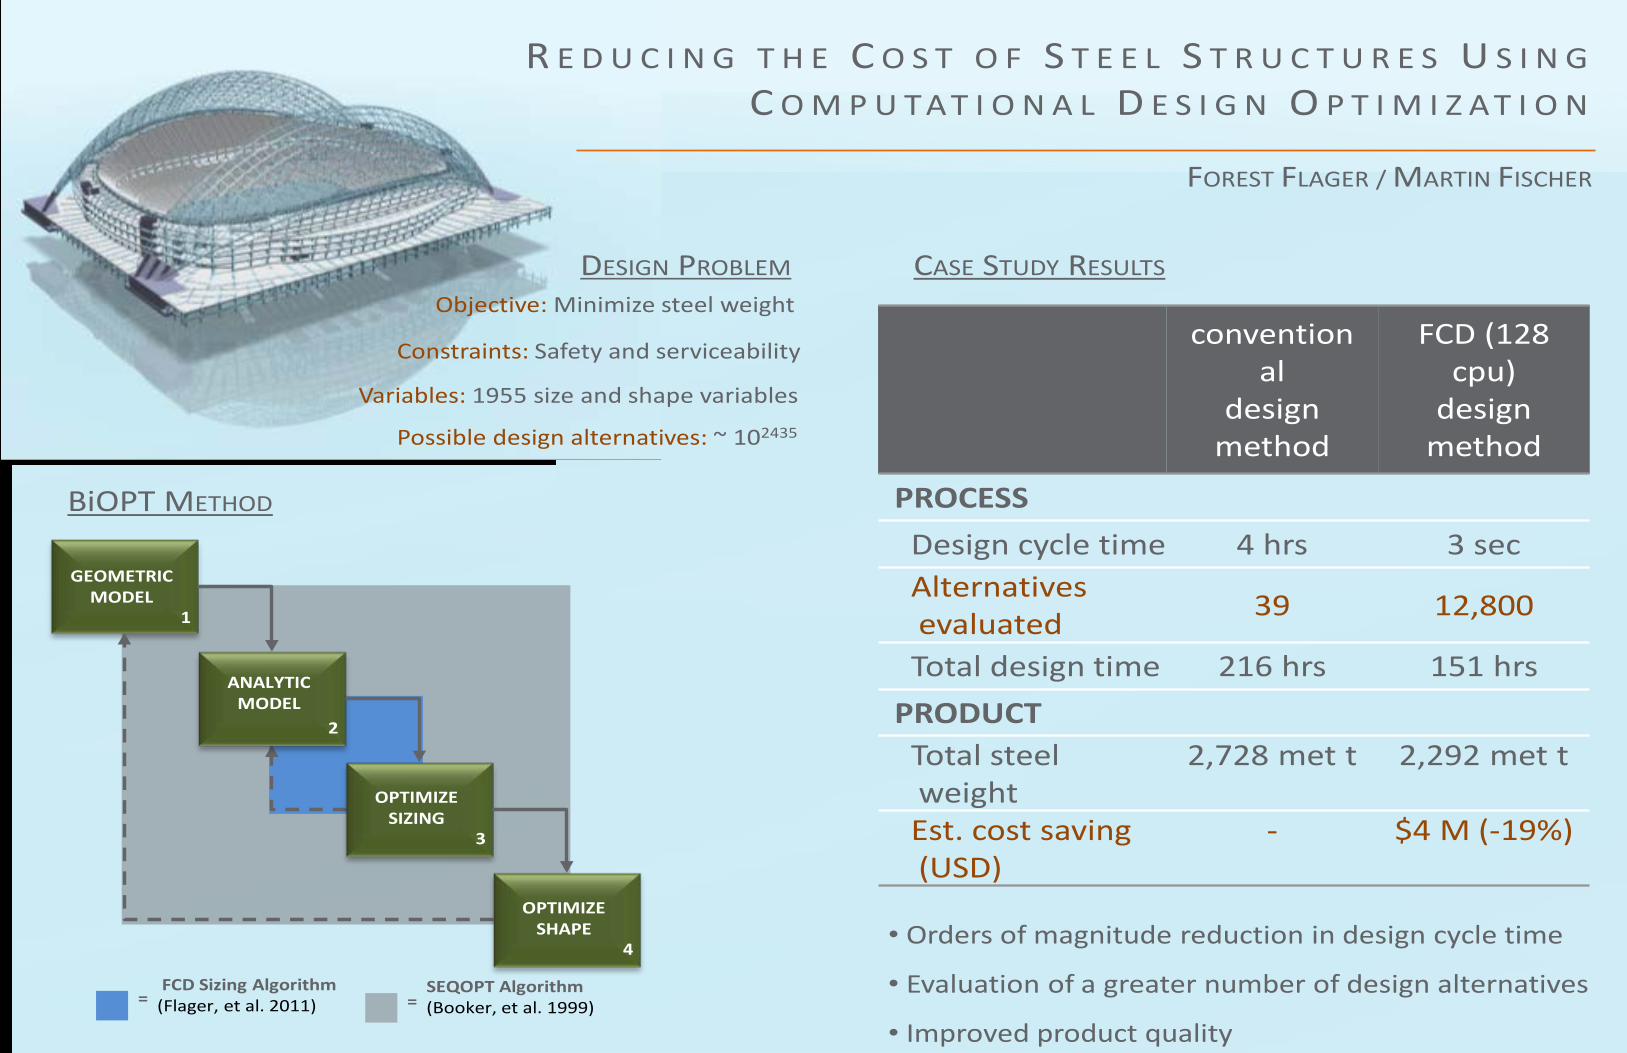
R E D U C I N G T H E C O S T O F S T E E L S T R U C T U R E S U S I N G C O M P U T AT I O N A L D E S I G N O P T I M I Z AT I O N
FOREST FLAGER / MARTIN FISCHER
conventional
design method
FCD (128 cpu)
design method
PROCESS Design cycle time 4 hrs 3 sec Alternatives
evaluated 39 12,800
Total design time 216 hrs 151 hrs PRODUCT Total steel
weight 2,728 met t 2,292 met t
Est. cost saving (USD)
- $4 M (-19%)
CASE STUDY RESULTS
GEOMETRIC MODEL
GEOMETRIC MODEL
OPTIMIZE SHAPE
ANALYTIC MODEL
OPTIMIZE SIZING
1
BiOPT METHOD
DESIGN PROBLEM
2
3
4
FCD Sizing Algorithm (Flager, et al. 2011)
SEQOPT Algorithm (Booker, et al. 1999)
• Orders of magnitude reduction in design cycle time
• Evaluation of a greater number of design alternatives
• Improved product quality
Objective: Minimize steel weight
Constraints: Safety and serviceability
Possible design alternatives: ~ 102435
Variables: 1955 size and shape variables
= =
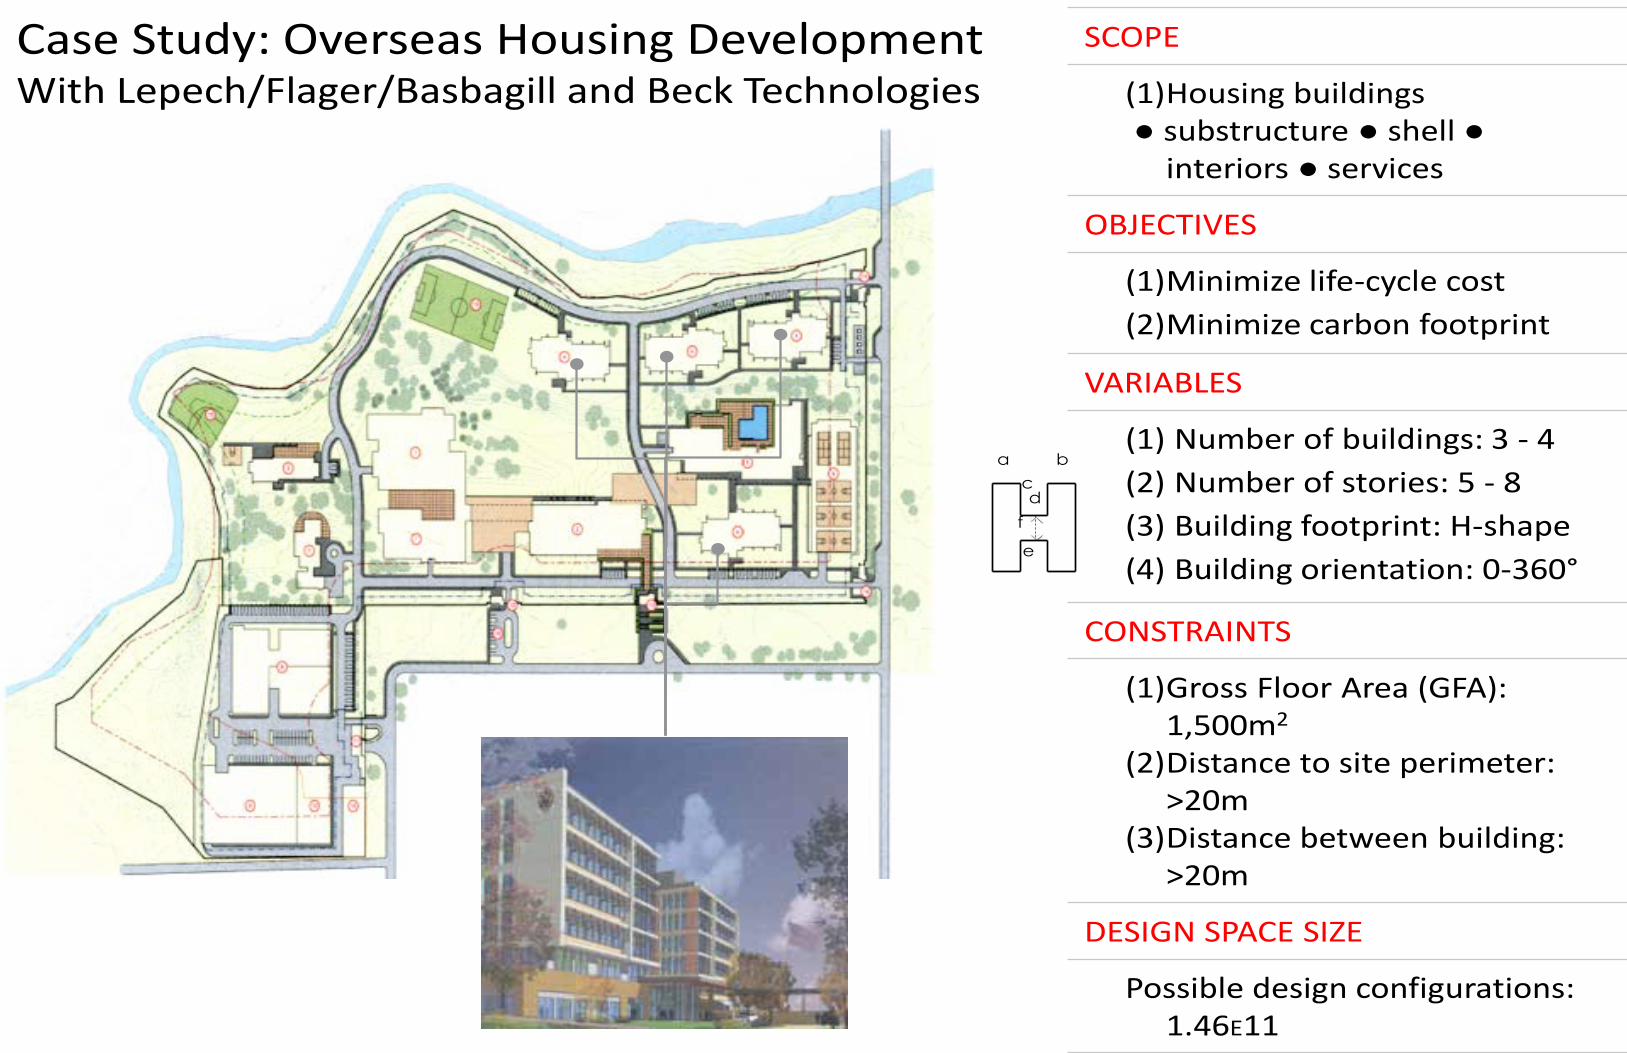
Case Study: Overseas Housing Development With Lepech/Flager/Basbagill and Beck Technologies
SCOPE
(1)Housing buildings ● substructure ● shell ●
interiors ● services
OBJECTIVES
(1)Minimize life-cycle cost (2)Minimize carbon footprint
VARIABLES
(1) Number of buildings: 3 - 4 (2) Number of stories: 5 - 8 (3) Building footprint: H-shape (4) Building orientation: 0-360°
CONSTRAINTS
(1)Gross Floor Area (GFA): 1,500m2
(2)Distance to site perimeter: >20m
(3)Distance between building: >20m
DESIGN SPACE SIZE
Possible design configurations: 1.46E11
a bcd
e
f

3 Configuration
Life-Cycle Performance
Capital
Operational
Baseline
Number of buildings: 4
Number of floors: 8
Baseline
COST (USD, Millions) IMPACT (kt CO2e)
Base Design
($197M)(285kt)
IMPACT (Kt CO2e)
COST
(USD
, Milli
ons)
197
285

Configuration
Life-Cycle Performance
Capital
Operational
Baseline Design 838
Number of buildings: 4
Number of floors: 8
Baseline Design 838
140 136
58 44
27 26
259 256
COST (USD, Millions) IMPACT (kt CO2e)
($18M) (4kt)
Reduced Cost Design
IMPACT (Kt CO2e)
COST
(USD
, Milli
ons)
197
285
-18
-4

3 Configuration
Life-Cycle Performance
Capital
Operational
Baseline Design1898
Number of buildings: 3
Number of floors: 7
Baseline Design1898
140 132
58 49
27 26
259 251
COST (USD, Millions) IMPACT (kt CO2e)
($17M) (8kt)
Reduced Carbon Design
IMPACT (Kt CO2e)
COST
(USD
, Milli
ons)
197
285
-17
-8
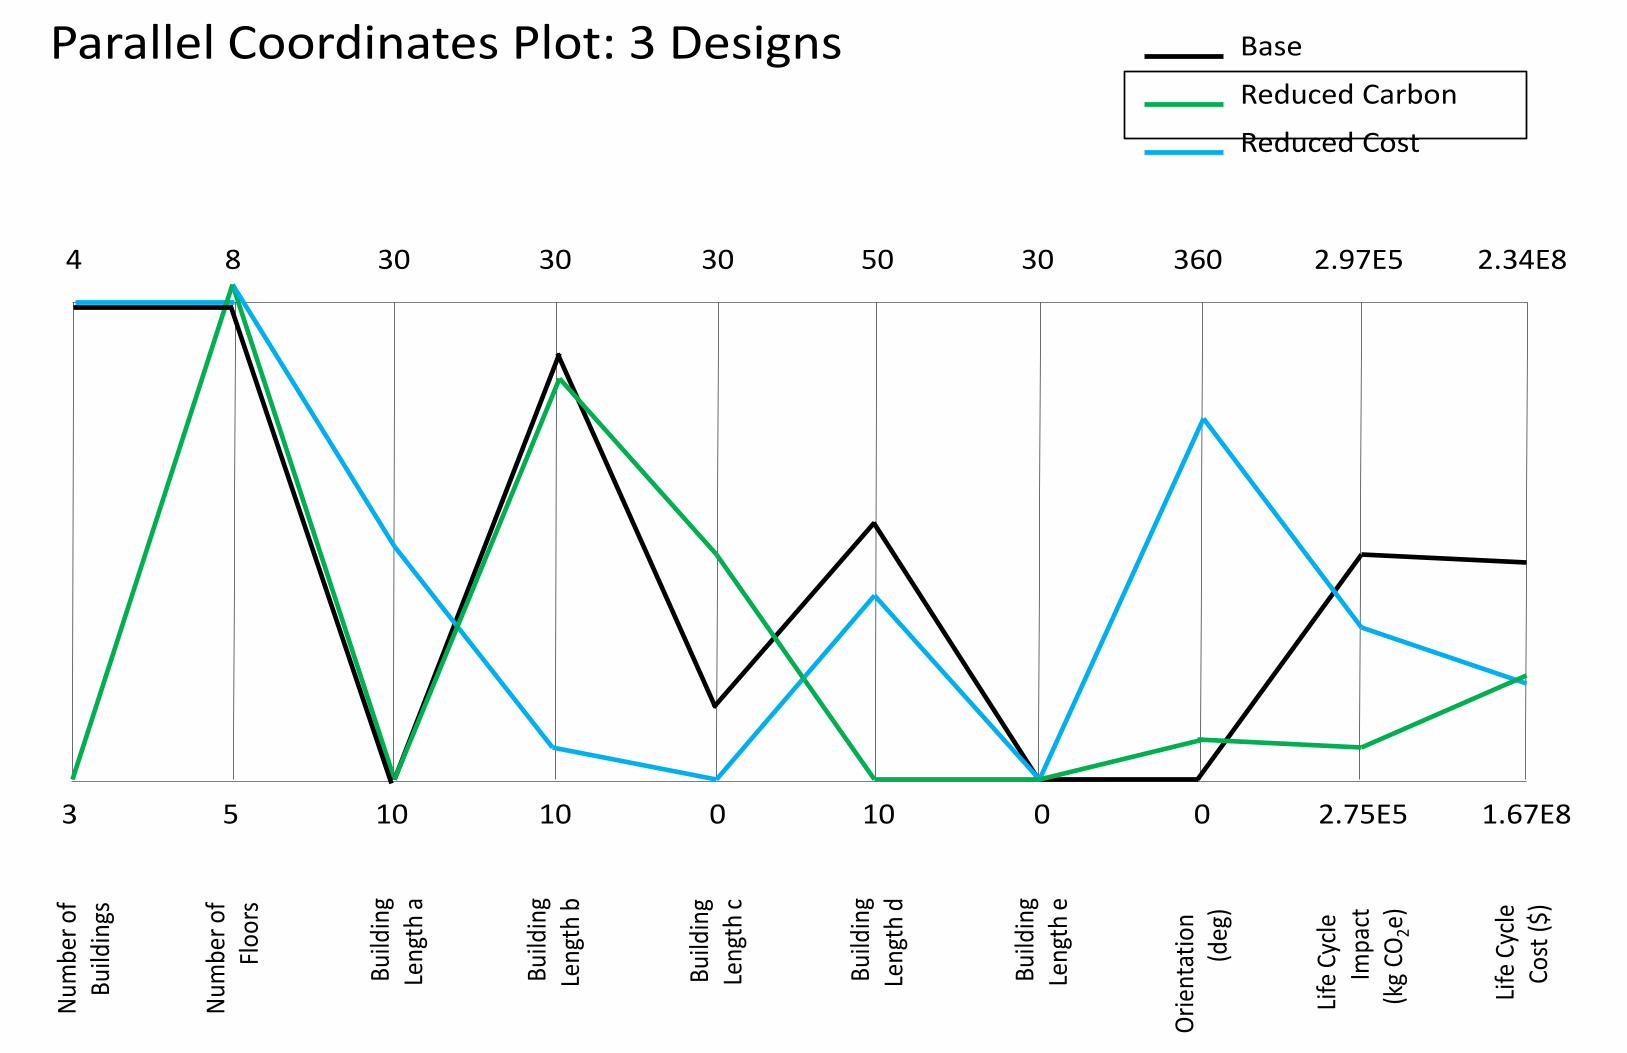
5 3 10 10 0 0 10 0 1.67E8 2.75E5
8 4 30 30 30 30 50 360 2.34E8 2.97E5
Num
ber o
f Bu
ildin
gs
Num
ber o
f Fl
oors
Build
ing
Leng
th a
Build
ing
Leng
th b
Build
ing
Leng
th c
Build
ing
Leng
th d
Build
ing
Leng
th e
Orie
ntat
ion
(d
eg)
Life
Cycle
Im
pact
(k
g CO
2e)
Life
Cycle
Co
st ($
)
Base
Reduced Carbon
Reduced Cost
Parallel Coordinates Plot: 3 Designs
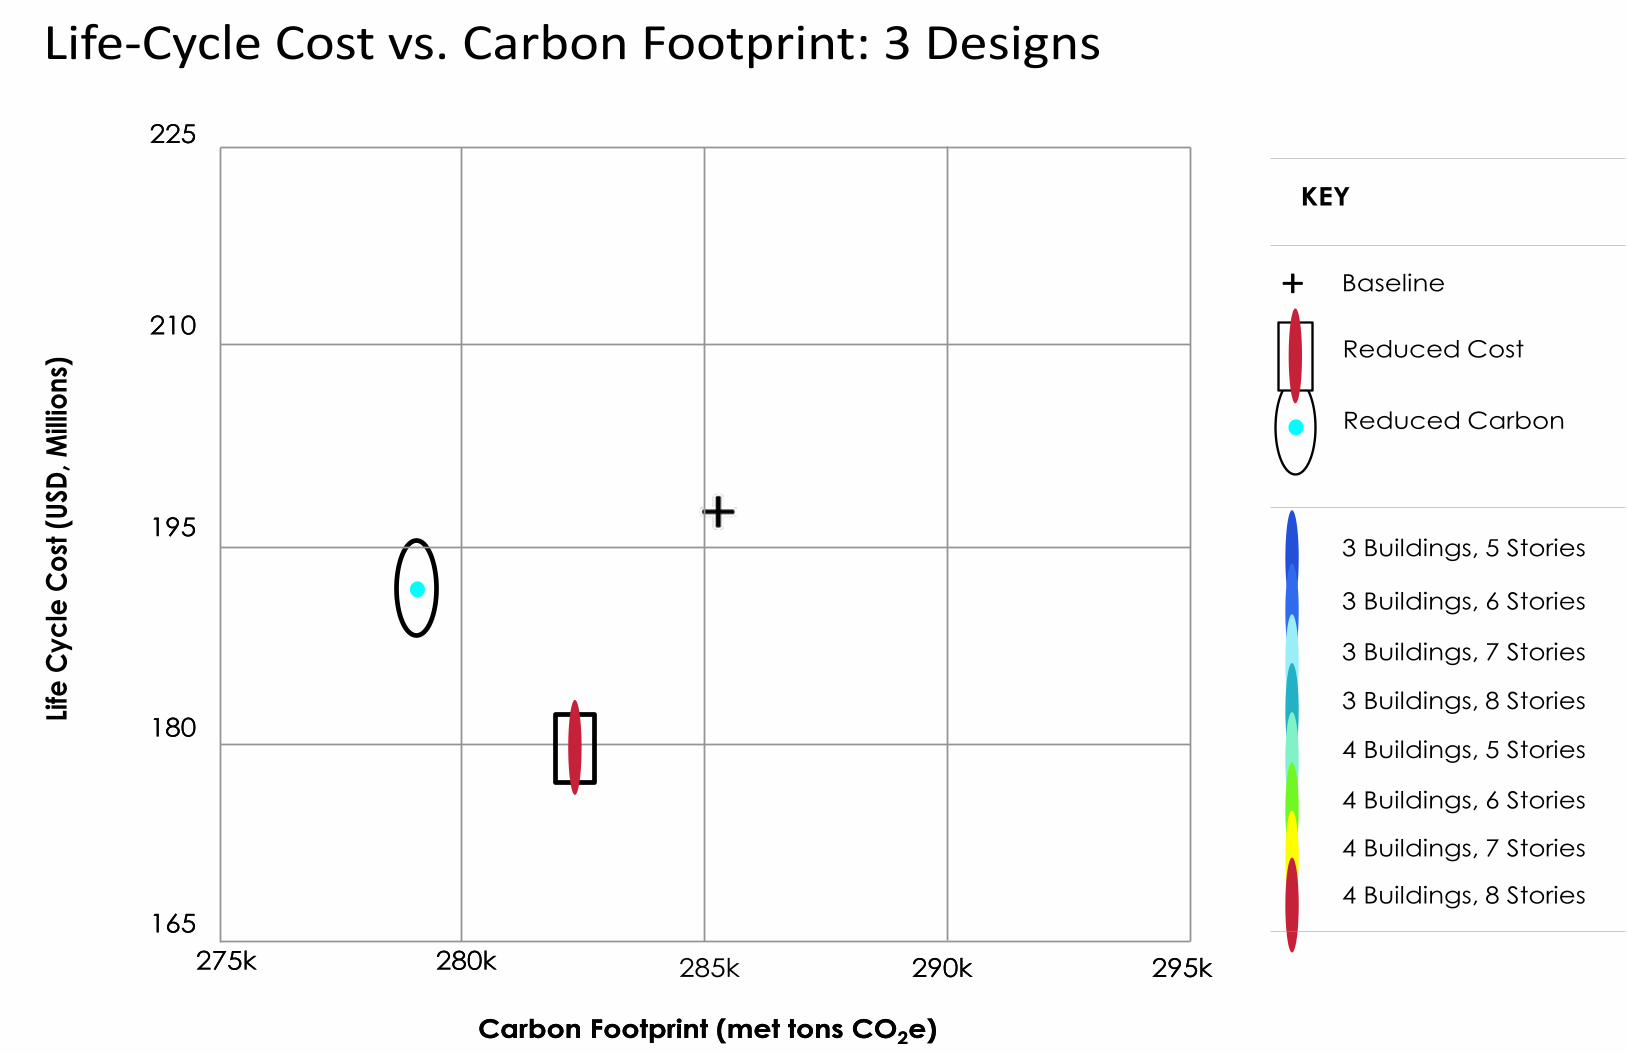
Life-Cycle Cost vs. Carbon Footprint: 3 Designs Lif
e Cy
cle
Cost
(USD
, Milli
ons)
Carbon Footprint (met tons CO2e)
275k 280k 290k 295k
165
180
195
210
225
+
KEY
Baseline
Reduced Carbon
Reduced Cost
3 Buildings, 5 Stories
3 Buildings, 6 Stories
3 Buildings, 7 Stories
3 Buildings, 8 Stories
4 Buildings, 5 Stories
4 Buildings, 6 Stories
4 Buildings, 7 Stories
4 Buildings, 8 Stories
Life
Cycl
e Co
st (U
SD, M
illion
s)
Carbon Footprint (met tons CO2e)
285k275k 280k 290k 295k
165
180
195
210
225

48
Building information
model
Pre-operational
cost
Optimizer
MRR schedule
Pre-operational
CO2e
Energy simulation
Operational cost
Operational CO2e
Life-cycle cost
Life-cycle CO2e
KEY
Automateddata translation
DProfiler
SimaPro
eQUEST
CostLab
Excel
MOGA
MDO Design Method
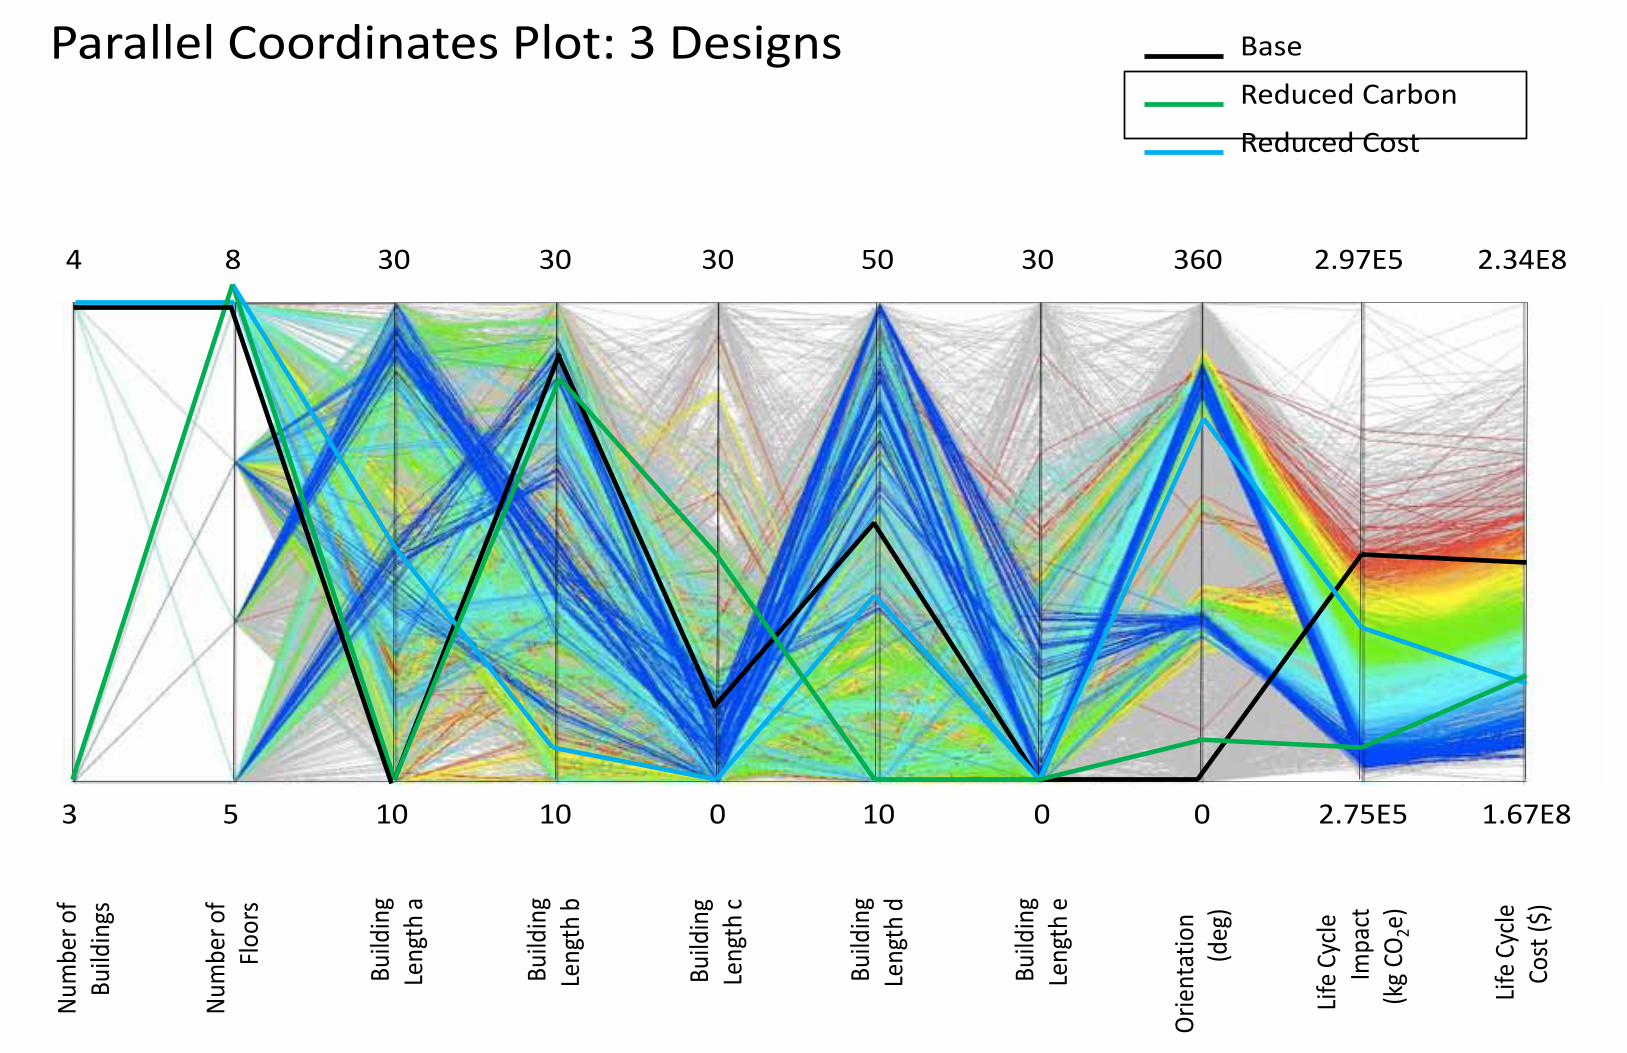
5 3 10 10 0 0 10 0 1.67E8 2.75E5
8 4 30 30 30 30 50 360 2.34E8 2.97E5
Num
ber o
f Bu
ildin
gs
Num
ber o
f Fl
oors
Build
ing
Leng
th a
Build
ing
Leng
th b
Build
ing
Leng
th c
Build
ing
Leng
th d
Build
ing
Leng
th e
Orie
ntat
ion
(d
eg)
Life
Cycle
Im
pact
(k
g CO
2e)
Life
Cycle
Co
st ($
)
Base
Reduced Carbon
Reduced Cost
Parallel Coordinates Plot: 3 Designs

Life-
Cycle
Cos
t (US
D, M
illio
ns)
Carbon Footprint (met tons CO2e)
275k 280k 285k 290k 295k165
180
195
210
225
285k
Results: Life-Cycle Cost vs. Carbon Footprint
+
KEY
Baseline
Reduced Carbon
Reduced Cost
3 Buildings, 5 Stories
3 Buildings, 6 Stories
3 Buildings, 7 Stories
3 Buildings, 8 Stories
4 Buildings, 5 Stories
4 Buildings, 6 Stories
4 Buildings, 7 Stories
4 Buildings, 8 Stories
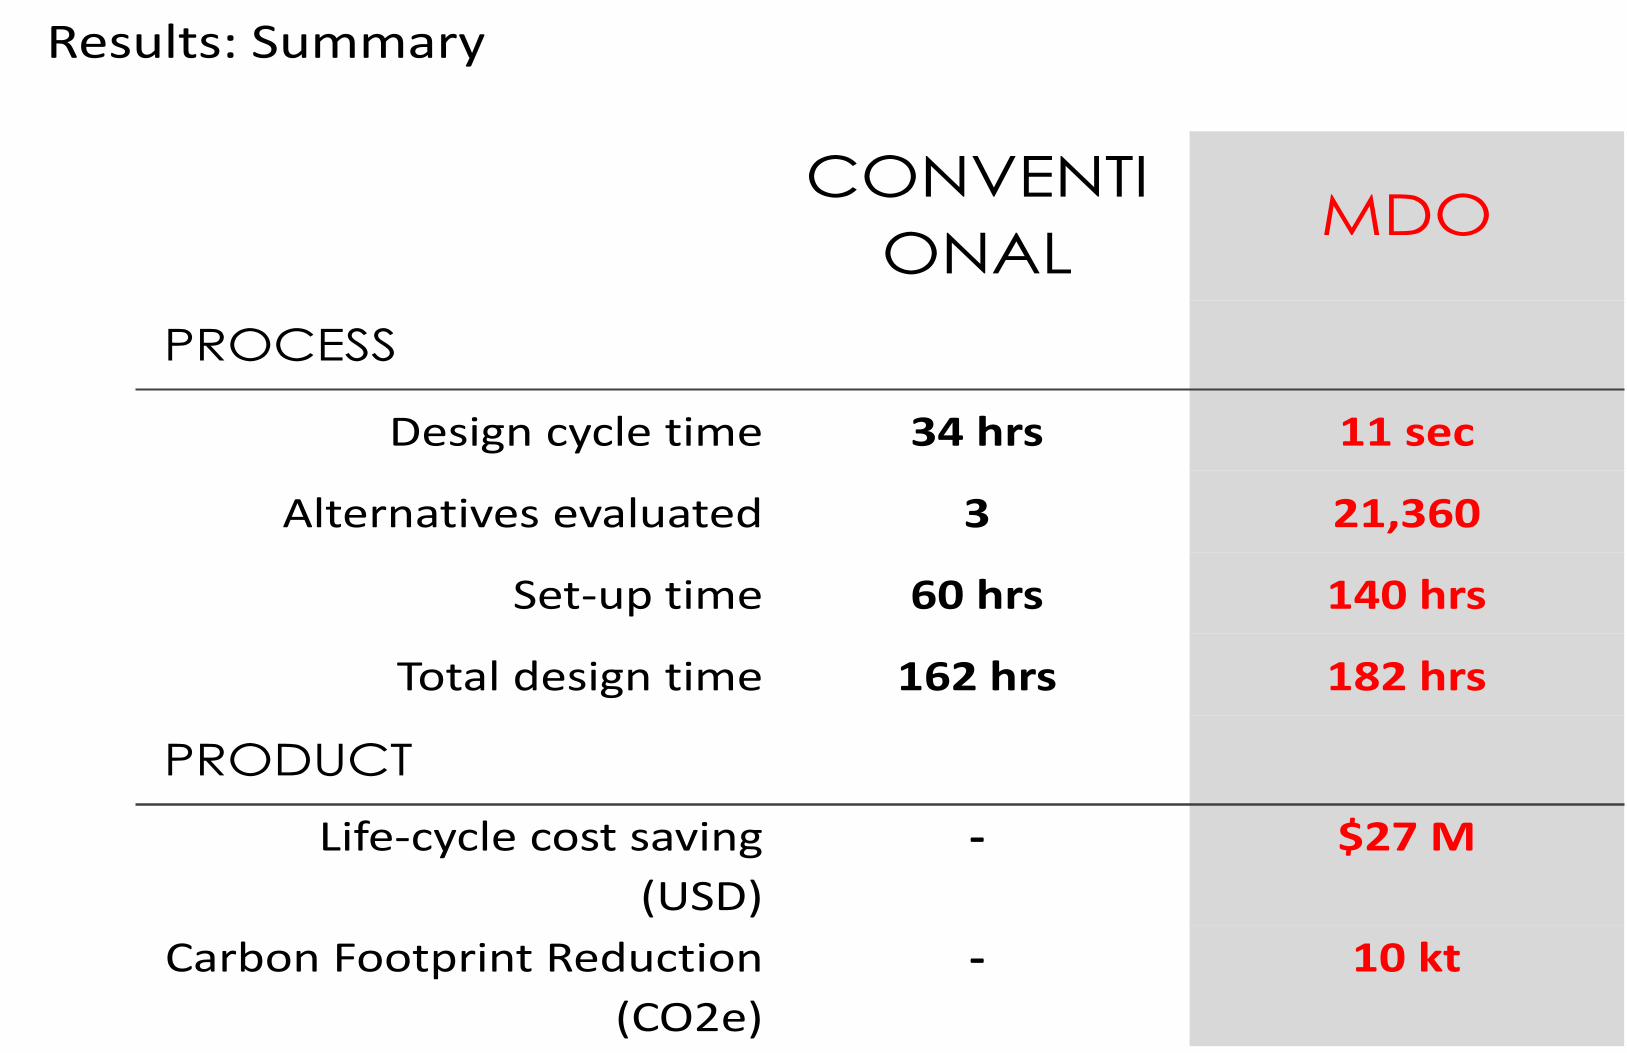
Results: Summary
CONVENTIONAL MDO
PROCESS
Design cycle time 34 hrs 11 sec
Alternatives evaluated 3 21,360
Set-up time 60 hrs 140 hrs
Total design time 162 hrs 182 hrs
PRODUCT
Life-cycle cost saving (USD)
- $27 M
Carbon Footprint Reduction (CO2e)
- 10 kt

I have made all my generals out of mud. Napoleon