building israel’s cleantech independence glenn yago director, milken institute, usa prepared for:...
TRANSCRIPT
Building Israel’s Cleantech Independence
Glenn YagoDirector, Milken Institute, USA
Prepared for:
Globes Conference 2009
Cleantech from Copenhagen to Jerusalem
December 13, 2009

“Towards Energy Independence” over the years
Source: EIA.
Carter: “This nation will never use more foreign oil than we did in 1977… never.”First
World oil crisis1973
Obama: “Eliminate our current imports from the Middle East and Venezuela within 10 years.”
Ford: “We must end vulnerability to economic disruption by foreign suppliers by 1985.”
Nixon: “In the year 1980, the United States will not be dependent on any other country for the energy we need.”
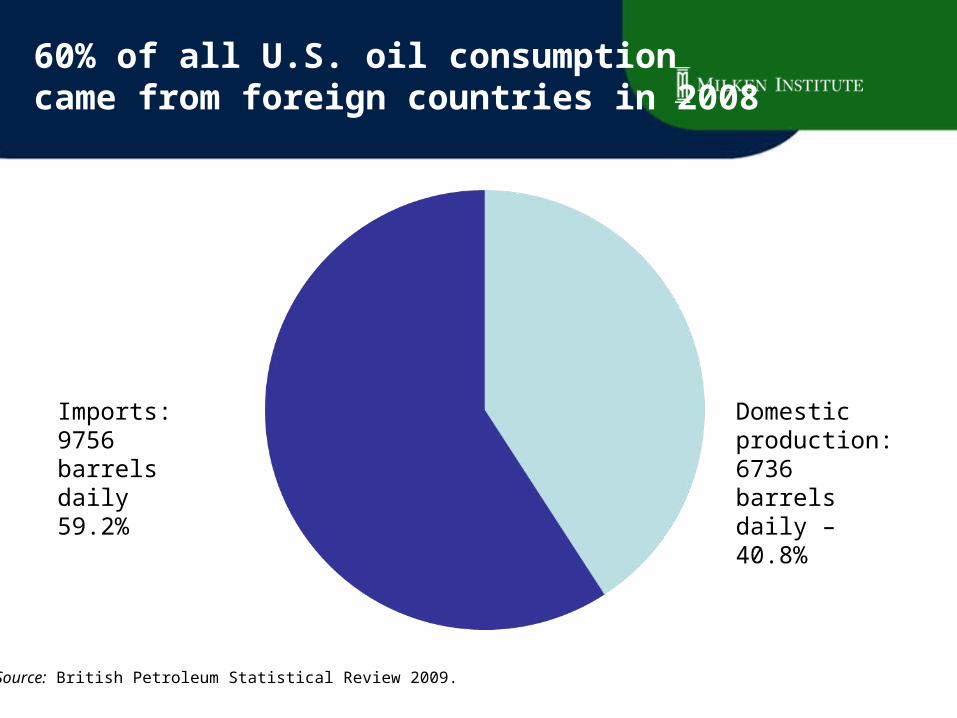
60% of all U.S. oil consumption came from foreign countries in 2008
Domestic production: 6736 barrels daily – 40.8%
Source: British Petroleum Statistical Review 2009.
Imports: 9756 barrels daily59.2%
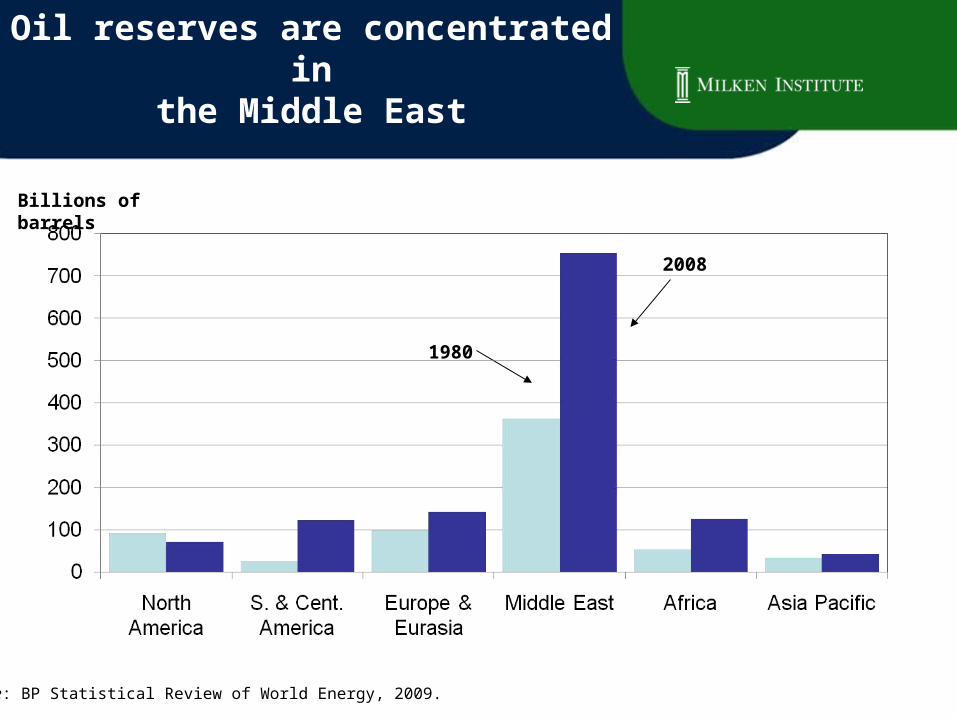
Oil reserves are concentrated inthe Middle East
Source: BP Statistical Review of World Energy, 2009.
1980
2008
Billions of barrels

Beta Sites: Building New Markets
at Home for Abroad
?כיצד יוצרים שוק ראשוני וחדשני בישראלהנהגה והובלה ממשלתית•
רגולציה ממשלתית •עידוד חדשנות )כגון הקלות במתן אישורים לחדשנים(–
מימון•–Growth equity )late stage( – High risk project financing
מינוף תעשיות הידע הקיימות והפוטנציאל היזמי •המקומי

Partnershipsשותפויות
לשיתוף • כמוקד ישראל של ובינלאומי לאומי מיצובפעולה
זרות • ממשלות עם פעולה :שיתוףמימון–פיתוח –הטמעה/ניסוי–הדגמה–
הפעולה • בשיתופי חדשנות

ד
המימון מבנהידע עתירות לתעשיות
Venture Capital
Incubators
Growth Equity
Stock Exchange & Banks
R&D Grants
כלי מדען ראשי:
Private Equity
Mezzanine
Angels
Academia
כלי שוק פרטי:
Strategic Partners

התפלגות ההשקעה לפי שלבי הצמיחה בישראל וארה"ב
Source: PricewaterhouseCoopers’ Money Tree Reports
4%
38%
58%
15%12%
73%
0
10
20
30
40
50
60
70
80
90
100
late stageearly stageSeed
Per
cen
t
US Israel
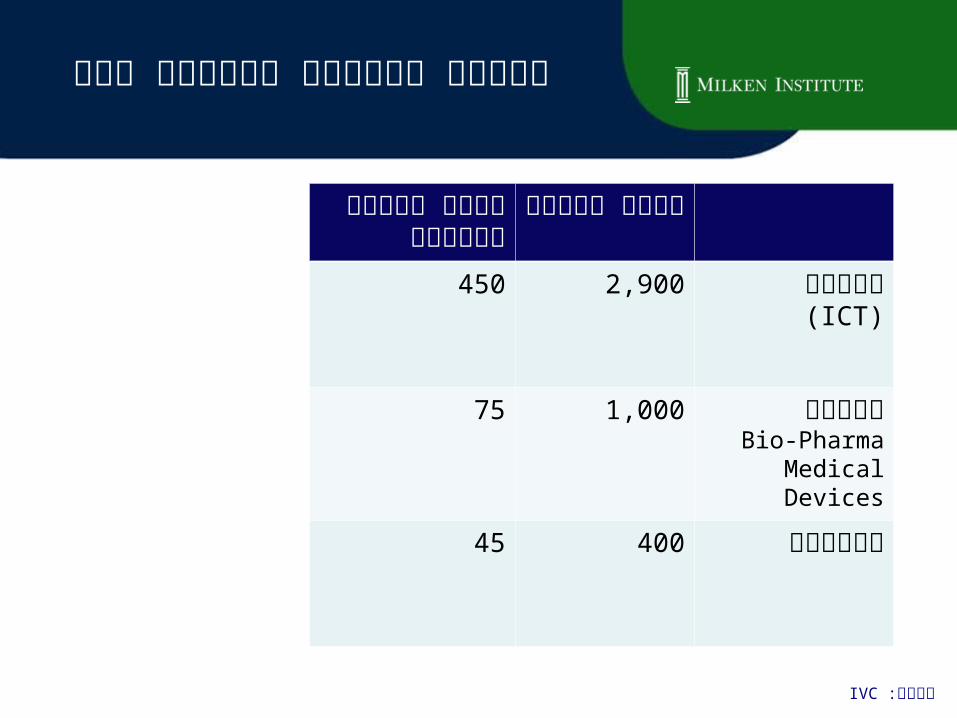
ידע עתירות תעשייה חברות
מספר חברות בוגרות
מספר חברות
450 2,900 הייטק(ICT)
75 1,000 ביוטקBio-Pharma
Medical Devices
45 400 קלינטק
IVCמקור:
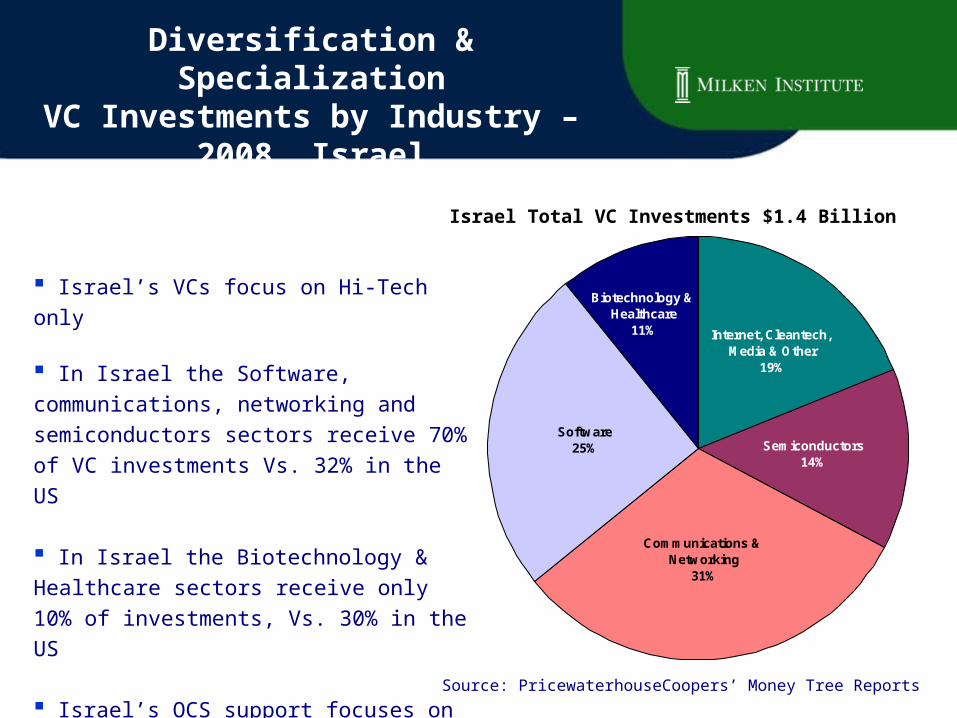
Israel’s VCs focus on Hi-Tech only
In Israel the Software, communications,
networking and semiconductors sectors
receive 70% of VC investments Vs. 32% in
the US
In Israel the Biotechnology & Healthcare
sectors receive only 10% of investments, Vs.
30% in the US
Israel’s OCS support focuses on
manufacturing R&D.
Diversification & SpecializationVC Investments by Industry – 2008,
Israel
Source: PricewaterhouseCoopers’ Money Tree Reports
Semiconductors14%
Software25%
Biotechnology & Healthcare
11%
Communications & Networking
31%
Internet, Cleantech, Media & Other
19%
Israel Total VC Investments $1.4 Billion
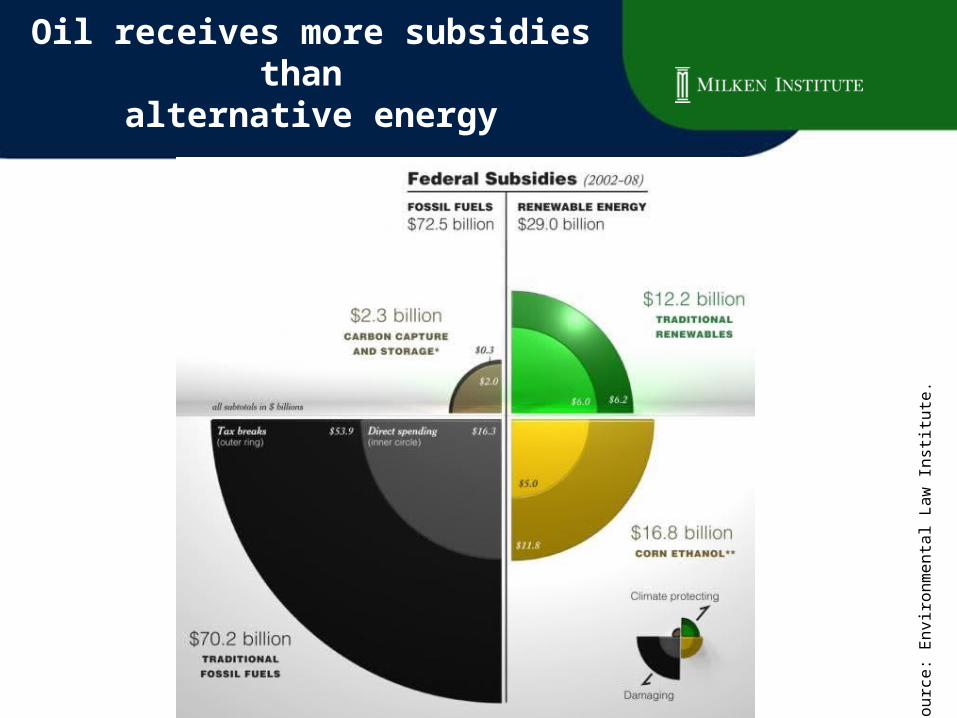
Oil receives more subsidies than alternative energy
So
urc
e:
En
viro
nm
en
tal L
aw
In
stitu
te.

Global investment in new clean energy
Source: New Energy Finance.
US$ billions

Funding challenges for AlternativeEnergy
TechnologyTechnologyincumbentincumbent
Seed/Seed/Start-upStart-up
Early stageEarly stage ExpansionExpansion Late stageLate stage
Venture capital Project financeAngel investor
First generation - Scaling up- Further R&D- Upgrading pipeline - Increase market share- Mezzanine and bridge finance for IPO or M&A- Collapsing market/Falling prices
Third generation - R&D- Initial investment in demonstration projects
Second generation - Achieve commercial-scale operation- Bringing down costs- Further investment in facilities
Funding challenges
Public grants and tax incentives
Valley of deathValley of death
Source: Milken Institute

The Water-Energy Nexus
Energy productionand generationrequire water
Water pumping,treatment anddistribution requireenergy
Reduced water conveyance and increased water recycling
Decreased energy consumption and smaller carbon footprint
Energy productionand generationrequire water
Water pumping,treatment anddistribution requireenergy
Reduced water conveyance and increased water recycling
Decreased energy consumption and smaller carbon footprint
Source: Y. Cohen, UCLA Water Center, 2009
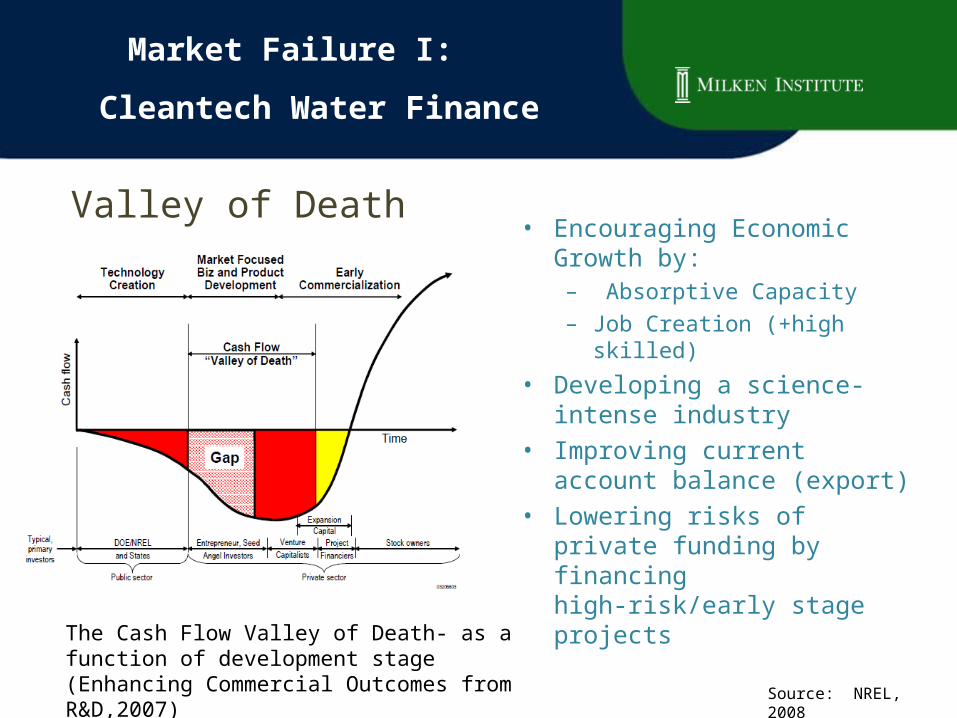
• Encouraging Economic Growth by:– Absorptive Capacity
– Job Creation )+high skilled(
• Developing a science-intense industry
• Improving current account balance )export(
• Lowering risks of private funding by financing high-risk/early stage projects
Valley of Death
The Cash Flow Valley of Death- as a function of development stage )Enhancing Commercial Outcomes from R&D,2007( Source: NREL, 2008
Market Failure I:
Cleantech Water Finance

Market Failure 2: Water Project FinanceInternational Private Investment in Infrastructure
Sources: Ti Le-Huu, Sustainable Development and Water Resources Section, UNESCAP.
US$ billion 1990-2009

A Shift in Water Resources & Management Paradigm
Source: Y. Cohen, UCLA WaTeR Center, 2009.
Alternative Energy IssuesAdditional Information
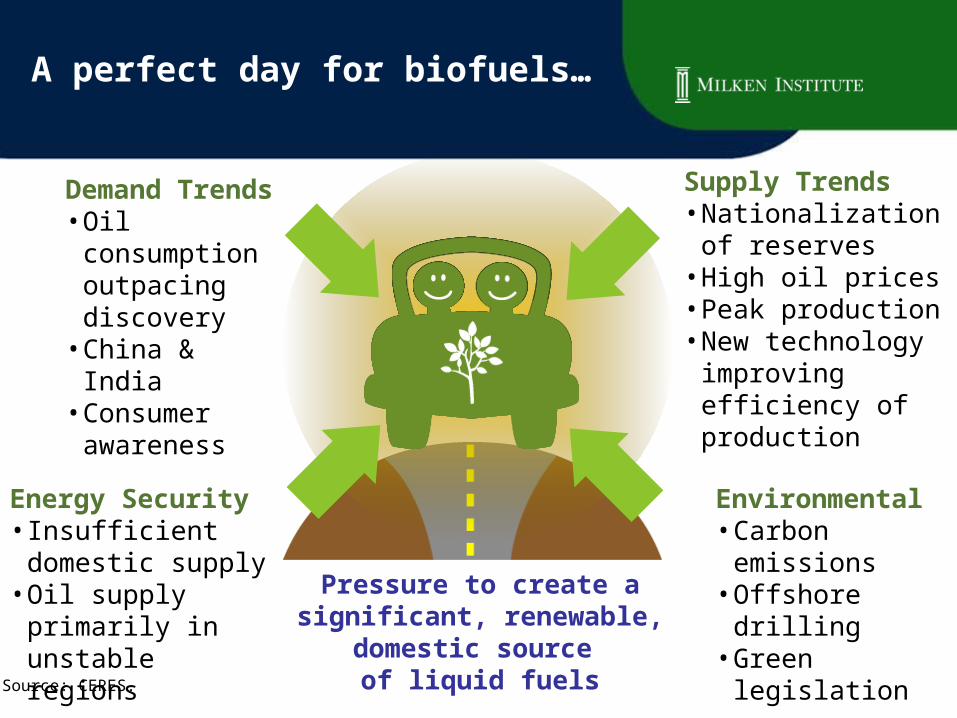
A perfect day for biofuels…
Energy Security• Insufficient domestic
supply• Oil supply primarily
in unstable regions
Demand Trends• Oil consumption
outpacing discovery
• China & India• Consumer
awareness
Supply Trends• Nationalization of
reserves• High oil prices• Peak production• New technology
improving efficiency of production
Environmental• Carbon
emissions• Offshore drilling• Green
legislation
Pressure to create a significant, renewable,
domestic source of liquid fuelsSource: CERES.

The advances in biofuels technology is game changing
Open-PollinatedDouble Cross
Biotechnology
Single-CrossHybrids
Average U.S. Corn Yields
Bu
shel
s/A
cre
Hybrid genetics & biotechnology have driven a five-fold increase in average U.S. corn yields since 1940.
Source: USDA.
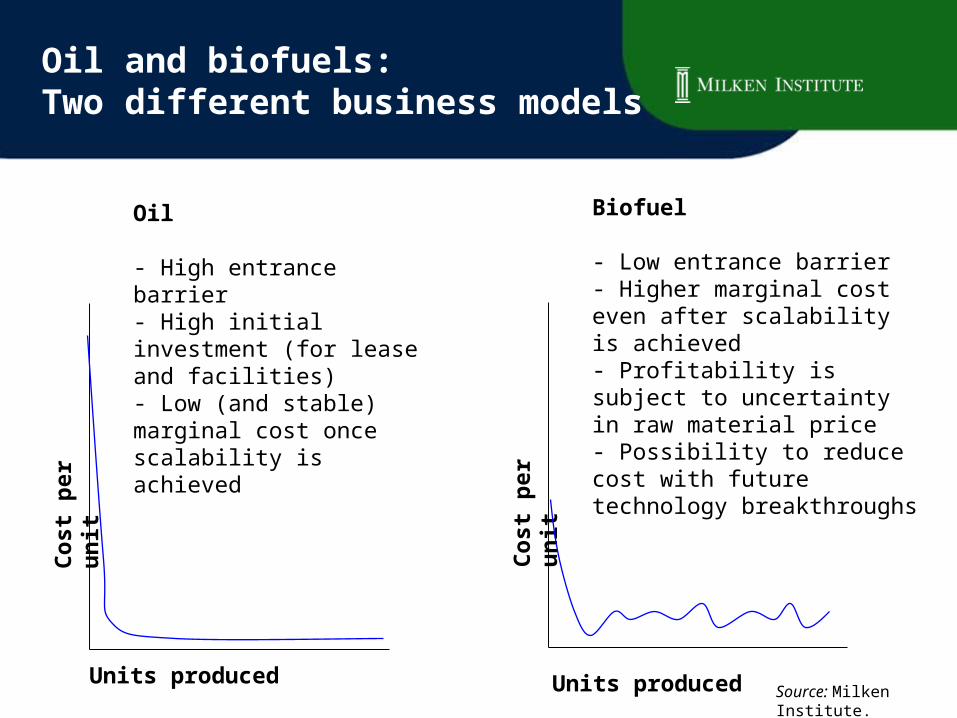
Oil and biofuels: Two different business models
Co
st
pe
r u
nit
Units produced
Oil
- High entrance barrier- High initial investment )for lease and facilities(- Low )and stable( marginal cost once scalability is achieved
Co
st
pe
r u
nit
Units produced
Biofuel
- Low entrance barrier- Higher marginal cost even after scalability is achieved- Profitability is subject to uncertainty in raw material price- Possibility to reduce cost with future technology breakthroughs
Source: Milken Institute.

The American Recovery and Reinvestment Act of 2009 (ARRA)Total measures worth $787 billion
So
urc
e:
Th
e A
me
rica
n R
eco
very
an
d R
ein
vest
me
nt
Act
of
20
09
.
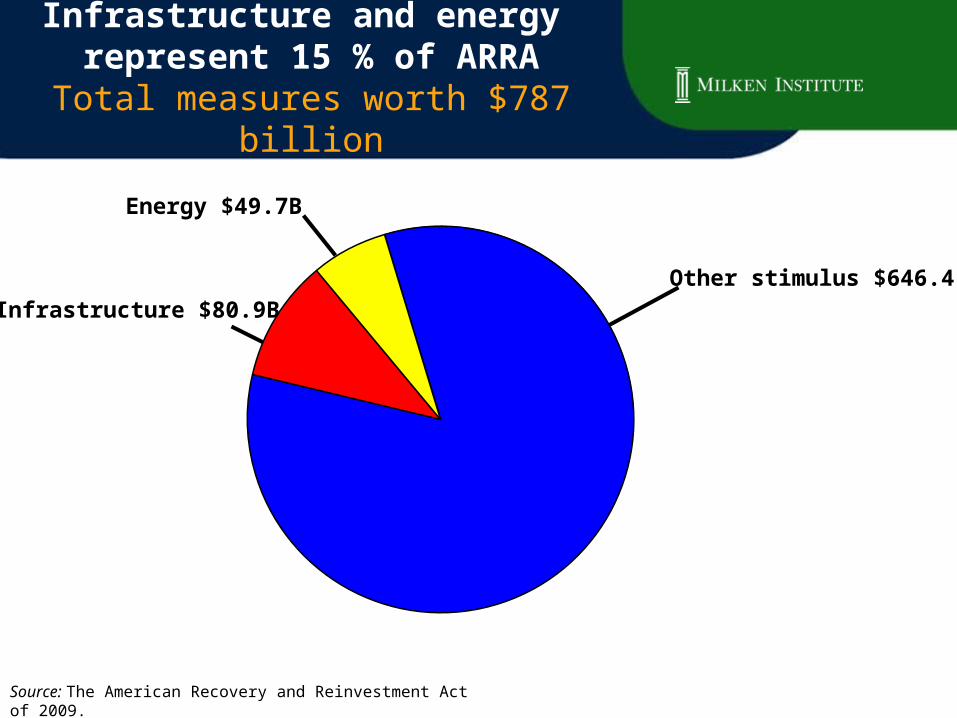
Infrastructure and energy represent 15 % of ARRA
Total measures worth $787 billion
Other stimulus $646.4
Infrastructure $80.9B
Energy $49.7B
Source: The American Recovery and Reinvestment Act of 2009.
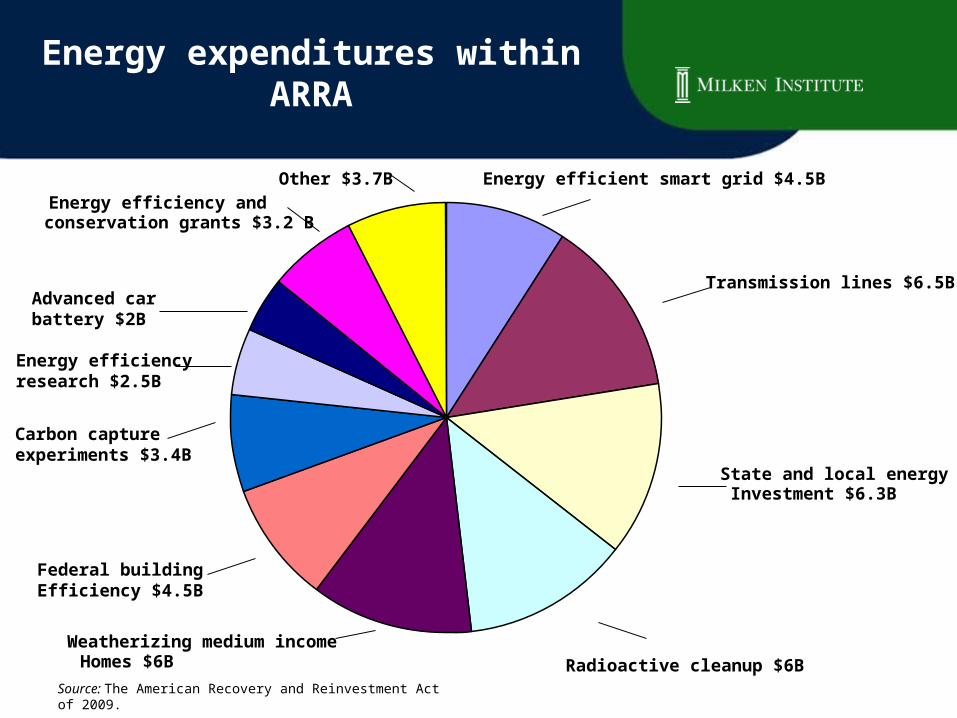
Energy expenditures within ARRA
Energy efficient smart grid $4.5B
Transmission lines $6.5B
State and local energyInvestment $6.3B
Radioactive cleanup $6BWeatherizing medium incomeHomes $6B
Federal building Efficiency $4.5B
Carbon capture experiments $3.4B
Energy efficiency research $2.5B
Advanced car battery $2B
Energy efficiency andconservation grants $3.2 B
Other $3.7B
Source: The American Recovery and Reinvestment Act of 2009.

$16.8 billion designated for the Office of Energy Efficiency and
Renewable Energy
Source: The U.S. Department of Energy.
Energy Efficiency and
Conservation Block Grants$3.2 billion
Retrofit ramp-
ups in energy efficiency - $454 million
Weatherization Assistance Program$5 billion
State Energy Program$3.1 billion
Energy Efficiency Research $2.5 billion
Others - $3 billion
DOE Recovery Act Funding: $36.7 billion