building it together: the design and implementation of ... building it together: the design and...
TRANSCRIPT

Building It Together: The Design and Implementation of Hillsborough County Public Schools’ Teacher Evaluation System
By Rachel Curtis
March 2012

Copyright © 2012 by The Aspen Institute
The Aspen InstituteOne Dupont Circle, N.W.Suite 700Washington, DC 20036
Published in the United States of America in 2012 by The Aspen Institute
All rights reservedPrinted in the United States of AmericaPublication Number: 12/0
All photographs were provided by Hillsborough County Public Schools.

www.aspeninstitute.org/education
Building It Together: The Design and Implementation of Hillsborough County Public Schools’ Teacher Evaluation System
By Rachel Curtis
March 2012
AcknowledgmentsThank you to the Hillsborough County Public Schools teachers, principals and central office staff who participated in this study. Special thanks to MaryEllen Elia, David Steele, Jean Clements, Lewis Brinson, Anna Brown, Tracye Brown, Jamalya Jackson, Tricia McManus, Wynne Tye, and Stephanie Woodford. Thank you also to Ross Wiener, Erin Hammond and Ariel Jacobs of the Aspen Institute Education & Society Program for guiding the development and production of this case study.
About the Author
Rachel Curtis works with school systems, foundations, and education policy organizations on teacher and principal human capital issues. In 2006, as assistant superintendent of the Boston Public Schools, she developed the system’s teaching standards and aligned new teacher induc-tion support and teacher evaluation to them. Her publications include the books Teaching Talent, Strategy in Action, and The Skillful Leader II.
Building It Together: Hillsborough County Public Schools’ Teacher Evaluation System 3
Overview
In 2010-11, the Hillsborough County (FL) Public Schools (Hillsborough, HCPS) launched a teacher-evaluation system that has attracted
attention from educators and policy makers across the country. All the stars aligned to make this new system possible. Five years of experience measuring teachers’ contributions to student achievement gains and implementing pay-for-performance through the state’s Merit Award Program (MAP) helped Hillsborough build the necessary infrastructure. Two, five-year Teacher Incentive Fund (TIF) grants (awarded in 2007 and 2010) enabled the district to implement pay-for-performance on a broad scale and built a familiarity with the concept among teachers. Then, late in 2009, the Bill & Melinda Gates Foundation awarded Hillsborough a $100 million Empowering Effective Teachers (EET) grant to support educator effectiveness. The grant focuses on implementation of a high-quality induction program for new teachers, enhanced professional development, new teacher and principal evaluation systems, a revamping of the system’s compensation plan, and incentives for teachers to work with the highest-needs students.
The new evaluation system also benefited from a deep collaboration between the school system and the Hillsborough Classroom Teachers Association (CTA). Together, the district and the union set the conditions for the early experiments in pay-for-performance, jumping at the chance to begin to figure out this complicated issue and leverage $10 million in state funds to reward effective teacher performance. The union president was one of the five members – along with the superintendent and school board chairman – of the work group that wrote the Empowering Effective Teachers grant. And teachers sit side-by-side with school and system administrators designing, supporting, and tracking the implementation of each element of the evaluation system.
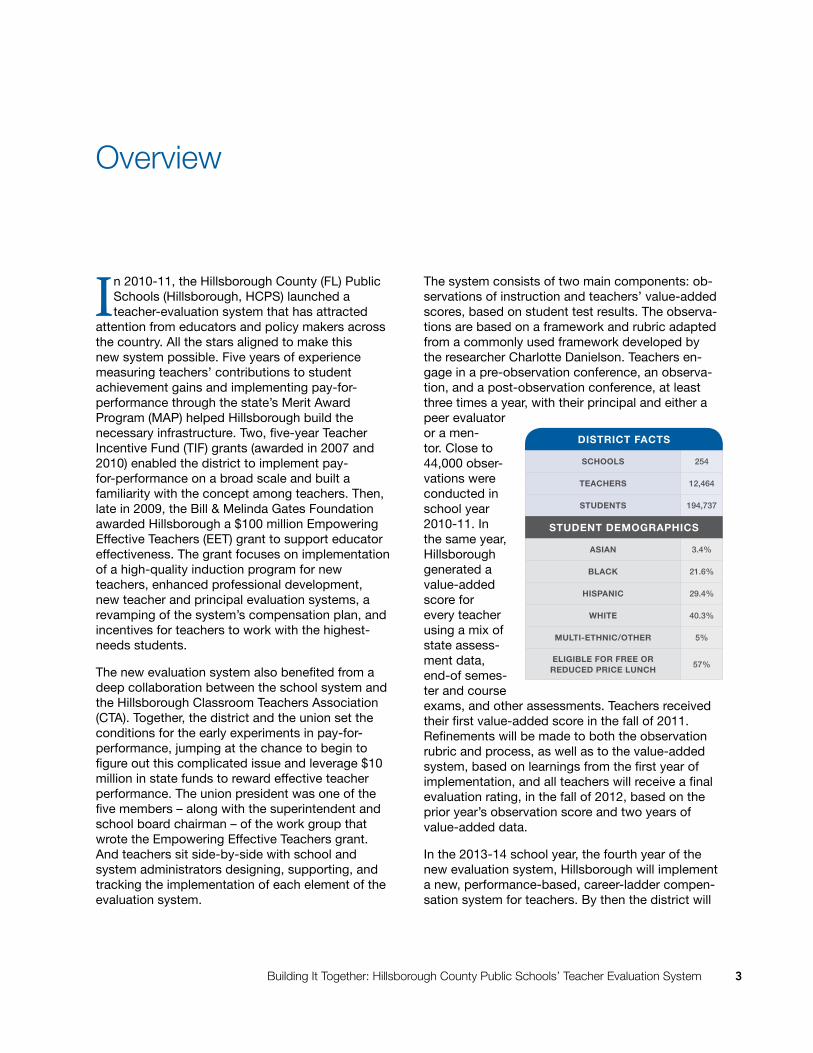
The system consists of two main components: ob-servations of instruction and teachers’ value-added scores, based on student test results. The observa-tions are based on a framework and rubric adapted from a commonly used framework developed by the researcher Charlotte Danielson. Teachers en-gage in a pre-observation conference, an observa-tion, and a post-observation conference, at least three times a year, with their principal and either a peer evaluator or a men-tor. Close to 44,000 obser-vations were conducted in school year 2010-11. In the same year, Hillsborough generated a value-added score for every teacher using a mix of state assess-ment data, end-of semes-ter and course exams, and other assessments. Teachers received their first value-added score in the fall of 2011. Refinements will be made to both the observation rubric and process, as well as to the value-added system, based on learnings from the first year of implementation, and all teachers will receive a final evaluation rating, in the fall of 2012, based on the prior year’s observation score and two years of value-added data.
In the 2013-14 school year, the fourth year of the new evaluation system, Hillsborough will implement a new, performance-based, career-ladder compen-sation system for teachers. By then the district will
District Facts
schools 254
teachers 12,464
stuDents 194,737
stuDent Demographics
asian 3.4%
Black 21.6%
hispanic 29.4%
white 40.3%
multi-ethnic/other 5%
eligiBle For Free or reDuceD price lunch
57%
4 The Aspen Institute Education & Society Program
have three years of observation and value-added data for each teacher. All teachers hired after the 2010 contract was ratified (about 40% of the workforce) are required to be enrolled in the new compensation system; veteran teachers have the option of enrolling in the new system or remaining in the previous system.
While systems like Hillsborough’s have sparked heated disagreements in other districts, the HCPS system has been facilitated by the district’s deep commitment to communication, collaboration, cross-functional work, and continuous improve-ment. HCPS brought to this work a belief that there is no such thing as too much communication. It has developed a rich array of strategies and media for communicating about this initiative and collecting feedback. Cross-functional workgroups bring to-gether teachers, principals, central office staff, and district leaders to guide the design and implemen-tation of each key element of the initiative. Central office staff work cross-functionally to ensure all key stakeholders and issues are considered. And all
of this work is monitored closely and regularly to identify problems and develop solutions as quickly as possible.
The culture that undergirds this work is captured in Superintendent MaryEllen Elia’s comment that “you don’t get excellence by destroying people,” a belief that is reflected in how the system does business. The focus of the teacher-evaluation work in Hills-borough is to help educators develop and improve their practice. And the way that work is ap-proached has a similar focus on development and improvement. The prevailing attitude among people involved in executing the new evaluation system can be summed up as a commitment to do the best they know how to do, learn from it, see where there are problems, make mid-course corrections and keep improving. There is a deep well of trust among adults in HCPS and a belief that the system will address whatever issues come up. The new evaluation system builds on and aims to strengthen Hillsborough’s conviction that the system and its educators are good and will keep getting better.
Building It Together: Hillsborough County Public Schools’ Teacher Evaluation System 5
Table of Contents
Background. . . . . . . . . . . . . . . . . . . . . . . . . . . . . . . . . . . . . . . . . . . . . . . . . . . . . . . . . 7
Evaluation . . . . . . . . . . . . . . . . . . . . . . . . . . . . . . . . . . . . . . . . . . . . . . . . . . . . . . . . . . 9
Implementation . . . . . . . . . . . . . . . . . . . . . . . . . . . . . . . . . . . . . . . . . . . . . . . . . . . . . . 11
Collaboration, Communication, and Cross-Functionality . . . . . . . . . . . . . . . . . . . . . 16
Perspectives from the Field . . . . . . . . . . . . . . . . . . . . . . . . . . . . . . . . . . . . . . . . . . . . 20
Data and Results . . . . . . . . . . . . . . . . . . . . . . . . . . . . . . . . . . . . . . . . . . . . . . . . . . . . . 21
Refinements and Priorities for Year Two . . . . . . . . . . . . . . . . . . . . . . . . . . . . . . . . . . . 24
Conclusion . . . . . . . . . . . . . . . . . . . . . . . . . . . . . . . . . . . . . . . . . . . . . . . . . . . . . . . . . 27
Appendix A: Danielson Domains . . . . . . . . . . . . . . . . . . . . . . . . . . . . . . . . . . . . . . . . 30
Appendix B: Grants Management Team Organizational Chart . . . . . . . . . . . . . . . . . . 31
Appendix C: Summaries of Observations . . . . . . . . . . . . . . . . . . . . . . . . . . . . . . . . . . 33
Appendix D: Five-Star Report . . . . . . . . . . . . . . . . . . . . . . . . . . . . . . . . . . . . . . . . . . 37
Appendix E: Teacher Evaluation Score Report . . . . . . . . . . . . . . . . . . . . . . . . . . . . . . 40
Appendix F: Distribution of Scores . . . . . . . . . . . . . . . . . . . . . . . . . . . . . . . . . . . . . . . 41

6 The Aspen Institute Education & Society Program
Building It Together: Hillsborough County Public Schools’ Teacher Evaluation System 7
Background
H illsborough’s history gives it a strong advan-tage in tackling some of the thorniest issues that are likely to surface in the development
of a new teacher evaluation system. With more than twenty years of experience assessing student learn-ing system-wide in all content areas and four years implementing pay-for-performance, HCPS has a critical infrastructure in place to support this next generation of work.
Since 1998, the state of Florida has had an ex-tensive student assessment system, the Florida Comprehensive Assessment Test (FCAT), which is administered in grades 3 through 11 in mathemat-ics, reading, writing, and science. In addition, Hill-sborough developed its own end-of-semester and course exams for most of the secondary courses offered. These multiple-choice, standardized tests provide the system with measures to assess teacher impact on student achievement in grades and subjects not covered by the FCAT. Since 2007, the system has been using these tests so that HCPS could participate in Florida’s Merit Award Program (MAP), a statewide, pay-for-performance initiative. While they recognized problems with the program’s design, the district and teachers’ union jointly decided to participate in MAP in order to tap the $10 million in additional pay the program could provide to Hillsborough teachers.
To implement the system, Hillsborough identified tests that would yield student growth scores for every course taught, then matched students to teachers who would be assigned scores. These efforts enabled the district to address the thorny scheduling issues in schools that make it difficult to generate a student growth score for a teacher. Finally, the district developed value tables for every grade and subject area that indicated the levels of growth required to be eligible for MAP.
Despite this preparation, the initial implementation of MAP was “insane,” as Superintendent MaryEllen Elia bluntly put it. The first year of implementation surfaced all of the problems that are now commonly associated with measuring teacher value-added: matching students to teachers, ensuring metrics are fair, dealing with elementary students who are not attached to a single teacher, and educating teach-ers about the whole value-added concept.
The experience with MAP taught Hillsborough about the importance of clear communication with teach-ers. When the first student growth scores came out, they were a mess. There were mistakes in the calculations of many teachers’ scores and teach-ers were confused and frustrated. As a stopgap measure, HCPS quickly developed a phone bank to respond to the onslaught of teacher calls. It then reached out to the teachers who were most vocal about the problems with the program and invited them to serve on a panel that was charged with fixing them. By the following year, many of the kinks in the system had been ironed out and the system was using its federal TIF grant to provide additional bonuses to high-performing teachers who worked in high-poverty schools.
While the journey was bumpy, the system gained a lot from the experiment that positioned it well for the work of 2010-11. Teachers saw the system respond to their concerns and address problems, build-ing confidence in the system’s commitment and capacity to follow through on its promises. Teach-ers were engaged in creating solutions. Teachers saw the system work hard and collaborate closely with the union, as Superintendent Elia explained, to “put more money in teachers’ pockets.” All of this built teachers’ trust in the system. At the same time, the district learned about the importance of clear, frequent communication with teachers about any changes that affect them. The credibility earned

8 The Aspen Institute Education & Society Program
through addressing the MAP fiasco and the hard-earned lessons made Hillsborough much smarter about how to approach the design and implementa-tion of its new evaluation system.
Hillsborough’s experience with MAP and TIF, the infrastructure it developed as a result, and the longstanding strong collaboration it enjoyed with the teachers union attracted the attention of the Gates Foundation, which was preparing to make a substantial investment in teacher evaluation and de-velopment. The foundation in 2009 invited HCPS to apply for a large, multi-year grant that is one of the cornerstones of the foundation’s educator effective-ness efforts. A team consisting of the superinten-
dent, school board chair, union president and key district leaders engaged in an intensive process of assessing the system’s educator effectiveness work and mapping out a vision and strategy to build a ro-bust system of teacher support and accountability, career pathways, and compensation. As part of this process, the system surveyed teachers to assess their readiness for the kind of change HCPS was proposing. The response from teachers was hopeful and in 2009 Hillsborough was awarded a seven-year, $100 million grant to bring its vision to life – one of only four systems in the country awarded a Gates Educator Effectiveness grant.
Building It Together: Hillsborough County Public Schools’ Teacher Evaluation System 9
Evaluation
The evaluation design that Hillsborough developed consists of three components: observations by peer evaluator or mentor1
(30 percent of a teacher’s score), observations by the principal (30 percent), and value-added data (40 percent). The district chose to use multiple mea-sures to come up with scores for each component: two evaluators for each observation, and several achievement measures contributing to value-added metrics wherever possible. The district chose Char-lotte Danielson’s Domains of Effective Teaching to guide observations, using a four-point rubric to as-sess teaching practice. (See Appendix A for a listing of the Danielson Domains.)
Observation
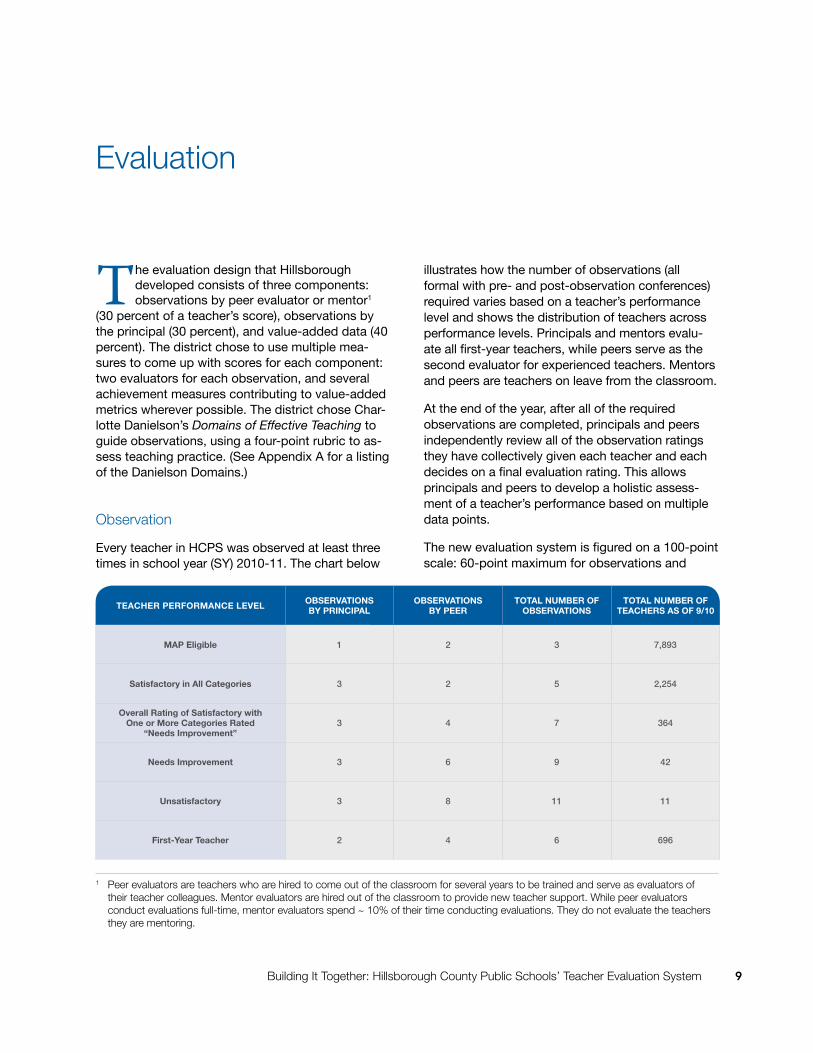
Every teacher in HCPS was observed at least three times in school year (SY) 2010-11. The chart below
illustrates how the number of observations (all formal with pre- and post-observation conferences) required varies based on a teacher’s performance level and shows the distribution of teachers across performance levels. Principals and mentors evalu-ate all first-year teachers, while peers serve as the second evaluator for experienced teachers. Mentors and peers are teachers on leave from the classroom.
At the end of the year, after all of the required observations are completed, principals and peers independently review all of the observation ratings they have collectively given each teacher and each decides on a final evaluation rating. This allows principals and peers to develop a holistic assess-ment of a teacher’s performance based on multiple data points.
The new evaluation system is figured on a 100-point scale: 60-point maximum for observations and
1 Peer evaluators are teachers who are hired to come out of the classroom for several years to be trained and serve as evaluators of their teacher colleagues. Mentor evaluators are hired out of the classroom to provide new teacher support. While peer evaluators conduct evaluations full-time, mentor evaluators spend ~ 10% of their time conducting evaluations. They do not evaluate the teachers they are mentoring.
teacher perFormance level oBservations By principal
oBservations By peer
total numBer oF oBservations
total numBer oF teachers as oF 9/10
map eligible 1 2 3 7,893
satisfactory in all categories 3 2 5 2,254
overall rating of satisfactory with one or more categories rated
“needs improvement”3 4 7 364
needs improvement 3 6 9 42
unsatisfactory 3 8 11 11
First-year teacher 2 4 6 696
10 The Aspen Institute Education & Society Program
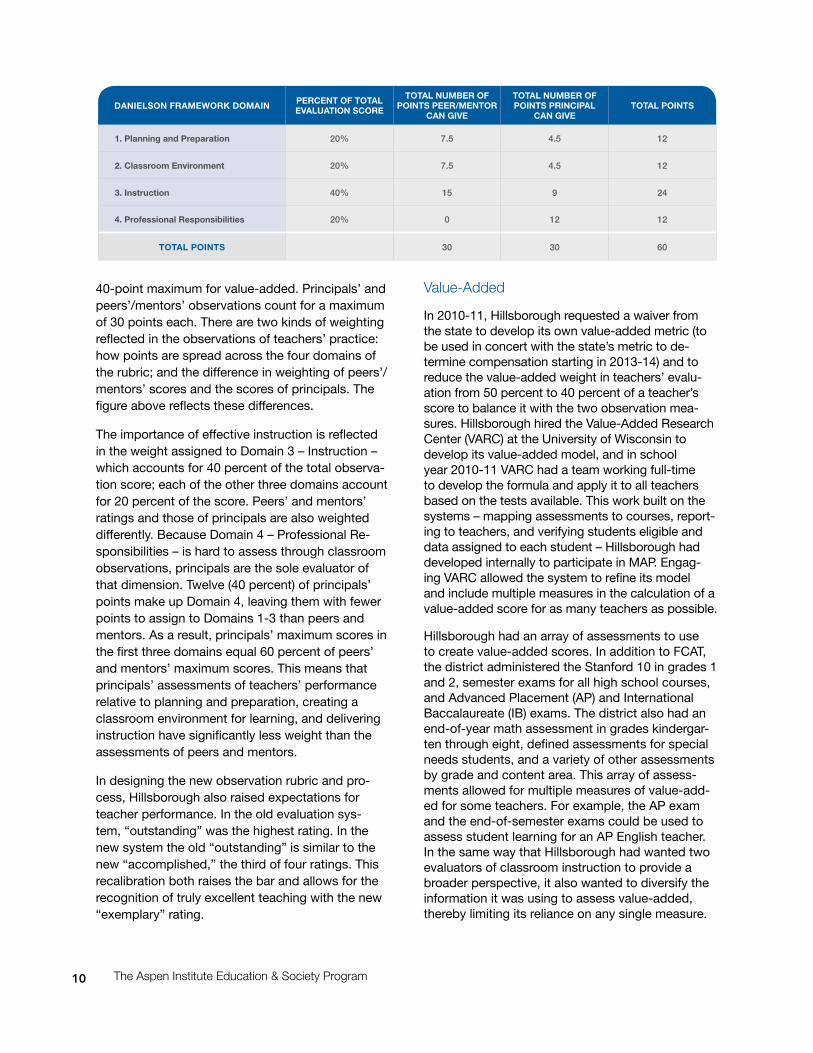
40-point maximum for value-added. Principals’ and peers’/mentors’ observations count for a maximum of 30 points each. There are two kinds of weighting reflected in the observations of teachers’ practice: how points are spread across the four domains of the rubric; and the difference in weighting of peers’/mentors’ scores and the scores of principals. The figure above reflects these differences.
The importance of effective instruction is reflected in the weight assigned to Domain 3 – Instruction – which accounts for 40 percent of the total observa-tion score; each of the other three domains account for 20 percent of the score. Peers’ and mentors’ ratings and those of principals are also weighted differently. Because Domain 4 – Professional Re-sponsibilities – is hard to assess through classroom observations, principals are the sole evaluator of that dimension. Twelve (40 percent) of principals’ points make up Domain 4, leaving them with fewer points to assign to Domains 1-3 than peers and mentors. As a result, principals’ maximum scores in the first three domains equal 60 percent of peers’ and mentors’ maximum scores. This means that principals’ assessments of teachers’ performance relative to planning and preparation, creating a classroom environment for learning, and delivering instruction have significantly less weight than the assessments of peers and mentors.
In designing the new observation rubric and pro-cess, Hillsborough also raised expectations for teacher performance. In the old evaluation sys-tem, “outstanding” was the highest rating. In the new system the old “outstanding” is similar to the new “accomplished,” the third of four ratings. This recalibration both raises the bar and allows for the recognition of truly excellent teaching with the new “exemplary” rating.
Value-Added
In 2010-11, Hillsborough requested a waiver from the state to develop its own value-added metric (to be used in concert with the state’s metric to de-termine compensation starting in 2013-14) and to reduce the value-added weight in teachers’ evalu-ation from 50 percent to 40 percent of a teacher’s score to balance it with the two observation mea-sures. Hillsborough hired the Value-Added Research Center (VARC) at the University of Wisconsin to develop its value-added model, and in school year 2010-11 VARC had a team working full-time to develop the formula and apply it to all teachers based on the tests available. This work built on the systems – mapping assessments to courses, report-ing to teachers, and verifying students eligible and data assigned to each student – Hillsborough had developed internally to participate in MAP. Engag-ing VARC allowed the system to refine its model and include multiple measures in the calculation of a value-added score for as many teachers as possible.
Hillsborough had an array of assessments to use to create value-added scores. In addition to FCAT, the district administered the Stanford 10 in grades 1 and 2, semester exams for all high school courses, and Advanced Placement (AP) and International Baccalaureate (IB) exams. The district also had an end-of-year math assessment in grades kindergar-ten through eight, defined assessments for special needs students, and a variety of other assessments by grade and content area. This array of assess-ments allowed for multiple measures of value-add-ed for some teachers. For example, the AP exam and the end-of-semester exams could be used to assess student learning for an AP English teacher. In the same way that Hillsborough had wanted two evaluators of classroom instruction to provide a broader perspective, it also wanted to diversify the information it was using to assess value-added, thereby limiting its reliance on any single measure.
Danielson Framework Domain percent oF total evaluation score
total numBer oF points peer/mentor
can give
total numBer oF points principal
can givetotal points
1. planning and preparation 20% 7.5 4.5 12
2. classroom environment 20% 7.5 4.5 12
3. instruction 40% 15 9 24
4. professional responsibilities 20% 0 12 12
total points 30 30 60
Building It Together: Hillsborough County Public Schools’ Teacher Evaluation System 11
Implementation
In school year 2010-11, Hillsborough rolled out the Danielson framework and rubric, laid out the new observational assessment expectations,
and hired mentors and peer evaluators. It also put the value-added system in place. Given the size of the district, the enormity of the task, and the need to have Year One implementation go smoothly, Hillsborough collaborated with several key partners to provide the training and support and build the required infrastructure.
Training
HCPS hired Cambridge Education to help with the rollout of the framework and rubric and to prepare evaluators – principals, mentors, and peers (and later assistant principals and key central office staff) – to make credible assessments using the rubric. Cambridge Education was chosen first and foremost because of its capacity to train the 680 people in the district who needed to conduct observations and to complete evaluations. Cambridge Education imple-mented a six-day training program for evaluators, which included performance-based assessments and culminated with certification that was required before evaluators could begin their evaluations.
The training began with an online pre-course, which introduced the Danielson framework and domains. The training alternated between deep exploration of the domains through scripted observations of videos of classroom instruction and school-based observations, in which an instructor worked with a small group of evaluators as they applied their learning observing in classrooms. In order to be certified, evaluators had to be observed and vet-ted by Cambridge Education as they completed pre-observation conferences, observations, and post-observation conferences with two teachers. To ensure evaluators’ continued learning, Cambridge
Education will conduct paired observations with evaluators periodically over the next three years. Additionally, HCPS is developing an online yearly evaluators’ recertification process.
For principals, the six-day training was followed by time devoted at the monthly Principal Council meet-ings. Principals met by school-level to strengthen implementation. In the fall months, the focus was on reviewing videos of instruction and calibrating scores. Regularly throughout the year, principals received aggregate ratings for their school broken out by principal, peers, and mentors as well as indi-vidual ratings for each teacher. They also received a report of the teachers in their school for whom there was a discrepancy in ratings of more than one performance category. At the monthly meetings, principals looked at the data to identify patterns and see what they could learn from them regard-ing teacher support and professional development. The district used the monthly meetings to provide resources to support teachers. For example, princi-pals were introduced to Doug Lemov’s Teach Like a Champion, a widely-used resource on teaching techniques, as the first step in building evaluators’ repertoire of instructional strategies they could draw on to support teachers.
Later in the year, trainers gave principals a teacher’s “bucket” (an online repository of all observation scores, teacher responses to ratings, informal ob-servation write-up, etc.) and asked them to review all of the data and discuss how they would synthe-size it into a final end-of-year evaluation rating. This activity foreshadowed what principals would have to do for each of their teachers at the end of the school year.
For the 46 mentors and 76 peers who were freshly hired into newly created roles, the six-day training served as the beginning of their orientation. HCPS
12 The Aspen Institute Education & Society Program
contracted with The New Teacher Center (TNTC) to provide ongoing training to mentors throughout the year while the system took the lead on training peer evaluators. Given that the mentors’ role was primar-ily focused on supporting first- and second-year teachers, with the evaluation component making up a small part of their overall responsibilities (they devote two weeks to evaluation, four times a year for a total of eight weeks), the district organized their professional development on TNTC’s mentor-ing curriculum. TNTC ran six, three-day academies throughout the school year for all mentors. These sessions focused on deepening mentors’ under-standing of the Danielson domains, developing strategies to support new teachers in each domain, calibrating observations against them, and develop-ing mentoring skills and strategies, using a variety of TNTC’s assessment and development tools. These included templates to guide mentors in set-ting and tracking learning goals with new teachers and formatively assessing new teachers’ growth.
One of the big priorities for the first year of men-toring was to create a learning community among mentors that would support their growth and development and sustain them in the work. Mentors were organized into smaller Professional Learning Communities (PLC) to build relationships and solve problems they encountered in their practice. Men-tors were also organized in pairs to do observations together, share observation strategies, and calibrate ratings. By the end of the first year, mentors had organized themselves into workgroups to resolve issues that had come up and were developing an induction program for new mentors.
While TNTC brought to its work with Hillsborough a mentoring model and expertise and years of ex-perience in developing mentors, HCPS developed its own peer evaluator model and facilitated train-ing aligned to it. After successfully completing the six-day, competency-based training on the rubric and observing and analyzing classroom instruction, peers participated in four weeks of training at the end of the summer and in the early weeks of the school year. This institute continued the observation and calibration work from Cambridge Education and introduced a variety of resources and protocols. These included a pre-observation template with questions, accompanied by a pre-observation guide to facilitate deeper conversations. For example, the first pre-observation conference question was: What is/are your lesson objectives? The guide of-
fered additional prompts, including: Why did you choose these goals and objectives? Where are you in relation to presenting this initial content and mas-tery? How do you plan to communicate the learning objectives to the students? How are you segment-ing the learning? How much time are you spending on these goals and objectives?
Throughout the year, peers met in PLCs once a month for a full day to continue the work of the early professional development, share how they were using the resources provided and to what effect, and work together to solve common problems of practice. PLCs provided peers a smaller group of colleagues with whom they could share their work. This sharing continued outside of meetings, as peers asked one another questions about particular observations and shared snippets of write-ups for feedback.
The Work of Peer Evaluators and Mentors
As the 76 peer evaluators began the work of con-ducting 23,000 observations, they worked hard to build relationships with teachers. This was not an easy task. As one peer evaluator diplomatically noted, “Not everyone was as excited about the new evaluation as me.” However, she continued, she made progress by the end of the year: “Teachers speak to me in the hall….They make eye contact.” The pace peers had to maintain to complete their evaluations (each peer carried a load of 175 teach-ers) was very brisk. They had little time for in-depth talk with teachers about their practice. By the end of the school year, teachers were asking for that kind of support and in Year Two the peer evaluators’ loads were reduced.
One of the reasons for introducing peer evaluators was to ensure objectivity, which was not guaranteed if only principals evaluated teachers. This made peers very cautious about their interactions with principals. They didn’t want teachers to think they were discussing their observations with principals for fear it would compromise their credibility. Yet there was a sense among peers that collaboration between peers and principals might strengthen the implementation of the evaluation system. For example, if peers and principals did some joint ob-servations to calibrate their scoring, it might lead to more closely aligned scores and a clearer message to teachers.
Building It Together: Hillsborough County Public Schools’ Teacher Evaluation System 13
As peers engaged in their work, several unexpected concerns arose. For example teachers and content-area specialists expressed concern that many peer evaluators lacked in knowledge of the elementary curriculum. Content-area directors from the cur-riculum and instruction department started “lining up in the doorway” of the director of evaluation and compensation, expressing concern about elemen-tary observations by peers. The union was hearing similar concerns from teachers. The issue was that peer evaluators were using the Danielson rubric to assess instruction, without understanding the prin-ciples and theory of instruction behind the different reading and writing programs in place in elementary schools. As a result, they were sometimes giving teachers feedback that contradicted the philosophy of the curricular and instructional programs they were implementing.
In response, the district agreed to form a closer partnership between the curriculum and instruction department and the peer evaluators. By providing training to the peers in the different reading and writing programs and also supporting peers who were evaluating elementary teachers who were working departmentally, the district was able to ensure that the pedagogical focus of the Danielson rubric was complemented by the peers’ content knowledge. At the same time, the district deter-mined that the curriculum and instruction staff needed to participate in the six-day training on the rubric and evaluations so they could align their work to the teacher evaluation effort and provide support to peers, mentors, and teachers.
Support for Teachers
Teachers’ support needs surfaced as they received their first observation ratings. The ratings identi-fied areas for improvement related to the Danielson domains and teachers were looking for professional development opportunities aligned to those do-mains. To respond to these needs, HCPS reviewed all of its professional development offerings, orga-nizing and advertising them by domain, and assess-ing where there were gaps in offerings. The system was best able to respond to teachers’ needs in the area of behavior management; its offerings in the areas of differentiated instruction and higher order thinking skills couldn’t meet the demand.
Given the limits of central office professional de-velopment offerings, teachers looked to peers and
principals for support. However, peers didn’t have time in their schedules to support teachers in next steps, and principals reported varied levels of confi-dence in their ability to do that work well. Principals worked to put school-based professional devel-opment in place, but it was inconsistent across schools. Some schools implemented teacher book studies – using the Danielson book that examines the domains in detail and Teach Like a Champion – to build teachers’ understanding of the domains and their repertoire of instructional strategies.
The union was also working to increase support to teachers. It won a grant from the American Federa-tion of Teachers (AFT) Innovation Fund to create online professional development and communities of practice for teachers aligned to the Danielson domains. Teachers facilitated the communities, which engaged several hundred teachers working collaboratively to develop tools and which reflect the priorities outlined in the Danielson domains for specific grades and content areas.
While the district worked to align teacher profes-sional development to the Danielson domains, it re-alized that there was a more fundamental problem. Early in the fall, both principals and peers identified a misalignment between the rubric and the in-structional demands certain categories of teachers faced. Exceptional Student Education (ESE) teach-ers – those who taught students with severe special needs – complained about the same issue to the union. In response, the district and the union cre-ated a committee of ESE teachers, curriculum and instruction staff, and leaders of the evaluation effort to address this. One option was to take ESE teach-ers out of the group assessed using the rubric; the committee chose not to do that. Instead, they de-veloped guidelines on how to interpret the domains in these classroom settings, and what evidence to use to inform scoring. A similar issue was identified for 12th-grade credit-recovery teachers. Given that much of the work students do in this class is online, it was hard to measure teachers on the domains and, ultimately, it was decided that the rubric would not be used for this group of teachers.
Support for Principals
The demands of the new system on principals’ time was profound and the signs of principals’ stress in the fall made it clear that the district needed to address this problem to ensure the success of first-
14 The Aspen Institute Education & Society Program
year implementation. Principals raised this concern with staff leading the evaluation initiative and the assistant superintendent for administration raised the same concern at the superintendent’s senior staff meeting. The district decided to take two steps to ensure that principals had the time they needed to conduct classroom observations. First, it asked principals what the system could take off their plates to make the observation expectations more manageable. Second, it immediately directed Area Directors (AD)2, the principals’ supervisors whose jobs were focused mainly on operational issues, to deploy resources to the schools to support non-instructional issues.
When principals were asked how their work could be streamlined, they had lots of suggestions, and the district responded. Principals’ requests includ-ed: move the behavior management responsibilities related to implementation of Response to Interven-tion (RTI) from them to guidance counselors; group common requests the system makes of principals to one time of year rather than spreading them out throughout the year; make it possible to upload ob-servation scores onto the Lawson Talent Manage-ment system from home; and extend the year-end deadline for completing observations and evalua-tions by two weeks.
Senior leaders addressed each of these requests and others as well as making curriculum and instruc-tion content-area leaders available to principals to
help conduct observations. Assistant principals were trained by Cambridge Education and were leveraged to help with the observations. While principals sign every evaluation, assistant principals conducted observations in several circumstances: when the teacher needed more than one observation; when the teacher was pursuing pay-for-performance; and when the principal wanted another perspective.
The stepped-up role of ADs also helped ease the principals’ administrative burdens somewhat, in order to enable them to focus on their evalua-tion responsibilities. Each AD oversees 35 to 40 schools and has a small staff representing food services, transportation, technology, and excep-tional students’ education to deploy to support schools. They send their teams out to staff front offices, attend to parent concerns, and deal with non-instructional issues.
However, ADs were not prepared to support prin-cipals in the substantive work of observing and analyzing instruction. This was not work they had done previously and they had not participated in the six-day introductory training. Their load of 35 to 40 principals further limited their ability in this regard. The system quickly realized that in order to institu-tionalize the new focus on teacher effectiveness, the ADs’ job would need to be redefined to focus on supporting principals in this work. This need was made even more clear as Hillsborough prepared to implement a new principal evaluation.
2 In school year 2010-11, principal supervisors’ position title was “Area Director.” In school year 2011-12, the title was changed to “Area Leadership Director” to reflect a renewed emphasis on leadership support to principals.
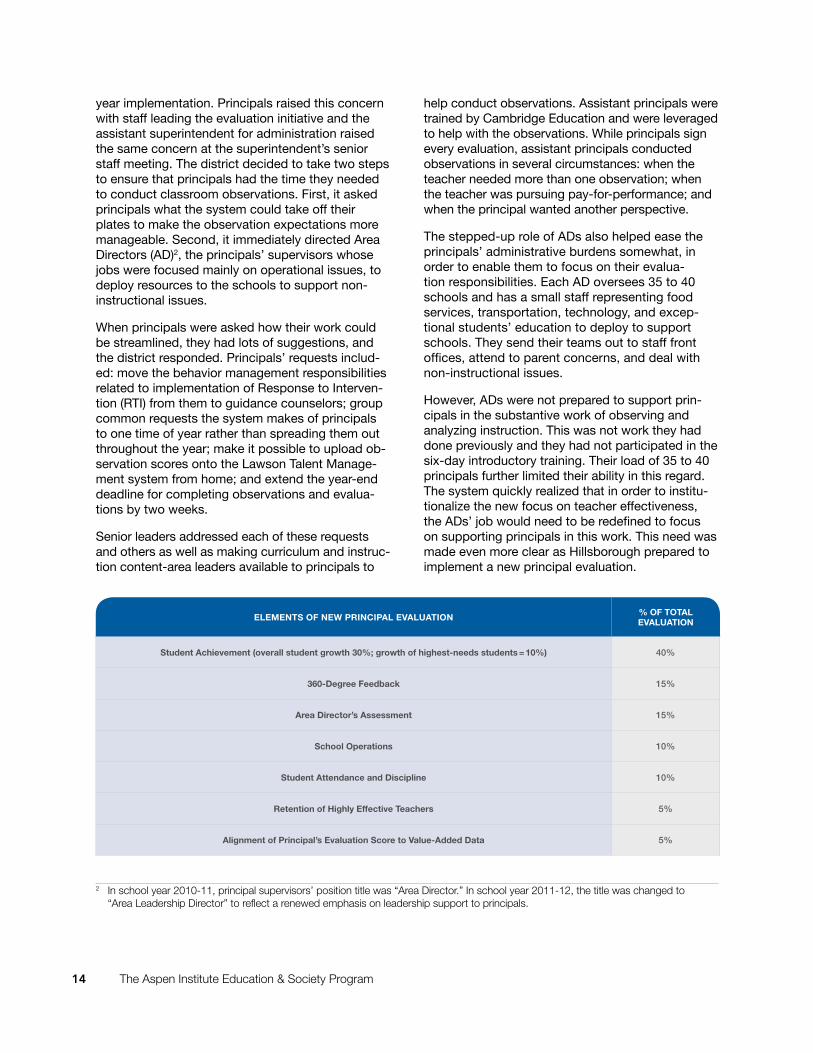
elements oF new principal evaluation % oF total evaluation
student achievement (overall student growth 30%; growth of highest-needs students = 10%) 40%
360-Degree Feedback 15%
area Director’s assessment 15%
school operations 10%
student attendance and Discipline 10%
retention of highly effective teachers 5%
alignment of principal’s evaluation score to value-added Data 5%
Building It Together: Hillsborough County Public Schools’ Teacher Evaluation System 15
The new principal evaluation introduced in 2011 includes the Val Ed. survey, a highly regarded evalu-ation tool designed by researchers at Vanderbilt University. It requires ADs to rate principals on a set of 72 indicators of the quality of principals’ practice. ADs’ traditional focus on operations limited their ability to make such an assessment; their load of 35 to 40 schools also makes it a challenge for them to know the intricacies of each principal’s practice.
ADs’ readiness to support principals and hold them accountable for instructional improvement and teacher development was one leadership challenge that surfaced in the implementation of the new teacher evaluation.
Accompanying it was a growing awareness of the need to develop a stronger pipeline to the principal-
ship and a variety of supports for current principals to build their skills and ensure their ability to meet the district’s changing expectations for them. When considered together, these issues suggested the need for an overall school and system leadership development strategy. Seeing the importance of this for the long-term success of the teacher effective-ness efforts, Hillsborough applied for and received funding from the Wallace Foundation to build a pipeline to the principalship and a robust structure of support for new and experienced principals. The foci of this grant include principal preparation, support for new principals, development for current principals who aspire to lead the system’s most ur-ban schools or serve as area directors, and support for area directors that allows them to spend more time in schools.
16 The Aspen Institute Education & Society Program
Collaboration, Communication, And Cross-Functionality
Given the size of HCPS and the complexity of the new evaluation system, clear, consis-tent, regular communication was prioritized
as critical for success. The system’s earlier work on pay-for-performance and the challenges it had faced made it clear how important strong commu-nication would be. It would help maintain a high de-gree of trust during a time of tremendous transition where there would inevitably be missteps, learnings, and refinements made along the way. Of the six positions created to implement the Gates grant, one of them focuses solely on communications.
The system defined communication broadly and developed a multi-pronged strategy. It included two-way communication with teachers and princi-pals; collaboration between the union, the district, and outside stakeholders in shaping the efforts; and an internal management structure that was cross-functional and forced a high degree of interdepen-dence between people and departments. The tone for this collaboration and communication was set by the steering committee that wrote the proposal to the Gates Foundation. The foundation required that the superintendent, school board chair, and union president be on the committee. Given Hills-borough’s history of collaboration with the union, the president was a logical person to include. The inclusion of the school board chair ensured a clear line of communication with the board, which would prove invaluable when implementation was messy and concerns were raised to board members. The additional two members were Wynne Tye, Assistant Superintendent for Curriculum and Instruction and David Steele, Chief Information and Technology Officer. Tye and Steele represented the academic, professional development, technology, and informa-tion-management divisions, areas that were heav-ily implicated in the work and would have to work together to execute the design.
Once Hillsborough received the grant, Steele became the lead. He and the superintendent had worked together for years, dating back to his as-sistant principalship of a magnet school when Elia oversaw the magnet schools. The choice was easy, Elia explained. “We have complementary skills,” she said. “He can do things I can’t do and I can do things he can’t do…. We speak truth to one anoth-er… and David is good at illuminating problems and finding data to reinforce them.” For his part, Steele made clear that his view of communication helps explain his lead role. As he put it, “Communication involves listening as well as talking,” reflecting the district’s approach in this area.
Committees
A central element of the system’s communication and collaboration strategy grew out of a teacher fo-cus group the steering committee convened to help develop the Gates grant. This group evolved into the Teacher Advisory Committee (TAC) after Hillsbor-ough won the grant and has been a critical partner ever since. It decided on the use of the Danielson rubric, vetted the value-added strategy, and meets monthly to discuss the status of implementation, problem-solve, and create communication vehicles. (See Appendix B for a list of TAC members and to see where it fits in the overall committee and com-munication structure for EET.) A good example of the work of TAC is its agenda for the spring 2011 meet-ing. The group reviewed a video it had developed for teachers to explain the intricacies of how the 60 points for the observation component of the total teacher effectiveness score is calculated. This would be shared with all teachers in anticipation of the final observation scores at the end of the school year.
Building It Together: Hillsborough County Public Schools’ Teacher Evaluation System 17
Once Hillsborough received the EET grant, it decided to develop a Principals Advisory Group, recognizing that principals would be essential to the successful implementation of the new evaluation system. HCPS wanted to have a direct pipeline to them to share the work of the grant and get feed-back as well as to track how the work was going on the ground. Seventeen principals, spanning K-12, serve on the committee, which meets bi-monthly to discuss implementation challenges and opportuni-ties and think through upcoming work.
While the steering committee is responsible for oversight of the grant, the Gates Management Team, made up of the six EET directors (funded by the Gates Foundation and the Broad Foundation), is charged with designing and executing key compo-nents of the grant. This team meets weekly to dis-cuss progress, problems, and plans. The directors who serve on this team are the people who work most frequently with the principal and teacher advi-sory groups. The management team reports once a month to the steering committee and has bi-weekly access to the superintendent’s senior staff meeting to share its work and flag potential problems and areas where cross-functional collaboration is criti-cal. It is in this setting that principals’ stress level was discussed and strategies to provide them more support and extend deadlines were developed.
Collaboration
Beyond all of these committees focused on the EET work, the existing structure of monthly principal council meetings, organized by level, is the primary mechanism for communicating and working with principals. Part of the agenda of these monthly full days of training and development is devoted to the new evaluation system. This time is spent calibrat-ing scores, reviewing trends in teacher performance, and developing plans of support. EET directors attend these meetings to share updates, provide professional development, and gather feedback. It was in these meetings that principals brainstormed about the most meaningful ways the system could lessen their load.
In addition to the committees, Hillsborough has established a process to develop the evalua-tion system that ensures broad-based input. The selection of the teacher evaluation rubric provides an example of how the process works. When the district had to identify the rubric it would use to
guide teacher observations, it leveraged the TAC to guide the work. First, managers from Profes-sional Development and Human Resources worked with the committee as it reviewed different rubrics available and made a recommendation to the Gates steering committee. The steering committee vetted the proposal and brought it to the system’s senior leadership team. After discussion at the senior leadership team, refinements were made and the proposal went to the school board.
Once the rubric and format for observations was settled, the committee turned its attention to the value-added metric. The director of assessment and performance management brought differ-ent scenarios about how student growth could be measured and what different data sources could be used. The group worked to develop a proposal that then moved through the steering committee, senior leadership, and, finally, the board. In SY 2010-11, the committee followed the same process as it de-veloped the evaluation system for media specialists, guidance counselors, technical resource, pre-K, and adult education teachers, which it rolled out in SY 2011-12.
Beyond the formal committees and structures, the way the EET staff work reflects the commitment to collaboration and cross-functionality. While all of the EET staff report to Steele, several of them “sit in” on the staff meetings of other departments. The directors overseeing professional development and assessment sit on the curriculum and instruction team’s staff meetings, while the director of evalua-tion and compensation and the manager who works with her both sit on the human resources depart-ment’s staff meetings. Given how the EET work cuts across these departments, it is essential to have close working relationships that allow the central office to anticipate issues that multiple departments need to address collaboratively.
The commitment to collaboration and problem solving is part of the culture of HCPS and extends beyond committees and who sits on whose staff meetings. It has been critically important in the first year of implementing the evaluation system. When the content area directors started lining up outside the door of Stephanie Woodford, the Director of Evaluation and Compensation, to express con-cern about elementary teachers’ evaluations, she quickly realized she needed to partner with Tye to address this issue. That collaboration led to training all content-area directors so they understood the
18 The Aspen Institute Education & Society Program
evaluation system and could be additional evalu-ators in their content areas as well as training for peers in the different reading and writing programs in place in HCPS schools.
Communication
Given that teachers are profoundly impacted by the implementation of the new evaluation system, com-munication with them is paramount. Working under the belief that there is no such thing as too much communication, Hillsborough developed an array of vehicles to keep teachers well informed, hear from them, and respond to their concerns. Strategies include:
• EET Toolkit on the HCPS website, which pro-vides one-stop shopping for descriptions of each element of the initiative, key documents, tools, etc.
• Monthly newsletters to teachers and principals about EET’s current happenings and upcoming attractions
• Quarterly online magazine regarding EET
• Link from the districts’ home page to EET web-site with easy access to most recent webcasts, PowerPoint presentations, etc.
• Monthly board update reporting progress, re-sults, and next steps
• “Greatteachers,” a dedicated email to which teachers can send any questions. The direc-tors of peers and evaluation and assessment receive those questions directly and reply within 24 hours
• EET Speakers’ Bureau, which provides speak-ers for faculty meetings, community events, etc.
• Video response to frequently asked questions (FAQ) that feature teachers
• Online video overviews of each of the key components of the initiative, e.g., evaluation and compensation, induction, assessment, and performance management
• Webinars about elements of the teacher evalu-ation, e.g., observations and scoring, value-added
• Presentations at schools introducing key ele-ments of the initiative just before they are imple-mented
• Updates at all monthly principal and assistant principal meetings
• Podcasts and pop-ups (they pop up on school system computers when they are turned on) by the superintendent regarding timely issues tied to the new evaluation
• Provision of PowerPoints, FAQs with answers, scripts, tri-fold brochures, and a DVD to guide principals’ presentations to teachers about ele-ments of the initiative
• Identification of Teacher Ambassadors at every school who serve as the communication liaison on EET, sharing information with teachers and sharing their feedback back to the system
• Surveys to get teacher feedback, which in-cluded a mid-year survey on the peer evalua-tors and end-of-year surveys on both peers and mentors
With all of these efforts, Hillsborough has learned some important things about communicating ef-fectively. First, it became clear that communication needs to be developmental. Given everything the system is trying to do, the key is to identify what teachers and principals need to know when and focus on those things so as not to overwhelm them. In the spring of 2010, after the Gates Foundation funded Hillsborough, the superintendent made a series of presentations about the EET initiative and developed a webinar about its vision, key elements, and the timeline for implementation. Similar com-munications have been developed for each element of the initiative as it is rolled out.
In the spring of 2011, two things were on the horizon. In June, teachers would get their final observation ratings from their principal and peer/mentor. The district needed to explain how those scores are calculated and why the two scores might be different. This was done through a web-based video and an accompanying handout that walked teachers through the calculations. At the same time, the district knew it needed to start to educate people about the value-added component of the evaluation. All winter and spring, the director of assessment was on a speaking tour, visiting faculty
Building It Together: Hillsborough County Public Schools’ Teacher Evaluation System 19
of almost every school to talk about value-added. Given that this was the first conversation on the subject for most teachers, the goal was awareness and an understanding of the concept. In late August or early September 2011, a few weeks before the value-added scores become available, a web-based video was released to explain the specifics of how the value-added metric is calculated.
A second learning was that face-to-face meetings are still essential. While technology has made com-munication much easier, sometimes human contact is the best strategy. Anna Brown, the Director of Assessment and Performance Management, felt this very clearly as she spent months visiting hundreds of schools to talk about the concept of value-added. While incredibly labor intensive, these visits gave her the chance to hear from teachers about their
concerns, identify patterns and trends in teachers’ comments, and think about how the system could best respond to them. The visits gave teachers a name and a face to connect to the value-added work, making something unfamiliar and potentially frightening much more accessible. They now knew the person answering the value-added questions they were sending in through “Greatteachers.”
It is worth noting that almost all of the district’s senior leaders involved in EET and the directors who serve on the management team were successful teachers and principals before coming to their roles in the central office. The concerns of teachers and principals are never far from any conversation about the initiative and there is a strong orientation in the central office towards serving schools.
20 The Aspen Institute Education & Society Program
Perspectives From The Field
“Stressful” is the word educators and admin-istrators in Hillsborough commonly use to describe the first year of implementation.
The stress seemed to come in waves. Teachers were stressed at the beginning of the year because they didn’t know what the expectations of this new system were and what the peer role would be like. The Assistant Superintendent for Curriculum and In-struction remembered, “You could hear a collective exhale once everyone had been through the first observation.” As the year progressed and teach-ers received observation ratings from both their principal and their peer, the stress level rose again for teachers who saw a discrepancy in the scores and wondered what it meant and what the implica-tions for them were. At the end of the year, teachers waited in anticipation to see how their principals and peers would calculate their overall performance rating based on their observations throughout the year and wondered about the value-added data that would be shared in the fall.
Despite all this transition and uncertainty, teach-ers had good things to say about the new system. Speaking for many, one observed that principals “are taking their role as educational leaders more seri-ously.” And a first-year teacher’s comments made it clear that the system’s hope of raising expectations for teacher performance was being realized. She reflected, “I wouldn’t have done the planning and preparation without the mentor and the evaluation. I wasn’t taught it in school. This has made me better.”
Principals experienced a pretty consistent level of stress throughout the year. The new evaluation system dramatically increased their responsibility for assessing teachers’ performance and it was a real challenge for them to simply find time to com-plete the observations. Once expected to observe every teacher once every three years, principals now had to observe every teacher every year. Ad-ditionally, principals are now expected to formally observe teachers who are rated “Satisfactory” or below three times a year. One principal described
the implications of the new system on her practice, explaining, “I’m spending more time in individual classrooms but am not as visible in the school.” In addition to changing how principals spend their time, the new evaluation system also makes differ-ent demands on what they need to know to lead the work. Principals simultaneously talked about having good conversations with teachers about their prac-tice and feeling not well prepared to provide teach-ers specific suggestions and resources to support them to improve their practice.
While the first year of implementation was very demanding for principals, they felt positive about the effort at year’s end. An Area Director explained that, “as stressed out as they [principals] are, they like it.” One principal articulated a perspective heard repeat-edly across the system, explaining, “I have found out more about what’s going on in my classrooms than I ever knew.” Principals also reported that the new evaluation system made it easier for them to deal with low-performing teachers. One principal com-mented, “It’s easier to mark a teacher ‘Requires Ac-tion’ or ‘Developing’ because it’s not subjective. The rubric helps. It’s not personal.” The presence of peer evaluators also proved to be a support to principals when they were struggling with an underperforming teacher. As one principal explained, “A peer’s score sometimes encouraged principals to say what they really think about the instruction.”
When asked about the successes of first-year implementation of the new evaluation system, the superintendent laughed and said, “That I’m still here. We’re all still on the same page. We haven’t eroded trust at the end of a huge lift.” Her comment under-lined the high stakes of the year’s work. The enormity of the challenge and the progress made are reflected in the comments of an experienced teacher as he described the impact on him and his colleagues in his school: “It pushed a lot of people. They got their score and self-reflected and thought about it. And then they said, ‘Maybe that is where I’m at.’”
Building It Together: Hillsborough County Public Schools’ Teacher Evaluation System 21
Data And Results
The evaluation data for teachers at the end of Year One came available in two phases. In June, observation data collected all year
were aggregated and every teacher received an observation score from her principal and her peer. Each of these ratings had a maximum score of 30 points, which when combined reflected a maximum of 60 of the 100 points on which the evaluation is calculated. The value-added score (maximum of 40 points) became available in the fall once the FCAT results were reported, the end-of-course tests were administered and graded, and the system had the chance to calculate value-added. Thus while teachers finished the school year knowing their performance relative to 60 percent of their evalua-tion, they had to wait until the fall to learn of their performance overall.
Given the timing of the state assessment and when the results become available, this bifurcation of evaluation data and resulting uncertainty for teach-ers is a reality the system and its teachers will need to live with.
Data
In June of 2011, after a full school year of imple-mentation of the new evaluation system, HCPS had data about observations and observers, the quality of instruction, and the performance of teachers that it had not had access to previously.
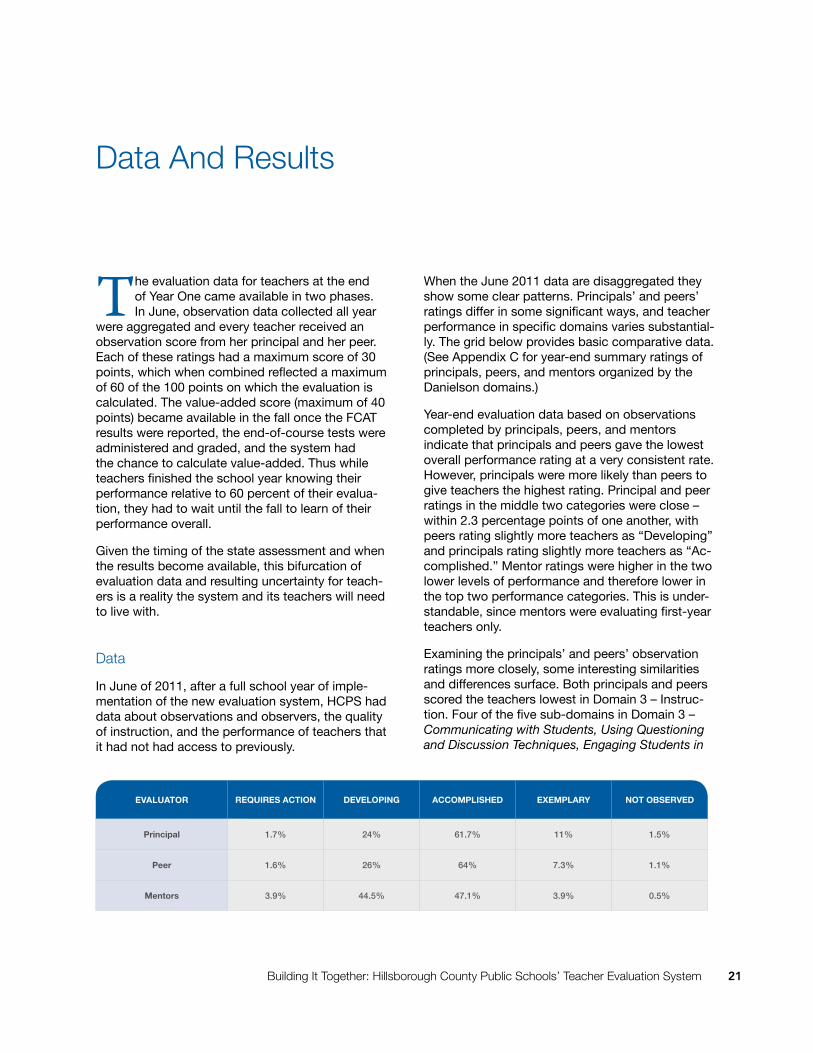
When the June 2011 data are disaggregated they show some clear patterns. Principals’ and peers’ ratings differ in some significant ways, and teacher performance in specific domains varies substantial-ly. The grid below provides basic comparative data. (See Appendix C for year-end summary ratings of principals, peers, and mentors organized by the Danielson domains.)
Year-end evaluation data based on observations completed by principals, peers, and mentors indicate that principals and peers gave the lowest overall performance rating at a very consistent rate. However, principals were more likely than peers to give teachers the highest rating. Principal and peer ratings in the middle two categories were close – within 2.3 percentage points of one another, with peers rating slightly more teachers as “Developing” and principals rating slightly more teachers as “Ac-complished.” Mentor ratings were higher in the two lower levels of performance and therefore lower in the top two performance categories. This is under-standable, since mentors were evaluating first-year teachers only.
Examining the principals’ and peers’ observation ratings more closely, some interesting similarities and differences surface. Both principals and peers scored the teachers lowest in Domain 3 – Instruc-tion. Four of the five sub-domains in Domain 3 – Communicating with Students, Using Questioning and Discussion Techniques, Engaging Students in
evaluator requires action Developing accomplisheD exemplary not oBserveD
principal 1.7% 24% 61.7% 11% 1.5%
peer 1.6% 26% 64% 7.3% 1.1%
mentors 3.9% 44.5% 47.1% 3.9% 0.5%
22 The Aspen Institute Education & Society Program
Learning, and Using Assessment in Instruction – got the lowest ratings, with a third to half of teachers rated “Developing” in these categories. The con-sistently lower ratings in Domain 3 reflected what principals and central office administrators ex-pected. They specifically identified student engage-ment, rigor, and the level of questioning as areas that needed attention. Peers rated more teachers as “Developing” in all four sub-domains of Domain 3, with the difference between peers and principals ranging from 4.7 to 10.7 percentage points.
The two other areas where teachers consistently scored low are sub-domains in Domain 1: Design-ing Coherent Instruction and Designing Student Assessments. In these two areas, peers rated more teachers as “Developing” than principals did. In comparing principals’ and peers’ ratings across all 16 sub-domains that both groups assessed, there was a variation of 5 percentage points or more in the ratings in 10 of the categories, suggesting a continued need for vigilance in calibrating principal and peer scoring.
Results
At the aggregate level, the data provide an overall distribution of teacher performance. In the 2009-10 school year, teachers were observed and evaluated using a 144-point scale and there were five perfor-mance levels. One-third of teachers got a perfect evaluation score of 144. These results cannot be compared with later results because the scoring system changed.
In September of 2011, teachers received the data regarding the remaining 40 percent of their perfor-mance rating: the value-added results. These data were provided in two formats with two purposes in mind. Teachers first received a “five-star” report (see Appendix D) that listed every student in the teacher’s class and illustrated the teacher’s value-added to each student’s learning using a one- to five-star rating. This allowed teachers to quickly discern which students they were having the most positive impact on, and which they were affecting the least. The second report indicated their value-added rating on the 40-point scale. Armed with this data and the observation scores from the spring, teachers were able to calculate their total perfor-mance score, based on a maximum possible score of 100 points.
At the end of the first year of implementation, teach-ers received a variety of data to help them begin to construct their own understanding of their perfor-mance relative to their peers. In June, they received their cumulative observation ratings reported by principal and peer (see Appendix E for an example) as well as a report that showed the distribution of observation scores across all teachers in the system.
In September, teachers received their value-added score and their total evaluation score, along with re-ports of the teacher distribution of both value-added scores and total evaluation scores. The distribution reports allowed teachers to gain a sense of where they performed relative to their peers. Each of the three distribution reports (observation, value-added, total evaluation score) included some analysis of the data, which provided hints about where the district might set performance level cut scores in fall 2012, when two years of data are available. (See Appendix F for these reports.)
HCPS’s two-year rollout of the new evaluation scores and performance ratings both provides two year’s worth of data to inform where cut scores are set and the opportunity for teachers to get used to the new system and identify for themselves (as opposed to being told by the system) how they are performing. This approach makes it likely that many teachers will predict their performance level fairly accurately before the system reports it to them, which will likely leave them feeling more in control and empowered than being told a rating, the origins of which they don’t fully understand.
While actual overall evaluation rating categories will not be set until fall 2012, the consequences have been determined based on the first-year data. Teachers whose total evaluation score places them in the top performance quartile (relative to their peers teaching the same student demographic, subjects…) received a $2,500 bonus in school year 2011-12 for performance in the prior year.
At the same time, cut scores were set for “Unsat-isfactory” and “Needs Improvement” performance levels. One hundred teachers whose overall evalu-ation score was 36.0 or less based on a 100-point scale were rated “Unsatisfactory.” This number represents five times as many teachers who were rated “Unsatisfactory” in school year 2009-10 (19). Teachers rated “Unsatisfactory” are given support in priority instructional areas and do not receive a

Building It Together: Hillsborough County Public Schools’ Teacher Evaluation System 23
salary step increase. Any teacher who receives an ”Unsatisfactory” rating two years in a row is eligible for dismissal. Teachers whose overall evaluation scores were in the 36.01 – 41.0 range received a rating of “Needs Improvement.” One hundred and forty four teachers fell into this category in 2010-11. These teachers also get individualized support and forego their salary step increase, but are given more than a year to improve. The teachers who fall into these two lowest performance levels represent 1.6 percent of the HCPS teaching workforce.
While HCPS is at the beginning of analyzing 2010-11 evaluation data to learn all it can tell the system about teacher performance and the impact of spe-cific system efforts, early analysis suggests some level of correlation between observation and value-added scores. This is encouraging, but the district needs to explore it in greater depth and detail.
24 The Aspen Institute Education & Society Program
Refinements And Priorities For Year Two
HCPS’s learning from Year One implemen-tation drove the refinements made to the system in the 2011-12 school year and
informed the system’s priorities.
Refinements
The time required for observations and the pre- and post-conferences associated with them was more intensive than anyone expected and placed tre-mendous demands on principals’ and peers’ time. The system has prioritized supporting this work better and making it more manageable. On the principal front, this means several things. The first involves principals’ ability to delegate responsibil-ity for observations. Under the system, principals are required to complete one formal observation for every teacher in their building. The informal observations, though, can be delegated to other administrators in the building. In the first year of evaluation implementation, the information manage-ment system didn’t discern if another administrator completed and submitted the evaluation. So HCPS had little sense of the extent to which principals delegated this work. That glitch in the information management system has been fixed, so this data can be tracked and principals are being encouraged to delegate observation responsibilities. To support this, assistant principals are receiving additional training on the teaching framework and conducting observations. Additionally, HCPS is providing train-ing and support to principals on time management to help them integrate the evaluation expectations with their other responsibilities and make strategic decisions on how they spend their time.
For peers, the district adjusted their load to make their observation work more manageable and sup-
portive for teachers. In the first year, peers observed as many as 175 teachers, making it difficult for them to interact with the teachers they observed. For school year 2011-12, the number of teachers’ peers responsible for observing was reduced to 110. To accommodate that shift, the district increased the number of peers from 75 to 109.
At the same time that the system was refining the peers’ load, it expanded the mentoring model that served novice teachers. In school year 2010-11, mentors served all first-year teachers, providing them support in their classroom once a week. Every mentor had a group of fifteen new teachers with whom she worked. The positive impact of mentor-ing was reflected at the end of the school year when first year retention was reported at 86 percent, which represents a jump of 14 percentage points from the 72 percent retention rate in SY 2009-10. In school year 2011-12 the mentoring program was fully implemented as second-year teachers received mentoring once every other week.
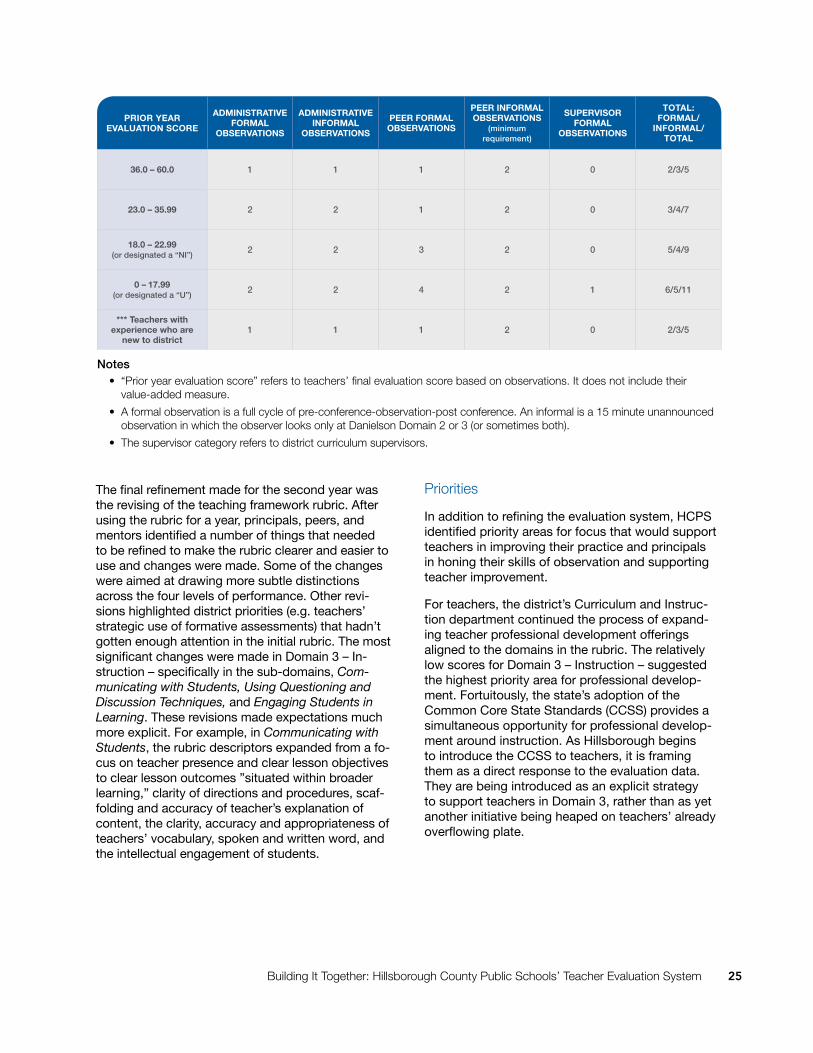
Based on feedback and learning in Year One, HCPS also revised the observation schedule to make a couple of important distinctions. The first distinc-tion was between formal and informal observations. The system introduced informal observations in SY 2011-12 as a mechanism for more frequent and focused observations and feedback to teachers and to lessen the burden from the first year of a pre- and post-observations conference after every observa-tion. To allow for a deeper review and analysis, the district agreed to focus informal observations solely on Domains 2 and/or 3 from the teaching frame-work. In addition, the district agreed to eliminate the pre- and post-observation conferences for informal observations. In lieu of conferring, observers are required to provide teachers written feedback on each of the components of Domain 2 and/or 3.
Building It Together: Hillsborough County Public Schools’ Teacher Evaluation System 25
The final refinement made for the second year was the revising of the teaching framework rubric. After using the rubric for a year, principals, peers, and mentors identified a number of things that needed to be refined to make the rubric clearer and easier to use and changes were made. Some of the changes were aimed at drawing more subtle distinctions across the four levels of performance. Other revi-sions highlighted district priorities (e.g. teachers’ strategic use of formative assessments) that hadn’t gotten enough attention in the initial rubric. The most significant changes were made in Domain 3 – In-struction – specifically in the sub-domains, Com-municating with Students, Using Questioning and Discussion Techniques, and Engaging Students in Learning. These revisions made expectations much more explicit. For example, in Communicating with Students, the rubric descriptors expanded from a fo-cus on teacher presence and clear lesson objectives to clear lesson outcomes ”situated within broader learning,” clarity of directions and procedures, scaf-folding and accuracy of teacher’s explanation of content, the clarity, accuracy and appropriateness of teachers’ vocabulary, spoken and written word, and the intellectual engagement of students.
Priorities
In addition to refining the evaluation system, HCPS identified priority areas for focus that would support teachers in improving their practice and principals in honing their skills of observation and supporting teacher improvement.
For teachers, the district’s Curriculum and Instruc-tion department continued the process of expand-ing teacher professional development offerings aligned to the domains in the rubric. The relatively low scores for Domain 3 – Instruction – suggested the highest priority area for professional develop-ment. Fortuitously, the state’s adoption of the Common Core State Standards (CCSS) provides a simultaneous opportunity for professional develop-ment around instruction. As Hillsborough begins to introduce the CCSS to teachers, it is framing them as a direct response to the evaluation data. They are being introduced as an explicit strategy to support teachers in Domain 3, rather than as yet another initiative being heaped on teachers’ already overflowing plate.
Notes• “Prioryearevaluationscore”referstoteachers’finalevaluationscorebasedonobservations.Itdoesnotincludetheir
value-added measure.
• Aformalobservationisafullcycleofpre-conference-observation-postconference.Aninformalisa15minuteunannouncedobservation in which the observer looks only at Danielson Domain 2 or 3 (or sometimes both).
• Thesupervisorcategoryreferstodistrictcurriculumsupervisors.
prior year evaluation score
aDministrative Formal
oBservations
aDministrative inFormal
oBservations
peer Formal oBservations
peer inFormal oBservations
(minimum requirement)
supervisor Formal
oBservations
total: Formal/
inFormal/ total
36.0 – 60.0 1 1 1 2 0 2/3/5
23.0 – 35.99 2 2 1 2 0 3/4/7
18.0 – 22.99 (or designated a “NI”)
2 2 3 2 0 5/4/9
0 – 17.99 (or designated a “U”)
2 2 4 2 1 6/5/11
*** teachers with experience who are
new to district1 1 1 2 0 2/3/5
26 The Aspen Institute Education & Society Program
CCSS’s expectations will go a long way towards educating teachers about what students need to understand and be able to do. They will reinforce the need for more challenging curriculum, more rigorous instruction, and questioning that chal-lenges students’ thinking and requires them to articulate and apply their understanding. All of these issues surfaced through first-year observation data; CCSS’s external validation of them as important is critical. As Hillsborough develops resources to support teachers to teach to the CCSS, the system will introduce them in a way that is both a response to teachers’ observation ratings and a mechanism to prepare the district to meet the expectations of CCSS. Integrating these two enormous initiatives makes them mutually reinforcing, and increases the likelihood that teachers will see CCSS as a positive development.
As one of the school systems participating in the Gates Foundation’s Measuring Effective Teaching (MET) study, Hillsborough is trying to determine the best way to integrate the learning and resources developed through that work with its new evalu-ation system. Given that the study has included the videotaping of hundreds of teachers in the system, Hillsborough is hoping to make more use of videos and figure out how to integrate them into the professional development it is working to strengthen. Teachers’ experience of videotaping as powerful professional development in its own right has the system interested in adding it to the induc-tion support it offers to new teachers. The MET study’s early report of the high degree of correlation between student survey responses about teachers and teachers’ value-added scores has Hillsborough thinking about how it might use student surveying as a formative measure for teachers. The system’s early thinking is that surveys will provide teachers more feedback about their practice, which they could use to guide improvement. It is not clear, at this time, if these surveys might eventually be used for evaluation.
In addition to providing professional development support to teachers, HCPS has reconceptualized the Area Director role3 (and staff) to better support prin-cipals by having them focus less on operations and more on instruction and coaching principals. Their staff will still be available to address operational
issues but the area directors, themselves, will focus more tightly on leadership and instruction. To begin this shift, the district trained the current ADs in the observation rubric and in observing and analyzing instruction in the summer of 2011. In addition, the district hired four people to work across the seven areas to respond to parent inquiries, to free ADs up to be in schools supporting principals. And seven coaches have been hired from the ranks of HCPS principals to work with principals (particularly new principals) to help them manage their workload.
On the technology front, Hillsborough is working to integrate its systems. The first priority is to expand Lawson Talent Management System, where evalua-tion data is stored, to include a professional devel-opment tracking system so teachers’ observation scores on specific domains will generate personal-ized professional development recommendations. A longer-term goal is to develop a one-stop portal for instructional resources for teachers: model lesson plans, videos of effective instruction, etc.
3 As part of the reconceptualization of the role, the job title has been changed from Area Director to Area Leadership Director.
Building It Together: Hillsborough County Public Schools’ Teacher Evaluation System 27
Conclusion
Hillsborough’s experience in the implemen-tation of a new teacher evaluation system suggests recommendations that are rel-
evant to all school systems undertaking the work of designing and implementing new teacher evaluation systems. These themes are worth highlighting:
1. reimagine the role of school leaders in the teacher effectiveness work and align their support and their supervisors’ work accordingly
Implementing a new teacher evaluation system requires strong school leadership and effective supervision and evaluation of principals to ensure its long-term sustain-ability. In Hillsborough, implementation of the new evaluation made it clear that princi-pals needed more time and support to be in classrooms observing instruction and Area Directors needed to have the skills to talk with principals about their evaluation work, the quality of instruction in the school, and the strategies for improvement.
Looking beyond the first year of this initia-tive, bigger questions about the role of the principal loom. The thorny question of how principals will be afforded the time to do this work provides an opportunity to consider what Eileen Horng and Susanna Loeb refer to as “organizational management for instruc-tional improvement.”4 This post-instructional-leadership conception of the role of the principal recognizes the need for principals to have their pulse squarely on the quality of in-struction in classrooms across their schools. But it suggests that the principal’s most important job is to orchestrate the organiza-
tional conditions – supervision, professional development, teacher collaboration, schedul-ing, teaching loads, and student assignment – that support instructional improvement and serve all students well.
Hillsborough’s decision to have principals be one of two evaluators, to have them gener-ally do fewer observations than the peer evaluators, and to give them the authority to delegate their informal observations to other administrators provides the wedge into this conversation. What is critical is how the evolution of the principalship is framed from this point forward. Principals in Hills-borough talked about needing to develop more skills and resources to support teach-ers in the areas their observations surfaced as weaknesses. They also talked about their nascent work in trying to provide structure for professional development and collabora-tion to support teachers in instructional areas of common concern. Developing principals’ skills in these areas is paramount and it has tremendous implications for the work of prin-cipal supervisors.
Hillsborough learned early on that the princi-pal supervisor role could no longer be primar-ily operationally focused. Principal supervi-sors need to be able to assess the quality of instruction, support principals in developing the organizational conditions required to support instructional improvement, and hold principals accountable for implementing them. They need to be experts in everything from school scheduling to adult development to building a culture of strong support and accountability.
3 Eileen Horng and Susanna Loeb, “New Thinking about Instructional Leadership,” Kappan 92(3), November 2010, 66-69.
28 The Aspen Institute Education & Society Program
2. Deepen capacity
Hillsborough invested heavily in the training and development of evaluators, knowing that consistency in their practices and rating is essential to the credibility of the evaluation system. The training provided was deep and ongoing. By the end of the first year of imple-menting the new evaluation system, though, Hillsborough realized that there were people beyond evaluators who needed similarly deep training and the overall success of the evalu-ation work depended on this.
One obvious group was the Area Directors who support, supervise, and evaluate prin-cipals. Their historic focus on school opera-tions needs to be balanced by a deep focus on instructional quality and levers principals can pull to drive instructional improvement at the level of individual teachers and a school faculty. This shift requires ADs to have a deep understanding of the framework, ratings of teaching practice that are calibrated with those of evaluators, and the ability to talk with principals about strategic leadership moves they can make to accelerate instruc-tional improvement.
The people charged with ensuring a robust curriculum and instruction infrastructure also need to understand the teaching framework so that they can ensure strong connections between the curriculum and pedagogical initiatives they develop and champion and the framework. In addition to making sure curricular decisions support the instruction emphasized in the framework, these staff members need to be able to communicate these connections clearly. The central office staff’s ability to tie curricular initiatives to the framework and use the language of the frame-work to describe them helps ensure teachers experience alignment between what they are being asked to do in their classroom, the support provided to them, and what they are being held accountable for in the evaluation.
3. interpret the points of discontent and dis-comfort with the new evaluation system at the end of the first year of implementation
as signals as to where the next layers of development lie
At the end of the first year of implementa-tion of the new teacher evaluation system in Hillsborough, four issues surfaced that were simultaneously signs of success and indica-tors of the next phase of the work. First, there was a deep, data-based understanding of the quality of instruction in the system. Second, principals and peers felt uncomfortable about their ability to provide meaningful guidance to teachers to support instructional improve-ment. Third, teachers wanted more coaching time with peer evaluators. And fourth, princi-pals and peers wanted to collaborate more.
All of these issues point to one critical is-sue: the need to build capacity within the system relative to high-quality instruction and helping teachers improve their practice. Teachers need to share common images of what rigorous, high-quality instruction looks like, sounds like, and feels like – and how to deliver it. Principals, peers and mentors need to learn those same things as well as how to talk about effective instruction and how to give teachers concrete support in developing these instructional practices. Everyone needs commonly-held images of planning, instruc-tion, and assessment that demonstrate how those three elements can be woven together to create a rigorous learning experience for students. Providing a vision of what instruc-tion can look like at its most engaging and rigorous and building educators’ capacity to provide and support it is both a daunting task and a stunning opportunity.
The fact that teachers are asking for support from peers and principals and peers want to collaborate is a sign of people’s openness and also the reality that everyone is going to have to work together to create new knowl-edge that will raise the quality of instruction. Leveraging this desire to collaborate will increase the system’s ability to do this next, challenging stage of work. It will also likely continue the evolution of how professional development is defined and delivered in terms of the role of individuals, schools, and
Building It Together: Hillsborough County Public Schools’ Teacher Evaluation System 29
the district. Embedded in teachers’ request for more support from peers and principals’ desire to partner with their peers is the oppor-tunity to chip away at the historic firewall that has been created between teacher support and accountability and create a true teacher performance-management system in which teachers receive ongoing feedback on their practice and support to improve continually.
4. communicate as a means of collaborating
Hillsborough’s continuous, multi-pronged, multi-dimensional communication strategy fostered a strong sense of collaboration throughout the school system and with the teachers’ union. The carefully staged com-munication about elements of the system and their rollout reduced apprehension about the changes. The frequent requests for feedback invited input and the system’s responsive-ness helped teachers and principals see their concerns addressed in system revisions. This made educators feel more connected to and invested in the evaluation system. Identify-ing ambassadors in every school to serve as communication liaisons for the work further created a broad sense of ownership and gave teachers a colleague who could serve as a resource about the new evaluation.
The system rollout of the observation ratings and value-added rating at the end of the first-year of implementation is a particularly effec-tive example of how to communicate in a way that invites people into the process as collab-orators. Teachers did not receive evaluation ratings. Instead they received their individual scores and a distribution of the scores of all teachers in the system with some indications of where cutoff points might be set a year
later when teachers would receive a rating. This approach allowed teachers to discern for themselves how they are performing relative to their peers before being told in the form of an evaluative rating. This approach invites them into the process of their evaluation in a way that gives them the chance to reflect on their year one performance, set goals for their performance in year two and feel a sense of ownership for the rating they will receive in the fall of 2012. It also makes it possible for teachers to predict their rating, which will make the rating, when it finally comes, feel fa-miliar and predictable, rather than something thrust upon them, created in a black box.
5. anticipate the unanticipated and commit to improvement
Two of Hillsborough’s greatest strengths in this work are its organizational stance towards learning and its deep belief in its capacity to figure things out. The system has structures and systems in place to use the learning stance to address problems. These structures support communication and learn-ing and allow the system to quickly identify and address implementation issues – such as the principals being overwhelmed – that had the potential to derail the entire effort. The role of the TAC and the process used to engage them in the work of determining how observations would be assessed and value-added would be calculated leveraged varied expertise and built strong buy-in and support.
Hillsborough’s efforts in implementing a new teacher evaluation system demonstrate both the complexity and possibility of the work and the impact of an unrelenting focus on organizational learning and improvement.
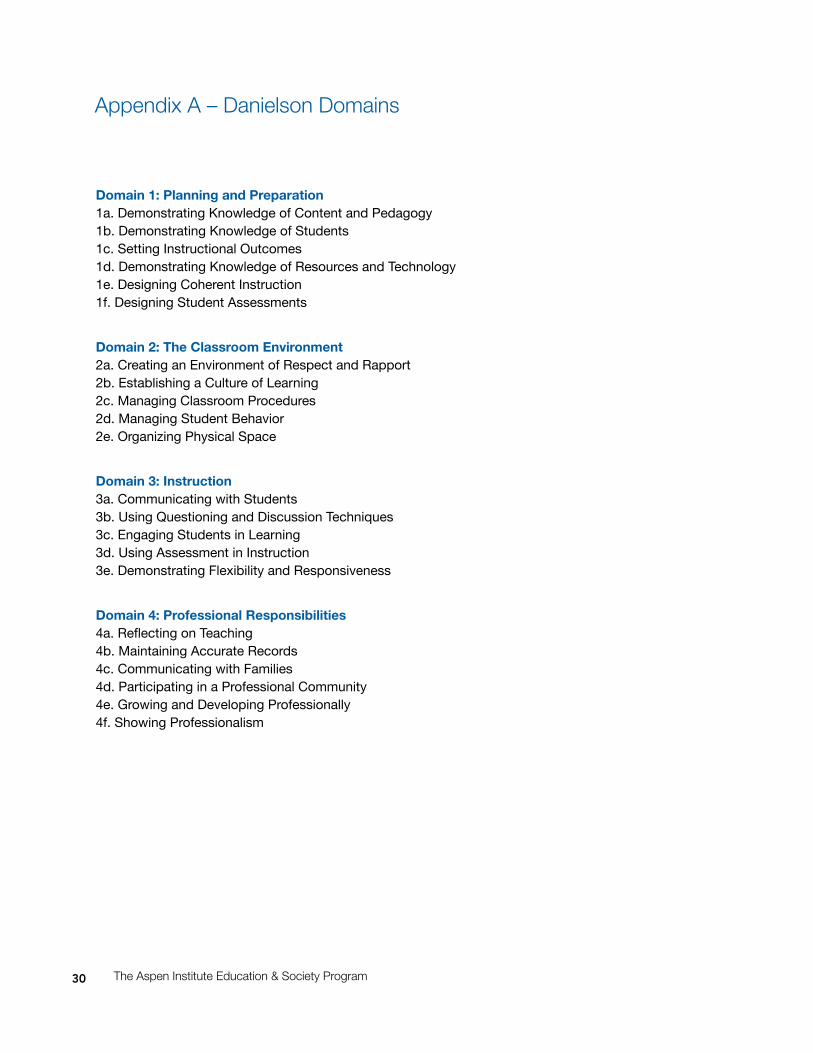
30 The Aspen Institute Education & Society Program
Domain 1: planning and preparation1a. Demonstrating Knowledge of Content and Pedagogy1b. Demonstrating Knowledge of Students1c. Setting Instructional Outcomes1d. Demonstrating Knowledge of Resources and Technology1e. Designing Coherent Instruction1f. Designing Student Assessments
Domain 2: the classroom environment2a. Creating an Environment of Respect and Rapport2b. Establishing a Culture of Learning2c. Managing Classroom Procedures2d. Managing Student Behavior2e. Organizing Physical Space
Domain 3: instruction3a. Communicating with Students3b. Using Questioning and Discussion Techniques3c. Engaging Students in Learning3d. Using Assessment in Instruction 3e. Demonstrating Flexibility and Responsiveness
Domain 4: professional responsibilities4a. Reflecting on Teaching4b. Maintaining Accurate Records4c. Communicating with Families4d. Participating in a Professional Community4e. Growing and Developing Professionally4f. Showing Professionalism
Appendix A – Danielson Domains
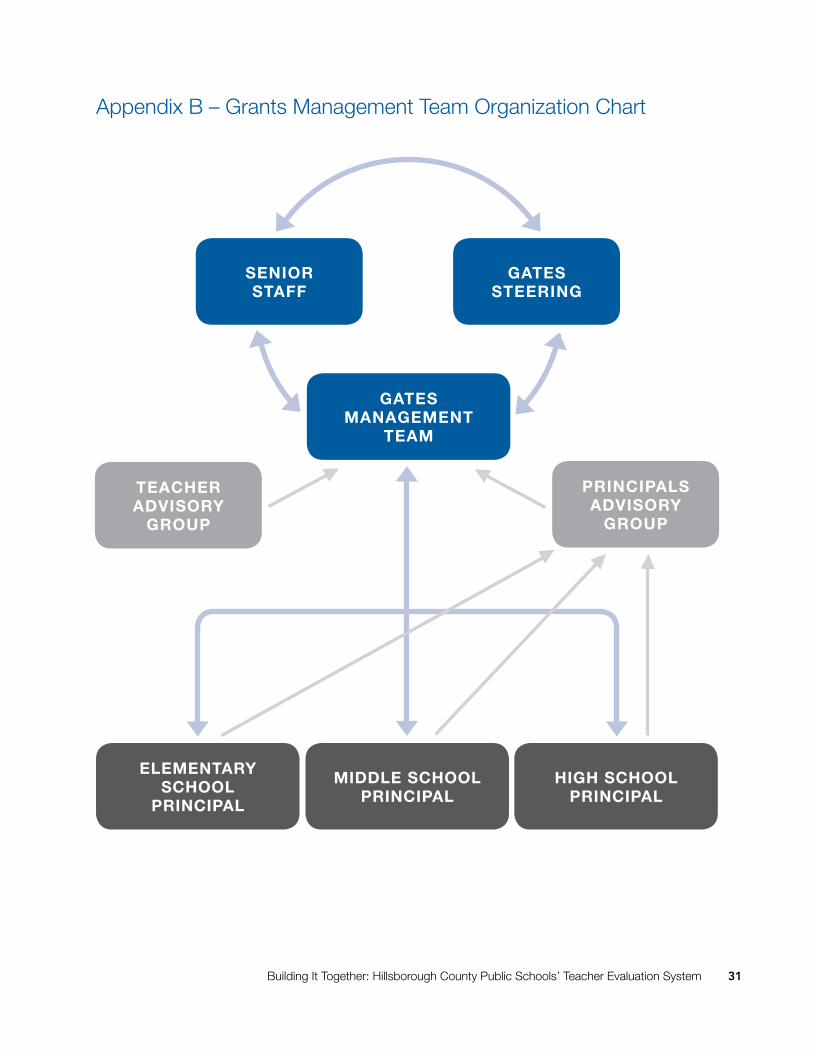
Building It Together: Hillsborough County Public Schools’ Teacher Evaluation System 31
Appendix B – Grants Management Team Organization Chart
miDDle school principal
elementary school
principal
high school principal
senior staFF
teacher aDvisory
group
principals aDvisory
group
gates management
team
gates steering
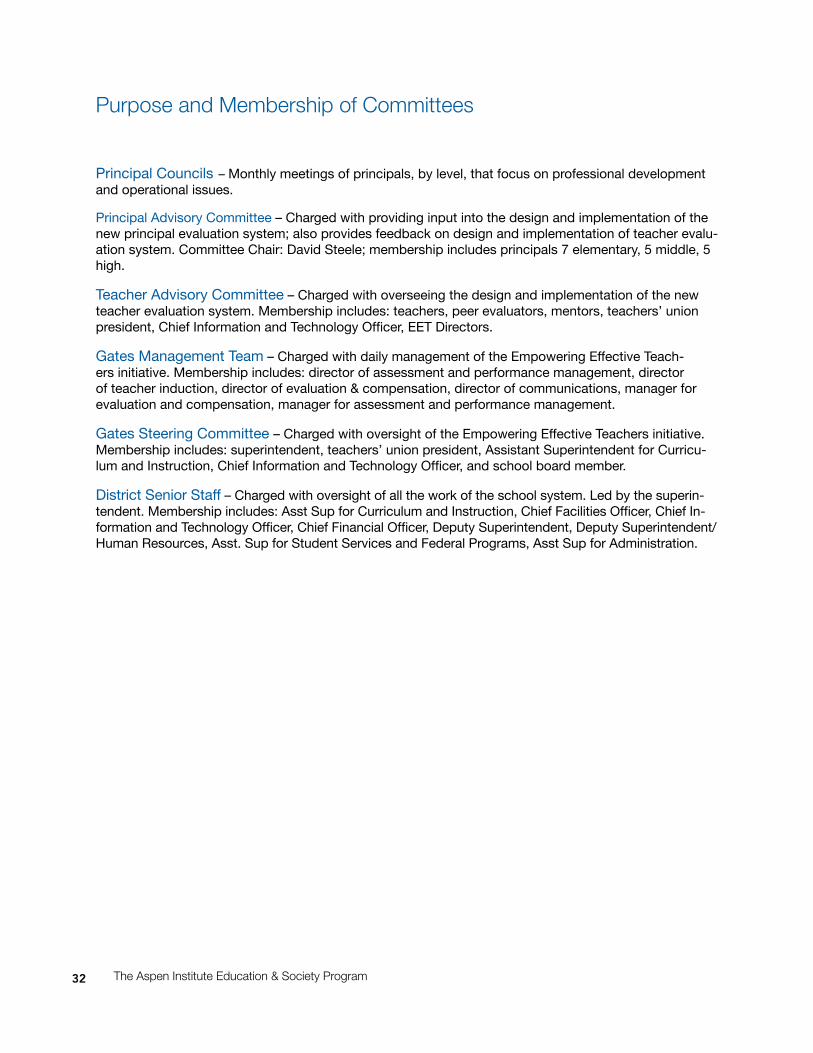
32 The Aspen Institute Education & Society Program
Purpose and Membership of Committees
Principal Councils – Monthly meetings of principals, by level, that focus on professional development and operational issues.
Principal Advisory Committee – Charged with providing input into the design and implementation of the new principal evaluation system; also provides feedback on design and implementation of teacher evalu-ation system. Committee Chair: David Steele; membership includes principals 7 elementary, 5 middle, 5 high.
Teacher Advisory Committee – Charged with overseeing the design and implementation of the new teacher evaluation system. Membership includes: teachers, peer evaluators, mentors, teachers’ union president, Chief Information and Technology Officer, EET Directors.
Gates Management Team – Charged with daily management of the Empowering Effective Teach-ers initiative. Membership includes: director of assessment and performance management, director of teacher induction, director of evaluation & compensation, director of communications, manager for evaluation and compensation, manager for assessment and performance management.
Gates Steering Committee – Charged with oversight of the Empowering Effective Teachers initiative. Membership includes: superintendent, teachers’ union president, Assistant Superintendent for Curricu-lum and Instruction, Chief Information and Technology Officer, and school board member.
District Senior Staff – Charged with oversight of all the work of the school system. Led by the superin-tendent. Membership includes: Asst Sup for Curriculum and Instruction, Chief Facilities Officer, Chief In-formation and Technology Officer, Chief Financial Officer, Deputy Superintendent, Deputy Superintendent/Human Resources, Asst. Sup for Student Services and Federal Programs, Asst Sup for Administration.
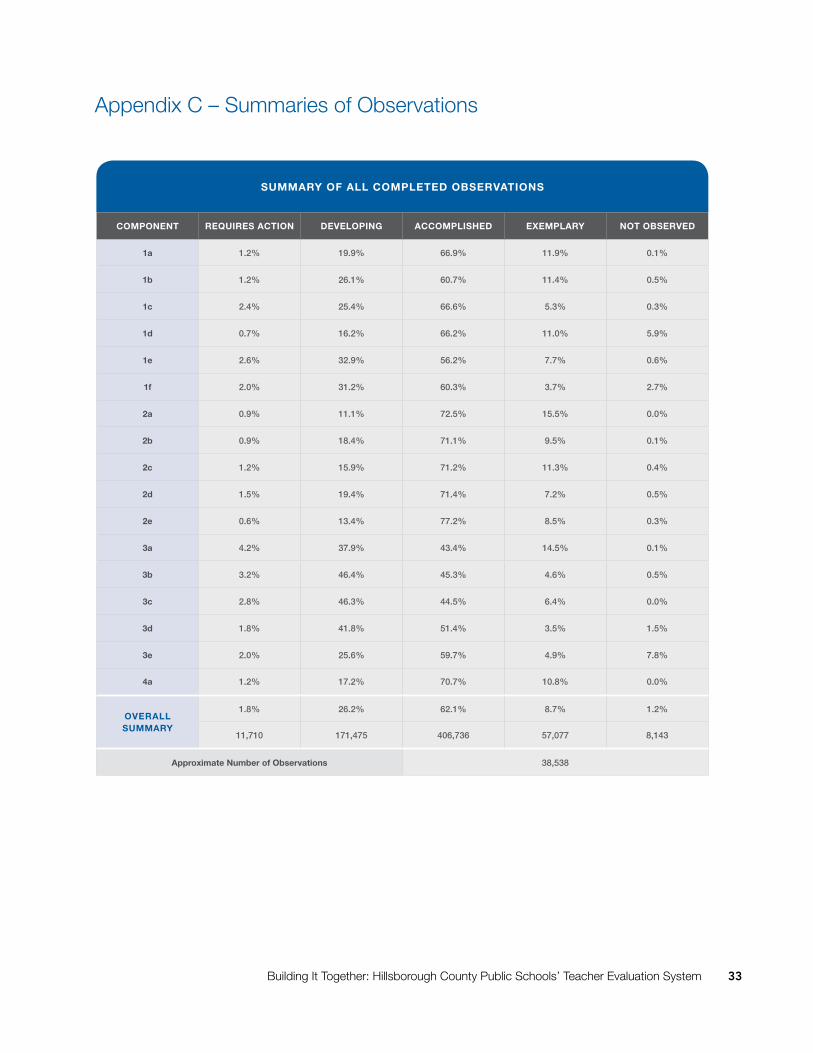
Building It Together: Hillsborough County Public Schools’ Teacher Evaluation System 33
Appendix C – Summaries of Observations
summary oF all completeD oBservations
component requires action Developing accomplisheD exemplary not oBserveD
1a 1.2% 19.9% 66.9% 11.9% 0.1%
1b 1.2% 26.1% 60.7% 11.4% 0.5%
1c 2.4% 25.4% 66.6% 5.3% 0.3%
1d 0.7% 16.2% 66.2% 11.0% 5.9%
1e 2.6% 32.9% 56.2% 7.7% 0.6%
1f 2.0% 31.2% 60.3% 3.7% 2.7%
2a 0.9% 11.1% 72.5% 15.5% 0.0%
2b 0.9% 18.4% 71.1% 9.5% 0.1%
2c 1.2% 15.9% 71.2% 11.3% 0.4%
2d 1.5% 19.4% 71.4% 7.2% 0.5%
2e 0.6% 13.4% 77.2% 8.5% 0.3%
3a 4.2% 37.9% 43.4% 14.5% 0.1%
3b 3.2% 46.4% 45.3% 4.6% 0.5%
3c 2.8% 46.3% 44.5% 6.4% 0.0%
3d 1.8% 41.8% 51.4% 3.5% 1.5%
3e 2.0% 25.6% 59.7% 4.9% 7.8%
4a 1.2% 17.2% 70.7% 10.8% 0.0%
overall summary
1.8% 26.2% 62.1% 8.7% 1.2%
11,710 171,475 406,736 57,077 8,143
approximate number of observations 38,538
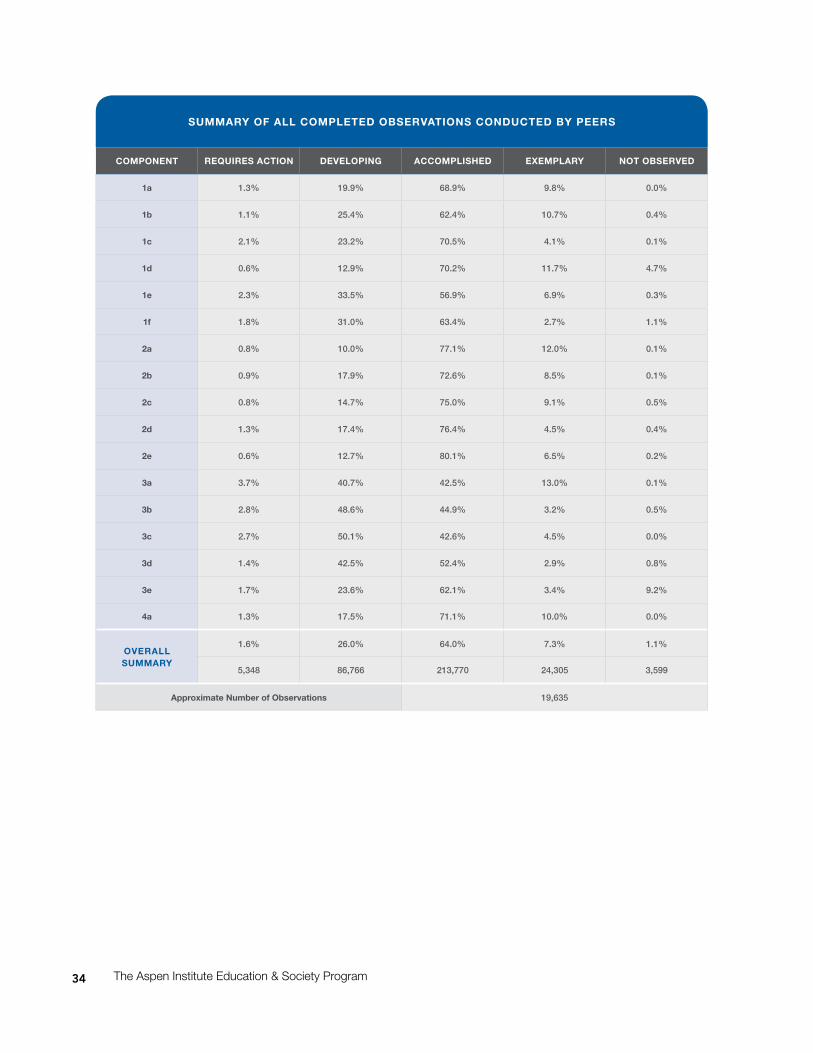
34 The Aspen Institute Education & Society Program
summary oF all completeD oBservations conDucteD By peers
component requires action Developing accomplisheD exemplary not oBserveD
1a 1.3% 19.9% 68.9% 9.8% 0.0%
1b 1.1% 25.4% 62.4% 10.7% 0.4%
1c 2.1% 23.2% 70.5% 4.1% 0.1%
1d 0.6% 12.9% 70.2% 11.7% 4.7%
1e 2.3% 33.5% 56.9% 6.9% 0.3%
1f 1.8% 31.0% 63.4% 2.7% 1.1%
2a 0.8% 10.0% 77.1% 12.0% 0.1%
2b 0.9% 17.9% 72.6% 8.5% 0.1%
2c 0.8% 14.7% 75.0% 9.1% 0.5%
2d 1.3% 17.4% 76.4% 4.5% 0.4%
2e 0.6% 12.7% 80.1% 6.5% 0.2%
3a 3.7% 40.7% 42.5% 13.0% 0.1%
3b 2.8% 48.6% 44.9% 3.2% 0.5%
3c 2.7% 50.1% 42.6% 4.5% 0.0%
3d 1.4% 42.5% 52.4% 2.9% 0.8%
3e 1.7% 23.6% 62.1% 3.4% 9.2%
4a 1.3% 17.5% 71.1% 10.0% 0.0%
overall summary
1.6% 26.0% 64.0% 7.3% 1.1%
5,348 86,766 213,770 24,305 3,599
approximate number of observations 19,635
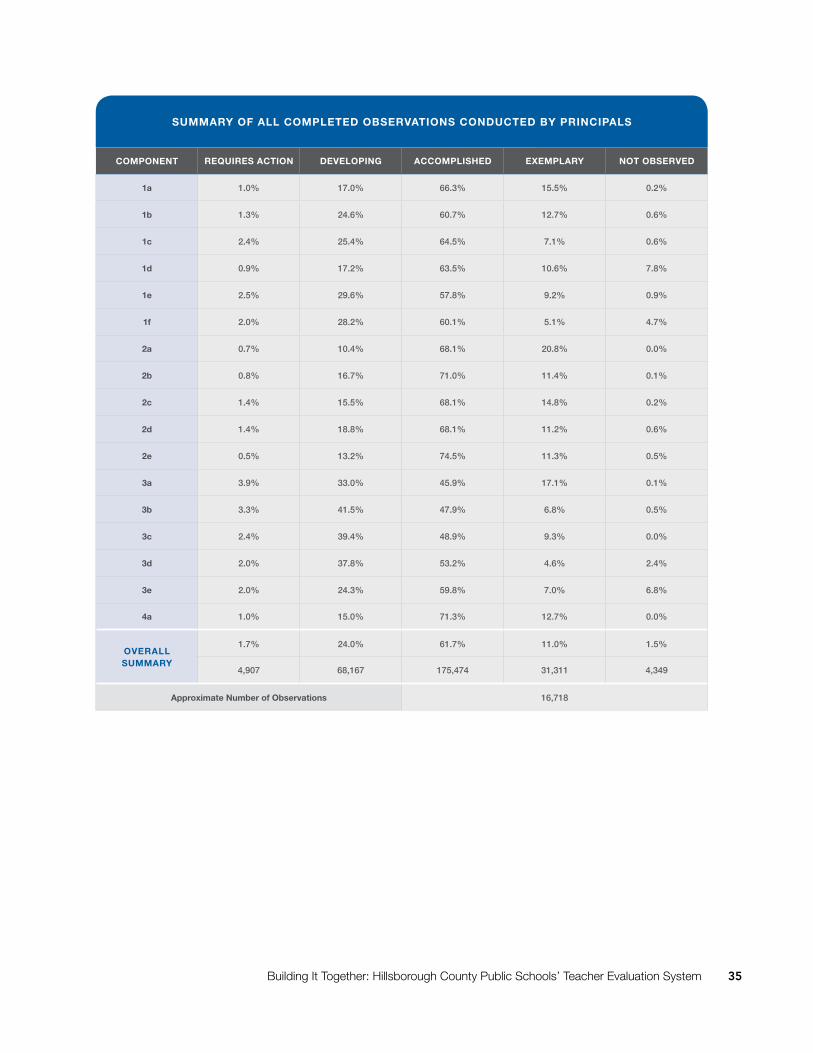
Building It Together: Hillsborough County Public Schools’ Teacher Evaluation System 35
summary oF all completeD oBservations conDucteD By principals
component requires action Developing accomplisheD exemplary not oBserveD
1a 1.0% 17.0% 66.3% 15.5% 0.2%
1b 1.3% 24.6% 60.7% 12.7% 0.6%
1c 2.4% 25.4% 64.5% 7.1% 0.6%
1d 0.9% 17.2% 63.5% 10.6% 7.8%
1e 2.5% 29.6% 57.8% 9.2% 0.9%
1f 2.0% 28.2% 60.1% 5.1% 4.7%
2a 0.7% 10.4% 68.1% 20.8% 0.0%
2b 0.8% 16.7% 71.0% 11.4% 0.1%
2c 1.4% 15.5% 68.1% 14.8% 0.2%
2d 1.4% 18.8% 68.1% 11.2% 0.6%
2e 0.5% 13.2% 74.5% 11.3% 0.5%
3a 3.9% 33.0% 45.9% 17.1% 0.1%
3b 3.3% 41.5% 47.9% 6.8% 0.5%
3c 2.4% 39.4% 48.9% 9.3% 0.0%
3d 2.0% 37.8% 53.2% 4.6% 2.4%
3e 2.0% 24.3% 59.8% 7.0% 6.8%
4a 1.0% 15.0% 71.3% 12.7% 0.0%
overall summary
1.7% 24.0% 61.7% 11.0% 1.5%
4,907 68,167 175,474 31,311 4,349
approximate number of observations 16,718
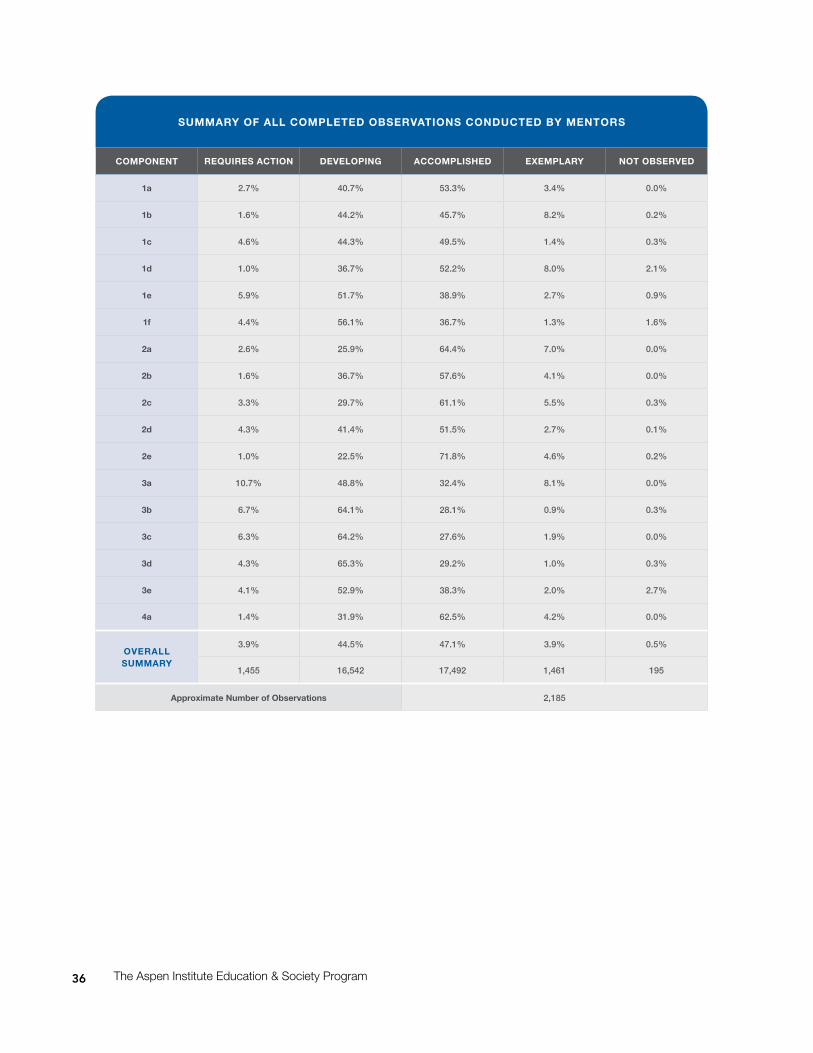
36 The Aspen Institute Education & Society Program
summary oF all completeD oBservations conDucteD By mentors
component requires action Developing accomplisheD exemplary not oBserveD
1a 2.7% 40.7% 53.3% 3.4% 0.0%
1b 1.6% 44.2% 45.7% 8.2% 0.2%
1c 4.6% 44.3% 49.5% 1.4% 0.3%
1d 1.0% 36.7% 52.2% 8.0% 2.1%
1e 5.9% 51.7% 38.9% 2.7% 0.9%
1f 4.4% 56.1% 36.7% 1.3% 1.6%
2a 2.6% 25.9% 64.4% 7.0% 0.0%
2b 1.6% 36.7% 57.6% 4.1% 0.0%
2c 3.3% 29.7% 61.1% 5.5% 0.3%
2d 4.3% 41.4% 51.5% 2.7% 0.1%
2e 1.0% 22.5% 71.8% 4.6% 0.2%
3a 10.7% 48.8% 32.4% 8.1% 0.0%
3b 6.7% 64.1% 28.1% 0.9% 0.3%
3c 6.3% 64.2% 27.6% 1.9% 0.0%
3d 4.3% 65.3% 29.2% 1.0% 0.3%
3e 4.1% 52.9% 38.3% 2.0% 2.7%
4a 1.4% 31.9% 62.5% 4.2% 0.0%
overall summary
3.9% 44.5% 47.1% 3.9% 0.5%
1,455 16,542 17,492 1,461 195
approximate number of observations 2,185
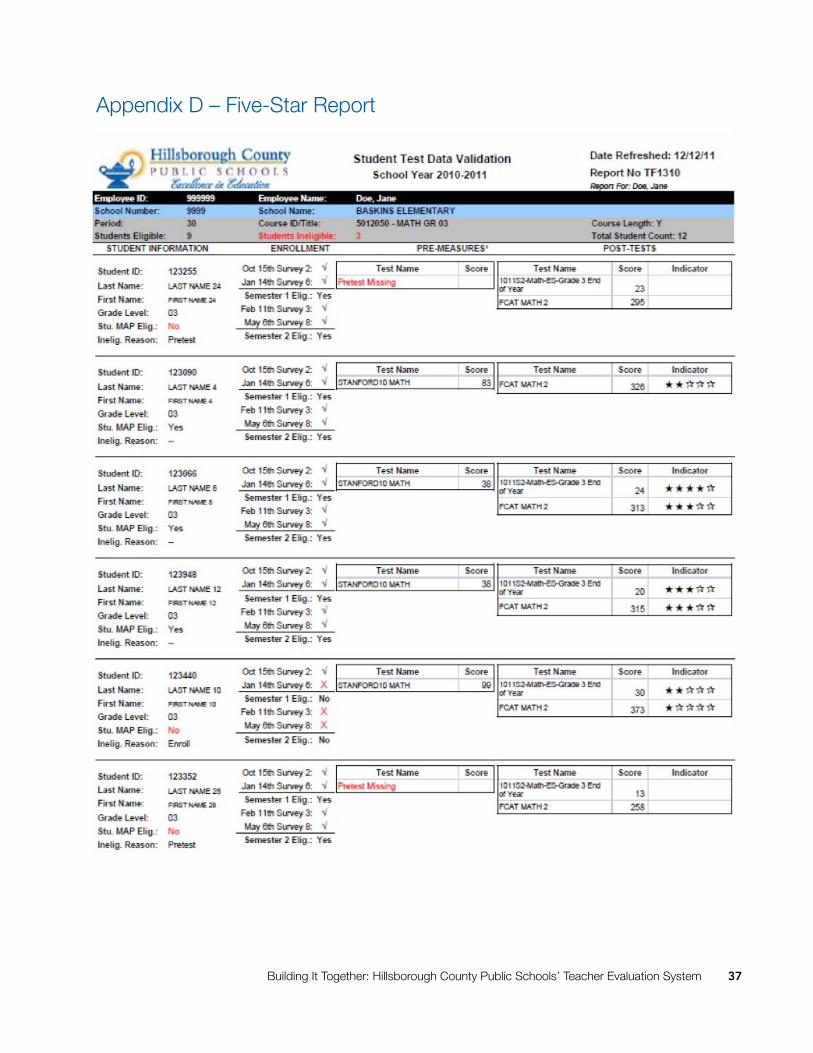
Building It Together: Hillsborough County Public Schools’ Teacher Evaluation System 37
Appendix D – Five-Star Report
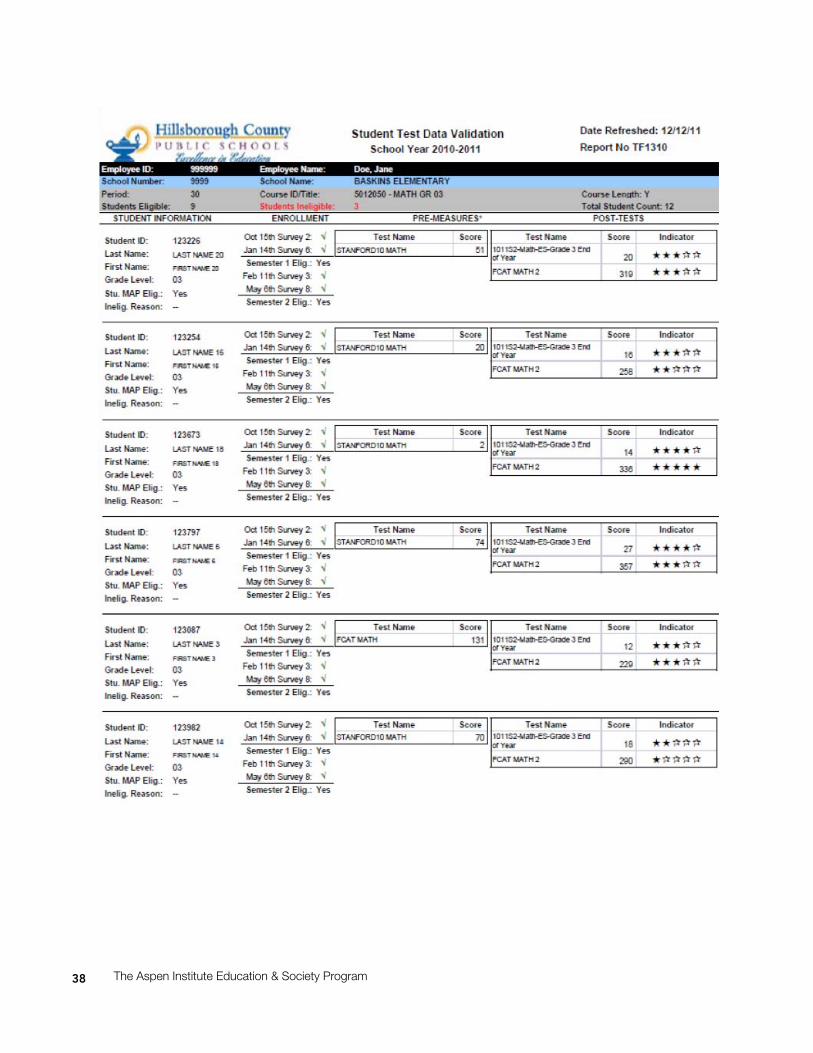
38 The Aspen Institute Education & Society Program
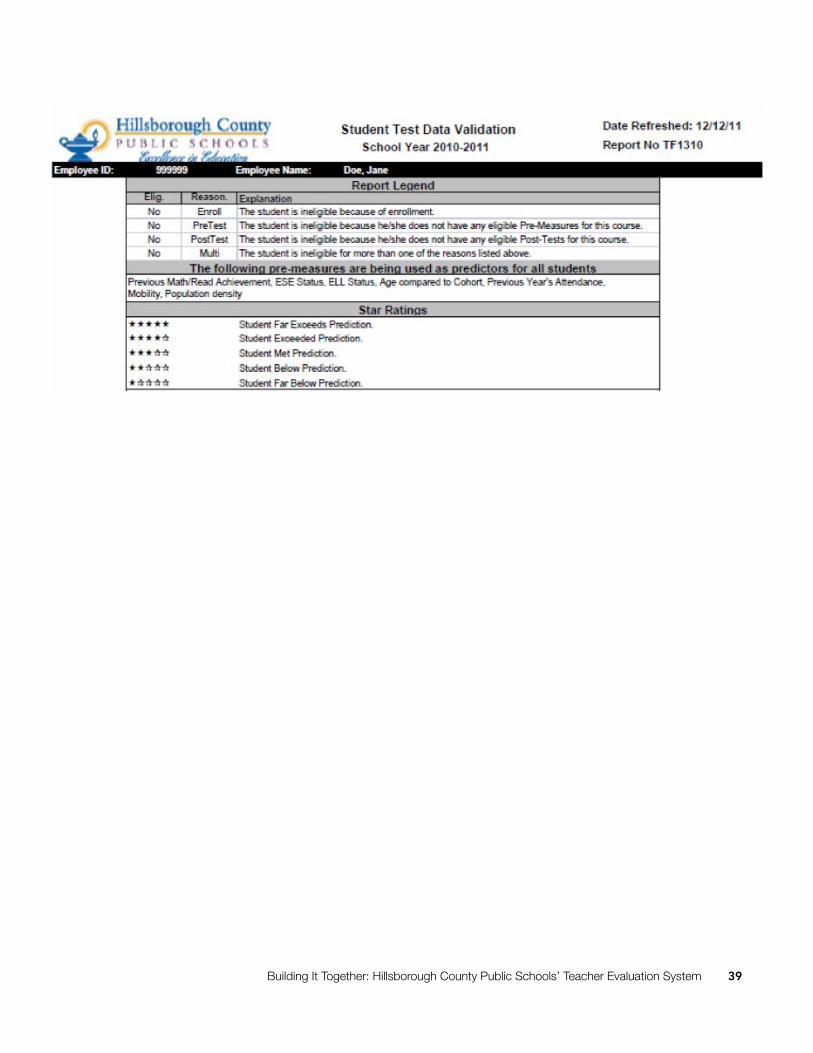
Building It Together: Hillsborough County Public Schools’ Teacher Evaluation System 39
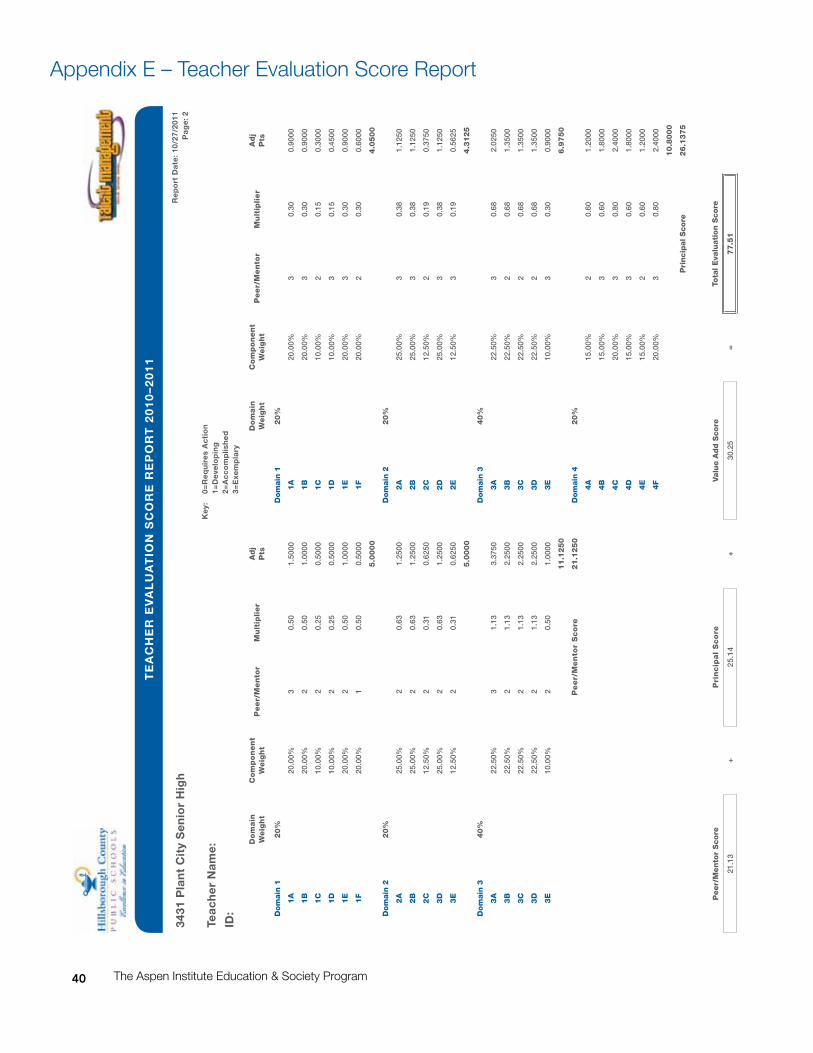
40 The Aspen Institute Education & Society Program
te
ac
he
r e
va
lu
at
ion
sc
or
e r
ep
or
t 2
01
0–2
01
1
3431
pla
nt
cit
y s
enio
r h
igh
rep
ort
Dat
e: 1
0/27
/201
1p
age:
2
teac
her
nam
e:
iD:
key
: 0=
req
uir
es a
ctio
n
1=D
evel
op
ing
2=
acc
om
plis
hed
3=
exe
mp
lary
Do
main
W
eig
ht
Co
mp
on
en
t
We
igh
tP
ee
r/M
en
tor
Mu
ltip
lie
rA
dj
P
tsD
om
ain
W
eig
ht
Co
mp
on
en
t
We
igh
tP
ee
r/M
en
tor
Mu
ltip
lie
rA
dj
P
ts
Dom
ain
12
0%
Dom
ain
12
0%
1A
20.0
0%3
0.50
1.50
001
A20
.00%
30.
300.
9000
1B
20.0
0%2
0.50
1.00
001
B20
.00%
30.
300.
9000
1C
10.0
0%2
0.25
0.50
001
C10
.00%
20.
150.
3000
1D
10.0
0%2
0.25
0.50
001
D10
.00%
30.
150.
4500
1E
20.0
0%2
0.50
1.00
001
E20
.00%
30.
300.
9000
1F
20.0
0%1
0.50
0.50
001
F20
.00%
20.
300.
6000
5.0
00
04
.05
00
Dom
ain
22
0%
Dom
ain
22
0%
2A
25.0
0%2
0.63
1.25
002
A25
.00%
30.
381.
1250
2B
25.0
0%2
0.63
1.25
002
B25
.00%
30.
381.
1250
2C
12.5
0%2
0.31
0.62
502
C12
.50%
20.
190.
3750
3D
25.0
0%2
0.63
1.25
002
D25
.00%
30.
381.
1250
3E
12.5
0%2
0.31
0.62
502
E12
.50%
30.
190.
5625
5.0
00
04
.31
25
Dom
ain
34
0%
Dom
ain
34
0%
3A
22.5
0%3
1.13
3.37
503
A22
.50%
30.
682.
0250
3B
22.5
0%2
1.13
2.25
003
B22
.50%
20.
681.
3500
3C
22.5
0%2
1.13
2.25
003
C22
.50%
20.
681.
3500
3D
22.5
0%2
1.13
2.25
003
D22
.50%
20.
681.
3500
3E
10.0
0%2
0.50
1.00
003
E10
.00%
30.
300.
9000
11
.12
50
6.9
75
0
Pe
er/
Me
nto
r S
co
re2
1.1
25
0D
om
ain
42
0%
4A
15.0
0%2
0.60
1.20
00
4B
15.0
0%3
0.60
1.80
00
4C
20.0
0%3
0.80
2.40
00
4D
15.0
0%3
0.60
1.80
00
4E
15.0
0%2
0.60
1.20
00
4F
20.0
0%3
0.80
2.40
00
10
.80
00
Pri
ncip
al S
core
26
.13
75
Peer/
Men
tor
Score
Pri
ncip
al
Sco
reValu
e A
dd
Score
Tota
l E
valu
ati
on
Score
21.1
3+
25.1
4+
30.2
5=
77
.51
Appendix E – Teacher Evaluation Score Report
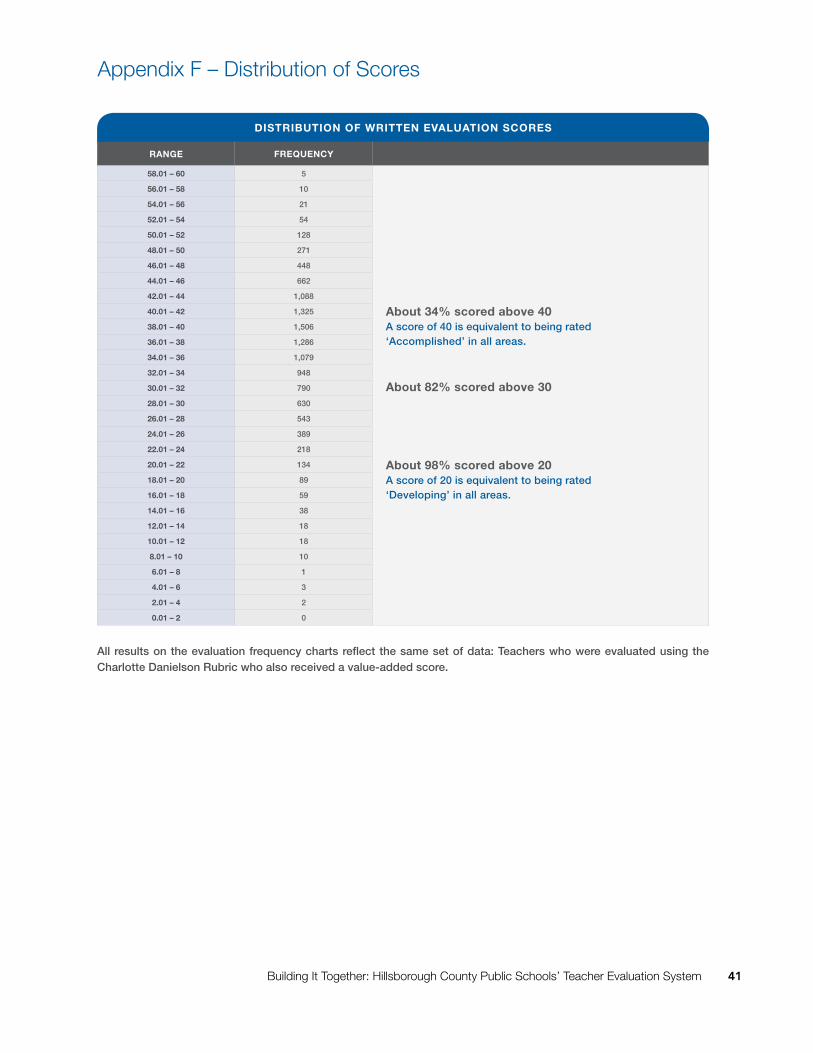
Building It Together: Hillsborough County Public Schools’ Teacher Evaluation System 41
DistriBution oF written evaluation scores
range Frequency
58.01 – 60 5
56.01 – 58 10
54.01 – 56 21
52.01 – 54 54
50.01 – 52 128
48.01 – 50 271
46.01 – 48 448
44.01 – 46 662
42.01 – 44 1,088
40.01 – 42 1,325
38.01 – 40 1,506
36.01 – 38 1,286
34.01 – 36 1,079
32.01 – 34 948
30.01 – 32 790
28.01 – 30 630
26.01 – 28 543
24.01 – 26 389
22.01 – 24 218
20.01 – 22 134
18.01 – 20 89
16.01 – 18 59
14.01 – 16 38
12.01 – 14 18
10.01 – 12 18
8.01 – 10 10
6.01 – 8 1
4.01 – 6 3
2.01 – 4 2
0.01 – 2 0
about 82% scored above 30
about 98% scored above 20 A score of 20 is equivalent to being rated ‘Developing’ in all areas.
about 34% scored above 40 A score of 40 is equivalent to being rated ‘Accomplished’ in all areas.
Appendix F – Distribution of Scores
All results on the evaluation frequency charts reflect the same set of data: Teachers who were evaluated using the Charlotte Danielson Rubric who also received a value-added score.
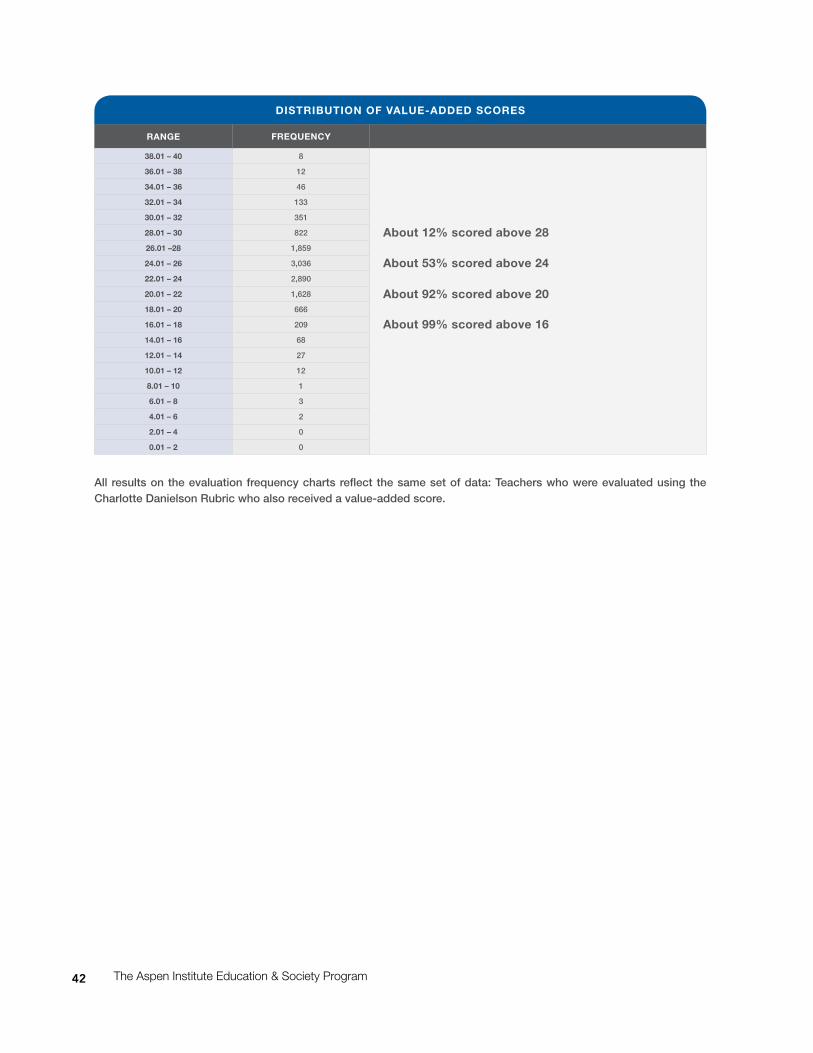
42 The Aspen Institute Education & Society Program
DistriBution oF value-aDDeD scores
range Frequency
38.01 – 40 8
36.01 – 38 12
34.01 – 36 46
32.01 – 34 133
30.01 – 32 351
28.01 – 30 822
26.01 –28 1,859
24.01 – 26 3,036
22.01 – 24 2,890
20.01 – 22 1,628
18.01 – 20 666
16.01 – 18 209
14.01 – 16 68
12.01 – 14 27
10.01 – 12 12
8.01 – 10 1
6.01 – 8 3
4.01 – 6 2
2.01 – 4 0
0.01 – 2 0
about 12% scored above 28
about 53% scored above 24
about 92% scored above 20
about 99% scored above 16
All results on the evaluation frequency charts reflect the same set of data: Teachers who were evaluated using the Charlotte Danielson Rubric who also received a value-added score.
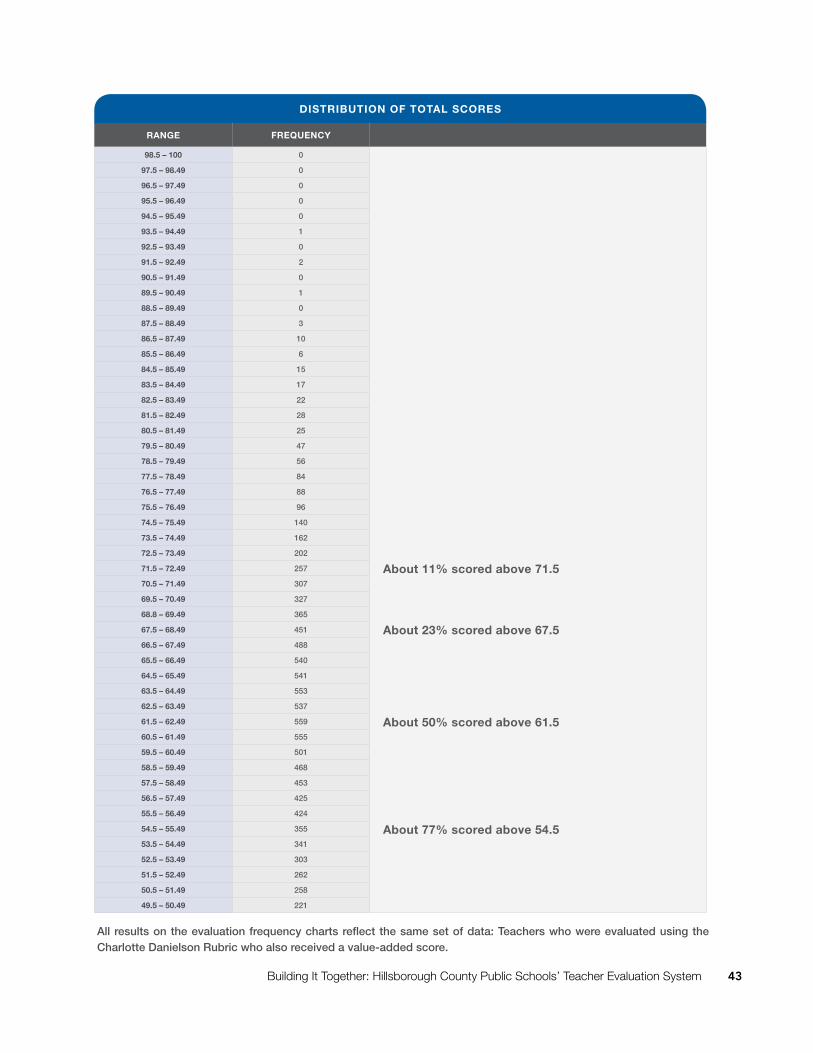
Building It Together: Hillsborough County Public Schools’ Teacher Evaluation System 43
DistriBution oF total scores
range Frequency
98.5 – 100 0
97.5 – 98.49 0
96.5 – 97.49 0
95.5 – 96.49 0
94.5 – 95.49 0
93.5 – 94.49 1
92.5 – 93.49 0
91.5 – 92.49 2
90.5 – 91.49 0
89.5 – 90.49 1
88.5 – 89.49 0
87.5 – 88.49 3
86.5 – 87.49 10
85.5 – 86.49 6
84.5 – 85.49 15
83.5 – 84.49 17
82.5 – 83.49 22
81.5 – 82.49 28
80.5 – 81.49 25
79.5 – 80.49 47
78.5 – 79.49 56
77.5 – 78.49 84
76.5 – 77.49 88
75.5 – 76.49 96
74.5 – 75.49 140
73.5 – 74.49 162
72.5 – 73.49 202
71.5 – 72.49 257
70.5 – 71.49 307
69.5 – 70.49 327
68.8 – 69.49 365
67.5 – 68.49 451
66.5 – 67.49 488
65.5 – 66.49 540
64.5 – 65.49 541
63.5 – 64.49 553
62.5 – 63.49 537
61.5 – 62.49 559
60.5 – 61.49 555
59.5 – 60.49 501
58.5 – 59.49 468
57.5 – 58.49 453
56.5 – 57.49 425
55.5 – 56.49 424
54.5 – 55.49 355
53.5 – 54.49 341
52.5 – 53.49 303
51.5 – 52.49 262
50.5 – 51.49 258
49.5 – 50.49 221
about 11% scored above 71.5
about 23% scored above 67.5
about 50% scored above 61.5
about 77% scored above 54.5
All results on the evaluation frequency charts reflect the same set of data: Teachers who were evaluated using the Charlotte Danielson Rubric who also received a value-added score.
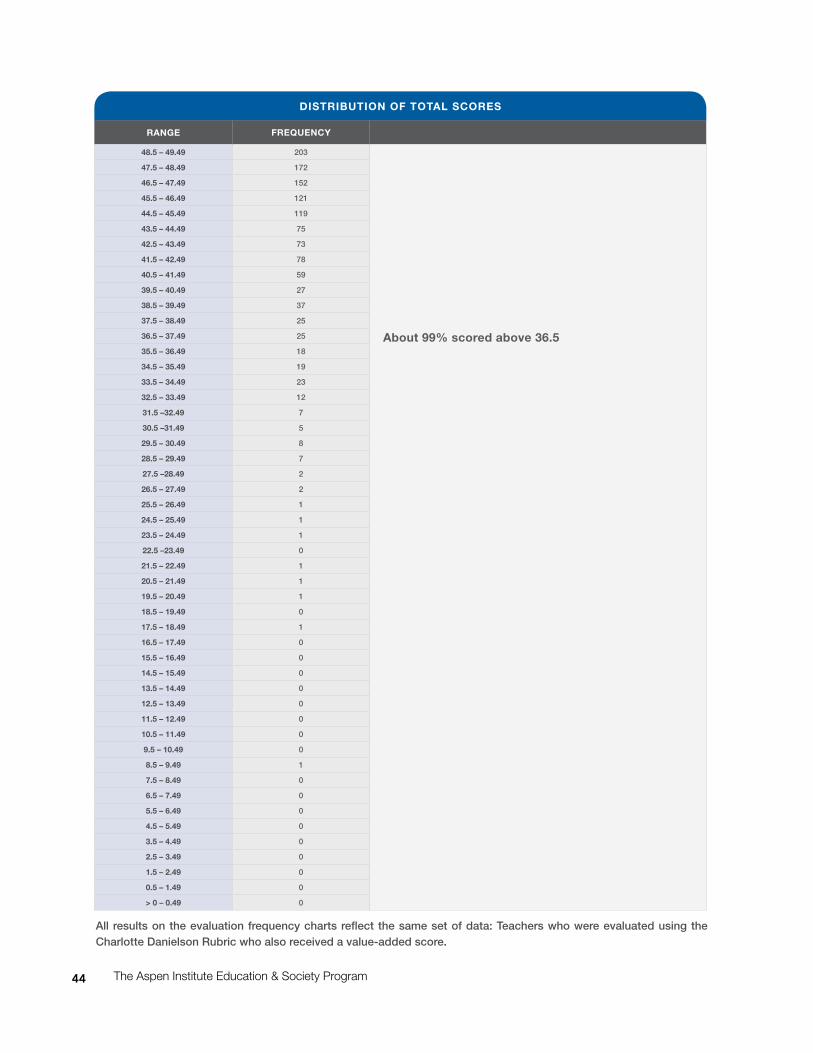
44 The Aspen Institute Education & Society Program
DistriBution oF total scores
range Frequency
48.5 – 49.49 203
47.5 – 48.49 172
46.5 – 47.49 152
45.5 – 46.49 121
44.5 – 45.49 119
43.5 – 44.49 75
42.5 – 43.49 73
41.5 – 42.49 78
40.5 – 41.49 59
39.5 – 40.49 27
38.5 – 39.49 37
37.5 – 38.49 25
36.5 – 37.49 25
35.5 – 36.49 18
34.5 – 35.49 19
33.5 – 34.49 23
32.5 – 33.49 12
31.5 –32.49 7
30.5 –31.49 5
29.5 – 30.49 8
28.5 – 29.49 7
27.5 –28.49 2
26.5 – 27.49 2
25.5 – 26.49 1
24.5 – 25.49 1
23.5 – 24.49 1
22.5 –23.49 0
21.5 – 22.49 1
20.5 – 21.49 1
19.5 – 20.49 1
18.5 – 19.49 0
17.5 – 18.49 1
16.5 – 17.49 0
15.5 – 16.49 0
14.5 – 15.49 0
13.5 – 14.49 0
12.5 – 13.49 0
11.5 – 12.49 0
10.5 – 11.49 0
9.5 – 10.49 0
8.5 – 9.49 1
7.5 – 8.49 0
6.5 – 7.49 0
5.5 – 6.49 0
4.5 – 5.49 0
3.5 – 4.49 0
2.5 – 3.49 0
1.5 – 2.49 0
0.5 – 1.49 0
> 0 – 0.49 0
about 99% scored above 36.5
All results on the evaluation frequency charts reflect the same set of data: Teachers who were evaluated using the Charlotte Danielson Rubric who also received a value-added score.
The Aspen Education & Society Program provides an informed and neutral forum for education practitioners, researchers, and policy leaders to engage in focused dialogue regarding their efforts to improve student achievement, and to consider how public policy changes can affect progress. Through our meetings, analysis, commissioned work, and structured networks of policymakers and practitioners, the program, for nearly 30 years, has developed intellectual frameworks on critical education issues that assist federal, state, and local policymakers working to improve American education.
The Aspen Institute mission is twofold: to foster values-based leadership, encouraging individuals to reflect on the ideals and ideas that define a good society, and to provide a neutral and balanced venue for discussing and acting on critical issues. The Aspen Institute does this primarily in four ways: seminars, young-leader fellowships around the globe, policy programs, and public conferences and events. The Institute is based in Washington, DC; in Aspen, Colorado; and on the Wye River on Maryland’s Eastern Shore and has an international network of partners.

[email protected] Dupont Circle • Suite 700 • Washington, D.C. • 20036
www.aspeninstitute.org/education