building sustainable communities in ohio’s shale region · building sustainable communities !5 in...
TRANSCRIPT
Ohio State University Extension ! Energize Ohio Signature Program 1
2014 Annual Report
energizeohio.osu.edu
2015 Eastern Ohio 25 County Regional ReportCommunity and Energy Series Technical Report 16-01
OHIO STATE UNIVERSITY EXTENSION
Building Sustainable Communities in Ohio’s Shale Region: Leveraging Manufacturing Clusters and Local Assets with Strategic Planning
Acknowledgments A special thank you to the following team members for their contributions to the development of this report.
Nancy Bowen, OSU Extension Field Specialist, Community Economics Eric Romich, OSU Extension Field Specialist, Energy Development David Civittolo, OSU Extension Field Specialist, Community Economics
EDA Shale Grant Project Overview………………………………………………………………3
Ohio Oil and Gas Production……………………………………………………………………5
Demographic Trends…………………………………………..…………………………….… 8
Economic Impact Analysis Methodology………………………………………………………9
Total 25 County EDA Region..………………………………………………………………… 12
Buckeye Hills Hocking Valley Region……………………………………………………………14
Eastgate Regional Council of Government Region…………………………………………………16
Northeast Ohio Four County Regional Planning & Development Organization Region……18
Ohio Mid-Eastern Governments Association Region……………………………………………20
Attachment A: Shale Energy Development: Economic Impact Analysis……………… 23
References……………………………………………………………………………………..….37
Building Sustainable Communities ! in Ohio’s Shale Region 3
Technical Report 16-01
EDA Shale Energy Grant Project Background and Overview
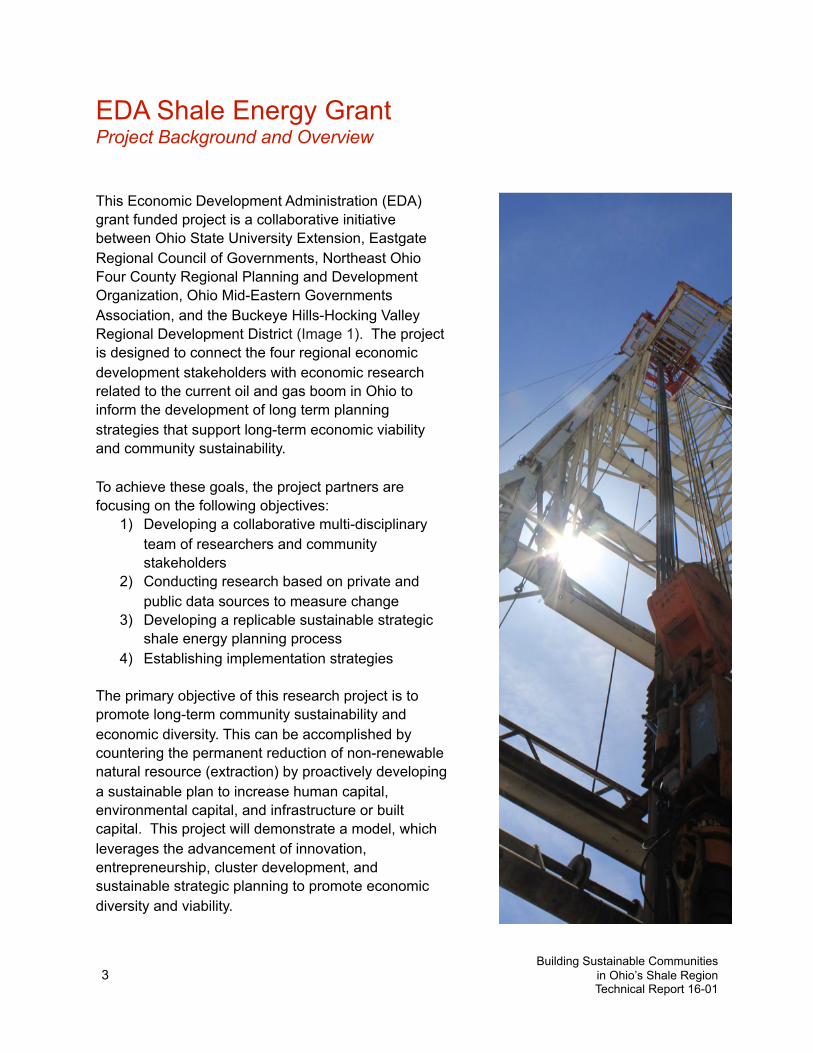
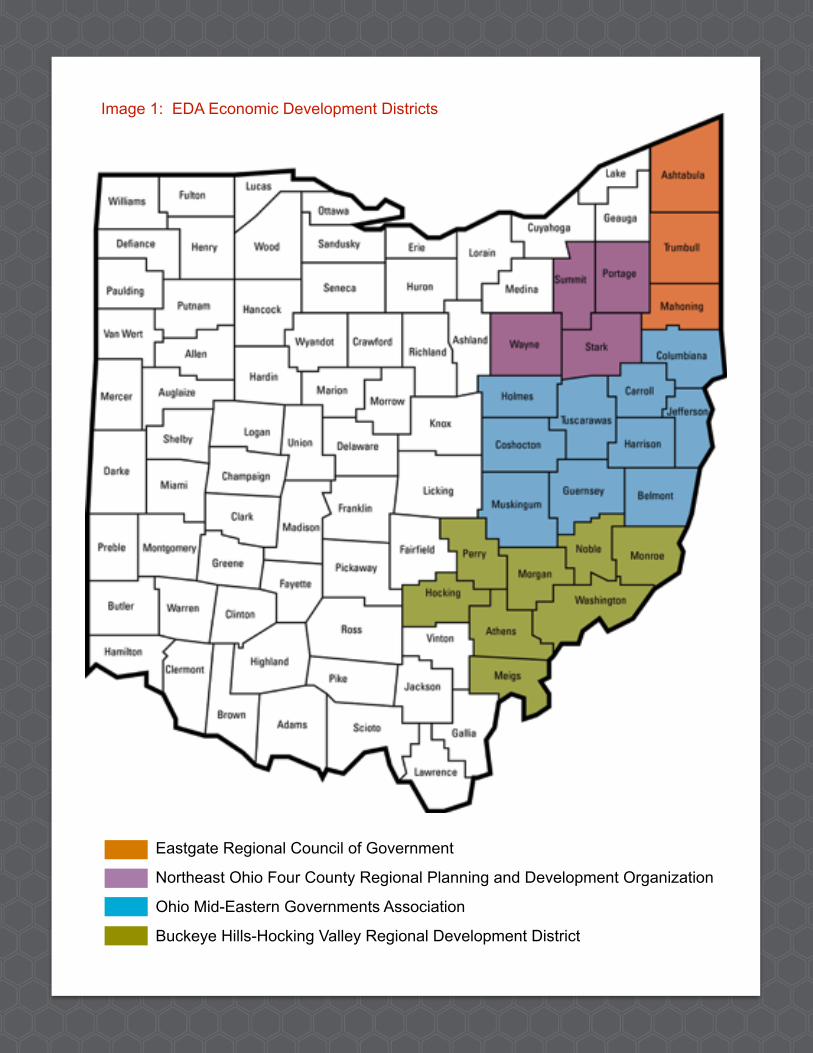
This Economic Development Administration (EDA) grant funded project is a collaborative initiative between Ohio State University Extension, Eastgate Regional Council of Governments, Northeast Ohio Four County Regional Planning and Development Organization, Ohio Mid-Eastern Governments Association, and the Buckeye Hills-Hocking Valley Regional Development District (Image 1). The project is designed to connect the four regional economic development stakeholders with economic research related to the current oil and gas boom in Ohio to inform the development of long term planning strategies that support long-term economic viability and community sustainability.
To achieve these goals, the project partners are focusing on the following objectives:
1) Developing a collaborative multi-disciplinaryteam of researchers and community stakeholders
2) Conducting research based on private andpublic data sources to measure change
3) Developing a replicable sustainable strategicshale energy planning process
4) Establishing implementation strategies
The primary objective of this research project is to promote long-term community sustainability and economic diversity. This can be accomplished by countering the permanent reduction of non-renewable natural resource (extraction) by proactively developing a sustainable plan to increase human capital, environmental capital, and infrastructure or built capital. This project will demonstrate a model, which leverages the advancement of innovation, entrepreneurship, cluster development, and sustainable strategic planning to promote economic diversity and viability.
Ohio State University Extension ! Energize Ohio Signature Program 4
2014 Annual Report
Eastgate Regional Council of Government
Northeast Ohio Four County Regional Planning and Development Organization
Ohio Mid-Eastern Governments Association
Buckeye Hills-Hocking Valley Regional Development District
Image 1: EDA Economic Development Districts
Building Sustainable Communities ! in Ohio’s Shale Region 5
Technical Report 16-01
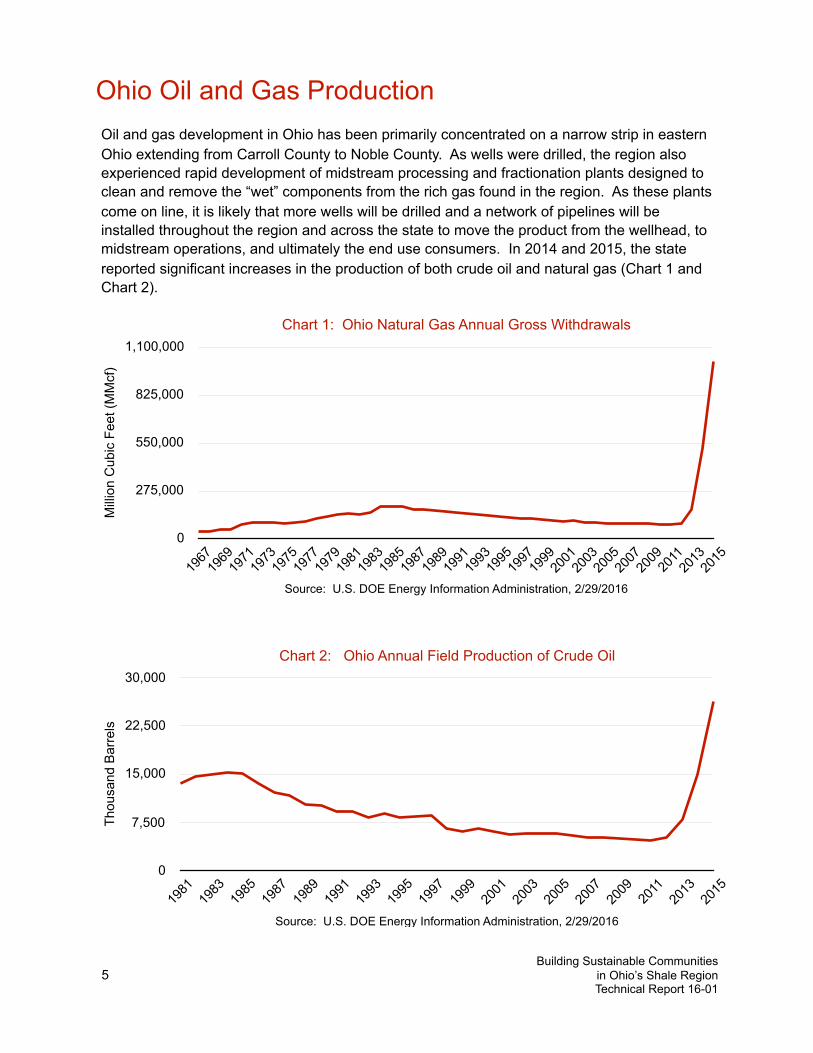
Ohio Oil and Gas ProductionOil and gas development in Ohio has been primarily concentrated on a narrow strip in eastern Ohio extending from Carroll County to Noble County. As wells were drilled, the region also experienced rapid development of midstream processing and fractionation plants designed to clean and remove the “wet” components from the rich gas found in the region. As these plants come on line, it is likely that more wells will be drilled and a network of pipelines will be installed throughout the region and across the state to move the product from the wellhead, to midstream operations, and ultimately the end use consumers. In 2014 and 2015, the state reported significant increases in the production of both crude oil and natural gas (Chart 1 and Chart 2).
Chart 2: Ohio Annual Field Production of Crude Oil
Thou
sand
Bar
rels
0
7,500
15,000
22,500
30,000
Source: U.S. DOE Energy Information Administration, 2/29/2016
1981
1983
1985
1987
1989
1991
1993
1995
1997
1999
2001
2003
2005
2007
2009
2011
2013
2015
Chart 1: Ohio Natural Gas Annual Gross Withdrawals
Mill
ion
Cub
ic F
eet (
MM
cf)
0
275,000
550,000
825,000
1,100,000
Source: U.S. DOE Energy Information Administration, 2/29/201619
6719
6919
7119
7319
7519
7719
7919
8119
8319
8519
8719
8919
9119
9319
9519
9719
9920
0120
0320
0520
0720
0920
1120
1320
15
Building Sustainable Communities ! in Ohio’s Shale Region 6
Technical Report 16-01
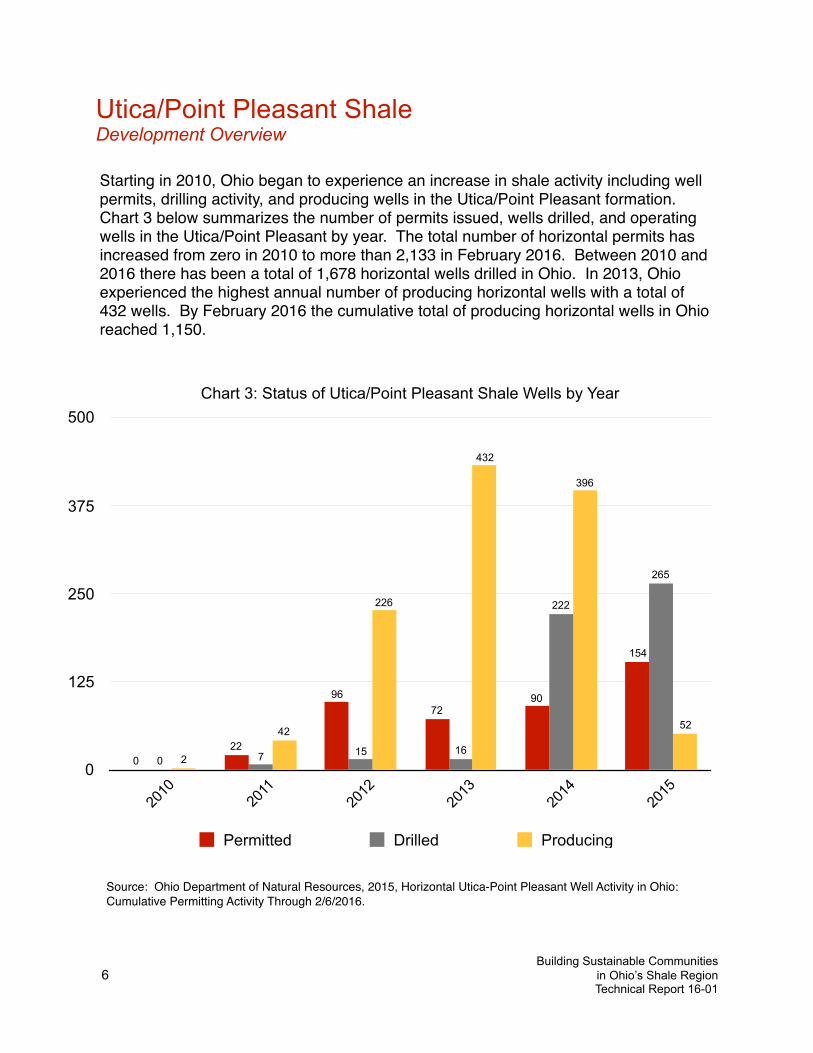
Chart 3: Status of Utica/Point Pleasant Shale Wells by Year
0
125
250
375
500
2010
2011
2012
2013
2014
2015
52
396
432
226
42
2
265
222
161570
154
9072
96
220
Permitted Drilled Producing
Utica/Point Pleasant Shale Development Overview
Starting in 2010, Ohio began to experience an increase in shale activity including well permits, drilling activity, and producing wells in the Utica/Point Pleasant formation. Chart 3 below summarizes the number of permits issued, wells drilled, and operating wells in the Utica/Point Pleasant by year. The total number of horizontal permits has increased from zero in 2010 to more than 2,133 in February 2016. Between 2010 and 2016 there has been a total of 1,678 horizontal wells drilled in Ohio. In 2013, Ohio experienced the highest annual number of producing horizontal wells with a total of 432 wells. By February 2016 the cumulative total of producing horizontal wells in Ohio reached 1,150.
Source: Ohio Department of Natural Resources, 2015, Horizontal Utica-Point Pleasant Well Activity in Ohio: Cumulative Permitting Activity Through 2/6/2016.
Building Sustainable Communities ! in Ohio’s Shale Region 7
Technical Report 16-01
XW
XW
XWXW
XWXWXW
XW
XWXWXW
XWXWXW
XWXW
XWXWXW
XW XWXWXW
XWXWXWXWXWXW
XWXW
XW
XWXWXW
XW
XW
XWXW
XW
XWXW
XW
XWXWXWXW
XW
XW
XWXWXWXWXWXW
XWXW
XWXWXW
XW
XWXWXWXWXWXWXWXWXWXWXWXW
XWXW
XWXWXWXW
XWXW
XWXW
XWXW
XW
XWXWXW
XWXW
XW
XW
XWXW
XWXW
XWXW
XW
XW
XW
XW
XWXW
XW
XWXW
XW
XW
XWXWXW XW
XW
XW
XW XW
XW
XWXW
XW
XWXWXWXW
XWXWXWXW
XWXW
XWXW
XW
XWXW
XW
XWXW
XWXW
XW
XWXWXW
XW
XW
XWXW
XWXW XW
XWXW XW
XWXWXWXWXWXW
XW
XWXWXWXWXWXW XWXWXWXWXWXWXWXWXW
XWXWXWXWXWXWXWXWXWXWXW
XWXW
XW
XW
XWXW
XW
XWXW XW
XWXW
XWXWXWXW
XW
XWXW
XWXWXWXW
XWXWXWXWXWXWXW
XWXWXW
XWXW
XWXWXWXWXW
XWXWXWXW
XW
XW
XW XW
XWXW
XW
XWXWXW
XW
XWXWXWXW
XWXWXWXWXW
XWXWXWXW
XWXWXWXWXWXWXW
XWXWXWXW
XWXWXWXWXWXWXWXWXWXWXWXWXW
XWXW
XW
XW
XWXWXW
XWXWXWXW
XWXWXWXW
XW
XWXW
XWXWXW
XWXWXW
XW
XWXWXWXWXW XWXWXW XWXW
XWXWXWXWXW
XW
XW
XWXWXWXWXWXWXWXW
XWXW
XWXW
XWXWXW
XWXWXW
XWXWXW
XWXWXWXWXWXW
XWXW
XW
XWXWXWXWXWXWXWXWXWXWXWXWXW
XW
XWXWXW
XW
XWXW XW
XWXWXWXWXWXWXWXW
XW
XW
XWXWXWXW
XWXW
XWXWXWXWXWXWXWXW
XWXWXWXWXWXW
XWXWXWXW
XW
XWXWXWXWXWXW
XW
XW
XWXW
XW
XWXW
XWXW
XW
XW
XW
XW
XWXWXWXW
XW
XW
XW
XW
XW
XW
XW
XWXW
XWXW
XW XWXWXW
XWXWXWXWXWXWXW WASHINGTONHOCKING
MORGAN
MONROEPERRYFAIRFIELDNOBLE
MUSKINGUM
BELMONTGUERNSEYLICKING
HARRISONCOSHOCTON
KNOX
JEFFERSON
HOLMES
TUSCARAWAS
MORROW
CARROLL
COLUMBIANA
WAYNE
RICHLAND
STARKASHLAND
MAHONING
MEDINAHURON
SUMMIT
PORTAGE
ERIETRUMBULL
LORAIN
CUYAHOGA
GEAUGA
LAKEASHTABULA
�
OHIO DEPARTMENT OF NATURAL RESOURCES
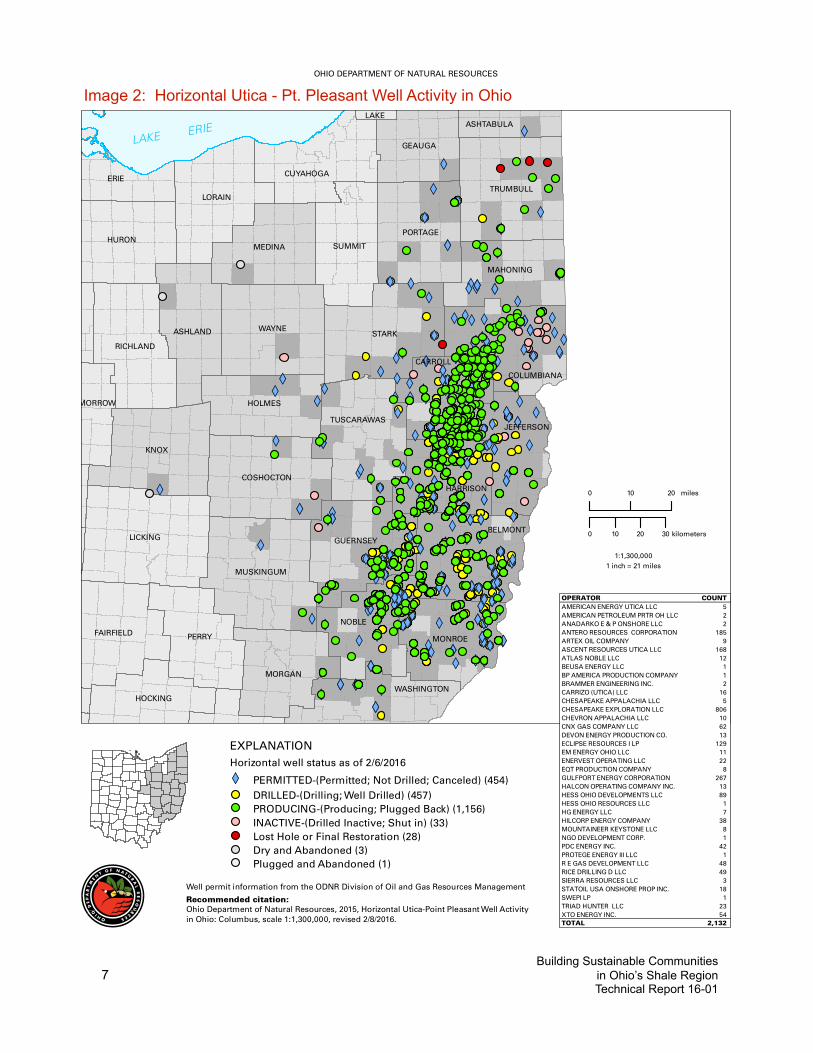
HORIZONTAL UTICA - P T PLEASANT WELL ACTIVITY IN OHIO
LAKE ERIE
1:1,300,000
Well permit information from the ODNR Division of Oil and Gas Resources Management
1 inch = 21 miles
0 10 20 miles
0 10 20 30 kilometers
EXPLANATIONHorizontal well status as of 2/6/2016
XW PERMITTED-(Permitted; Not Drilled; Canceled) (454)DRILLED-(Drilling; Well Drilled) (457)PRODUCING-(Producing; Plugged Back) (1,156)INACTIVE-(Drilled Inactive; Shut in) (33)Lost Hole or Final Restoration (28)Dry and Abandoned (3)Plugged and Abandoned (1)
Recommended citation:Ohio Department of Natural Resources, 2015, Horizontal Utica-Point Pleasant Well Activityin Ohio: Columbus, scale 1:1,300,000, revised 2/8/2016.
OPERATOR COUNTAMERICAN ENERGY UTICA LLC 5 AMERICAN PETROLEUM PRTR OH LLC 2 ANADARKO E & P ONSHORE LLC 2 ANTERO RESOURCES CORPORATION 185 ARTEX OIL COMPANY 9 ASCENT RESOURCES UTICA LLC 168 ATLAS NOBLE LLC 12 BEUSA ENERGY LLC 1 BP AMERICA PRODUCTION COMPANY 1 BRAMMER ENGINEERING INC. 2 CARRIZO (UTICA) LLC 16 CHESAPEAKE APPALACHIA LLC 5 CHESAPEAKE EXPLORATION LLC 806 CHEVRON APPALACHIA LLC 10 CNX GAS COMPANY LLC 62 DEVON ENERGY PRODUCTION CO. 13 ECLIPSE RESOURCES I LP 129 EM ENERGY OHIO LLC 11 ENERVEST OPERATING LLC 22 EQT PRODUCTION COMPANY 8 GULFPORT ENERGY CORPORATION 267 HALCON OPERATING COMPANY INC. 13 HESS OHIO DEVELOPMENTS LLC 89 HESS OHIO RESOURCES LLC 1 HG ENERGY LLC 7 HILCORP ENERGY COMPANY 38 MOUNTAINEER KEYSTONE LLC 8 NGO DEVELOPMENT CORP. 1 PDC ENERGY INC. 42 PROTEGE ENERGY III LLC 1 R E GAS DEVELOPMENT LLC 48 RICE DRILLING D LLC 49 SIERRA RESOURCES LLC 3 STATOIL USA ONSHORE PROP INC. 18 SWEPI LP 1 TRIAD HUNTER LLC 23 XTO ENERGY INC. 54 TOTAL 2,132
Image 2: Horizontal Utica - Pt. Pleasant Well Activity in Ohio
Building Sustainable Communities ! in Ohio’s Shale Region 8
Technical Report 16-01
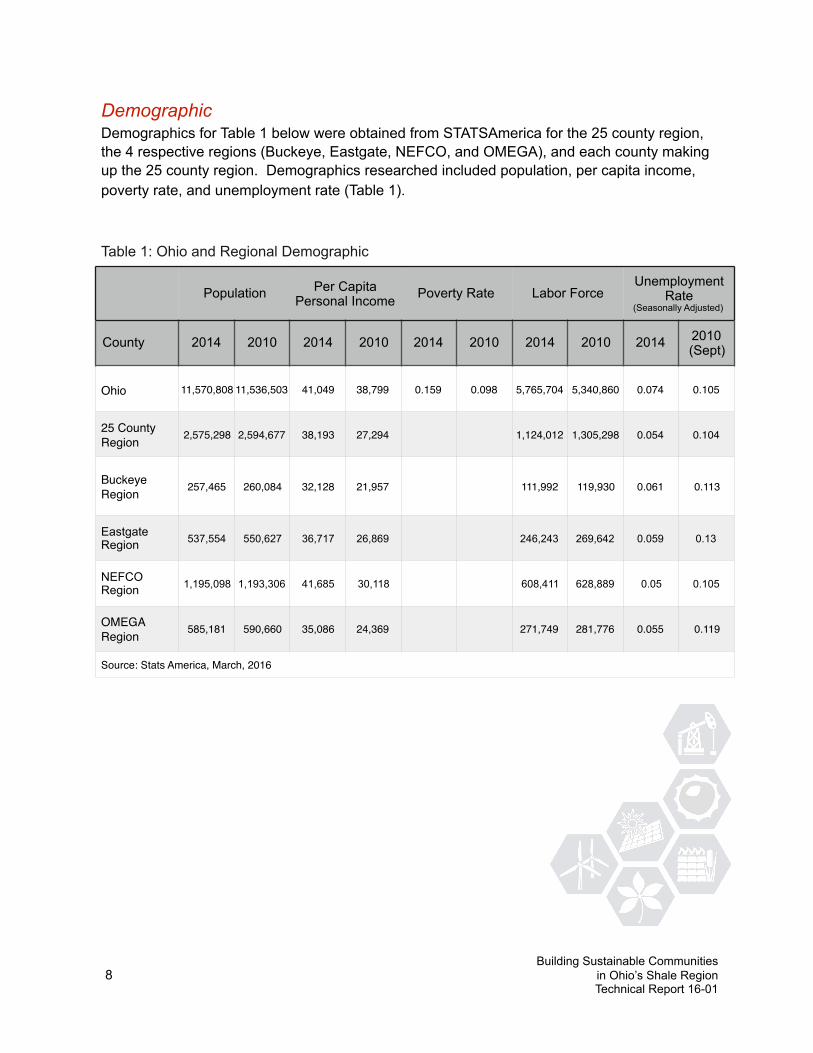
Demographic Demographics for Table 1 below were obtained from STATSAmerica for the 25 county region, the 4 respective regions (Buckeye, Eastgate, NEFCO, and OMEGA), and each county making up the 25 county region. Demographics researched included population, per capita income, poverty rate, and unemployment rate (Table 1).
Table 1: Ohio and Regional Demographic
Population Per Capita Personal Income Poverty Rate Labor Force
Unemployment Rate
(Seasonally Adjusted)
County 2014 2010 2014 2010 2014 2010 2014 2010 2014 2010 (Sept)
Ohio 11,570,808 11,536,503 41,049 38,799 0.159 0.098 5,765,704 5,340,860 0.074 0.105
25 County Region 2,575,298 2,594,677 38,193 27,294 1,124,012 1,305,298 0.054 0.104
BuckeyeRegion 257,465 260,084 32,128 21,957 111,992 119,930 0.061 0.113
Eastgate Region 537,554 550,627 36,717 26,869 246,243 269,642 0.059 0.13
NEFCO Region 1,195,098 1,193,306 41,685 30,118 608,411 628,889 0.05 0.105
OMEGARegion 585,181 590,660 35,086 24,369 271,749 281,776 0.055 0.119
Source: Stats America, March, 2016
Building Sustainable Communities ! in Ohio’s Shale Region 9
Technical Report 16-01
Demographic Trends
• In 2014, the 25 County Region total population of 2,575,298 was about 22.2% of the State of Ohio’s total population (11,507,808).
• The NEFCO Region had the largest population at 1,195,098, followed by Omega (585,181) and Eastgate (537,554). The Buckeye Region had the least population at 257,465, which made up only 10% of the total population in the 25 county region in 2014.
• While the State of Ohio’s population increased slightly between 2010 and 2014, the 25 County Region showed a slight decrease in terms of total population. Of the 4 Regions, only the NEFCO Region showed a slight increase in population. In terms of actual population numbers, the Eastgate Region lost the most population (from 550,627 in 2010 to 537,554 in 2014).
• While the per capita income in Ohio was $41,049 in 2014, the 25 County Region had a per capita income of $38,193, which was almost $3,000 less than the State of Ohio’s. Of the four regions, the NEFCO was the only region above the State of Ohio’s per capita income. In 2014, the NEFCO Region had a per capita income of $41,685, almost $700 above the State of Ohio’s per capita income. The Buckeye Region had the lowest per capita income in 2014 at $32,198, almost $9,000 less than the State of Ohio’s.
• While the State of Ohio had a labor force of 5,765,704 in 2014, the 25 County Region had 1,124,012, which made up almost 20% of the total labor force in Ohio. While the labor force in Ohio actually increased between 2009 and 2014, the 25 County Region saw a decrease. For example, in the Eastgate Region, the labor force shrank by over 16,000 people between 2009 and 2014.
• The Unemployment Rate in the State of Ohio in 2014 was 7.4%. The 25 County Region had an unemployment rate of 5.4% during the same time frame. In fact, all 4 Regions were below that State Of Ohio’s unemployment rate with the lowest found in the NEFCO region (5.0%), followed closely by OMEGA (5.5%) and Eastgate (5.9%).
Building Sustainable Communities ! in Ohio’s Shale Region 10
Technical Report 16-01
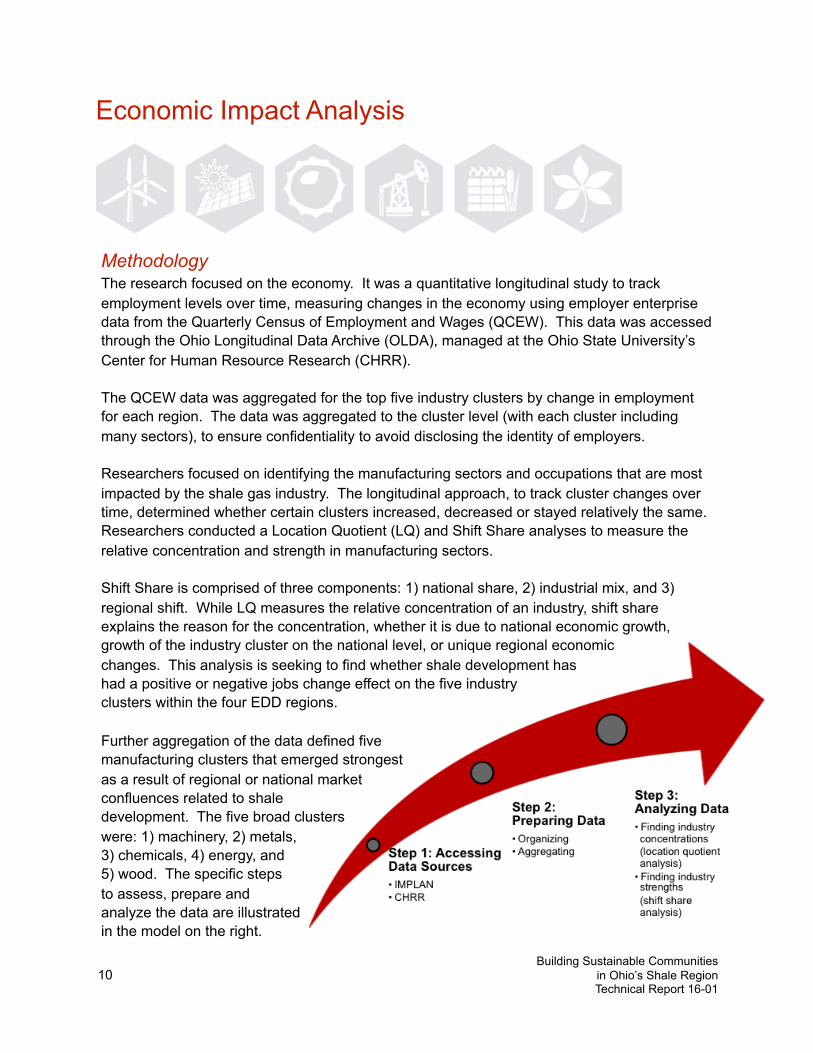
Methodology The research focused on the economy. It was a quantitative longitudinal study to track employment levels over time, measuring changes in the economy using employer enterprise data from the Quarterly Census of Employment and Wages (QCEW). This data was accessed through the Ohio Longitudinal Data Archive (OLDA), managed at the Ohio State University’s Center for Human Resource Research (CHRR).
The QCEW data was aggregated for the top five industry clusters by change in employment for each region. The data was aggregated to the cluster level (with each cluster including many sectors), to ensure confidentiality to avoid disclosing the identity of employers.
Researchers focused on identifying the manufacturing sectors and occupations that are most impacted by the shale gas industry. The longitudinal approach, to track cluster changes over time, determined whether certain clusters increased, decreased or stayed relatively the same. Researchers conducted a Location Quotient (LQ) and Shift Share analyses to measure the relative concentration and strength in manufacturing sectors.
Shift Share is comprised of three components: 1) national share, 2) industrial mix, and 3) regional shift. While LQ measures the relative concentration of an industry, shift share explains the reason for the concentration, whether it is due to national economic growth, growth of the industry cluster on the national level, or unique regional economic changes. This analysis is seeking to find whether shale development has had a positive or negative jobs change effect on the five industry clusters within the four EDD regions.
Further aggregation of the data defined five manufacturing clusters that emerged strongest as a result of regional or national market confluences related to shale development. The five broad clusters were: 1) machinery, 2) metals, 3) chemicals, 4) energy, and 5) wood. The specific steps to assess, prepare and analyze the data are illustrated in the model on the right.
Economic Impact Analysis
Building Sustainable Communities ! in Ohio’s Shale Region 11
Technical Report 16-01
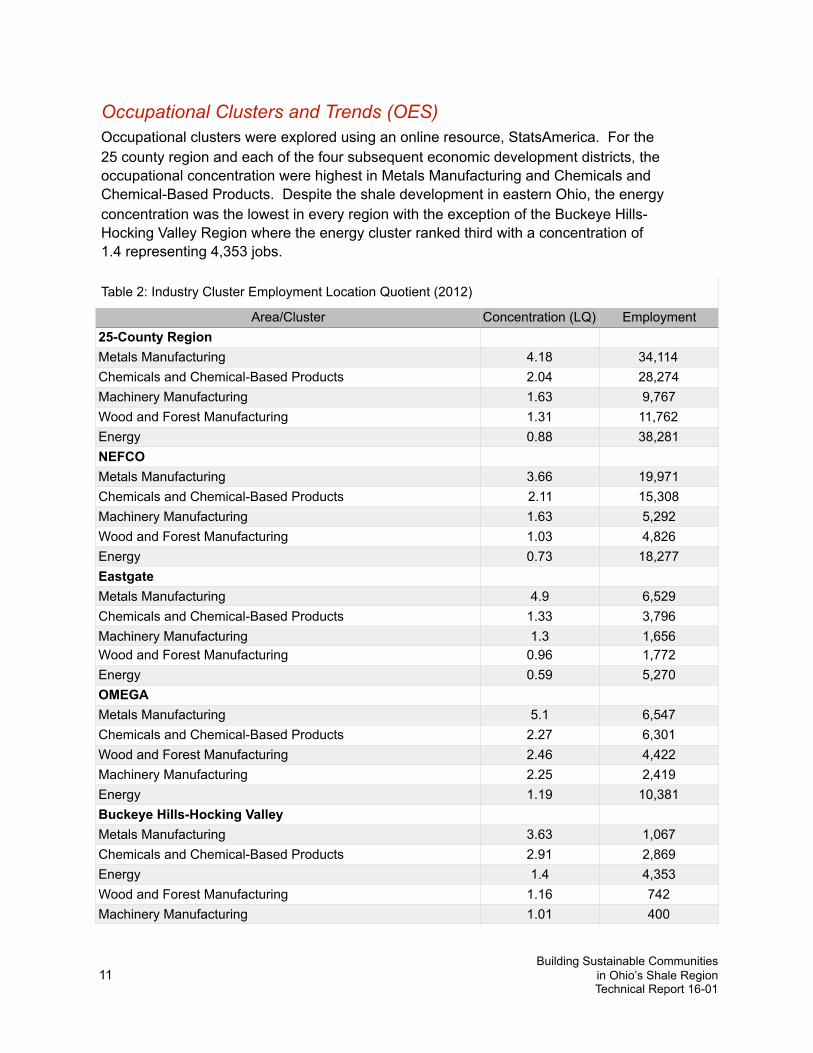
Table 2: Industry Cluster Employment Location Quotient (2012)
Area/Cluster Concentration (LQ) Employment25-County RegionMetals Manufacturing 4.18 34,114Chemicals and Chemical-Based Products 2.04 28,274Machinery Manufacturing 1.63 9,767Wood and Forest Manufacturing 1.31 11,762Energy 0.88 38,281NEFCOMetals Manufacturing 3.66 19,971Chemicals and Chemical-Based Products 2.11 15,308Machinery Manufacturing 1.63 5,292Wood and Forest Manufacturing 1.03 4,826Energy 0.73 18,277EastgateMetals Manufacturing 4.9 6,529Chemicals and Chemical-Based Products 1.33 3,796Machinery Manufacturing 1.3 1,656Wood and Forest Manufacturing 0.96 1,772Energy 0.59 5,270OMEGAMetals Manufacturing 5.1 6,547Chemicals and Chemical-Based Products 2.27 6,301Wood and Forest Manufacturing 2.46 4,422Machinery Manufacturing 2.25 2,419Energy 1.19 10,381Buckeye Hills-Hocking ValleyMetals Manufacturing 3.63 1,067Chemicals and Chemical-Based Products 2.91 2,869Energy 1.4 4,353Wood and Forest Manufacturing 1.16 742Machinery Manufacturing 1.01 400
Occupational Clusters and Trends (OES) Occupational clusters were explored using an online resource, StatsAmerica. For the 25 county region and each of the four subsequent economic development districts, the occupational concentration were highest in Metals Manufacturing and Chemicals and Chemical-Based Products. Despite the shale development in eastern Ohio, the energy concentration was the lowest in every region with the exception of the Buckeye Hills-Hocking Valley Region where the energy cluster ranked third with a concentration of 1.4 representing 4,353 jobs.
Building Sustainable Communities ! in Ohio’s Shale Region 12
Technical Report 16-01
Total 25 County EDA Region
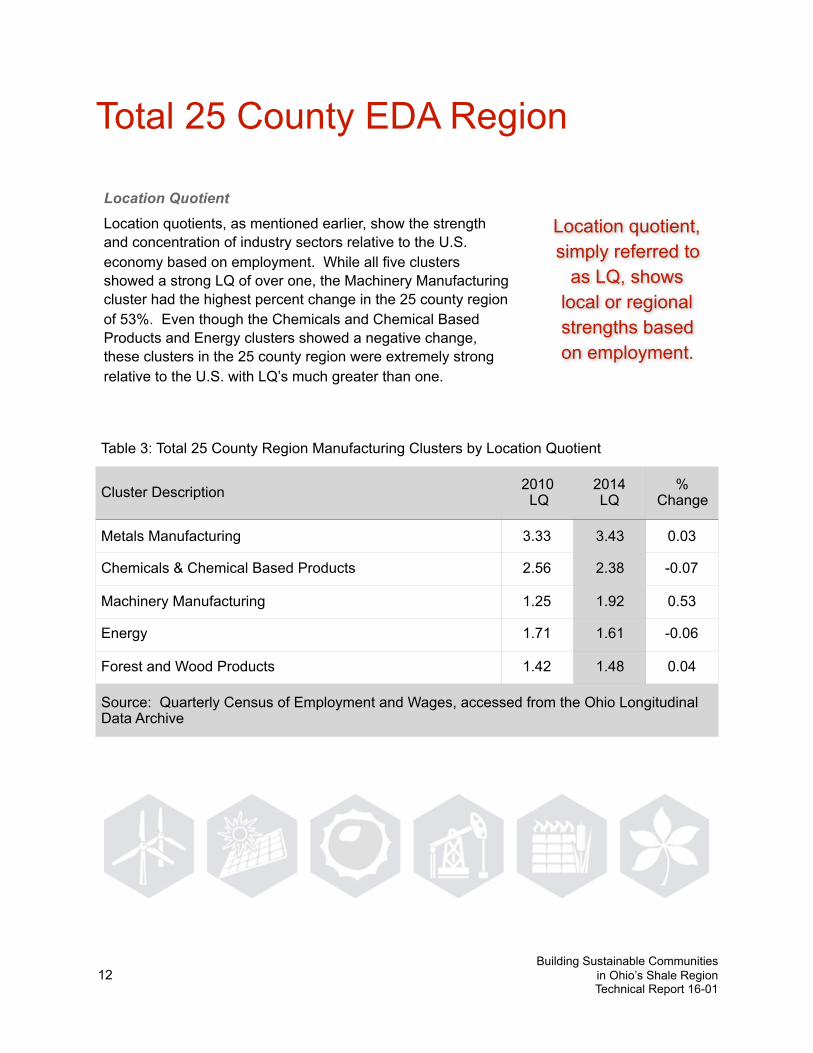
Table 3: Total 25 County Region Manufacturing Clusters by Location Quotient
Cluster Description 2010 LQ
2014 LQ
% Change
Metals Manufacturing 3.33 3.43 0.03
Chemicals & Chemical Based Products 2.56 2.38 -0.07
Machinery Manufacturing 1.25 1.92 0.53
Energy 1.71 1.61 -0.06
Forest and Wood Products 1.42 1.48 0.04
Source: Quarterly Census of Employment and Wages, accessed from the Ohio Longitudinal Data Archive
Location Quotient Location quotients, as mentioned earlier, show the strength and concentration of industry sectors relative to the U.S. economy based on employment. While all five clusters showed a strong LQ of over one, the Machinery Manufacturing cluster had the highest percent change in the 25 county region of 53%. Even though the Chemicals and Chemical Based Products and Energy clusters showed a negative change, these clusters in the 25 county region were extremely strong relative to the U.S. with LQ’s much greater than one.
Location quotient, simply referred to
as LQ, shows local or regional strengths based on employment.
Building Sustainable Communities ! in Ohio’s Shale Region 13
Technical Report 16-01
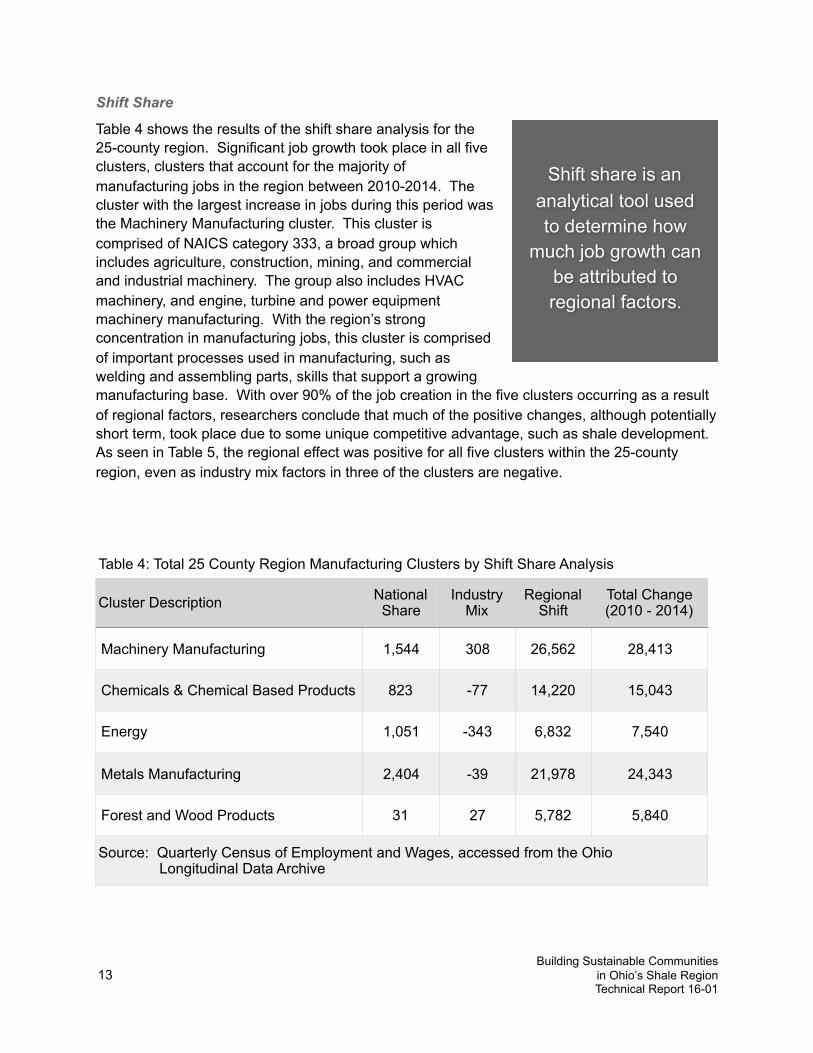
Table 4: Total 25 County Region Manufacturing Clusters by Shift Share Analysis
Cluster Description National Share
Industry Mix
Regional Shift
Total Change (2010 - 2014)
Machinery Manufacturing 1,544 308 26,562 28,413
Chemicals & Chemical Based Products 823 -77 14,220 15,043
Energy 1,051 -343 6,832 7,540
Metals Manufacturing 2,404 -39 21,978 24,343
Forest and Wood Products 31 27 5,782 5,840
Source: Quarterly Census of Employment and Wages, accessed from the Ohio Longitudinal Data Archive
Shift Share
Table 4 shows the results of the shift share analysis for the 25-county region. Significant job growth took place in all five clusters, clusters that account for the majority of manufacturing jobs in the region between 2010-2014. The cluster with the largest increase in jobs during this period was the Machinery Manufacturing cluster. This cluster is comprised of NAICS category 333, a broad group which includes agriculture, construction, mining, and commercial and industrial machinery. The group also includes HVAC machinery, and engine, turbine and power equipment machinery manufacturing. With the region’s strong concentration in manufacturing jobs, this cluster is comprised of important processes used in manufacturing, such as welding and assembling parts, skills that support a growing manufacturing base. With over 90% of the job creation in the five clusters occurring as a result of regional factors, researchers conclude that much of the positive changes, although potentially short term, took place due to some unique competitive advantage, such as shale development. As seen in Table 5, the regional effect was positive for all five clusters within the 25-county region, even as industry mix factors in three of the clusters are negative.
Shift share is an analytical tool used to determine how
much job growth can be attributed to regional factors.
Building Sustainable Communities ! in Ohio’s Shale Region 14
Technical Report 16-01
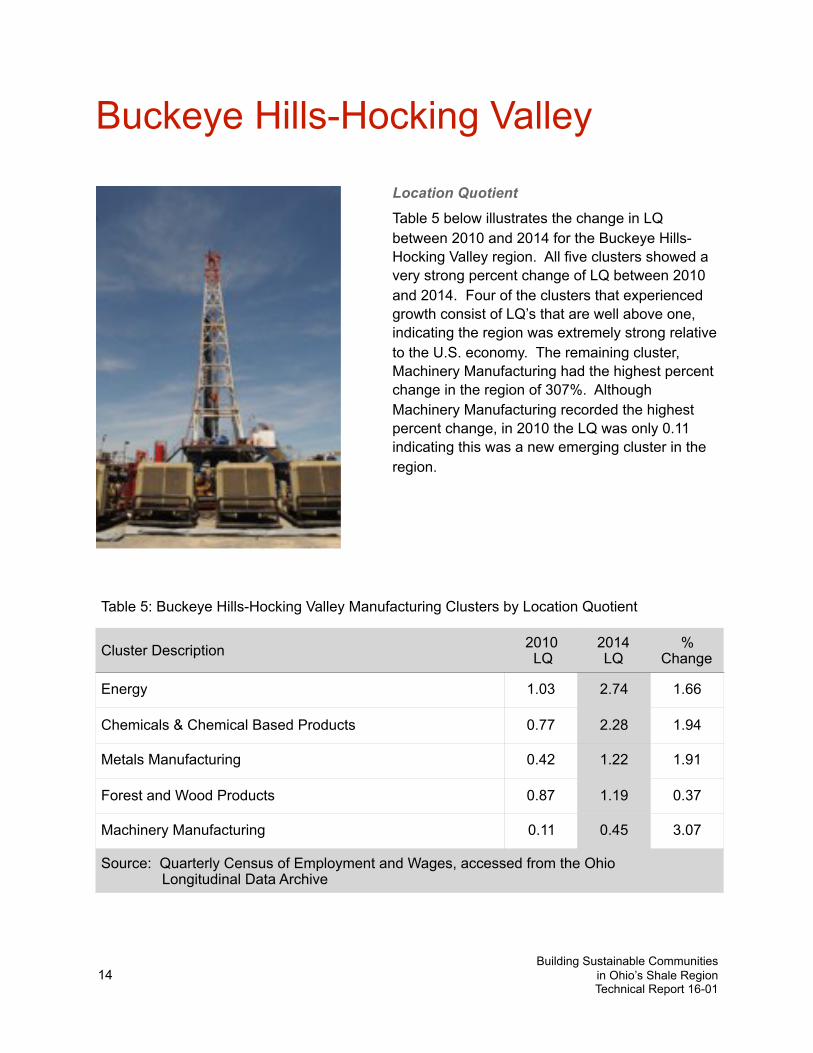
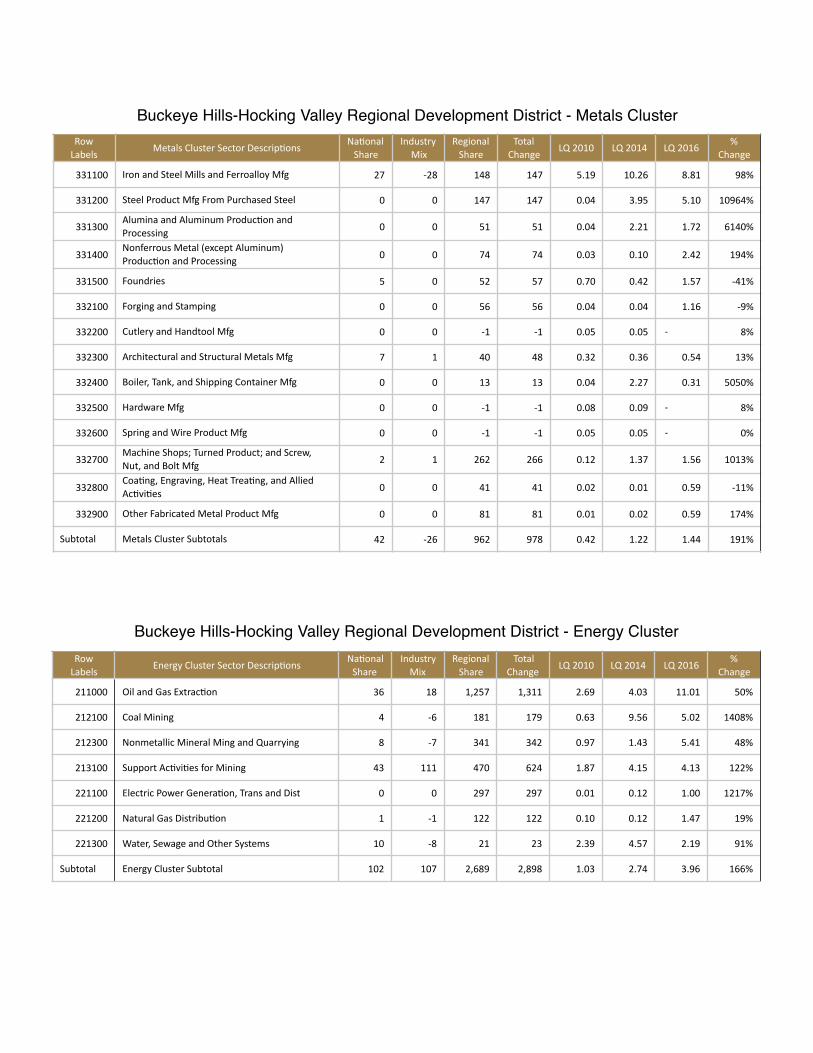
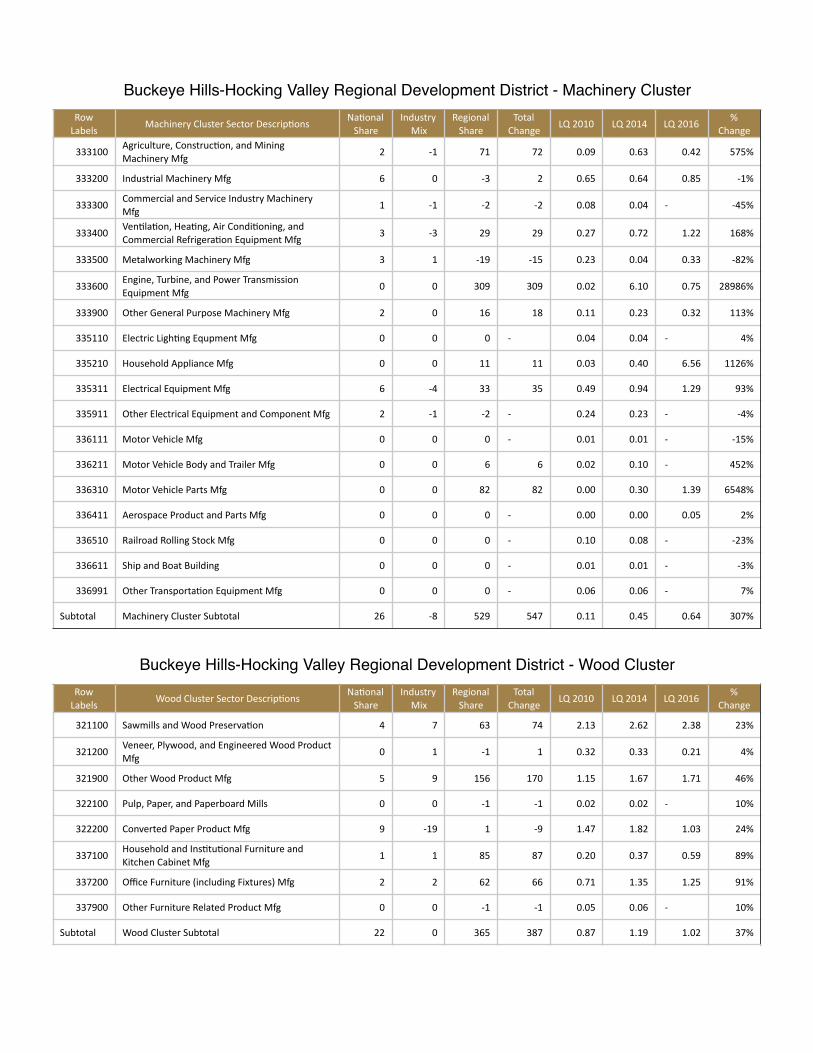
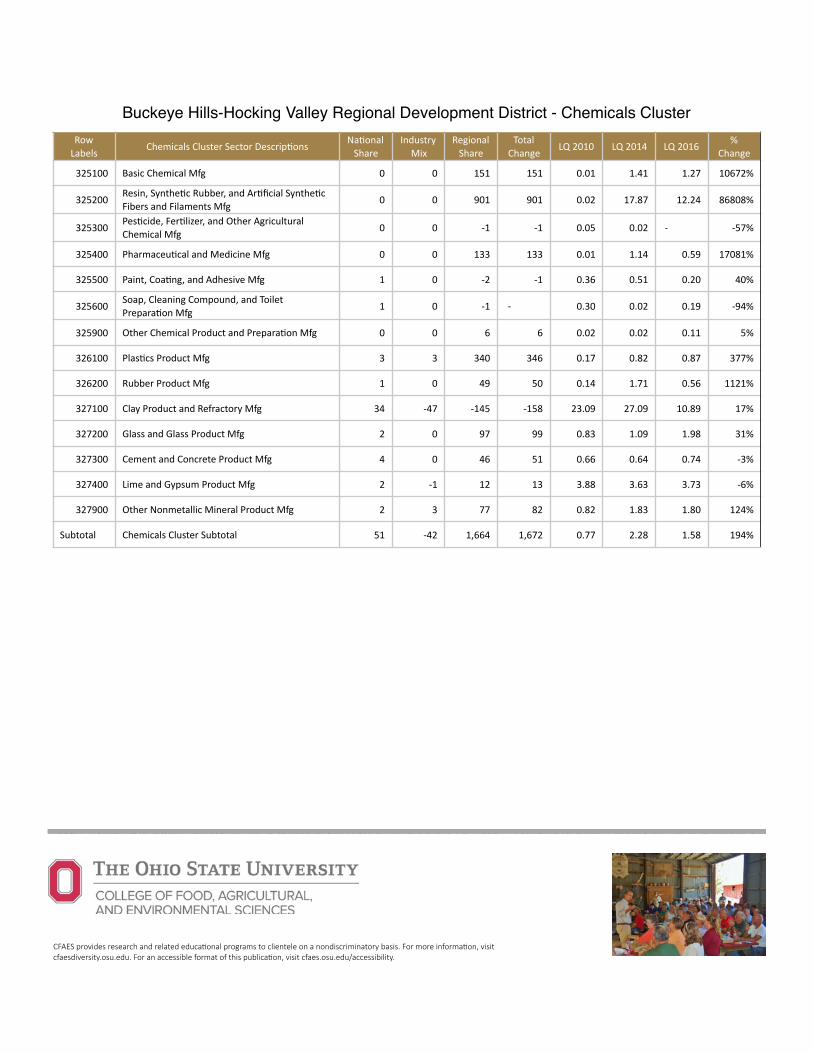
Buckeye Hills-Hocking Valley
Table 5: Buckeye Hills-Hocking Valley Manufacturing Clusters by Location Quotient
Cluster Description 2010 LQ
2014 LQ
% Change
Energy 1.03 2.74 1.66
Chemicals & Chemical Based Products 0.77 2.28 1.94
Metals Manufacturing 0.42 1.22 1.91
Forest and Wood Products 0.87 1.19 0.37
Machinery Manufacturing 0.11 0.45 3.07
Source: Quarterly Census of Employment and Wages, accessed from the Ohio Longitudinal Data Archive
Location Quotient Table 5 below illustrates the change in LQ between 2010 and 2014 for the Buckeye Hills-Hocking Valley region. All five clusters showed a very strong percent change of LQ between 2010 and 2014. Four of the clusters that experienced growth consist of LQ’s that are well above one, indicating the region was extremely strong relative to the U.S. economy. The remaining cluster, Machinery Manufacturing had the highest percent change in the region of 307%. Although Machinery Manufacturing recorded the highest percent change, in 2010 the LQ was only 0.11 indicating this was a new emerging cluster in the region.
Building Sustainable Communities ! in Ohio’s Shale Region 15
Technical Report 16-01
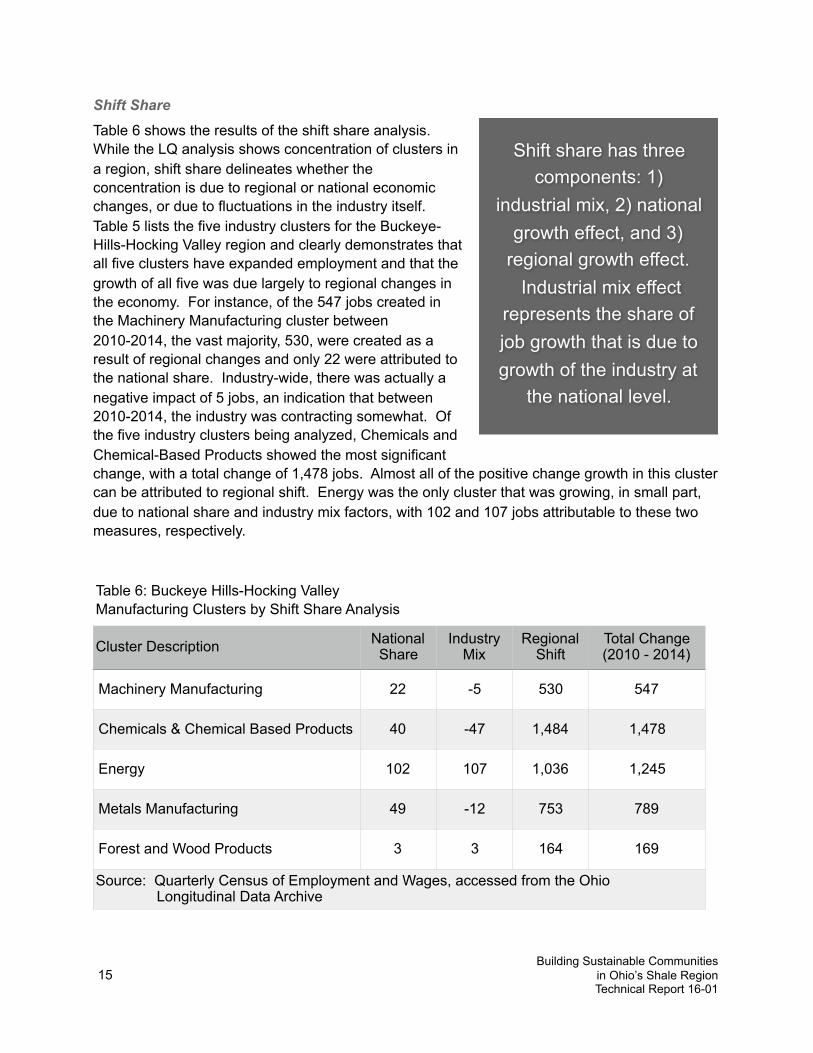
Table 6: Buckeye Hills-Hocking Valley Manufacturing Clusters by Shift Share Analysis
Cluster Description National Share
Industry Mix
Regional Shift
Total Change (2010 - 2014)
Machinery Manufacturing 22 -5 530 547
Chemicals & Chemical Based Products 40 -47 1,484 1,478
Energy 102 107 1,036 1,245
Metals Manufacturing 49 -12 753 789
Forest and Wood Products 3 3 164 169
Source: Quarterly Census of Employment and Wages, accessed from the Ohio Longitudinal Data Archive
Shift Share Table 6 shows the results of the shift share analysis. While the LQ analysis shows concentration of clusters in a region, shift share delineates whether the concentration is due to regional or national economic changes, or due to fluctuations in the industry itself. Table 5 lists the five industry clusters for the Buckeye-Hills-Hocking Valley region and clearly demonstrates that all five clusters have expanded employment and that the growth of all five was due largely to regional changes in the economy. For instance, of the 547 jobs created in the Machinery Manufacturing cluster between 2010-2014, the vast majority, 530, were created as a result of regional changes and only 22 were attributed to the national share. Industry-wide, there was actually a negative impact of 5 jobs, an indication that between 2010-2014, the industry was contracting somewhat. Of the five industry clusters being analyzed, Chemicals and Chemical-Based Products showed the most significant change, with a total change of 1,478 jobs. Almost all of the positive change growth in this cluster can be attributed to regional shift. Energy was the only cluster that was growing, in small part, due to national share and industry mix factors, with 102 and 107 jobs attributable to these two measures, respectively.
Shift share has three components: 1)
industrial mix, 2) national growth effect, and 3)
regional growth effect. Industrial mix effect
represents the share of job growth that is due to growth of the industry at
the national level.
Building Sustainable Communities ! in Ohio’s Shale Region 16
Technical Report 16-01
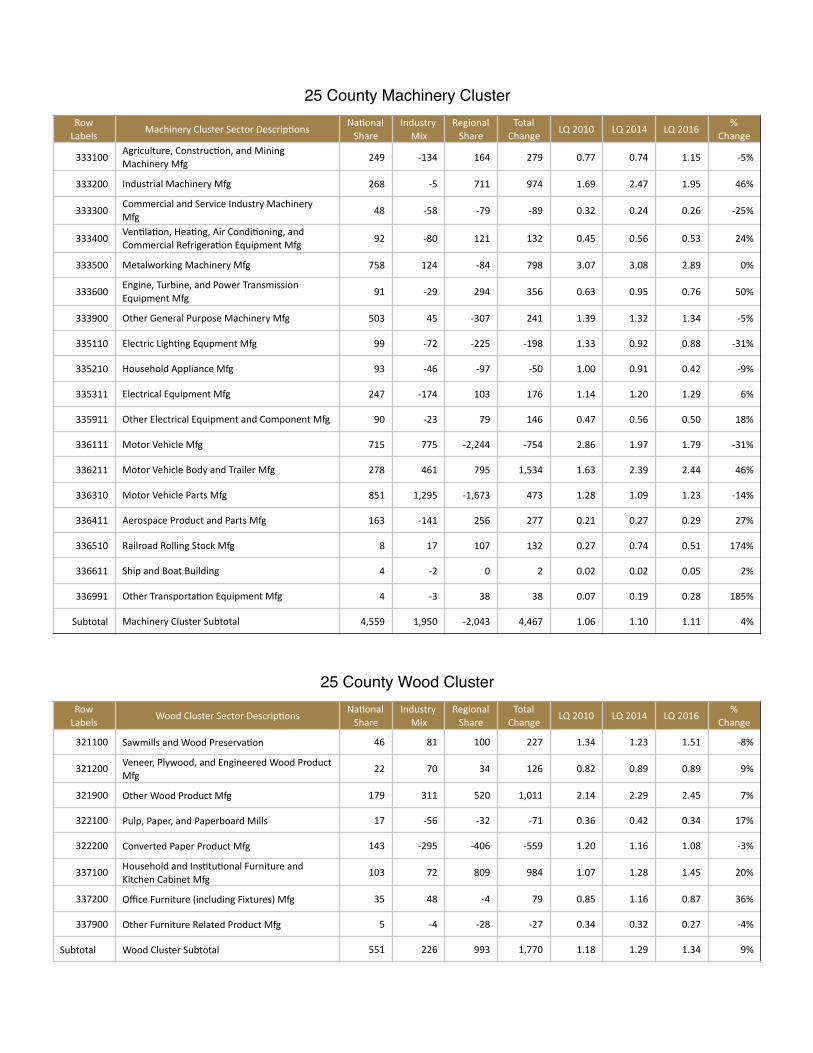
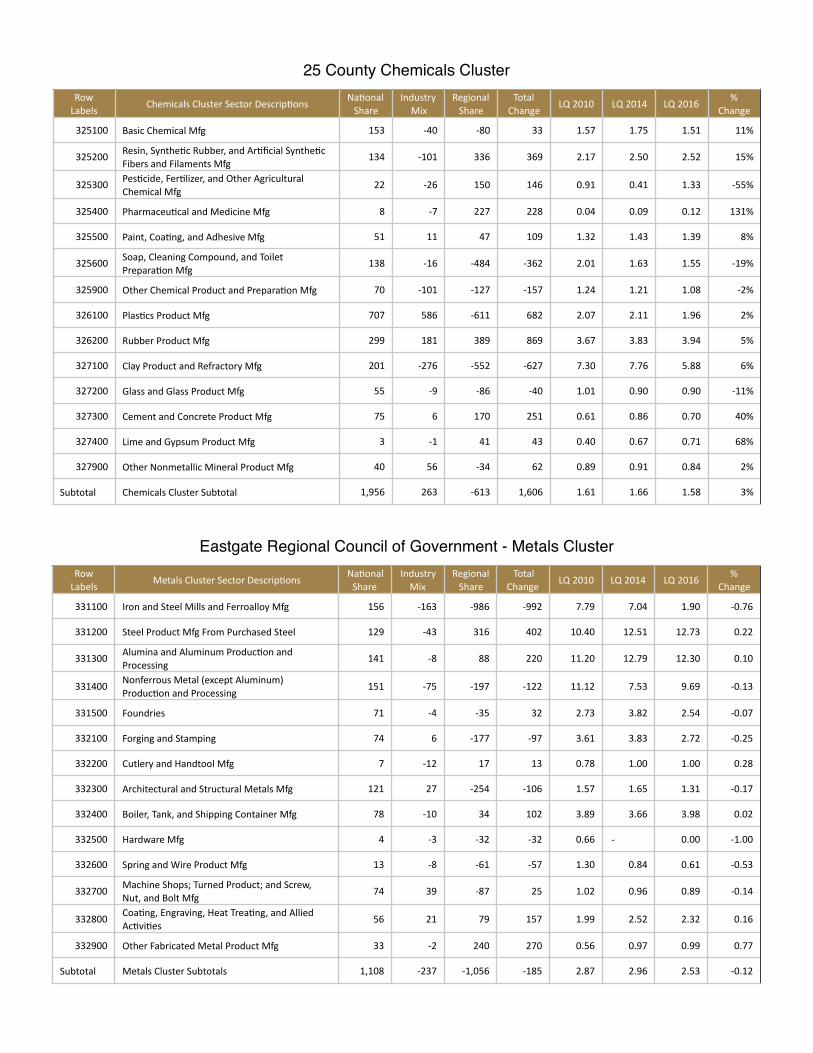
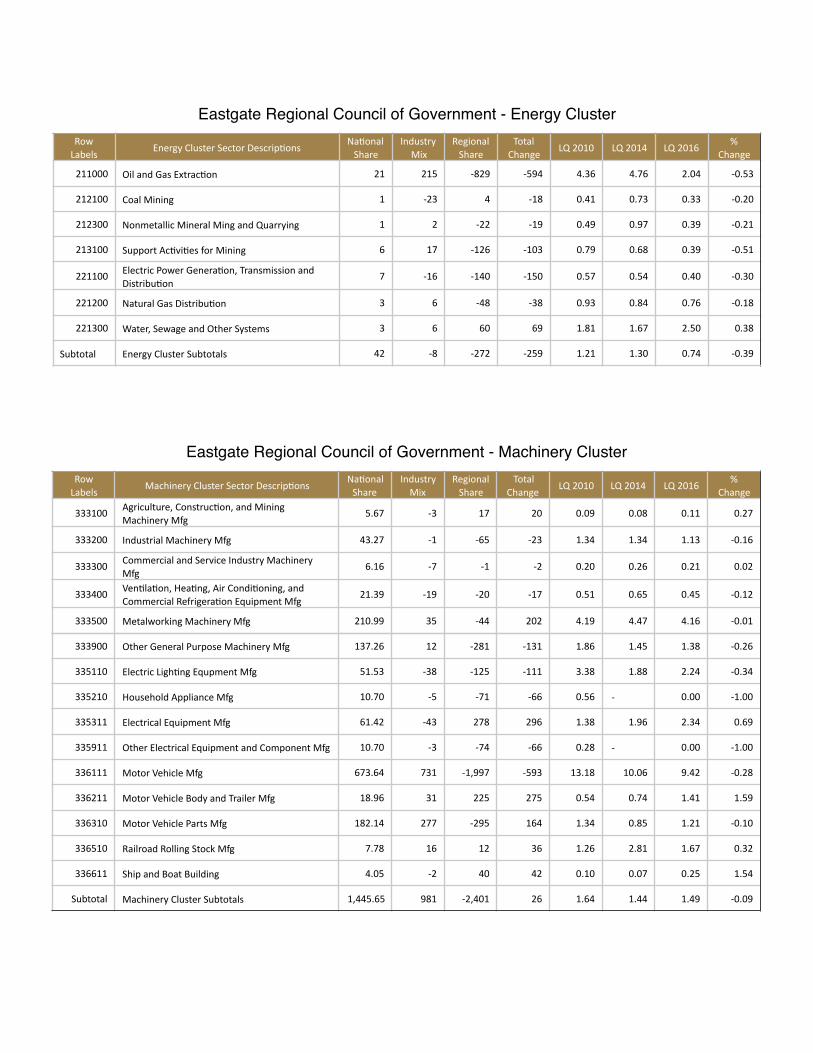
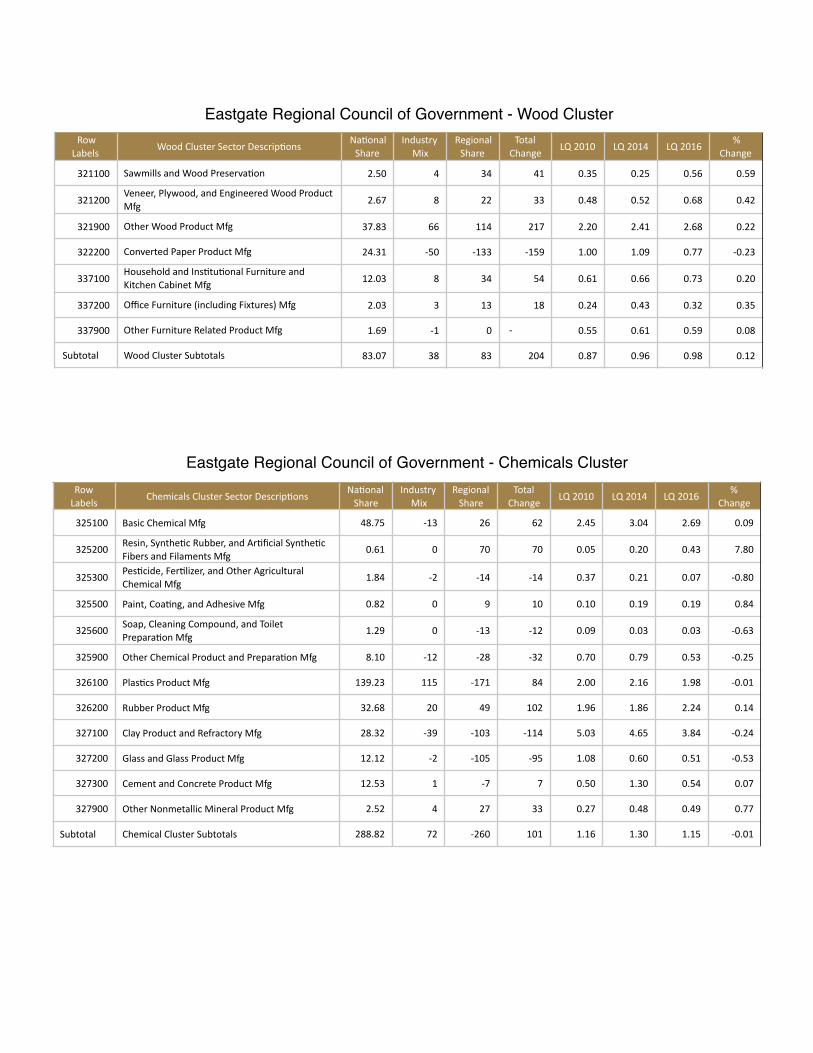
Eastgate Regional Council of Government
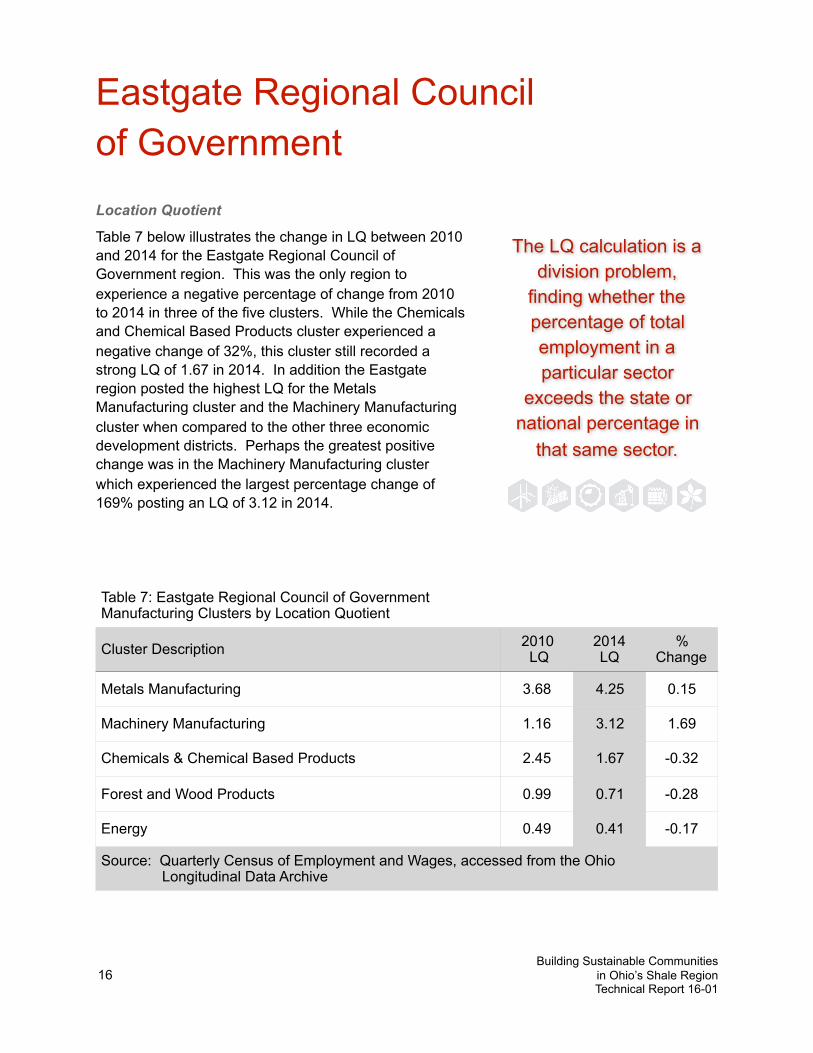
Table 7: Eastgate Regional Council of Government Manufacturing Clusters by Location Quotient
Cluster Description 2010 LQ
2014 LQ
% Change
Metals Manufacturing 3.68 4.25 0.15
Machinery Manufacturing 1.16 3.12 1.69
Chemicals & Chemical Based Products 2.45 1.67 -0.32
Forest and Wood Products 0.99 0.71 -0.28
Energy 0.49 0.41 -0.17
Source: Quarterly Census of Employment and Wages, accessed from the Ohio Longitudinal Data Archive
Location Quotient
Table 7 below illustrates the change in LQ between 2010 and 2014 for the Eastgate Regional Council of Government region. This was the only region to experience a negative percentage of change from 2010 to 2014 in three of the five clusters. While the Chemicals and Chemical Based Products cluster experienced a negative change of 32%, this cluster still recorded a strong LQ of 1.67 in 2014. In addition the Eastgate region posted the highest LQ for the Metals Manufacturing cluster and the Machinery Manufacturing cluster when compared to the other three economic development districts. Perhaps the greatest positive change was in the Machinery Manufacturing cluster which experienced the largest percentage change of 169% posting an LQ of 3.12 in 2014.
The LQ calculation is a division problem,
finding whether the percentage of total employment in a particular sector
exceeds the state or national percentage in
that same sector.
Building Sustainable Communities ! in Ohio’s Shale Region 17
Technical Report 16-01
Table 8: Eastgate Regional Council of Government Manufacturing Clusters by Shift Share Analysis
Cluster Description National Share
Industry Mix
Regional Shift
Total Change (2010 - 2014)
Machinery Manufacturing 274 2 11,273 11,550
Chemicals & Chemical Based Products 151 85 1,538 1,604
Energy 58 1 359 419
Metals Manufacturing 510 1 6,809 7,320
Forest and Wood Products 4 5 423 432
Source: Quarterly Census of Employment and Wages, accessed from the Ohio Longitudinal Data Archive
Shift Share
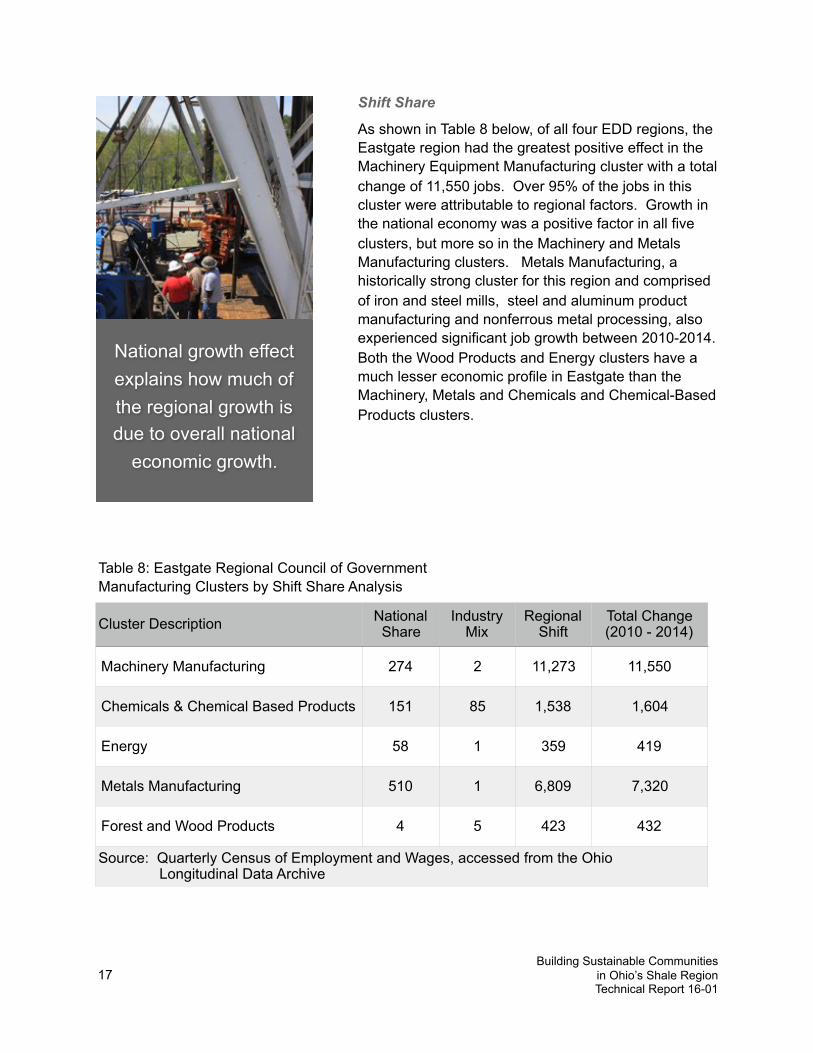
As shown in Table 8 below, of all four EDD regions, the Eastgate region had the greatest positive effect in the Machinery Equipment Manufacturing cluster with a total change of 11,550 jobs. Over 95% of the jobs in this cluster were attributable to regional factors. Growth in the national economy was a positive factor in all five clusters, but more so in the Machinery and Metals Manufacturing clusters. Metals Manufacturing, a historically strong cluster for this region and comprised of iron and steel mills, steel and aluminum product manufacturing and nonferrous metal processing, also experienced significant job growth between 2010-2014. Both the Wood Products and Energy clusters have a much lesser economic profile in Eastgate than the Machinery, Metals and Chemicals and Chemical-Based Products clusters.
National growth effect explains how much of the regional growth is due to overall national
economic growth.
Building Sustainable Communities ! in Ohio’s Shale Region 18
Technical Report 16-01
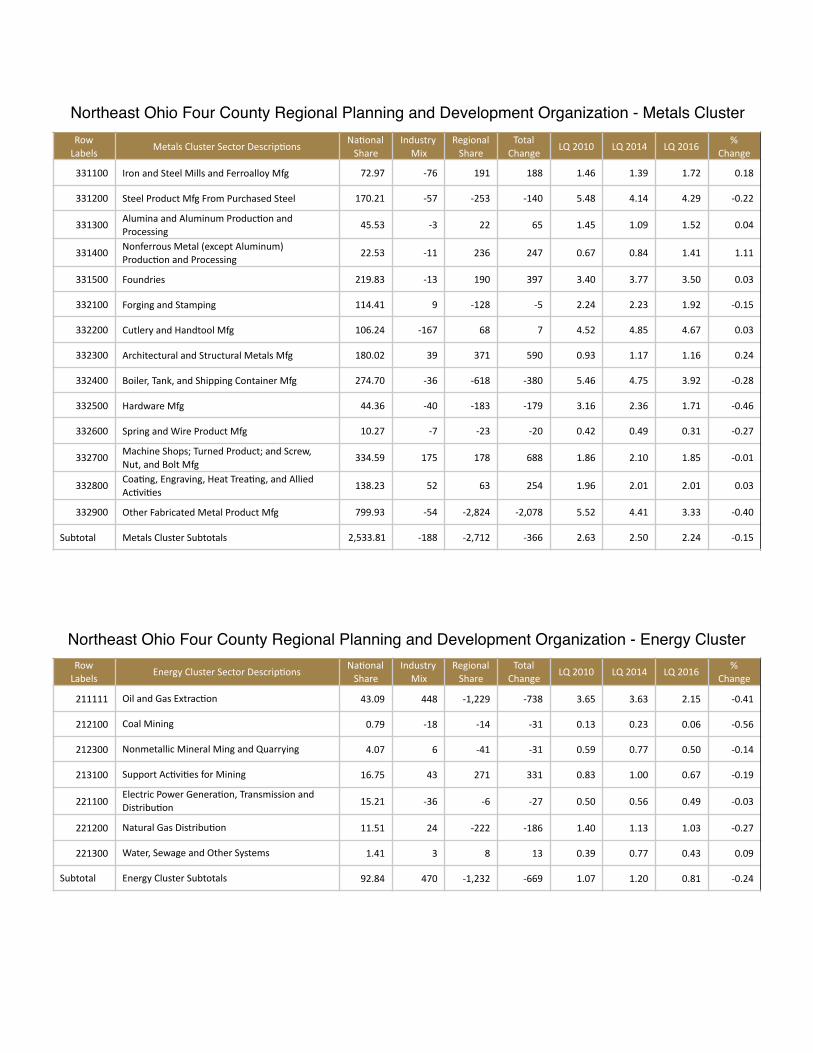
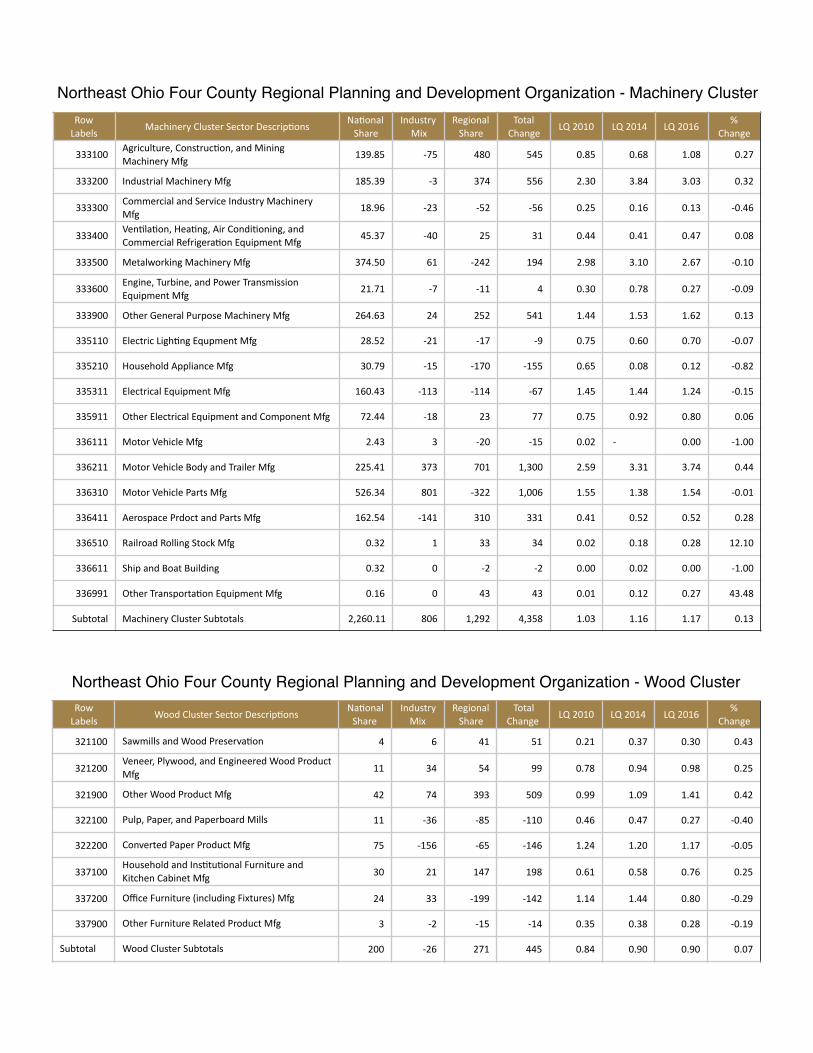
Northeast Ohio Four County Regional Planning and Development
Table 9: Northeast Ohio Four County Regional Planning and Development Organization Manufacturing Clusters by Location Quotient
Cluster Description 2010 LQ
2014 LQ
% Change
Metals Manufacturing 3.07 3.73 0.22
Chemicals & Chemical Based Products 2.84 2.54 -0.11
Machinery Manufacturing 1.49 1.57 0.05
Energy 1.28 1.55 0.21
Forest and Wood Products 1.01 1.09 0.08
Source: Quarterly Census of Employment and Wages, accessed from the Ohio Longitudinal Data Archive
Location Quotient
Table 9 below illustrates the change in LQ between 2010 and 2014 for the Northeast Ohio Four County Regional Planning and Development Organization region. It appears this region experienced steady and consistent growth anchored by the Metals Manufacturing and Chemicals and Chemical Based Products clusters. While it was the only region that did not have a cluster enjoy a percentage growth change of more than 100%, all five of the clusters analyzed yielded an LQ greater than one in 2014. Furthermore, even though the Chemicals and Chemical Based Products cluster indicated a negative change of 11%, this cluster still had an LQ of 2.54 which was extremely strong relative to the U.S. economy.
Do-it-yourself LQ calculators are available on the internet, on the Bureau of Labor Statistics website,
or StatsAmerica (www.statsamerica.org), which is a service of the
Indiana Business Research Center.
Building Sustainable Communities ! in Ohio’s Shale Region 19
Technical Report 16-01
Shift Share
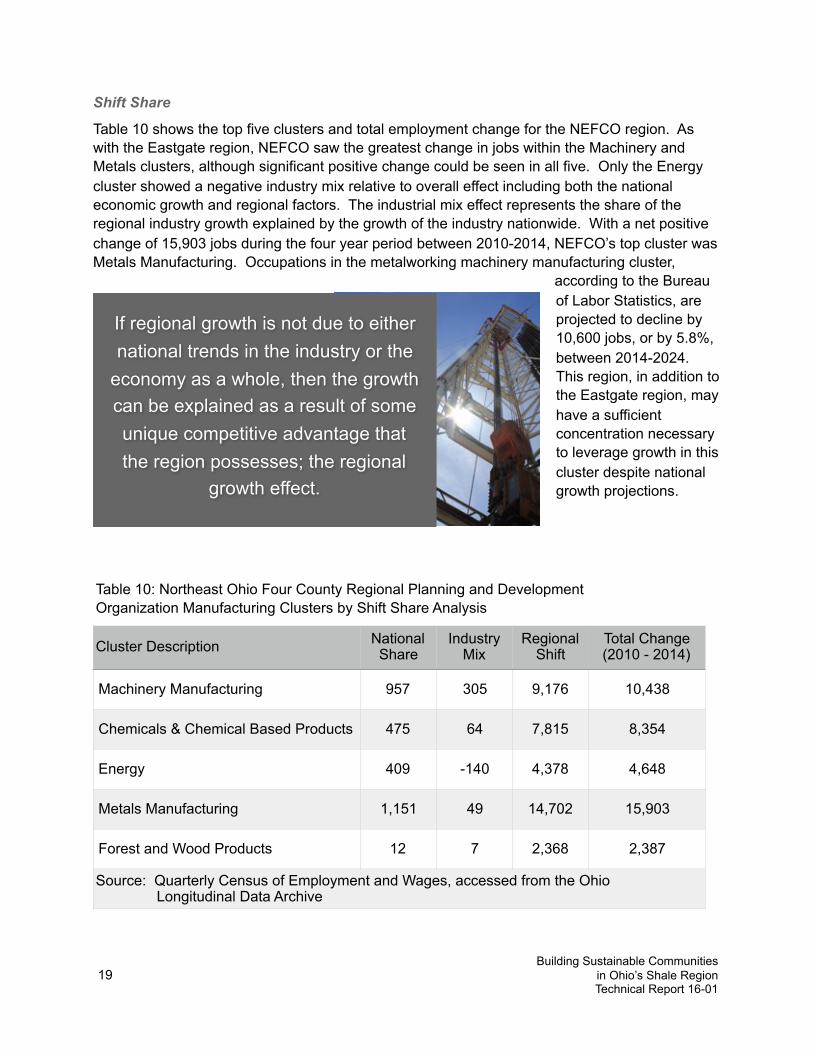
Table 10 shows the top five clusters and total employment change for the NEFCO region. As with the Eastgate region, NEFCO saw the greatest change in jobs within the Machinery and Metals clusters, although significant positive change could be seen in all five. Only the Energy cluster showed a negative industry mix relative to overall effect including both the national economic growth and regional factors. The industrial mix effect represents the share of the regional industry growth explained by the growth of the industry nationwide. With a net positive change of 15,903 jobs during the four year period between 2010-2014, NEFCO’s top cluster was Metals Manufacturing. Occupations in the metalworking machinery manufacturing cluster,
according to the Bureau of Labor Statistics, are projected to decline by 10,600 jobs, or by 5.8%, between 2014-2024. This region, in addition to the Eastgate region, may have a sufficient concentration necessary to leverage growth in this cluster despite national growth projections.
Table 10: Northeast Ohio Four County Regional Planning and Development Organization Manufacturing Clusters by Shift Share Analysis
Cluster Description National Share
Industry Mix
Regional Shift
Total Change (2010 - 2014)
Machinery Manufacturing 957 305 9,176 10,438
Chemicals & Chemical Based Products 475 64 7,815 8,354
Energy 409 -140 4,378 4,648
Metals Manufacturing 1,151 49 14,702 15,903
Forest and Wood Products 12 7 2,368 2,387
Source: Quarterly Census of Employment and Wages, accessed from the Ohio Longitudinal Data Archive
If regional growth is not due to either national trends in the industry or the
economy as a whole, then the growth can be explained as a result of some unique competitive advantage that the region possesses; the regional
growth effect.
Building Sustainable Communities ! in Ohio’s Shale Region 20
Technical Report 16-01
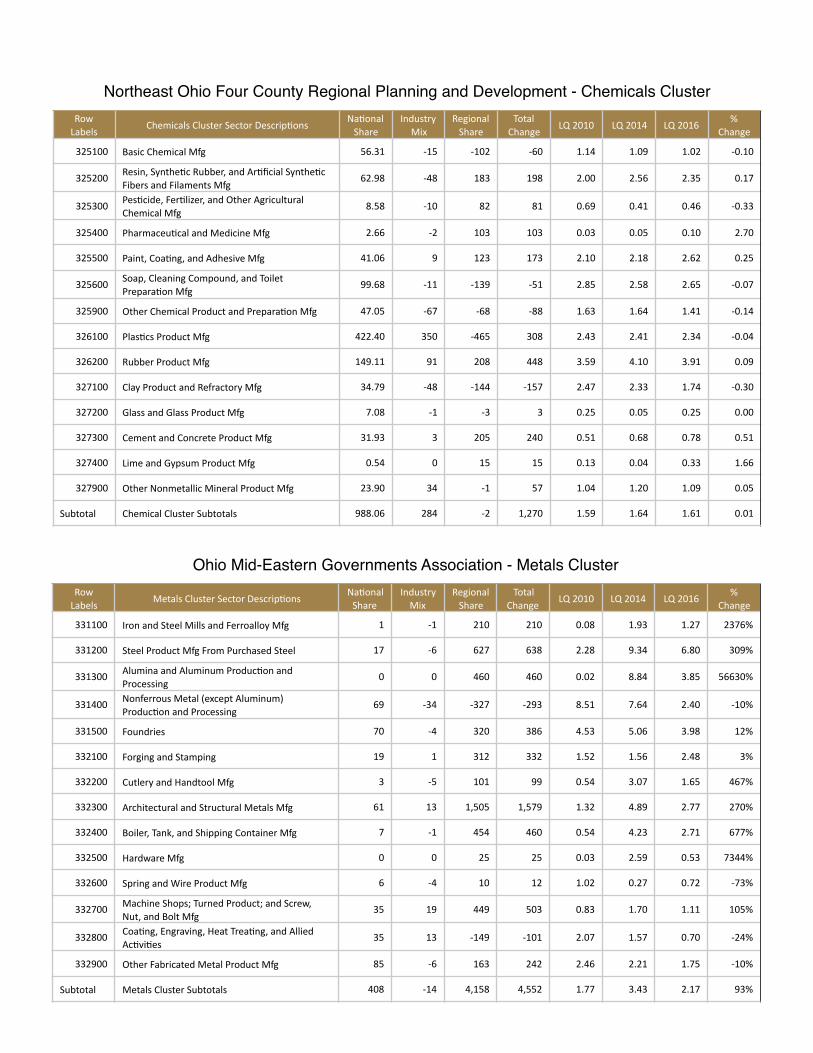
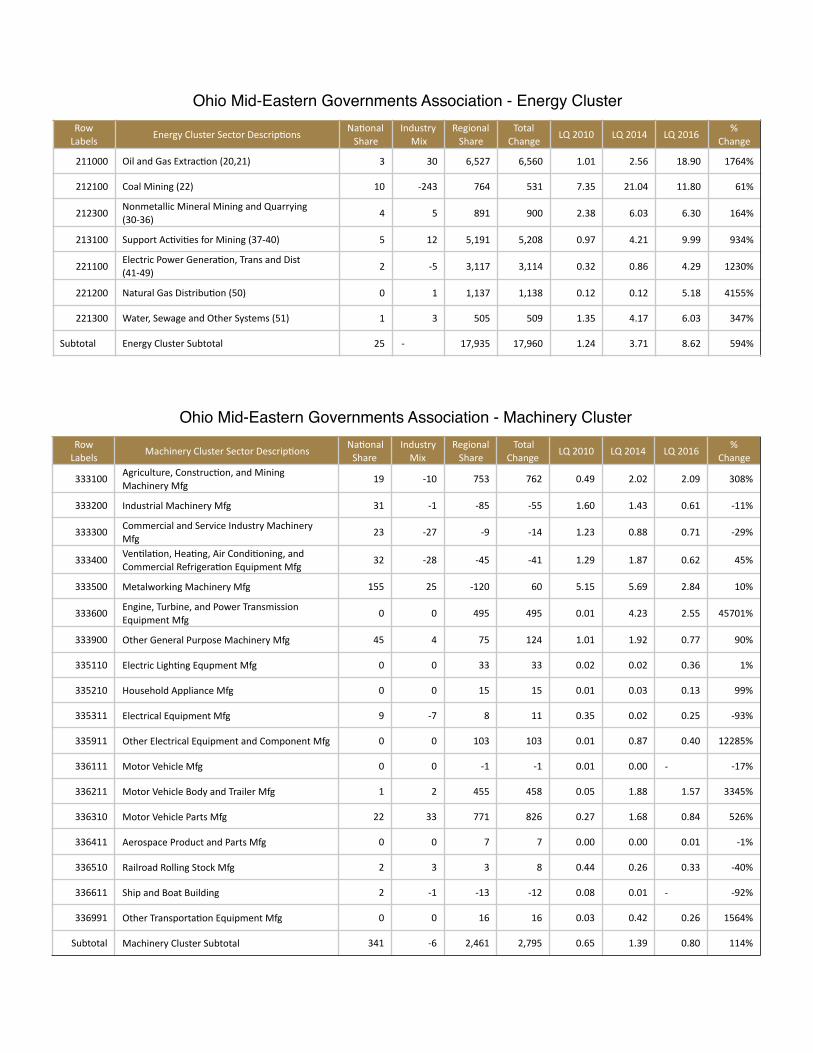
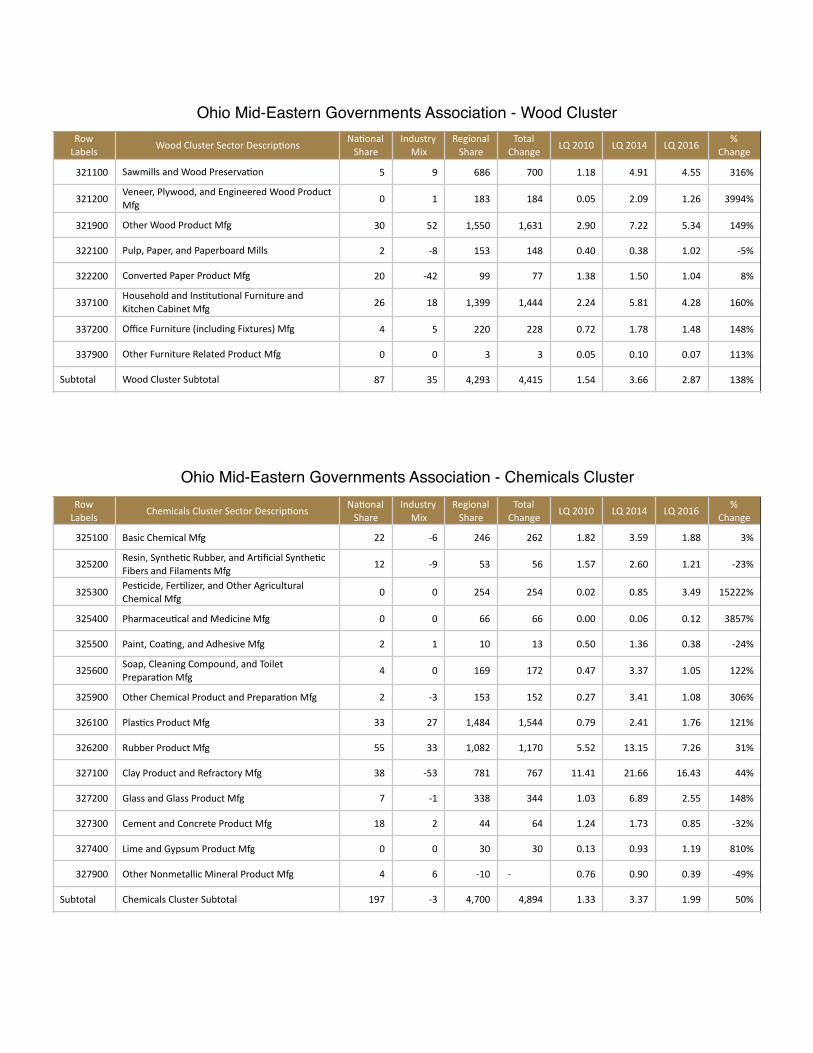
Ohio Mid-Eastern Governments Association
Table 11: Ohio Mid-Eastern Governments Association Manufacturing Clusters by Location Quotient
Cluster Description 2010 LQ
2014 LQ
% Change
Energy 1.24 3.71 1.99
Forest and Wood Products 1.54 3.66 1.38
Metals Manufacturing 1.77 3.43 0.93
Chemicals & Chemical Based Products 1.33 3.37 1.53
Machinery Manufacturing 0.73 1.61 1.2
Source: Quarterly Census of Employment and Wages, accessed from the Ohio Longitudinal Data Archive
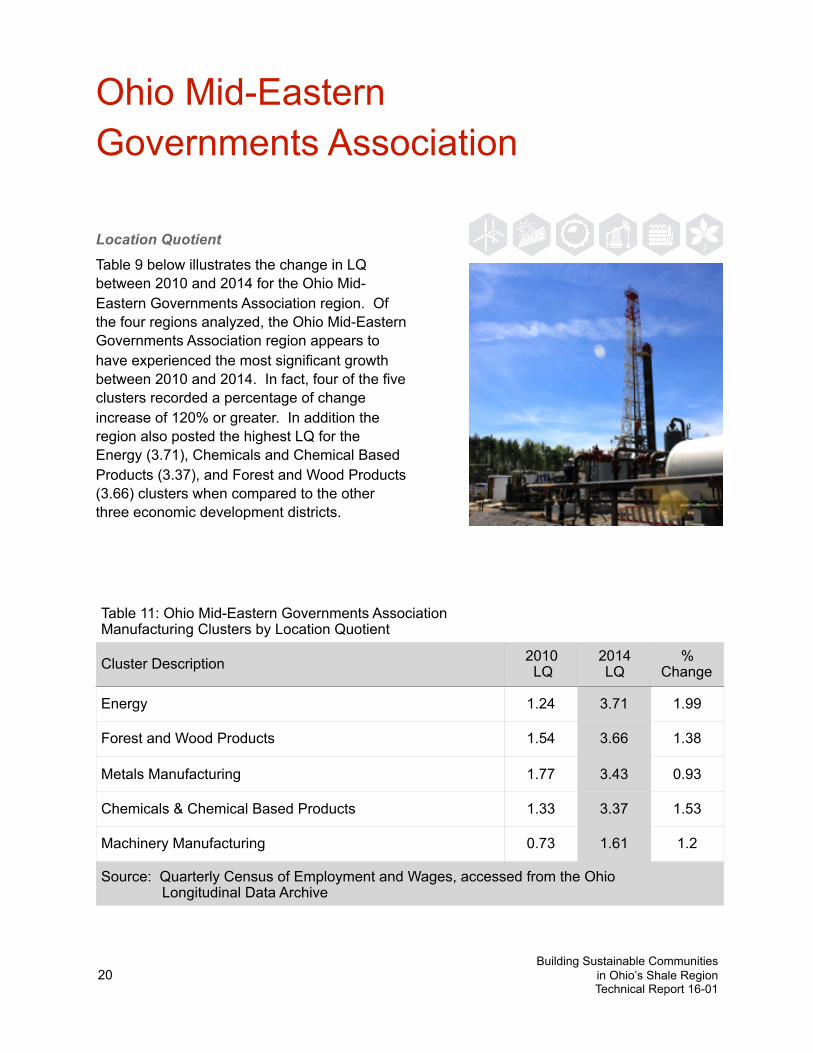
Location Quotient Table 9 below illustrates the change in LQ between 2010 and 2014 for the Ohio Mid-Eastern Governments Association region. Of the four regions analyzed, the Ohio Mid-Eastern Governments Association region appears to have experienced the most significant growth between 2010 and 2014. In fact, four of the five clusters recorded a percentage of change increase of 120% or greater. In addition the region also posted the highest LQ for the Energy (3.71), Chemicals and Chemical Based Products (3.37), and Forest and Wood Products (3.66) clusters when compared to the other three economic development districts.
Building Sustainable Communities ! in Ohio’s Shale Region 21
Technical Report 16-01
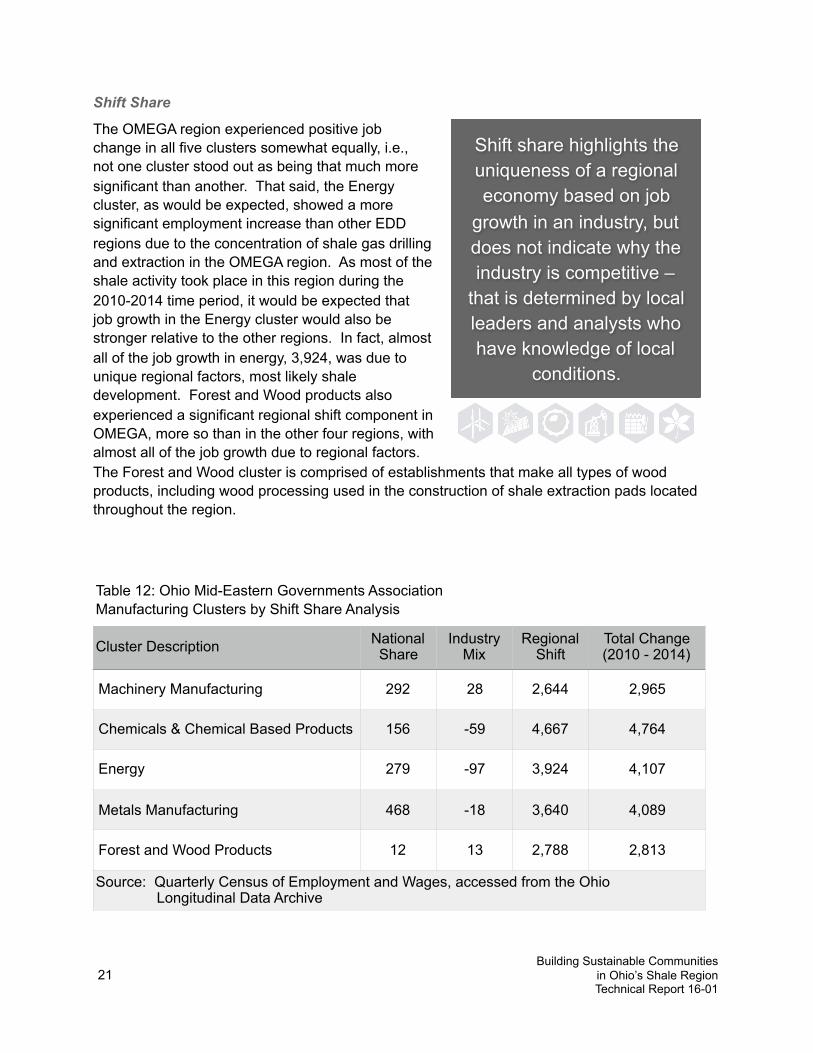
Table 12: Ohio Mid-Eastern Governments Association Manufacturing Clusters by Shift Share Analysis
Cluster Description National Share
Industry Mix
Regional Shift
Total Change (2010 - 2014)
Machinery Manufacturing 292 28 2,644 2,965
Chemicals & Chemical Based Products 156 -59 4,667 4,764
Energy 279 -97 3,924 4,107
Metals Manufacturing 468 -18 3,640 4,089
Forest and Wood Products 12 13 2,788 2,813
Source: Quarterly Census of Employment and Wages, accessed from the Ohio Longitudinal Data Archive
Shift Share
The OMEGA region experienced positive job change in all five clusters somewhat equally, i.e., not one cluster stood out as being that much more significant than another. That said, the Energy cluster, as would be expected, showed a more significant employment increase than other EDD regions due to the concentration of shale gas drilling and extraction in the OMEGA region. As most of the shale activity took place in this region during the 2010-2014 time period, it would be expected that job growth in the Energy cluster would also be stronger relative to the other regions. In fact, almost all of the job growth in energy, 3,924, was due to unique regional factors, most likely shale development. Forest and Wood products also experienced a significant regional shift component in OMEGA, more so than in the other four regions, with almost all of the job growth due to regional factors. The Forest and Wood cluster is comprised of establishments that make all types of wood products, including wood processing used in the construction of shale extraction pads located throughout the region.
Shift share highlights the uniqueness of a regional economy based on job
growth in an industry, but does not indicate why the industry is competitive –
that is determined by local leaders and analysts who have knowledge of local
conditions.
Building Sustainable Communities ! in Ohio’s Shale Region 22
Technical Report 16-01
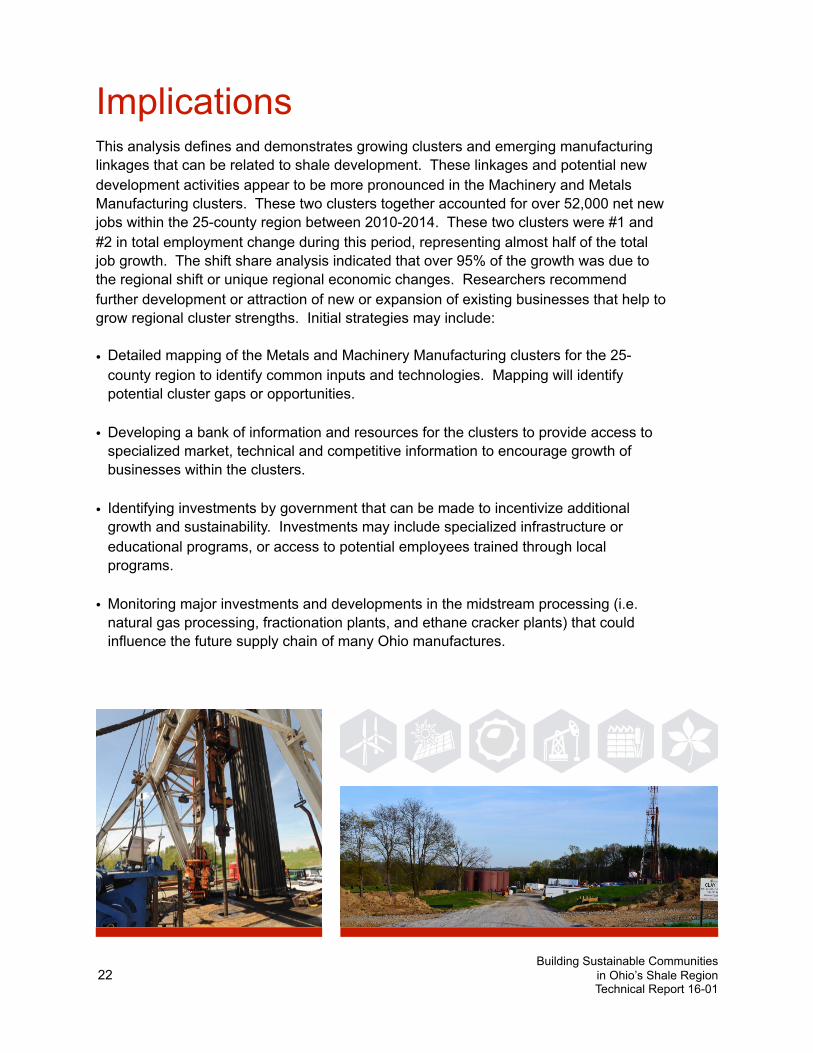
Implications This analysis defines and demonstrates growing clusters and emerging manufacturing linkages that can be related to shale development. These linkages and potential new development activities appear to be more pronounced in the Machinery and Metals Manufacturing clusters. These two clusters together accounted for over 52,000 net new jobs within the 25-county region between 2010-2014. These two clusters were #1 and #2 in total employment change during this period, representing almost half of the total job growth. The shift share analysis indicated that over 95% of the growth was due to the regional shift or unique regional economic changes. Researchers recommend further development or attraction of new or expansion of existing businesses that help to grow regional cluster strengths. Initial strategies may include:
• Detailed mapping of the Metals and Machinery Manufacturing clusters for the 25-county region to identify common inputs and technologies. Mapping will identify potential cluster gaps or opportunities.
• Developing a bank of information and resources for the clusters to provide access to specialized market, technical and competitive information to encourage growth of businesses within the clusters.
• Identifying investments by government that can be made to incentivize additional growth and sustainability. Investments may include specialized infrastructure or educational programs, or access to potential employees trained through local programs.
• Monitoring major investments and developments in the midstream processing (i.e. natural gas processing, fractionation plants, and ethane cracker plants) that could influence the future supply chain of many Ohio manufactures.
Attachment A: Shale Energy Development: Economic Impact Analysis
OHIO STATE UNIVERSITY EXTENSIONCFAES
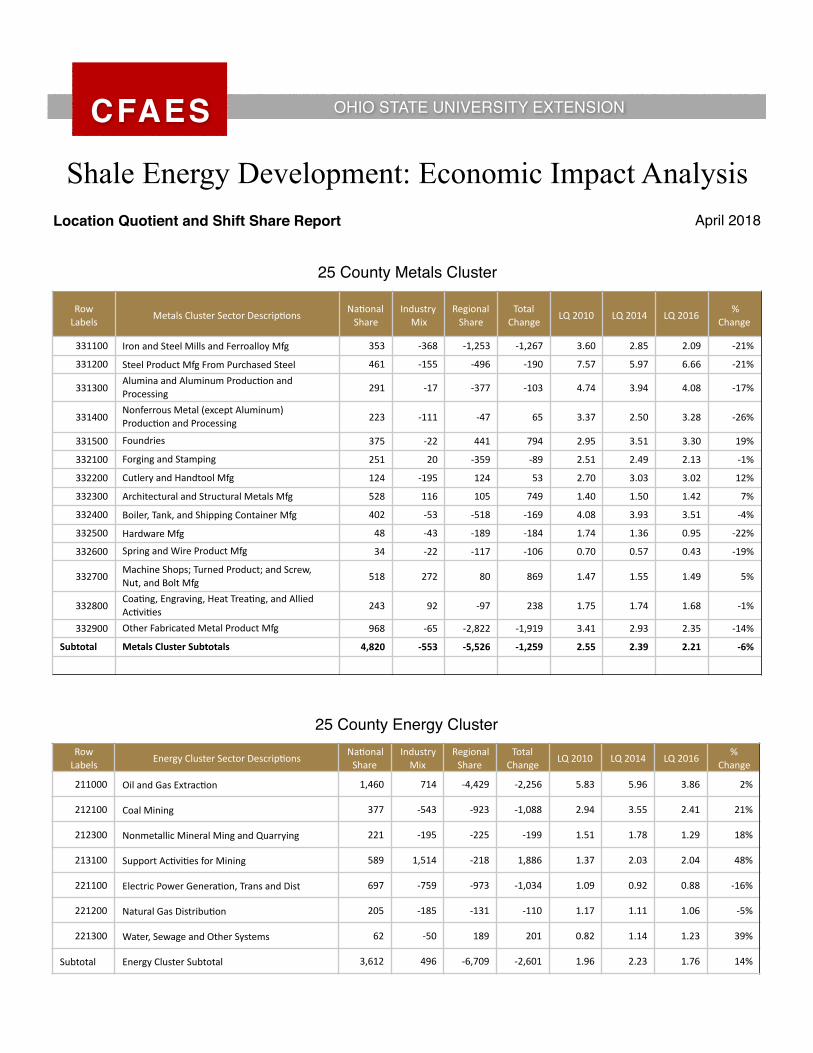
Shale Energy Development: Economic Impact AnalysisLocation Quotient and Shift Share Report April 2018
25 County Metals Cluster
RowLabels MetalsClusterSectorDescrip5ons Na5onal
ShareIndustryMix
RegionalShare
TotalChange LQ2010 LQ2014 LQ2016 %
Change
331100 IronandSteelMillsandFerroalloyMfg 353 -368 -1,253 -1,267 3.60 2.85 2.09 -21%
331200 SteelProductMfgFromPurchasedSteel 461 -155 -496 -190 7.57 5.97 6.66 -21%
331300AluminaandAluminumProduc5onandProcessing 291 -17 -377 -103 4.74 3.94 4.08 -17%
331400NonferrousMetal(exceptAluminum)Produc5onandProcessing 223 -111 -47 65 3.37 2.50 3.28 -26%
331500 Foundries 375 -22 441 794 2.95 3.51 3.30 19%
332100 ForgingandStamping 251 20 -359 -89 2.51 2.49 2.13 -1%
332200 CutleryandHandtoolMfg 124 -195 124 53 2.70 3.03 3.02 12%
332300 ArchitecturalandStructuralMetalsMfg 528 116 105 749 1.40 1.50 1.42 7%
332400 Boiler,Tank,andShippingContainerMfg 402 -53 -518 -169 4.08 3.93 3.51 -4%
332500 HardwareMfg 48 -43 -189 -184 1.74 1.36 0.95 -22%
332600 SpringandWireProductMfg 34 -22 -117 -106 0.70 0.57 0.43 -19%
332700MachineShops;TurnedProduct;andScrew,Nut,andBoltMfg 518 272 80 869 1.47 1.55 1.49 5%
332800Coa5ng,Engraving,HeatTrea5ng,andAlliedAc5vi5es 243 92 -97 238 1.75 1.74 1.68 -1%
332900 OtherFabricatedMetalProductMfg 968 -65 -2,822 -1,919 3.41 2.93 2.35 -14%
Subtotal MetalsClusterSubtotals 4,820 -553 -5,526 -1,259 2.55 2.39 2.21 -6%
25 County Energy ClusterRowLabels EnergyClusterSectorDescrip5ons Na5onal
ShareIndustryMix
RegionalShare
TotalChange LQ2010 LQ2014 LQ2016 %
Change
211000 OilandGasExtrac5on 1,460 714 -4,429 -2,256 5.83 5.96 3.86 2%
212100 CoalMining 377 -543 -923 -1,088 2.94 3.55 2.41 21%
212300 NonmetallicMineralMingandQuarrying 221 -195 -225 -199 1.51 1.78 1.29 18%
213100 SupportAc5vi5esforMining 589 1,514 -218 1,886 1.37 2.03 2.04 48%
221100 ElectricPowerGenera5on,TransandDist 697 -759 -973 -1,034 1.09 0.92 0.88 -16%
221200 NaturalGasDistribu5on 205 -185 -131 -110 1.17 1.11 1.06 -5%
221300 Water,SewageandOtherSystems 62 -50 189 201 0.82 1.14 1.23 39%
Subtotal EnergyClusterSubtotal 3,612 496 -6,709 -2,601 1.96 2.23 1.76 14%
25 County Machinery ClusterRowLabels MachineryClusterSectorDescrip5ons Na5onal
ShareIndustryMix
RegionalShare
TotalChange LQ2010 LQ2014 LQ2016 %
Change
333100Agriculture,Construc5on,andMiningMachineryMfg 249 -134 164 279 0.77 0.74 1.15 -5%
333200 IndustrialMachineryMfg 268 -5 711 974 1.69 2.47 1.95 46%
333300CommercialandServiceIndustryMachineryMfg 48 -58 -79 -89 0.32 0.24 0.26 -25%
333400Ven5la5on,Hea5ng,AirCondi5oning,andCommercialRefrigera5onEquipmentMfg 92 -80 121 132 0.45 0.56 0.53 24%
333500 MetalworkingMachineryMfg 758 124 -84 798 3.07 3.08 2.89 0%
333600Engine,Turbine,andPowerTransmissionEquipmentMfg 91 -29 294 356 0.63 0.95 0.76 50%
333900 OtherGeneralPurposeMachineryMfg 503 45 -307 241 1.39 1.32 1.34 -5%
335110 ElectricLigh5ngEqupmentMfg 99 -72 -225 -198 1.33 0.92 0.88 -31%
335210 HouseholdApplianceMfg 93 -46 -97 -50 1.00 0.91 0.42 -9%
335311 ElectricalEquipmentMfg 247 -174 103 176 1.14 1.20 1.29 6%
335911 OtherElectricalEquipmentandComponentMfg 90 -23 79 146 0.47 0.56 0.50 18%
336111 MotorVehicleMfg 715 775 -2,244 -754 2.86 1.97 1.79 -31%
336211 MotorVehicleBodyandTrailerMfg 278 461 795 1,534 1.63 2.39 2.44 46%
336310 MotorVehiclePartsMfg 851 1,295 -1,673 473 1.28 1.09 1.23 -14%
336411 AerospaceProductandPartsMfg 163 -141 256 277 0.21 0.27 0.29 27%
336510 RailroadRollingStockMfg 8 17 107 132 0.27 0.74 0.51 174%
336611 ShipandBoatBuilding 4 -2 0 2 0.02 0.02 0.05 2%
336991 OtherTransporta5onEquipmentMfg 4 -3 38 38 0.07 0.19 0.28 185%
Subtotal MachineryClusterSubtotal 4,559 1,950 -2,043 4,467 1.06 1.10 1.11 4%
25 County Wood ClusterRowLabels WoodClusterSectorDescrip5ons Na5onal
ShareIndustryMix
RegionalShare
TotalChange LQ2010 LQ2014 LQ2016 %
Change
321100 SawmillsandWoodPreserva5on 46 81 100 227 1.34 1.23 1.51 -8%
321200 Veneer,Plywood,andEngineeredWoodProductMfg
22 70 34 126 0.82 0.89 0.89 9%
321900 OtherWoodProductMfg 179 311 520 1,011 2.14 2.29 2.45 7%
322100 Pulp,Paper,andPaperboardMills 17 -56 -32 -71 0.36 0.42 0.34 17%
322200 ConvertedPaperProductMfg 143 -295 -406 -559 1.20 1.16 1.08 -3%
337100 HouseholdandIns5tu5onalFurnitureandKitchenCabinetMfg
103 72 809 984 1.07 1.28 1.45 20%
337200 OfficeFurniture(includingFixtures)Mfg 35 48 -4 79 0.85 1.16 0.87 36%
337900 OtherFurnitureRelatedProductMfg 5 -4 -28 -27 0.34 0.32 0.27 -4%
Subtotal WoodClusterSubtotal 551 226 993 1,770 1.18 1.29 1.34 9%
25 County Chemicals ClusterRowLabels ChemicalsClusterSectorDescrip5ons Na5onal
ShareIndustryMix
RegionalShare
TotalChange LQ2010 LQ2014 LQ2016 %
Change
325100 BasicChemicalMfg 153 -40 -80 33 1.57 1.75 1.51 11%
325200 Resin,Synthe5cRubber,andAr5ficialSynthe5cFibersandFilamentsMfg
134 -101 336 369 2.17 2.50 2.52 15%
325300 Pes5cide,Fer5lizer,andOtherAgriculturalChemicalMfg
22 -26 150 146 0.91 0.41 1.33 -55%
325400 Pharmaceu5calandMedicineMfg 8 -7 227 228 0.04 0.09 0.12 131%
325500 Paint,Coa5ng,andAdhesiveMfg 51 11 47 109 1.32 1.43 1.39 8%
325600 Soap,CleaningCompound,andToiletPrepara5onMfg
138 -16 -484 -362 2.01 1.63 1.55 -19%
325900 OtherChemicalProductandPrepara5onMfg 70 -101 -127 -157 1.24 1.21 1.08 -2%
326100 Plas5csProductMfg 707 586 -611 682 2.07 2.11 1.96 2%
326200 RubberProductMfg 299 181 389 869 3.67 3.83 3.94 5%
327100 ClayProductandRefractoryMfg 201 -276 -552 -627 7.30 7.76 5.88 6%
327200 GlassandGlassProductMfg 55 -9 -86 -40 1.01 0.90 0.90 -11%
327300 CementandConcreteProductMfg 75 6 170 251 0.61 0.86 0.70 40%
327400 LimeandGypsumProductMfg 3 -1 41 43 0.40 0.67 0.71 68%
327900 OtherNonmetallicMineralProductMfg 40 56 -34 62 0.89 0.91 0.84 2%
Subtotal ChemicalsClusterSubtotal 1,956 263 -613 1,606 1.61 1.66 1.58 3%
Eastgate Regional Council of Government - Metals ClusterRowLabels MetalsClusterSectorDescrip5ons Na5onal
ShareIndustryMix
RegionalShare
TotalChange LQ2010 LQ2014 LQ2016 %
Change
331100 IronandSteelMillsandFerroalloyMfg 156 -163 -986 -992 7.79 7.04 1.90 -0.76
331200 SteelProductMfgFromPurchasedSteel 129 -43 316 402 10.40 12.51 12.73 0.22
331300 AluminaandAluminumProduc5onandProcessing
141 -8 88 220 11.20 12.79 12.30 0.10
331400 NonferrousMetal(exceptAluminum)Produc5onandProcessing
151 -75 -197 -122 11.12 7.53 9.69 -0.13
331500 Foundries 71 -4 -35 32 2.73 3.82 2.54 -0.07
332100 ForgingandStamping 74 6 -177 -97 3.61 3.83 2.72 -0.25
332200 CutleryandHandtoolMfg 7 -12 17 13 0.78 1.00 1.00 0.28
332300 ArchitecturalandStructuralMetalsMfg 121 27 -254 -106 1.57 1.65 1.31 -0.17
332400 Boiler,Tank,andShippingContainerMfg 78 -10 34 102 3.89 3.66 3.98 0.02
332500 HardwareMfg 4 -3 -32 -32 0.66 - 0.00 -1.00
332600 SpringandWireProductMfg 13 -8 -61 -57 1.30 0.84 0.61 -0.53
332700 MachineShops;TurnedProduct;andScrew,Nut,andBoltMfg
74 39 -87 25 1.02 0.96 0.89 -0.14
332800 Coa5ng,Engraving,HeatTrea5ng,andAlliedAc5vi5es
56 21 79 157 1.99 2.52 2.32 0.16
332900 OtherFabricatedMetalProductMfg 33 -2 240 270 0.56 0.97 0.99 0.77
Subtotal MetalsClusterSubtotals 1,108 -237 -1,056 -185 2.87 2.96 2.53 -0.12
Eastgate Regional Council of Government - Machinery ClusterRowLabels MachineryClusterSectorDescrip5ons Na5onal
ShareIndustryMix
RegionalShare
TotalChange LQ2010 LQ2014 LQ2016 %
Change
333100 Agriculture,Construc5on,andMiningMachineryMfg
5.67 -3 17 20 0.09 0.08 0.11 0.27
333200 IndustrialMachineryMfg 43.27 -1 -65 -23 1.34 1.34 1.13 -0.16
333300 CommercialandServiceIndustryMachineryMfg
6.16 -7 -1 -2 0.20 0.26 0.21 0.02
333400 Ven5la5on,Hea5ng,AirCondi5oning,andCommercialRefrigera5onEquipmentMfg
21.39 -19 -20 -17 0.51 0.65 0.45 -0.12
333500 MetalworkingMachineryMfg 210.99 35 -44 202 4.19 4.47 4.16 -0.01
333900 OtherGeneralPurposeMachineryMfg 137.26 12 -281 -131 1.86 1.45 1.38 -0.26
335110 ElectricLigh5ngEqupmentMfg 51.53 -38 -125 -111 3.38 1.88 2.24 -0.34
335210 HouseholdApplianceMfg 10.70 -5 -71 -66 0.56 - 0.00 -1.00
335311 ElectricalEquipmentMfg 61.42 -43 278 296 1.38 1.96 2.34 0.69
335911 OtherElectricalEquipmentandComponentMfg 10.70 -3 -74 -66 0.28 - 0.00 -1.00
336111 MotorVehicleMfg 673.64 731 -1,997 -593 13.18 10.06 9.42 -0.28
336211 MotorVehicleBodyandTrailerMfg 18.96 31 225 275 0.54 0.74 1.41 1.59
336310 MotorVehiclePartsMfg 182.14 277 -295 164 1.34 0.85 1.21 -0.10
336510 RailroadRollingStockMfg 7.78 16 12 36 1.26 2.81 1.67 0.32
336611 ShipandBoatBuilding 4.05 -2 40 42 0.10 0.07 0.25 1.54
Subtotal MachineryClusterSubtotals 1,445.65 981 -2,401 26 1.64 1.44 1.49 -0.09
Eastgate Regional Council of Government - Energy ClusterRowLabels EnergyClusterSectorDescrip5ons Na5onal
ShareIndustryMix
RegionalShare
TotalChange LQ2010 LQ2014 LQ2016 %
Change
211000 OilandGasExtrac5on 21 215 -829 -594 4.36 4.76 2.04 -0.53
212100 CoalMining 1 -23 4 -18 0.41 0.73 0.33 -0.20
212300 NonmetallicMineralMingandQuarrying 1 2 -22 -19 0.49 0.97 0.39 -0.21
213100 SupportAc5vi5esforMining 6 17 -126 -103 0.79 0.68 0.39 -0.51
221100 ElectricPowerGenera5on,TransmissionandDistribu5on
7 -16 -140 -150 0.57 0.54 0.40 -0.30
221200 NaturalGasDistribu5on 3 6 -48 -38 0.93 0.84 0.76 -0.18
221300 Water,SewageandOtherSystems 3 6 60 69 1.81 1.67 2.50 0.38
Subtotal EnergyClusterSubtotals 42 -8 -272 -259 1.21 1.30 0.74 -0.39
Eastgate Regional Council of Government - Chemicals ClusterRowLabels ChemicalsClusterSectorDescrip5ons Na5onal
ShareIndustryMix
RegionalShare
TotalChange LQ2010 LQ2014 LQ2016 %
Change
325100 BasicChemicalMfg 48.75 -13 26 62 2.45 3.04 2.69 0.09
325200 Resin,Synthe5cRubber,andAr5ficialSynthe5cFibersandFilamentsMfg
0.61 0 70 70 0.05 0.20 0.43 7.80
325300 Pes5cide,Fer5lizer,andOtherAgriculturalChemicalMfg
1.84 -2 -14 -14 0.37 0.21 0.07 -0.80
325500 Paint,Coa5ng,andAdhesiveMfg 0.82 0 9 10 0.10 0.19 0.19 0.84
325600 Soap,CleaningCompound,andToiletPrepara5onMfg
1.29 0 -13 -12 0.09 0.03 0.03 -0.63
325900 OtherChemicalProductandPrepara5onMfg 8.10 -12 -28 -32 0.70 0.79 0.53 -0.25
326100 Plas5csProductMfg 139.23 115 -171 84 2.00 2.16 1.98 -0.01
326200 RubberProductMfg 32.68 20 49 102 1.96 1.86 2.24 0.14
327100 ClayProductandRefractoryMfg 28.32 -39 -103 -114 5.03 4.65 3.84 -0.24
327200 GlassandGlassProductMfg 12.12 -2 -105 -95 1.08 0.60 0.51 -0.53
327300 CementandConcreteProductMfg 12.53 1 -7 7 0.50 1.30 0.54 0.07
327900 OtherNonmetallicMineralProductMfg 2.52 4 27 33 0.27 0.48 0.49 0.77
Subtotal ChemicalClusterSubtotals 288.82 72 -260 101 1.16 1.30 1.15 -0.01
Eastgate Regional Council of Government - Wood ClusterRowLabels WoodClusterSectorDescrip5ons Na5onal
ShareIndustryMix
RegionalShare
TotalChange LQ2010 LQ2014 LQ2016 %
Change
321100 SawmillsandWoodPreserva5on 2.50 4 34 41 0.35 0.25 0.56 0.59
321200Veneer,Plywood,andEngineeredWoodProductMfg 2.67 8 22 33 0.48 0.52 0.68 0.42
321900 OtherWoodProductMfg 37.83 66 114 217 2.20 2.41 2.68 0.22
322200 ConvertedPaperProductMfg 24.31 -50 -133 -159 1.00 1.09 0.77 -0.23
337100HouseholdandIns5tu5onalFurnitureandKitchenCabinetMfg 12.03 8 34 54 0.61 0.66 0.73 0.20
337200 OfficeFurniture(includingFixtures)Mfg 2.03 3 13 18 0.24 0.43 0.32 0.35
337900 OtherFurnitureRelatedProductMfg 1.69 -1 0 - 0.55 0.61 0.59 0.08
Subtotal WoodClusterSubtotals 83.07 38 83 204 0.87 0.96 0.98 0.12
Northeast Ohio Four County Regional Planning and Development Organization - Metals ClusterRowLabels MetalsClusterSectorDescrip5ons Na5onal
ShareIndustryMix
RegionalShare
TotalChange LQ2010 LQ2014 LQ2016 %
Change
331100 IronandSteelMillsandFerroalloyMfg 72.97 -76 191 188 1.46 1.39 1.72 0.18
331200 SteelProductMfgFromPurchasedSteel 170.21 -57 -253 -140 5.48 4.14 4.29 -0.22
331300 AluminaandAluminumProduc5onandProcessing
45.53 -3 22 65 1.45 1.09 1.52 0.04
331400 NonferrousMetal(exceptAluminum)Produc5onandProcessing
22.53 -11 236 247 0.67 0.84 1.41 1.11
331500 Foundries 219.83 -13 190 397 3.40 3.77 3.50 0.03
332100 ForgingandStamping 114.41 9 -128 -5 2.24 2.23 1.92 -0.15
332200 CutleryandHandtoolMfg 106.24 -167 68 7 4.52 4.85 4.67 0.03
332300 ArchitecturalandStructuralMetalsMfg 180.02 39 371 590 0.93 1.17 1.16 0.24
332400 Boiler,Tank,andShippingContainerMfg 274.70 -36 -618 -380 5.46 4.75 3.92 -0.28
332500 HardwareMfg 44.36 -40 -183 -179 3.16 2.36 1.71 -0.46
332600 SpringandWireProductMfg 10.27 -7 -23 -20 0.42 0.49 0.31 -0.27
332700 MachineShops;TurnedProduct;andScrew,Nut,andBoltMfg
334.59 175 178 688 1.86 2.10 1.85 -0.01
332800 Coa5ng,Engraving,HeatTrea5ng,andAlliedAc5vi5es
138.23 52 63 254 1.96 2.01 2.01 0.03
332900 OtherFabricatedMetalProductMfg 799.93 -54 -2,824 -2,078 5.52 4.41 3.33 -0.40
Subtotal MetalsClusterSubtotals 2,533.81 -188 -2,712 -366 2.63 2.50 2.24 -0.15
Northeast Ohio Four County Regional Planning and Development Organization - Energy ClusterRowLabels EnergyClusterSectorDescrip5ons Na5onal
ShareIndustryMix
RegionalShare
TotalChange LQ2010 LQ2014 LQ2016 %
Change
211111 OilandGasExtrac5on 43.09 448 -1,229 -738 3.65 3.63 2.15 -0.41
212100 CoalMining 0.79 -18 -14 -31 0.13 0.23 0.06 -0.56
212300 NonmetallicMineralMingandQuarrying 4.07 6 -41 -31 0.59 0.77 0.50 -0.14
213100 SupportAc5vi5esforMining 16.75 43 271 331 0.83 1.00 0.67 -0.19
221100ElectricPowerGenera5on,TransmissionandDistribu5on 15.21 -36 -6 -27 0.50 0.56 0.49 -0.03
221200 NaturalGasDistribu5on 11.51 24 -222 -186 1.40 1.13 1.03 -0.27
221300 Water,SewageandOtherSystems 1.41 3 8 13 0.39 0.77 0.43 0.09
Subtotal EnergyClusterSubtotals 92.84 470 -1,232 -669 1.07 1.20 0.81 -0.24
Northeast Ohio Four County Regional Planning and Development Organization - Machinery ClusterRowLabels MachineryClusterSectorDescrip5ons Na5onal
ShareIndustryMix
RegionalShare
TotalChange LQ2010 LQ2014 LQ2016 %
Change
333100 Agriculture,Construc5on,andMiningMachineryMfg 139.85 -75 480 545 0.85 0.68 1.08 0.27
333200 IndustrialMachineryMfg 185.39 -3 374 556 2.30 3.84 3.03 0.32
333300 CommercialandServiceIndustryMachineryMfg 18.96 -23 -52 -56 0.25 0.16 0.13 -0.46
333400 Ven5la5on,Hea5ng,AirCondi5oning,andCommercialRefrigera5onEquipmentMfg 45.37 -40 25 31 0.44 0.41 0.47 0.08
333500 MetalworkingMachineryMfg 374.50 61 -242 194 2.98 3.10 2.67 -0.10
333600 Engine,Turbine,andPowerTransmissionEquipmentMfg 21.71 -7 -11 4 0.30 0.78 0.27 -0.09
333900 OtherGeneralPurposeMachineryMfg 264.63 24 252 541 1.44 1.53 1.62 0.13
335110 ElectricLigh5ngEqupmentMfg 28.52 -21 -17 -9 0.75 0.60 0.70 -0.07
335210 HouseholdApplianceMfg 30.79 -15 -170 -155 0.65 0.08 0.12 -0.82
335311 ElectricalEquipmentMfg 160.43 -113 -114 -67 1.45 1.44 1.24 -0.15
335911 OtherElectricalEquipmentandComponentMfg 72.44 -18 23 77 0.75 0.92 0.80 0.06
336111 MotorVehicleMfg 2.43 3 -20 -15 0.02 - 0.00 -1.00
336211 MotorVehicleBodyandTrailerMfg 225.41 373 701 1,300 2.59 3.31 3.74 0.44
336310 MotorVehiclePartsMfg 526.34 801 -322 1,006 1.55 1.38 1.54 -0.01
336411 AerospacePrdoctandPartsMfg 162.54 -141 310 331 0.41 0.52 0.52 0.28
336510 RailroadRollingStockMfg 0.32 1 33 34 0.02 0.18 0.28 12.10
336611 ShipandBoatBuilding 0.32 0 -2 -2 0.00 0.02 0.00 -1.00
336991 OtherTransporta5onEquipmentMfg 0.16 0 43 43 0.01 0.12 0.27 43.48
Subtotal MachineryClusterSubtotals 2,260.11 806 1,292 4,358 1.03 1.16 1.17 0.13
Northeast Ohio Four County Regional Planning and Development Organization - Wood ClusterRowLabels WoodClusterSectorDescrip5ons Na5onal
ShareIndustryMix
RegionalShare
TotalChange LQ2010 LQ2014 LQ2016 %
Change
321100 SawmillsandWoodPreserva5on 4 6 41 51 0.21 0.37 0.30 0.43
321200Veneer,Plywood,andEngineeredWoodProductMfg 11 34 54 99 0.78 0.94 0.98 0.25
321900 OtherWoodProductMfg 42 74 393 509 0.99 1.09 1.41 0.42
322100 Pulp,Paper,andPaperboardMills 11 -36 -85 -110 0.46 0.47 0.27 -0.40
322200 ConvertedPaperProductMfg 75 -156 -65 -146 1.24 1.20 1.17 -0.05
337100HouseholdandIns5tu5onalFurnitureandKitchenCabinetMfg 30 21 147 198 0.61 0.58 0.76 0.25
337200 OfficeFurniture(includingFixtures)Mfg 24 33 -199 -142 1.14 1.44 0.80 -0.29
337900 OtherFurnitureRelatedProductMfg 3 -2 -15 -14 0.35 0.38 0.28 -0.19
Subtotal WoodClusterSubtotals 200 -26 271 445 0.84 0.90 0.90 0.07
Northeast Ohio Four County Regional Planning and Development - Chemicals ClusterRowLabels ChemicalsClusterSectorDescrip5ons Na5onal
ShareIndustryMix
RegionalShare
TotalChange LQ2010 LQ2014 LQ2016 %
Change
325100 BasicChemicalMfg 56.31 -15 -102 -60 1.14 1.09 1.02 -0.10
325200 Resin,Synthe5cRubber,andAr5ficialSynthe5cFibersandFilamentsMfg
62.98 -48 183 198 2.00 2.56 2.35 0.17
325300 Pes5cide,Fer5lizer,andOtherAgriculturalChemicalMfg
8.58 -10 82 81 0.69 0.41 0.46 -0.33
325400 Pharmaceu5calandMedicineMfg 2.66 -2 103 103 0.03 0.05 0.10 2.70
325500 Paint,Coa5ng,andAdhesiveMfg 41.06 9 123 173 2.10 2.18 2.62 0.25
325600 Soap,CleaningCompound,andToiletPrepara5onMfg
99.68 -11 -139 -51 2.85 2.58 2.65 -0.07
325900 OtherChemicalProductandPrepara5onMfg 47.05 -67 -68 -88 1.63 1.64 1.41 -0.14
326100 Plas5csProductMfg 422.40 350 -465 308 2.43 2.41 2.34 -0.04
326200 RubberProductMfg 149.11 91 208 448 3.59 4.10 3.91 0.09
327100 ClayProductandRefractoryMfg 34.79 -48 -144 -157 2.47 2.33 1.74 -0.30
327200 GlassandGlassProductMfg 7.08 -1 -3 3 0.25 0.05 0.25 0.00
327300 CementandConcreteProductMfg 31.93 3 205 240 0.51 0.68 0.78 0.51
327400 LimeandGypsumProductMfg 0.54 0 15 15 0.13 0.04 0.33 1.66
327900 OtherNonmetallicMineralProductMfg 23.90 34 -1 57 1.04 1.20 1.09 0.05
Subtotal ChemicalClusterSubtotals 988.06 284 -2 1,270 1.59 1.64 1.61 0.01
Ohio Mid-Eastern Governments Association - Metals ClusterRowLabels MetalsClusterSectorDescrip5ons Na5onal
ShareIndustryMix
RegionalShare
TotalChange LQ2010 LQ2014 LQ2016 %
Change
331100 IronandSteelMillsandFerroalloyMfg 1 -1 210 210 0.08 1.93 1.27 2376%
331200 SteelProductMfgFromPurchasedSteel 17 -6 627 638 2.28 9.34 6.80 309%
331300 AluminaandAluminumProduc5onandProcessing
0 0 460 460 0.02 8.84 3.85 56630%
331400 NonferrousMetal(exceptAluminum)Produc5onandProcessing
69 -34 -327 -293 8.51 7.64 2.40 -10%
331500 Foundries 70 -4 320 386 4.53 5.06 3.98 12%
332100 ForgingandStamping 19 1 312 332 1.52 1.56 2.48 3%
332200 CutleryandHandtoolMfg 3 -5 101 99 0.54 3.07 1.65 467%
332300 ArchitecturalandStructuralMetalsMfg 61 13 1,505 1,579 1.32 4.89 2.77 270%
332400 Boiler,Tank,andShippingContainerMfg 7 -1 454 460 0.54 4.23 2.71 677%
332500 HardwareMfg 0 0 25 25 0.03 2.59 0.53 7344%
332600 SpringandWireProductMfg 6 -4 10 12 1.02 0.27 0.72 -73%
332700 MachineShops;TurnedProduct;andScrew,Nut,andBoltMfg
35 19 449 503 0.83 1.70 1.11 105%
332800 Coa5ng,Engraving,HeatTrea5ng,andAlliedAc5vi5es
35 13 -149 -101 2.07 1.57 0.70 -24%
332900 OtherFabricatedMetalProductMfg 85 -6 163 242 2.46 2.21 1.75 -10%
Subtotal MetalsClusterSubtotals 408 -14 4,158 4,552 1.77 3.43 2.17 93%
Ohio Mid-Eastern Governments Association - Energy ClusterRowLabels EnergyClusterSectorDescrip5ons Na5onal
ShareIndustryMix
RegionalShare
TotalChange LQ2010 LQ2014 LQ2016 %
Change
211000 OilandGasExtrac5on(20,21) 3 30 6,527 6,560 1.01 2.56 18.90 1764%
212100 CoalMining(22) 10 -243 764 531 7.35 21.04 11.80 61%
212300NonmetallicMineralMiningandQuarrying(30-36) 4 5 891 900 2.38 6.03 6.30 164%
213100 SupportAc5vi5esforMining(37-40) 5 12 5,191 5,208 0.97 4.21 9.99 934%
221100ElectricPowerGenera5on,TransandDist(41-49) 2 -5 3,117 3,114 0.32 0.86 4.29 1230%
221200 NaturalGasDistribu5on(50) 0 1 1,137 1,138 0.12 0.12 5.18 4155%
221300 Water,SewageandOtherSystems(51) 1 3 505 509 1.35 4.17 6.03 347%
Subtotal EnergyClusterSubtotal 25 - 17,935 17,960 1.24 3.71 8.62 594%
Ohio Mid-Eastern Governments Association - Machinery ClusterRowLabels MachineryClusterSectorDescrip5ons Na5onal
ShareIndustryMix
RegionalShare
TotalChange LQ2010 LQ2014 LQ2016 %
Change
333100 Agriculture,Construc5on,andMiningMachineryMfg
19 -10 753 762 0.49 2.02 2.09 308%
333200 IndustrialMachineryMfg 31 -1 -85 -55 1.60 1.43 0.61 -11%
333300 CommercialandServiceIndustryMachineryMfg
23 -27 -9 -14 1.23 0.88 0.71 -29%
333400 Ven5la5on,Hea5ng,AirCondi5oning,andCommercialRefrigera5onEquipmentMfg
32 -28 -45 -41 1.29 1.87 0.62 45%
333500 MetalworkingMachineryMfg 155 25 -120 60 5.15 5.69 2.84 10%
333600 Engine,Turbine,andPowerTransmissionEquipmentMfg
0 0 495 495 0.01 4.23 2.55 45701%
333900 OtherGeneralPurposeMachineryMfg 45 4 75 124 1.01 1.92 0.77 90%
335110 ElectricLigh5ngEqupmentMfg 0 0 33 33 0.02 0.02 0.36 1%
335210 HouseholdApplianceMfg 0 0 15 15 0.01 0.03 0.13 99%
335311 ElectricalEquipmentMfg 9 -7 8 11 0.35 0.02 0.25 -93%
335911 OtherElectricalEquipmentandComponentMfg 0 0 103 103 0.01 0.87 0.40 12285%
336111 MotorVehicleMfg 0 0 -1 -1 0.01 0.00 - -17%
336211 MotorVehicleBodyandTrailerMfg 1 2 455 458 0.05 1.88 1.57 3345%
336310 MotorVehiclePartsMfg 22 33 771 826 0.27 1.68 0.84 526%
336411 AerospaceProductandPartsMfg 0 0 7 7 0.00 0.00 0.01 -1%
336510 RailroadRollingStockMfg 2 3 3 8 0.44 0.26 0.33 -40%
336611 ShipandBoatBuilding 2 -1 -13 -12 0.08 0.01 - -92%
336991 OtherTransporta5onEquipmentMfg 0 0 16 16 0.03 0.42 0.26 1564%
Subtotal MachineryClusterSubtotal 341 -6 2,461 2,795 0.65 1.39 0.80 114%
Ohio Mid-Eastern Governments Association - Wood ClusterRowLabels WoodClusterSectorDescrip5ons Na5onal
ShareIndustryMix
RegionalShare
TotalChange LQ2010 LQ2014 LQ2016 %
Change
321100 SawmillsandWoodPreserva5on 5 9 686 700 1.18 4.91 4.55 316%
321200Veneer,Plywood,andEngineeredWoodProductMfg 0 1 183 184 0.05 2.09 1.26 3994%
321900 OtherWoodProductMfg 30 52 1,550 1,631 2.90 7.22 5.34 149%
322100 Pulp,Paper,andPaperboardMills 2 -8 153 148 0.40 0.38 1.02 -5%
322200 ConvertedPaperProductMfg 20 -42 99 77 1.38 1.50 1.04 8%
337100HouseholdandIns5tu5onalFurnitureandKitchenCabinetMfg 26 18 1,399 1,444 2.24 5.81 4.28 160%
337200 OfficeFurniture(includingFixtures)Mfg 4 5 220 228 0.72 1.78 1.48 148%
337900 OtherFurnitureRelatedProductMfg 0 0 3 3 0.05 0.10 0.07 113%
Subtotal WoodClusterSubtotal 87 35 4,293 4,415 1.54 3.66 2.87 138%
Ohio Mid-Eastern Governments Association - Chemicals ClusterRowLabels ChemicalsClusterSectorDescrip5ons Na5onal
ShareIndustryMix
RegionalShare
TotalChange LQ2010 LQ2014 LQ2016 %
Change
325100 BasicChemicalMfg 22 -6 246 262 1.82 3.59 1.88 3%
325200 Resin,Synthe5cRubber,andAr5ficialSynthe5cFibersandFilamentsMfg 12 -9 53 56 1.57 2.60 1.21 -23%
325300 Pes5cide,Fer5lizer,andOtherAgriculturalChemicalMfg 0 0 254 254 0.02 0.85 3.49 15222%
325400 Pharmaceu5calandMedicineMfg 0 0 66 66 0.00 0.06 0.12 3857%
325500 Paint,Coa5ng,andAdhesiveMfg 2 1 10 13 0.50 1.36 0.38 -24%
325600 Soap,CleaningCompound,andToiletPrepara5onMfg 4 0 169 172 0.47 3.37 1.05 122%
325900 OtherChemicalProductandPrepara5onMfg 2 -3 153 152 0.27 3.41 1.08 306%
326100 Plas5csProductMfg 33 27 1,484 1,544 0.79 2.41 1.76 121%
326200 RubberProductMfg 55 33 1,082 1,170 5.52 13.15 7.26 31%
327100 ClayProductandRefractoryMfg 38 -53 781 767 11.41 21.66 16.43 44%
327200 GlassandGlassProductMfg 7 -1 338 344 1.03 6.89 2.55 148%
327300 CementandConcreteProductMfg 18 2 44 64 1.24 1.73 0.85 -32%
327400 LimeandGypsumProductMfg 0 0 30 30 0.13 0.93 1.19 810%
327900 OtherNonmetallicMineralProductMfg 4 6 -10 - 0.76 0.90 0.39 -49%
Subtotal ChemicalsClusterSubtotal 197 -3 4,700 4,894 1.33 3.37 1.99 50%
Buckeye Hills-Hocking Valley Regional Development District - Metals ClusterRowLabels MetalsClusterSectorDescrip5ons Na5onal
ShareIndustryMix
RegionalShare
TotalChange LQ2010 LQ2014 LQ2016 %
Change
331100 IronandSteelMillsandFerroalloyMfg 27 -28 148 147 5.19 10.26 8.81 98%
331200 SteelProductMfgFromPurchasedSteel 0 0 147 147 0.04 3.95 5.10 10964%
331300AluminaandAluminumProduc5onandProcessing 0 0 51 51 0.04 2.21 1.72 6140%
331400NonferrousMetal(exceptAluminum)Produc5onandProcessing 0 0 74 74 0.03 0.10 2.42 194%
331500 Foundries 5 0 52 57 0.70 0.42 1.57 -41%
332100 ForgingandStamping 0 0 56 56 0.04 0.04 1.16 -9%
332200 CutleryandHandtoolMfg 0 0 -1 -1 0.05 0.05 - 8%
332300 ArchitecturalandStructuralMetalsMfg 7 1 40 48 0.32 0.36 0.54 13%
332400 Boiler,Tank,andShippingContainerMfg 0 0 13 13 0.04 2.27 0.31 5050%
332500 HardwareMfg 0 0 -1 -1 0.08 0.09 - 8%
332600 SpringandWireProductMfg 0 0 -1 -1 0.05 0.05 - 0%
332700MachineShops;TurnedProduct;andScrew,Nut,andBoltMfg 2 1 262 266 0.12 1.37 1.56 1013%
332800Coa5ng,Engraving,HeatTrea5ng,andAlliedAc5vi5es 0 0 41 41 0.02 0.01 0.59 -11%
332900 OtherFabricatedMetalProductMfg 0 0 81 81 0.01 0.02 0.59 174%
Subtotal MetalsClusterSubtotals 42 -26 962 978 0.42 1.22 1.44 191%
Buckeye Hills-Hocking Valley Regional Development District - Energy ClusterRowLabels EnergyClusterSectorDescrip5ons Na5onal
ShareIndustryMix
RegionalShare
TotalChange LQ2010 LQ2014 LQ2016 %
Change
211000 OilandGasExtrac5on 36 18 1,257 1,311 2.69 4.03 11.01 50%
212100 CoalMining 4 -6 181 179 0.63 9.56 5.02 1408%
212300 NonmetallicMineralMingandQuarrying 8 -7 341 342 0.97 1.43 5.41 48%
213100 SupportAc5vi5esforMining 43 111 470 624 1.87 4.15 4.13 122%
221100 ElectricPowerGenera5on,TransandDist 0 0 297 297 0.01 0.12 1.00 1217%
221200 NaturalGasDistribu5on 1 -1 122 122 0.10 0.12 1.47 19%
221300 Water,SewageandOtherSystems 10 -8 21 23 2.39 4.57 2.19 91%
Subtotal EnergyClusterSubtotal 102 107 2,689 2,898 1.03 2.74 3.96 166%
Buckeye Hills-Hocking Valley Regional Development District - Machinery ClusterRowLabels MachineryClusterSectorDescrip5ons Na5onal
ShareIndustryMix
RegionalShare
TotalChange LQ2010 LQ2014 LQ2016 %
Change
333100 Agriculture,Construc5on,andMiningMachineryMfg 2 -1 71 72 0.09 0.63 0.42 575%
333200 IndustrialMachineryMfg 6 0 -3 2 0.65 0.64 0.85 -1%
333300 CommercialandServiceIndustryMachineryMfg 1 -1 -2 -2 0.08 0.04 - -45%
333400 Ven5la5on,Hea5ng,AirCondi5oning,andCommercialRefrigera5onEquipmentMfg 3 -3 29 29 0.27 0.72 1.22 168%
333500 MetalworkingMachineryMfg 3 1 -19 -15 0.23 0.04 0.33 -82%
333600 Engine,Turbine,andPowerTransmissionEquipmentMfg 0 0 309 309 0.02 6.10 0.75 28986%
333900 OtherGeneralPurposeMachineryMfg 2 0 16 18 0.11 0.23 0.32 113%
335110 ElectricLigh5ngEqupmentMfg 0 0 0 - 0.04 0.04 - 4%
335210 HouseholdApplianceMfg 0 0 11 11 0.03 0.40 6.56 1126%
335311 ElectricalEquipmentMfg 6 -4 33 35 0.49 0.94 1.29 93%
335911 OtherElectricalEquipmentandComponentMfg 2 -1 -2 - 0.24 0.23 - -4%
336111 MotorVehicleMfg 0 0 0 - 0.01 0.01 - -15%
336211 MotorVehicleBodyandTrailerMfg 0 0 6 6 0.02 0.10 - 452%
336310 MotorVehiclePartsMfg 0 0 82 82 0.00 0.30 1.39 6548%
336411 AerospaceProductandPartsMfg 0 0 0 - 0.00 0.00 0.05 2%
336510 RailroadRollingStockMfg 0 0 0 - 0.10 0.08 - -23%
336611 ShipandBoatBuilding 0 0 0 - 0.01 0.01 - -3%
336991 OtherTransporta5onEquipmentMfg 0 0 0 - 0.06 0.06 - 7%
Subtotal MachineryClusterSubtotal 26 -8 529 547 0.11 0.45 0.64 307%
Buckeye Hills-Hocking Valley Regional Development District - Wood ClusterRowLabels WoodClusterSectorDescrip5ons Na5onal
ShareIndustryMix
RegionalShare
TotalChange LQ2010 LQ2014 LQ2016 %
Change
321100 SawmillsandWoodPreserva5on 4 7 63 74 2.13 2.62 2.38 23%
321200 Veneer,Plywood,andEngineeredWoodProductMfg 0 1 -1 1 0.32 0.33 0.21 4%
321900 OtherWoodProductMfg 5 9 156 170 1.15 1.67 1.71 46%
322100 Pulp,Paper,andPaperboardMills 0 0 -1 -1 0.02 0.02 - 10%
322200 ConvertedPaperProductMfg 9 -19 1 -9 1.47 1.82 1.03 24%
337100 HouseholdandIns5tu5onalFurnitureandKitchenCabinetMfg 1 1 85 87 0.20 0.37 0.59 89%
337200 OfficeFurniture(includingFixtures)Mfg 2 2 62 66 0.71 1.35 1.25 91%
337900 OtherFurnitureRelatedProductMfg 0 0 -1 -1 0.05 0.06 - 10%
Subtotal WoodClusterSubtotal 22 0 365 387 0.87 1.19 1.02 37%
CFAES provides research and related educa6onal programs to clientele on a nondiscriminatory basis. For more informa6on, visit cfaesdiversity.osu.edu. For an accessible format of this publica6on, visit cfaes.osu.edu/accessibility.
Buckeye Hills-Hocking Valley Regional Development District - Chemicals ClusterRowLabels ChemicalsClusterSectorDescrip5ons Na5onal
ShareIndustryMix
RegionalShare
TotalChange LQ2010 LQ2014 LQ2016 %
Change
325100 BasicChemicalMfg 0 0 151 151 0.01 1.41 1.27 10672%
325200Resin,Synthe5cRubber,andAr5ficialSynthe5cFibersandFilamentsMfg 0 0 901 901 0.02 17.87 12.24 86808%
325300Pes5cide,Fer5lizer,andOtherAgriculturalChemicalMfg 0 0 -1 -1 0.05 0.02 - -57%
325400 Pharmaceu5calandMedicineMfg 0 0 133 133 0.01 1.14 0.59 17081%
325500 Paint,Coa5ng,andAdhesiveMfg 1 0 -2 -1 0.36 0.51 0.20 40%
325600Soap,CleaningCompound,andToiletPrepara5onMfg 1 0 -1 - 0.30 0.02 0.19 -94%
325900 OtherChemicalProductandPrepara5onMfg 0 0 6 6 0.02 0.02 0.11 5%
326100 Plas5csProductMfg 3 3 340 346 0.17 0.82 0.87 377%
326200 RubberProductMfg 1 0 49 50 0.14 1.71 0.56 1121%
327100 ClayProductandRefractoryMfg 34 -47 -145 -158 23.09 27.09 10.89 17%
327200 GlassandGlassProductMfg 2 0 97 99 0.83 1.09 1.98 31%
327300 CementandConcreteProductMfg 4 0 46 51 0.66 0.64 0.74 -3%
327400 LimeandGypsumProductMfg 2 -1 12 13 3.88 3.63 3.73 -6%
327900 OtherNonmetallicMineralProductMfg 2 3 77 82 0.82 1.83 1.80 124%
Subtotal ChemicalsClusterSubtotal 51 -42 1,664 1,672 0.77 2.28 1.58 194%
2015 OMEGA Report ! Leveraging Manufacturing Clusters 23
and Local Assets with Strategic Planning
Ohio Longitudinal Data Archive Disclaimer This workforce solution was funded by a grant awarded to the U.S. Department of Labor's Employment and Training Administration. The solution was created by the Center for Human Resource Research on behalf of the Ohio Department of Job and Family Services and does not necessarily reflect the official position of the U.S. Department of Labor. The Department of Labor makes no guarantees, warranties, or assurances of any kind, express or implied, with respect to such information, including any information on linked sites and including, but not limited to, accuracy of the information or its completeness, timeliness, usefulness, adequacy, continued availability, or ownership. This solution is copyrighted by the institution that created it. Internal use, by an organization and/or personal use by an individual for non-commercial purposes, is permissible.
References Farren, M., Weinstein, A., and Partridge, M. (2012). Making Shale Development Work for Ohio. [Policy Summary Report]. Columbus, OH: Ohio State University. Retrieved from: http://aede.osu.edu/sites/aede/files/publication_files/Making%20Shale%20Development%20Work%20for%20Ohio%20June%201.pdf
IMPLAN Professional Version 2.0 Users Guide. 2004. Minnesota IMPLAN Group, Inc. (4th Edition). The IMPLAN Input-Output System. 2003. Minnesota IMPLAN Group, Inc.
United States Department of Energy, Energy Information Administration (USDOE/EIA). (2014). The Annual Energy Outlook 2014 . United States Department of Energy, Energy Information Administration, Washington D.C.

Ohio State University Extension ! Energize Ohio Signature Program 24 2014 Annual Report
CFAES provides research and related educational programs to clientele on a nondiscriminatory basis. For more information: go.osu.edu/cfaesdiversity.
Please contact us for more information:
740-725-6317 or energizeohio.osu.edu