building tennessee's tomorrow county summaries...26 building tennessee’s tomorrow:...
TRANSCRIPT

21WWW.TN.GOV/TACIR
County Summaries
Building Tennessee’s Tomorrow:
Anticipating the State’s Infrastructure Needs
July 2018 through June 2023
COUNTY SUMMARIES
The county summaries highlight the top three types of infrastructure based on total estimated cost needed in the county, broken down by whether it is needed locally or at the regional level. The estimated costs for all types of infrastructure are divided between conceptual projects and those that have moved into the planning and design stage or have started construction. The infrastructure needed at public school systems is also compared to student enrollment.
DRAFT

DRAFT

23WWW.TN.GOV/TACIR
County Summaries
Project Type ConceptualPlanning & Design
+ Construction
Transportation 50,525,197$ 164,365,971$
Water and Wastewater 52,725,000$ 14,396,000$
School Renovations 13,123,530$ 8,276,284$
New Public Schools & Additions 1,000,000$ 20,000,000$
Recreation 7,905,000$ 10,830,001$
Community Development 874,000$ 2,683,000$
Public Health Facilities -$ 2,200,000$
Other Facilities 500,000$ 600,000$
School-System-wide 1,000,000$ -$
Law Enforcement 800,000$ -$
Solid Waste -$ 565,000$
Other Utilities 550,000$ -$
Industrial Sites and Parks 500,000$ -$
Fire Protection 250,000$ -$
Public Buildings -$ 250,000$
Broadband -$ -$
Business District Development -$ -$
Housing -$ -$
Libraries, Museums, & Historic Sites -$ -$
Other Education -$ -$
Post-secondary Education -$ -$
Storm Water -$ -$Total 129,752,727$ 224,166,256$
*Total Estimated Cost = Conceptual + Planning & Design + Construction
Estimated Cost of Needed Infrastructurefor Anderson County
Five-year period July 2018 through June 2023
Anderson CountyTotal Estimated Cost* for
Infrastructure Improvements
$353,918,983
$0$5$10$15$20$25$30
$0
$50
$100
$150
$200
$250
09 10 11 12 13 14 15 16 17 18 Est.
Cos
t of
Com
plet
ions
Est.
Cos
t of
Nee
ds
Inventory Year
Transportation(in millions)
Completed
$0$2$4$6$8$10$12$14$16
$0$10$20$30$40$50$60$70$80
09 10 11 12 13 14 15 16 17 18 Est.
Cos
t of
Com
plet
ions
Est.
Cos
t of
Nee
ds
Inventory Year
Water and Wastewater(in millions)
Completed
$0$2$4$6$8$10$12$14
$0
$5
$10
$15
$20
$25
09 10 11 12 13 14 15 16 17 18 Est.
Cos
t of
Com
plet
ions
Est.
Cos
t of
Nee
ds
Inventory Year
School Renovations(in millions)
Completed
TOP 3
0
2,000
4,000
6,000
8,000
10,000
12,000
14,000
$0
$5
$10
$15
$20
$25
09 10 11 12 13 14 15 16 17 18
Stud
ents
Cost
in M
illio
ns
Inventory Year
Cost of Needed New School Space vs Improvements to Existing Schools and Student Enrollment Growth
New Space Existing Space Students
= Local= Regional (Serves Multiple Counties)
DRAFT

WWW.TN.GOV/TACIR24
Building Tennessee’s Tomorrow: Anticipating the State’s Infrastructure Needs
Project Type Conceptual
Planning & Design + Construction
Transportation 39,861,000$ 117,981,778$
New Public Schools & Additions 16,197,192$ 25,400,000$
Water and Wastewater 21,600,000$ 1,400,000$
School Renovations 5,430,000$ 1,495,000$
Law Enforcement -$ 5,710,000$
Public Buildings -$ 5,710,000$
Other Facilities 4,780,000$ -$
Recreation 2,540,000$ 1,050,000$
Other Utilities 1,500,000$ -$
Fire Protection -$ 1,200,000$
Post-secondary Education 120,000$ 120,000$
Broadband -$ -$
Business District Development -$ -$
Community Development -$ -$
Housing -$ -$
Industrial Sites and Parks -$ -$
Libraries, Museums, & Historic Sites -$ -$
Other Education -$ -$
Public Health Facilities -$ -$
School-System-wide -$ -$
Solid Waste -$ -$
Storm Water -$ -$Total 92,028,192$ 160,066,778$
*Total Estimated Cost = Conceptual + Planning & Design + Construction
Estimated Cost of Needed Infrastructurefor Bedford County
Five-year period July 2018 through June 2023
Bedford CountyTotal Estimated Cost* for
Infrastructure Improvements
$252,094,970
$0
$10
$20
$30
$40
$50
$0$50
$100$150$200$250$300
09 10 11 12 13 14 15 16 17 18 Est.
Cos
t of
Com
plet
ions
Est.
Cos
t of
Nee
ds
Inventory Year
Transportation(in millions)
Completed
$0$5$10$15$20$25$30
$0
$10
$20
$30
$40
$50
09 10 11 12 13 14 15 16 17 18 Est.
Cos
t of
Com
plet
ions
Est.
Cos
t of
Nee
ds
Inventory Year
New Public Schools & Additions (in millions)
Completed
$0$5$10$15$20$25$30
$0$10$20$30$40$50$60
09 10 11 12 13 14 15 16 17 18 Est.
Cos
t of
Com
plet
ions
Est.
Cos
t of
Nee
ds
Inventory Year
Water and Wastewater(in millions)
Completed
TOP 3
01,0002,0003,0004,0005,0006,0007,0008,0009,000
$0$5
$10$15$20$25$30$35$40$45$50
09 10 11 12 13 14 15 16 17 18
Stud
ents
Cost
in M
illio
ns
Inventory Year
Cost of Needed New School Space vs Improvements to Existing Schools and Student Enrollment Growth
New Space Existing Space Students
= Local= Regional (Serves Multiple Counties)
DRAFT

25WWW.TN.GOV/TACIR
County Summaries
Project Type Conceptual
Planning & Design + Construction
Transportation 15,013,000$ 154,409,905$
Water and Wastewater 10,000,000$ -$
New Public Schools & Additions 4,450,000$ -$
School Renovations 3,202,000$ 853,288$
Recreation 815,000$ -$
Public Buildings 75,000$ 325,000$
Broadband -$ -$
Business District Development -$ -$
Community Development -$ -$
Fire Protection -$ -$
Housing -$ -$
Industrial Sites and Parks -$ -$
Law Enforcement -$ -$
Libraries, Museums, & Historic Sites -$ -$
Other Education -$ -$
Other Facilities -$ -$
Other Utilities -$ -$
Post-secondary Education -$ -$
Public Health Facilities -$ -$
School-System-wide -$ -$
Solid Waste -$ -$
Storm Water -$ -$Total 33,555,000$ 155,588,193$
*Total Estimated Cost = Conceptual + Planning & Design + Construction
Estimated Cost of Needed Infrastructurefor Benton County
Five-year period July 2018 through June 2023
Benton CountyTotal Estimated Cost* for
Infrastructure Improvements
$189,143,193
$0$2$4$6$8$10$12
$0
$50
$100
$150
$200
$250
09 10 11 12 13 14 15 16 17 18 Est.
Cos
t of
Com
plet
ions
Est.
Cos
t of
Nee
ds
Inventory Year
Transportation(in millions)
Completed
$0.0$0.1$0.2$0.3$0.4$0.5$0.6$0.7
$0$2$4$6$8
$10$12
09 10 11 12 13 14 15 16 17 18 Est.
Cos
t of
Com
plet
ions
Est.
Cos
t of
Nee
ds
Inventory Year
Water and Wastewater(in millions)
Completed
$0.00$0.02$0.04$0.06$0.08$0.10$0.12$0.14$0.16$0.18$0.20
$0$1$2$3$4$5$6
09 10 11 12 13 14 15 16 17 18 Est.
Cos
t of
Com
plet
ions
Est.
Cos
t of
Nee
ds
Inventory Year
New Public Schools & Additions (in millions)
Completed
TOP 3
0
500
1,000
1,500
2,000
2,500
3,000
$0
$1
$2
$3
$4
$5
$6
09 10 11 12 13 14 15 16 17 18
Stud
ents
Cost
in M
illio
ns
Inventory Year
Cost of Needed New School Space vs Improvements to Existing Schools and Student Enrollment Growth
New Space Existing Space Students
= Local= Regional (Serves Multiple Counties)
DRAFT

WWW.TN.GOV/TACIR26
Building Tennessee’s Tomorrow: Anticipating the State’s Infrastructure Needs
Project Type Conceptual
Planning & Design + Construction
Law Enforcement 4,750,000$ 41,500,000$
Transportation 11,244,000$ 1,419,000$
Public Health Facilities -$ 9,387,657$
School Renovations 6,235,000$ 695,000$
Water and Wastewater -$ 1,000,000$
Recreation 500,000$ -$
Broadband -$ -$
Business District Development -$ -$
Community Development -$ -$
Fire Protection -$ -$
Housing -$ -$
Industrial Sites and Parks -$ -$
Libraries, Museums, & Historic Sites -$ -$
New Public Schools & Additions -$ -$
Other Education -$ -$
Other Facilities -$ -$
Other Utilities -$ -$
Post-secondary Education -$ -$
Public Buildings -$ -$
School-System-wide -$ -$
Solid Waste -$ -$
Storm Water -$ -$Total 22,729,000$ 54,001,657$
*Total Estimated Cost = Conceptual + Planning & Design + Construction
Estimated Cost of Needed Infrastructurefor Bledsoe County
Five-year period July 2018 through June 2023
Bledsoe CountyTotal Estimated Cost* for
Infrastructure Improvements
$76,730,657
$0$1$2$3$4$5$6
$0$10$20$30$40$50$60
09 10 11 12 13 14 15 16 17 18 Est.
Cos
t of
Com
plet
ions
Est.
Cos
t of
Nee
ds
Inventory Year
Law Enforcement(in millions)
Completed
$0.0$0.5$1.0$1.5$2.0$2.5$3.0
$0
$5
$10
$15
$20
$25
09 10 11 12 13 14 15 16 17 18 Est.
Cos
t of
Com
plet
ions
Est.
Cos
t of
Nee
ds
Inventory Year
Transportation(in millions)
Completed
$0.00$0.01$0.02$0.03$0.04$0.05$0.06$0.07
$0$1$2$3$4$5$6$7$8$9
$10
09 10 11 12 13 14 15 16 17 18 Est.
Cos
t of
Com
plet
ions
Est.
Cos
t of
Nee
ds
Inventory Year
Public Health Facilities(in millions)
Completed
TOP 3
02004006008001,0001,2001,4001,6001,8002,000
$0$1$2$3$4$5$6$7$8$9
09 10 11 12 13 14 15 16 17 18
Stud
ents
Cost
in M
illio
ns
Inventory Year
Cost of Needed New School Space vs Improvements to Existing Schools and Student Enrollment Growth
New Space Existing Space Students
= Local= Regional (Serves Multiple Counties)
DRAFT

27WWW.TN.GOV/TACIR
County Summaries
Project Type Conceptual
Planning & Design + Construction
Transportation 101,139,780$ 571,457,930$
New Public Schools & Additions 29,000,000$ 14,000,999$
Recreation 26,075,470$ 11,751,088$
Water and Wastewater 19,627,000$ 6,651,770$
Post-secondary Education 10,890,000$ 1,400,000$
School Renovations 3,065,000$ 6,500,993$
Fire Protection 2,546,408$ -$
Public Buildings -$ 2,400,000$
Solid Waste 600,000$ -$
Other Facilities -$ 338,800$
Law Enforcement -$ 240,000$
Broadband -$ -$
Business District Development -$ -$
Community Development -$ -$
Housing -$ -$
Industrial Sites and Parks -$ -$
Libraries, Museums, & Historic Sites -$ -$
Other Education -$ -$
Other Utilities -$ -$
Public Health Facilities -$ -$
School-System-wide -$ -$
Storm Water -$ -$Total 192,943,658$ 614,741,580$
*Total Estimated Cost = Conceptual + Planning & Design + Construction
Estimated Cost of Needed Infrastructurefor Blount County
Five-year period July 2018 through June 2023
Blount CountyTotal Estimated Cost* for
Infrastructure Improvements
$807,685,238
$0$5$10$15$20$25$30$35
$0$100$200$300$400$500$600$700$800
09 10 11 12 13 14 15 16 17 18 Est.
Cos
t of
Com
plet
ions
Est.
Cos
t of
Nee
ds
Inventory Year
Transportation(in millions)
Completed
$0$5$10$15$20$25$30$35$40
$0
$20
$40
$60
$80
$100
09 10 11 12 13 14 15 16 17 18 Est.
Cos
t of
Com
plet
ions
Est.
Cos
t of
Nee
ds
Inventory Year
New Public Schools & Additions (in millions)
Completed
$0.0$0.2$0.4$0.6$0.8$1.0$1.2$1.4$1.6$1.8
$0$5
$10$15$20$25$30$35$40
09 10 11 12 13 14 15 16 17 18 Est.
Cos
t of
Com
plet
ions
Est.
Cos
t of
Nee
ds
Inventory Year
Recreation(in millions)
Completed
TOP 3
02,0004,0006,0008,00010,00012,00014,00016,00018,00020,000
$0$10$20$30$40$50$60$70$80$90
09 10 11 12 13 14 15 16 17 18
Stud
ents
Cost
in M
illio
ns
Inventory Year
Cost of Needed New School Space vs Improvements to Existing Schools and Student Enrollment Growth
New Space Existing Space Students
= Local= Regional (Serves Multiple Counties)
DRAFT

WWW.TN.GOV/TACIR28
Building Tennessee’s Tomorrow: Anticipating the State’s Infrastructure Needs
Project Type Conceptual
Planning & Design + Construction
Transportation 67,792,898$ 138,357,088$
Public Health Facilities -$ 40,500,000$
New Public Schools & Additions 1,875,000$ 35,250,680$
Post-secondary Education -$ 28,380,000$
Water and Wastewater 4,134,000$ 12,096,000$
School-System-wide -$ 16,000,000$
School Renovations 5,014,000$ 8,420,080$
Industrial Sites and Parks -$ 6,000,000$
Recreation 100,000$ 3,866,678$
Fire Protection -$ 3,111,071$
Other Facilities 3,000,000$ -$
Community Development 2,652,280$ -$
Public Buildings -$ 2,000,000$
Libraries, Museums, & Historic Sites 1,800,000$ -$
Broadband -$ -$
Business District Development -$ -$
Housing -$ -$
Law Enforcement -$ -$
Other Education -$ -$
Other Utilities -$ -$
Solid Waste -$ -$
Storm Water -$ -$Total 86,368,178$ 293,981,597$
*Total Estimated Cost = Conceptual + Planning & Design + Construction
Estimated Cost of Needed Infrastructurefor Bradley County
Five-year period July 2018 through June 2023
Bradley CountyTotal Estimated Cost* for
Infrastructure Improvements
$380,349,775
$0$10$20$30$40$50$60$70$80
$0
$50
$100
$150
$200
$250
09 10 11 12 13 14 15 16 17 18 Est.
Cos
t of
Com
plet
ions
Est.
Cos
t of
Nee
ds
Inventory Year
Transportation(in millions)
Completed
$0.0
$0.2
$0.4
$0.6
$0.8
$1.0
$0
$10
$20
$30
$40
$50
09 10 11 12 13 14 15 16 17 18 Est.
Cos
t of
Com
plet
ions
Est.
Cos
t of
Nee
ds
Inventory Year
Public Health Facilities(in millions)
Completed
$0$2$4$6$8$10$12
$0$5
$10$15$20$25$30$35$40$45$50
09 10 11 12 13 14 15 16 17 18 Est.
Cos
t of
Com
plet
ions
Est.
Cos
t of
Nee
ds
Inventory Year
New Public Schools & Additions (in millions)
Completed
TOP 3
02,0004,0006,0008,00010,00012,00014,00016,00018,000
$0$5
$10$15$20$25$30$35$40$45$50
09 10 11 12 13 14 15 16 17 18
Stud
ents
Cost
in M
illio
ns
Inventory Year
Cost of Needed New School Space vs Improvements to Existing Schools and Student Enrollment Growth
New Space Existing Space Students
= Local= Regional (Serves Multiple Counties)
DRAFT

29WWW.TN.GOV/TACIR
County Summaries
Project Type Conceptual
Planning & Design + Construction
Transportation 48,887,000$ 189,465,830$
Recreation 13,810,000$ 170,000$
Water and Wastewater 4,625,000$ 5,389,000$
Community Development 5,100,000$ -$
Industrial Sites and Parks 1,500,000$ 680,000$
Public Buildings 2,000,000$ -$
School Renovations 193,000$ 1,390,000$
Fire Protection 700,000$ -$
Storm Water 100,000$ -$
Broadband -$ -$
Business District Development -$ -$
Housing -$ -$
Law Enforcement -$ -$
Libraries, Museums, & Historic Sites -$ -$
New Public Schools & Additions -$ -$
Other Education -$ -$
Other Facilities -$ -$
Other Utilities -$ -$
Post-secondary Education -$ -$
Public Health Facilities -$ -$
School-System-wide -$ -$
Solid Waste -$ -$Total 76,915,000$ 197,094,830$
*Total Estimated Cost = Conceptual + Planning & Design + Construction
Estimated Cost of Needed Infrastructurefor Campbell County
Five-year period July 2018 through June 2023
Campbell CountyTotal Estimated Cost* for
Infrastructure Improvements
$274,009,830
$0$2$4$6$8$10$12$14
$0$50
$100$150$200$250$300
09 10 11 12 13 14 15 16 17 18 Est.
Cos
t of
Com
plet
ions
Est.
Cos
t of
Nee
ds
Inventory Year
Transportation(in millions)
Completed
$0.0$0.1$0.2$0.3$0.4$0.5$0.6
$0$2$4$6$8
$10$12$14$16
09 10 11 12 13 14 15 16 17 18 Est.
Cos
t of
Com
plet
ions
Est.
Cos
t of
Nee
ds
Inventory Year
Recreation(in millions)
Completed
$0$1$2$3$4$5$6$7$8$9$10
$0
$5
$10
$15
$20
$25
09 10 11 12 13 14 15 16 17 18 Est.
Cos
t of
Com
plet
ions
Est.
Cos
t of
Nee
ds
Inventory Year
Water and Wastewater(in millions)
Completed
TOP 3
0
1,000
2,000
3,000
4,000
5,000
6,000
7,000
$0.0$0.5$1.0$1.5$2.0$2.5$3.0$3.5$4.0$4.5
09 10 11 12 13 14 15 16 17 18
Stud
ents
Cost
in M
illio
ns
Inventory Year
Cost of Needed New School Space vs Improvements to Existing Schools and Student Enrollment Growth
New Space Existing Space Students
= Local= Regional (Serves Multiple Counties)
DRAFT

WWW.TN.GOV/TACIR30
Building Tennessee’s Tomorrow: Anticipating the State’s Infrastructure Needs
Project Type Conceptual
Planning & Design + Construction
Transportation 23,976,000$ 22,902,380$
Water and Wastewater -$ 7,800,000$
School Renovations 2,895,000$ 43,000$
Fire Protection 500,000$ -$
Other Facilities -$ 363,000$
Solid Waste -$ 150,000$
Broadband -$ -$
Business District Development -$ -$
Community Development -$ -$
Housing -$ -$
Industrial Sites and Parks -$ -$
Law Enforcement -$ -$
Libraries, Museums, & Historic Sites -$ -$
New Public Schools & Additions -$ -$
Other Education -$ -$
Other Utilities -$ -$
Post-secondary Education -$ -$
Public Buildings -$ -$
Public Health Facilities -$ -$
Recreation -$ -$
School-System-wide -$ -$
Storm Water -$ -$Total 27,371,000$ 31,258,380$
*Total Estimated Cost = Conceptual + Planning & Design + Construction
Estimated Cost of Needed Infrastructurefor Cannon County
Five-year period July 2018 through June 2023
Cannon CountyTotal Estimated Cost* for
Infrastructure Improvements
$58,629,380
$0$1$2$3$4$5$6
$0
$20
$40
$60
$80
$100
09 10 11 12 13 14 15 16 17 18 Est.
Cos
t of
Com
plet
ions
Est.
Cos
t of
Nee
ds
Inventory Year
Transportation(in millions)
Completed
$0.0$0.1$0.2$0.3$0.4$0.5$0.6
$0
$2
$4
$6
$8
$10
09 10 11 12 13 14 15 16 17 18 Est.
Cos
t of
Com
plet
ions
Est.
Cos
t of
Nee
ds
Inventory Year
Water and Wastewater(in millions)
Completed
$0.0$0.1$0.2$0.3$0.4$0.5$0.6
$0.0$0.5$1.0$1.5$2.0$2.5$3.0$3.5
09 10 11 12 13 14 15 16 17 18 Est.
Cos
t of
Com
plet
ions
Est.
Cos
t of
Nee
ds
Inventory Year
School Renovations(in millions)
Completed
TOP 3
0
500
1,000
1,500
2,000
2,500
$0.0
$0.5
$1.0
$1.5
$2.0
$2.5
$3.0
$3.5
09 10 11 12 13 14 15 16 17 18
Stud
ents
Cost
in M
illio
ns
Inventory Year
Cost of Needed New School Space vs Improvements to Existing Schools and Student Enrollment Growth
New Space Existing Space Students
= Local= Regional (Serves Multiple Counties)
DRAFT

31WWW.TN.GOV/TACIR
County Summaries
Project Type Conceptual
Planning & Design + Construction
Transportation 41,762,000$ 86,930,457$
Water and Wastewater 1,933,000$ 919,333$
School Renovations 2,000,000$ 60,000$
Recreation 1,225,000$ 696,000$
Public Buildings 1,500,000$ -$
New Public Schools & Additions -$ 551,792$
Storm Water 500,000$ -$
Fire Protection 400,000$ -$
Other Facilities 375,000$ -$
Industrial Sites and Parks -$ 257,462$
Broadband -$ -$
Business District Development -$ -$
Community Development -$ -$
Housing -$ -$
Law Enforcement -$ -$
Libraries, Museums, & Historic Sites -$ -$
Other Education -$ -$
Other Utilities -$ -$
Post-secondary Education -$ -$
Public Health Facilities -$ -$
School-System-wide -$ -$
Solid Waste -$ -$Total 49,695,000$ 89,415,044$
*Total Estimated Cost = Conceptual + Planning & Design + Construction
Estimated Cost of Needed Infrastructurefor Carroll County
Five-year period July 2018 through June 2023
Carroll CountyTotal Estimated Cost* for
Infrastructure Improvements
$139,110,044
$0$5$10$15$20$25$30
$0$20$40$60$80
$100$120$140
09 10 11 12 13 14 15 16 17 18 Est.
Cos
t of
Com
plet
ions
Est.
Cos
t of
Nee
ds
Inventory Year
Transportation(in millions)
Completed
$0.0$0.5$1.0$1.5$2.0$2.5$3.0
$0
$2
$4
$6
$8
$10
09 10 11 12 13 14 15 16 17 18 Est.
Cos
t of
Com
plet
ions
Est.
Cos
t of
Nee
ds
Inventory Year
Water and Wastewater(in millions)
Completed
$0.0$0.5$1.0$1.5$2.0$2.5$3.0$3.5
$0.0$0.5$1.0$1.5$2.0$2.5$3.0
09 10 11 12 13 14 15 16 17 18 Est.
Cos
t of
Com
plet
ions
Est.
Cos
t of
Nee
ds
Inventory Year
School Renovations(in millions)
Completed
TOP 3
05001,0001,5002,0002,5003,0003,5004,0004,5005,000
$0.0
$0.5
$1.0
$1.5
$2.0
$2.5
$3.0
09 10 11 12 13 14 15 16 17 18
Stud
ents
Cost
in M
illio
ns
Inventory Year
Cost of Needed New School Space vs Improvements to Existing Schools and Student Enrollment Growth
New Space Existing Space Students
= Local= Regional (Serves Multiple Counties)
DRAFT

WWW.TN.GOV/TACIR32
Building Tennessee’s Tomorrow: Anticipating the State’s Infrastructure Needs
Project Type Conceptual
Planning & Design + Construction
Transportation 66,036,000$ 50,017,201$
Recreation 4,850,000$ 24,950,510$
School Renovations 17,095,650$ 2,297,254$
Water and Wastewater 15,200,031$ 267,995$
New Public Schools & Additions 6,700,000$ 60,000$
Housing 2,200,000$ 1,750,000$
Law Enforcement 620,000$ 2,700,000$
Libraries, Museums, & Historic Sites 1,600,000$ 1,000,000$
Fire Protection 2,507,984$ -$
Post-secondary Education 860,000$ 1,637,049$
Public Health Facilities -$ 1,000,000$
Solid Waste 950,000$ -$
Industrial Sites and Parks 697,000$ -$
Business District Development -$ 500,000$
Public Buildings 200,000$ -$
Broadband -$ -$
Community Development -$ -$
Other Education -$ -$
Other Facilities -$ -$
Other Utilities -$ -$
School-System-wide -$ -$
Storm Water -$ -$Total 119,516,665$ 86,180,009$
*Total Estimated Cost = Conceptual + Planning & Design + Construction
Estimated Cost of Needed Infrastructurefor Carter County
Five-year period July 2018 through June 2023
Carter CountyTotal Estimated Cost* for
Infrastructure Improvements
$205,696,674
$0$10$20$30$40$50$60$70$80
$0
$50
$100
$150
$200
09 10 11 12 13 14 15 16 17 18 Est.
Cos
t of
Com
plet
ions
Est.
Cos
t of
Nee
ds
Inventory Year
Transportation(in millions)
Completed
$0.0$0.2$0.4$0.6$0.8$1.0$1.2$1.4$1.6
$0$5
$10$15$20$25$30$35
09 10 11 12 13 14 15 16 17 18 Est.
Cos
t of
Com
plet
ions
Est.
Cos
t of
Nee
ds
Inventory Year
Recreation(in millions)
Completed
$0$1$2$3$4$5$6$7$8
$0$5
$10$15$20$25$30
09 10 11 12 13 14 15 16 17 18 Est.
Cos
t of
Com
plet
ions
Est.
Cos
t of
Nee
ds
Inventory Year
School Renovations(in millions)
Completed
TOP 3
01,0002,0003,0004,0005,0006,0007,0008,0009,000
$0
$5
$10
$15
$20
$25
$30
09 10 11 12 13 14 15 16 17 18
Stud
ents
Cost
in M
illio
ns
Inventory Year
Cost of Needed New School Space vs Improvements to Existing Schools and Student Enrollment Growth
New Space Existing Space Students
= Local= Regional (Serves Multiple Counties)
DRAFT

33WWW.TN.GOV/TACIR
County Summaries
Project Type Conceptual
Planning & Design + Construction
Transportation 26,917,000$ 141,712,579$
New Public Schools & Additions -$ 40,000,000$
Water and Wastewater 1,000,000$ 14,449,000$
Recreation 9,815,295$ 3,157,421$
Law Enforcement -$ 12,000,000$
Public Buildings 1,600,000$ 5,000,000$
School Renovations 102,000$ 4,784,010$
Community Development 3,000,000$ -$
Industrial Sites and Parks 2,100,000$ -$
School-System-wide -$ 1,200,000$
Libraries, Museums, & Historic Sites 1,000,000$ -$
Business District Development 500,000$ -$
Fire Protection 300,000$ 130,710$
Storm Water 200,000$ -$
Other Facilities 50,000$ -$
Broadband -$ -$
Housing -$ -$
Other Education -$ -$
Other Utilities -$ -$
Post-secondary Education -$ -$
Public Health Facilities -$ -$
Solid Waste -$ -$Total 46,584,295$ 222,433,720$
*Total Estimated Cost = Conceptual + Planning & Design + Construction
Estimated Cost of Needed Infrastructurefor Cheatham County
Five-year period July 2018 through June 2023
Cheatham CountyTotal Estimated Cost* for
Infrastructure Improvements
$269,018,015
$0$5$10$15$20$25$30
$0
$50
$100
$150
$200
09 10 11 12 13 14 15 16 17 18 Est.
Cos
t of
Com
plet
ions
Est.
Cos
t of
Nee
ds
Inventory Year
Transportation(in millions)
Completed
$0.0$0.5$1.0$1.5$2.0$2.5$3.0$3.5
$0
$10
$20
$30
$40
$50
09 10 11 12 13 14 15 16 17 18 Est.
Cos
t of
Com
plet
ions
Est.
Cos
t of
Nee
ds
Inventory Year
New Public Schools & Additions (in millions)
Completed
$0.0$0.5$1.0$1.5$2.0$2.5$3.0$3.5$4.0
$0$5
$10$15$20$25$30
09 10 11 12 13 14 15 16 17 18 Est.
Cos
t of
Com
plet
ions
Est.
Cos
t of
Nee
ds
Inventory Year
Water and Wastewater(in millions)
Completed
TOP 3
01,0002,0003,0004,0005,0006,0007,0008,000
$0$5
$10$15$20$25$30$35$40$45
09 10 11 12 13 14 15 16 17 18
Stud
ents
Cost
in M
illio
ns
Inventory Year
Cost of Needed New School Space vs Improvements to Existing Schools and Student Enrollment Growth
New Space Existing Space Students
= Local= Regional (Serves Multiple Counties)
DRAFT

WWW.TN.GOV/TACIR34
Building Tennessee’s Tomorrow: Anticipating the State’s Infrastructure Needs
Project Type Conceptual
Planning & Design + Construction
Transportation 17,227,000$ 30,001,200$
Water and Wastewater 6,900,000$ -$
Recreation 1,510,000$ 5,295,000$
School Renovations 3,094,750$ -$
New Public Schools & Additions -$ 1,800,000$
Public Buildings 1,800,000$ -$
Law Enforcement 1,240,000$ -$
Broadband -$ -$
Business District Development -$ -$
Community Development -$ -$
Fire Protection -$ -$
Housing -$ -$
Industrial Sites and Parks -$ -$
Libraries, Museums, & Historic Sites -$ -$
Other Education -$ -$
Other Facilities -$ -$
Other Utilities -$ -$
Post-secondary Education -$ -$
Public Health Facilities -$ -$
School-System-wide -$ -$
Solid Waste -$ -$
Storm Water -$ -$Total 31,771,750$ 37,096,200$
*Total Estimated Cost = Conceptual + Planning & Design + Construction
Estimated Cost of Needed Infrastructurefor Chester County
Five-year period July 2018 through June 2023
Chester CountyTotal Estimated Cost* for
Infrastructure Improvements
$68,867,950
$0.0
$0.5
$1.0
$1.5
$2.0
$0
$10
$20
$30
$40
$50
09 10 11 12 13 14 15 16 17 18 Est.
Cos
t of
Com
plet
ions
Est.
Cos
t of
Nee
ds
Inventory Year
Transportation(in millions)
Completed
$0.0
$0.1
$0.2
$0.3
$0.4
$0.5
$0$2$4$6$8
$10$12$14
09 10 11 12 13 14 15 16 17 18 Est.
Cos
t of
Com
plet
ions
Est.
Cos
t of
Nee
ds
Inventory Year
Water and Wastewater(in millions)
Completed
$0.0$0.2$0.4$0.6$0.8$1.0$1.2
$0$1$2$3$4$5$6$7$8
09 10 11 12 13 14 15 16 17 18 Est.
Cos
t of
Com
plet
ions
Est.
Cos
t of
Nee
ds
Inventory Year
Recreation(in millions)
Completed
TOP 3
0
500
1,000
1,500
2,000
2,500
3,000
$0.0
$0.5
$1.0
$1.5
$2.0
$2.5
$3.0
$3.5
09 10 11 12 13 14 15 16 17 18
Stud
ents
Cost
in M
illio
ns
Inventory Year
Cost of Needed New School Space vs Improvements to Existing Schools and Student Enrollment Growth
New Space Existing Space Students
= Local= Regional (Serves Multiple Counties)
DRAFT

35WWW.TN.GOV/TACIR
County Summaries
Project Type Conceptual
Planning & Design + Construction
Transportation 24,558,000$ 47,419,799$
New Public Schools & Additions 11,300,000$ -$
Water and Wastewater 10,169,720$ 1,000,000$
School Renovations 4,809,060$ 697,000$
Recreation 500,000$ 1,757,821$
Law Enforcement 860,000$ 760,000$
Fire Protection 1,000,000$ -$
Public Buildings 500,000$ -$
Business District Development 400,000$ -$
Other Facilities 200,000$ -$
Broadband -$ -$
Community Development -$ -$
Housing -$ -$
Industrial Sites and Parks -$ -$
Libraries, Museums, & Historic Sites -$ -$
Other Education -$ -$
Other Utilities -$ -$
Post-secondary Education -$ -$
Public Health Facilities -$ -$
School-System-wide -$ -$
Solid Waste -$ -$
Storm Water -$ -$Total 54,296,780$ 51,634,620$
*Total Estimated Cost = Conceptual + Planning & Design + Construction
Estimated Cost of Needed Infrastructurefor Claiborne County
Five-year period July 2018 through June 2023
Claiborne CountyTotal Estimated Cost* for
Infrastructure Improvements
$105,931,400
$0$5$10$15$20$25$30$35$40
$0
$50
$100
$150
$200
09 10 11 12 13 14 15 16 17 18 Est.
Cos
t of
Com
plet
ions
Est.
Cos
t of
Nee
ds
Inventory Year
Transportation(in millions)
Completed
$0.00$0.05$0.10$0.15$0.20$0.25$0.30$0.35$0.40
$0$2$4$6$8
$10$12$14
09 10 11 12 13 14 15 16 17 18 Est.
Cos
t of
Com
plet
ions
Est.
Cos
t of
Nee
ds
Inventory Year
New Public Schools & Additions (in millions)
Completed
$0$2$4$6$8$10$12$14$16
$0$5
$10$15$20$25$30
09 10 11 12 13 14 15 16 17 18 Est.
Cos
t of
Com
plet
ions
Est.
Cos
t of
Nee
ds
Inventory Year
Water and Wastewater(in millions)
Completed
TOP 3
05001,0001,5002,0002,5003,0003,5004,0004,5005,000
$0
$2
$4
$6
$8
$10
$12
$14
09 10 11 12 13 14 15 16 17 18
Stud
ents
Cost
in M
illio
ns
Inventory Year
Cost of Needed New School Space vs Improvements to Existing Schools and Student Enrollment Growth
New Space Existing Space Students
= Local= Regional (Serves Multiple Counties)
DRAFT

WWW.TN.GOV/TACIR36
Building Tennessee’s Tomorrow: Anticipating the State’s Infrastructure Needs
Project Type Conceptual
Planning & Design + Construction
Transportation 7,074,000$ 488,000$
Law Enforcement -$ 5,000,000$
Other Utilities 5,000,000$ -$
Water and Wastewater -$ 2,350,000$
Industrial Sites and Parks -$ 1,700,000$
Solid Waste -$ 500,000$
School Renovations 400,000$ -$
New Public Schools & Additions 350,000$ -$
Broadband -$ -$
Business District Development -$ -$
Community Development -$ -$
Fire Protection -$ -$
Housing -$ -$
Libraries, Museums, & Historic Sites -$ -$
Other Education -$ -$
Other Facilities -$ -$
Post-secondary Education -$ -$
Public Buildings -$ -$
Public Health Facilities -$ -$
Recreation -$ -$
School-System-wide -$ -$
Storm Water -$ -$Total 12,824,000$ 10,038,000$
*Total Estimated Cost = Conceptual + Planning & Design + Construction
Estimated Cost of Needed Infrastructurefor Clay County
Five-year period July 2018 through June 2023
Clay CountyTotal Estimated Cost* for
Infrastructure Improvements
$22,862,000
$0$10$20$30$40$50$60
$0$20$40$60$80
$100$120
09 10 11 12 13 14 15 16 17 18 Est.
Cos
t of
Com
plet
ions
Est.
Cos
t of
Nee
ds
Inventory Year
Transportation(in millions)
Completed
$0.0
$0.2
$0.4
$0.6
$0.8
$1.0
$0$1$2$3$4$5$6
09 10 11 12 13 14 15 16 17 18 Est.
Cos
t of
Com
plet
ions
Est.
Cos
t of
Nee
ds
Inventory Year
Law Enforcement(in millions)
Completed
$0.0$0.1$0.2$0.3$0.4$0.5$0.6$0.7$0.8$0.9$1.0
$0
$5
$10
$15
$20
$25
09 10 11 12 13 14 15 16 17 18 Est.
Cos
t of
Com
plet
ions
Est.
Cos
t of
Nee
ds
Inventory Year
Other Utilities(in millions)
Completed
TOP 3
0
200
400
600
800
1,000
1,200
$0.0$0.2$0.4$0.6$0.8$1.0$1.2$1.4$1.6
09 10 11 12 13 14 15 16 17 18
Stud
ents
Cost
in M
illio
ns
Inventory Year
Cost of Needed New School Space vs Improvements to Existing Schools and Student Enrollment Growth
New Space Existing Space Students
= Local= Regional (Serves Multiple Counties)
DRAFT

37WWW.TN.GOV/TACIR
County Summaries
Project Type Conceptual
Planning & Design + Construction
Transportation 44,515,000$ 177,367,025$
Water and Wastewater -$ 23,388,000$
New Public Schools & Additions 7,676,000$ 3,590,000$
School Renovations 8,456,000$ 1,808,807$
Broadband -$ 7,000,000$
Other Utilities 2,900,000$ 3,200,000$
Law Enforcement 3,000,000$ -$
Recreation -$ 507,560$
Business District Development -$ -$
Community Development -$ -$
Fire Protection -$ -$
Housing -$ -$
Industrial Sites and Parks -$ -$
Libraries, Museums, & Historic Sites -$ -$
Other Education -$ -$
Other Facilities -$ -$
Post-secondary Education -$ -$
Public Buildings -$ -$
Public Health Facilities -$ -$
School-System-wide -$ -$
Solid Waste -$ -$
Storm Water -$ -$Total 66,547,000$ 216,861,392$
*Total Estimated Cost = Conceptual + Planning & Design + Construction
Estimated Cost of Needed Infrastructurefor Cocke County
Five-year period July 2018 through June 2023
Cocke CountyTotal Estimated Cost* for
Infrastructure Improvements
$283,408,392
$0$10$20$30$40$50$60
$0$50
$100$150$200$250$300
09 10 11 12 13 14 15 16 17 18 Est.
Cos
t of
Com
plet
ions
Est.
Cos
t of
Nee
ds
Inventory Year
Transportation(in millions)
Completed
$0
$2
$4
$6
$8
$10
$0
$5
$10
$15
$20
$25
09 10 11 12 13 14 15 16 17 18 Est.
Cos
t of
Com
plet
ions
Est.
Cos
t of
Nee
ds
Inventory Year
Water and Wastewater(in millions)
Completed
$0.0
$0.5
$1.0
$1.5
$2.0
$2.5
$0$2$4$6$8
$10$12
09 10 11 12 13 14 15 16 17 18 Est.
Cos
t of
Com
plet
ions
Est.
Cos
t of
Nee
ds
Inventory Year
New Public Schools & Additions (in millions)
Completed
TOP 3
0
1,000
2,000
3,000
4,000
5,000
6,000
$0
$2
$4
$6
$8
$10
$12
09 10 11 12 13 14 15 16 17 18
Stud
ents
Cost
in M
illio
ns
Inventory Year
Cost of Needed New School Space vs Improvements to Existing Schools and Student Enrollment Growth
New Space Existing Space Students
= Local= Regional (Serves Multiple Counties)
DRAFT

WWW.TN.GOV/TACIR38
Building Tennessee’s Tomorrow: Anticipating the State’s Infrastructure Needs
Project Type Conceptual
Planning & Design + Construction
Transportation 55,930,000$ 52,665,927$
New Public Schools & Additions 11,000,000$ 500,000$
School Renovations 5,000,000$ 6,350,000$
Water and Wastewater 4,000,000$ 6,290,000$
Public Buildings 180,000$ 3,200,000$
Recreation -$ 1,200,000$
Law Enforcement -$ 590,000$
Industrial Sites and Parks 500,000$ -$
Broadband -$ -$
Business District Development -$ -$
Community Development -$ -$
Fire Protection -$ -$
Housing -$ -$
Libraries, Museums, & Historic Sites -$ -$
Other Education -$ -$
Other Facilities -$ -$
Other Utilities -$ -$
Post-secondary Education -$ -$
Public Health Facilities -$ -$
School-System-wide -$ -$
Solid Waste -$ -$
Storm Water -$ -$Total 76,610,000$ 70,795,927$
*Total Estimated Cost = Conceptual + Planning & Design + Construction
Estimated Cost of Needed Infrastructurefor Coffee County
Five-year period July 2018 through June 2023
Coffee CountyTotal Estimated Cost* for
Infrastructure Improvements
$147,405,927
$0
$5
$10
$15
$20
$0$20$40$60$80
$100$120$140
09 10 11 12 13 14 15 16 17 18 Est.
Cos
t of
Com
plet
ions
Est.
Cos
t of
Nee
ds
Inventory Year
Transportation(in millions)
Completed
$0$5$10$15$20$25$30
$0$5
$10$15$20$25$30
09 10 11 12 13 14 15 16 17 18 Est.
Cos
t of
Com
plet
ions
Est.
Cos
t of
Nee
ds
Inventory Year
New Public Schools & Additions (in millions)
Completed
$0$1$2$3$4$5$6$7$8$9$10
$0$5
$10$15$20$25$30
09 10 11 12 13 14 15 16 17 18 Est.
Cos
t of
Com
plet
ions
Est.
Cos
t of
Nee
ds
Inventory Year
School Renovations(in millions)
Completed
TOP 3
01,0002,0003,0004,0005,0006,0007,0008,0009,00010,000
$0
$5
$10
$15
$20
$25
$30
09 10 11 12 13 14 15 16 17 18
Stud
ents
Cost
in M
illio
ns
Inventory Year
Cost of Needed New School Space vs Improvements to Existing Schools and Student Enrollment Growth
New Space Existing Space Students
= Local= Regional (Serves Multiple Counties)
DRAFT

39WWW.TN.GOV/TACIR
County Summaries
Project Type Conceptual
Planning & Design + Construction
Transportation 24,631,000$ 3,841,578$
New Public Schools & Additions 4,550,000$ 7,100,000$
School Renovations 2,880,000$ 1,550,000$
Water and Wastewater 2,622,726$ 404,000$
Recreation 1,100,000$ -$
Public Buildings 200,000$ 800,000$
Community Development 500,000$ -$
Broadband -$ -$
Business District Development -$ -$
Fire Protection -$ -$
Housing -$ -$
Industrial Sites and Parks -$ -$
Law Enforcement -$ -$
Libraries, Museums, & Historic Sites -$ -$
Other Education -$ -$
Other Facilities -$ -$
Other Utilities -$ -$
Post-secondary Education -$ -$
Public Health Facilities -$ -$
School-System-wide -$ -$
Solid Waste -$ -$
Storm Water -$ -$Total 36,483,726$ 13,695,578$
*Total Estimated Cost = Conceptual + Planning & Design + Construction
Estimated Cost of Needed Infrastructurefor Crockett County
Five-year period July 2018 through June 2023
Crockett CountyTotal Estimated Cost* for
Infrastructure Improvements
$50,179,304
$0$1$2$3$4$5$6$7
$0$5
$10$15$20$25$30$35$40
09 10 11 12 13 14 15 16 17 18 Est.
Cos
t of
Com
plet
ions
Est.
Cos
t of
Nee
ds
Inventory Year
Transportation(in millions)
Completed
$0.00$0.05$0.10$0.15$0.20$0.25$0.30$0.35$0.40
$0
$5
$10
$15
$20
09 10 11 12 13 14 15 16 17 18 Est.
Cos
t of
Com
plet
ions
Est.
Cos
t of
Nee
ds
Inventory Year
New Public Schools & Additions (in millions)
Completed
$0.0$0.2$0.4$0.6$0.8$1.0$1.2$1.4$1.6$1.8$2.0
$0.0$0.5$1.0$1.5$2.0$2.5$3.0$3.5$4.0$4.5$5.0
09 10 11 12 13 14 15 16 17 18 Est.
Cos
t of
Com
plet
ions
Est.
Cos
t of
Nee
ds
Inventory Year
School Renovations(in millions)
Completed
TOP 3
0
500
1,000
1,500
2,000
2,500
3,000
3,500
$0$2$4$6$8
$10$12$14$16$18$20
09 10 11 12 13 14 15 16 17 18
Stud
ents
Cost
in M
illio
ns
Inventory Year
Cost of Needed New School Space vs Improvements to Existing Schools and Student Enrollment Growth
New Space Existing Space Students
= Local= Regional (Serves Multiple Counties)
DRAFT

WWW.TN.GOV/TACIR40
Building Tennessee’s Tomorrow: Anticipating the State’s Infrastructure Needs
Project Type Conceptual
Planning & Design + Construction
Transportation 29,052,000$ 337,280,413$
Water and Wastewater 53,200,000$ 14,200,000$
School Renovations 4,572,000$ 16,715,000$
Industrial Sites and Parks -$ 18,500,000$
Recreation 5,160,000$ 1,270,000$
Business District Development -$ 6,000,000$
Other Utilities -$ 1,500,000$
Post-secondary Education -$ 1,420,000$
New Public Schools & Additions 1,100,000$ -$
Storm Water -$ 300,000$
Broadband -$ -$
Community Development -$ -$
Fire Protection -$ -$
Housing -$ -$
Law Enforcement -$ -$
Libraries, Museums, & Historic Sites -$ -$
Other Education -$ -$
Other Facilities -$ -$
Public Buildings -$ -$
Public Health Facilities -$ -$
School-System-wide -$ -$
Solid Waste -$ -$Total 93,084,000$ 397,185,413$
*Total Estimated Cost = Conceptual + Planning & Design + Construction
Estimated Cost of Needed Infrastructurefor Cumberland County
Five-year period July 2018 through June 2023
Cumberland CountyTotal Estimated Cost* for
Infrastructure Improvements
$490,269,413
$0$5$10$15$20$25$30
$0
$100
$200
$300
$400
$500
09 10 11 12 13 14 15 16 17 18 Est.
Cos
t of
Com
plet
ions
Est.
Cos
t of
Nee
ds
Inventory Year
Transportation(in millions)
Completed
$0$1$2$3$4$5$6$7$8
$0$10$20$30$40$50$60$70$80
09 10 11 12 13 14 15 16 17 18 Est.
Cos
t of
Com
plet
ions
Est.
Cos
t of
Nee
ds
Inventory Year
Water and Wastewater(in millions)
Completed
$0.0$0.5$1.0$1.5$2.0$2.5$3.0$3.5$4.0$4.5$5.0
$0
$5
$10
$15
$20
$25
09 10 11 12 13 14 15 16 17 18 Est.
Cos
t of
Com
plet
ions
Est.
Cos
t of
Nee
ds
Inventory Year
School Renovations(in millions)
Completed
TOP 3
01,0002,0003,0004,0005,0006,0007,0008,000
$0
$5
$10
$15
$20
$25
$30
09 10 11 12 13 14 15 16 17 18
Stud
ents
Cost
in M
illio
ns
Inventory Year
Cost of Needed New School Space vs Improvements to Existing Schools and Student Enrollment Growth
New Space Existing Space Students
= Local= Regional (Serves Multiple Counties)
DRAFT

41WWW.TN.GOV/TACIR
County Summaries
Project Type Conceptual
Planning & Design + Construction
School Renovations 3,021,950,000$ 121,471,200$
Transportation 508,924,000$ 1,910,340,890$
Water and Wastewater 3,624,000$ 1,106,977,300$
Law Enforcement 292,490,000$ 275,250,000$
Post-secondary Education 222,960,000$ 240,400,722$
New Public Schools & Additions 415,440,000$ -$
Public Buildings 255,770,000$ 140,736,823$
Libraries, Museums, & Historic Sites 47,593,000$ 320,392,000$
Recreation -$ 93,660,000$
Public Health Facilities 40,702,000$ 11,048,000$
Housing -$ 45,000,000$
Fire Protection 38,000,000$ -$
Community Development -$ 27,200,000$
Other Facilities 21,490,000$ 2,500,000$
Other Education 11,345,000$ 5,970,000$
Business District Development 12,000,000$ -$
Other Utilities 3,300,000$ -$
Storm Water 50,000$ -$
Broadband -$ -$
Industrial Sites and Parks -$ -$
School-System-wide -$ -$
Solid Waste -$ -$Total 4,895,638,000$ 4,300,946,935$
*Total Estimated Cost = Conceptual + Planning & Design + Construction
Estimated Cost of Needed Infrastructurefor Davidson County
Five-year period July 2018 through June 2023
Davidson CountyTotal Estimated Cost* for
Infrastructure Improvements
$9,196,584,935
$0
$20
$40
$60
$80
$100
$0$500
$1,000$1,500$2,000$2,500$3,000$3,500
09 10 11 12 13 14 15 16 17 18 Est.
Cos
t of
Com
plet
ions
Est.
Cos
t of
Nee
ds
Inventory Year
School Renovations(in millions)
Completed
$0
$50
$100
$150
$200
$0$500
$1,000$1,500$2,000$2,500$3,000
09 10 11 12 13 14 15 16 17 18 Est.
Cos
t of
Com
plet
ions
Est.
Cos
t of
Nee
ds
Inventory Year
Transportation(in millions)
Completed
$0$20$40$60$80$100$120$140$160
$0$200$400$600$800
$1,000$1,200$1,400
09 10 11 12 13 14 15 16 17 18 Est.
Cos
t of
Com
plet
ions
Est.
Cos
t of
Nee
ds
Inventory Year
Water and Wastewater(in millions)
Completed
TOP 3
010,00020,00030,00040,00050,00060,00070,00080,00090,000
$0
$500
$1,000
$1,500
$2,000
$2,500
$3,000
$3,500
09 10 11 12 13 14 15 16 17 18
Stud
ents
Cost
in M
illio
ns
Inventory Year
Cost of Needed New School Space vs Improvements to Existing Schools and Student Enrollment Growth
New Space Existing Space Students
= Local= Regional (Serves Multiple Counties)
DRAFT

WWW.TN.GOV/TACIR42
Building Tennessee’s Tomorrow: Anticipating the State’s Infrastructure Needs
Project Type Conceptual
Planning & Design + Construction
Transportation 84,214,000$ 2,843,900$
School Renovations 696,700$ 1,386,000$
Storm Water 750,000$ -$
Broadband -$ -$
Business District Development -$ -$
Community Development -$ -$
Fire Protection -$ -$
Housing -$ -$
Industrial Sites and Parks -$ -$
Law Enforcement -$ -$
Libraries, Museums, & Historic Sites -$ -$
New Public Schools & Additions -$ -$
Other Education -$ -$
Other Facilities -$ -$
Other Utilities -$ -$
Post-secondary Education -$ -$
Public Buildings -$ -$
Public Health Facilities -$ -$
Recreation -$ -$
School-System-wide -$ -$
Solid Waste -$ -$
Water and Wastewater -$ -$Total 85,660,700$ 4,229,900$
*Total Estimated Cost = Conceptual + Planning & Design + Construction
Estimated Cost of Needed Infrastructurefor Decatur County
Five-year period July 2018 through June 2023
Decatur CountyTotal Estimated Cost* for
Infrastructure Improvements
$89,890,600
$0$5$10$15$20$25$30
$0
$20
$40
$60
$80
$100
09 10 11 12 13 14 15 16 17 18 Est.
Cos
t of
Com
plet
ions
Est.
Cos
t of
Nee
ds
Inventory Year
Transportation(in millions)
Completed
$0.0$0.1$0.2$0.3$0.4$0.5$0.6$0.7
$0.0
$0.5
$1.0
$1.5
$2.0
$2.5
09 10 11 12 13 14 15 16 17 18 Est.
Cos
t of
Com
plet
ions
Est.
Cos
t of
Nee
ds
Inventory Year
School Renovations(in millions)
Completed
$0.0$0.1$0.2$0.3$0.4$0.5$0.6$0.7$0.8$0.9$1.0
$0.0$0.1$0.2$0.3$0.4$0.5$0.6$0.7$0.8
09 10 11 12 13 14 15 16 17 18 Est.
Cos
t of
Com
plet
ions
Est.
Cos
t of
Nee
ds
Inventory Year
Storm Water(in millions)
Completed
TOP 3
02004006008001,0001,2001,4001,6001,800
$0.0
$0.5
$1.0
$1.5
$2.0
$2.5
09 10 11 12 13 14 15 16 17 18
Stud
ents
Cost
in M
illio
ns
Inventory Year
Cost of Needed New School Space vs Improvements to Existing Schools and Student Enrollment Growth
New Space Existing Space Students
= Local= Regional (Serves Multiple Counties)
DRAFT

43WWW.TN.GOV/TACIR
County Summaries
Project Type Conceptual
Planning & Design + Construction
Transportation 17,671,000$ 82,180,000$
New Public Schools & Additions 6,060,000$ 42,000,000$
Recreation 330,000$ 2,200,000$
Industrial Sites and Parks 2,250,000$ -$
Law Enforcement 1,300,000$ -$
Water and Wastewater -$ 915,543$
School Renovations 275,000$ -$
Public Health Facilities 146,000$ -$
Fire Protection -$ 75,000$
Broadband -$ -$
Business District Development -$ -$
Community Development -$ -$
Housing -$ -$
Libraries, Museums, & Historic Sites -$ -$
Other Education -$ -$
Other Facilities -$ -$
Other Utilities -$ -$
Post-secondary Education -$ -$
Public Buildings -$ -$
School-System-wide -$ -$
Solid Waste -$ -$
Storm Water -$ -$Total 28,032,000$ 127,370,543$
*Total Estimated Cost = Conceptual + Planning & Design + Construction
Estimated Cost of Needed Infrastructurefor DeKalb County
Five-year period July 2018 through June 2023
DeKalb CountyTotal Estimated Cost* for
Infrastructure Improvements
$155,402,543
$0$10$20$30$40$50$60
$0
$50
$100
$150
$200
$250
09 10 11 12 13 14 15 16 17 18 Est.
Cos
t of
Com
plet
ions
Est.
Cos
t of
Nee
ds
Inventory Year
Transportation(in millions)
Completed
$0.0
$0.5
$1.0
$1.5
$2.0
$0$10$20$30$40$50$60
09 10 11 12 13 14 15 16 17 18 Est.
Cos
t of
Com
plet
ions
Est.
Cos
t of
Nee
ds
Inventory Year
New Public Schools & Additions (in millions)
Completed
$0.0
$0.5
$1.0
$1.5
$2.0
$2.5
$0$1$2$3$4$5$6
09 10 11 12 13 14 15 16 17 18 Est.
Cos
t of
Com
plet
ions
Est.
Cos
t of
Nee
ds
Inventory Year
Recreation(in millions)
Completed
TOP 3
0
500
1,000
1,500
2,000
2,500
3,000
3,500
$0
$10
$20
$30
$40
$50
$60
09 10 11 12 13 14 15 16 17 18
Stud
ents
Cost
in M
illio
ns
Inventory Year
Cost of Needed New School Space vs Improvements to Existing Schools and Student Enrollment Growth
New Space Existing Space Students
= Local= Regional (Serves Multiple Counties)
DRAFT

WWW.TN.GOV/TACIR44
Building Tennessee’s Tomorrow: Anticipating the State’s Infrastructure Needs
Project Type Conceptual
Planning & Design + Construction
Transportation 44,084,000$ 61,885,758$
New Public Schools & Additions 33,000,000$ 34,951,000$
Recreation 8,080,000$ 23,480,000$
Public Buildings 2,500,000$ 29,000,000$
School Renovations 6,948,948$ 6,343,717$
Water and Wastewater -$ 9,118,962$
Business District Development -$ 2,667,495$
Fire Protection 1,000,000$ 600,000$
Solid Waste -$ 1,500,000$
Other Facilities 770,000$ -$
Community Development -$ 630,000$
Post-secondary Education -$ 550,000$
School-System-wide -$ 200,000$
Broadband -$ -$
Housing -$ -$
Industrial Sites and Parks -$ -$
Law Enforcement -$ -$
Libraries, Museums, & Historic Sites -$ -$
Other Education -$ -$
Other Utilities -$ -$
Public Health Facilities -$ -$
Storm Water -$ -$Total 96,382,948$ 170,926,932$
*Total Estimated Cost = Conceptual + Planning & Design + Construction
Estimated Cost of Needed Infrastructurefor Dickson County
Five-year period July 2018 through June 2023
Dickson CountyTotal Estimated Cost* for
Infrastructure Improvements
$267,309,880
$0
$5
$10
$15
$20
$0$50
$100$150$200$250$300
09 10 11 12 13 14 15 16 17 18 Est.
Cos
t of
Com
plet
ions
Est.
Cos
t of
Nee
ds
Inventory Year
Transportation(in millions)
Completed
$0.0
$0.2
$0.4
$0.6
$0.8
$1.0
$0$10$20$30$40$50$60$70$80
09 10 11 12 13 14 15 16 17 18 Est.
Cos
t of
Com
plet
ions
Est.
Cos
t of
Nee
ds
Inventory Year
New Public Schools & Additions (in millions)
Completed
$0.0$0.5$1.0$1.5$2.0$2.5$3.0$3.5$4.0
$0$5
$10$15$20$25$30$35
09 10 11 12 13 14 15 16 17 18 Est.
Cos
t of
Com
plet
ions
Est.
Cos
t of
Nee
ds
Inventory Year
Recreation(in millions)
Completed
TOP 3
01,0002,0003,0004,0005,0006,0007,0008,0009,000
$0$10$20$30$40$50$60$70$80
09 10 11 12 13 14 15 16 17 18
Stud
ents
Cost
in M
illio
ns
Inventory Year
Cost of Needed New School Space vs Improvements to Existing Schools and Student Enrollment Growth
New Space Existing Space Students
= Local= Regional (Serves Multiple Counties)
DRAFT

45WWW.TN.GOV/TACIR
County Summaries
Project Type Conceptual
Planning & Design + Construction
Transportation 99,282,000$ 232,555,147$
Water and Wastewater 4,950,000$ 3,000,000$
School Renovations 2,560,000$ 3,680,000$
Recreation 150,000$ 4,200,000$
Post-secondary Education 400,000$ 3,585,000$
Public Buildings 1,206,000$ 425,000$
Fire Protection 1,250,000$ -$
Other Facilities 1,100,000$ -$
Law Enforcement 1,000,000$ -$
Community Development 800,000$ -$
New Public Schools & Additions 380,000$ -$
Broadband -$ -$
Business District Development -$ -$
Housing -$ -$
Industrial Sites and Parks -$ -$
Libraries, Museums, & Historic Sites -$ -$
Other Education -$ -$
Other Utilities -$ -$
Public Health Facilities -$ -$
School-System-wide -$ -$
Solid Waste -$ -$
Storm Water -$ -$Total 113,078,000$ 247,445,147$
*Total Estimated Cost = Conceptual + Planning & Design + Construction
Estimated Cost of Needed Infrastructurefor Dyer County
Five-year period July 2018 through June 2023
Dyer CountyTotal Estimated Cost* for
Infrastructure Improvements
$360,523,147
$0$1$2$3$4$5$6$7$8
$0$200$400$600$800
$1,000$1,200
09 10 11 12 13 14 15 16 17 18 Est.
Cos
t of
Com
plet
ions
Est.
Cos
t of
Nee
ds
Inventory Year
Transportation(in millions)
Completed
$0.0$0.5$1.0$1.5$2.0$2.5$3.0
$0$2$4$6$8
$10$12
09 10 11 12 13 14 15 16 17 18 Est.
Cos
t of
Com
plet
ions
Est.
Cos
t of
Nee
ds
Inventory Year
Water and Wastewater(in millions)
Completed
$0$1$2$3$4$5$6$7
$0$2$4$6$8
$10$12$14$16
09 10 11 12 13 14 15 16 17 18 Est.
Cos
t of
Com
plet
ions
Est.
Cos
t of
Nee
ds
Inventory Year
School Renovations(in millions)
Completed
TOP 3
01,0002,0003,0004,0005,0006,0007,0008,000
$0
$5
$10
$15
$20
$25
09 10 11 12 13 14 15 16 17 18
Stud
ents
Cost
in M
illio
ns
Inventory Year
Cost of Needed New School Space vs Improvements to Existing Schools and Student Enrollment Growth
New Space Existing Space Students
= Local= Regional (Serves Multiple Counties)
DRAFT

WWW.TN.GOV/TACIR46
Building Tennessee’s Tomorrow: Anticipating the State’s Infrastructure Needs
Project Type Conceptual
Planning & Design + Construction
Transportation 85,948,500$ 130,265,566$
Law Enforcement -$ 4,210,000$
School Renovations 3,960,000$ -$
Water and Wastewater 1,570,000$ 1,531,365$
Recreation 725,000$ -$
Fire Protection -$ 300,000$
Community Development -$ 219,686$
Housing 200,000$ -$
Broadband -$ -$
Business District Development -$ -$
Industrial Sites and Parks -$ -$
Libraries, Museums, & Historic Sites -$ -$
New Public Schools & Additions -$ -$
Other Education -$ -$
Other Facilities -$ -$
Other Utilities -$ -$
Post-secondary Education -$ -$
Public Buildings -$ -$
Public Health Facilities -$ -$
School-System-wide -$ -$
Solid Waste -$ -$
Storm Water -$ -$Total 92,403,500$ 136,526,617$
*Total Estimated Cost = Conceptual + Planning & Design + Construction
Estimated Cost of Needed Infrastructurefor Fayette County
Five-year period July 2018 through June 2023
Fayette CountyTotal Estimated Cost* for
Infrastructure Improvements
$228,930,117
$0$5$10$15$20$25$30$35$40
$0$50
$100$150$200$250$300$350
09 10 11 12 13 14 15 16 17 18 Est.
Cos
t of
Com
plet
ions
Est.
Cos
t of
Nee
ds
Inventory Year
Transportation(in millions)
Completed
$0.0
$0.5
$1.0
$1.5
$2.0
$2.5
$0$1$2$3$4$5$6$7
09 10 11 12 13 14 15 16 17 18 Est.
Cos
t of
Com
plet
ions
Est.
Cos
t of
Nee
ds
Inventory Year
Law Enforcement(in millions)
Completed
$0.00$0.02$0.04$0.06$0.08$0.10$0.12
$0$1$2$3$4$5$6
09 10 11 12 13 14 15 16 17 18 Est.
Cos
t of
Com
plet
ions
Est.
Cos
t of
Nee
ds
Inventory Year
School Renovations(in millions)
Completed
TOP 3
05001,0001,5002,0002,5003,0003,5004,000
$0
$2
$4
$6
$8
$10
$12
$14
09 10 11 12 13 14 15 16 17 18
Stud
ents
Cost
in M
illio
ns
Inventory Year
Cost of Needed New School Space vs Improvements to Existing Schools and Student Enrollment Growth
New Space Existing Space Students
= Local= Regional (Serves Multiple Counties)
DRAFT

47WWW.TN.GOV/TACIR
County Summaries
Project Type Conceptual
Planning & Design + Construction
Transportation 26,713,000$ 79,830,700$
Other Education 6,440,000$ 1,890,000$
Recreation 4,600,000$ 492,000$
Industrial Sites and Parks -$ 5,000,000$
Water and Wastewater 640,000$ 1,070,000$
School Renovations 1,261,000$ 250,000$
Community Development 300,000$ -$
Broadband -$ -$
Business District Development -$ -$
Fire Protection -$ -$
Housing -$ -$
Law Enforcement -$ -$
Libraries, Museums, & Historic Sites -$ -$
New Public Schools & Additions -$ -$
Other Facilities -$ -$
Other Utilities -$ -$
Post-secondary Education -$ -$
Public Buildings -$ -$
Public Health Facilities -$ -$
School-System-wide -$ -$
Solid Waste -$ -$
Storm Water -$ -$Total 39,954,000$ 88,532,700$
*Total Estimated Cost = Conceptual + Planning & Design + Construction
Estimated Cost of Needed Infrastructurefor Fentress County
Five-year period July 2018 through June 2023
Fentress CountyTotal Estimated Cost* for
Infrastructure Improvements
$128,486,700
$0$2$4$6$8$10$12$14
$0
$50
$100
$150
$200
09 10 11 12 13 14 15 16 17 18 Est.
Cos
t of
Com
plet
ions
Est.
Cos
t of
Nee
ds
Inventory Year
Transportation(in millions)
Completed
$0.0$0.5$1.0$1.5$2.0$2.5$3.0$3.5
$0
$5
$10
$15
$20
$25
09 10 11 12 13 14 15 16 17 18 Est.
Cos
t of
Com
plet
ions
Est.
Cos
t of
Nee
ds
Inventory Year
Other Education(in millions)
Completed
$0.0$0.1$0.2$0.3$0.4$0.5$0.6$0.7$0.8$0.9$1.0
$0$1$2$3$4$5$6
09 10 11 12 13 14 15 16 17 18 Est.
Cos
t of
Com
plet
ions
Est.
Cos
t of
Nee
ds
Inventory Year
Recreation(in millions)
Completed
TOP 3
0
500
1,000
1,500
2,000
2,500
3,000
$0
$2
$4
$6
$8
$10
$12
$14
09 10 11 12 13 14 15 16 17 18
Stud
ents
Cost
in M
illio
ns
Inventory Year
Cost of Needed New School Space vs Improvements to Existing Schools and Student Enrollment Growth
New Space Existing Space Students
= Local= Regional (Serves Multiple Counties)
DRAFT

WWW.TN.GOV/TACIR48
Building Tennessee’s Tomorrow: Anticipating the State’s Infrastructure Needs
Project Type Conceptual
Planning & Design + Construction
Transportation 37,993,000$ 19,023,630$
New Public Schools & Additions 24,088,000$ 24,000,000$
Water and Wastewater 1,250,000$ 17,000,000$
Post-secondary Education -$ 5,000,000$
Industrial Sites and Parks -$ 3,429,667$
Recreation 2,400,000$ -$
School Renovations 1,918,500$ -$
Broadband -$ -$
Business District Development -$ -$
Community Development -$ -$
Fire Protection -$ -$
Housing -$ -$
Law Enforcement -$ -$
Libraries, Museums, & Historic Sites -$ -$
Other Education -$ -$
Other Facilities -$ -$
Other Utilities -$ -$
Public Buildings -$ -$
Public Health Facilities -$ -$
School-System-wide -$ -$
Solid Waste -$ -$
Storm Water -$ -$Total 67,649,500$ 68,453,297$
*Total Estimated Cost = Conceptual + Planning & Design + Construction
Estimated Cost of Needed Infrastructurefor Franklin County
Five-year period July 2018 through June 2023
Franklin CountyTotal Estimated Cost* for
Infrastructure Improvements
$136,102,797
$0
$5
$10
$15
$20
$25
$0
$20
$40
$60
$80
$100
09 10 11 12 13 14 15 16 17 18 Est.
Cos
t of
Com
plet
ions
Est.
Cos
t of
Nee
ds
Inventory Year
Transportation(in millions)
Completed
$0.0$0.1$0.2$0.3$0.4$0.5$0.6$0.7
$0$10$20$30$40$50$60
09 10 11 12 13 14 15 16 17 18 Est.
Cos
t of
Com
plet
ions
Est.
Cos
t of
Nee
ds
Inventory Year
New Public Schools & Additions (in millions)
Completed
$0.0$0.5$1.0$1.5$2.0$2.5$3.0$3.5$4.0$4.5$5.0
$0$2$4$6$8
$10$12$14$16$18$20
09 10 11 12 13 14 15 16 17 18 Est.
Cos
t of
Com
plet
ions
Est.
Cos
t of
Nee
ds
Inventory Year
Water and Wastewater(in millions)
Completed
TOP 3
0
1,000
2,000
3,000
4,000
5,000
6,000
7,000
$0
$10
$20
$30
$40
$50
$60
09 10 11 12 13 14 15 16 17 18
Stud
ents
Cost
in M
illio
ns
Inventory Year
Cost of Needed New School Space vs Improvements to Existing Schools and Student Enrollment Growth
New Space Existing Space Students
= Local= Regional (Serves Multiple Counties)
DRAFT

49WWW.TN.GOV/TACIR
County Summaries
Project Type Conceptual
Planning & Design + Construction
Transportation 63,737,000$ 36,935,258$
Water and Wastewater 3,770,000$ 12,865,032$
Industrial Sites and Parks -$ 5,391,800$
School Renovations 4,210,000$ 210,000$
Other Facilities 2,040,000$ -$
Fire Protection 1,300,000$ -$
Recreation 1,131,000$ -$
Law Enforcement 150,000$ 740,000$
Community Development 500,000$ -$
Libraries, Museums, & Historic Sites 400,000$ -$
Public Buildings 300,000$ -$
Storm Water 300,000$ -$
New Public Schools & Additions -$ 200,000$
Broadband -$ -$
Business District Development -$ -$
Housing -$ -$
Other Education -$ -$
Other Utilities -$ -$
Post-secondary Education -$ -$
Public Health Facilities -$ -$
School-System-wide -$ -$
Solid Waste -$ -$Total 77,838,000$ 56,342,090$
*Total Estimated Cost = Conceptual + Planning & Design + Construction
Estimated Cost of Needed Infrastructurefor Gibson County
Five-year period July 2018 through June 2023
Gibson CountyTotal Estimated Cost* for
Infrastructure Improvements
$134,180,090
$0
$10
$20
$30
$40
$50
$0
$50
$100
$150
$200
$250
09 10 11 12 13 14 15 16 17 18 Est.
Cos
t of
Com
plet
ions
Est.
Cos
t of
Nee
ds
Inventory Year
Transportation(in millions)
Completed
$0.0$0.5$1.0$1.5$2.0$2.5$3.0$3.5$4.0
$0
$5
$10
$15
$20
09 10 11 12 13 14 15 16 17 18 Est.
Cos
t of
Com
plet
ions
Est.
Cos
t of
Nee
ds
Inventory Year
Water and Wastewater(in millions)
Completed
$0.0$0.1$0.2$0.3$0.4$0.5$0.6$0.7$0.8$0.9$1.0
$0$1$2$3$4$5$6
09 10 11 12 13 14 15 16 17 18 Est.
Cos
t of
Com
plet
ions
Est.
Cos
t of
Nee
ds
Inventory Year
Industrial Sites and Parks(in millions)
Completed
TOP 3
01,0002,0003,0004,0005,0006,0007,0008,0009,00010,000
$0$2$4$6$8
$10$12$14$16$18$20
09 10 11 12 13 14 15 16 17 18
Stud
ents
Cost
in M
illio
ns
Inventory Year
Cost of Needed New School Space vs Improvements to Existing Schools and Student Enrollment Growth
New Space Existing Space Students
= Local= Regional (Serves Multiple Counties)
DRAFT

WWW.TN.GOV/TACIR50
Building Tennessee’s Tomorrow: Anticipating the State’s Infrastructure Needs
Project Type Conceptual
Planning & Design + Construction
Transportation 30,062,000$ 44,413,273$
Post-secondary Education 41,120,000$ 3,171,350$
New Public Schools & Additions 32,000,000$ -$
Water and Wastewater 650,000$ 4,170,000$
School Renovations 3,544,250$ -$
Recreation 3,000,000$ 540,000$
Law Enforcement 2,000,000$ -$
Public Buildings 250,000$ 500,000$
Community Development -$ 50,000$
Broadband -$ -$
Business District Development -$ -$
Fire Protection -$ -$
Housing -$ -$
Industrial Sites and Parks -$ -$
Libraries, Museums, & Historic Sites -$ -$
Other Education -$ -$
Other Facilities -$ -$
Other Utilities -$ -$
Public Health Facilities -$ -$
School-System-wide -$ -$
Solid Waste -$ -$
Storm Water -$ -$Total 112,626,250$ 52,844,623$
*Total Estimated Cost = Conceptual + Planning & Design + Construction
Estimated Cost of Needed Infrastructurefor Giles County
Five-year period July 2018 through June 2023
Giles CountyTotal Estimated Cost* for
Infrastructure Improvements
$165,470,873
$0$5$10$15$20$25$30$35$40
$0
$20
$40
$60
$80
$100
09 10 11 12 13 14 15 16 17 18 Est.
Cos
t of
Com
plet
ions
Est.
Cos
t of
Nee
ds
Inventory Year
Transportation(in millions)
Completed
$0.00$0.02$0.04$0.06$0.08$0.10$0.12$0.14
$0
$10
$20
$30
$40
$50
09 10 11 12 13 14 15 16 17 18 Est.
Cos
t of
Com
plet
ions
Est.
Cos
t of
Nee
ds
Inventory Year
Post-secondary Education(in millions)
Completed
$0.00$0.01$0.02$0.03$0.04$0.05$0.06$0.07$0.08$0.09
$0$5
$10$15$20$25$30$35
09 10 11 12 13 14 15 16 17 18 Est.
Cos
t of
Com
plet
ions
Est.
Cos
t of
Nee
ds
Inventory Year
New Public Schools & Additions (in millions)
Completed
TOP 3
05001,0001,5002,0002,5003,0003,5004,0004,5005,000
$0
$5
$10
$15
$20
$25
$30
$35
09 10 11 12 13 14 15 16 17 18
Stud
ents
Cost
in M
illio
ns
Inventory Year
Cost of Needed New School Space vs Improvements to Existing Schools and Student Enrollment Growth
New Space Existing Space Students
= Local= Regional (Serves Multiple Counties)
DRAFT

51WWW.TN.GOV/TACIR
County Summaries
Project Type Conceptual
Planning & Design + Construction
Transportation 15,308,000$ 92,708,235$
Water and Wastewater 11,420,700$ -$
Recreation 1,175,000$ 550,000$
Industrial Sites and Parks 1,000,000$ -$
Libraries, Museums, & Historic Sites 500,000$ -$
School Renovations 210,000$ 160,000$
Community Development -$ 108,504$
Broadband -$ -$
Business District Development -$ -$
Fire Protection -$ -$
Housing -$ -$
Law Enforcement -$ -$
New Public Schools & Additions -$ -$
Other Education -$ -$
Other Facilities -$ -$
Other Utilities -$ -$
Post-secondary Education -$ -$
Public Buildings -$ -$
Public Health Facilities -$ -$
School-System-wide -$ -$
Solid Waste -$ -$
Storm Water -$ -$Total 29,613,700$ 93,526,739$
*Total Estimated Cost = Conceptual + Planning & Design + Construction
Estimated Cost of Needed Infrastructurefor Grainger County
Five-year period July 2018 through June 2023
Grainger CountyTotal Estimated Cost* for
Infrastructure Improvements
$123,140,439
$0$1$2$3$4$5$6
$0$20$40$60$80
$100$120$140
09 10 11 12 13 14 15 16 17 18 Est.
Cos
t of
Com
plet
ions
Est.
Cos
t of
Nee
ds
Inventory Year
Transportation(in millions)
Completed
$0.0$0.5$1.0$1.5$2.0$2.5$3.0$3.5
$0
$5
$10
$15
$20
$25
09 10 11 12 13 14 15 16 17 18 Est.
Cos
t of
Com
plet
ions
Est.
Cos
t of
Nee
ds
Inventory Year
Water and Wastewater(in millions)
Completed
$0.0$0.1$0.2$0.3$0.4$0.5$0.6$0.7
$0.0$0.2$0.4$0.6$0.8$1.0$1.2$1.4$1.6$1.8$2.0
09 10 11 12 13 14 15 16 17 18 Est.
Cos
t of
Com
plet
ions
Est.
Cos
t of
Nee
ds
Inventory Year
Recreation(in millions)
Completed
TOP 3
05001,0001,5002,0002,5003,0003,5004,000
$0
$1
$2
$3
$4
$5
$6
09 10 11 12 13 14 15 16 17 18
Stud
ents
Cost
in M
illio
ns
Inventory Year
Cost of Needed New School Space vs Improvements to Existing Schools and Student Enrollment Growth
New Space Existing Space Students
= Local= Regional (Serves Multiple Counties)
DRAFT
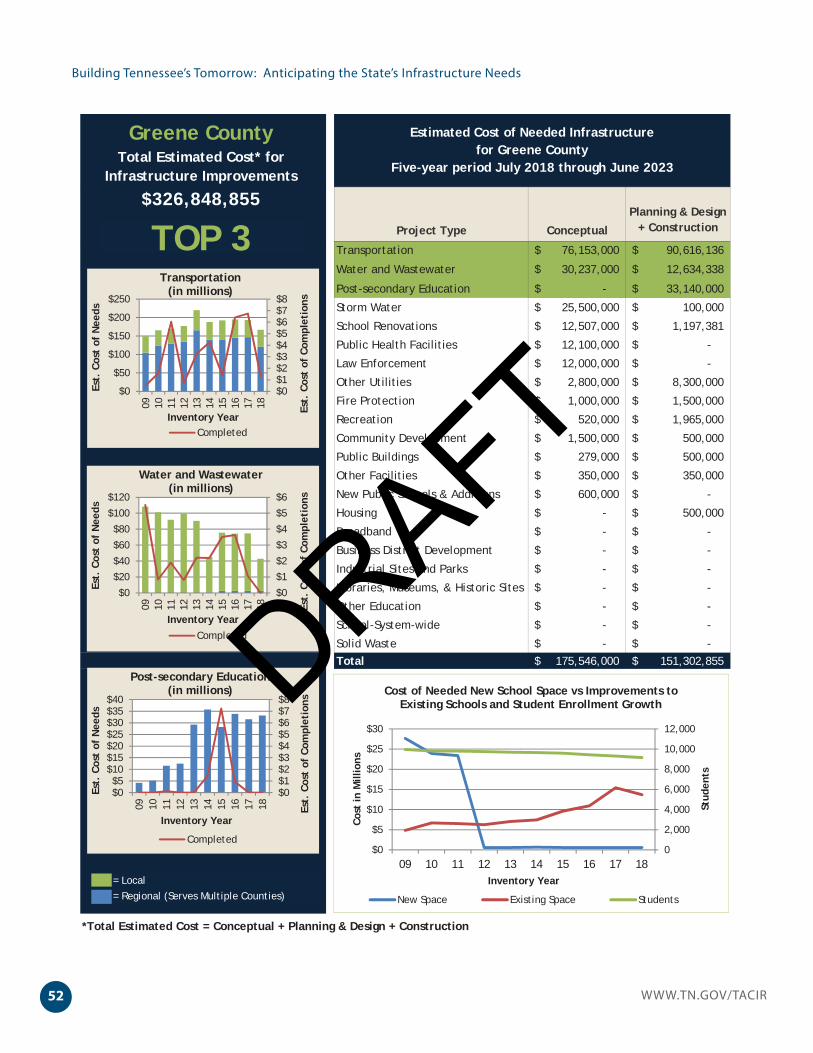
WWW.TN.GOV/TACIR52
Building Tennessee’s Tomorrow: Anticipating the State’s Infrastructure Needs
Project Type Conceptual
Planning & Design + Construction
Transportation 76,153,000$ 90,616,136$
Water and Wastewater 30,237,000$ 12,634,338$
Post-secondary Education -$ 33,140,000$
Storm Water 25,500,000$ 100,000$
School Renovations 12,507,000$ 1,197,381$
Public Health Facilities 12,100,000$ -$
Law Enforcement 12,000,000$ -$
Other Utilities 2,800,000$ 8,300,000$
Fire Protection 1,000,000$ 1,500,000$
Recreation 520,000$ 1,965,000$
Community Development 1,500,000$ 500,000$
Public Buildings 279,000$ 500,000$
Other Facilities 350,000$ 350,000$
New Public Schools & Additions 600,000$ -$
Housing -$ 500,000$
Broadband -$ -$
Business District Development -$ -$
Industrial Sites and Parks -$ -$
Libraries, Museums, & Historic Sites -$ -$
Other Education -$ -$
School-System-wide -$ -$
Solid Waste -$ -$Total 175,546,000$ 151,302,855$
*Total Estimated Cost = Conceptual + Planning & Design + Construction
Estimated Cost of Needed Infrastructurefor Greene County
Five-year period July 2018 through June 2023
Greene CountyTotal Estimated Cost* for
Infrastructure Improvements
$326,848,855
$0$1$2$3$4$5$6$7$8
$0
$50
$100
$150
$200
$250
09 10 11 12 13 14 15 16 17 18 Est.
Cos
t of
Com
plet
ions
Est.
Cos
t of
Nee
ds
Inventory Year
Transportation(in millions)
Completed
$0$1$2$3$4$5$6
$0$20$40$60$80
$100$120
09 10 11 12 13 14 15 16 17 18 Est.
Cos
t of
Com
plet
ions
Est.
Cos
t of
Nee
ds
Inventory Year
Water and Wastewater(in millions)
Completed
$0$1$2$3$4$5$6$7$8
$0$5
$10$15$20$25$30$35$40
09 10 11 12 13 14 15 16 17 18 Est.
Cos
t of
Com
plet
ions
Est.
Cos
t of
Nee
ds
Inventory Year
Post-secondary Education(in millions)
Completed
TOP 3
0
2,000
4,000
6,000
8,000
10,000
12,000
$0
$5
$10
$15
$20
$25
$30
09 10 11 12 13 14 15 16 17 18
Stud
ents
Cost
in M
illio
ns
Inventory Year
Cost of Needed New School Space vs Improvements to Existing Schools and Student Enrollment Growth
New Space Existing Space Students
= Local= Regional (Serves Multiple Counties)
DRAFT

53WWW.TN.GOV/TACIR
County Summaries
Project Type Conceptual
Planning & Design + Construction
Recreation 24,225,000$ 745,267$
Transportation 7,523,000$ 5,104,924$
School Renovations 8,050,000$ 985,000$
Water and Wastewater 2,325,000$ 3,218,100$
Community Development 250,000$ 840,000$
Law Enforcement -$ 660,000$
Industrial Sites and Parks 600,000$ -$
Fire Protection 475,000$ -$
Libraries, Museums, & Historic Sites 150,000$ -$
Broadband -$ -$
Business District Development -$ -$
Housing -$ -$
New Public Schools & Additions -$ -$
Other Education -$ -$
Other Facilities -$ -$
Other Utilities -$ -$
Post-secondary Education -$ -$
Public Buildings -$ -$
Public Health Facilities -$ -$
School-System-wide -$ -$
Solid Waste -$ -$
Storm Water -$ -$Total 43,598,000$ 11,553,291$
*Total Estimated Cost = Conceptual + Planning & Design + Construction
Estimated Cost of Needed Infrastructurefor Grundy County
Five-year period July 2018 through June 2023
Grundy CountyTotal Estimated Cost* for
Infrastructure Improvements
$55,151,291
$0.0
$0.5
$1.0
$1.5
$2.0
$2.5
$0$5
$10$15$20$25$30
09 10 11 12 13 14 15 16 17 18 Est.
Cos
t of
Com
plet
ions
Est.
Cos
t of
Nee
ds
Inventory Year
Recreation(in millions)
Completed
$0
$2
$4
$6
$8
$10
$0
$5
$10
$15
$20
09 10 11 12 13 14 15 16 17 18 Est.
Cos
t of
Com
plet
ions
Est.
Cos
t of
Nee
ds
Inventory Year
Transportation(in millions)
Completed
$0.0$0.5$1.0$1.5$2.0$2.5$3.0$3.5$4.0$4.5$5.0
$0$1$2$3$4$5$6$7$8$9
$10
09 10 11 12 13 14 15 16 17 18 Est.
Cos
t of
Com
plet
ions
Est.
Cos
t of
Nee
ds
Inventory Year
School Renovations(in millions)
Completed
TOP 3
0
500
1,000
1,500
2,000
2,500
$0$1$2$3$4$5$6$7$8$9
$10
09 10 11 12 13 14 15 16 17 18
Stud
ents
Cost
in M
illio
ns
Inventory Year
Cost of Needed New School Space vs Improvements to Existing Schools and Student Enrollment Growth
New Space Existing Space Students
= Local= Regional (Serves Multiple Counties)
DRAFT

WWW.TN.GOV/TACIR54
Building Tennessee’s Tomorrow: Anticipating the State’s Infrastructure Needs
Project Type Conceptual
Planning & Design + Construction
Transportation 94,791,000$ 110,831,527$
Law Enforcement 40,000,000$ 130,000$
School Renovations 24,628,000$ 13,864,000$
Community Development -$ 25,000,000$
Recreation 7,300,000$ 9,703,731$
Other Facilities -$ 12,000,000$
Post-secondary Education 500,000$ 6,398,886$
Water and Wastewater -$ 3,568,464$
Broadband -$ -$
Business District Development -$ -$
Fire Protection -$ -$
Housing -$ -$
Industrial Sites and Parks -$ -$
Libraries, Museums, & Historic Sites -$ -$
New Public Schools & Additions -$ -$
Other Education -$ -$
Other Utilities -$ -$
Public Buildings -$ -$
Public Health Facilities -$ -$
School-System-wide -$ -$
Solid Waste -$ -$
Storm Water -$ -$Total 167,219,000$ 181,496,608$
*Total Estimated Cost = Conceptual + Planning & Design + Construction
Estimated Cost of Needed Infrastructurefor Hamblen County
Five-year period July 2018 through June 2023
Hamblen CountyTotal Estimated Cost* for
Infrastructure Improvements
$348,715,608
$0$5$10$15$20$25$30$35$40
$0$50
$100$150$200$250$300$350
09 10 11 12 13 14 15 16 17 18 Est.
Cos
t of
Com
plet
ions
Est.
Cos
t of
Nee
ds
Inventory Year
Transportation(in millions)
Completed
$0.00$0.05$0.10$0.15$0.20$0.25$0.30$0.35$0.40
$0
$10
$20
$30
$40
$50
09 10 11 12 13 14 15 16 17 18 Est.
Cos
t of
Com
plet
ions
Est.
Cos
t of
Nee
ds
Inventory Year
Law Enforcement(in millions)
Completed
$0$2$4$6$8$10$12$14$16
$0$5
$10$15$20$25$30$35$40$45
09 10 11 12 13 14 15 16 17 18 Est.
Cos
t of
Com
plet
ions
Est.
Cos
t of
Nee
ds
Inventory Year
School Renovations(in millions)
Completed
TOP 3
0
2,000
4,000
6,000
8,000
10,000
12,000
$0$5
$10$15$20$25$30$35$40$45
09 10 11 12 13 14 15 16 17 18
Stud
ents
Cost
in M
illio
ns
Inventory Year
Cost of Needed New School Space vs Improvements to Existing Schools and Student Enrollment Growth
New Space Existing Space Students
= Local= Regional (Serves Multiple Counties)
DRAFT

55WWW.TN.GOV/TACIR
County Summaries
Project Type Conceptual
Planning & Design + Construction
Transportation 384,426,000$ 1,653,920,042$
Post-secondary Education 168,930,000$ 226,518,540$
Water and Wastewater 10,347,000$ 173,838,401$
Public Health Facilities 133,950,000$ 3,600,000$
New Public Schools & Additions 72,800,000$ 75,000$
Law Enforcement 29,980,000$ 6,212,600$
School Renovations 19,380,000$ 13,983,000$
Recreation 8,367,856$ 13,064,662$
Public Buildings 8,950,000$ 725,000$
Storm Water 5,814,000$ 1,800,200$
Fire Protection 1,000,000$ 6,600,000$
Community Development 3,600,000$ 2,382,463$
Business District Development -$ 4,200,000$
Solid Waste -$ 3,005,300$
Other Facilities -$ 1,850,000$
Libraries, Museums, & Historic Sites 300,000$ 1,100,000$
Industrial Sites and Parks 520,000$ -$
Broadband -$ -$
Housing -$ -$
Other Education -$ -$
Other Utilities -$ -$
School-System-wide -$ -$Total 848,364,856$ 2,112,875,208$
*Total Estimated Cost = Conceptual + Planning & Design + Construction
Estimated Cost of Needed Infrastructurefor Hamilton County
Five-year period July 2018 through June 2023
Hamilton CountyTotal Estimated Cost* for
Infrastructure Improvements
$2,961,240,064
$0
$50
$100
$150
$200
$0
$500
$1,000
$1,500
$2,000
$2,500
09 10 11 12 13 14 15 16 17 18 Est.
Cos
t of
Com
plet
ions
Est.
Cos
t of
Nee
ds
Inventory Year
Transportation(in millions)
Completed
$0
$20
$40
$60
$80
$100
$0
$100
$200
$300
$400
$500
09 10 11 12 13 14 15 16 17 18 Est.
Cos
t of
Com
plet
ions
Est.
Cos
t of
Nee
ds
Inventory Year
Post-secondary Education(in millions)
Completed
$0$2$4$6$8$10$12$14$16$18$20
$0
$50
$100
$150
$200
$250
09 10 11 12 13 14 15 16 17 18 Est.
Cos
t of
Com
plet
ions
Est.
Cos
t of
Nee
ds
Inventory Year
Water and Wastewater(in millions)
Completed
TOP 3
05,00010,00015,00020,00025,00030,00035,00040,00045,00050,000
$0$20$40$60$80
$100$120$140$160
09 10 11 12 13 14 15 16 17 18
Stud
ents
Cost
in M
illio
ns
Inventory Year
Cost of Needed New School Space vs Improvements to Existing Schools and Student Enrollment Growth
New Space Existing Space Students
= Local= Regional (Serves Multiple Counties)
DRAFT

WWW.TN.GOV/TACIR56
Building Tennessee’s Tomorrow: Anticipating the State’s Infrastructure Needs
Project Type Conceptual
Planning & Design + Construction
Transportation 24,574,000$ 2,192,000$
Water and Wastewater 6,289,182$ 1,207,000$
Industrial Sites and Parks -$ 2,098,750$
Recreation 2,075,000$ -$
School Renovations 895,271$ 58,400$
Public Buildings 750,000$ 122,000$
New Public Schools & Additions -$ 700,000$
Other Utilities 175,000$ -$
Broadband -$ -$
Business District Development -$ -$
Community Development -$ -$
Fire Protection -$ -$
Housing -$ -$
Law Enforcement -$ -$
Libraries, Museums, & Historic Sites -$ -$
Other Education -$ -$
Other Facilities -$ -$
Post-secondary Education -$ -$
Public Health Facilities -$ -$
School-System-wide -$ -$
Solid Waste -$ -$
Storm Water -$ -$Total 34,758,453$ 6,378,150$
*Total Estimated Cost = Conceptual + Planning & Design + Construction
Estimated Cost of Needed Infrastructurefor Hancock County
Five-year period July 2018 through June 2023
Hancock CountyTotal Estimated Cost* for
Infrastructure Improvements
$41,136,603
$0$1$2$3$4$5$6$7
$0$5
$10$15$20$25$30$35
09 10 11 12 13 14 15 16 17 18 Est.
Cos
t of
Com
plet
ions
Est.
Cos
t of
Nee
ds
Inventory Year
Transportation(in millions)
Completed
$0
$1
$2
$3
$4
$5
$0$2$4$6$8
$10$12
09 10 11 12 13 14 15 16 17 18 Est.
Cos
t of
Com
plet
ions
Est.
Cos
t of
Nee
ds
Inventory Year
Water and Wastewater(in millions)
Completed
$0.0$0.2$0.4$0.6$0.8$1.0$1.2$1.4$1.6
$0.0
$0.5
$1.0
$1.5
$2.0
$2.5
09 10 11 12 13 14 15 16 17 18 Est.
Cos
t of
Com
plet
ions
Est.
Cos
t of
Nee
ds
Inventory Year
Industrial Sites and Parks(in millions)
Completed
TOP 3
0
200
400
600
800
1,000
1,200
$0.0
$0.2
$0.4
$0.6
$0.8
$1.0
$1.2
09 10 11 12 13 14 15 16 17 18
Stud
ents
Cost
in M
illio
ns
Inventory Year
Cost of Needed New School Space vs Improvements to Existing Schools and Student Enrollment Growth
New Space Existing Space Students
= Local= Regional (Serves Multiple Counties)
DRAFT

57WWW.TN.GOV/TACIR
County Summaries
Project Type Conceptual
Planning & Design + Construction
Transportation 55,193,000$ 69,282,669$
Public Health Facilities 32,210,000$ -$
Post-secondary Education 10,350,000$ -$
School Renovations 150,000$ 3,800,000$
Water and Wastewater 950,000$ 249,760$
Law Enforcement 1,000,000$ -$
Fire Protection 950,000$ -$
Public Buildings -$ 750,000$
Recreation 300,000$ 283,500$
Broadband -$ -$
Business District Development -$ -$
Community Development -$ -$
Housing -$ -$
Industrial Sites and Parks -$ -$
Libraries, Museums, & Historic Sites -$ -$
New Public Schools & Additions -$ -$
Other Education -$ -$
Other Facilities -$ -$
Other Utilities -$ -$
School-System-wide -$ -$
Solid Waste -$ -$
Storm Water -$ -$Total 101,103,000$ 74,365,929$
*Total Estimated Cost = Conceptual + Planning & Design + Construction
Estimated Cost of Needed Infrastructurefor Hardeman County
Five-year period July 2018 through June 2023
Hardeman CountyTotal Estimated Cost* for
Infrastructure Improvements
$175,468,929
$0$10$20$30$40$50$60
$0
$50
$100
$150
$200
09 10 11 12 13 14 15 16 17 18 Est.
Cos
t of
Com
plet
ions
Est.
Cos
t of
Nee
ds
Inventory Year
Transportation(in millions)
Completed
$0$10$20$30$40$50$60$70
$0$5
$10$15$20$25$30$35
09 10 11 12 13 14 15 16 17 18 Est.
Cos
t of
Com
plet
ions
Est.
Cos
t of
Nee
ds
Inventory Year
Public Health Facilities(in millions)
Completed
$0$2$4$6$8$10$12$14$16$18
$0$2$4$6$8
$10$12$14$16$18
09 10 11 12 13 14 15 16 17 18 Est.
Cos
t of
Com
plet
ions
Est.
Cos
t of
Nee
ds
Inventory Year
Post-secondary Education(in millions)
Completed
TOP 3
05001,0001,5002,0002,5003,0003,5004,0004,500
$0
$1
$2
$3
$4
$5
$6
09 10 11 12 13 14 15 16 17 18
Stud
ents
Cost
in M
illio
ns
Inventory Year
Cost of Needed New School Space vs Improvements to Existing Schools and Student Enrollment Growth
New Space Existing Space Students
= Local= Regional (Serves Multiple Counties)
DRAFT

WWW.TN.GOV/TACIR58
Building Tennessee’s Tomorrow: Anticipating the State’s Infrastructure Needs
Project Type Conceptual
Planning & Design + Construction
Transportation 145,683,000$ 83,817,268$
Recreation 5,515,000$ 11,680,000$
School Renovations 135,000$ 2,903,000$
Water and Wastewater 605,000$ 2,104,423$
Industrial Sites and Parks 1,000,000$ -$
Business District Development 500,000$ 150,000$
Fire Protection 350,000$ -$
Post-secondary Education -$ 114,380$
Libraries, Museums, & Historic Sites 100,000$ -$
Broadband -$ -$
Community Development -$ -$
Housing -$ -$
Law Enforcement -$ -$
New Public Schools & Additions -$ -$
Other Education -$ -$
Other Facilities -$ -$
Other Utilities -$ -$
Public Buildings -$ -$
Public Health Facilities -$ -$
School-System-wide -$ -$
Solid Waste -$ -$
Storm Water -$ -$Total 153,888,000$ 100,769,071$
*Total Estimated Cost = Conceptual + Planning & Design + Construction
Estimated Cost of Needed Infrastructurefor Hardin County
Five-year period July 2018 through June 2023
Hardin CountyTotal Estimated Cost* for
Infrastructure Improvements
$254,657,071
$0$10$20$30$40$50$60$70
$0$50
$100$150$200$250$300
09 10 11 12 13 14 15 16 17 18 Est.
Cos
t of
Com
plet
ions
Est.
Cos
t of
Nee
ds
Inventory Year
Transportation(in millions)
Completed
$0
$1
$2
$3
$4
$5
$0
$5
$10
$15
$20
09 10 11 12 13 14 15 16 17 18 Est.
Cos
t of
Com
plet
ions
Est.
Cos
t of
Nee
ds
Inventory Year
Recreation(in millions)
Completed
$0.0$0.2$0.4$0.6$0.8$1.0$1.2$1.4$1.6
$0.0$0.5$1.0$1.5$2.0$2.5$3.0$3.5
09 10 11 12 13 14 15 16 17 18 Est.
Cos
t of
Com
plet
ions
Est.
Cos
t of
Nee
ds
Inventory Year
School Renovations(in millions)
Completed
TOP 3
05001,0001,5002,0002,5003,0003,5004,000
$0
$5
$10
$15
$20
$25
09 10 11 12 13 14 15 16 17 18
Stud
ents
Cost
in M
illio
ns
Inventory Year
Cost of Needed New School Space vs Improvements to Existing Schools and Student Enrollment Growth
New Space Existing Space Students
= Local= Regional (Serves Multiple Counties)
DRAFT

59WWW.TN.GOV/TACIR
County Summaries
Project Type Conceptual
Planning & Design + Construction
Transportation 76,052,000$ 73,620,897$
Water and Wastewater 25,387,850$ 3,061,172$
School Renovations 11,572,000$ 2,920,142$
Community Development 5,500,000$ 1,700,000$
Recreation 600,000$ 4,233,000$
Other Utilities -$ 3,000,000$
New Public Schools & Additions 2,500,000$ -$
Fire Protection 975,000$ 200,000$
Law Enforcement 850,000$ -$
Housing 100,000$ 500,000$
Other Facilities -$ 550,000$
Industrial Sites and Parks 193,000$ -$
Broadband -$ -$
Business District Development -$ -$
Libraries, Museums, & Historic Sites -$ -$
Other Education -$ -$
Post-secondary Education -$ -$
Public Buildings -$ -$
Public Health Facilities -$ -$
School-System-wide -$ -$
Solid Waste -$ -$
Storm Water -$ -$Total 123,729,850$ 89,785,211$
*Total Estimated Cost = Conceptual + Planning & Design + Construction
Estimated Cost of Needed Infrastructurefor Hawkins County
Five-year period July 2018 through June 2023
Hawkins CountyTotal Estimated Cost* for
Infrastructure Improvements
$213,515,061
$0$1$2$3$4$5$6$7$8
$0
$50
$100
$150
$200
09 10 11 12 13 14 15 16 17 18 Est.
Cos
t of
Com
plet
ions
Est.
Cos
t of
Nee
ds
Inventory Year
Transportation(in millions)
Completed
$0$2$4$6$8$10$12
$0$5
$10$15$20$25$30$35$40
09 10 11 12 13 14 15 16 17 18 Est.
Cos
t of
Com
plet
ions
Est.
Cos
t of
Nee
ds
Inventory Year
Water and Wastewater(in millions)
Completed
$0$2$4$6$8$10$12$14$16
$0$2$4$6$8
$10$12$14$16
09 10 11 12 13 14 15 16 17 18 Est.
Cos
t of
Com
plet
ions
Est.
Cos
t of
Nee
ds
Inventory Year
School Renovations(in millions)
Completed
TOP 3
01,0002,0003,0004,0005,0006,0007,0008,0009,000
$0$2$4$6$8
$10$12$14$16
09 10 11 12 13 14 15 16 17 18
Stud
ents
Cost
in M
illio
ns
Inventory Year
Cost of Needed New School Space vs Improvements to Existing Schools and Student Enrollment Growth
New Space Existing Space Students
= Local= Regional (Serves Multiple Counties)
DRAFT
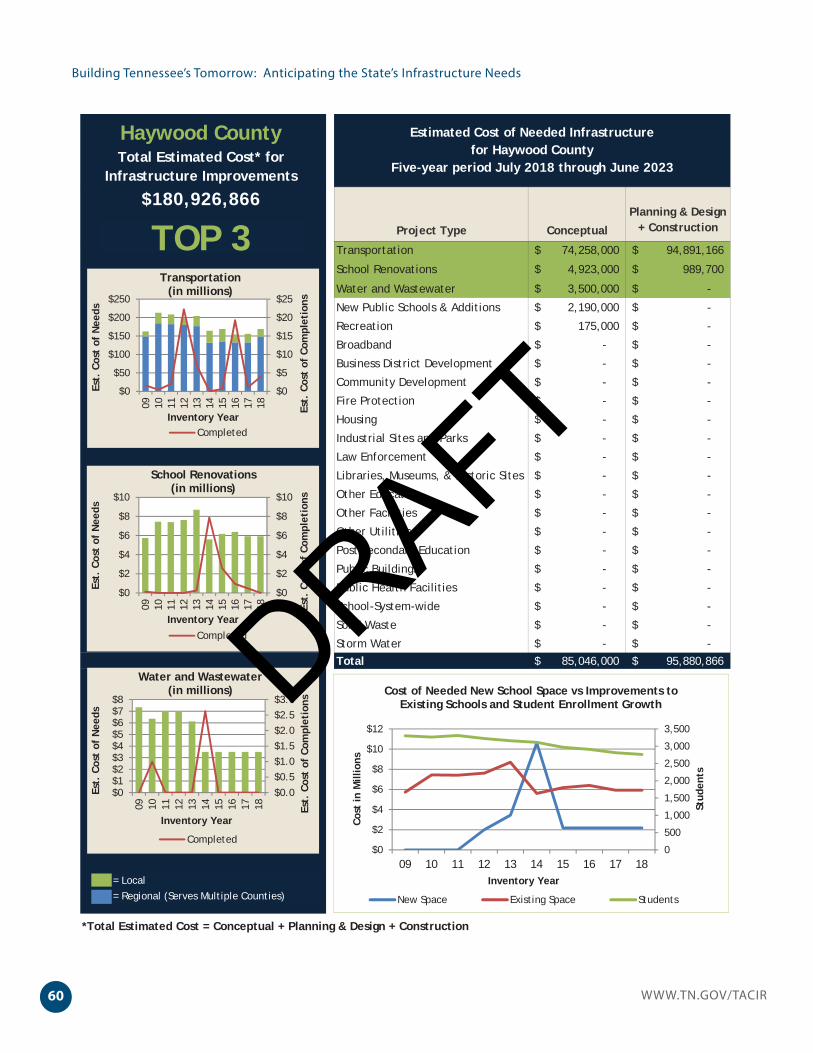
WWW.TN.GOV/TACIR60
Building Tennessee’s Tomorrow: Anticipating the State’s Infrastructure Needs
Project Type Conceptual
Planning & Design + Construction
Transportation 74,258,000$ 94,891,166$
School Renovations 4,923,000$ 989,700$
Water and Wastewater 3,500,000$ -$
New Public Schools & Additions 2,190,000$ -$
Recreation 175,000$ -$
Broadband -$ -$
Business District Development -$ -$
Community Development -$ -$
Fire Protection -$ -$
Housing -$ -$
Industrial Sites and Parks -$ -$
Law Enforcement -$ -$
Libraries, Museums, & Historic Sites -$ -$
Other Education -$ -$
Other Facilities -$ -$
Other Utilities -$ -$
Post-secondary Education -$ -$
Public Buildings -$ -$
Public Health Facilities -$ -$
School-System-wide -$ -$
Solid Waste -$ -$
Storm Water -$ -$Total 85,046,000$ 95,880,866$
*Total Estimated Cost = Conceptual + Planning & Design + Construction
Estimated Cost of Needed Infrastructurefor Haywood County
Five-year period July 2018 through June 2023
Haywood CountyTotal Estimated Cost* for
Infrastructure Improvements
$180,926,866
$0
$5
$10
$15
$20
$25
$0
$50
$100
$150
$200
$250
09 10 11 12 13 14 15 16 17 18 Est.
Cos
t of
Com
plet
ions
Est.
Cos
t of
Nee
ds
Inventory Year
Transportation(in millions)
Completed
$0
$2
$4
$6
$8
$10
$0
$2
$4
$6
$8
$10
09 10 11 12 13 14 15 16 17 18 Est.
Cos
t of
Com
plet
ions
Est.
Cos
t of
Nee
ds
Inventory Year
School Renovations(in millions)
Completed
$0.0$0.5$1.0$1.5$2.0$2.5$3.0
$0$1$2$3$4$5$6$7$8
09 10 11 12 13 14 15 16 17 18 Est.
Cos
t of
Com
plet
ions
Est.
Cos
t of
Nee
ds
Inventory Year
Water and Wastewater(in millions)
Completed
TOP 3
0
500
1,000
1,500
2,000
2,500
3,000
3,500
$0
$2
$4
$6
$8
$10
$12
09 10 11 12 13 14 15 16 17 18
Stud
ents
Cost
in M
illio
ns
Inventory Year
Cost of Needed New School Space vs Improvements to Existing Schools and Student Enrollment Growth
New Space Existing Space Students
= Local= Regional (Serves Multiple Counties)
DRAFT

61WWW.TN.GOV/TACIR
County Summaries
Project Type Conceptual
Planning & Design + Construction
Transportation 38,993,000$ 89,755,237$
Recreation 6,770,000$ -$
Community Development 5,000,000$ -$
School Renovations 545,000$ 3,048,000$
Public Buildings -$ 1,710,000$
Law Enforcement -$ 930,000$
Libraries, Museums, & Historic Sites -$ 318,750$
Industrial Sites and Parks -$ 150,000$
Water and Wastewater 150,000$ -$
New Public Schools & Additions 50,000$ -$
Broadband -$ -$
Business District Development -$ -$
Fire Protection -$ -$
Housing -$ -$
Other Education -$ -$
Other Facilities -$ -$
Other Utilities -$ -$
Post-secondary Education -$ -$
Public Health Facilities -$ -$
School-System-wide -$ -$
Solid Waste -$ -$
Storm Water -$ -$Total 51,508,000$ 95,911,987$
*Total Estimated Cost = Conceptual + Planning & Design + Construction
Estimated Cost of Needed Infrastructurefor Henderson County
Five-year period July 2018 through June 2023
Henderson CountyTotal Estimated Cost* for
Infrastructure Improvements
$147,419,987
$0
$10
$20
$30
$40
$50
$0$50
$100$150$200$250$300
09 10 11 12 13 14 15 16 17 18 Est.
Cos
t of
Com
plet
ions
Est.
Cos
t of
Nee
ds
Inventory Year
Transportation(in millions)
Completed
$0.0$0.5$1.0$1.5$2.0$2.5$3.0$3.5$4.0
$0$1$2$3$4$5$6$7$8
09 10 11 12 13 14 15 16 17 18 Est.
Cos
t of
Com
plet
ions
Est.
Cos
t of
Nee
ds
Inventory Year
Recreation(in millions)
Completed
$0.0$0.1$0.2$0.3$0.4$0.5$0.6$0.7$0.8$0.9$1.0
$0$1$2$3$4$5$6
09 10 11 12 13 14 15 16 17 18 Est.
Cos
t of
Com
plet
ions
Est.
Cos
t of
Nee
ds
Inventory Year
Community Development(in millions)
Completed
TOP 3
0
1,000
2,000
3,000
4,000
5,000
6,000
$0.0$0.5$1.0$1.5$2.0$2.5$3.0$3.5$4.0$4.5$5.0
09 10 11 12 13 14 15 16 17 18
Stud
ents
Cost
in M
illio
ns
Inventory Year
Cost of Needed New School Space vs Improvements to Existing Schools and Student Enrollment Growth
New Space Existing Space Students
= Local= Regional (Serves Multiple Counties)
DRAFT

WWW.TN.GOV/TACIR62
Building Tennessee’s Tomorrow: Anticipating the State’s Infrastructure Needs
Project Type Conceptual
Planning & Design + Construction
Transportation 27,966,000$ 85,789,074$
Recreation 14,465,000$ 24,570,000$
School Renovations -$ 9,416,654$
Water and Wastewater 337,966$ 8,200,000$
New Public Schools & Additions -$ 2,500,000$
School-System-wide 2,400,000$ -$
Industrial Sites and Parks -$ 500,000$
Fire Protection 85,000$ -$
Broadband -$ -$
Business District Development -$ -$
Community Development -$ -$
Housing -$ -$
Law Enforcement -$ -$
Libraries, Museums, & Historic Sites -$ -$
Other Education -$ -$
Other Facilities -$ -$
Other Utilities -$ -$
Post-secondary Education -$ -$
Public Buildings -$ -$
Public Health Facilities -$ -$
Solid Waste -$ -$
Storm Water -$ -$Total 45,253,966$ 130,975,728$
*Total Estimated Cost = Conceptual + Planning & Design + Construction
Estimated Cost of Needed Infrastructurefor Henry County
Five-year period July 2018 through June 2023
Henry CountyTotal Estimated Cost* for
Infrastructure Improvements
$176,229,694
$0
$5
$10
$15
$20
$0$20$40$60$80
$100$120
09 10 11 12 13 14 15 16 17 18 Est.
Cos
t of
Com
plet
ions
Est.
Cos
t of
Nee
ds
Inventory Year
Transportation(in millions)
Completed
$0.0$0.2$0.4$0.6$0.8$1.0$1.2$1.4
$0
$10
$20
$30
$40
$50
09 10 11 12 13 14 15 16 17 18 Est.
Cos
t of
Com
plet
ions
Est.
Cos
t of
Nee
ds
Inventory Year
Recreation(in millions)
Completed
$0$1$2$3$4$5$6$7$8$9$10
$0$2$4$6$8
$10$12
09 10 11 12 13 14 15 16 17 18 Est.
Cos
t of
Com
plet
ions
Est.
Cos
t of
Nee
ds
Inventory Year
School Renovations(in millions)
Completed
TOP 3
05001,0001,5002,0002,5003,0003,5004,0004,5005,000
$0
$2
$4
$6
$8
$10
$12
09 10 11 12 13 14 15 16 17 18
Stud
ents
Cost
in M
illio
ns
Inventory Year
Cost of Needed New School Space vs Improvements to Existing Schools and Student Enrollment Growth
New Space Existing Space Students
= Local= Regional (Serves Multiple Counties)
DRAFT

63WWW.TN.GOV/TACIR
County Summaries
Project Type Conceptual
Planning & Design + Construction
Transportation 54,172,000$ 53,202,553$
Water and Wastewater 48,900,000$ 1,000,000$
Law Enforcement 17,840,000$ 16,900,000$
School Renovations 16,400,000$ 278,000$
Industrial Sites and Parks -$ 1,800,000$
Fire Protection 185,000$ -$
Solid Waste 160,000$ -$
Broadband -$ -$
Business District Development -$ -$
Community Development -$ -$
Housing -$ -$
Libraries, Museums, & Historic Sites -$ -$
New Public Schools & Additions -$ -$
Other Education -$ -$
Other Facilities -$ -$
Other Utilities -$ -$
Post-secondary Education -$ -$
Public Buildings -$ -$
Public Health Facilities -$ -$
Recreation -$ -$
School-System-wide -$ -$
Storm Water -$ -$Total 137,657,000$ 73,180,553$
*Total Estimated Cost = Conceptual + Planning & Design + Construction
Estimated Cost of Needed Infrastructurefor Hickman County
Five-year period July 2018 through June 2023
Hickman CountyTotal Estimated Cost* for
Infrastructure Improvements
$210,837,553
$0$2$4$6$8$10$12
$0$20$40$60$80
$100$120$140$160
09 10 11 12 13 14 15 16 17 18 Est.
Cos
t of
Com
plet
ions
Est.
Cos
t of
Nee
ds
Inventory Year
Transportation(in millions)
Completed
$0
$2
$4
$6
$8
$10
$0$10$20$30$40$50$60
09 10 11 12 13 14 15 16 17 18 Est.
Cos
t of
Com
plet
ions
Est.
Cos
t of
Nee
ds
Inventory Year
Water and Wastewater(in millions)
Completed
$0$2$4$6$8$10$12
$0$5
$10$15$20$25$30$35$40
09 10 11 12 13 14 15 16 17 18 Est.
Cos
t of
Com
plet
ions
Est.
Cos
t of
Nee
ds
Inventory Year
Law Enforcement(in millions)
Completed
TOP 3
05001,0001,5002,0002,5003,0003,5004,0004,500
$0$2$4$6$8
$10$12$14$16$18
09 10 11 12 13 14 15 16 17 18
Stud
ents
Cost
in M
illio
ns
Inventory Year
Cost of Needed New School Space vs Improvements to Existing Schools and Student Enrollment Growth
New Space Existing Space Students
= Local= Regional (Serves Multiple Counties)
DRAFT

WWW.TN.GOV/TACIR64
Building Tennessee’s Tomorrow: Anticipating the State’s Infrastructure Needs
Project Type Conceptual
Planning & Design + Construction
Transportation 12,037,000$ 4,341,900$
Water and Wastewater 3,200,000$ 5,400,000$
Community Development 2,000,000$ -$
Libraries, Museums, & Historic Sites -$ 1,500,000$
Recreation 845,000$ 500,000$
Other Facilities 670,000$ 100,000$
Fire Protection 650,000$ -$
Public Health Facilities -$ 400,000$
Solid Waste -$ 100,000$
School Renovations -$ 80,000$
Public Buildings -$ 70,000$
Broadband -$ -$
Business District Development -$ -$
Housing -$ -$
Industrial Sites and Parks -$ -$
Law Enforcement -$ -$
New Public Schools & Additions -$ -$
Other Education -$ -$
Other Utilities -$ -$
Post-secondary Education -$ -$
School-System-wide -$ -$
Storm Water -$ -$Total 19,402,000$ 12,491,900$
*Total Estimated Cost = Conceptual + Planning & Design + Construction
Estimated Cost of Needed Infrastructurefor Houston County
Five-year period July 2018 through June 2023
Houston CountyTotal Estimated Cost* for
Infrastructure Improvements
$31,893,900
$0.0
$0.5
$1.0
$1.5
$2.0
$2.5
$0
$10
$20
$30
$40
$50
09 10 11 12 13 14 15 16 17 18 Est.
Cos
t of
Com
plet
ions
Est.
Cos
t of
Nee
ds
Inventory Year
Transportation(in millions)
Completed
$0.0
$0.5
$1.0
$1.5
$2.0
$2.5
$0$2$4$6$8
$10$12
09 10 11 12 13 14 15 16 17 18 Est.
Cos
t of
Com
plet
ions
Est.
Cos
t of
Nee
ds
Inventory Year
Water and Wastewater(in millions)
Completed
$0.0$0.1$0.2$0.3$0.4$0.5$0.6$0.7$0.8$0.9$1.0
$0.0
$0.5
$1.0
$1.5
$2.0
$2.5
09 10 11 12 13 14 15 16 17 18 Est.
Cos
t of
Com
plet
ions
Est.
Cos
t of
Nee
ds
Inventory Year
Community Development(in millions)
Completed
TOP 3
02004006008001,0001,2001,4001,600
$0.0$0.2$0.4$0.6$0.8$1.0$1.2$1.4$1.6$1.8
09 10 11 12 13 14 15 16 17 18
Stud
ents
Cost
in M
illio
ns
Inventory Year
Cost of Needed New School Space vs Improvements to Existing Schools and Student Enrollment Growth
New Space Existing Space Students
= Local= Regional (Serves Multiple Counties)
DRAFT

65WWW.TN.GOV/TACIR
County Summaries
Project Type Conceptual
Planning & Design + Construction
Transportation 99,848,000$ 72,901,600$
Water and Wastewater 13,000,000$ 6,388,375$
Industrial Sites and Parks 2,700,000$ 9,700,000$
School Renovations 9,625,000$ 350,000$
Other Utilities -$ 3,110,044$
New Public Schools & Additions 2,000,000$ -$
Storm Water 2,000,000$ -$
Public Buildings -$ 1,076,000$
Fire Protection 500,000$ -$
Recreation 250,000$ -$
Broadband -$ -$
Business District Development -$ -$
Community Development -$ -$
Housing -$ -$
Law Enforcement -$ -$
Libraries, Museums, & Historic Sites -$ -$
Other Education -$ -$
Other Facilities -$ -$
Post-secondary Education -$ -$
Public Health Facilities -$ -$
School-System-wide -$ -$
Solid Waste -$ -$Total 129,923,000$ 93,526,019$
*Total Estimated Cost = Conceptual + Planning & Design + Construction
Estimated Cost of Needed Infrastructurefor Humphreys County
Five-year period July 2018 through June 2023
Humphreys CountyTotal Estimated Cost* for
Infrastructure Improvements
$223,449,019
$0$5$10$15$20$25$30
$0
$50
$100
$150
$200
09 10 11 12 13 14 15 16 17 18 Est.
Cos
t of
Com
plet
ions
Est.
Cos
t of
Nee
ds
Inventory Year
Transportation(in millions)
Completed
$0$1$2$3$4$5$6
$0
$5
$10
$15
$20
$25
09 10 11 12 13 14 15 16 17 18 Est.
Cos
t of
Com
plet
ions
Est.
Cos
t of
Nee
ds
Inventory Year
Water and Wastewater(in millions)
Completed
$0.0$0.1$0.2$0.3$0.4$0.5$0.6$0.7$0.8$0.9$1.0
$0$2$4$6$8
$10$12$14
09 10 11 12 13 14 15 16 17 18 Est.
Cos
t of
Com
plet
ions
Est.
Cos
t of
Nee
ds
Inventory Year
Industrial Sites and Parks(in millions)
Completed
TOP 3
0
500
1,000
1,500
2,000
2,500
3,000
3,500
$0$2$4$6$8
$10$12$14$16
09 10 11 12 13 14 15 16 17 18
Stud
ents
Cost
in M
illio
ns
Inventory Year
Cost of Needed New School Space vs Improvements to Existing Schools and Student Enrollment Growth
New Space Existing Space Students
= Local= Regional (Serves Multiple Counties)
DRAFT

WWW.TN.GOV/TACIR66
Building Tennessee’s Tomorrow: Anticipating the State’s Infrastructure Needs
Project Type Conceptual
Planning & Design + Construction
Transportation 58,140,000$ 2,088,835$
Industrial Sites and Parks 1,250,000$ 15,000,000$
Recreation 2,500,000$ 2,950,000$
Water and Wastewater 500,000$ 1,173,150$
Community Development 1,350,000$ -$
New Public Schools & Additions 200,000$ -$
Broadband -$ -$
Business District Development -$ -$
Fire Protection -$ -$
Housing -$ -$
Law Enforcement -$ -$
Libraries, Museums, & Historic Sites -$ -$
Other Education -$ -$
Other Facilities -$ -$
Other Utilities -$ -$
Post-secondary Education -$ -$
Public Buildings -$ -$
Public Health Facilities -$ -$
School Renovations -$ -$
School-System-wide -$ -$
Solid Waste -$ -$
Storm Water -$ -$Total 63,940,000$ 21,211,985$
*Total Estimated Cost = Conceptual + Planning & Design + Construction
Estimated Cost of Needed Infrastructurefor Jackson County
Five-year period July 2018 through June 2023
Jackson CountyTotal Estimated Cost* for
Infrastructure Improvements
$85,151,985
$0.0$0.5$1.0$1.5$2.0$2.5$3.0$3.5
$0$20$40$60$80
$100$120
09 10 11 12 13 14 15 16 17 18 Est.
Cos
t of
Com
plet
ions
Est.
Cos
t of
Nee
ds
Inventory Year
Transportation(in millions)
Completed
$0.0
$0.2
$0.4
$0.6
$0.8
$1.0
$0
$5
$10
$15
$20
09 10 11 12 13 14 15 16 17 18 Est.
Cos
t of
Com
plet
ions
Est.
Cos
t of
Nee
ds
Inventory Year
Industrial Sites and Parks(in millions)
Completed
$0.0$0.1$0.2$0.3$0.4$0.5$0.6$0.7$0.8$0.9$1.0
$0$1$2$3$4$5$6
09 10 11 12 13 14 15 16 17 18 Est.
Cos
t of
Com
plet
ions
Est.
Cos
t of
Nee
ds
Inventory Year
Recreation(in millions)
Completed
TOP 3
02004006008001,0001,2001,4001,6001,800
$0.0
$0.5
$1.0
$1.5
$2.0
$2.5
$3.0
$3.5
09 10 11 12 13 14 15 16 17 18
Stud
ents
Cost
in M
illio
ns
Inventory Year
Cost of Needed New School Space vs Improvements to Existing Schools and Student Enrollment Growth
New Space Existing Space Students
= Local= Regional (Serves Multiple Counties)
DRAFT

67WWW.TN.GOV/TACIR
County Summaries
Project Type Conceptual
Planning & Design + Construction
Transportation 53,666,000$ 290,366,505$
School Renovations 24,230,000$ 3,944,000$
Water and Wastewater 7,741,244$ 16,954,911$
New Public Schools & Additions 6,500,000$ -$
Law Enforcement -$ 5,200,000$
Recreation 785,000$ 250,000$
Other Facilities 150,000$ -$
Storm Water -$ 50,000$
Broadband -$ -$
Business District Development -$ -$
Community Development -$ -$
Fire Protection -$ -$
Housing -$ -$
Industrial Sites and Parks -$ -$
Libraries, Museums, & Historic Sites -$ -$
Other Education -$ -$
Other Utilities -$ -$
Post-secondary Education -$ -$
Public Buildings -$ -$
Public Health Facilities -$ -$
School-System-wide -$ -$
Solid Waste -$ -$Total 93,072,244$ 316,765,416$
*Total Estimated Cost = Conceptual + Planning & Design + Construction
Estimated Cost of Needed Infrastructurefor Jefferson County
Five-year period July 2018 through June 2023
Jefferson CountyTotal Estimated Cost* for
Infrastructure Improvements
$409,837,660
$0
$10
$20
$30
$40
$50
$0$50
$100$150$200$250$300$350$400
09 10 11 12 13 14 15 16 17 18 Est.
Cos
t of
Com
plet
ions
Est.
Cos
t of
Nee
ds
Inventory Year
Transportation(in millions)
Completed
$0$5$10$15$20$25$30$35
$0
$10
$20
$30
$40
$50
09 10 11 12 13 14 15 16 17 18 Est.
Cos
t of
Com
plet
ions
Est.
Cos
t of
Nee
ds
Inventory Year
School Renovations(in millions)
Completed
$0$2$4$6$8$10$12$14
$0$5
$10$15$20$25$30$35
09 10 11 12 13 14 15 16 17 18 Est.
Cos
t of
Com
plet
ions
Est.
Cos
t of
Nee
ds
Inventory Year
Water and Wastewater(in millions)
Completed
TOP 3
01,0002,0003,0004,0005,0006,0007,0008,000
$0$5
$10$15$20$25$30$35$40$45
09 10 11 12 13 14 15 16 17 18
Stud
ents
Cost
in M
illio
ns
Inventory Year
Cost of Needed New School Space vs Improvements to Existing Schools and Student Enrollment Growth
New Space Existing Space Students
= Local= Regional (Serves Multiple Counties)
DRAFT

WWW.TN.GOV/TACIR68
Building Tennessee’s Tomorrow: Anticipating the State’s Infrastructure Needs
Project Type Conceptual
Planning & Design + Construction
Transportation 18,503,000$ 96,830,092$
Law Enforcement 14,210,000$ -$
Water and Wastewater 6,500,000$ 2,084,500$
Recreation 6,435,000$ 1,128,707$
School Renovations 50,000$ 2,645,000$
Post-secondary Education 508,000$ -$
Fire Protection 500,000$ -$
Industrial Sites and Parks 500,000$ -$
Other Facilities 300,000$ -$
Solid Waste 250,000$ -$
Libraries, Museums, & Historic Sites -$ 227,000$
Broadband -$ -$
Business District Development -$ -$
Community Development -$ -$
Housing -$ -$
New Public Schools & Additions -$ -$
Other Education -$ -$
Other Utilities -$ -$
Public Buildings -$ -$
Public Health Facilities -$ -$
School-System-wide -$ -$
Storm Water -$ -$Total 47,756,000$ 102,915,299$
*Total Estimated Cost = Conceptual + Planning & Design + Construction
Estimated Cost of Needed Infrastructurefor Johnson County
Five-year period July 2018 through June 2023
Johnson CountyTotal Estimated Cost* for
Infrastructure Improvements
$150,671,299
$0
$5
$10
$15
$20
$25
$0$20$40$60$80
$100$120$140
09 10 11 12 13 14 15 16 17 18 Est.
Cos
t of
Com
plet
ions
Est.
Cos
t of
Nee
ds
Inventory Year
Transportation(in millions)
Completed
$0$2$4$6$8$10$12
$0$2$4$6$8
$10$12$14$16
09 10 11 12 13 14 15 16 17 18 Est.
Cos
t of
Com
plet
ions
Est.
Cos
t of
Nee
ds
Inventory Year
Law Enforcement(in millions)
Completed
$0.0$0.5$1.0$1.5$2.0$2.5$3.0$3.5$4.0
$0$5
$10$15$20$25$30
09 10 11 12 13 14 15 16 17 18 Est.
Cos
t of
Com
plet
ions
Est.
Cos
t of
Nee
ds
Inventory Year
Water and Wastewater(in millions)
Completed
TOP 3
0
500
1,000
1,500
2,000
2,500
$0.0
$0.5
$1.0
$1.5
$2.0
$2.5
$3.0
09 10 11 12 13 14 15 16 17 18
Stud
ents
Cost
in M
illio
ns
Inventory Year
Cost of Needed New School Space vs Improvements to Existing Schools and Student Enrollment Growth
New Space Existing Space Students
= Local= Regional (Serves Multiple Counties)
DRAFT

69WWW.TN.GOV/TACIR
County Summaries
Project Type Conceptual
Planning & Design + Construction
Post-secondary Education 424,700,000$ 1,254,608,000$
Transportation 380,859,000$ 1,115,633,912$
Water and Wastewater 77,000,000$ 402,165,000$
Other Utilities 16,670,000$ 59,000,000$
Housing 15,000,000$ 60,000,000$
Law Enforcement 54,500,000$ 5,510,000$
Other Education 12,270,000$ 25,730,000$
Recreation 2,295,000$ 33,094,471$
School Renovations 15,714,000$ 13,053,322$
Other Facilities 550,000$ 24,823,018$
Public Health Facilities -$ 22,190,000$
Business District Development -$ 20,239,472$
New Public Schools & Additions 400,000$ 6,750,000$
Libraries, Museums, & Historic Sites 2,500,000$ 2,300,000$
Public Buildings 1,800,000$ -$
Broadband -$ -$
Community Development -$ -$
Fire Protection -$ -$
Industrial Sites and Parks -$ -$
School-System-wide -$ -$
Solid Waste -$ -$
Storm Water -$ -$Total 1,004,258,000$ 3,045,097,195$
*Total Estimated Cost = Conceptual + Planning & Design + Construction
Estimated Cost of Needed Infrastructurefor Knox County
Five-year period July 2018 through June 2023
Knox CountyTotal Estimated Cost* for
Infrastructure Improvements
$4,049,355,195
$0
$50
$100
$150
$200
$250
$0
$500
$1,000
$1,500
$2,000
$2,500
09 10 11 12 13 14 15 16 17 18 Est.
Cos
t of
Com
plet
ions
Est.
Cos
t of
Nee
ds
Inventory Year
Post-secondary Education(in millions)
Completed
$0
$50
$100
$150
$200
$250
$0$200$400$600$800
$1,000$1,200$1,400$1,600
09 11 13 15 17 Est.
Cos
t of
Com
plet
ions
Est.
Cos
t of
Nee
ds
Inventory Year
Transportation(in millions)
Completed
$0$10$20$30$40$50$60$70$80$90$100
$0$100$200$300$400$500$600
09 10 11 12 13 14 15 16 17 18 Est.
Cos
t of
Com
plet
ions
Est.
Cos
t of
Nee
ds
Inventory Year
Water and Wastewater(in millions)
Completed
TOP 3
0
10,000
20,000
30,000
40,000
50,000
60,000
70,000
$0
$20
$40
$60
$80
$100
$120
$140
09 10 11 12 13 14 15 16 17 18
Stud
ents
Cost
in M
illio
ns
Inventory Year
Cost of Needed New School Space vs Improvements to Existing Schools and Student Enrollment Growth
New Space Existing Space Students
= Local= Regional (Serves Multiple Counties)
DRAFT

WWW.TN.GOV/TACIR70
Building Tennessee’s Tomorrow: Anticipating the State’s Infrastructure Needs
Project Type Conceptual
Planning & Design + Construction
Law Enforcement 10,500,000$ 13,000,000$
School Renovations 10,660,000$ 270,000$
Transportation 4,417,000$ 3,894,934$
Public Buildings 3,200,000$ -$
Recreation 1,800,000$ 201,210$
Water and Wastewater 200,000$ 507,925$
Community Development 700,000$ -$
Industrial Sites and Parks -$ 308,748$
Other Facilities 200,000$ -$
Storm Water 150,000$ -$
Fire Protection 50,000$ -$
Broadband -$ -$
Business District Development -$ -$
Housing -$ -$
Libraries, Museums, & Historic Sites -$ -$
New Public Schools & Additions -$ -$
Other Education -$ -$
Other Utilities -$ -$
Post-secondary Education -$ -$
Public Health Facilities -$ -$
School-System-wide -$ -$
Solid Waste -$ -$Total 31,877,000$ 18,182,817$
*Total Estimated Cost = Conceptual + Planning & Design + Construction
Estimated Cost of Needed Infrastructurefor Lake County
Five-year period July 2018 through June 2023
Lake CountyTotal Estimated Cost* for
Infrastructure Improvements
$50,059,817
$0
$2
$4
$6
$8
$10
$0
$5
$10
$15
$20
$25
09 10 11 12 13 14 15 16 17 18 Est.
Cos
t of
Com
plet
ions
Est.
Cos
t of
Nee
ds
Inventory Year
Law Enforcement(in millions)
Completed
$0.0$0.1$0.2$0.3$0.4$0.5$0.6$0.7
$0$2$4$6$8
$10$12
09 10 11 12 13 14 15 16 17 18 Est.
Cos
t of
Com
plet
ions
Est.
Cos
t of
Nee
ds
Inventory Year
School Renovations(in millions)
Completed
$0$5$10$15$20$25$30
$0$10$20$30$40$50$60$70
09 10 11 12 13 14 15 16 17 18 Est.
Cos
t of
Com
plet
ions
Est.
Cos
t of
Nee
ds
Inventory Year
Transportation(in millions)
Completed
TOP 3
01002003004005006007008009001,000
$0
$2
$4
$6
$8
$10
$12
09 10 11 12 13 14 15 16 17 18
Stud
ents
Cost
in M
illio
ns
Inventory Year
Cost of Needed New School Space vs Improvements to Existing Schools and Student Enrollment Growth
New Space Existing Space Students
= Local= Regional (Serves Multiple Counties)
DRAFT

71WWW.TN.GOV/TACIR
County Summaries
Project Type Conceptual
Planning & Design + Construction
Transportation 29,334,495$ 335,263,321$
Law Enforcement 11,170,000$ 33,460,000$
School Renovations 36,480,000$ 397,500$
Housing 2,500,000$ -$
Libraries, Museums, & Historic Sites -$ 300,000$
Broadband -$ -$
Business District Development -$ -$
Community Development -$ -$
Fire Protection -$ -$
Industrial Sites and Parks -$ -$
New Public Schools & Additions -$ -$
Other Education -$ -$
Other Facilities -$ -$
Other Utilities -$ -$
Post-secondary Education -$ -$
Public Buildings -$ -$
Public Health Facilities -$ -$
Recreation -$ -$
School-System-wide -$ -$
Solid Waste -$ -$
Storm Water -$ -$
Water and Wastewater -$ -$Total 79,484,495$ 369,420,821$
*Total Estimated Cost = Conceptual + Planning & Design + Construction
Estimated Cost of Needed Infrastructurefor Lauderdale County
Five-year period July 2018 through June 2023
Lauderdale CountyTotal Estimated Cost* for
Infrastructure Improvements
$448,905,316
$0$5$10$15$20$25$30
$0
$100
$200
$300
$400
$500
09 10 11 12 13 14 15 16 17 18 Est.
Cos
t of
Com
plet
ions
Est.
Cos
t of
Nee
ds
Inventory Year
Transportation(in millions)
Completed
$0$1$2$3$4$5$6$7
$0
$10
$20
$30
$40
$50
09 10 11 12 13 14 15 16 17 18 Est.
Cos
t of
Com
plet
ions
Est.
Cos
t of
Nee
ds
Inventory Year
Law Enforcement(in millions)
Completed
$0$1$2$3$4$5$6
$0$5
$10$15$20$25$30$35$40
09 10 11 12 13 14 15 16 17 18 Est.
Cos
t of
Com
plet
ions
Est.
Cos
t of
Nee
ds
Inventory Year
School Renovations(in millions)
Completed
TOP 3
05001,0001,5002,0002,5003,0003,5004,0004,5005,000
$0$5
$10$15$20$25$30$35$40
09 10 11 12 13 14 15 16 17 18
Stud
ents
Cost
in M
illio
ns
Inventory Year
Cost of Needed New School Space vs Improvements to Existing Schools and Student Enrollment Growth
New Space Existing Space Students
= Local= Regional (Serves Multiple Counties)
DRAFT

WWW.TN.GOV/TACIR72
Building Tennessee’s Tomorrow: Anticipating the State’s Infrastructure Needs
Project Type Conceptual
Planning & Design + Construction
Transportation 21,264,000$ 12,462,105$
Post-secondary Education -$ 10,000,000$
Law Enforcement 9,480,000$ -$
New Public Schools & Additions 5,000,000$ -$
Recreation 3,070,000$ -$
School Renovations 1,185,000$ 716,849$
Water and Wastewater 1,000,000$ -$
Fire Protection 850,000$ -$
Solid Waste -$ 450,000$
Broadband -$ -$
Business District Development -$ -$
Community Development -$ -$
Housing -$ -$
Industrial Sites and Parks -$ -$
Libraries, Museums, & Historic Sites -$ -$
Other Education -$ -$
Other Facilities -$ -$
Other Utilities -$ -$
Public Buildings -$ -$
Public Health Facilities -$ -$
School-System-wide -$ -$
Storm Water -$ -$Total 41,849,000$ 23,628,954$
*Total Estimated Cost = Conceptual + Planning & Design + Construction
Estimated Cost of Needed Infrastructurefor Lawrence County
Five-year period July 2018 through June 2023
Lawrence CountyTotal Estimated Cost* for
Infrastructure Improvements
$65,477,954
$0$10$20$30$40$50$60
$0$20$40$60$80
$100$120$140
09 10 11 12 13 14 15 16 17 18 Est.
Cos
t of
Com
plet
ions
Est.
Cos
t of
Nee
ds
Inventory Year
Transportation(in millions)
Completed
$0.0
$0.2
$0.4
$0.6
$0.8
$1.0
$0$2$4$6$8
$10$12
09 10 11 12 13 14 15 16 17 18 Est.
Cos
t of
Com
plet
ions
Est.
Cos
t of
Nee
ds
Inventory Year
Post-secondary Education(in millions)
Completed
$0$2$4$6$8$10$12$14$16$18
$0$2$4$6$8
$10$12$14$16$18
09 10 11 12 13 14 15 16 17 18 Est.
Cos
t of
Com
plet
ions
Est.
Cos
t of
Nee
ds
Inventory Year
Law Enforcement(in millions)
Completed
TOP 3
01,0002,0003,0004,0005,0006,0007,0008,000
$0
$1
$2
$3
$4
$5
$6
$7
09 10 11 12 13 14 15 16 17 18
Stud
ents
Cost
in M
illio
ns
Inventory Year
Cost of Needed New School Space vs Improvements to Existing Schools and Student Enrollment Growth
New Space Existing Space Students
= Local= Regional (Serves Multiple Counties)
DRAFT

73WWW.TN.GOV/TACIR
County Summaries
Project Type Conceptual
Planning & Design + Construction
Transportation 21,761,015$ 3,680,173$
New Public Schools & Additions 20,000,000$ -$
Law Enforcement 500,000$ 7,000,000$
Recreation 1,500,000$ -$
Libraries, Museums, & Historic Sites -$ 1,000,000$
Community Development 400,000$ -$
Industrial Sites and Parks 250,000$ -$
Broadband -$ -$
Business District Development -$ -$
Fire Protection -$ -$
Housing -$ -$
Other Education -$ -$
Other Facilities -$ -$
Other Utilities -$ -$
Post-secondary Education -$ -$
Public Buildings -$ -$
Public Health Facilities -$ -$
School Renovations -$ -$
School-System-wide -$ -$
Solid Waste -$ -$
Storm Water -$ -$
Water and Wastewater -$ -$Total 44,411,015$ 11,680,173$
*Total Estimated Cost = Conceptual + Planning & Design + Construction
Estimated Cost of Needed Infrastructurefor Lewis County
Five-year period July 2018 through June 2023
Lewis CountyTotal Estimated Cost* for
Infrastructure Improvements
$56,091,188
$0$5$10$15$20$25$30$35$40
$0
$20
$40
$60
$80
$100
09 10 11 12 13 14 15 16 17 18 Est.
Cos
t of
Com
plet
ions
Est.
Cos
t of
Nee
ds
Inventory Year
Transportation(in millions)
Completed
$0.0
$0.2
$0.4
$0.6
$0.8
$1.0
$0
$5
$10
$15
$20
$25
09 10 11 12 13 14 15 16 17 18 Est.
Cos
t of
Com
plet
ions
Est.
Cos
t of
Nee
ds
Inventory Year
New Public Schools & Additions (in millions)
Completed
$0.0$0.1$0.2$0.3$0.4$0.5$0.6$0.7$0.8$0.9$1.0
$0$1$2$3$4$5$6$7$8
09 10 11 12 13 14 15 16 17 18 Est.
Cos
t of
Com
plet
ions
Est.
Cos
t of
Nee
ds
Inventory Year
Law Enforcement(in millions)
Completed
TOP 3
02004006008001,0001,2001,4001,6001,8002,000
$0
$5
$10
$15
$20
$25
09 10 11 12 13 14 15 16 17 18
Stud
ents
Cost
in M
illio
ns
Inventory Year
Cost of Needed New School Space vs Improvements to Existing Schools and Student Enrollment Growth
New Space Existing Space Students
= Local= Regional (Serves Multiple Counties)
DRAFT

WWW.TN.GOV/TACIR74
Building Tennessee’s Tomorrow: Anticipating the State’s Infrastructure Needs
Project Type Conceptual
Planning & Design + Construction
Transportation 26,972,000$ 36,751,786$
New Public Schools & Additions -$ 27,000,000$
Water and Wastewater 14,300,000$ 790,800$
School Renovations 12,203,000$ 310,000$
Recreation 8,675,260$ 2,673,796$
Libraries, Museums, & Historic Sites -$ 1,625,000$
Storm Water 350,000$ 805,000$
Post-secondary Education 610,000$ -$
Industrial Sites and Parks -$ 398,300$
Public Buildings -$ 250,000$
Broadband -$ -$
Business District Development -$ -$
Community Development -$ -$
Fire Protection -$ -$
Housing -$ -$
Law Enforcement -$ -$
Other Education -$ -$
Other Facilities -$ -$
Other Utilities -$ -$
Public Health Facilities -$ -$
School-System-wide -$ -$
Solid Waste -$ -$Total 63,110,260$ 70,604,682$
*Total Estimated Cost = Conceptual + Planning & Design + Construction
Estimated Cost of Needed Infrastructurefor Lincoln County
Five-year period July 2018 through June 2023
Lincoln CountyTotal Estimated Cost* for
Infrastructure Improvements
$133,714,942
$0$5$10$15$20$25$30$35$40
$0$10$20$30$40$50$60$70
09 10 11 12 13 14 15 16 17 18 Est.
Cos
t of
Com
plet
ions
Est.
Cos
t of
Nee
ds
Inventory Year
Transportation(in millions)
Completed
$0.0
$0.2
$0.4
$0.6
$0.8
$1.0
$0$5
$10$15$20$25$30
09 10 11 12 13 14 15 16 17 18 Est.
Cos
t of
Com
plet
ions
Est.
Cos
t of
Nee
ds
Inventory Year
New Public Schools & Additions (in millions)
Completed
$0.0$0.5$1.0$1.5$2.0$2.5$3.0
$0$2$4$6$8
$10$12$14$16
09 10 11 12 13 14 15 16 17 18 Est.
Cos
t of
Com
plet
ions
Est.
Cos
t of
Nee
ds
Inventory Year
Water and Wastewater(in millions)
Completed
TOP 3
0
1,000
2,000
3,000
4,000
5,000
6,000
$0
$5
$10
$15
$20
$25
$30
09 10 11 12 13 14 15 16 17 18
Stud
ents
Cost
in M
illio
ns
Inventory Year
Cost of Needed New School Space vs Improvements to Existing Schools and Student Enrollment Growth
New Space Existing Space Students
= Local= Regional (Serves Multiple Counties)
DRAFT

75WWW.TN.GOV/TACIR
County Summaries
Project Type Conceptual
Planning & Design + Construction
Transportation 45,112,426$ 350,116,255$
Law Enforcement -$ 18,750,000$
Water and Wastewater 13,500,000$ 4,660,000$
Public Buildings 500,000$ 5,000,000$
Other Utilities 3,000,000$ 900,000$
Recreation 3,000,000$ -$
School Renovations 225,000$ 2,010,000$
Industrial Sites and Parks 1,760,000$ -$
New Public Schools & Additions 600,000$ 750,000$
Broadband -$ -$
Business District Development -$ -$
Community Development -$ -$
Fire Protection -$ -$
Housing -$ -$
Libraries, Museums, & Historic Sites -$ -$
Other Education -$ -$
Other Facilities -$ -$
Post-secondary Education -$ -$
Public Health Facilities -$ -$
School-System-wide -$ -$
Solid Waste -$ -$
Storm Water -$ -$Total 67,697,426$ 382,186,255$
*Total Estimated Cost = Conceptual + Planning & Design + Construction
Estimated Cost of Needed Infrastructurefor Loudon County
Five-year period July 2018 through June 2023
Loudon CountyTotal Estimated Cost* for
Infrastructure Improvements
$449,883,681
$0
$10
$20
$30
$40
$50
$0
$100
$200
$300
$400
$500
09 10 11 12 13 14 15 16 17 18 Est.
Cos
t of
Com
plet
ions
Est.
Cos
t of
Nee
ds
Inventory Year
Transportation(in millions)
Completed
$0.0
$0.2
$0.4
$0.6
$0.8
$1.0
$0
$5
$10
$15
$20
09 10 11 12 13 14 15 16 17 18 Est.
Cos
t of
Com
plet
ions
Est.
Cos
t of
Nee
ds
Inventory Year
Law Enforcement(in millions)
Completed
$0
$5
$10
$15
$20
$25
$0$10$20$30$40$50$60$70$80
09 10 11 12 13 14 15 16 17 18 Est.
Cos
t of
Com
plet
ions
Est.
Cos
t of
Nee
ds
Inventory Year
Water and Wastewater(in millions)
Completed
TOP 3
01,0002,0003,0004,0005,0006,0007,0008,000
$0$5
$10$15$20$25$30$35$40$45
09 10 11 12 13 14 15 16 17 18
Stud
ents
Cost
in M
illio
ns
Inventory Year
Cost of Needed New School Space vs Improvements to Existing Schools and Student Enrollment Growth
New Space Existing Space Students
= Local= Regional (Serves Multiple Counties)
DRAFT

WWW.TN.GOV/TACIR76
Building Tennessee’s Tomorrow: Anticipating the State’s Infrastructure Needs
Project Type Conceptual
Planning & Design + Construction
Transportation 35,864,000$ 40,757,764$
New Public Schools & Additions 25,800,000$ 10,880,000$
Water and Wastewater 12,000,000$ 5,525,000$
Community Development 8,000,000$ -$
Law Enforcement -$ 5,640,000$
Recreation 3,060,000$ -$
Post-secondary Education 3,000,000$ -$
School-System-wide 500,000$ -$
Solid Waste -$ 500,000$
Public Health Facilities 300,000$ -$
School Renovations -$ 60,000$
Broadband -$ -$
Business District Development -$ -$
Fire Protection -$ -$
Housing -$ -$
Industrial Sites and Parks -$ -$
Libraries, Museums, & Historic Sites -$ -$
Other Education -$ -$
Other Facilities -$ -$
Other Utilities -$ -$
Public Buildings -$ -$
Storm Water -$ -$Total 88,524,000$ 63,362,764$
*Total Estimated Cost = Conceptual + Planning & Design + Construction
Estimated Cost of Needed Infrastructurefor Macon County
Five-year period July 2018 through June 2023
Macon CountyTotal Estimated Cost* for
Infrastructure Improvements
$151,886,764
$0.0$0.2$0.4$0.6$0.8$1.0$1.2
$0$20$40$60$80
$100$120
09 10 11 12 13 14 15 16 17 18 Est.
Cos
t of
Com
plet
ions
Est.
Cos
t of
Nee
ds
Inventory Year
Transportation(in millions)
Completed
$0.00
$0.05
$0.10
$0.15
$0.20
$0$5
$10$15$20$25$30$35$40
09 10 11 12 13 14 15 16 17 18 Est.
Cos
t of
Com
plet
ions
Est.
Cos
t of
Nee
ds
Inventory Year
New Public Schools & Additions (in millions)
Completed
$0$1$2$3$4$5$6
$0
$5
$10
$15
$20
$25
09 10 11 12 13 14 15 16 17 18 Est.
Cos
t of
Com
plet
ions
Est.
Cos
t of
Nee
ds
Inventory Year
Water and Wastewater(in millions)
Completed
TOP 3
05001,0001,5002,0002,5003,0003,5004,0004,500
$0$5
$10$15$20$25$30$35$40
09 10 11 12 13 14 15 16 17 18
Stud
ents
Cost
in M
illio
ns
Inventory Year
Cost of Needed New School Space vs Improvements to Existing Schools and Student Enrollment Growth
New Space Existing Space Students
= Local= Regional (Serves Multiple Counties)
DRAFT
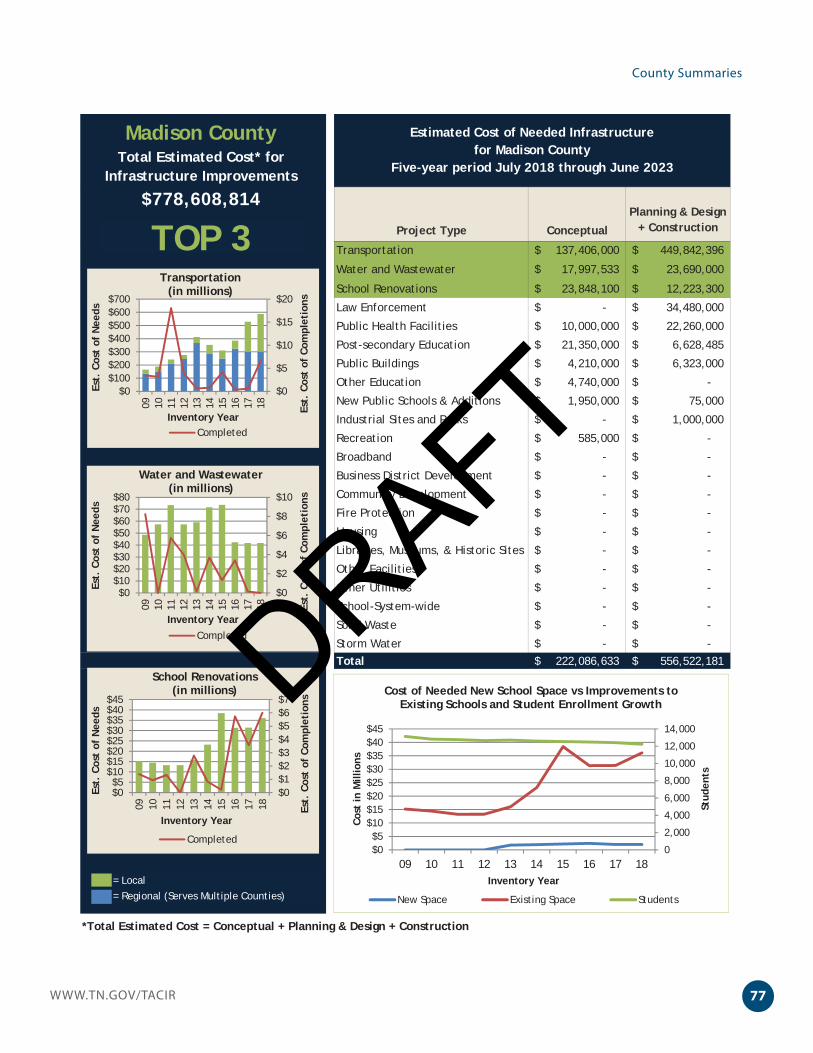
77WWW.TN.GOV/TACIR
County Summaries
Project Type Conceptual
Planning & Design + Construction
Transportation 137,406,000$ 449,842,396$
Water and Wastewater 17,997,533$ 23,690,000$
School Renovations 23,848,100$ 12,223,300$
Law Enforcement -$ 34,480,000$
Public Health Facilities 10,000,000$ 22,260,000$
Post-secondary Education 21,350,000$ 6,628,485$
Public Buildings 4,210,000$ 6,323,000$
Other Education 4,740,000$ -$
New Public Schools & Additions 1,950,000$ 75,000$
Industrial Sites and Parks -$ 1,000,000$
Recreation 585,000$ -$
Broadband -$ -$
Business District Development -$ -$
Community Development -$ -$
Fire Protection -$ -$
Housing -$ -$
Libraries, Museums, & Historic Sites -$ -$
Other Facilities -$ -$
Other Utilities -$ -$
School-System-wide -$ -$
Solid Waste -$ -$
Storm Water -$ -$Total 222,086,633$ 556,522,181$
*Total Estimated Cost = Conceptual + Planning & Design + Construction
Estimated Cost of Needed Infrastructurefor Madison County
Five-year period July 2018 through June 2023
Madison CountyTotal Estimated Cost* for
Infrastructure Improvements
$778,608,814
$0
$5
$10
$15
$20
$0$100$200$300$400$500$600$700
09 10 11 12 13 14 15 16 17 18 Est.
Cos
t of
Com
plet
ions
Est.
Cos
t of
Nee
ds
Inventory Year
Transportation(in millions)
Completed
$0
$2
$4
$6
$8
$10
$0$10$20$30$40$50$60$70$80
09 10 11 12 13 14 15 16 17 18 Est.
Cos
t of
Com
plet
ions
Est.
Cos
t of
Nee
ds
Inventory Year
Water and Wastewater(in millions)
Completed
$0$1$2$3$4$5$6$7
$0$5
$10$15$20$25$30$35$40$45
09 10 11 12 13 14 15 16 17 18 Est.
Cos
t of
Com
plet
ions
Est.
Cos
t of
Nee
ds
Inventory Year
School Renovations(in millions)
Completed
TOP 3
0
2,000
4,000
6,000
8,000
10,000
12,000
14,000
$0$5
$10$15$20$25$30$35$40$45
09 10 11 12 13 14 15 16 17 18
Stud
ents
Cost
in M
illio
ns
Inventory Year
Cost of Needed New School Space vs Improvements to Existing Schools and Student Enrollment Growth
New Space Existing Space Students
= Local= Regional (Serves Multiple Counties)
DRAFT

WWW.TN.GOV/TACIR78
Building Tennessee’s Tomorrow: Anticipating the State’s Infrastructure Needs
Project Type Conceptual
Planning & Design + Construction
Transportation 147,317,000$ 40,016,779$
New Public Schools & Additions 31,427,460$ -$
School Renovations 10,248,225$ 2,165,000$
Water and Wastewater 3,969,200$ 708,000$
Industrial Sites and Parks 2,150,000$ 2,100,000$
Post-secondary Education -$ 3,485,300$
Recreation 2,170,000$ 419,205$
Public Buildings 1,000,000$ 309,207$
Housing -$ 500,000$
Libraries, Museums, & Historic Sites 500,000$ -$
Community Development 250,000$ -$
Storm Water -$ 50,000$
Broadband -$ -$
Business District Development -$ -$
Fire Protection -$ -$
Law Enforcement -$ -$
Other Education -$ -$
Other Facilities -$ -$
Other Utilities -$ -$
Public Health Facilities -$ -$
School-System-wide -$ -$
Solid Waste -$ -$Total 199,031,885$ 49,753,491$
*Total Estimated Cost = Conceptual + Planning & Design + Construction
Estimated Cost of Needed Infrastructurefor Marion County
Five-year period July 2018 through June 2023
Marion CountyTotal Estimated Cost* for
Infrastructure Improvements
$248,785,376
$0$10$20$30$40$50$60
$0$50
$100$150$200$250$300
09 10 11 12 13 14 15 16 17 18 Est.
Cos
t of
Com
plet
ions
Est.
Cos
t of
Nee
ds
Inventory Year
Transportation(in millions)
Completed
$0.0$0.1$0.2$0.3$0.4$0.5$0.6$0.7
$0$5
$10$15$20$25$30$35
09 10 11 12 13 14 15 16 17 18 Est.
Cos
t of
Com
plet
ions
Est.
Cos
t of
Nee
ds
Inventory Year
New Public Schools & Additions (in millions)
Completed
$0.0$0.2$0.4$0.6$0.8$1.0$1.2
$0$2$4$6$8
$10$12$14
09 10 11 12 13 14 15 16 17 18 Est.
Cos
t of
Com
plet
ions
Est.
Cos
t of
Nee
ds
Inventory Year
School Renovations(in millions)
Completed
TOP 3
05001,0001,5002,0002,5003,0003,5004,0004,5005,000
$0
$5
$10
$15
$20
$25
$30
$35
09 10 11 12 13 14 15 16 17 18
Stud
ents
Cost
in M
illio
ns
Inventory Year
Cost of Needed New School Space vs Improvements to Existing Schools and Student Enrollment Growth
New Space Existing Space Students
= Local= Regional (Serves Multiple Counties)
DRAFT

79WWW.TN.GOV/TACIR
County Summaries
Project Type Conceptual
Planning & Design + Construction
Transportation 33,053,000$ 56,768,831$
Recreation -$ 27,100,000$
Water and Wastewater -$ 5,967,594$
Public Health Facilities -$ 1,800,000$
Libraries, Museums, & Historic Sites 1,500,000$ -$
Fire Protection -$ 800,000$
Public Buildings -$ 59,091$
Broadband -$ -$
Business District Development -$ -$
Community Development -$ -$
Housing -$ -$
Industrial Sites and Parks -$ -$
Law Enforcement -$ -$
New Public Schools & Additions -$ -$
Other Education -$ -$
Other Facilities -$ -$
Other Utilities -$ -$
Post-secondary Education -$ -$
School Renovations -$ -$
School-System-wide -$ -$
Solid Waste -$ -$
Storm Water -$ -$Total 34,553,000$ 92,495,516$
*Total Estimated Cost = Conceptual + Planning & Design + Construction
Estimated Cost of Needed Infrastructurefor Marshall County
Five-year period July 2018 through June 2023
Marshall CountyTotal Estimated Cost* for
Infrastructure Improvements
$127,048,516
$0
$10
$20
$30
$40
$50
$0
$20
$40
$60
$80
$100
09 10 11 12 13 14 15 16 17 18 Est.
Cos
t of
Com
plet
ions
Est.
Cos
t of
Nee
ds
Inventory Year
Transportation(in millions)
Completed
$0.0
$0.5
$1.0
$1.5
$2.0
$2.5
$0$5
$10$15$20$25$30
09 10 11 12 13 14 15 16 17 18 Est.
Cos
t of
Com
plet
ions
Est.
Cos
t of
Nee
ds
Inventory Year
Recreation(in millions)
Completed
$0$2$4$6$8$10$12$14$16
$0$5
$10$15$20$25$30$35
09 10 11 12 13 14 15 16 17 18 Est.
Cos
t of
Com
plet
ions
Est.
Cos
t of
Nee
ds
Inventory Year
Water and Wastewater(in millions)
Completed
TOP 3
0
1,000
2,000
3,000
4,000
5,000
6,000
$0$5
$10$15$20$25$30$35$40
09 10 11 12 13 14 15 16 17 18
Stud
ents
Cost
in M
illio
ns
Inventory Year
Cost of Needed New School Space vs Improvements to Existing Schools and Student Enrollment Growth
New Space Existing Space Students
= Local= Regional (Serves Multiple Counties)
DRAFT

WWW.TN.GOV/TACIR80
Building Tennessee’s Tomorrow: Anticipating the State’s Infrastructure Needs
Project Type Conceptual
Planning & Design + Construction
Transportation 110,699,000$ 117,095,339$
New Public Schools & Additions -$ 66,486,000$
Law Enforcement 560,000$ 33,919,676$
School Renovations 20,100,000$ 9,854,565$
Water and Wastewater 19,370,000$ 1,625,000$
Post-secondary Education 220,000$ 11,750,000$
Public Health Facilities -$ 11,750,000$
Recreation 11,740,000$ -$
Public Buildings 2,650,000$ 2,500,000$
Fire Protection 1,500,000$ 200,000$
Solid Waste -$ 500,000$
Libraries, Museums, & Historic Sites -$ 175,000$
Broadband -$ -$
Business District Development -$ -$
Community Development -$ -$
Housing -$ -$
Industrial Sites and Parks -$ -$
Other Education -$ -$
Other Facilities -$ -$
Other Utilities -$ -$
School-System-wide -$ -$
Storm Water -$ -$Total 166,839,000$ 255,855,580$
*Total Estimated Cost = Conceptual + Planning & Design + Construction
Estimated Cost of Needed Infrastructurefor Maury County
Five-year period July 2018 through June 2023
Maury CountyTotal Estimated Cost* for
Infrastructure Improvements
$422,694,580
$0$2$4$6$8$10$12$14
$0
$50
$100
$150
$200
$250
09 10 11 12 13 14 15 16 17 18 Est.
Cos
t of
Com
plet
ions
Est.
Cos
t of
Nee
ds
Inventory Year
Transportation(in millions)
Completed
$0
$10
$20
$30
$40
$50
$0$20$40$60$80
$100$120
09 10 11 12 13 14 15 16 17 18 Est.
Cos
t of
Com
plet
ions
Est.
Cos
t of
Nee
ds
Inventory Year
New Public Schools & Additions (in millions)
Completed
$0$1$2$3$4$5$6
$0$5
$10$15$20$25$30$35$40
09 10 11 12 13 14 15 16 17 18 Est.
Cos
t of
Com
plet
ions
Est.
Cos
t of
Nee
ds
Inventory Year
Law Enforcement(in millions)
Completed
TOP 3
0
2,000
4,000
6,000
8,000
10,000
12,000
14,000
$0
$20
$40
$60
$80
$100
$120
09 10 11 12 13 14 15 16 17 18
Stud
ents
Cost
in M
illio
ns
Inventory Year
Cost of Needed New School Space vs Improvements to Existing Schools and Student Enrollment Growth
New Space Existing Space Students
= Local= Regional (Serves Multiple Counties)
DRAFT

81WWW.TN.GOV/TACIR
County Summaries
Project Type Conceptual
Planning & Design + Construction
Transportation 30,778,000$ 41,388,114$
School Renovations 15,196,140$ 5,602,000$
Post-secondary Education 13,860,000$ 6,500,000$
Storm Water 10,000,000$ -$
New Public Schools & Additions 3,280,000$ 5,500,000$
Broadband 6,500,000$ -$
Recreation 3,050,000$ 3,160,000$
Business District Development 6,000,000$ -$
Water and Wastewater 1,974,000$ 2,759,322$
Community Development 4,000,000$ 443,340$
Fire Protection 4,000,000$ -$
Industrial Sites and Parks 2,000,000$ 1,001,000$
Other Utilities 1,000,000$ -$
Law Enforcement 200,000$ -$
Libraries, Museums, & Historic Sites 100,000$ -$
Public Buildings -$ 50,000$
Housing -$ -$
Other Education -$ -$
Other Facilities -$ -$
Public Health Facilities -$ -$
School-System-wide -$ -$
Solid Waste -$ -$Total 101,938,140$ 66,403,776$
*Total Estimated Cost = Conceptual + Planning & Design + Construction
Estimated Cost of Needed Infrastructurefor McMinn County
Five-year period July 2018 through June 2023
McMinn CountyTotal Estimated Cost* for
Infrastructure Improvements
$168,341,916
$0$10$20$30$40$50$60
$0$50
$100$150$200$250$300
09 10 11 12 13 14 15 16 17 18 Est.
Cos
t of
Com
plet
ions
Est.
Cos
t of
Nee
ds
Inventory Year
Transportation(in millions)
Completed
$0.0$0.2$0.4$0.6$0.8$1.0$1.2$1.4
$0
$5
$10
$15
$20
$25
09 10 11 12 13 14 15 16 17 18 Est.
Cos
t of
Com
plet
ions
Est.
Cos
t of
Nee
ds
Inventory Year
School Renovations(in millions)
Completed
$0.0$0.1$0.2$0.3$0.4$0.5$0.6$0.7$0.8$0.9$1.0
$0
$5
$10
$15
$20
$25
09 10 11 12 13 14 15 16 17 18 Est.
Cos
t of
Com
plet
ions
Est.
Cos
t of
Nee
ds
Inventory Year
Post-secondary Education(in millions)
Completed
TOP 3
01,0002,0003,0004,0005,0006,0007,0008,0009,000
$0
$5
$10
$15
$20
$25
09 10 11 12 13 14 15 16 17 18
Stud
ents
Cost
in M
illio
ns
Inventory Year
Cost of Needed New School Space vs Improvements to Existing Schools and Student Enrollment Growth
New Space Existing Space Students
= Local= Regional (Serves Multiple Counties)
DRAFT

WWW.TN.GOV/TACIR82
Building Tennessee’s Tomorrow: Anticipating the State’s Infrastructure Needs
Project Type Conceptual
Planning & Design + Construction
Transportation 25,304,000$ 16,243,456$
Water and Wastewater 9,720,000$ 8,307,887$
New Public Schools & Additions 4,215,000$ 5,000,000$
School Renovations 3,602,900$ 101,000$
Public Buildings 1,800,000$ -$
Other Utilities 1,500,000$ -$
Recreation 1,330,000$ -$
Storm Water 800,000$ -$
Libraries, Museums, & Historic Sites 200,000$ -$
Fire Protection 80,000$ -$
Broadband -$ -$
Business District Development -$ -$
Community Development -$ -$
Housing -$ -$
Industrial Sites and Parks -$ -$
Law Enforcement -$ -$
Other Education -$ -$
Other Facilities -$ -$
Post-secondary Education -$ -$
Public Health Facilities -$ -$
School-System-wide -$ -$
Solid Waste -$ -$Total 48,551,900$ 29,652,343$
*Total Estimated Cost = Conceptual + Planning & Design + Construction
Estimated Cost of Needed Infrastructurefor McNairy County
Five-year period July 2018 through June 2023
McNairy CountyTotal Estimated Cost* for
Infrastructure Improvements
$78,204,243
$0$10$20$30$40$50$60$70$80
$0
$50
$100
$150
$200
09 10 11 12 13 14 15 16 17 18 Est.
Cos
t of
Com
plet
ions
Est.
Cos
t of
Nee
ds
Inventory Year
Transportation(in millions)
Completed
$0$1$2$3$4$5$6$7$8
$0$5
$10$15$20$25$30$35$40
09 10 11 12 13 14 15 16 17 18 Est.
Cos
t of
Com
plet
ions
Est.
Cos
t of
Nee
ds
Inventory Year
Water and Wastewater(in millions)
Completed
$0$2$4$6$8$10$12$14$16
$0
$5
$10
$15
$20
$25
09 10 11 12 13 14 15 16 17 18 Est.
Cos
t of
Com
plet
ions
Est.
Cos
t of
Nee
ds
Inventory Year
New Public Schools & Additions (in millions)
Completed
TOP 3
05001,0001,5002,0002,5003,0003,5004,0004,5005,000
$0
$5
$10
$15
$20
$25
09 10 11 12 13 14 15 16 17 18
Stud
ents
Cost
in M
illio
ns
Inventory Year
Cost of Needed New School Space vs Improvements to Existing Schools and Student Enrollment Growth
New Space Existing Space Students
= Local= Regional (Serves Multiple Counties)
DRAFT

83WWW.TN.GOV/TACIR
County Summaries
Project Type Conceptual
Planning & Design + Construction
Transportation 8,795,000$ 2,103,800$
Water and Wastewater 5,000,000$ 1,795,100$
School Renovations 1,406,000$ -$
Other Facilities 250,000$ 300,000$
School-System-wide 150,000$ -$
Fire Protection 50,000$ -$
Broadband -$ -$
Business District Development -$ -$
Community Development -$ -$
Housing -$ -$
Industrial Sites and Parks -$ -$
Law Enforcement -$ -$
Libraries, Museums, & Historic Sites -$ -$
New Public Schools & Additions -$ -$
Other Education -$ -$
Other Utilities -$ -$
Post-secondary Education -$ -$
Public Buildings -$ -$
Public Health Facilities -$ -$
Recreation -$ -$
Solid Waste -$ -$
Storm Water -$ -$Total 15,651,000$ 4,198,900$
*Total Estimated Cost = Conceptual + Planning & Design + Construction
Estimated Cost of Needed Infrastructurefor Meigs County
Five-year period July 2018 through June 2023
Meigs CountyTotal Estimated Cost* for
Infrastructure Improvements
$19,849,900
$0
$5
$10
$15
$20
$25
$0$5
$10$15$20$25$30$35
09 10 11 12 13 14 15 16 17 18 Est.
Cos
t of
Com
plet
ions
Est.
Cos
t of
Nee
ds
Inventory Year
Transportation(in millions)
Completed
$0.0$0.5$1.0$1.5$2.0$2.5$3.0
$0$2$4$6$8
$10$12$14
09 10 11 12 13 14 15 16 17 18 Est.
Cos
t of
Com
plet
ions
Est.
Cos
t of
Nee
ds
Inventory Year
Water and Wastewater(in millions)
Completed
$0.0$0.2$0.4$0.6$0.8$1.0$1.2$1.4
$0.0$0.2$0.4$0.6$0.8$1.0$1.2$1.4$1.6
09 10 11 12 13 14 15 16 17 18 Est.
Cos
t of
Com
plet
ions
Est.
Cos
t of
Nee
ds
Inventory Year
School Renovations(in millions)
Completed
TOP 3
02004006008001,0001,2001,4001,6001,8002,000
$0.0$0.2$0.4$0.6$0.8$1.0$1.2$1.4$1.6$1.8$2.0
09 10 11 12 13 14 15 16 17 18
Stud
ents
Cost
in M
illio
ns
Inventory Year
Cost of Needed New School Space vs Improvements to Existing Schools and Student Enrollment Growth
New Space Existing Space Students
= Local= Regional (Serves Multiple Counties)
DRAFT

WWW.TN.GOV/TACIR84
Building Tennessee’s Tomorrow: Anticipating the State’s Infrastructure Needs
Project Type Conceptual
Planning & Design + Construction
Transportation 10,879,000$ 42,459,022$
New Public Schools & Additions 9,020,000$ 31,000,000$
Law Enforcement 30,075,000$ 300,000$
School Renovations 20,706,853$ 4,155,000$
Water and Wastewater 8,418,513$ 1,233,148$
Public Buildings 2,570,000$ 500,000$
Industrial Sites and Parks -$ 1,855,000$
Recreation 1,000,000$ 700,000$
Libraries, Museums, & Historic Sites 1,500,000$ -$
Fire Protection -$ 500,000$
Other Facilities 75,000$ -$
Broadband -$ -$
Business District Development -$ -$
Community Development -$ -$
Housing -$ -$
Other Education -$ -$
Other Utilities -$ -$
Post-secondary Education -$ -$
Public Health Facilities -$ -$
School-System-wide -$ -$
Solid Waste -$ -$
Storm Water -$ -$Total 84,244,366$ 82,702,170$
*Total Estimated Cost = Conceptual + Planning & Design + Construction
Estimated Cost of Needed Infrastructurefor Monroe County
Five-year period July 2018 through June 2023
Monroe CountyTotal Estimated Cost* for
Infrastructure Improvements
$166,946,536
$0.0
$0.5
$1.0
$1.5
$2.0
$2.5
$0$10$20$30$40$50$60$70
09 10 11 12 13 14 15 16 17 18 Est.
Cos
t of
Com
plet
ions
Est.
Cos
t of
Nee
ds
Inventory Year
Transportation(in millions)
Completed
$0$2$4$6$8$10$12$14
$0
$10
$20
$30
$40
$50
09 10 11 12 13 14 15 16 17 18 Est.
Cos
t of
Com
plet
ions
Est.
Cos
t of
Nee
ds
Inventory Year
New Public Schools & Additions (in millions)
Completed
$0.0$0.1$0.2$0.3$0.4$0.5$0.6$0.7$0.8$0.9$1.0
$0$5
$10$15$20$25$30$35
09 10 11 12 13 14 15 16 17 18 Est.
Cos
t of
Com
plet
ions
Est.
Cos
t of
Nee
ds
Inventory Year
Law Enforcement(in millions)
Completed
TOP 3
01,0002,0003,0004,0005,0006,0007,0008,000
$0$5
$10$15$20$25$30$35$40$45
09 10 11 12 13 14 15 16 17 18
Stud
ents
Cost
in M
illio
ns
Inventory Year
Cost of Needed New School Space vs Improvements to Existing Schools and Student Enrollment Growth
New Space Existing Space Students
= Local= Regional (Serves Multiple Counties)
DRAFT

85WWW.TN.GOV/TACIR
County Summaries
Project Type Conceptual
Planning & Design + Construction
Transportation 124,733,638$ 757,715,435$
Recreation 67,473,000$ 105,474,005$
New Public Schools & Additions 75,100,000$ 79,100,000$
Post-secondary Education 79,970,000$ 44,703,700$
Water and Wastewater 7,722,000$ 102,780,000$
Other Utilities 12,500,000$ 44,525,000$
School Renovations 49,385,915$ 6,503,000$
Community Development -$ 45,360,046$
Law Enforcement 29,970,000$ -$
Libraries, Museums, & Historic Sites 12,000,000$ -$
Fire Protection 7,150,000$ 3,625,000$
Public Health Facilities 3,180,000$ 4,023,440$
Public Buildings 4,500,000$ -$
Other Facilities -$ 500,000$
Broadband -$ -$
Business District Development -$ -$
Housing -$ -$
Industrial Sites and Parks -$ -$
Other Education -$ -$
School-System-wide -$ -$
Solid Waste -$ -$
Storm Water -$ -$Total 473,684,553$ 1,194,309,626$
*Total Estimated Cost = Conceptual + Planning & Design + Construction
Estimated Cost of Needed Infrastructurefor Montgomery County
Five-year period July 2018 through June 2023
Montgomery CountyTotal Estimated Cost* for
Infrastructure Improvements
$1,667,994,179
$0$10$20$30$40$50$60
$0
$200
$400
$600
$800
$1,000
09 10 11 12 13 14 15 16 17 18 Est.
Cos
t of
Com
plet
ions
Est.
Cos
t of
Nee
ds
Inventory Year
Transportation(in millions)
Completed
$0
$5
$10
$15
$20
$25
$0
$50
$100
$150
$200
$250
09 10 11 12 13 14 15 16 17 18 Est.
Cos
t of
Com
plet
ions
Est.
Cos
t of
Nee
ds
Inventory Year
Recreation(in millions)
Completed
$0$10$20$30$40$50$60$70
$0
$50
$100
$150
$200
$250
09 10 11 12 13 14 15 16 17 18 Est.
Cos
t of
Com
plet
ions
Est.
Cos
t of
Nee
ds
Inventory Year
New Public Schools & Additions (in millions)
Completed
TOP 3
05,00010,00015,00020,00025,00030,00035,00040,000
$0
$50
$100
$150
$200
$250
09 10 11 12 13 14 15 16 17 18
Stud
ents
Cost
in M
illio
ns
Inventory Year
Cost of Needed New School Space vs Improvements to Existing Schools and Student Enrollment Growth
New Space Existing Space Students
= Local= Regional (Serves Multiple Counties)
DRAFT

WWW.TN.GOV/TACIR86
Building Tennessee’s Tomorrow: Anticipating the State’s Infrastructure Needs
Project Type Conceptual
Planning & Design + Construction
Post-secondary Education -$ 37,161,095$
School Renovations 2,800,000$ 13,315,000$
Transportation 5,697,000$ 8,705,000$
Water and Wastewater -$ 10,500,000$
New Public Schools & Additions -$ 6,000,000$
Public Buildings 750,000$ -$
Broadband -$ -$
Business District Development -$ -$
Community Development -$ -$
Fire Protection -$ -$
Housing -$ -$
Industrial Sites and Parks -$ -$
Law Enforcement -$ -$
Libraries, Museums, & Historic Sites -$ -$
Other Education -$ -$
Other Facilities -$ -$
Other Utilities -$ -$
Public Health Facilities -$ -$
Recreation -$ -$
School-System-wide -$ -$
Solid Waste -$ -$
Storm Water -$ -$Total 9,247,000$ 75,681,095$
*Total Estimated Cost = Conceptual + Planning & Design + Construction
Estimated Cost of Needed Infrastructurefor Moore County
Five-year period July 2018 through June 2023
Moore CountyTotal Estimated Cost* for
Infrastructure Improvements
$84,928,095
$0$2$4$6$8$10$12$14$16
$0
$10
$20
$30
$40
$50
09 10 11 12 13 14 15 16 17 18 Est.
Cos
t of
Com
plet
ions
Est.
Cos
t of
Nee
ds
Inventory Year
Post-secondary Education(in millions)
Completed
$0.0$0.1$0.2$0.3$0.4$0.5$0.6$0.7
$0
$5
$10
$15
$20
09 10 11 12 13 14 15 16 17 18 Est.
Cos
t of
Com
plet
ions
Est.
Cos
t of
Nee
ds
Inventory Year
School Renovations(in millions)
Completed
$0.0$0.2$0.4$0.6$0.8$1.0$1.2$1.4$1.6
$0$2$4$6$8
$10$12$14$16
09 10 11 12 13 14 15 16 17 18 Est.
Cos
t of
Com
plet
ions
Est.
Cos
t of
Nee
ds
Inventory Year
Transportation(in millions)
Completed
TOP 3
0
200
400
600
800
1,000
1,200
$0$2$4$6$8
$10$12$14$16$18
09 10 11 12 13 14 15 16 17 18
Stud
ents
Cost
in M
illio
ns
Inventory Year
Cost of Needed New School Space vs Improvements to Existing Schools and Student Enrollment Growth
New Space Existing Space Students
= Local= Regional (Serves Multiple Counties)
DRAFT

87WWW.TN.GOV/TACIR
County Summaries
Project Type Conceptual
Planning & Design + Construction
Transportation 19,046,950$ 263,868,096$
Recreation 3,144,000$ 1,450,000$
Law Enforcement -$ 3,700,000$
Water and Wastewater 730,880$ 1,976,923$
School Renovations -$ 1,543,000$
Broadband -$ -$
Business District Development -$ -$
Community Development -$ -$
Fire Protection -$ -$
Housing -$ -$
Industrial Sites and Parks -$ -$
Libraries, Museums, & Historic Sites -$ -$
New Public Schools & Additions -$ -$
Other Education -$ -$
Other Facilities -$ -$
Other Utilities -$ -$
Post-secondary Education -$ -$
Public Buildings -$ -$
Public Health Facilities -$ -$
School-System-wide -$ -$
Solid Waste -$ -$
Storm Water -$ -$Total 22,921,830$ 272,538,019$
*Total Estimated Cost = Conceptual + Planning & Design + Construction
Estimated Cost of Needed Infrastructurefor Morgan County
Five-year period July 2018 through June 2023
Morgan CountyTotal Estimated Cost* for
Infrastructure Improvements
$295,459,849
$0$10$20$30$40$50$60
$0$50
$100$150$200$250$300
09 10 11 12 13 14 15 16 17 18 Est.
Cos
t of
Com
plet
ions
Est.
Cos
t of
Nee
ds
Inventory Year
Transportation(in millions)
Completed
$0.00
$0.02
$0.04
$0.06
$0.08
$0.10
$0
$1
$2
$3
$4
$5
09 10 11 12 13 14 15 16 17 18 Est.
Cos
t of
Com
plet
ions
Est.
Cos
t of
Nee
ds
Inventory Year
Recreation(in millions)
Completed
$0.0$0.5$1.0$1.5$2.0$2.5$3.0
$0$1$2$3$4$5$6$7$8
09 10 11 12 13 14 15 16 17 18 Est.
Cos
t of
Com
plet
ions
Est.
Cos
t of
Nee
ds
Inventory Year
Law Enforcement(in millions)
Completed
TOP 3
0
500
1,000
1,500
2,000
2,500
3,000
3,500
$0
$1
$2
$3
$4
$5
$6
$7
09 10 11 12 13 14 15 16 17 18
Stud
ents
Cost
in M
illio
ns
Inventory Year
Cost of Needed New School Space vs Improvements to Existing Schools and Student Enrollment Growth
New Space Existing Space Students
= Local= Regional (Serves Multiple Counties)
DRAFT

WWW.TN.GOV/TACIR88
Building Tennessee’s Tomorrow: Anticipating the State’s Infrastructure Needs
Project Type Conceptual
Planning & Design + Construction
Transportation 67,995,219$ 365,579,020$
New Public Schools & Additions 4,999,000$ 100,000$
School Renovations 2,461,208$ 250,000$
Water and Wastewater 700,000$ 2,004,000$
Recreation 50,000$ 2,000,000$
Law Enforcement -$ 1,200,000$
Industrial Sites and Parks 500,000$ 500,000$
Public Buildings 200,000$ -$
Storm Water 200,000$ -$
School-System-wide 192,000$ -$
Fire Protection 60,000$ -$
Broadband -$ -$
Business District Development -$ -$
Community Development -$ -$
Housing -$ -$
Libraries, Museums, & Historic Sites -$ -$
Other Education -$ -$
Other Facilities -$ -$
Other Utilities -$ -$
Post-secondary Education -$ -$
Public Health Facilities -$ -$
Solid Waste -$ -$Total 77,357,427$ 371,633,020$
*Total Estimated Cost = Conceptual + Planning & Design + Construction
Estimated Cost of Needed Infrastructurefor Obion County
Five-year period July 2018 through June 2023
Obion CountyTotal Estimated Cost* for
Infrastructure Improvements
$448,990,447
$0
$10
$20
$30
$40
$50
$0
$100
$200
$300
$400
$500
09 10 11 12 13 14 15 16 17 18 Est.
Cos
t of
Com
plet
ions
Est.
Cos
t of
Nee
ds
Inventory Year
Transportation(in millions)
Completed
$0.0$0.2$0.4$0.6$0.8$1.0$1.2$1.4
$0$1$2$3$4$5$6$7$8
09 10 11 12 13 14 15 16 17 18 Est.
Cos
t of
Com
plet
ions
Est.
Cos
t of
Nee
ds
Inventory Year
New Public Schools & Additions (in millions)
Completed
$0.0$0.5$1.0$1.5$2.0$2.5$3.0$3.5$4.0$4.5$5.0
$0$1$2$3$4$5$6$7
09 10 11 12 13 14 15 16 17 18 Est.
Cos
t of
Com
plet
ions
Est.
Cos
t of
Nee
ds
Inventory Year
School Renovations(in millions)
Completed
TOP 3
0
1,000
2,000
3,000
4,000
5,000
6,000
$0$1$2$3$4$5$6$7$8
09 10 11 12 13 14 15 16 17 18
Stud
ents
Cost
in M
illio
ns
Inventory Year
Cost of Needed New School Space vs Improvements to Existing Schools and Student Enrollment Growth
New Space Existing Space Students
= Local= Regional (Serves Multiple Counties)
DRAFT

89WWW.TN.GOV/TACIR
County Summaries
Project Type Conceptual
Planning & Design + Construction
Transportation 9,325,000$ 41,006,715$
Public Health Facilities -$ 6,900,000$
Recreation 4,000,000$ 2,630,000$
School Renovations 4,538,000$ 1,930,000$
Water and Wastewater 1,800,000$ 4,200,000$
Public Buildings 1,840,000$ 320,000$
Law Enforcement -$ 200,000$
School-System-wide 110,000$ -$
Broadband -$ -$
Business District Development -$ -$
Community Development -$ -$
Fire Protection -$ -$
Housing -$ -$
Industrial Sites and Parks -$ -$
Libraries, Museums, & Historic Sites -$ -$
New Public Schools & Additions -$ -$
Other Education -$ -$
Other Facilities -$ -$
Other Utilities -$ -$
Post-secondary Education -$ -$
Solid Waste -$ -$
Storm Water -$ -$Total 21,613,000$ 57,186,715$
*Total Estimated Cost = Conceptual + Planning & Design + Construction
Estimated Cost of Needed Infrastructurefor Overton County
Five-year period July 2018 through June 2023
Overton CountyTotal Estimated Cost* for
Infrastructure Improvements
$78,799,715
$0$5$10$15$20$25$30
$0$20$40$60$80
$100$120
09 10 11 12 13 14 15 16 17 18 Est.
Cos
t of
Com
plet
ions
Est.
Cos
t of
Nee
ds
Inventory Year
Transportation(in millions)
Completed
$0.0
$0.2
$0.4
$0.6
$0.8
$1.0
$0$1$2$3$4$5$6$7$8
09 10 11 12 13 14 15 16 17 18 Est.
Cos
t of
Com
plet
ions
Est.
Cos
t of
Nee
ds
Inventory Year
Public Health Facilities(in millions)
Completed
$0.0$0.1$0.2$0.3$0.4$0.5$0.6$0.7$0.8$0.9$1.0
$0$1$2$3$4$5$6$7
09 10 11 12 13 14 15 16 17 18 Est.
Cos
t of
Com
plet
ions
Est.
Cos
t of
Nee
ds
Inventory Year
Recreation(in millions)
Completed
TOP 3
05001,0001,5002,0002,5003,0003,5004,000
$0$5
$10$15$20$25$30$35$40$45$50
09 10 11 12 13 14 15 16 17 18
Stud
ents
Cost
in M
illio
ns
Inventory Year
Cost of Needed New School Space vs Improvements to Existing Schools and Student Enrollment Growth
New Space Existing Space Students
= Local= Regional (Serves Multiple Counties)
DRAFT

WWW.TN.GOV/TACIR90
Building Tennessee’s Tomorrow: Anticipating the State’s Infrastructure Needs
Project Type Conceptual
Planning & Design + Construction
Transportation 30,594,000$ 46,962,015$
School Renovations -$ 235,000$
Broadband -$ -$
Business District Development -$ -$
Community Development -$ -$
Fire Protection -$ -$
Housing -$ -$
Industrial Sites and Parks -$ -$
Law Enforcement -$ -$
Libraries, Museums, & Historic Sites -$ -$
New Public Schools & Additions -$ -$
Other Education -$ -$
Other Facilities -$ -$
Other Utilities -$ -$
Post-secondary Education -$ -$
Public Buildings -$ -$
Public Health Facilities -$ -$
Recreation -$ -$
School-System-wide -$ -$
Solid Waste -$ -$
Storm Water -$ -$
Water and Wastewater -$ -$Total 30,594,000$ 47,197,015$
*Total Estimated Cost = Conceptual + Planning & Design + Construction
Estimated Cost of Needed Infrastructurefor Perry County
Five-year period July 2018 through June 2023
Perry CountyTotal Estimated Cost* for
Infrastructure Improvements
$77,791,015
$0
$5
$10
$15
$20
$0
$20
$40
$60
$80
$100
09 10 11 12 13 14 15 16 17 18 Est.
Cos
t of
Com
plet
ions
Est.
Cos
t of
Nee
ds
Inventory Year
Transportation(in millions)
Completed
$0.00
$0.05
$0.10
$0.15
$0.20
$0.00$0.05$0.10$0.15$0.20$0.25$0.30
09 10 11 12 13 14 15 16 17 18 Est.
Cos
t of
Com
plet
ions
Est.
Cos
t of
Nee
ds
Inventory Year
School Renovations(in millions)
Completed
TOP 3
0
200
400
600
800
1,000
1,200
$0
$0
$0
$0
$0
$0
$0
09 10 11 12 13 14 15 16 17 18
Stud
ents
Cost
in M
illio
ns
Inventory Year
Cost of Needed New School Space vs Improvements to Existing Schools and Student Enrollment Growth
New Space Existing Space Students
= Local= Regional (Serves Multiple Counties)
DRAFT

91WWW.TN.GOV/TACIR
County Summaries
Project Type Conceptual
Planning & Design + Construction
Recreation 6,140,000$ -$
Housing 5,000,000$ -$
Law Enforcement -$ 5,000,000$
Libraries, Museums, & Historic Sites 3,150,000$ -$
Transportation 1,789,000$ 952,880$
Industrial Sites and Parks 350,000$ 1,500,000$
Solid Waste -$ 1,345,687$
New Public Schools & Additions 600,000$ -$
School Renovations 285,000$ 200,000$
School-System-wide 100,000$ -$
Fire Protection -$ 95,000$
Broadband -$ -$
Business District Development -$ -$
Community Development -$ -$
Other Education -$ -$
Other Facilities -$ -$
Other Utilities -$ -$
Post-secondary Education -$ -$
Public Buildings -$ -$
Public Health Facilities -$ -$
Storm Water -$ -$
Water and Wastewater -$ -$Total 17,414,000$ 9,093,567$
*Total Estimated Cost = Conceptual + Planning & Design + Construction
Estimated Cost of Needed Infrastructurefor Pickett County
Five-year period July 2018 through June 2023
Pickett CountyTotal Estimated Cost* for
Infrastructure Improvements
$26,507,567
$0.0
$0.2
$0.4
$0.6
$0.8
$1.0
$0$1$2$3$4$5$6$7
09 10 11 12 13 14 15 16 17 18 Est.
Cos
t of
Com
plet
ions
Est.
Cos
t of
Nee
ds
Inventory Year
Recreation(in millions)
Completed
$0.0
$0.2
$0.4
$0.6
$0.8
$1.0
$0$1$2$3$4$5$6
09 10 11 12 13 14 15 16 17 18 Est.
Cos
t of
Com
plet
ions
Est.
Cos
t of
Nee
ds
Inventory Year
Housing(in millions)
Completed
$0.0$0.1$0.2$0.3$0.4$0.5$0.6$0.7$0.8$0.9$1.0
$0$1$2$3$4$5$6
09 10 11 12 13 14 15 16 17 18 Est.
Cos
t of
Com
plet
ions
Est.
Cos
t of
Nee
ds
Inventory Year
Law Enforcement(in millions)
Completed
TOP 3
0100200300400500600700800
$0$2$4$6$8
$10$12$14$16
09 10 11 12 13 14 15 16 17 18
Stud
ents
Cost
in M
illio
ns
Inventory Year
Cost of Needed New School Space vs Improvements to Existing Schools and Student Enrollment Growth
New Space Existing Space Students
= Local= Regional (Serves Multiple Counties)
DRAFT

WWW.TN.GOV/TACIR92
Building Tennessee’s Tomorrow: Anticipating the State’s Infrastructure Needs
Project Type Conceptual
Planning & Design + Construction
Transportation 25,092,629$ 247,879,023$
Water and Wastewater 8,950,000$ 3,890,508$
Recreation 4,420,000$ -$
Community Development -$ 801,715$
Public Health Facilities -$ 403,846$
Public Buildings 300,000$ -$
Industrial Sites and Parks 256,000$ -$
School Renovations 110,000$ -$
Broadband -$ -$
Business District Development -$ -$
Fire Protection -$ -$
Housing -$ -$
Law Enforcement -$ -$
Libraries, Museums, & Historic Sites -$ -$
New Public Schools & Additions -$ -$
Other Education -$ -$
Other Facilities -$ -$
Other Utilities -$ -$
Post-secondary Education -$ -$
School-System-wide -$ -$
Solid Waste -$ -$
Storm Water -$ -$Total 39,128,629$ 252,975,092$
*Total Estimated Cost = Conceptual + Planning & Design + Construction
Estimated Cost of Needed Infrastructurefor Polk County
Five-year period July 2018 through June 2023
Polk CountyTotal Estimated Cost* for
Infrastructure Improvements
$292,103,721
$0$10$20$30$40$50$60
$0$50
$100$150$200$250$300
09 10 11 12 13 14 15 16 17 18 Est.
Cos
t of
Com
plet
ions
Est.
Cos
t of
Nee
ds
Inventory Year
Transportation(in millions)
Completed
$0.0
$0.5
$1.0
$1.5
$2.0
$2.5
$0$2$4$6$8
$10$12$14
09 10 11 12 13 14 15 16 17 18 Est.
Cos
t of
Com
plet
ions
Est.
Cos
t of
Nee
ds
Inventory Year
Water and Wastewater(in millions)
Completed
$0.0$0.1$0.2$0.3$0.4$0.5$0.6$0.7$0.8$0.9$1.0
$0$5
$10$15$20$25$30
09 10 11 12 13 14 15 16 17 18 Est.
Cos
t of
Com
plet
ions
Est.
Cos
t of
Nee
ds
Inventory Year
Recreation(in millions)
Completed
TOP 3
0
500
1,000
1,500
2,000
2,500
3,000
$0.0
$0.5
$1.0
$1.5
$2.0
$2.5
09 10 11 12 13 14 15 16 17 18
Stud
ents
Cost
in M
illio
ns
Inventory Year
Cost of Needed New School Space vs Improvements to Existing Schools and Student Enrollment Growth
New Space Existing Space Students
= Local= Regional (Serves Multiple Counties)
DRAFT

93WWW.TN.GOV/TACIR
County Summaries
Project Type Conceptual
Planning & Design + Construction
Post-secondary Education 194,500,000$ 264,700,392$
Transportation 59,149,000$ 61,610,621$
New Public Schools & Additions 25,230,000$ 5,000,000$
Law Enforcement 8,960,000$ 20,000,000$
School Renovations 9,800,000$ 2,077,000$
Water and Wastewater 1,529,000$ 9,949,313$
Other Facilities 6,220,000$ -$
Recreation 5,780,000$ -$
Public Buildings 2,000,000$ -$
Fire Protection -$ 475,000$
School-System-wide 250,000$ -$
Broadband -$ -$
Business District Development -$ -$
Community Development -$ -$
Housing -$ -$
Industrial Sites and Parks -$ -$
Libraries, Museums, & Historic Sites -$ -$
Other Education -$ -$
Other Utilities -$ -$
Public Health Facilities -$ -$
Solid Waste -$ -$
Storm Water -$ -$Total 313,418,000$ 363,812,326$
*Total Estimated Cost = Conceptual + Planning & Design + Construction
Estimated Cost of Needed Infrastructurefor Putnam County
Five-year period July 2018 through June 2023
Putnam CountyTotal Estimated Cost* for
Infrastructure Improvements
$677,230,326
$0
$10
$20
$30
$40
$50
$0
$100
$200
$300
$400
$500
09 10 11 12 13 14 15 16 17 18 Est.
Cos
t of
Com
plet
ions
Est.
Cos
t of
Nee
ds
Inventory Year
Post-secondary Education(in millions)
Completed
$0$5$10$15$20$25$30$35
$0
$50
$100
$150
$200
09 10 11 12 13 14 15 16 17 18 Est.
Cos
t of
Com
plet
ions
Est.
Cos
t of
Nee
ds
Inventory Year
Transportation(in millions)
Completed
$0$5$10$15$20$25$30$35
$0$10$20$30$40$50$60$70$80
09 10 11 12 13 14 15 16 17 18 Est.
Cos
t of
Com
plet
ions
Est.
Cos
t of
Nee
ds
Inventory Year
New Public Schools & Additions (in millions)
Completed
TOP 3
0
2,000
4,000
6,000
8,000
10,000
12,000
$0$10$20$30$40$50$60$70$80
09 10 11 12 13 14 15 16 17 18
Stud
ents
Cost
in M
illio
ns
Inventory Year
Cost of Needed New School Space vs Improvements to Existing Schools and Student Enrollment Growth
New Space Existing Space Students
= Local= Regional (Serves Multiple Counties)
DRAFT

WWW.TN.GOV/TACIR94
Building Tennessee’s Tomorrow: Anticipating the State’s Infrastructure Needs
Project Type Conceptual
Planning & Design + Construction
Transportation 47,017,105$ 58,809,563$
Law Enforcement 28,000,000$ -$
Water and Wastewater 278,571$ 16,842,000$
Industrial Sites and Parks 1,500,000$ 6,000,000$
Public Buildings 3,490,000$ 250,000$
Recreation 1,250,000$ 1,163,786$
Storm Water 1,100,000$ -$
School Renovations 810,000$ -$
Broadband -$ -$
Business District Development -$ -$
Community Development -$ -$
Fire Protection -$ -$
Housing -$ -$
Libraries, Museums, & Historic Sites -$ -$
New Public Schools & Additions -$ -$
Other Education -$ -$
Other Facilities -$ -$
Other Utilities -$ -$
Post-secondary Education -$ -$
Public Health Facilities -$ -$
School-System-wide -$ -$
Solid Waste -$ -$Total 83,445,676$ 83,065,349$
*Total Estimated Cost = Conceptual + Planning & Design + Construction
Estimated Cost of Needed Infrastructurefor Rhea County
Five-year period July 2018 through June 2023
Rhea CountyTotal Estimated Cost* for
Infrastructure Improvements
$166,511,025
$0
$10
$20
$30
$40
$50
$0$20$40$60$80
$100$120
09 10 11 12 13 14 15 16 17 18 Est.
Cos
t of
Com
plet
ions
Est.
Cos
t of
Nee
ds
Inventory Year
Transportation(in millions)
Completed
$0.0
$0.1
$0.2
$0.3
$0.4
$0.5
$0$5
$10$15$20$25$30
09 10 11 12 13 14 15 16 17 18 Est.
Cos
t of
Com
plet
ions
Est.
Cos
t of
Nee
ds
Inventory Year
Law Enforcement(in millions)
Completed
$0$2$4$6$8$10$12$14$16
$0
$5
$10
$15
$20
$25
09 10 11 12 13 14 15 16 17 18 Est.
Cos
t of
Com
plet
ions
Est.
Cos
t of
Nee
ds
Inventory Year
Water and Wastewater(in millions)
Completed
TOP 3
0
1,000
2,000
3,000
4,000
5,000
6,000
$0
$5
$10
$15
$20
$25
$30
$35
09 10 11 12 13 14 15 16 17 18
Stud
ents
Cost
in M
illio
ns
Inventory Year
Cost of Needed New School Space vs Improvements to Existing Schools and Student Enrollment Growth
New Space Existing Space Students
= Local= Regional (Serves Multiple Counties)
DRAFT

95WWW.TN.GOV/TACIR
County Summaries
Project Type Conceptual
Planning & Design + Construction
Transportation 40,345,000$ 148,349,278$
New Public Schools & Additions 78,000,000$ -$
Law Enforcement 30,000,000$ -$
Recreation 13,480,000$ 9,454,097$
Water and Wastewater 5,000,000$ 7,519,000$
School Renovations 8,700,000$ 3,507,728$
Other Facilities -$ 11,400,000$
Other Utilities -$ 10,200,000$
Community Development 10,000,000$ -$
Industrial Sites and Parks 6,100,000$ -$
Post-secondary Education 320,000$ 4,915,385$
Storm Water 5,000,000$ -$
Public Buildings 3,300,000$ 1,000,000$
Fire Protection 1,600,000$ -$
Solid Waste -$ 300,000$
Business District Development -$ 200,000$
Broadband -$ -$
Housing -$ -$
Libraries, Museums, & Historic Sites -$ -$
Other Education -$ -$
Public Health Facilities -$ -$
School-System-wide -$ -$Total 201,845,000$ 196,845,488$
*Total Estimated Cost = Conceptual + Planning & Design + Construction
Estimated Cost of Needed Infrastructurefor Roane County
Five-year period July 2018 through June 2023
Roane CountyTotal Estimated Cost* for
Infrastructure Improvements
$398,690,488
$0$5$10$15$20$25$30$35$40
$0
$50
$100
$150
$200
09 10 11 12 13 14 15 16 17 18 Est.
Cos
t of
Com
plet
ions
Est.
Cos
t of
Nee
ds
Inventory Year
Transportation(in millions)
Completed
$0
$5
$10
$15
$20
$0
$20
$40
$60
$80
$100
09 10 11 12 13 14 15 16 17 18 Est.
Cos
t of
Com
plet
ions
Est.
Cos
t of
Nee
ds
Inventory Year
New Public Schools & Additions (in millions)
Completed
$0$2$4$6$8$10$12$14
$0$5
$10$15$20$25$30$35
09 10 11 12 13 14 15 16 17 18 Est.
Cos
t of
Com
plet
ions
Est.
Cos
t of
Nee
ds
Inventory Year
Law Enforcement(in millions)
Completed
TOP 3
01,0002,0003,0004,0005,0006,0007,0008,000
$0$10$20$30$40$50$60$70$80$90
09 10 11 12 13 14 15 16 17 18
Stud
ents
Cost
in M
illio
ns
Inventory Year
Cost of Needed New School Space vs Improvements to Existing Schools and Student Enrollment Growth
New Space Existing Space Students
= Local= Regional (Serves Multiple Counties)
DRAFT

WWW.TN.GOV/TACIR96
Building Tennessee’s Tomorrow: Anticipating the State’s Infrastructure Needs
Project Type Conceptual
Planning & Design + Construction
Transportation 42,475,000$ 341,922,499$
Water and Wastewater 29,800,000$ 79,601,000$
School Renovations 31,839,000$ 47,905,200$
New Public Schools & Additions 13,000,000$ 35,000,000$
Recreation 1,677,600$ 4,053,731$
Community Development 300,000$ 5,000,000$
Fire Protection 3,050,000$ -$
Other Utilities 400,000$ 1,340,000$
Storm Water -$ 1,225,000$
Law Enforcement -$ 900,000$
Broadband -$ -$
Business District Development -$ -$
Housing -$ -$
Industrial Sites and Parks -$ -$
Libraries, Museums, & Historic Sites -$ -$
Other Education -$ -$
Other Facilities -$ -$
Post-secondary Education -$ -$
Public Buildings -$ -$
Public Health Facilities -$ -$
School-System-wide -$ -$
Solid Waste -$ -$Total 122,541,600$ 516,947,430$
*Total Estimated Cost = Conceptual + Planning & Design + Construction
Estimated Cost of Needed Infrastructurefor Robertson County
Five-year period July 2018 through June 2023
Robertson CountyTotal Estimated Cost* for
Infrastructure Improvements
$639,489,030
$0$1$2$3$4$5$6$7
$0
$100
$200
$300
$400
$500
09 10 11 12 13 14 15 16 17 18 Est.
Cos
t of
Com
plet
ions
Est.
Cos
t of
Nee
ds
Inventory Year
Transportation(in millions)
Completed
$0$1$2$3$4$5$6$7$8
$0$20$40$60$80
$100$120
09 10 11 12 13 14 15 16 17 18 Est.
Cos
t of
Com
plet
ions
Est.
Cos
t of
Nee
ds
Inventory Year
Water and Wastewater(in millions)
Completed
$0$5$10$15$20$25$30$35$40$45$50
$0$10$20$30$40$50$60$70$80$90
$100
09 10 11 12 13 14 15 16 17 18 Est.
Cos
t of
Com
plet
ions
Est.
Cos
t of
Nee
ds
Inventory Year
School Renovations(in millions)
Completed
TOP 3
0
2,000
4,000
6,000
8,000
10,000
12,000
$0$10$20$30$40$50$60$70$80$90
$100
09 10 11 12 13 14 15 16 17 18
Stud
ents
Cost
in M
illio
ns
Inventory Year
Cost of Needed New School Space vs Improvements to Existing Schools and Student Enrollment Growth
New Space Existing Space Students
= Local= Regional (Serves Multiple Counties)
DRAFT

97WWW.TN.GOV/TACIR
County Summaries
Project Type Conceptual
Planning & Design + Construction
Transportation 139,046,000$ 516,060,067$
New Public Schools & Additions 319,435,750$ 232,447,676$
Post-secondary Education 261,685,000$ 189,559,362$
Water and Wastewater 42,250,000$ 121,166,000$
Recreation 3,820,000$ 65,648,566$
School Renovations 2,375,000$ 32,514,186$
Public Health Facilities 25,628,000$ 1,210,000$
Fire Protection 8,200,000$ 12,900,000$
Law Enforcement -$ 11,650,000$
School-System-wide -$ 2,500,000$
Other Facilities -$ 1,400,000$
Other Utilities -$ 1,225,000$
Public Buildings -$ 1,200,000$
Solid Waste -$ 400,000$
Broadband -$ -$
Business District Development -$ -$
Community Development -$ -$
Housing -$ -$
Industrial Sites and Parks -$ -$
Libraries, Museums, & Historic Sites -$ -$
Other Education -$ -$
Storm Water -$ -$Total 802,439,750$ 1,189,880,857$
*Total Estimated Cost = Conceptual + Planning & Design + Construction
Estimated Cost of Needed Infrastructurefor Rutherford County
Five-year period July 2018 through June 2023
Rutherford CountyTotal Estimated Cost* for
Infrastructure Improvements
$1,992,320,607
$0
$20
$40
$60
$80
$100
$0$100$200$300$400$500$600$700
09 10 11 12 13 14 15 16 17 18 Est.
Cos
t of
Com
plet
ions
Est.
Cos
t of
Nee
ds
Inventory Year
Transportation(in millions)
Completed
$0
$10
$20
$30
$40
$50
$0$100$200$300$400$500$600
09 10 11 12 13 14 15 16 17 18 Est.
Cos
t of
Com
plet
ions
Est.
Cos
t of
Nee
ds
Inventory Year
New Public Schools & Additions (in millions)
Completed
$0$20$40$60$80$100$120$140$160$180$200
$0$100$200$300$400$500$600
09 10 11 12 13 14 15 16 17 18 Est.
Cos
t of
Com
plet
ions
Est.
Cos
t of
Nee
ds
Inventory Year
Post-secondary Education(in millions)
Completed
TOP 3
0
10,000
20,000
30,000
40,000
50,000
60,000
$0
$100
$200
$300
$400
$500
$600
09 10 11 12 13 14 15 16 17 18
Stud
ents
Cost
in M
illio
ns
Inventory Year
Cost of Needed New School Space vs Improvements to Existing Schools and Student Enrollment Growth
New Space Existing Space Students
= Local= Regional (Serves Multiple Counties)
DRAFT

WWW.TN.GOV/TACIR98
Building Tennessee’s Tomorrow: Anticipating the State’s Infrastructure Needs
Project Type Conceptual
Planning & Design + Construction
Transportation 34,098,000$ 68,460,830$
New Public Schools & Additions 5,800,000$ 100,000$
Water and Wastewater -$ 4,075,000$
School Renovations 1,137,000$ 60,000$
Recreation -$ 500,000$
Solid Waste 500,000$ -$
Post-secondary Education 200,000$ 222,000$
Broadband -$ -$
Business District Development -$ -$
Community Development -$ -$
Fire Protection -$ -$
Housing -$ -$
Industrial Sites and Parks -$ -$
Law Enforcement -$ -$
Libraries, Museums, & Historic Sites -$ -$
Other Education -$ -$
Other Facilities -$ -$
Other Utilities -$ -$
Public Buildings -$ -$
Public Health Facilities -$ -$
School-System-wide -$ -$
Storm Water -$ -$Total 41,735,000$ 73,417,830$
*Total Estimated Cost = Conceptual + Planning & Design + Construction
Estimated Cost of Needed Infrastructurefor Scott County
Five-year period July 2018 through June 2023
Scott CountyTotal Estimated Cost* for
Infrastructure Improvements
$115,152,830
$0
$1
$2
$3
$4
$5
$0$20$40$60$80
$100$120$140$160
09 10 11 12 13 14 15 16 17 18 Est.
Cos
t of
Com
plet
ions
Est.
Cos
t of
Nee
ds
Inventory Year
Transportation(in millions)
Completed
$0$1$2$3$4$5$6
$0$1$2$3$4$5$6$7
09 10 11 12 13 14 15 16 17 18 Est.
Cos
t of
Com
plet
ions
Est.
Cos
t of
Nee
ds
Inventory Year
New Public Schools & Additions (in millions)
Completed
$0.0$0.2$0.4$0.6$0.8$1.0$1.2$1.4$1.6$1.8
$0.0$0.5$1.0$1.5$2.0$2.5$3.0$3.5$4.0$4.5$5.0
09 10 11 12 13 14 15 16 17 18 Est.
Cos
t of
Com
plet
ions
Est.
Cos
t of
Nee
ds
Inventory Year
Water and Wastewater(in millions)
Completed
TOP 3
05001,0001,5002,0002,5003,0003,5004,0004,500
$0$2$4$6$8
$10$12$14$16$18$20
09 10 11 12 13 14 15 16 17 18
Stud
ents
Cost
in M
illio
ns
Inventory Year
Cost of Needed New School Space vs Improvements to Existing Schools and Student Enrollment Growth
New Space Existing Space Students
= Local= Regional (Serves Multiple Counties)
DRAFT

99WWW.TN.GOV/TACIR
County Summaries
Project Type Conceptual
Planning & Design + Construction
Public Health Facilities 32,600,000$ -$
Transportation 11,542,000$ 1,366,366$
Recreation -$ 1,738,926$
Water and Wastewater 1,500,000$ -$
School Renovations 400,000$ 380,000$
School-System-wide 600,000$ -$
Industrial Sites and Parks -$ 482,836$
Broadband -$ -$
Business District Development -$ -$
Community Development -$ -$
Fire Protection -$ -$
Housing -$ -$
Law Enforcement -$ -$
Libraries, Museums, & Historic Sites -$ -$
New Public Schools & Additions -$ -$
Other Education -$ -$
Other Facilities -$ -$
Other Utilities -$ -$
Post-secondary Education -$ -$
Public Buildings -$ -$
Solid Waste -$ -$
Storm Water -$ -$Total 46,642,000$ 3,968,128$
*Total Estimated Cost = Conceptual + Planning & Design + Construction
Estimated Cost of Needed Infrastructurefor Sequatchie County
Five-year period July 2018 through June 2023
Sequatchie CountyTotal Estimated Cost* for
Infrastructure Improvements
$50,610,128
$0.0
$0.2
$0.4
$0.6
$0.8
$1.0
$0$5
$10$15$20$25$30$35$40
09 10 11 12 13 14 15 16 17 18 Est.
Cos
t of
Com
plet
ions
Est.
Cos
t of
Nee
ds
Inventory Year
Public Health Facilities(in millions)
Completed
$0.0$0.2$0.4$0.6$0.8$1.0$1.2
$0
$5
$10
$15
$20
$25
09 10 11 12 13 14 15 16 17 18 Est.
Cos
t of
Com
plet
ions
Est.
Cos
t of
Nee
ds
Inventory Year
Transportation(in millions)
Completed
$0.0$0.1$0.2$0.3$0.4$0.5$0.6
$0.0
$0.5
$1.0
$1.5
$2.0
$2.5
09 10 11 12 13 14 15 16 17 18 Est.
Cos
t of
Com
plet
ions
Est.
Cos
t of
Nee
ds
Inventory Year
Recreation(in millions)
Completed
TOP 3
0
500
1,000
1,500
2,000
2,500
$0.0
$0.5
$1.0
$1.5
$2.0
$2.5
$3.0
09 10 11 12 13 14 15 16 17 18
Stud
ents
Cost
in M
illio
ns
Inventory Year
Cost of Needed New School Space vs Improvements to Existing Schools and Student Enrollment Growth
New Space Existing Space Students
= Local= Regional (Serves Multiple Counties)
DRAFT

WWW.TN.GOV/TACIR100
Building Tennessee’s Tomorrow: Anticipating the State’s Infrastructure Needs
Project Type Conceptual
Planning & Design + Construction
Transportation 54,565,000$ 229,956,900$
Water and Wastewater 16,192,504$ 61,905,000$
Other Utilities -$ 64,522,750$
New Public Schools & Additions 23,025,000$ 26,409,243$
Business District Development -$ 30,000,000$
Recreation 1,570,000$ 23,137,462$
School Renovations 11,250,529$ 10,682,944$
Public Buildings 16,000,000$ -$
Post-secondary Education -$ 12,500,000$
Fire Protection 4,870,000$ 6,000,000$
Industrial Sites and Parks -$ 10,000,000$
Community Development 445,000$ 4,000,000$
Other Facilities 584,000$ -$
Storm Water -$ 250,000$
Law Enforcement 55,000$ -$
Broadband -$ -$
Housing -$ -$
Libraries, Museums, & Historic Sites -$ -$
Other Education -$ -$
Public Health Facilities -$ -$
School-System-wide -$ -$
Solid Waste -$ -$Total 128,557,033$ 479,364,299$
*Total Estimated Cost = Conceptual + Planning & Design + Construction
Estimated Cost of Needed Infrastructurefor Sevier County
Five-year period July 2018 through June 2023
Sevier CountyTotal Estimated Cost* for
Infrastructure Improvements
$607,921,332
$0$10$20$30$40$50$60$70$80
$0$50
$100$150$200$250$300$350$400
09 10 11 12 13 14 15 16 17 18 Est.
Cos
t of
Com
plet
ions
Est.
Cos
t of
Nee
ds
Inventory Year
Transportation(in millions)
Completed
$0$5$10$15$20$25$30$35$40
$0$20$40$60$80
$100$120$140
09 10 11 12 13 14 15 16 17 18 Est.
Cos
t of
Com
plet
ions
Est.
Cos
t of
Nee
ds
Inventory Year
Water and Wastewater(in millions)
Completed
$0.0$0.1$0.2$0.3$0.4$0.5$0.6$0.7$0.8$0.9$1.0
$0$10$20$30$40$50$60$70
09 10 11 12 13 14 15 16 17 18 Est.
Cos
t of
Com
plet
ions
Est.
Cos
t of
Nee
ds
Inventory Year
Other Utilities(in millions)
Completed
TOP 3
02,0004,0006,0008,00010,00012,00014,00016,000
$0
$20
$40
$60
$80
$100
$120
09 10 11 12 13 14 15 16 17 18
Stud
ents
Cost
in M
illio
ns
Inventory Year
Cost of Needed New School Space vs Improvements to Existing Schools and Student Enrollment Growth
New Space Existing Space Students
= Local= Regional (Serves Multiple Counties)
DRAFT

101WWW.TN.GOV/TACIR
County Summaries
Project Type Conceptual
Planning & Design + Construction
Transportation 912,500,912$ 2,124,769,602$
Post-secondary Education 221,370,000$ 488,632,671$
School Renovations 415,377,066$ 204,477,295$
Water and Wastewater 50,425,000$ 380,849,962$
Housing 171,019,000$ -$
Recreation 13,055,000$ 154,414,332$
Law Enforcement 77,775,800$ 41,652,000$
Public Health Facilities 118,600,000$ -$
New Public Schools & Additions 38,829,000$ 68,698,884$
Fire Protection 25,093,189$ 18,134,038$
Libraries, Museums, & Historic Sites 11,868,000$ 26,667,019$
Public Buildings 10,580,000$ 10,500,000$
Other Facilities 9,630,000$ 5,243,834$
Solid Waste -$ 8,000,000$
Business District Development 250,000$ 6,865,536$
Community Development 3,158,500$ 2,550,000$
Storm Water 2,545,000$ 2,239,000$
Broadband -$ -$
Industrial Sites and Parks -$ -$
Other Education -$ -$
Other Utilities -$ -$
School-System-wide -$ -$Total 2,082,076,467$ 3,543,694,173$
*Total Estimated Cost = Conceptual + Planning & Design + Construction
Estimated Cost of Needed Infrastructurefor Shelby County
Five-year period July 2018 through June 2023
Shelby CountyTotal Estimated Cost* for
Infrastructure Improvements
$5,625,770,640
$0
$50
$100
$150
$200
$250
$0$500
$1,000$1,500$2,000$2,500$3,000$3,500$4,000
09 10 11 12 13 14 15 16 17 18 Est.
Cos
t of
Com
plet
ions
Est.
Cos
t of
Nee
ds
Inventory Year
Transportation(in millions)
Completed
$0
$50
$100
$150
$200
$0
$200
$400
$600
$800
$1,000
09 10 11 12 13 14 15 16 17 18 Est.
Cos
t of
Com
plet
ions
Est.
Cos
t of
Nee
ds
Inventory Year
Post-secondary Education(in millions)
Completed
$0$20$40$60$80$100$120$140
$0$100$200$300$400$500$600$700
09 10 11 12 13 14 15 16 17 18 Est.
Cos
t of
Com
plet
ions
Est.
Cos
t of
Nee
ds
Inventory Year
School Renovations(in millions)
Completed
TOP 3
020,00040,00060,00080,000100,000120,000140,000160,000180,000
$0
$100
$200
$300
$400
$500
$600
$700
09 10 11 12 13 14 15 16 17 18
Stud
ents
Cost
in M
illio
ns
Inventory Year
Cost of Needed New School Space vs Improvements to Existing Schools and Student Enrollment Growth
New Space Existing Space Students
= Local= Regional (Serves Multiple Counties)
DRAFT

WWW.TN.GOV/TACIR102
Building Tennessee’s Tomorrow: Anticipating the State’s Infrastructure Needs
Project Type Conceptual
Planning & Design + Construction
Transportation 62,753,000$ 47,849,300$
Water and Wastewater 7,500,000$ 4,457,500$
New Public Schools & Additions 4,869,000$ -$
School Renovations 1,038,200$ 825,000$
Solid Waste 1,000,000$ -$
Recreation 150,000$ 188,000$
Community Development 100,000$ -$
Law Enforcement 100,000$ -$
Broadband -$ -$
Business District Development -$ -$
Fire Protection -$ -$
Housing -$ -$
Industrial Sites and Parks -$ -$
Libraries, Museums, & Historic Sites -$ -$
Other Education -$ -$
Other Facilities -$ -$
Other Utilities -$ -$
Post-secondary Education -$ -$
Public Buildings -$ -$
Public Health Facilities -$ -$
School-System-wide -$ -$
Storm Water -$ -$Total 77,510,200$ 53,319,800$
*Total Estimated Cost = Conceptual + Planning & Design + Construction
Estimated Cost of Needed Infrastructurefor Smith County
Five-year period July 2018 through June 2023
Smith CountyTotal Estimated Cost* for
Infrastructure Improvements
$130,830,000
$0$2$4$6$8$10$12$14
$0$20$40$60$80
$100$120
09 10 11 12 13 14 15 16 17 18 Est.
Cos
t of
Com
plet
ions
Est.
Cos
t of
Nee
ds
Inventory Year
Transportation(in millions)
Completed
$0.0$0.5$1.0$1.5$2.0$2.5$3.0$3.5
$0$2$4$6$8
$10$12$14$16
09 10 11 12 13 14 15 16 17 18 Est.
Cos
t of
Com
plet
ions
Est.
Cos
t of
Nee
ds
Inventory Year
Water and Wastewater(in millions)
Completed
$0.0$0.1$0.2$0.3$0.4$0.5$0.6$0.7$0.8$0.9$1.0
$0$1$2$3$4$5$6
09 10 11 12 13 14 15 16 17 18 Est.
Cos
t of
Com
plet
ions
Est.
Cos
t of
Nee
ds
Inventory Year
New Public Schools & Additions (in millions)
Completed
TOP 3
0
500
1,000
1,500
2,000
2,500
3,000
3,500
$0
$1
$2
$3
$4
$5
$6
09 10 11 12 13 14 15 16 17 18
Stud
ents
Cost
in M
illio
ns
Inventory Year
Cost of Needed New School Space vs Improvements to Existing Schools and Student Enrollment Growth
New Space Existing Space Students
= Local= Regional (Serves Multiple Counties)
DRAFT

103WWW.TN.GOV/TACIR
County Summaries
Project Type Conceptual
Planning & Design + Construction
Transportation 18,383,000$ 2,006,000$
Other Utilities -$ 11,000,000$
School Renovations 1,400,000$ 550,000$
Water and Wastewater 500,000$ 840,000$
Recreation 725,000$ -$
Broadband -$ -$
Business District Development -$ -$
Community Development -$ -$
Fire Protection -$ -$
Housing -$ -$
Industrial Sites and Parks -$ -$
Law Enforcement -$ -$
Libraries, Museums, & Historic Sites -$ -$
New Public Schools & Additions -$ -$
Other Education -$ -$
Other Facilities -$ -$
Post-secondary Education -$ -$
Public Buildings -$ -$
Public Health Facilities -$ -$
School-System-wide -$ -$
Solid Waste -$ -$
Storm Water -$ -$Total 21,008,000$ 14,396,000$
*Total Estimated Cost = Conceptual + Planning & Design + Construction
Estimated Cost of Needed Infrastructurefor Stewart County
Five-year period July 2018 through June 2023
Stewart CountyTotal Estimated Cost* for
Infrastructure Improvements
$35,404,000
$0$5$10$15$20$25$30$35
$0$10$20$30$40$50$60$70
09 10 11 12 13 14 15 16 17 18 Est.
Cos
t of
Com
plet
ions
Est.
Cos
t of
Nee
ds
Inventory Year
Transportation(in millions)
Completed
$0.0
$0.2
$0.4
$0.6
$0.8
$1.0
$0$2$4$6$8
$10$12
09 10 11 12 13 14 15 16 17 18 Est.
Cos
t of
Com
plet
ions
Est.
Cos
t of
Nee
ds
Inventory Year
Other Utilities(in millions)
Completed
$0.0$0.1$0.2$0.3$0.4$0.5$0.6$0.7
$0.0$0.5$1.0$1.5$2.0$2.5$3.0
09 10 11 12 13 14 15 16 17 18 Est.
Cos
t of
Com
plet
ions
Est.
Cos
t of
Nee
ds
Inventory Year
School Renovations(in millions)
Completed
TOP 3
0
500
1,000
1,500
2,000
2,500
$0.0
$0.5
$1.0
$1.5
$2.0
$2.5
$3.0
09 10 11 12 13 14 15 16 17 18
Stud
ents
Cost
in M
illio
ns
Inventory Year
Cost of Needed New School Space vs Improvements to Existing Schools and Student Enrollment Growth
New Space Existing Space Students
= Local= Regional (Serves Multiple Counties)
DRAFT

WWW.TN.GOV/TACIR104
Building Tennessee’s Tomorrow: Anticipating the State’s Infrastructure Needs
Project Type Conceptual
Planning & Design + Construction
Transportation 315,564,881$ 349,827,017$
School Renovations 110,239,000$ 48,288,809$
New Public Schools & Additions 3,180,000$ 134,000,000$
Water and Wastewater 18,149,000$ 46,470,142$
Housing 1,900,000$ 56,016,000$
Public Health Facilities 55,000,000$ -$
Post-secondary Education -$ 39,265,000$
Industrial Sites and Parks 1,998,900$ 20,117,000$
Recreation 7,735,000$ 9,714,000$
Fire Protection 200,000$ 4,568,000$
Other Facilities 2,000,000$ 1,330,000$
School-System-wide 1,000,000$ -$
Storm Water 500,000$ 400,000$
Libraries, Museums, & Historic Sites 500,000$ 205,513$
Public Buildings -$ 350,000$
Business District Development -$ 301,000$
Community Development 70,000$ -$
Broadband -$ -$
Law Enforcement -$ -$
Other Education -$ -$
Other Utilities -$ -$
Solid Waste -$ -$Total 518,036,781$ 710,852,481$
*Total Estimated Cost = Conceptual + Planning & Design + Construction
Estimated Cost of Needed Infrastructurefor Sullivan County
Five-year period July 2018 through June 2023
Sullivan CountyTotal Estimated Cost* for
Infrastructure Improvements
$1,228,889,262
$0$5$10$15$20$25$30$35$40
$0$100$200$300$400$500$600$700
09 10 11 12 13 14 15 16 17 18 Est.
Cos
t of
Com
plet
ions
Est.
Cos
t of
Nee
ds
Inventory Year
Transportation(in millions)
Completed
$0
$5
$10
$15
$20
$25
$0
$50
$100
$150
$200
09 10 11 12 13 14 15 16 17 18 Est.
Cos
t of
Com
plet
ions
Est.
Cos
t of
Nee
ds
Inventory Year
School Renovations(in millions)
Completed
$0$2$4$6$8$10$12$14$16$18$20
$0$20$40$60$80
$100$120$140$160$180
09 10 11 12 13 14 15 16 17 18 Est.
Cos
t of
Com
plet
ions
Est.
Cos
t of
Nee
ds
Inventory Year
New Public Schools & Additions (in millions)
Completed
TOP 3
0
5,000
10,000
15,000
20,000
25,000
$0$20$40$60$80
$100$120$140$160$180
09 10 11 12 13 14 15 16 17 18
Stud
ents
Cost
in M
illio
ns
Inventory Year
Cost of Needed New School Space vs Improvements to Existing Schools and Student Enrollment Growth
New Space Existing Space Students
= Local= Regional (Serves Multiple Counties)
DRAFT

105WWW.TN.GOV/TACIR
County Summaries
Project Type Conceptual
Planning & Design + Construction
Transportation 128,908,552$ 222,565,438$
Water and Wastewater 22,289,000$ 102,190,000$
Public Buildings 10,000,000$ 106,200,000$
Recreation 94,129,250$ 10,264,375$
New Public Schools & Additions 103,000,000$ -$
Libraries, Museums, & Historic Sites 16,450,000$ 688,000$
Post-secondary Education 3,060,000$ 10,172,220$
School Renovations 2,199,000$ 10,924,247$
Fire Protection 5,900,000$ 6,482,000$
Community Development 5,100,000$ 6,500,000$
Other Utilities 2,500,000$ 9,000,000$
Storm Water 1,410,000$ 3,975,000$
Other Facilities 2,600,000$ 1,000,000$
Law Enforcement 3,000,000$ -$
Business District Development 2,000,000$ -$
Broadband -$ -$
Housing -$ -$
Industrial Sites and Parks -$ -$
Other Education -$ -$
Public Health Facilities -$ -$
School-System-wide -$ -$
Solid Waste -$ -$Total 402,545,802$ 489,961,280$
*Total Estimated Cost = Conceptual + Planning & Design + Construction
Estimated Cost of Needed Infrastructurefor Sumner County
Five-year period July 2018 through June 2023
Sumner CountyTotal Estimated Cost* for
Infrastructure Improvements
$892,507,082
$0$20$40$60$80$100$120
$0$50
$100$150$200$250$300$350$400
09 10 11 12 13 14 15 16 17 18 Est.
Cos
t of
Com
plet
ions
Est.
Cos
t of
Nee
ds
Inventory Year
Transportation(in millions)
Completed
$0$10$20$30$40$50$60
$0
$50
$100
$150
$200
09 10 11 12 13 14 15 16 17 18 Est.
Cos
t of
Com
plet
ions
Est.
Cos
t of
Nee
ds
Inventory Year
Water and Wastewater(in millions)
Completed
$0.0$0.5$1.0$1.5$2.0$2.5$3.0$3.5$4.0$4.5$5.0
$0$20$40$60$80
$100$120$140
09 10 11 12 13 14 15 16 17 18 Est.
Cos
t of
Com
plet
ions
Est.
Cos
t of
Nee
ds
Inventory Year
Public Buildings(in millions)
Completed
TOP 3
0
5,000
10,000
15,000
20,000
25,000
30,000
35,000
$0
$20
$40
$60
$80
$100
$120
09 10 11 12 13 14 15 16 17 18
Stud
ents
Cost
in M
illio
ns
Inventory Year
Cost of Needed New School Space vs Improvements to Existing Schools and Student Enrollment Growth
New Space Existing Space Students
= Local= Regional (Serves Multiple Counties)
DRAFT
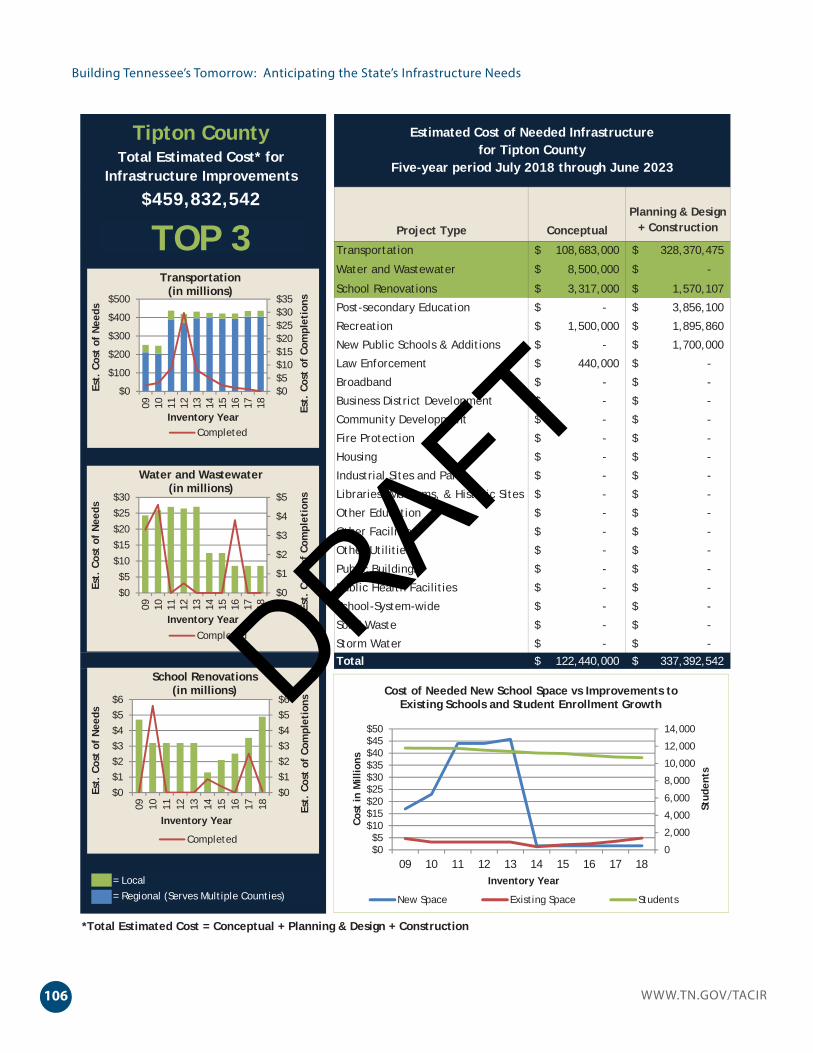
WWW.TN.GOV/TACIR106
Building Tennessee’s Tomorrow: Anticipating the State’s Infrastructure Needs
Project Type Conceptual
Planning & Design + Construction
Transportation 108,683,000$ 328,370,475$
Water and Wastewater 8,500,000$ -$
School Renovations 3,317,000$ 1,570,107$
Post-secondary Education -$ 3,856,100$
Recreation 1,500,000$ 1,895,860$
New Public Schools & Additions -$ 1,700,000$
Law Enforcement 440,000$ -$
Broadband -$ -$
Business District Development -$ -$
Community Development -$ -$
Fire Protection -$ -$
Housing -$ -$
Industrial Sites and Parks -$ -$
Libraries, Museums, & Historic Sites -$ -$
Other Education -$ -$
Other Facilities -$ -$
Other Utilities -$ -$
Public Buildings -$ -$
Public Health Facilities -$ -$
School-System-wide -$ -$
Solid Waste -$ -$
Storm Water -$ -$Total 122,440,000$ 337,392,542$
*Total Estimated Cost = Conceptual + Planning & Design + Construction
Estimated Cost of Needed Infrastructurefor Tipton County
Five-year period July 2018 through June 2023
Tipton CountyTotal Estimated Cost* for
Infrastructure Improvements
$459,832,542
$0$5$10$15$20$25$30$35
$0
$100
$200
$300
$400
$500
09 10 11 12 13 14 15 16 17 18 Est.
Cos
t of
Com
plet
ions
Est.
Cos
t of
Nee
ds
Inventory Year
Transportation(in millions)
Completed
$0
$1
$2
$3
$4
$5
$0$5
$10$15$20$25$30
09 10 11 12 13 14 15 16 17 18 Est.
Cos
t of
Com
plet
ions
Est.
Cos
t of
Nee
ds
Inventory Year
Water and Wastewater(in millions)
Completed
$0$1$2$3$4$5$6
$0$1$2$3$4$5$6
09 10 11 12 13 14 15 16 17 18 Est.
Cos
t of
Com
plet
ions
Est.
Cos
t of
Nee
ds
Inventory Year
School Renovations(in millions)
Completed
TOP 3
0
2,000
4,000
6,000
8,000
10,000
12,000
14,000
$0$5
$10$15$20$25$30$35$40$45$50
09 10 11 12 13 14 15 16 17 18
Stud
ents
Cost
in M
illio
ns
Inventory Year
Cost of Needed New School Space vs Improvements to Existing Schools and Student Enrollment Growth
New Space Existing Space Students
= Local= Regional (Serves Multiple Counties)
DRAFT

107WWW.TN.GOV/TACIR
County Summaries
Project Type Conceptual
Planning & Design + Construction
Transportation 25,230,000$ 53,445,754$
Industrial Sites and Parks 1,500,000$ 27,200,000$
Law Enforcement 10,000,000$ -$
Water and Wastewater 1,432,720$ 7,680,000$
School Renovations 100,000$ 100,000$
Public Buildings 100,000$ -$
Broadband -$ -$
Business District Development -$ -$
Community Development -$ -$
Fire Protection -$ -$
Housing -$ -$
Libraries, Museums, & Historic Sites -$ -$
New Public Schools & Additions -$ -$
Other Education -$ -$
Other Facilities -$ -$
Other Utilities -$ -$
Post-secondary Education -$ -$
Public Health Facilities -$ -$
Recreation -$ -$
School-System-wide -$ -$
Solid Waste -$ -$
Storm Water -$ -$Total 38,362,720$ 88,425,754$
*Total Estimated Cost = Conceptual + Planning & Design + Construction
Estimated Cost of Needed Infrastructurefor Trousdale County
Five-year period July 2018 through June 2023
Trousdale CountyTotal Estimated Cost* for
Infrastructure Improvements
$126,788,474
$0
$5
$10
$15
$20
$0$20$40$60$80
$100$120
09 10 11 12 13 14 15 16 17 18 Est.
Cos
t of
Com
plet
ions
Est.
Cos
t of
Nee
ds
Inventory Year
Transportation(in millions)
Completed
$0.0$0.5$1.0$1.5$2.0$2.5$3.0
$0$5
$10$15$20$25$30$35
09 10 11 12 13 14 15 16 17 18 Est.
Cos
t of
Com
plet
ions
Est.
Cos
t of
Nee
ds
Inventory Year
Industrial Sites and Parks(in millions)
Completed
$0.0
$0.5
$1.0
$1.5
$2.0
$2.5
$0$2$4$6$8
$10$12
09 10 11 12 13 14 15 16 17 18 Est.
Cos
t of
Com
plet
ions
Est.
Cos
t of
Nee
ds
Inventory Year
Law Enforcement(in millions)
Completed
TOP 3
02004006008001,0001,2001,4001,600
$0.0
$0.5
$1.0
$1.5
$2.0
$2.5
$3.0
$3.5
09 10 11 12 13 14 15 16 17 18
Stud
ents
Cost
in M
illio
ns
Inventory Year
Cost of Needed New School Space vs Improvements to Existing Schools and Student Enrollment Growth
New Space Existing Space Students
= Local= Regional (Serves Multiple Counties)
DRAFT

WWW.TN.GOV/TACIR108
Building Tennessee’s Tomorrow: Anticipating the State’s Infrastructure Needs
Project Type Conceptual
Planning & Design + Construction
Recreation 12,245,000$ 20,249,089$
Transportation 22,058,000$ 8,057,978$
Community Development 16,575,000$ -$
Water and Wastewater 5,132,200$ 2,576,840$
School Renovations 350,000$ 900,000$
Broadband -$ 1,100,000$
Business District Development 1,000,000$ -$
Industrial Sites and Parks 650,000$ -$
Other Facilities 496,000$ -$
Housing 150,000$ -$
Fire Protection -$ -$
Law Enforcement -$ -$
Libraries, Museums, & Historic Sites -$ -$
New Public Schools & Additions -$ -$
Other Education -$ -$
Other Utilities -$ -$
Post-secondary Education -$ -$
Public Buildings -$ -$
Public Health Facilities -$ -$
School-System-wide -$ -$
Solid Waste -$ -$
Storm Water -$ -$Total 58,656,200$ 32,883,907$
*Total Estimated Cost = Conceptual + Planning & Design + Construction
Estimated Cost of Needed Infrastructurefor Unicoi County
Five-year period July 2018 through June 2023
Unicoi CountyTotal Estimated Cost* for
Infrastructure Improvements
$91,540,107
$0.0$0.2$0.4$0.6$0.8$1.0$1.2$1.4$1.6
$0$5
$10$15$20$25$30$35
09 10 11 12 13 14 15 16 17 18 Est.
Cos
t of
Com
plet
ions
Est.
Cos
t of
Nee
ds
Inventory Year
Recreation(in millions)
Completed
$0
$5
$10
$15
$20
$25
$0$10$20$30$40$50$60$70
09 10 11 12 13 14 15 16 17 18 Est.
Cos
t of
Com
plet
ions
Est.
Cos
t of
Nee
ds
Inventory Year
Transportation(in millions)
Completed
$0.0$0.5$1.0$1.5$2.0$2.5$3.0
$0
$5
$10
$15
$20
$25
09 10 11 12 13 14 15 16 17 18 Est.
Cos
t of
Com
plet
ions
Est.
Cos
t of
Nee
ds
Inventory Year
Community Development(in millions)
Completed
TOP 3
0
500
1,000
1,500
2,000
2,500
3,000
$0$2$4$6$8
$10$12$14$16$18
09 10 11 12 13 14 15 16 17 18
Stud
ents
Cost
in M
illio
ns
Inventory Year
Cost of Needed New School Space vs Improvements to Existing Schools and Student Enrollment Growth
New Space Existing Space Students
= Local= Regional (Serves Multiple Counties)
DRAFT

109WWW.TN.GOV/TACIR
County Summaries
Project Type Conceptual
Planning & Design + Construction
Transportation 4,121,000$ 77,911,639$
New Public Schools & Additions 15,175,000$ -$
Recreation 6,070,000$ 1,750,000$
School Renovations 1,408,620$ 905,983$
Industrial Sites and Parks 1,200,000$ -$
Post-secondary Education 1,000,000$ -$
Water and Wastewater 328,220$ -$
Public Health Facilities 250,000$ -$
Broadband -$ -$
Business District Development -$ -$
Community Development -$ -$
Fire Protection -$ -$
Housing -$ -$
Law Enforcement -$ -$
Libraries, Museums, & Historic Sites -$ -$
Other Education -$ -$
Other Facilities -$ -$
Other Utilities -$ -$
Public Buildings -$ -$
School-System-wide -$ -$
Solid Waste -$ -$
Storm Water -$ -$Total 29,552,840$ 80,567,622$
*Total Estimated Cost = Conceptual + Planning & Design + Construction
Estimated Cost of Needed Infrastructurefor Union County
Five-year period July 2018 through June 2023
Union CountyTotal Estimated Cost* for
Infrastructure Improvements
$110,120,462
$0$5$10$15$20$25$30$35
$0$20$40$60$80
$100$120$140$160
09 10 11 12 13 14 15 16 17 18 Est.
Cos
t of
Com
plet
ions
Est.
Cos
t of
Nee
ds
Inventory Year
Transportation(in millions)
Completed
$0$1$2$3$4$5$6$7$8
$0$2$4$6$8
$10$12$14$16
09 10 11 12 13 14 15 16 17 18 Est.
Cos
t of
Com
plet
ions
Est.
Cos
t of
Nee
ds
Inventory Year
New Public Schools & Additions (in millions)
Completed
$0.0$0.1$0.2$0.3$0.4$0.5$0.6$0.7$0.8$0.9$1.0
$0$1$2$3$4$5$6$7$8$9
09 10 11 12 13 14 15 16 17 18 Est.
Cos
t of
Com
plet
ions
Est.
Cos
t of
Nee
ds
Inventory Year
Recreation(in millions)
Completed
TOP 3
0
1,000
2,000
3,000
4,000
5,000
6,000
7,000
$0$2$4$6$8
$10$12$14$16
09 10 11 12 13 14 15 16 17 18
Stud
ents
Cost
in M
illio
ns
Inventory Year
Cost of Needed New School Space vs Improvements to Existing Schools and Student Enrollment Growth
New Space Existing Space Students
= Local= Regional (Serves Multiple Counties)
DRAFT

WWW.TN.GOV/TACIR110
Building Tennessee’s Tomorrow: Anticipating the State’s Infrastructure Needs
Project Type Conceptual
Planning & Design + Construction
Recreation 15,910,000$ 32,400,000$
Transportation 559,000$ 26,921,340$
Public Health Facilities 6,000,000$ -$
Industrial Sites and Parks 5,000,000$ -$
Other Utilities -$ 631,000$
Community Development -$ 440,000$
Water and Wastewater 300,000$ -$
School Renovations 170,000$ -$
Business District Development -$ 68,000$
Public Buildings -$ 52,500$
Broadband -$ -$
Fire Protection -$ -$
Housing -$ -$
Law Enforcement -$ -$
Libraries, Museums, & Historic Sites -$ -$
New Public Schools & Additions -$ -$
Other Education -$ -$
Other Facilities -$ -$
Post-secondary Education -$ -$
School-System-wide -$ -$
Solid Waste -$ -$
Storm Water -$ -$Total 27,939,000$ 60,512,840$
*Total Estimated Cost = Conceptual + Planning & Design + Construction
Estimated Cost of Needed Infrastructurefor Van Buren County
Five-year period July 2018 through June 2023
Van Buren CountyTotal Estimated Cost* for
Infrastructure Improvements
$88,451,840
$0.0$0.5$1.0$1.5$2.0$2.5$3.0$3.5$4.0
$0$10$20$30$40$50$60
09 10 11 12 13 14 15 16 17 18 Est.
Cos
t of
Com
plet
ions
Est.
Cos
t of
Nee
ds
Inventory Year
Recreation(in millions)
Completed
$0$10$20$30$40$50$60$70$80
$0
$20
$40
$60
$80
$100
09 10 11 12 13 14 15 16 17 18 Est.
Cos
t of
Com
plet
ions
Est.
Cos
t of
Nee
ds
Inventory Year
Transportation(in millions)
Completed
$0.0$0.1$0.2$0.3$0.4$0.5$0.6$0.7$0.8$0.9$1.0
$0$1$2$3$4$5$6$7$8$9
09 10 11 12 13 14 15 16 17 18 Est.
Cos
t of
Com
plet
ions
Est.
Cos
t of
Nee
ds
Inventory Year
Public Health Facilities(in millions)
Completed
TOP 3
0100200300400500600700800900
$0$2$4$6$8
$10$12$14$16$18$20
09 10 11 12 13 14 15 16 17 18
Stud
ents
Cost
in M
illio
ns
Inventory Year
Cost of Needed New School Space vs Improvements to Existing Schools and Student Enrollment Growth
New Space Existing Space Students
= Local= Regional (Serves Multiple Counties)
DRAFT

111WWW.TN.GOV/TACIR
County Summaries
Project Type Conceptual
Planning & Design + Construction
Transportation 33,398,000$ 45,963,960$
Water and Wastewater 4,500,000$ 19,115,000$
School Renovations 2,270,000$ 11,214,500$
Law Enforcement -$ 12,160,000$
New Public Schools & Additions 2,504,000$ 2,800,000$
Recreation -$ 5,000,000$
Post-secondary Education 1,740,000$ -$
Public Buildings 1,000,000$ 300,000$
Fire Protection 325,000$ -$
Public Health Facilities 100,000$ -$
Broadband -$ -$
Business District Development -$ -$
Community Development -$ -$
Housing -$ -$
Industrial Sites and Parks -$ -$
Libraries, Museums, & Historic Sites -$ -$
Other Education -$ -$
Other Facilities -$ -$
Other Utilities -$ -$
School-System-wide -$ -$
Solid Waste -$ -$
Storm Water -$ -$Total 45,837,000$ 96,553,460$
*Total Estimated Cost = Conceptual + Planning & Design + Construction
Estimated Cost of Needed Infrastructurefor Warren County
Five-year period July 2018 through June 2023
Warren CountyTotal Estimated Cost* for
Infrastructure Improvements
$142,390,460
$0
$5
$10
$15
$20
$25
$0$20$40$60$80
$100$120$140
09 10 11 12 13 14 15 16 17 18 Est.
Cos
t of
Com
plet
ions
Est.
Cos
t of
Nee
ds
Inventory Year
Transportation(in millions)
Completed
$0
$2
$4
$6
$8
$10
$0$5
$10$15$20$25$30$35
09 10 11 12 13 14 15 16 17 18 Est.
Cos
t of
Com
plet
ions
Est.
Cos
t of
Nee
ds
Inventory Year
Water and Wastewater(in millions)
Completed
$0$1$2$3$4$5$6$7$8
$0$2$4$6$8
$10$12$14$16
09 10 11 12 13 14 15 16 17 18 Est.
Cos
t of
Com
plet
ions
Est.
Cos
t of
Nee
ds
Inventory Year
School Renovations(in millions)
Completed
TOP 3
0
1,000
2,000
3,000
4,000
5,000
6,000
7,000
$0$2$4$6$8
$10$12$14$16
09 10 11 12 13 14 15 16 17 18
Stud
ents
Cost
in M
illio
ns
Inventory Year
Cost of Needed New School Space vs Improvements to Existing Schools and Student Enrollment Growth
New Space Existing Space Students
= Local= Regional (Serves Multiple Counties)
DRAFT

WWW.TN.GOV/TACIR112
Building Tennessee’s Tomorrow: Anticipating the State’s Infrastructure Needs
Project Type Conceptual
Planning & Design + Construction
Post-secondary Education 171,915,000$ 165,384,147$
Transportation 87,809,000$ 130,530,780$
Water and Wastewater 47,429,000$ 65,515,000$
New Public Schools & Additions 50,175,500$ 37,400,000$
Housing 6,780,000$ 29,200,000$
School Renovations 11,712,000$ 3,105,000$
Recreation 1,570,000$ 11,995,000$
Other Facilities -$ 8,000,000$
Fire Protection 5,750,000$ -$
Libraries, Museums, & Historic Sites 2,050,000$ 2,485,000$
Public Buildings 1,080,000$ 3,169,000$
Public Health Facilities 3,030,000$ 445,000$
Law Enforcement 3,080,000$ 100,000$
Business District Development 2,000,000$ -$
School-System-wide 300,000$ -$
Broadband -$ -$
Community Development -$ -$
Industrial Sites and Parks -$ -$
Other Education -$ -$
Other Utilities -$ -$
Solid Waste -$ -$
Storm Water -$ -$Total 394,680,500$ 457,328,927$
*Total Estimated Cost = Conceptual + Planning & Design + Construction
Estimated Cost of Needed Infrastructurefor Washington County
Five-year period July 2018 through June 2023
Washington CountyTotal Estimated Cost* for
Infrastructure Improvements
$852,009,427
$0
$10
$20
$30
$40
$50
$0$50
$100$150$200$250$300$350$400
09 10 11 12 13 14 15 16 17 18 Est.
Cos
t of
Com
plet
ions
Est.
Cos
t of
Nee
ds
Inventory Year
Post-secondary Education(in millions)
Completed
$0$10$20$30$40$50$60
$0
$50
$100
$150
$200
$250
09 10 11 12 13 14 15 16 17 18 Est.
Cos
t of
Com
plet
ions
Est.
Cos
t of
Nee
ds
Inventory Year
Transportation(in millions)
Completed
$0$10$20$30$40$50$60
$0
$50
$100
$150
$200
$250
09 10 11 12 13 14 15 16 17 18 Est.
Cos
t of
Com
plet
ions
Est.
Cos
t of
Nee
ds
Inventory Year
Water and Wastewater(in millions)
Completed
TOP 3
02,0004,0006,0008,00010,00012,00014,00016,00018,000
$0
$20
$40
$60
$80
$100
$120
09 10 11 12 13 14 15 16 17 18
Stud
ents
Cost
in M
illio
ns
Inventory Year
Cost of Needed New School Space vs Improvements to Existing Schools and Student Enrollment Growth
New Space Existing Space Students
= Local= Regional (Serves Multiple Counties)
DRAFT

113WWW.TN.GOV/TACIR
County Summaries
Project Type Conceptual
Planning & Design + Construction
Transportation 42,510,151$ 6,578,529$
Law Enforcement 19,860,000$ 28,900,000$
Industrial Sites and Parks 5,500,000$ 1,014,894$
School Renovations 2,044,000$ 100,000$
Water and Wastewater 1,763,500$ -$
Community Development 1,500,000$ -$
Solid Waste -$ 950,000$
New Public Schools & Additions 850,000$ -$
School-System-wide -$ 781,717$
Public Health Facilities -$ 250,000$
Recreation -$ 250,000$
Fire Protection -$ 125,955$
Broadband -$ -$
Business District Development -$ -$
Housing -$ -$
Libraries, Museums, & Historic Sites -$ -$
Other Education -$ -$
Other Facilities -$ -$
Other Utilities -$ -$
Post-secondary Education -$ -$
Public Buildings -$ -$
Storm Water -$ -$Total 74,027,651$ 38,951,095$
*Total Estimated Cost = Conceptual + Planning & Design + Construction
Estimated Cost of Needed Infrastructurefor Wayne County
Five-year period July 2018 through June 2023
Wayne CountyTotal Estimated Cost* for
Infrastructure Improvements
$112,978,746
$0$10$20$30$40$50$60
$0$20$40$60$80
$100$120
09 10 11 12 13 14 15 16 17 18 Est.
Cos
t of
Com
plet
ions
Est.
Cos
t of
Nee
ds
Inventory Year
Transportation(in millions)
Completed
$0$2$4$6$8$10$12
$0$10$20$30$40$50$60
09 10 11 12 13 14 15 16 17 18 Est.
Cos
t of
Com
plet
ions
Est.
Cos
t of
Nee
ds
Inventory Year
Law Enforcement(in millions)
Completed
$0.0$0.1$0.2$0.3$0.4$0.5$0.6$0.7$0.8$0.9$1.0
$0$1$2$3$4$5$6$7
09 10 11 12 13 14 15 16 17 18 Est.
Cos
t of
Com
plet
ions
Est.
Cos
t of
Nee
ds
Inventory Year
Industrial Sites and Parks(in millions)
Completed
TOP 3
0
500
1,000
1,500
2,000
2,500
3,000
$0.0$0.5$1.0$1.5$2.0$2.5$3.0$3.5$4.0
09 10 11 12 13 14 15 16 17 18
Stud
ents
Cost
in M
illio
ns
Inventory Year
Cost of Needed New School Space vs Improvements to Existing Schools and Student Enrollment Growth
New Space Existing Space Students
= Local= Regional (Serves Multiple Counties)
DRAFT

WWW.TN.GOV/TACIR114
Building Tennessee’s Tomorrow: Anticipating the State’s Infrastructure Needs
Project Type Conceptual
Planning & Design + Construction
Post-secondary Education 74,600,000$ 108,680,000$
Transportation 29,234,000$ 17,780,875$
Libraries, Museums, & Historic Sites 5,500,000$ -$
Law Enforcement -$ 4,500,000$
Water and Wastewater 2,500,000$ 860,360$
New Public Schools & Additions 3,100,000$ -$
Recreation 850,000$ 1,149,633$
Industrial Sites and Parks 1,900,000$ -$
Public Buildings 1,300,000$ 260,000$
School Renovations 575,000$ 745,000$
Fire Protection 300,000$ 1,000,000$
Storm Water 1,000,000$ -$
Broadband -$ -$
Business District Development -$ -$
Community Development -$ -$
Housing -$ -$
Other Education -$ -$
Other Facilities -$ -$
Other Utilities -$ -$
Public Health Facilities -$ -$
School-System-wide -$ -$
Solid Waste -$ -$Total 120,859,000$ 134,975,868$
*Total Estimated Cost = Conceptual + Planning & Design + Construction
Estimated Cost of Needed Infrastructurefor Weakley County
Five-year period July 2018 through June 2023
Weakley CountyTotal Estimated Cost* for
Infrastructure Improvements
$255,834,868
$0$5$10$15$20$25$30$35$40
$0
$50
$100
$150
$200
$250
09 10 11 12 13 14 15 16 17 18 Est.
Cos
t of
Com
plet
ions
Est.
Cos
t of
Nee
ds
Inventory Year
Post-secondary Education(in millions)
Completed
$0$1$2$3$4$5$6
$0
$10
$20
$30
$40
$50
09 10 11 12 13 14 15 16 17 18 Est.
Cos
t of
Com
plet
ions
Est.
Cos
t of
Nee
ds
Inventory Year
Transportation(in millions)
Completed
$0.0$0.1$0.2$0.3$0.4$0.5$0.6$0.7$0.8$0.9$1.0
$0$1$2$3$4$5$6
09 10 11 12 13 14 15 16 17 18 Est.
Cos
t of
Com
plet
ions
Est.
Cos
t of
Nee
ds
Inventory Year
Libraries, Museums, & Historic Sites (in millions)
Completed
TOP 3
05001,0001,5002,0002,5003,0003,5004,0004,5005,000
$0$2$4$6$8
$10$12$14$16$18
09 10 11 12 13 14 15 16 17 18
Stud
ents
Cost
in M
illio
ns
Inventory Year
Cost of Needed New School Space vs Improvements to Existing Schools and Student Enrollment Growth
New Space Existing Space Students
= Local= Regional (Serves Multiple Counties)
DRAFT

115WWW.TN.GOV/TACIR
County Summaries
Project Type Conceptual
Planning & Design + Construction
Transportation 41,801,000$ 14,502,695$
New Public Schools & Additions -$ 20,895,000$
Water and Wastewater 12,700,000$ 3,800,000$
School Renovations 850,000$ 3,280,000$
Industrial Sites and Parks -$ 4,069,700$
Public Buildings 4,000,000$ -$
Law Enforcement 3,000,000$ -$
Solid Waste -$ 3,000,000$
Other Utilities -$ 900,000$
Libraries, Museums, & Historic Sites 500,000$ -$
Community Development -$ 200,000$
Recreation 200,000$ -$
Broadband -$ -$
Business District Development -$ -$
Fire Protection -$ -$
Housing -$ -$
Other Education -$ -$
Other Facilities -$ -$
Post-secondary Education -$ -$
Public Health Facilities -$ -$
School-System-wide -$ -$
Storm Water -$ -$Total 63,051,000$ 50,647,395$
*Total Estimated Cost = Conceptual + Planning & Design + Construction
Estimated Cost of Needed Infrastructurefor White County
Five-year period July 2018 through June 2023
White CountyTotal Estimated Cost* for
Infrastructure Improvements
$113,698,395
$0
$2
$4
$6
$8
$10
$0$10$20$30$40$50$60$70
09 10 11 12 13 14 15 16 17 18 Est.
Cos
t of
Com
plet
ions
Est.
Cos
t of
Nee
ds
Inventory Year
Transportation(in millions)
Completed
$0.00$0.05$0.10$0.15$0.20$0.25$0.30$0.35
$0
$5
$10
$15
$20
$25
09 10 11 12 13 14 15 16 17 18 Est.
Cos
t of
Com
plet
ions
Est.
Cos
t of
Nee
ds
Inventory Year
New Public Schools & Additions (in millions)
Completed
$0$1$2$3$4$5$6
$0$2$4$6$8
$10$12$14$16$18
09 10 11 12 13 14 15 16 17 18 Est.
Cos
t of
Com
plet
ions
Est.
Cos
t of
Nee
ds
Inventory Year
Water and Wastewater(in millions)
Completed
TOP 3
05001,0001,5002,0002,5003,0003,5004,0004,500
$0
$5
$10
$15
$20
$25
09 10 11 12 13 14 15 16 17 18
Stud
ents
Cost
in M
illio
ns
Inventory Year
Cost of Needed New School Space vs Improvements to Existing Schools and Student Enrollment Growth
New Space Existing Space Students
= Local= Regional (Serves Multiple Counties)
DRAFT

WWW.TN.GOV/TACIR116
Building Tennessee’s Tomorrow: Anticipating the State’s Infrastructure Needs
Project Type Conceptual
Planning & Design + Construction
Transportation 172,360,844$ 821,708,901$
New Public Schools & Additions 255,700,000$ 99,100,000$
Water and Wastewater 44,571,895$ 222,187,498$
School Renovations 21,428,000$ 143,970,968$
Recreation 31,405,670$ 83,357,953$
Post-secondary Education 17,700,000$ 58,680,000$
Fire Protection 50,812,500$ 8,939,884$
Public Buildings -$ 43,600,000$
Law Enforcement -$ 30,000,000$
Other Facilities -$ 14,000,000$
Business District Development 8,600,000$ -$
School-System-wide -$ 8,000,000$
Storm Water 4,000,000$ 3,667,135$
Libraries, Museums, & Historic Sites 3,970,170$ 3,120,000$
Solid Waste 2,550,000$ 1,512,000$
Broadband -$ -$
Community Development -$ -$
Housing -$ -$
Industrial Sites and Parks -$ -$
Other Education -$ -$
Other Utilities -$ -$
Public Health Facilities -$ -$Total 613,099,079$ 1,541,844,339$
*Total Estimated Cost = Conceptual + Planning & Design + Construction
Estimated Cost of Needed Infrastructurefor Williamson County
Five-year period July 2018 through June 2023
Williamson CountyTotal Estimated Cost* for
Infrastructure Improvements
$2,154,943,418
$0
$50
$100
$150
$200
$250
$0$200$400$600$800
$1,000$1,200
09 10 11 12 13 14 15 16 17 18 Est.
Cos
t of
Com
plet
ions
Est.
Cos
t of
Nee
ds
Inventory Year
Transportation(in millions)
Completed
$0
$20
$40
$60
$80
$100
$0
$100
$200
$300
$400
$500
09 10 11 12 13 14 15 16 17 18 Est.
Cos
t of
Com
plet
ions
Est.
Cos
t of
Nee
ds
Inventory Year
New Public Schools & Additions (in millions)
Completed
$0
$5
$10
$15
$20
$25
$0$50
$100$150$200$250$300
09 10 11 12 13 14 15 16 17 18 Est.
Cos
t of
Com
plet
ions
Est.
Cos
t of
Nee
ds
Inventory Year
Water and Wastewater(in millions)
Completed
TOP 3
05,00010,00015,00020,00025,00030,00035,00040,00045,000
$0$50
$100$150$200$250$300$350$400$450$500
09 10 11 12 13 14 15 16 17 18
Stud
ents
Cost
in M
illio
ns
Inventory Year
Cost of Needed New School Space vs Improvements to Existing Schools and Student Enrollment Growth
New Space Existing Space Students
= Local= Regional (Serves Multiple Counties)
DRAFT

117WWW.TN.GOV/TACIR
County Summaries
Project Type Conceptual
Planning & Design + Construction
New Public Schools & Additions 388,500,000$ 280,000,000$
Transportation 251,872,000$ 366,669,625$
School Renovations 151,748,900$ 632,500$
Water and Wastewater 48,600,000$ 32,000,000$
Law Enforcement -$ 18,340,000$
Recreation 11,000,000$ 7,160,570$
Other Utilities -$ 10,000,000$
Fire Protection 3,500,000$ 2,750,000$
Solid Waste 3,000,000$ -$
Public Buildings -$ 2,500,000$
School-System-wide 2,150,000$ -$
Public Health Facilities 720,000$ -$
Broadband -$ -$
Business District Development -$ -$
Community Development -$ -$
Housing -$ -$
Industrial Sites and Parks -$ -$
Libraries, Museums, & Historic Sites -$ -$
Other Education -$ -$
Other Facilities -$ -$
Post-secondary Education -$ -$
Storm Water -$ -$Total 861,090,900$ 720,052,695$
*Total Estimated Cost = Conceptual + Planning & Design + Construction
Estimated Cost of Needed Infrastructurefor Wilson County
Five-year period July 2018 through June 2023
Wilson CountyTotal Estimated Cost* for
Infrastructure Improvements
$1,581,143,595
$0$10$20$30$40$50$60
$0$100$200$300$400$500$600$700$800
09 10 11 12 13 14 15 16 17 18 Est.
Cos
t of
Com
plet
ions
Est.
Cos
t of
Nee
ds
Inventory Year
New Public Schools & Additions (in millions)
Completed
$0
$10
$20
$30
$40
$50
$0$100$200$300$400$500$600$700
09 10 11 12 13 14 15 16 17 18 Est.
Cos
t of
Com
plet
ions
Est.
Cos
t of
Nee
ds
Inventory Year
Transportation(in millions)
Completed
$0$5$10$15$20$25$30$35$40$45
$0$20$40$60$80
$100$120$140$160$180
09 10 11 12 13 14 15 16 17 18 Est.
Cos
t of
Com
plet
ions
Est.
Cos
t of
Nee
ds
Inventory Year
School Renovations(in millions)
Completed
TOP 3
0
5,000
10,000
15,000
20,000
25,000
$0$100$200$300$400$500$600$700$800
09 10 11 12 13 14 15 16 17 18
Stud
ents
Cost
in M
illio
ns
Inventory Year
Cost of Needed New School Space vs Improvements to Existing Schools and Student Enrollment Growth
New Space Existing Space Students
= Local= Regional (Serves Multiple Counties)
DRAFT

WWW.TN.GOV/TACIR118
Building Tennessee’s Tomorrow: Anticipating the State’s Infrastructure Needs
Project Type Conceptual
Planning & Design + Construction
Transportation 1,239,389,000$ 2,358,329,495$
Water and Wastewater 27,706,410$ 404,944,000$
Other Utilities 89,700,000$ 245,775,000$
Post-secondary Education 57,340,000$ 51,317,416$
Law Enforcement 3,200,000$ 59,030,000$
Recreation 10,040,000$ 14,500,000$
Public Buildings -$ 12,410,000$
Fire Protection 158,000$ -$
Libraries, Museums, & Historic Sites -$ 135,199$
Broadband -$ -$
Business District Development -$ -$
Community Development -$ -$
Housing -$ -$
Industrial Sites and Parks -$ -$
New Public Schools & Additions -$ -$
Other Education -$ -$
Other Facilities -$ -$
Public Health Facilities -$ -$
School Renovations -$ -$
School-System-wide -$ -$
Solid Waste -$ -$
Storm Water -$ -$Total 1,427,533,410$ 3,146,441,110$
*Total Estimated Cost = Conceptual + Planning & Design + Construction
Estimated Cost of Needed Infrastructurefor Multi-county
Five-year period July 2018 through June 2023
Multi-countyTotal Estimated Cost* for
Infrastructure Improvements
$4,573,974,520
$0
$50
$100
$150
$200
$0$500
$1,000$1,500$2,000$2,500$3,000$3,500$4,000
09 10 11 12 13 14 15 16 17 18 Est.
Cos
t of
Com
plet
ions
Est.
Cos
t of
Nee
ds
Inventory Year
Transportation(in millions)
Completed
$0.0
$0.2
$0.4
$0.6
$0.8
$1.0
$0
$100
$200
$300
$400
$500
09 10 11 12 13 14 15 16 17 18 Est.
Cos
t of
Com
plet
ions
Est.
Cos
t of
Nee
ds
Inventory Year
Water and Wastewater(in millions)
Completed
$0$1$2$3$4$5$6$7
$0$50
$100$150$200$250$300$350$400
09 10 11 12 13 14 15 16 17 18 Est.
Cos
t of
Com
plet
ions
Est.
Cos
t of
Nee
ds
Inventory Year
Other Utilities(in millions)
Completed
TOP 3
= Local= Regional (Serves Multiple Counties)
DRAFT