buildings in arid desert climate - diva portal1084934/fulltext01.pdf · buildings in arid desert...
TRANSCRIPT
BUILDINGS IN ARID DESERT
CLIMATEIMPROVING ENERGY EFFICIENCY WITH MEASURES ON
THE BUILDING ENVELOPE
Emma Wahl
Civilingenjör, Arkitektur
2017
Luleå tekniska universitet
Institutionen för samhällsbyggnad och naturresurser

I
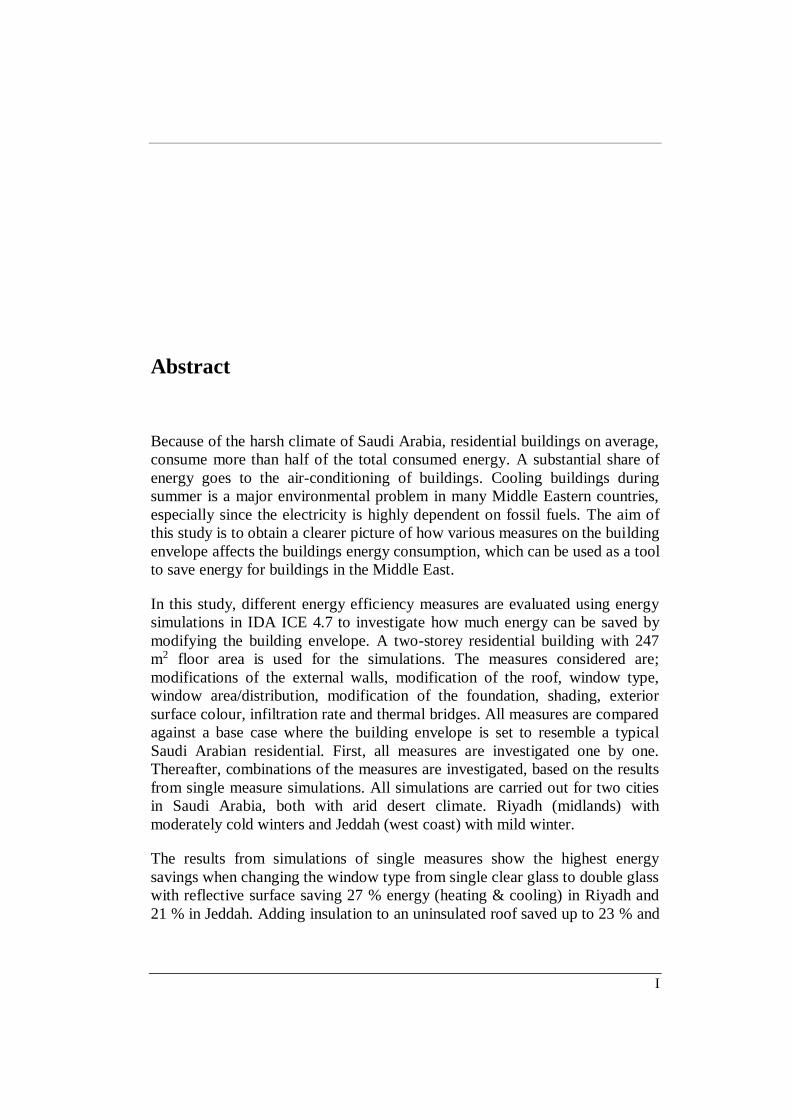
Abstract
Because of the harsh climate of Saudi Arabia, residential buildings on average,
consume more than half of the total consumed energy. A substantial share of
energy goes to the air-conditioning of buildings. Cooling buildings during
summer is a major environmental problem in many Middle Eastern countries,
especially since the electricity is highly dependent on fossil fuels. The aim of
this study is to obtain a clearer picture of how various measures on the building
envelope affects the buildings energy consumption, which can be used as a tool
to save energy for buildings in the Middle East.
In this study, different energy efficiency measures are evaluated using energy
simulations in IDA ICE 4.7 to investigate how much energy can be saved by
modifying the building envelope. A two-storey residential building with 247
m2 floor area is used for the simulations. The measures considered are;
modifications of the external walls, modification of the roof, window type,
window area/distribution, modification of the foundation, shading, exterior
surface colour, infiltration rate and thermal bridges. All measures are compared
against a base case where the building envelope is set to resemble a typical
Saudi Arabian residential. First, all measures are investigated one by one.
Thereafter, combinations of the measures are investigated, based on the results
from single measure simulations. All simulations are carried out for two cities
in Saudi Arabia, both with arid desert climate. Riyadh (midlands) with
moderately cold winters and Jeddah (west coast) with mild winter.
The results from simulations of single measures show the highest energy
savings when changing the window type from single clear glass to double glass
with reflective surface saving 27 % energy (heating & cooling) in Riyadh and
21 % in Jeddah. Adding insulation to an uninsulated roof saved up to 23 % and
BUILDINGS IN ARID DESERT CLIMATE
II
21 % energy for Riyadh respectively Jeddah. Improvements of the thermal
resistance of the exterior walls show 21 % energy savings in Riyadh and only
11 % in Jeddah. Lowering the window to wall ratio from 28 % to 10 % and
changing the window distribution results in 19 % (Riyadh) and 17 % (Jeddah)
energy savings. Adding fixed shades saves up to 8 % (Riyadh) and 13 %
energy (Jeddah) when dimensioned for the peak cooling load. Using
bright/reflective surface colour on the roof saves up to 9% (Riyadh) and 17 %
(Jeddah) when the roof is uninsulated. For the exterior walls, bright/reflective
surface saves up to 5 % (Riyadh) and 10 % (Jeddah) when the walls are
uninsulated. The other single measures investigated show less than 7 % energy
savings.
The results for combined measures show the highest energy savings for two
combined measures when improving the thermal resistance of the exterior
walls and changing window area/distribution saving up to 52 % (Riyadh) and
39 % (Jeddah). When performing three measures the addition of improved
thermal resistance and reflectance of the windows resulted in the highest
energy savings, saving up to 62 % (Riyadh) and 48 % (Jeddah). When adding a
fourth measure, improving the thermal resistance of the slab shows the highest
energy savings, 71 % (Riyadh) and 54 % (Jeddah). Applying all measures on
the building envelope results in 78 % (Riyadh) and 62 % (Jeddah) energy
savings.
Significant energy savings can be achieved with measures on the building
envelope. Major savings can be made by adding only 50-100 mm of insulation
to the exterior walls and roof. Decreased window area and improvements on
the thermal resistance and reflectance on the windows result in significant
energy savings. Energy savings achieved with shadings and reflective surface
colours decrease significantly when the thermal resistance of the roof and
external walls are improved. All measures concerning thermal resistance have
a higher impact in Riyadh than in Jeddah due to that a large part of the total
heating and cooling is air handling unit (AHU) cooling in Jeddah. AHU
cooling is not affected significantly by measures on the building envelope. To
optimise energy savings, measures on the building envelope should be
considered in combination with measures concerning the AHU.
III
Abstract in Swedish
På grund av det hårda klimatet i Saudiarabien, konsumerar bostadshus mer än
hälften av den totala energi som förbrukas. En stor del av den förbrukade
energin går till luftkonditionering. Kylningen av byggnader är ett stort
miljöproblem i många länder i Mellanöstern, särskilt eftersom elektriciteten till
stor del är helt beroende av förbränning av fossila bränslen. Syftet med denna
studie är att få en tydligare bild av hur olika åtgärder på klimatskalet påverkar
byggnaders energiförbrukning. Tanken är att resultaten ska kunna användas
som ett hjälpmedel vid design av mer energieffektiva byggnader i
Mellanöstern.
I denna studie är olika energieffektivitetsåtgärder utvärderade med hjälp av
energisimuleringar i IDA ICE 4.7 för att undersöka hur mycket energi som kan
sparas genom att modifiera klimatskalet. Ett bostadshus med 247 m2 golvyta i
två våningar används för simuleringarna. De åtgärder som övervägs är;
modifieringar av ytterväggar, modifiering av tak, fönstertyp, fönster area/
distribution, modifiering av fundamentet, skuggning, ytskikt, infiltration och
köldbryggor. Alla åtgärder jämförs mot ett Base Case där klimatskalet är
inställt för att likna en typisk bostad i Saudiarabiens. Först undersöks alla
åtgärder en åt gången. Därefter undersöks kombinationer av de studerade
åtgärderna, baserat på resultat från simuleringar av enskilda åtgärder. Alla
simuleringar utförs för två städer i Saudiarabien, både med torrt ökenklimat.
Riyadh (inlandet) med måttligt kalla vintrar och Jeddah (västkusten) med mild
vinter.
Resultatet från simuleringar av enskilda åtgärder visar högst energibesparing
när fönstertypen byts ut från enkelt klarglas till dubbelt reflekterande glas. Med
byte av fönstertyp sparas upp till 27 % energi (uppvärmning och kylning) i
Riyadh och 21 % i Jeddah. Att isolera taket sparar upp till 23 % och 21 % för
Riyadh respektive Jeddah. Förbättrat värmemotstånd i ytterväggarna resulterar
i upp till 21 % energibesparing i Riyadh och endast 11 % i Jeddah. Minskning
av fönsterarean från 28 % av väggytan till 10 % och omplacering av fönsterna
ger19 % (Riyadh) och 17 % (Jeddah) energibesparingar. Solavskärmning med
hjälp av fasta skärmtak och fenor sparar 8 % (Riyadh) och 13 % energi
(Jeddah) när de är dimensionerad för maximalt kylbehovet. Använda
ljus/reflekterande yta på taket sparar upp till 9 % (Riyadh) och 17 % (Jeddah)
när taket är oisolerad. För ytterväggar, sparar ljust/reflekterande ytskikt upp till
BUILDINGS IN ARID DESERT CLIMATE
IV
5 % (Riyadh) och 10 % (Jeddah) när väggarna är oisolerad. De övriga enskilda
åtgärderna som undersökts visar mindre än 7 % energibesparing.
Resultaten för kombinerade åtgärder visar högst energibesparingar för två
kombinerade åtgärder när ytterväggens värmemotstånd förbättras tillsammans
med mindre fönsterarea och ändrad fönsterplacering. De två åtgärderna sparar
upp till 52 % energi i Riyadh och 39 % i Jeddah. När tre åtgärder utförs, fås
den högsta energibesparingen med de två åtgärderna ovan med tillägg av
förbättrade fönster med lägre u-värde och högre reflektants. Tillsammans
resulterar de tre åtgärderna i en energibesparing upp till 62 % för Riyadh och
48 % för Jeddah. När man lägger till en fjärde åtgärd, fås den högsta
besparingen med tillägg av förbättrat u-värde på grunden till de tre tidigare
åtgärderna. De fyra åtgärderna sparar upp till 71 % energi i Riyadh och 54 % i
Jeddah. Tillämpning av alla åtgärder på klimatskalet resulterar i 78 % (Riyadh)
och 62 % (Jeddah) energibesparing.
Betydlig reducering av energianvändningen kan uppnås med åtgärder på
byggnadens klimatskal. Stora besparingar fås med endast 50 – 100 mm
isolering i ytterväggar och tak. Att minska fönsterarean och förbättra fönsternas
u-värde och reflektivitet bidrar till stora energibesparingar. Besparingarna som
fås vid solavskärmning och reflektiva ytor på tak och väggar minskar
signifikant när taket och ytterväggarna isoleras. Alla åtgärder som förbättrar u-
värdet på klimatskalet har en större inverkan i Riyadh än i Jeddah på grund av
att en större andel av total uppvärmning och kylning upptas av kylning av
inkommande luft i ventilationen. Energin som behövs för att kyla inkommande
luft påverkas inte nämnvärt av åtgärderna på klimatskalet. För att optimera
energibesparingarna ytterligare, bör åtgärder på klimatskalets övervägas
tillsammans med energieffektivitetsåtgärder av ventilationen.
V
Contents
ABSTRACT .................................................................................................... I
ABSTRACT IN SWEDISH ........................................................................... III
CONTENTS ................................................................................................... V
PREFACE .................................................................................................... IX
ABBREVIATIONS ......................................................................................... 1
1 INTRODUCTION .................................................................................. 3
1.1 Background ................................................................................... 3 1.2 Aim and objective .......................................................................... 4
1.3 Scope and limitations ..................................................................... 4
2 METHOD ............................................................................................... 6
2.1 Choice of method........................................................................... 6
2.2 Approach ....................................................................................... 6 2.2.1 Literature study .................................................................. 8
2.2.2 Base case ............................................................................ 8 2.2.3 Simulations of energy efficiency measures ......................... 9
2.2.4 Energy simulation tool ....................................................... 9 2.3 Reliability and validity ................................................................. 10
3 LITERATURE STUDY ........................................................................ 11 3.1 The Climate of Saudi Arabia ........................................................ 11
3.2 The Building Envelope ................................................................ 12 3.2.1 Orientation ....................................................................... 13
3.2.2 Thermal mass ................................................................... 13
BUILDINGS IN ARID DESERT CLIMATE
VI
3.2.3 Walls ............................................................................... 13 3.2.4 Roof ................................................................................ 16
3.2.5 Solar Reflection of Walls and Roofs ................................ 18 3.2.6 Windows ......................................................................... 18
3.2.7 Daylight and Shading ....................................................... 20 3.2.8 Infiltration rate ................................................................. 22
3.3 Saudi households......................................................................... 22
4 SIMULATION STUDY ....................................................................... 23
4.1 Case ............................................................................................ 23
4.2 Climate data ................................................................................ 24 4.3 Base case - Building parameters .................................................. 27
4.3.1 Exterior walls .................................................................. 27 4.3.2 Foundation ....................................................................... 27
4.3.3 Roof ................................................................................ 28 4.3.4 Windows ......................................................................... 29
4.3.5 Internal walls ................................................................... 30 4.3.6 Ground properties ............................................................ 30
4.3.7 Surfaces ........................................................................... 31 4.3.8 Ventilation ....................................................................... 31
4.3.9 Heating and cooling system ............................................. 32 4.3.10 Pressure coefficients and infiltration rate .......................... 32
4.3.11 Thermal bridges ............................................................... 33 4.3.12 Parameters related to occupants, lightning and equipment 34
4.4 Energy efficiency measures ......................................................... 36 4.4.1 Modification of external walls ......................................... 36
4.4.2 Window types .................................................................. 40 4.4.3 Window area and distribution .......................................... 41
4.4.4 Modification of the roof ................................................... 42 4.4.5 Modification of the foundation ......................................... 44
4.4.6 Shading............................................................................ 45 4.4.7 Modification of exterior surfaces ..................................... 48
4.4.8 Infiltration rate ................................................................. 49 4.4.9 Thermal bridges ............................................................... 49
4.4.10 Combination of measures ................................................. 49
5 RESULTS AND ANALYSIS ............................................................... 51
5.1 Energy simulation - Base case ..................................................... 51 5.1.1 Total heating & cooling ................................................... 51
5.1.2 Energy for all zones during cooling .................................. 54 5.1.3 Peak cooling load ............................................................. 55
VII
5.1.4 Peak heating load ............................................................. 58 5.2 Energy efficiency measures ......................................................... 58
5.2.1 Modification of external walls .......................................... 58 5.2.2 Window types .................................................................. 60
5.2.3 Window area .................................................................... 62 5.2.4 Modification of the roof ................................................... 67
5.2.5 Modification of the foundation ......................................... 69 5.2.6 Shading ............................................................................ 70
5.2.7 Modification of exterior surfaces ...................................... 73 5.2.8 Infiltration rate ................................................................. 75
5.2.9 Thermal bridges ............................................................... 76 5.2.10 Summary of single measures, max energy savings ............ 77
5.2.11 Combination of measures ................................................. 79
6 DISCUSSION AND CONCLUSION ................................................... 84
6.1 Addressing the research questions ................................................ 84
6.2 Conclusions ................................................................................. 87 6.3 Reliability and validity ................................................................. 89
6.4 Suggestions for further studies ..................................................... 89
REFERENCES .............................................................................................. 91
APPENDICES ............................................................................................... 95
Appendix A – Architectural drawings ................................................... 95 Ground floor ................................................................................ 95
2nd Floor ..................................................................................... 96 Appendix B – Zones used in IDA ICE .................................................. 97
Ground floor - zones .................................................................... 97 2nd Floor - zones .......................................................................... 98
Appendix C – Supply and exhaust air ................................................... 99 Appendix D – Calculations of window overhang and fin depth ........... 100
Shading 1 –dimensions for window overhangs and fins ............. 102 Shading 2 –dimensions for window overhangs and fins ............. 105
Window overhang and fin dimensions – Window distribution 7 . 106 Window overhang and fin dimensions – Window distribution 9 . 107
Appendix E – Results from energy simulations ................................... 108 Wall types.................................................................................. 108
Combined measures ................................................................... 109 Additional combined measures .................................................. 110
Distribution of total heating & cooling ....................................... 115 Appendix F – Sun path diagrams ........................................................ 117
BUILDINGS IN ARID DESERT CLIMATE
VIII
IX
Preface
The study is carried out between august 2016 and January 2017 and is a master
thesis for MSc Architectural Engineering at Luleå University of Technology
(LTU). This thesis was enabled thanks to the support from Norconsult, as well
as the Department of Civil, Environmental and Natural Resources Engineering
at Luleå University of Technology, Sweden.
I would like to thank my supervisor at LTU, Jutta Schade, who has given me
guidance throughout my work. I would also like to thank my supervisor at
Norconsult, Marcus Rydbo, for the opportunity to carry out my master thesis at
Norconsult. I highly appreciate working in Norconsult’s office, as part of the
company. I would also like to extend my gratitude to EQUA for lending an
IDA ICE licence, as a tool to carry out energy simulations. Finally, I am
thankful to my examiner, Thomas Olofsson, for his participation in the
examination of this report.
Emma Wahl
Göteborg, January 2016

Abbreviations
1
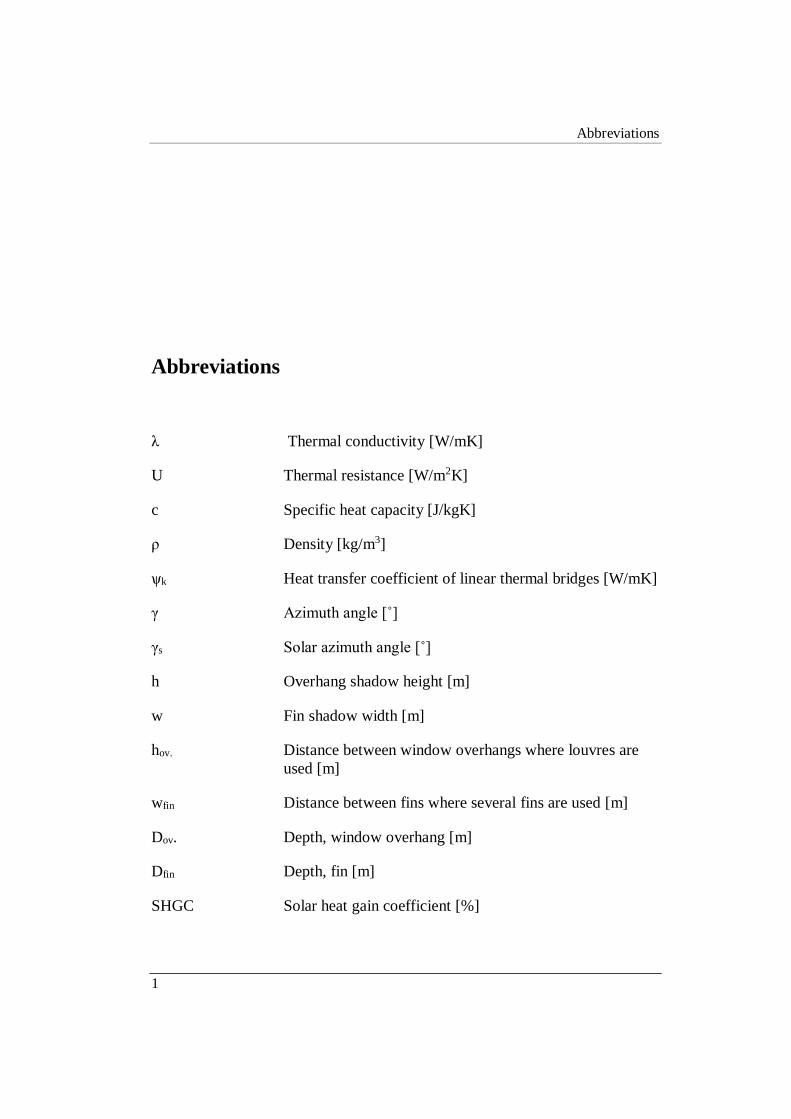
Abbreviations
λ Thermal conductivity [W/mK]
U Thermal resistance [W/m2K]
c Specific heat capacity [J/kgK]
ρ Density [kg/m3]
ѱk Heat transfer coefficient of linear thermal bridges [W/mK]
γ Azimuth angle [˚]
γs Solar azimuth angle [˚]
h Overhang shadow height [m]
w Fin shadow width [m]
hov. Distance between window overhangs where louvres are
used [m]
wfin Distance between fins where several fins are used [m]
Dov. Depth, window overhang [m]
Dfin Depth, fin [m]
SHGC Solar heat gain coefficient [%]

BUILDINGS IN ARID DESERT CLIMATE
2
VT Visible transmittance [%]
ELDB Envelope load dominated buildings
ILDB Internally load dominated buildings
AHU Air handling unit

INTRODUCTION
3
1 INTRODUCTION
1.1 Background
The current energy consumption in the Gulf region (GCC countries) for air-
conditioning is not sustainable concerning environmental impact (Elsarrag &
Alhorr, 2012). As a result of poorly designed buildings in the GCC countries,
air-conditioning and refrigeration accounts for almost 80 % of the household
electricity (Taleb & Sharples, 2011). Cooling buildings during summer is a
major environmental problem in many Middle Eastern countries (Karrufa &
Adil, 2012). Two problems during the summer period are the high peak in
electricity consumption due to air-conditioning and the low efficiency of the
power plant units due to high inlet air temperature (Hasnain, 1999).
In Saudi Arabia, one of the GCC countries, there is a strong expansion in
housing because of an escalating population growth and a high level of
economic growth (Taleb & Sharples, 2011). The residential sector accounts
according to Taleb & Sharples (2011) for more than half of Saudi Arabia’s
energy demand. In order to meet the needs of the growing population it is
estimated that the country will need to build 2.32 million new homes by 2020
(Sidawi, 2009). The electricity demand is expected to double by the year 2025
in this sector due to the growth in both economy and population combined with
low tariffs (Obaid & Mufti, 2008). The electricity in Saudi Arabia is
completely dependent on burning fossil fuels (Alnatheer, 2006).
Saudi Arabia needs to move towards a more sustainable building approach to
tackle the energy and environmental challenges imposed by the building sector
in the future (Alrashed & Asif, 2015).
BUILDINGS IN ARID DESERT CLIMATE
4
This master thesis originated with that Norconsult (with clients in the Middle
East) recognized a need for more information about how energy efficiency
measures on the building envelope affects the buildings energy consumption.
1.2 Aim and objective
The aim of this study is to obtain a clearer picture of how various measures on
the building envelope affects the energy consumption both during a period of
the year, such as summer, or annual basis, and in this way, optimize the
intended measures to reduce energy consumption in buildings in Saudi Arabia.
The objective is to produce guidelines for the building envelope design that
provides sustainable energy for cooling and heating for a residential building in
Saudi Arabia.
To allow examination of the objective above, the following
research questions are used:
1. What is the climate of Saudi Arabia and how may it impact the
buildings energy consumption?
2. How does it affect the energy consumption if the building is located
at the coast (Jeddah) or in the midlands (Riyadh)?
3. How is the energy consumption affected by different measures on
the building envelope in the climate of Riyadh and Jeddah?
4. How is the energy consumption affected by combined measures on
the building envelope in the climate of Riyadh and Jeddah?
1.3 Scope and limitations
The focus of this study is on the building envelope. The work is limited to one
geometric design of the building. The building used is designed by Norconsult
and used in a previous master thesis which examined the cooling system for a
solar house in the Middle East (Tan & Maerten, 2011).
The simulations are designed to investigate the cooling and heating
requirements of the building and do not take moisture into account. Since
Saudi Arabia has a very varied climate with a wide range of temperatures, two
cities, Riyadh and Jeddah, were chosen for the simulations. Riyadh is situated
INTRODUCTION
5
in desert climate and Jeddah at the west coast of Saudi Arabia with coastal
climate.
The variables that change during the simulations are the building's orientation,
insulation (thickness and material), the surface layer and the type of windows,
building orientation and shading. Account is taken to the additional costs of a
measure on the building envelope compared with the original building.
BUILDINGS IN ARID DESERT CLIMATE
6
2 METHOD
2.1 Choice of method
The method chosen for this Thesis is a simulation study where different
measures on the building envelop is simulated for a chosen building. The
building studied is similar to a typical Saudi Arabian residential building which
is useful since it can help facilitate better understanding of how to work with
Saudi Arabian residential buildings in the future to reduce energy
consumption.
Simulations are carried out, were data is collected and compared to the base
case for each energy efficiency measure tested in this study.
2.2 Approach
In this study, an already planned residential building is used for the study.
Different energy efficiency measures are simulated in IDA ICE one at a time to
finally put together several measures to see how much energy can be saved by
modifying the building envelope. Simulations with measures are compared to a
base case that is similar to a typical Saudi Arabian residential building.
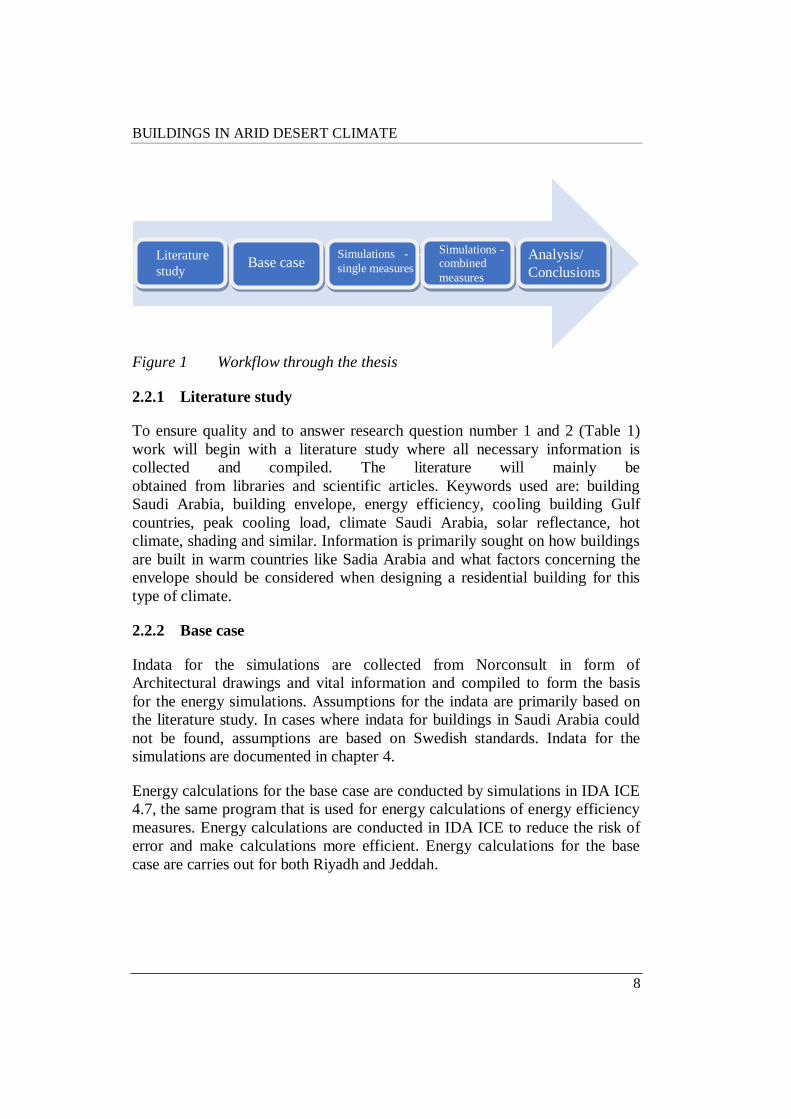
The purpose and how research questions are scheduled to be answered are
shown in Table 1. The workflow is represented in Figure 1.

METHOD
7
Table 1 Aim and methodology for answering the research questions
Research question Aim Method
1
What is the climate of
Saudi Arabia and how
may it impact the
buildings energy
consumption?
To better understand the
conditions for buildings in
Saudi climate and provide a
base for answering the
other research questions.
Literature study
2
How does it affect the
energy consumption if
the building is located
at the coast (Jeddah)
or in the midlands
(Riyadh)?
To enable that a
recommendation of
measures on the building
envelope can be made for
both climates.
Literature study
and energy
simulations
3
How is the energy
consumption affected
by different measures
on the building
envelope in the
climate of Riyadh and
Jeddah?
To identify which measures
on the building envelope
that affects the energy
consumption the most to
make it easier to choose
between measures.
Literature study
and energy
simulations
4
How is the energy
consumption affected
by combined
measures on the
building envelope in
the climate of Riyadh
and Jeddah?
To identify the most
beneficial combination of
measures on the building
envelope.
Literature study
and energy
simulations
BUILDINGS IN ARID DESERT CLIMATE
8
Figure 1 Workflow through the thesis
2.2.1 Literature study
To ensure quality and to answer research question number 1 and 2 (Table 1)
work will begin with a literature study where all necessary information is
collected and compiled. The literature will mainly be
obtained from libraries and scientific articles. Keywords used are: building
Saudi Arabia, building envelope, energy efficiency, cooling building Gulf
countries, peak cooling load, climate Saudi Arabia, solar reflectance, hot
climate, shading and similar. Information is primarily sought on how buildings
are built in warm countries like Sadia Arabia and what factors concerning the
envelope should be considered when designing a residential building for this
type of climate.
2.2.2 Base case
Indata for the simulations are collected from Norconsult in form of
Architectural drawings and vital information and compiled to form the basis
for the energy simulations. Assumptions for the indata are primarily based on
the literature study. In cases where indata for buildings in Saudi Arabia could
not be found, assumptions are based on Swedish standards. Indata for the
simulations are documented in chapter 4.
Energy calculations for the base case are conducted by simulations in IDA ICE
4.7, the same program that is used for energy calculations of energy efficiency
measures. Energy calculations are conducted in IDA ICE to reduce the risk of
error and make calculations more efficient. Energy calculations for the base
case are carries out for both Riyadh and Jeddah.
Literature
study Base case
Simulations - -
single measures
Simulations -combined
measures
Analysis/
Conclusions

METHOD
9
2.2.3 Simulations of energy efficiency measures
Energy simulations of the energy efficiency measures was carried out by
altering the base case building with one measure at the time while documenting
the change in energy use to answer research question 2 and 3. To answer
research question 4, all simulations are performed for both Riyadh and Jeddah.
The measures studied are:
• Modification of external walls
• Window type
• Window area and distribution
• Modification of the roof
• Modification of the foundation
• Shading
• Exterior surfaces
• Infiltration rate
• Thermal bridges
All measures studied are measures on the building envelope. There are no
other measures studied since this study focuses on measures on the building
envelope.
2.2.4 Energy simulation tool
There are several simulation tools on the market for building energy
simulations. IDA ICE 4.7 (Indoor Climate and Energy) was chosen to perform
energy simulations in this study. IDA ICE was chosen partly because it is used
BUILDINGS IN ARID DESERT CLIMATE
10
at Luleå University of Technology and thereby it is beneficial because of
available support. Another reason for choosing IDA ICE is the fact that IFC
models are supported and can be imported from for example Revit. The
validity of the program was considered before choosing. A test series
comparing IDA ICE 4 to other simulation software indicate that IDA ICE
performs on similar level as analytical/semi-analytical models and other
software programs (EQUA, 2010).
2.3 Reliability and validity
The reliability of this report is mainly based on that IDA ICE is validated by
EN 15265-2007 and will give the same result time after time as long as the
same in data is used for all cases.
In order to ensure that the focus of the work is properly established, research
questions to be answered are listed in the beginning of the work. The selected
energy calculation program calculates the required quantities to investigate the
impact on energy demand. Some calculations have been done by hand to
achieve data to be used in energy simulations.
LITERATURE STUDY
11
3 LITERATURE STUDY
3.1 The Climate of Saudi Arabia
The climate in Saudi Arabia is very diverse between different zones during the
same period (Hasnaina et al, 1999). The hot-arid climate in the Midlands is
characterized by extreme hot and dry summers with large diurnal temperature
ranges and moderately cold winters (Al-Homound, 2004). Diurnal swings
during summer of 15 – 20°C or more are common with temperatures reaching
below 15°C (Meir & Roaf, 2002). The Midlands are dry with temperatures
between 47°C in summer and 2°C in winter (Hasnaina et al, 1999). Hot spells
are a common occurrence of large parts of the deserts (Meir & Roaf, 2002).
The skies are clear for the most part of the year (Al-Homound, 2004).
Areas at the coast are moist with temperature ranges between 40°C during
summer and 15°C in winter (Hasnaina et al, 1999). The coastal area is
characterized by hot and humid summers and mild short winters, which makes
summer the main concern for building designer (Al-Homound, 2004).
Rainfalls are rare in most parts of Saudi Arabia (Ahmed, 1997).
Because of the harsh climate of Saudi Arabia, residential buildings on average,
consume more than half of the total consumed energy (Al-Saadi & Budaiwi,
2007). A substantial share of energy goes to the air-conditioning of buildings
(Al-Homound, 2004). Of the residential building energy consumption, the use
of cooling and heating system accounts for 62 % in hot-humid climate and 76
% in hot-dry climate of Saudi Arabia (Al-Saadi & Budaiwi, 2007). Cooling
buildings in summer is one of the main environmental problems for architects
and builders in many Middle East countries (Kharrufa, 2012). Hot spells
BUILDINGS IN ARID DESERT CLIMATE
12
combined with dust storms may even prevent the use of outdoor spaces and the
opening of windows to allow for comfort ventilation (Meir & Roaf, 2002).
Horizontal surfaces will receive the gratest intensity of solar radiation. Of the
verical surfaces, east and west will receive the most solar radiation. East facing
surfaces receiving radiation in the morning and west facing surfaces in the
afternoon. North and south facing surfaces will receive solar radiation for short
periods of the year. In the northen hemisphere, northfacing surfaces will
receive more radiation during the hot season. (Koch-Nielsen, 2002)
3.2 The Building Envelope
Most Saudi residential are concrete buildings (81.9 %), followed by
brick/block houses (16.6 %) and houses made of mud or stone are rare (Salam
et al., 2014).
Due to the absence of regulations and standards concerning energy saving
measures for buildings and the lack of economic gains, most building in Saudi
Arabia are not well insulated (Budaiwi et al, 2002). Proper use of thermal
insulation in the building envelope can both reduce energy requirements and
produce lower peak loads (Al-Homound, 2004). The energy use of buildings
can be put into two categories; Envelope Load Dominated Buildings (ELDB)
such as houses and Internally Load Dominated Buildings (ILDB) such as
offices, schools and stores (Aboulnaga, 2006).
The impact of building envelope design on buildings in hot climate was studied
by Al-Hoomound (2004) with the conclusion that proper design of the building
envelope can improve thermal performance significantly, especially for
envelope load dominated building (ELDB). Al-Hoomound (2004) recommend
wall and roof insulation for buildings in all climates to gain thermally
comfortable spaces with less energy requirements.
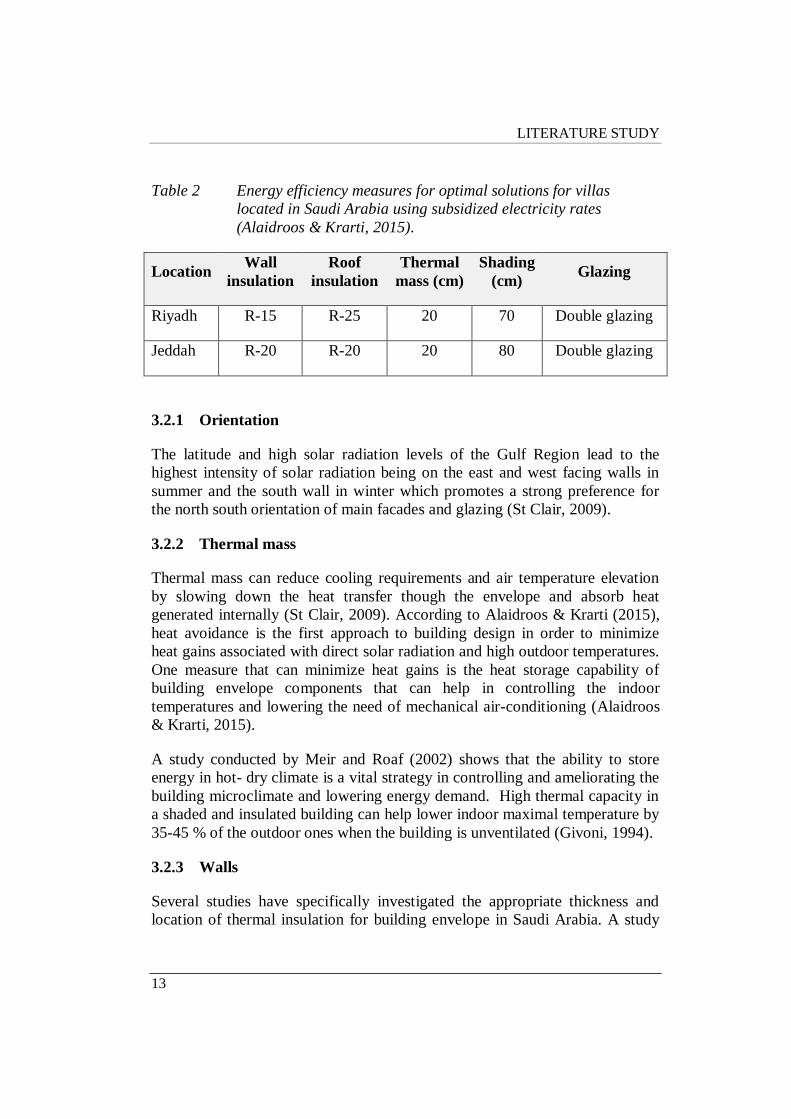
Optimal energy efficiency measures on the envelope based on simulations by
Alaidros & Krarti (2015) for villas in Riyadh and Jeddah with respect to the
costs are represented in Table 2.
LITERATURE STUDY
13
Table 2 Energy efficiency measures for optimal solutions for villas
located in Saudi Arabia using subsidized electricity rates
(Alaidroos & Krarti, 2015).
Location Wall
insulation
Roof
insulation
Thermal
mass (cm)
Shading
(cm) Glazing
Riyadh R-15 R-25 20 70 Double glazing
Jeddah R-20 R-20 20 80 Double glazing
3.2.1 Orientation
The latitude and high solar radiation levels of the Gulf Region lead to the
highest intensity of solar radiation being on the east and west facing walls in
summer and the south wall in winter which promotes a strong preference for
the north south orientation of main facades and glazing (St Clair, 2009).
3.2.2 Thermal mass
Thermal mass can reduce cooling requirements and air temperature elevation
by slowing down the heat transfer though the envelope and absorb heat
generated internally (St Clair, 2009). According to Alaidroos & Krarti (2015),
heat avoidance is the first approach to building design in order to minimize
heat gains associated with direct solar radiation and high outdoor temperatures.
One measure that can minimize heat gains is the heat storage capability of
building envelope components that can help in controlling the indoor
temperatures and lowering the need of mechanical air-conditioning (Alaidroos
& Krarti, 2015).
A study conducted by Meir and Roaf (2002) shows that the ability to store
energy in hot- dry climate is a vital strategy in controlling and ameliorating the
building microclimate and lowering energy demand. High thermal capacity in
a shaded and insulated building can help lower indoor maximal temperature by
35-45 % of the outdoor ones when the building is unventilated (Givoni, 1994).
3.2.3 Walls
Several studies have specifically investigated the appropriate thickness and
location of thermal insulation for building envelope in Saudi Arabia. A study
BUILDINGS IN ARID DESERT CLIMATE
14
conducted by Saleh (1990), investigating the positioning of the thermal
insulation within the wall in Riyadh’s climate, concluded that thermal
insulation with thickness of 50-100 mm located within the outside layer of the
exterior wall gave the best energy performance in reducing cooling loads.
However, the study also showed that when using air-conditioning system,
placing the thermal insulation within the inner side of the building mass would
result in reaching the standard level of thermal comfort faster than when it is
placed on the outer side. According to Khaeseh et al (2015), based on
calculations for a residential building in Qatar, the required cooling can be
reduced 27 % by adding less than 2 cm of polyurethane to the external walls.
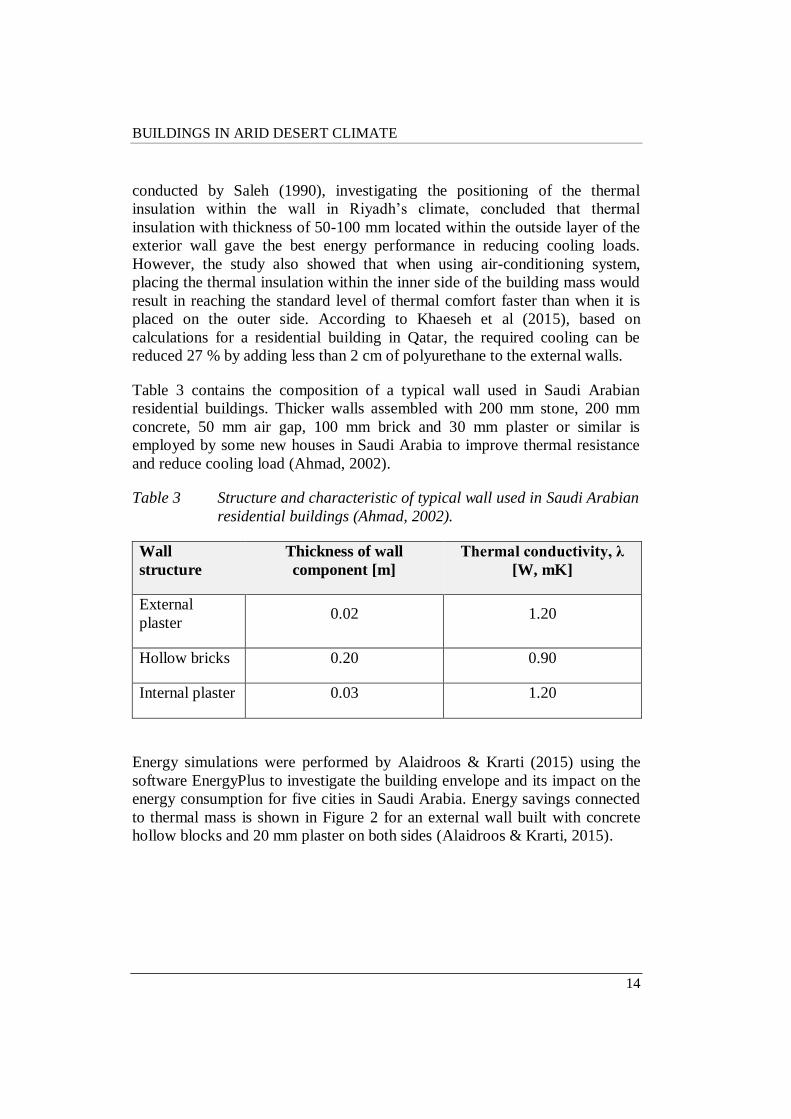
Table 3 contains the composition of a typical wall used in Saudi Arabian
residential buildings. Thicker walls assembled with 200 mm stone, 200 mm
concrete, 50 mm air gap, 100 mm brick and 30 mm plaster or similar is
employed by some new houses in Saudi Arabia to improve thermal resistance
and reduce cooling load (Ahmad, 2002).
Table 3 Structure and characteristic of typical wall used in Saudi Arabian
residential buildings (Ahmad, 2002).
Wall
structure
Thickness of wall
component [m]
Thermal conductivity, λ
[W, mK]
External
plaster 0.02 1.20
Hollow bricks 0.20 0.90
Internal plaster 0.03 1.20
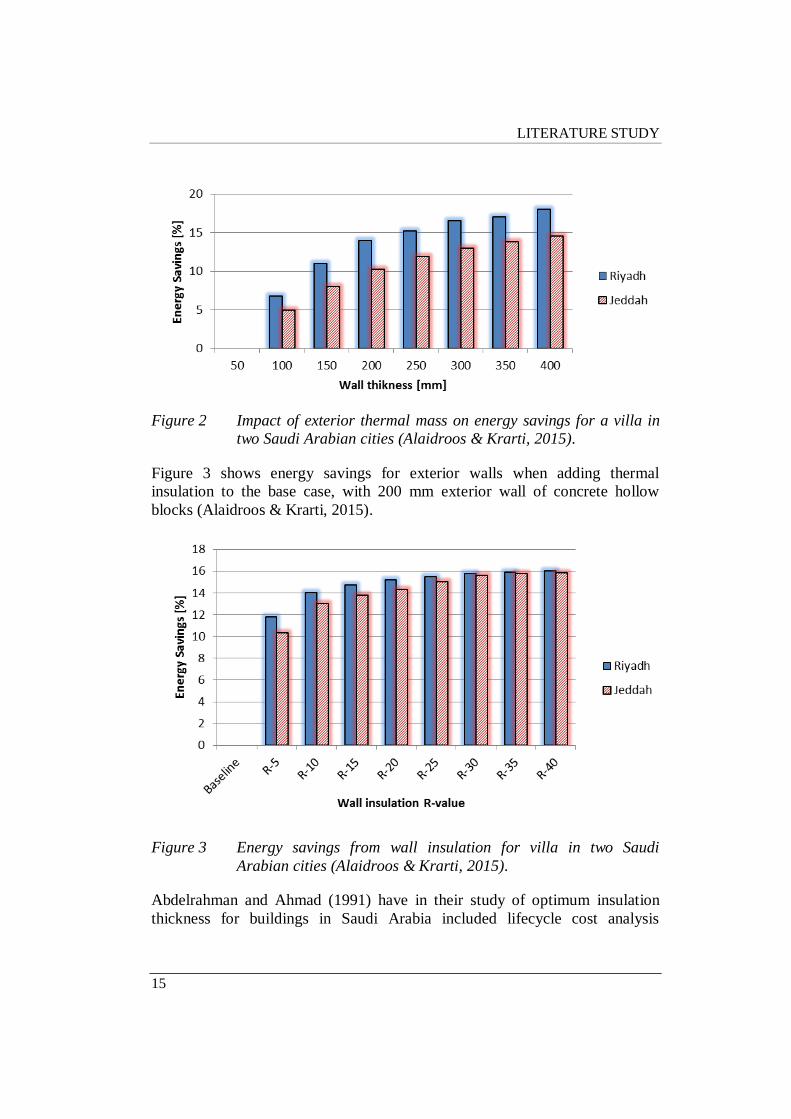
Energy simulations were performed by Alaidroos & Krarti (2015) using the
software EnergyPlus to investigate the building envelope and its impact on the
energy consumption for five cities in Saudi Arabia. Energy savings connected
to thermal mass is shown in Figure 2 for an external wall built with concrete
hollow blocks and 20 mm plaster on both sides (Alaidroos & Krarti, 2015).
LITERATURE STUDY
15
Figure 2 Impact of exterior thermal mass on energy savings for a villa in
two Saudi Arabian cities (Alaidroos & Krarti, 2015).
Figure 3 shows energy savings for exterior walls when adding thermal
insulation to the base case, with 200 mm exterior wall of concrete hollow
blocks (Alaidroos & Krarti, 2015).
Figure 3 Energy savings from wall insulation for villa in two Saudi
Arabian cities (Alaidroos & Krarti, 2015).
Abdelrahman and Ahmad (1991) have in their study of optimum insulation
thickness for buildings in Saudi Arabia included lifecycle cost analysis
BUILDINGS IN ARID DESERT CLIMATE
16
concluded that a wall with hollow concrete blocks needs a thicker insulation
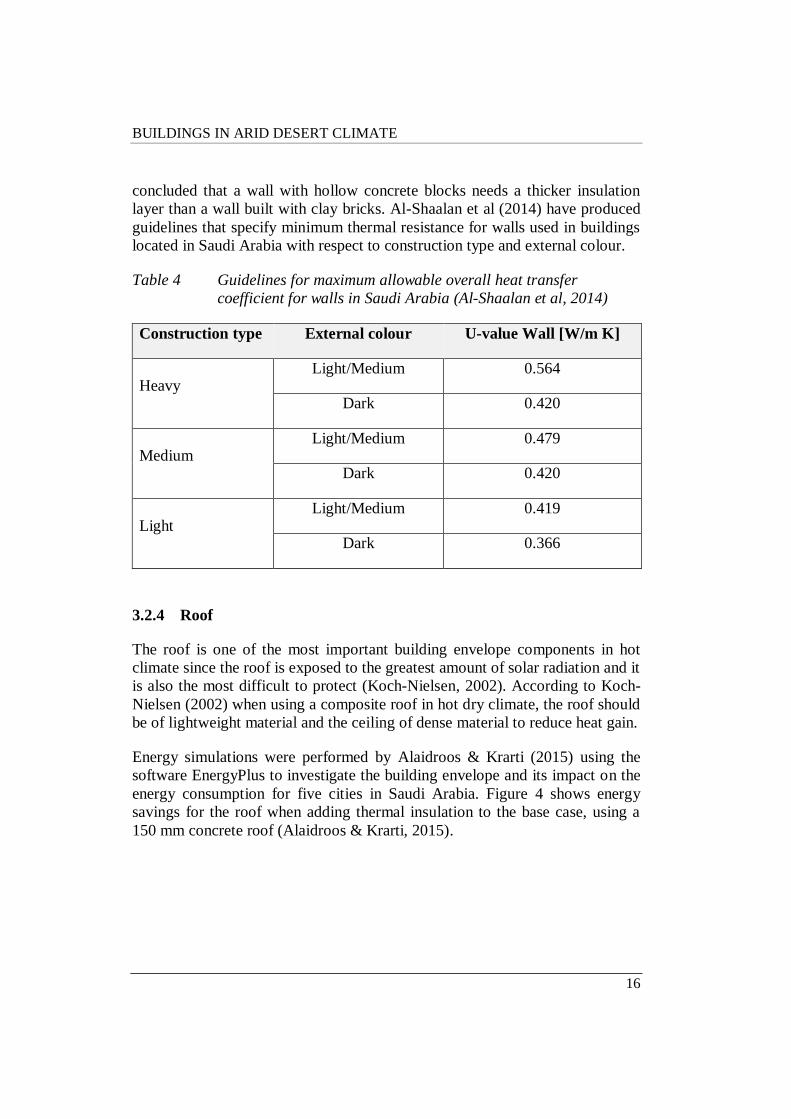
layer than a wall built with clay bricks. Al-Shaalan et al (2014) have produced
guidelines that specify minimum thermal resistance for walls used in buildings
located in Saudi Arabia with respect to construction type and external colour.
Table 4 Guidelines for maximum allowable overall heat transfer
coefficient for walls in Saudi Arabia (Al-Shaalan et al, 2014)
Construction type External colour U-value Wall [W/m K]
Heavy Light/Medium 0.564
Dark 0.420
Medium Light/Medium 0.479
Dark 0.420
Light Light/Medium 0.419
Dark 0.366
3.2.4 Roof
The roof is one of the most important building envelope components in hot
climate since the roof is exposed to the greatest amount of solar radiation and it
is also the most difficult to protect (Koch-Nielsen, 2002). According to Koch-
Nielsen (2002) when using a composite roof in hot dry climate, the roof should
be of lightweight material and the ceiling of dense material to reduce heat gain.
Energy simulations were performed by Alaidroos & Krarti (2015) using the
software EnergyPlus to investigate the building envelope and its impact on the
energy consumption for five cities in Saudi Arabia. Figure 4 shows energy
savings for the roof when adding thermal insulation to the base case, using a
150 mm concrete roof (Alaidroos & Krarti, 2015).

LITERATURE STUDY
17
Figure 4 Energy savings from roof insulation for villa in two Saudi
Arabian cities (Alaidroos & Krarti, 2015).
Al-Shaalan et al (2014) have produced guidelines that specify minimum
thermal resistance for roofs used in buildings located in Saudi Arabia with
respect to construction type and external colour.
Table 5 Guidelines for maximum allowable overall heat transfer
coefficient for roofs in Saudi Arabia (Al-Shaalan et al, 2014)
Construction type External colour U-value Roof [W/m K]
Heavy Light/Medium 0.395
Dark 0.251
Medium Light/Medium 0.338
Dark 0.192
Light Light/Medium 0.276
Dark 0.165

BUILDINGS IN ARID DESERT CLIMATE
18
Al-Sanea (2002) compared in a study six variants of typical roof structures
used in building constructions in Saudi Arabia and came to the conclusion that
reference daily heat transfer through the roof can be reduced by up to 45 % by
adding insulation when compared with a reference uninsulated roof section
using heavy weight concrete foam as a levelling layer. Comparing moulded
polystyrene, extruded polystyrene, polyurethane and lightweight concrete
foam, the greatest improvement on the heat transfer was given when using
light weight concrete foam (Al-Sanea, 2002).
3.2.5 Solar Reflection of Walls and Roofs
The characteristics of the envelope finish layer can affect the energy
consumption of a building. A study performed by Cheng et al. (2005)
concluded that the envelope colour has an impact on the energy demand,
varying depending on solar radiation and thermal mass. The lighter the
building and the higher level of solar radiation, the more sensitive is the
building performance to the envelope colour (Cheng et al., 2005). An
experiment (Cheng et al., 2005) performed in hot-humid climate showed that
air temperature inside an unventilated room without windows could have a ten
degreed higher temperature when it was dark compared to white colour.
During clear sky situations, it has been discovered that from 20 % to 95 % of
solar absorbance is typically absorbed by the roof surface (Dabaieh et al.,
2015). A study evaluating the effect of solar reflection of the roof surface
conducted by Suehrcke et al. (2008) suggest that a significant reduction in
downward heat flow can be achieved by using a ligth or reflective surface
colour instead of a dark one. The study is however restricted to locations where
there are no heating requirements. That the effect given by ligth or reflective
surface colour will be reduced over time due to aging and weather conditions is
considered by Suehrcke et al. (2008), and a new relationship for the solar
absorptance of new and aged materials are suggested.
3.2.6 Windows
With the highest intensity of solar radiation in Saudi Arabia being on the east
and west façade during summer and the south wall in winter most windows
should be oriented to the north and south. Simple window shading is easy to
facilitate as a result of the high solar altitude and greater reflection of solar
radiation from the façade due to the lower angle of incidence. (St Clair, 2009)
The article by St Clair (2009) is based on the climate of the United Arab
Emirates, neighbour country to Saudi Arabia.
LITERATURE STUDY
19
West and east orientations have similar absolute illumination although in terms
of thermal effects, the east orientation is advantageous (Ouahrani, 2000).
According to Ouahrani (2000) special attention should be paid to west oriented
windows concerning direct solar radiation, to avoid overheating and vertical
shading devices are recommended. The research conducted by Ouahrani
(2000) is based on the climate of Ghardaïa which has a hot desert climate
similar to the climate of Riyadh.
Ouahrani (2000) classifies window orientations in an order of preference of
daylight and thermal comfort:
- South orientation of windows
- East orientation of windows
- West orientation of windows
- North orientation of windows
In terms of illuminance north orientation is not favourable because of low
daylighting (Ouahrani, 2000). However, north facing facades provides an
opportunity for a more open façade and provide controlled daylight and views,
whilst minimising solar heat gains (St Clair, 2009).
A study conducted by Aboulnaga (2006) concerning the use and misuse of
glass as a building material in the Gulf region indicate that glazed buildings
with shading coefficient (SC) below 0.2 are appropriate to ensure good
daylight factor and daylight level, although large areas of glazing is not
recommended, even if the building’s façade is oriented north-south.
Guidelines for buildings in Saudi Arabia have been designed by Al-Shaalan et
al (2014) for maximal window to wall ratio for different glazing types based on
U-value and SHGC (Solar heat gain coefficient).

BUILDINGS IN ARID DESERT CLIMATE
20
Table 6 Guidelines for allowable window to wall ratio (Al-Shaalan et al,
2014)
Glazing Type U-value
[W/m K] SHGC Window to Wall Ratio [%]
East West South North
6 mm, single, clear 6.08 0.710 < 5 < 3 < 4 < 5
6 mm, single,
reflective 6.42 0.342 7 6 8 9
6 mm, double, tinted 3.43 0.370 12 10 9 13
6 mm double,
reflective 3.35 0.241 20 17 22 18
The study conducted by Alaidroos & Krarti (2015) demonstrates up to 10 %
energy savings when improving the U-value and solar heat gain coefficient of
the window compared to single glaze window using 13 % window to wall
ratio.
Low-emissivity glazing
Low emissivity glazing is an assembly of thin layers including at least one
metal layer reflecting infrared rays (Decroupet & Depauw, 2010). The
application of a typical low emissivity coating is able to change the original
longwave emissivity of around 0.9 to less than 0.1 (Chow et al., 2010).
3.2.7 Daylight and Shading
The use of shading minimizes the incident solar radiation and can reduce the
peak-cooling load in buildings (Al-Shaalan et al, 2014). Two options to
achieve a shading effect are window overhangs or shutters. The overhang is
according to Ouahrani (2000) less effective than the shutters in terms of
climate control. However, shutters require daily minipulation for an efficient
effect, a fixed overhang does not (Ouahrani, 2000).
LITERATURE STUDY
21
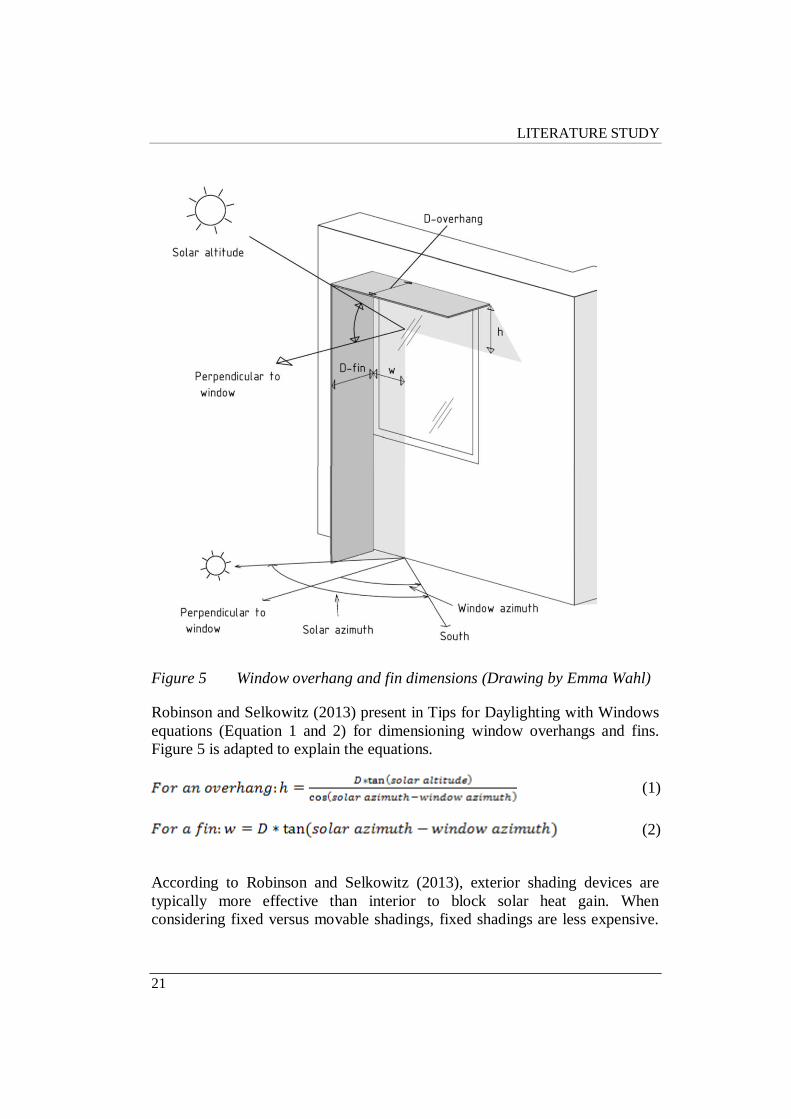
Figure 5 Window overhang and fin dimensions (Drawing by Emma Wahl)
Robinson and Selkowitz (2013) present in Tips for Daylighting with Windows
equations (Equation 1 and 2) for dimensioning window overhangs and fins.
Figure 5 is adapted to explain the equations.
(1)
(2)
According to Robinson and Selkowitz (2013), exterior shading devices are
typically more effective than interior to block solar heat gain. When
considering fixed versus movable shadings, fixed shadings are less expensive.

BUILDINGS IN ARID DESERT CLIMATE
22
However, movable devices, especially automatically controlled devices are
more efficient (Robin & Selkowitz, 2013).
Koch-Nielsen (2002) developed guidelines for the built environment in hot
climate including guidelines for shading devices. There are two basic forms of
shading devices, horizontal and vertical, that should be adopted for different
orientations (Koch-Nielsen, 2002). According to Koch-Nielsen (2002) a
horizontal shading device can be used if the sun passes high in the sky which is
effective for north and south facing windows. When the sun passes low a
vertical shading device can be used to exclude solar radiation, which is
effective for east and west facing windows (Koch-Nielsen, 2002).
Window overhangs are studied by Alaidroos & Krarti (2015) in search for
optimum measures on the building envelope for villas in Saudi Arabia. Energy
savings achieved by adding window overhangs with a depth of 0.1 – 1.0 m are
up to 6.0 % for Riyadh and up to 6.5 % for Jeddah according to Alaidroos &
Krarti (2015). The energy savings are based on a typical house built with
masonry materials in Dhahran, Saudi Arabia, with 13 % window to wall ratio
(Alaidroos & Krarti, 2015).
Louvres
An alternative to window overhangs is using louvres (divided overhangs). A
window with louvers provides shading, blocks uncomfortable direct sun,
softens window daylight contrast and provides a better light distribution
(Djamel, 2000).
3.2.8 Infiltration rate
There are several rating systems in th Gulf region specifying standard
infiltration rate for residetual buildings. The standard value for infiltration vary
between the different standards from 0.9 to 7.7 air changes per hour at 50 Pa
(Whistler, 2014). The rating systems listed by Whistler (2014) are the Abu
Dhabi Municipal Code, Masdar City Performance Specification, Dubai Green
Building Regulations and Estidama Pearl Building Rating System.
3.3 Saudi households
The number of occupants and their behaviour has a significant impact on the
buildings energy use. The average household in Saudi Arabia consists of 5.6
family members (Salam et al., 2014
SIMULATION STUDY
23
4 SIMULATION STUDY
4.1 Case
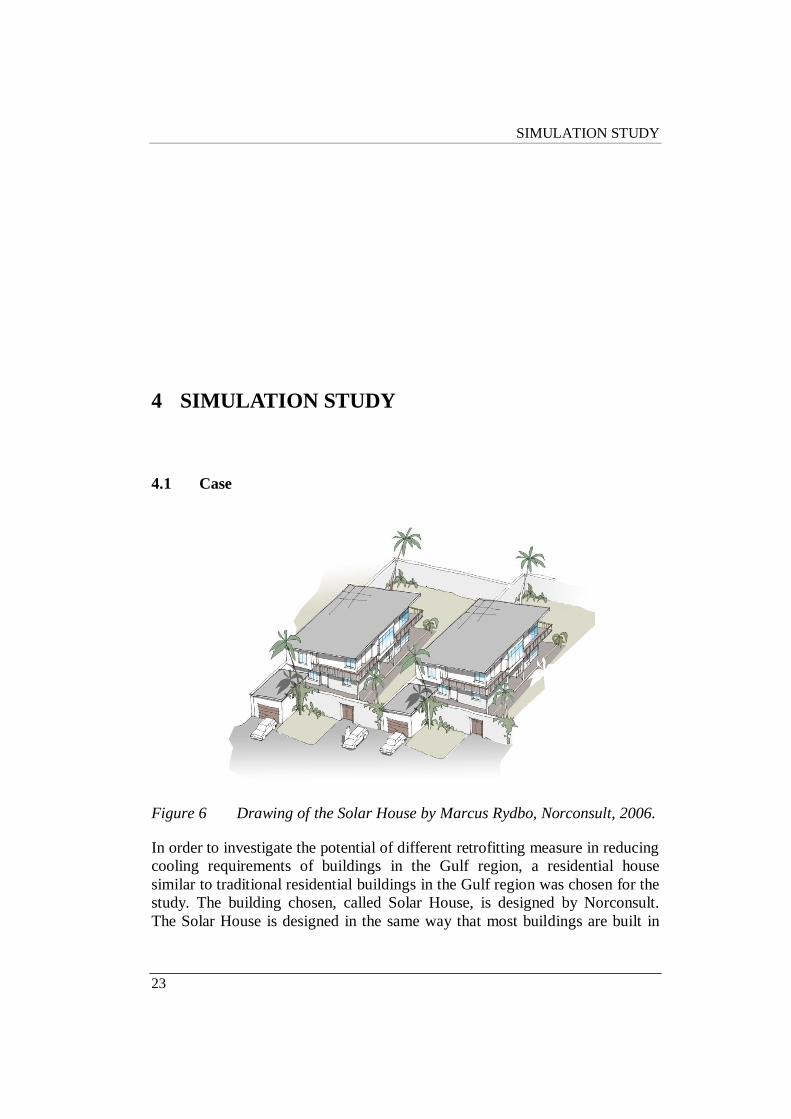
Figure 6 Drawing of the Solar House by Marcus Rydbo, Norconsult, 2006.
In order to investigate the potential of different retrofitting measure in reducing
cooling requirements of buildings in the Gulf region, a residential house
similar to traditional residential buildings in the Gulf region was chosen for the
study. The building chosen, called Solar House, is designed by Norconsult.
The Solar House is designed in the same way that most buildings are built in
BUILDINGS IN ARID DESERT CLIMATE
24
the Gulf Region, but with some variations to achieve better energy efficiency
than typical villas in the region.
Table 7 Building facts, Solar House
Building facts
Floor area 247 m2
Rooms 1st floor Entrance hall, Dining room/Living room, WC, Kitchen,
Staff room, Staff WC
Rooms 2nd floor Master bedroom, Bedroom*2, Bathroom*2, Ladies
Room
To achieve a base case for comparison, the Solar House design is used with
typical Saudi Arabian construction of the building envelope.
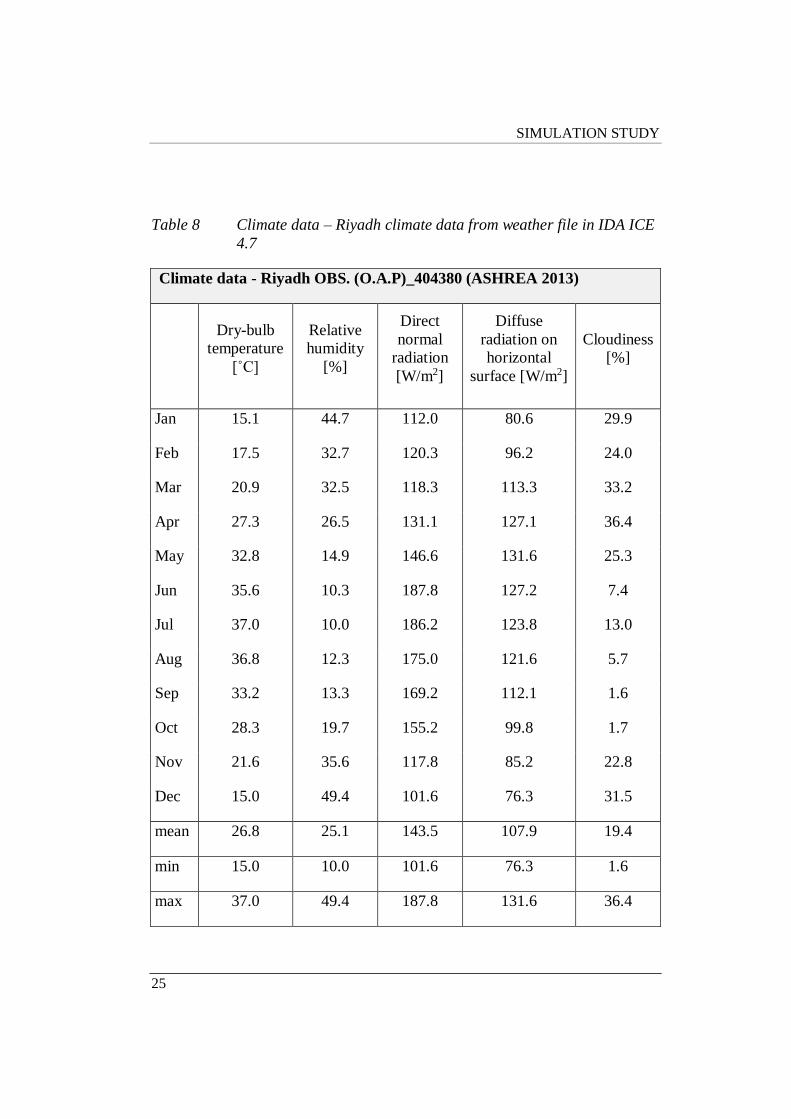
4.2 Climate data
Climate data for the cities Riyadh and Jeddah located in Saudi Arabia are
represented in Table 8 and 9. Weather data shown in Table 8 and 9 are
retrieved from the weather files used for simulations in IDA ICE 4.7.
SIMULATION STUDY
25
Table 8 Climate data – Riyadh climate data from weather file in IDA ICE
4.7
Climate data - Riyadh OBS. (O.A.P)_404380 (ASHREA 2013)
Dry-bulb
temperature
[˚C]
Relative
humidity
[%]
Direct
normal
radiation
[W/m2]
Diffuse
radiation on
horizontal
surface [W/m2]
Cloudiness
[%]
Jan 15.1 44.7 112.0 80.6 29.9
Feb 17.5 32.7 120.3 96.2 24.0
Mar 20.9 32.5 118.3 113.3 33.2
Apr 27.3 26.5 131.1 127.1 36.4
May 32.8 14.9 146.6 131.6 25.3
Jun 35.6 10.3 187.8 127.2 7.4
Jul 37.0 10.0 186.2 123.8 13.0
Aug 36.8 12.3 175.0 121.6 5.7
Sep 33.2 13.3 169.2 112.1 1.6
Oct 28.3 19.7 155.2 99.8 1.7
Nov 21.6 35.6 117.8 85.2 22.8
Dec 15.0 49.4 101.6 76.3 31.5
mean 26.8 25.1 143.5 107.9 19.4
min 15.0 10.0 101.6 76.3 1.6
max 37.0 49.4 187.8 131.6 36.4

BUILDINGS IN ARID DESERT CLIMATE
26
Table 9 Jeddah – climate data from weather file in IDA ICE 4.7
Climate data - SAU_JEDDAH(KING-ABDUL)_410240_IW2 (ASHREA
2011)
Dry-bulb
temperature
[˚C]
Relative
humidity
[%]
Direct
normal
radiation
[W/m2]
Diffuse radiation
on horizontal
surface [W/m2]
Cloudiness
[%]
Jan 23.5 58.2 116.6 89.3 23.5
Feb 23.5 61.1 132.9 103.7 13.0
Mar 24.9 59.0 142.5 120.7 9.3
Apr 28.0 58.7 158.4 128.2 8.5
May 30.2 54.7 165.2 131.3 7.6
Jun 31.2 61.4 171.4 130.7 8.3
Jul 32.6 50.8 167.9 127.9 11.4
Aug 32.5 56.6 149.4 128.1 17.9
Sep 30.7 66.2 136.1 121.1 17.8
Oct 29.9 67.0 141.5 107.6 2.1
Nov 27.2 65.4 124.7 94.2 13.3
Dec 24.6 60.6 106.7 85.5 24.4
mean 28.3 59.9 142.8 114.1 13.1
min 23.5 50.8 106.7 85.5 2.1
max 32.6 67.0 171.4 131.3 24.4

SIMULATION STUDY
27
4.3 Base case - Building parameters
Buildings parameters are listed below. These settings are the same for Riyadh
and Jeddah. However, their climate settings are always different for the two
cities with setting corresponding to each city.
4.3.1 Exterior walls
The exterior walls used in the base case are similar to the typical Saudi Arabian
walls. Example of a typical Saudi Arabian wall is shown in Table 3 in the
literature study. Properties of the base case wall are represented in Table 10.
Table 10 Exterior Wall - Base Case
Exterior Wall - Base Case
Material Thickness
[mm]
Thermal
conductivity, λ
[W/m K]
Specific Heat
Capacity, c
[J/kg K]
Density,
ρ [kg/m3]
External cement
plaster 20 0.720* 800* 1860*
Hollow concrete
block – CB01 200 0.812* 837* 1922*
Internal cement
plaster 30 0.720* 800* 1860*
*Material properties retrieved from IES (2014)
4.3.2 Foundation
The base case foundation used is a 200 mm concrete slab with properties
shown in Table 11. The base case middle slab is constructed with 200 mm
concrete with the same properties as for the base case foundation.
BUILDINGS IN ARID DESERT CLIMATE
28
Table 11 Base Case Slab
Base Case Slab
Material Thickness
[mm]
Thermal
conductivity, λ
[W/m K]
Specific Heat
Capacity, c [J/kg
K]
Density,
ρ [kg/m3]
Concrete 200 1.70* 880* 2300*
*Material properties retrieved from IDA ICE 4.7
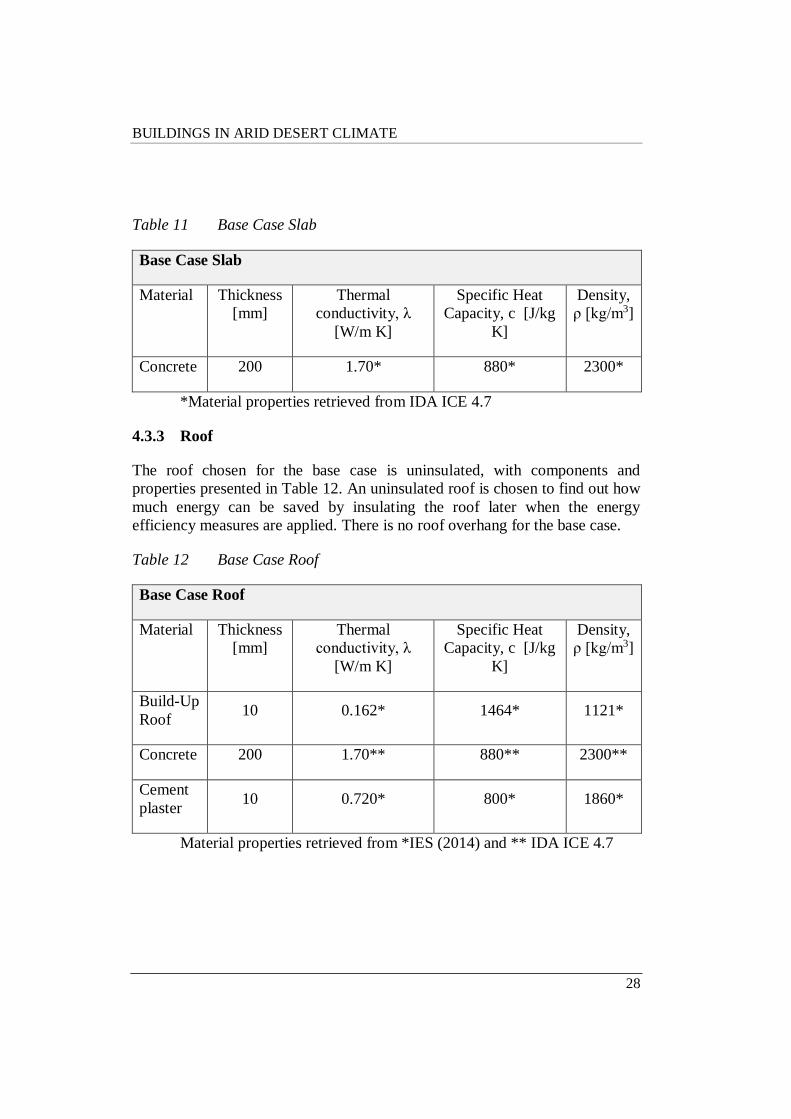
4.3.3 Roof
The roof chosen for the base case is uninsulated, with components and
properties presented in Table 12. An uninsulated roof is chosen to find out how
much energy can be saved by insulating the roof later when the energy
efficiency measures are applied. There is no roof overhang for the base case.
Table 12 Base Case Roof
Base Case Roof
Material Thickness
[mm]
Thermal
conductivity, λ
[W/m K]
Specific Heat
Capacity, c [J/kg
K]
Density,
ρ [kg/m3]
Build-Up
Roof 10 0.162* 1464* 1121*
Concrete 200 1.70** 880** 2300**
Cement
plaster 10 0.720* 800* 1860*
Material properties retrieved from *IES (2014) and ** IDA ICE 4.7
SIMULATION STUDY
29
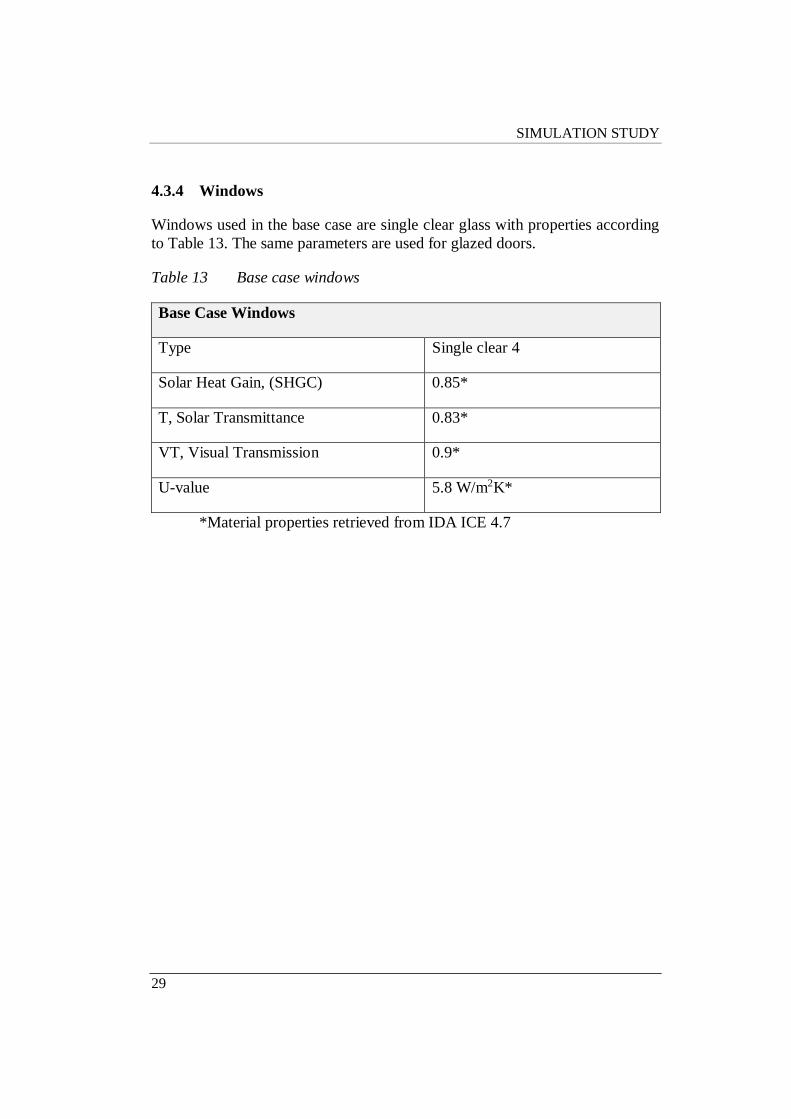
4.3.4 Windows
Windows used in the base case are single clear glass with properties according
to Table 13. The same parameters are used for glazed doors.
Table 13 Base case windows
Base Case Windows
Type Single clear 4
Solar Heat Gain, (SHGC) 0.85*
T, Solar Transmittance 0.83*
VT, Visual Transmission 0.9*
U-value 5.8 W/m2K*
*Material properties retrieved from IDA ICE 4.7
BUILDINGS IN ARID DESERT CLIMATE
30
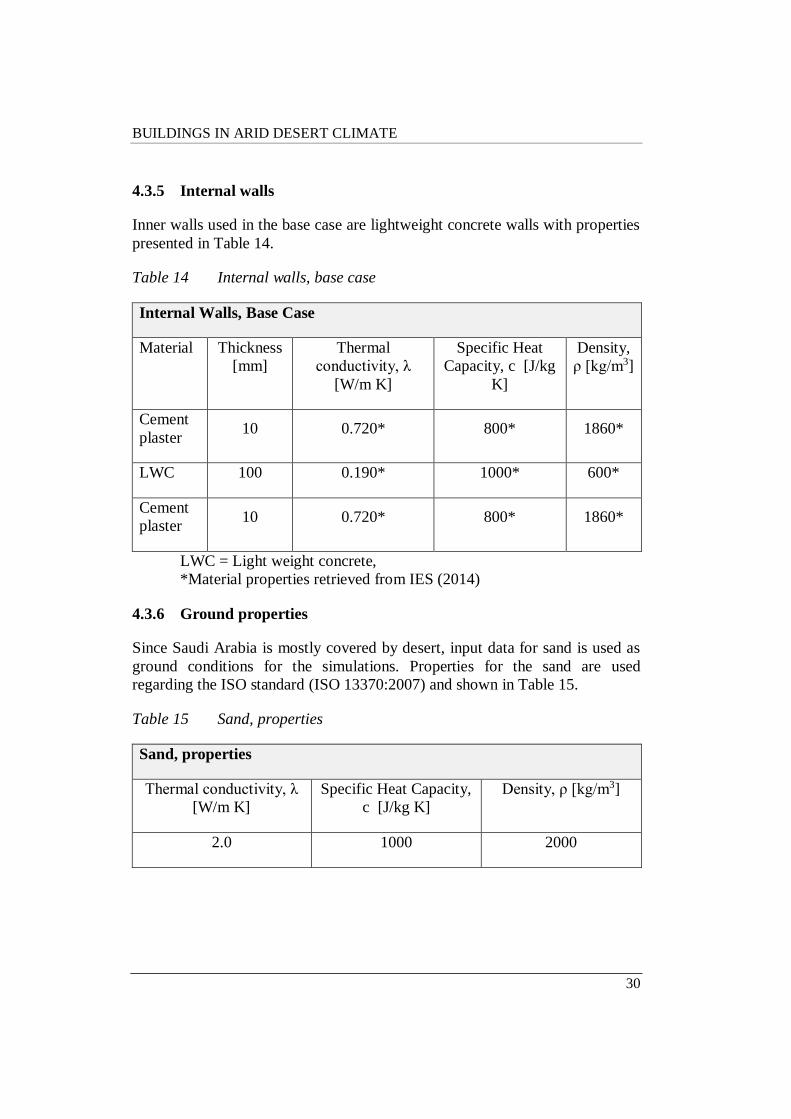
4.3.5 Internal walls
Inner walls used in the base case are lightweight concrete walls with properties
presented in Table 14.
Table 14 Internal walls, base case
Internal Walls, Base Case
Material Thickness
[mm]
Thermal
conductivity, λ
[W/m K]
Specific Heat
Capacity, c [J/kg
K]
Density,
ρ [kg/m3]
Cement
plaster 10 0.720* 800* 1860*
LWC 100 0.190* 1000* 600*
Cement
plaster 10 0.720* 800* 1860*
LWC = Light weight concrete,
*Material properties retrieved from IES (2014)
4.3.6 Ground properties
Since Saudi Arabia is mostly covered by desert, input data for sand is used as
ground conditions for the simulations. Properties for the sand are used
regarding the ISO standard (ISO 13370:2007) and shown in Table 15.
Table 15 Sand, properties
Sand, properties
Thermal conductivity, λ
[W/m K]
Specific Heat Capacity,
c [J/kg K]
Density, ρ [kg/m3]
2.0 1000 2000
SIMULATION STUDY
31
4.3.7 Surfaces
All surfaces for the base case are set to default surface in IDA ICE.
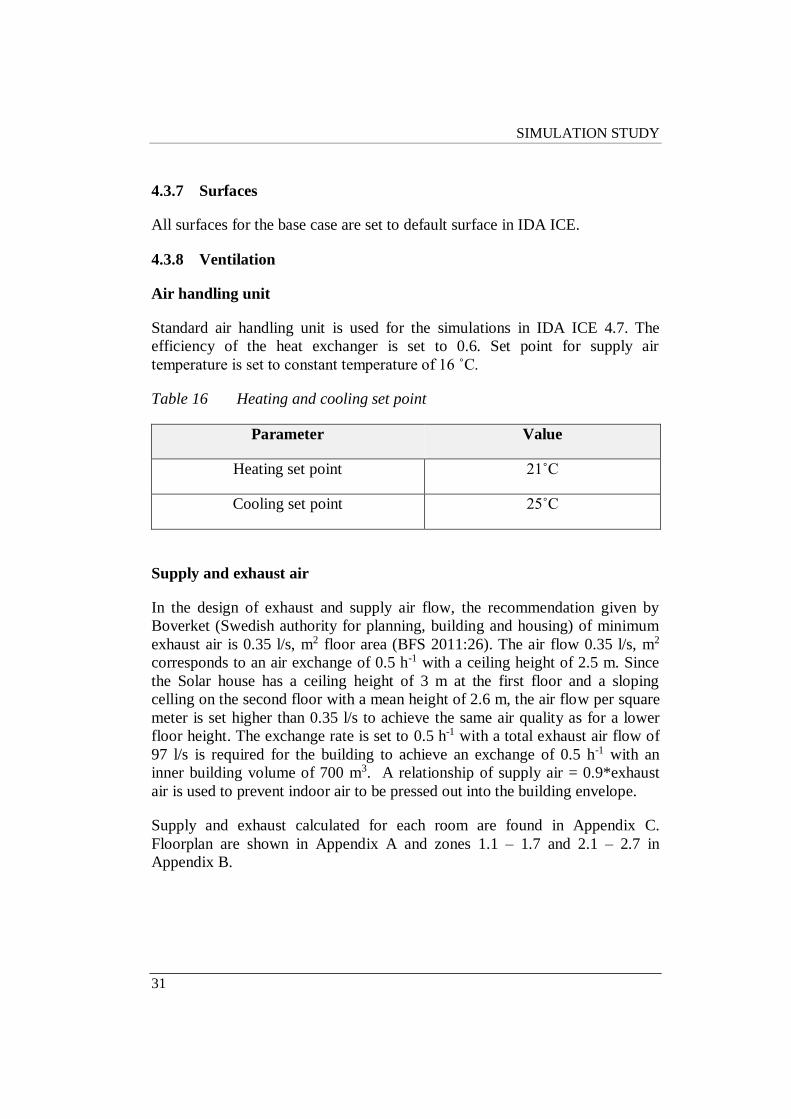
4.3.8 Ventilation
Air handling unit
Standard air handling unit is used for the simulations in IDA ICE 4.7. The
efficiency of the heat exchanger is set to 0.6. Set point for supply air
temperature is set to constant temperature of 16 ˚C.
Table 16 Heating and cooling set point
Parameter Value
Heating set point 21˚C
Cooling set point 25˚C
Supply and exhaust air
In the design of exhaust and supply air flow, the recommendation given by
Boverket (Swedish authority for planning, building and housing) of minimum
exhaust air is 0.35 l/s, m2 floor area (BFS 2011:26). The air flow 0.35 l/s, m2
corresponds to an air exchange of 0.5 h-1 with a ceiling height of 2.5 m. Since
the Solar house has a ceiling height of 3 m at the first floor and a sloping
celling on the second floor with a mean height of 2.6 m, the air flow per square
meter is set higher than 0.35 l/s to achieve the same air quality as for a lower
floor height. The exchange rate is set to 0.5 h-1 with a total exhaust air flow of
97 l/s is required for the building to achieve an exchange of 0.5 h-1 with an
inner building volume of 700 m3. A relationship of supply air = 0.9*exhaust
air is used to prevent indoor air to be pressed out into the building envelope.
Supply and exhaust calculated for each room are found in Appendix C.
Floorplan are shown in Appendix A and zones 1.1 – 1.7 and 2.1 – 2.7 in
Appendix B.
BUILDINGS IN ARID DESERT CLIMATE
32
4.3.9 Heating and cooling system
A standard plant is chosen for the heating and cooling system in IDA ICE 4.7
using pre-set parameters. Ideal cooler and heater with pre-set parameters are
selected for the room units.
4.3.10 Pressure coefficients and infiltration rate
To retrieve the pressure coefficients for the model in IDA ICE 4.7, auto fill is
used for a semi-exposed building. The infiltration rate is set at two air changes
per hour.

SIMULATION STUDY
33
4.3.11 Thermal bridges
Since no standards for thermal bridges concerning buildings in the gulf region
was found and standards for definition of thermal bridges vary widely, typical
values for thermal bridges pre-set in IDA ICE 4.7 was adopted for the base
case. Type of thermal bridges and their properties are shown in Table 17.
Table 17 Thermal bridges - Typical
Thermal bridges - Typical Heat transfer coefficient of linear thermal
bridges, ѱk [W/mK]
External wall/ internal slab 0.05
External wall/ internal wall 0.03
External wall/ external wall 0.08
External window perimeters 0.03
External door perimeters 0.03
Roof/external walls 0.09
External slab/external walls 0.14
Balcony floor/external walls 0.20
External slab/ internal walls 0.03
Roof/ internal walls 0.03

BUILDINGS IN ARID DESERT CLIMATE
34
4.3.12 Parameters related to occupants, lightning and equipment
The number of occupants and their pattern of behaviour are related to the
energy use and have a significant impact on the results of the simulations.
Therefore, it is important that these parameters are approximated in an
appropriate manner.
The average household size of 5.6 persons for homes in Saudi Arabia is used in
the base case. A density of 0.023 occupants per square meter is calculated from
the household size divided by the floor area of 247 m2.
Since no standards for the behaviour of occupants was found for the Gulf
region the recommendations from the Swedish professional association,
SVEBY (2012 a) is used. The schedule for when the occupants are home is set
to 17 – 7 every day according to SVEBY (2012 a) standard. The schedule for
lighting and equipment is also set to 17 – 7 since an assumption is made that no
light and equipment are needed when the occupants are away.
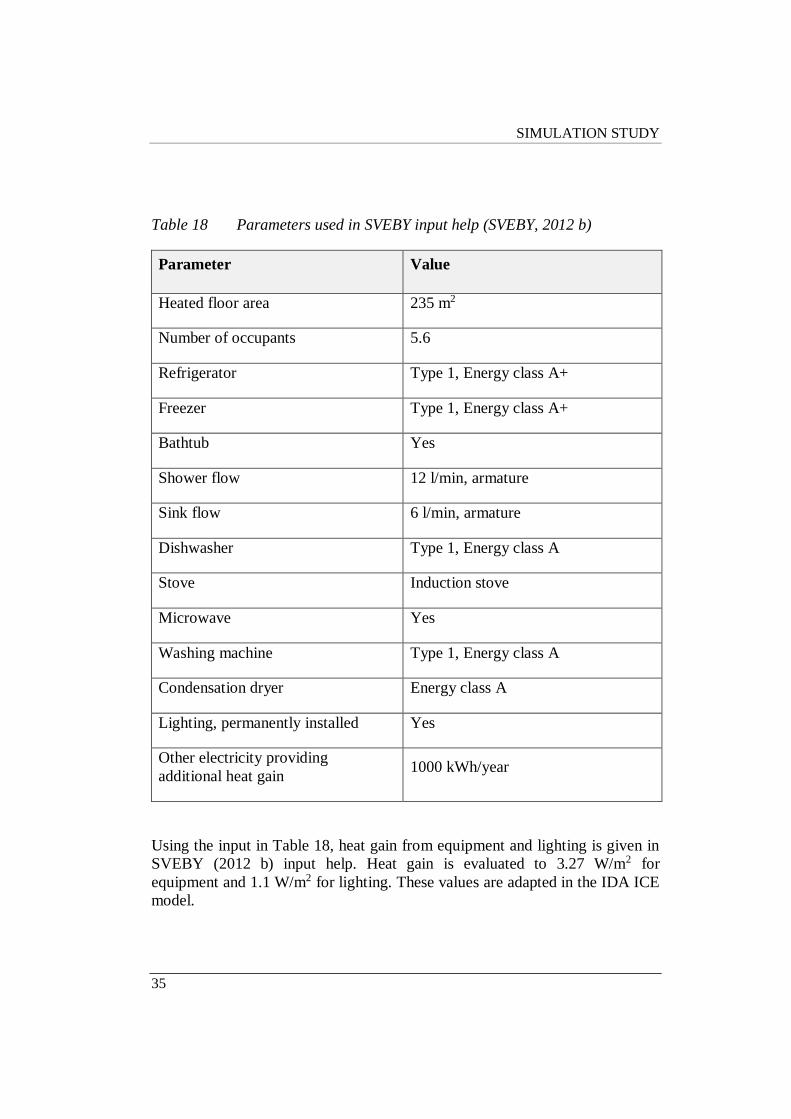
Estimated additional heat from equipment and light is obtained from
calculations using SVEBY (2012 b) input help for household electricity, domestic hot water, heat from occupants and certain domestic electricity for
detached houses. Input data used for the calculations are shown in Table 18.
Values in Table 18 are default values retrieved from SVEBY (2012 b) input
help, except from numbers of occupants, heated floor area and other electricity
providing additional heat gain. The value for other electricity providing
additional heating is assumed.
SIMULATION STUDY
35
Table 18 Parameters used in SVEBY input help (SVEBY, 2012 b)
Parameter Value
Heated floor area 235 m2
Number of occupants 5.6
Refrigerator Type 1, Energy class A+
Freezer Type 1, Energy class A+
Bathtub Yes
Shower flow 12 l/min, armature
Sink flow 6 l/min, armature
Dishwasher Type 1, Energy class A
Stove Induction stove
Microwave Yes
Washing machine Type 1, Energy class A
Condensation dryer Energy class A
Lighting, permanently installed Yes
Other electricity providing
additional heat gain 1000 kWh/year
Using the input in Table 18, heat gain from equipment and lighting is given in
SVEBY (2012 b) input help. Heat gain is evaluated to 3.27 W/m2 for
equipment and 1.1 W/m2 for lighting. These values are adapted in the IDA ICE
model.
BUILDINGS IN ARID DESERT CLIMATE
36
4.4 Energy efficiency measures
4.4.1 Modification of external walls
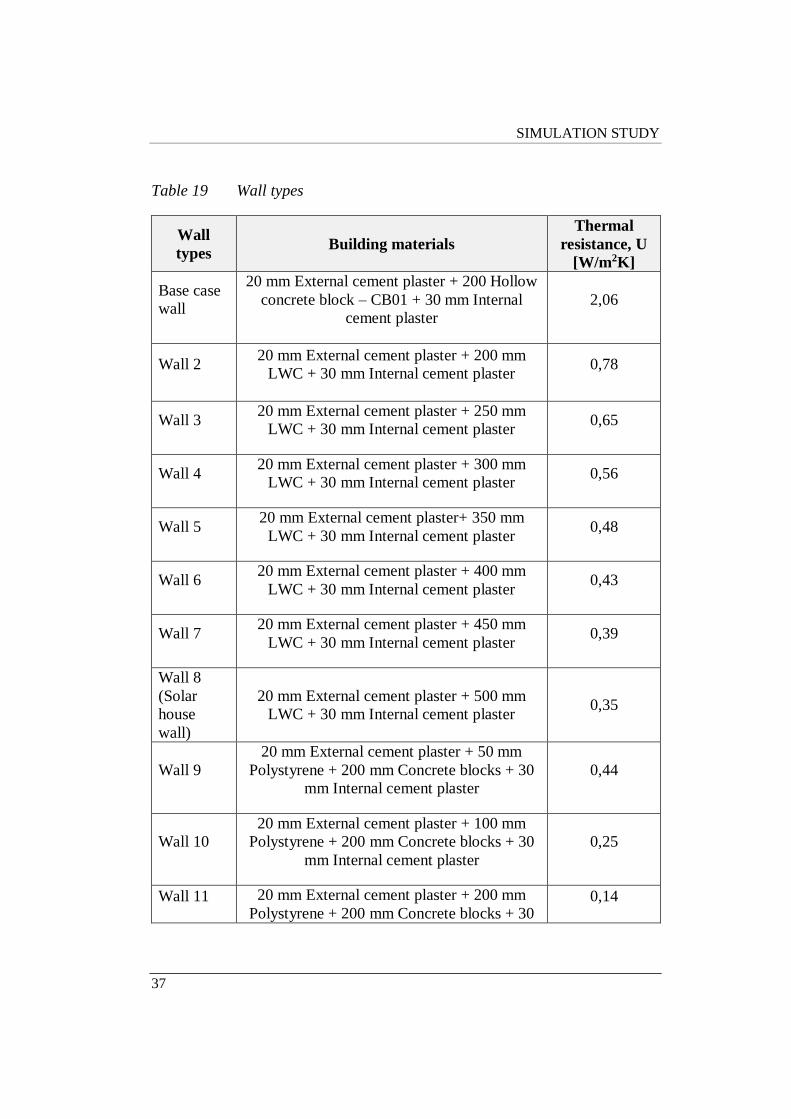
The different types of walls used in the simulations are shown in Table 19.
First, only base case wall to wall 14 was used to see how the insulation
thickness affects the buildings energy demand. Walls 15 to 20 where added to
see if there is any difference in energy consumption between a lightweight and
a heavyweight wall construction. Simulations are made for each wall type and
all other parameters are kept the same as in the base case.
SIMULATION STUDY
37
Table 19 Wall types
Wall
types Building materials
Thermal
resistance, U
[W/m2K]
Base case
wall
20 mm External cement plaster + 200 Hollow
concrete block – CB01 + 30 mm Internal
cement plaster
2,06
Wall 2 20 mm External cement plaster + 200 mm
LWC + 30 mm Internal cement plaster 0,78
Wall 3 20 mm External cement plaster + 250 mm
LWC + 30 mm Internal cement plaster 0,65
Wall 4 20 mm External cement plaster + 300 mm
LWC + 30 mm Internal cement plaster 0,56
Wall 5 20 mm External cement plaster+ 350 mm
LWC + 30 mm Internal cement plaster 0,48
Wall 6 20 mm External cement plaster + 400 mm
LWC + 30 mm Internal cement plaster 0,43
Wall 7 20 mm External cement plaster + 450 mm
LWC + 30 mm Internal cement plaster 0,39
Wall 8
(Solar
house
wall)
20 mm External cement plaster + 500 mm
LWC + 30 mm Internal cement plaster 0,35
Wall 9
20 mm External cement plaster + 50 mm
Polystyrene + 200 mm Concrete blocks + 30
mm Internal cement plaster
0,44
Wall 10
20 mm External cement plaster + 100 mm
Polystyrene + 200 mm Concrete blocks + 30
mm Internal cement plaster
0,25
Wall 11 20 mm External cement plaster + 200 mm
Polystyrene + 200 mm Concrete blocks + 30 0,14

BUILDINGS IN ARID DESERT CLIMATE
38
mm Internal cement plaster
Wall 12
20 mm External cement plaster + 300 mm
Polystyrene + 200 mm Concrete blocks + 30
mm Internal cement plaster
0,09
Wall 13
20 mm External cement plaster + 400 mm
Polystyrene + 200 mm Concrete blocks + 30
mm Internal cement plaster
0,07
Wall 14
20 mm External cement plaster + 500 mm
Polystyrene + 200 mm Concrete blocks + 30
mm Internal cement plaster
0,06
Wall 15
20 mm External cement plaster + 50 mm
Polystyrene + 200 mm LWC + 30 mm
Internal cement plaster
0,34
Wall 16
20 mm External cement plaster + 100 mm
Polystyrene + 200 mm LWC + 30 mm
Internal cement plaster
0,22
Wall 17
20 mm External cement plaster + 200 mm
Polystyrene + 200 mm LWC + 30 mm
Internal cement plaster
0,13
Wall 18
20 mm External cement plaster + 300 mm
Polystyrene + 200 mm LWC + 30 mm
Internal cement plaster
0,09
Wall 19
20 mm External cement plaster + 400 mm
Polystyrene + 200 mm LWC + 30 mm
Internal cement plaster
0,07
Wall 20
20 mm External cement plaster + 500 mm
Polystyrene + 200 mm LWC + 30 mm
Internal cement plaster
0,06
All material properties are taken from IES (2014) except for material marked
with *, where material properties from IDA ICE 4.7 are used
SIMULATION STUDY
39
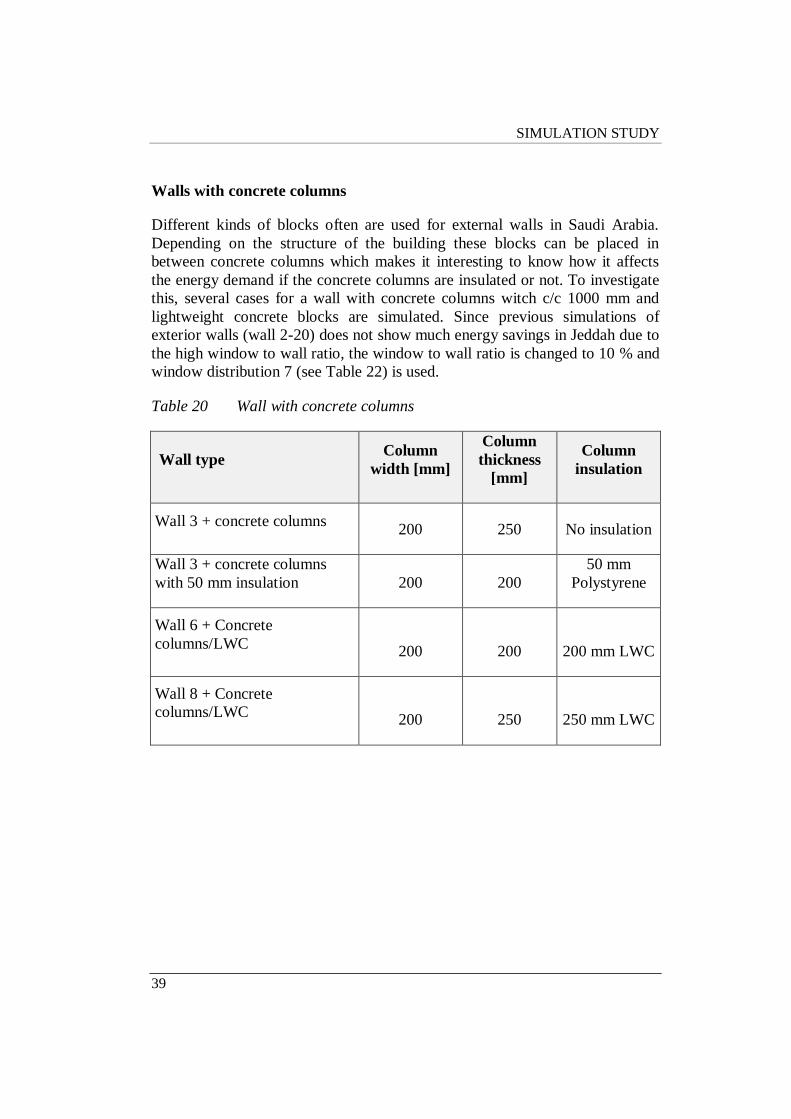
Walls with concrete columns
Different kinds of blocks often are used for external walls in Saudi Arabia.
Depending on the structure of the building these blocks can be placed in
between concrete columns which makes it interesting to know how it affects
the energy demand if the concrete columns are insulated or not. To investigate
this, several cases for a wall with concrete columns witch c/c 1000 mm and
lightweight concrete blocks are simulated. Since previous simulations of
exterior walls (wall 2-20) does not show much energy savings in Jeddah due to
the high window to wall ratio, the window to wall ratio is changed to 10 % and
window distribution 7 (see Table 22) is used.
Table 20 Wall with concrete columns
Wall type Column
width [mm]
Column
thickness
[mm]
Column
insulation
Wall 3 + concrete columns 200 250 No insulation
Wall 3 + concrete columns
with 50 mm insulation 200 200
50 mm
Polystyrene
Wall 6 + Concrete
columns/LWC 200 200 200 mm LWC
Wall 8 + Concrete
columns/LWC 200 250 250 mm LWC
BUILDINGS IN ARID DESERT CLIMATE
40
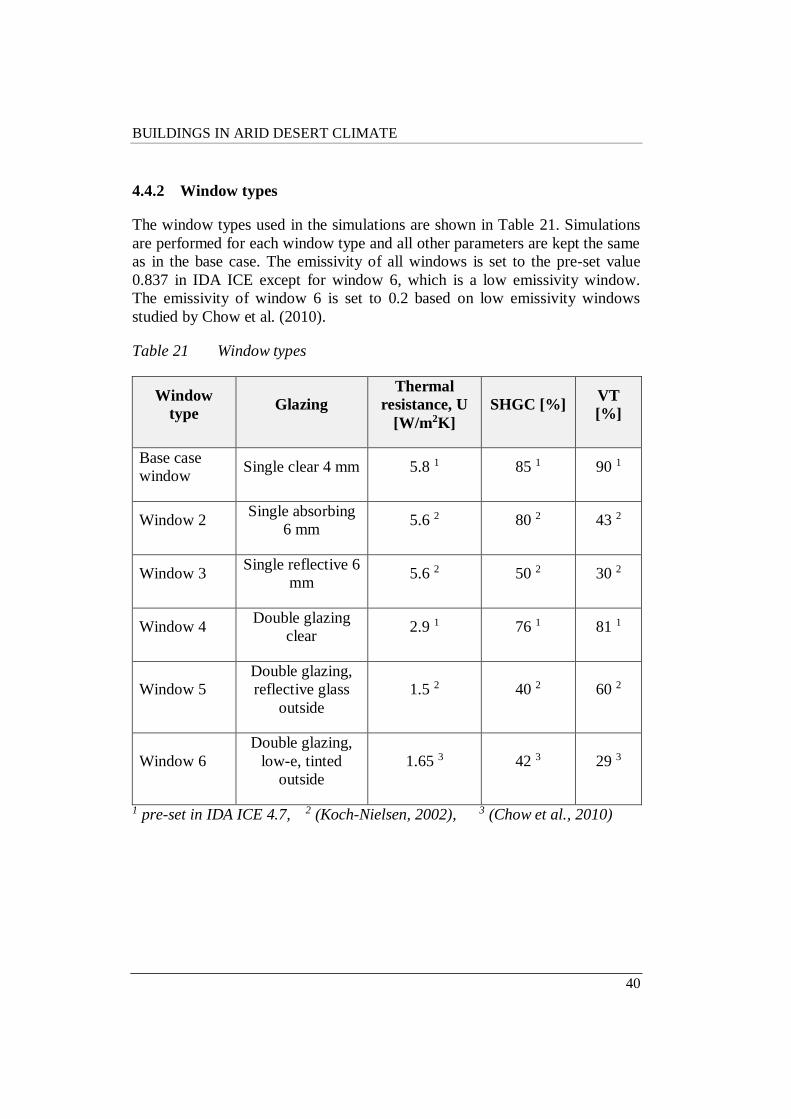
4.4.2 Window types
The window types used in the simulations are shown in Table 21. Simulations
are performed for each window type and all other parameters are kept the same
as in the base case. The emissivity of all windows is set to the pre-set value
0.837 in IDA ICE except for window 6, which is a low emissivity window.
The emissivity of window 6 is set to 0.2 based on low emissivity windows
studied by Chow et al. (2010).
Table 21 Window types
Window
type Glazing
Thermal
resistance, U
[W/m2K]
SHGC [%] VT
[%]
Base case
window Single clear 4 mm 5.8 1 85 1 90 1
Window 2 Single absorbing
6 mm 5.6 2 80 2 43 2
Window 3 Single reflective 6
mm 5.6 2 50 2 30 2
Window 4 Double glazing
clear 2.9 1 76 1 81 1
Window 5
Double glazing,
reflective glass
outside
1.5 2 40 2 60 2
Window 6
Double glazing,
low-e, tinted
outside
1.65 3 42 3 29 3
1 pre-set in IDA ICE 4.7, 2 (Koch-Nielsen, 2002), 3 (Chow et al., 2010)
SIMULATION STUDY
41
4.4.3 Window area and distribution
Comparison of window directions
To compare the influence of the window orientation on the energy savings,
simulations are executed with windows on only one façade at the time. Other
than the changes in window area the model in IDA ICE is kept the same as the
Base case. All windows were deleted in the model, after witch 10 m2 of
windows were placed at one façade at the time and simulations are performed
for each direction.
Window to wall ratio
The window to wall ratio is changed for one direction at the time. When
changing the window to wall ratio of one façade the other façades keeps the
original design of the base case. In addition to the base case, window to wall
ratio are simulated for each direction at 15 %, 10 %, 8 %, 6 %, 4 % and 2 %.
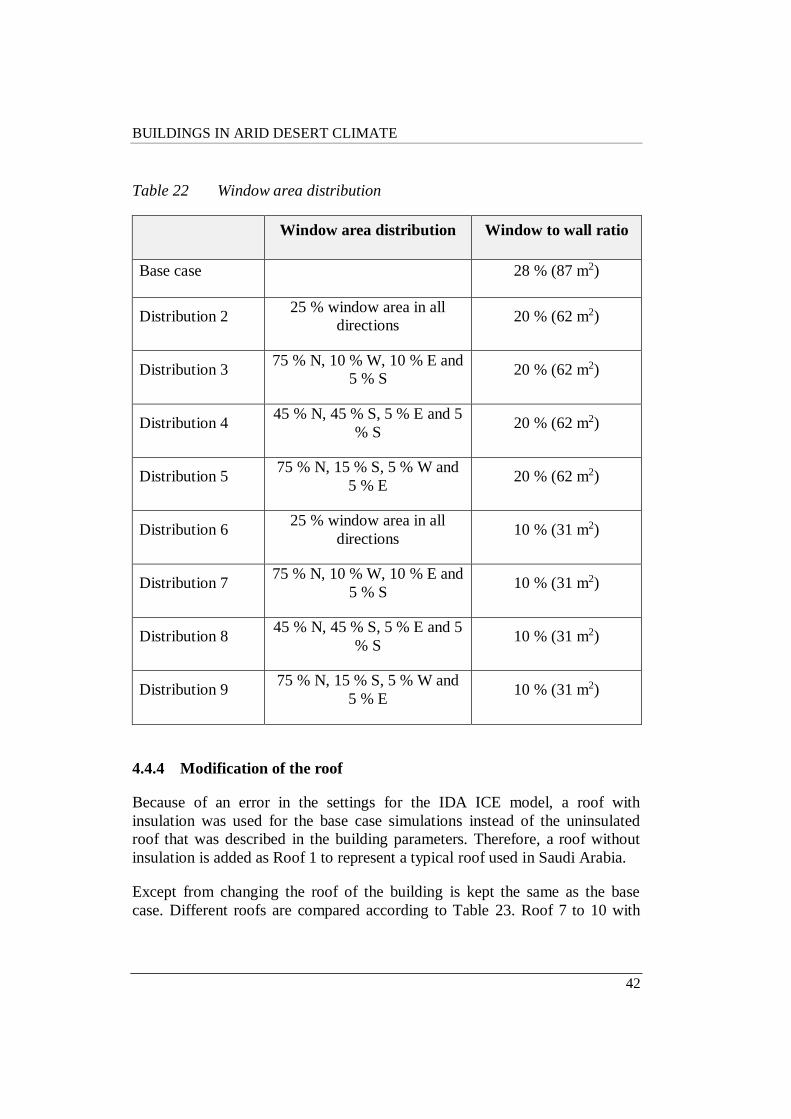
Distribution of window area
To study how the placement of windows effect the energy demand, several
window distributions are simulated based on the results from the comparison
of window directions. Since the simulations of window to wall ratio for each
wall showed a significant reduction in energy demand when lowering the
window to wall ratio to 10 % or less (except for south that did not have
windows before) a 10 % (31m2) window to wall ratio is used for the total
exterior wall area of the building. A higher window to wall ratio of 20 % is
also simulated for comparison.
BUILDINGS IN ARID DESERT CLIMATE
42
Table 22 Window area distribution
Window area distribution Window to wall ratio
Base case 28 % (87 m2)
Distribution 2 25 % window area in all
directions 20 % (62 m2)
Distribution 3 75 % N, 10 % W, 10 % E and
5 % S 20 % (62 m2)
Distribution 4 45 % N, 45 % S, 5 % E and 5
% S 20 % (62 m2)
Distribution 5 75 % N, 15 % S, 5 % W and
5 % E 20 % (62 m2)
Distribution 6 25 % window area in all
directions 10 % (31 m2)
Distribution 7 75 % N, 10 % W, 10 % E and
5 % S 10 % (31 m2)
Distribution 8 45 % N, 45 % S, 5 % E and 5
% S 10 % (31 m2)
Distribution 9 75 % N, 15 % S, 5 % W and
5 % E 10 % (31 m2)
4.4.4 Modification of the roof
Because of an error in the settings for the IDA ICE model, a roof with
insulation was used for the base case simulations instead of the uninsulated
roof that was described in the building parameters. Therefore, a roof without
insulation is added as Roof 1 to represent a typical roof used in Saudi Arabia.
Except from changing the roof of the building is kept the same as the base
case. Different roofs are compared according to Table 23. Roof 7 to 10 with

SIMULATION STUDY
43
lightweight construction of wood is simulated to see if lightweight structures
differ from heavy weight structures in terms of energy demand. The thermal
resistance for each roof shown in Table 23 is given in IDA ICE 4.7.
Table 23 Roof types
Roof Building materials
Thermal
resistance, U
[W/m2K]
Roof 1 10 mm Build-up roof * + 200 mm Concrete**
+ 10 mm Cement plaster* 2,75
Roof 2 50 mm Foamglas*** + 200 mm Concrete** +
10 mm Cement plaster* 0,66
Roof 3 100 mm Foamglas*** + 200 mm Concrete**
+ 10 mm Cement plaster* 0.36
Roof 4 100 mm Polyurethane* + 200 mm Concrete**
+ 10 mm Cement plaster* 0,23
Base
case roof
10 mm Build-up roof* + 200 mm light
insulation**+ 200 mm Concrete** + 10 mm
Cement plaster*
0,17
Roof 5 200 mm Polyurethane* + 200 mm Concrete**
+ 10 mm Cement plaster* 0,12
Roof 6 300 mm Polyurethane* + 200 mm Concrete**
+ 10 mm Cement plaster* 0,08
Roof 7 400 mm Polyurethane* + 200 mm Concrete**
+ 10 mm Cement plaster* 0,06
Roof 8 100 mm Polyurethane* + 22 mm wood** +
13 mm Gypsum** 0,23
Roof 9 200 mm Polyurethane* + 22 mm wood** +
13 mm Gypsum** 0,12
Roof 10 300 mm Polyurethane* + 22 mm wood** +
13 mm Gypsum** 0,08
Roof 11 400 mm Polyurethane* + 22 mm wood** +
13 mm Gypsum** 0,06
Material properties from: *IES (2014), **IDA ICE 4.7 and
***Foamglas (2010)

BUILDINGS IN ARID DESERT CLIMATE
44
4.4.5 Modification of the foundation
Table 24 Slab types
Slab Building materials Thermal resistance, U
[W/m2K]
Base
case slab 200 mm concrete 3,48
Slab 2 200 mm Concrete + 50 mm Extruded
Polystyrene 0.60
Slab 3 200 mm Concrete + 100 mm
Extruded Polystyrene 0,33
Slab 4 200 mm Concrete + 200 mm
Extruded Polystyrene 0,17
Slab 5 200 mm Concrete + 300 mm
Extruded Polystyrene 0,12
Slab 6 200 mm Concrete + 400 mm
Extruded Polystyrene 0,09
Slab 7 200 mm Concrete + 500 mm
Extruded Polystyrene 0,07
Slab 8 22 mm Wood Chip Board + 50 mm
Extruded Polystyrene 0,59
Slab 9 22 mm Wood Chip Board + 100 mm
Extruded Polystyrene 0,32
Slab 10 22 mm Wood Chip Board + 200 mm
Extruded Polystyrene 0,17
Slab 11 22 mm Wood Chip Board + 300 mm
Extruded Polystyrene 0,12
Slab 12 22 mm Wood Chip Board + 400 mm
Extruded Polystyrene 0,09
Slab 13 22 mm Wood Chip Board + 500 mm
Extruded Polystyrene 0,07
Material properties from IDA ICE 4.7
The foundations compared are represented in Table 24. Except from changing
the foundation, the building is kept the same as the base case. Slab 8 to 13
with lightweight construction of wood is simulated to see if lightweight
structures differ from heavy weight structures in terms of energy demand. The
thermal resistance for each slab shown in Table 24 is given in IDA ICE 4.7.

SIMULATION STUDY
45
4.4.6 Shading
Fixed overhangs and fins are chosen for shading in the simulations since they
are cheaper than movable shading and do not acquire daily manipulations as
shutters does. However, although movable shadings are not considered in the
simulations they are an option that provides efficient shading and allow
daylight to enter when there is no need for shading.
Since maximum cooling load occur at the 15th of July (for both Jeddah and
Riyadh) when the sun is shining at the north and west façade, shading for these
facades are considered first. Overhangs and fin dimensions for the west and
north façade are calculated in Appendix D with azimuth angles for both cities
at 17.30, the 15th of July 2015.
Because there are no maximum cooling loads when the sun is shining at the
east façade (Table 32 & 33) the same dimensions for window overhangs and
fins as for the west façade are used for the east façade since the solar angles are
similar but from the opposite directions occurring in the morning. The location
of the sun at different times is found using sun path diagrams in Appendix F.
For the south façade, window overhangs and fins are dimension for the solar
azimuth and latitude of the 15th of October 2015, 17.30 when the sun is shining
at the south and west façade. The 15th of October is chosen even though there
are also maximum cooling loads occurring at the 14th of August and the 15th of
September (Table 32 & 33) since the south façade is more exposed by the sun
in the afternoon in October. Any shading devices dimensioned for October
located at the south façade should also be sufficient for August and September
since the sun is set lower in the sky in October 17.30 than for the same hour at
the day in August and September.
It should be considered that there is a huge difference between the dimensions
of the shades between the north/south and the east/west façades. The east and
west façades require deeper shades to achieve the same shaded window area as
on the north and south façade during the cooling peak load.
Shading 1 – Base case
To investigate how adding shading affects the energy demand compared to
other measures, simulations are made adding overhangs and fins to the base
case windows.

BUILDINGS IN ARID DESERT CLIMATE
46
Dimensions used for overhangs and fins are calculated in Appendix D.
Because there are several big windows in the base case building, overhangs
and fins have been split up into louvres to allow some light to enter the
building and to keep the dimensions of the shades within reasonable size. Since
the base case building does not have any windows on the south façade, the
impact of shading of south facing windows cannot be examined using the base
case building. The percentage in Table 25 indicates how much of the window
that is shaded during the peak cooling load. For overhangs it is the percentage
of the window height, while it is the percentage of the window width when
calculating the shade created by the fin.
Because the fins for west and east were calculated to be very deep (between 1-
2 m) the fins are given the same depth as the overhangs on the east and west
facades.
Table 25 Shading 1 – Base case
Shading 1 – Base case
Case: Measure:
60 % N 60 % Overhang and Fins – North
100 % N 100 % Overhang and Fins – North
60 % W 60 % Overhang and Fins – West
100 % W 100 % Overhang and Fins – West
60 % E 60 % Overhang and Fins – East
100 % E 100 % Overhang and Fins – East
60 % N & W 60 % Overhang and Fins – North & West
100 % N & W 100 % Overhang and Fins – North & West
60 % N, W & E 60 % Overhang and Fins – North, West & East
100 % N, W & E 100 % Overhang and Fins – North, West & East

SIMULATION STUDY
47
Shading 2 – 25% windows in all directions
To investigate how much effect window shades have depending on directions,
simulations are made for a building where the base case windows have been
replaced with an equal area of windows in each direction. All other parameters
are the same as in the bas case. The window distribution used is window
distribution 6.
Table 26 Shading 2
Shading 2
Case: Measure:
Ov. North 100 % overhang – North
Ov. West 100 % overhang – West
Ov. East 100 % overhang – East
Ov. South 100 % overhang – South
Fin North 100 % fins – North
Fin West 100 % fins – West
Fin East 100 % fins– East
Fin South 100 % fins – South
Ov. & Fin N 100 % overhang & fins – North
Ov. & Fin W 100 % overhang & fins – West
Ov. & Fin E 100 % overhang & fins – East
Ov. & Fin S 100 % overhang & fins – South
Dimensions for the shades are calculated in Appendix D. A problem
discovered while executing simulations for shading 1 was that fins on the west
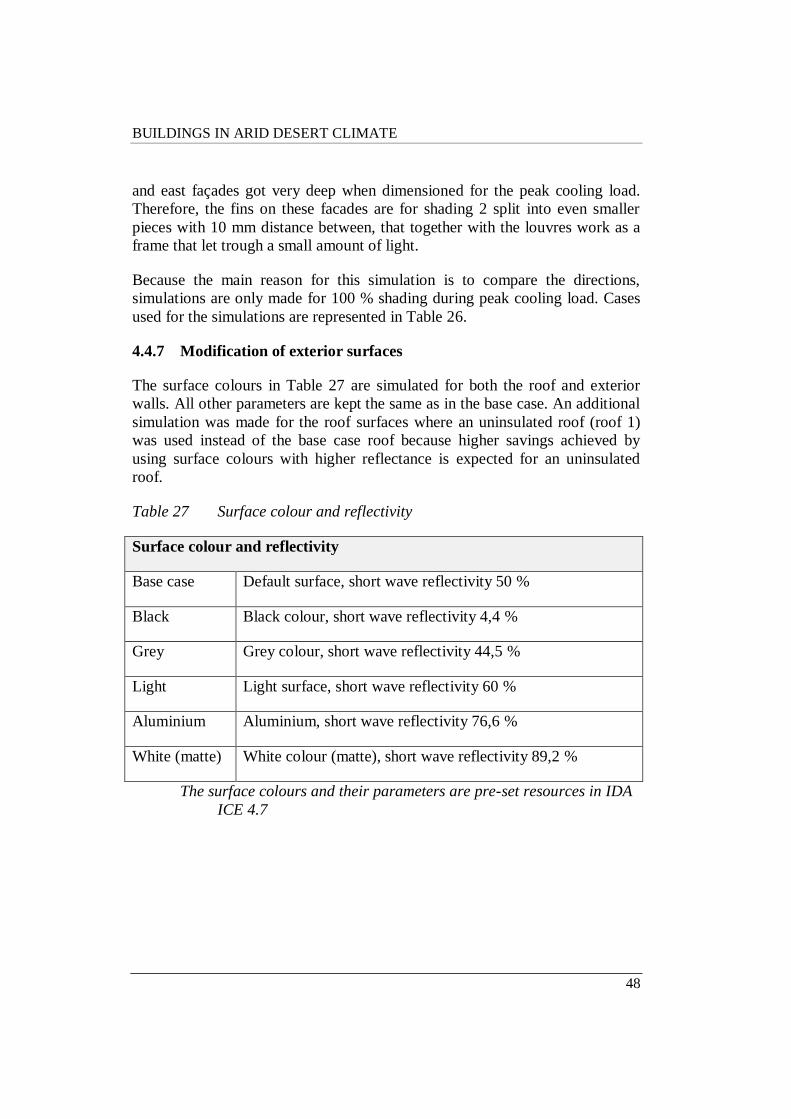
BUILDINGS IN ARID DESERT CLIMATE
48
and east façades got very deep when dimensioned for the peak cooling load.
Therefore, the fins on these facades are for shading 2 split into even smaller
pieces with 10 mm distance between, that together with the louvres work as a
frame that let trough a small amount of light.
Because the main reason for this simulation is to compare the directions,
simulations are only made for 100 % shading during peak cooling load. Cases
used for the simulations are represented in Table 26.
4.4.7 Modification of exterior surfaces
The surface colours in Table 27 are simulated for both the roof and exterior
walls. All other parameters are kept the same as in the base case. An additional
simulation was made for the roof surfaces where an uninsulated roof (roof 1)
was used instead of the base case roof because higher savings achieved by
using surface colours with higher reflectance is expected for an uninsulated
roof.
Table 27 Surface colour and reflectivity
Surface colour and reflectivity
Base case Default surface, short wave reflectivity 50 %
Black Black colour, short wave reflectivity 4,4 %
Grey Grey colour, short wave reflectivity 44,5 %
Light Light surface, short wave reflectivity 60 %
Aluminium Aluminium, short wave reflectivity 76,6 %
White (matte) White colour (matte), short wave reflectivity 89,2 %
The surface colours and their parameters are pre-set resources in IDA
ICE 4.7
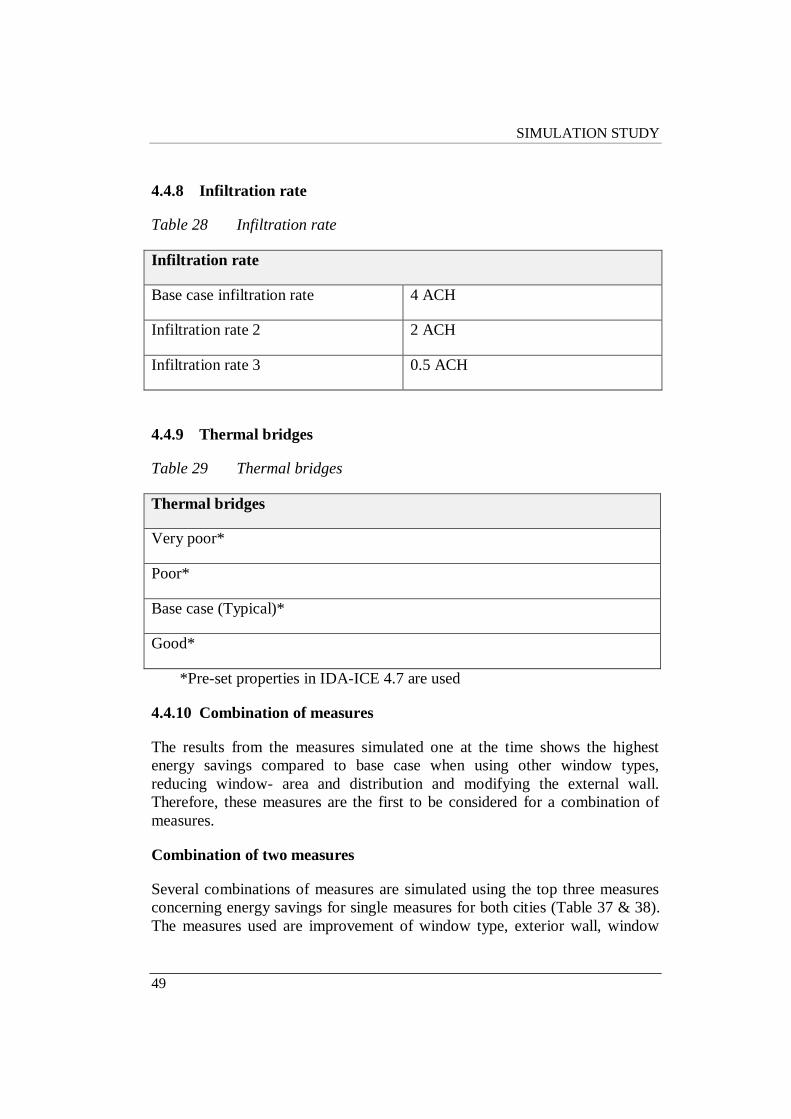
SIMULATION STUDY
49
4.4.8 Infiltration rate
Table 28 Infiltration rate
Infiltration rate
Base case infiltration rate 4 ACH
Infiltration rate 2 2 ACH
Infiltration rate 3 0.5 ACH
4.4.9 Thermal bridges
Table 29 Thermal bridges
Thermal bridges
Very poor*
Poor*
Base case (Typical)*
Good*
*Pre-set properties in IDA-ICE 4.7 are used
4.4.10 Combination of measures
The results from the measures simulated one at the time shows the highest
energy savings compared to base case when using other window types,
reducing window- area and distribution and modifying the external wall.
Therefore, these measures are the first to be considered for a combination of
measures.
Combination of two measures
Several combinations of measures are simulated using the top three measures
concerning energy savings for single measures for both cities (Table 37 & 38).
The measures used are improvement of window type, exterior wall, window
BUILDINGS IN ARID DESERT CLIMATE
50
area distribution and shading. Dimensions for the shadings used together with
window distribution 7 and 9 are calculated in Appendix D.
Combination of three measures
Based on the results of the simulations of combinations of two measures,
combinations with three measures are simulated using the same measures as
for the combinations of two measures.
Combination of four measures
Combinations of four measures are simulated based on the results for
combinations of three measures. Taking the best three measures for Jeddah
respectively Riyadh from the simulations conducted for combinations of three
measures and adding shading and improving one at the time. When improving
the slab, slab 4 is used because it showed the highest energy savings of the
floors tested when preforming energy simulations for single measures.
Additional measures
Simulations are performed adding the measures that were not included in the
combinations of two, three and four measures to the measures used in the
combinations of four measures. These measures are represented in Appendix
E.

RESULTS AND ANALYSIS
51
5 RESULTS AND ANALYSIS
5.1 Energy simulation - Base case
5.1.1 Total heating & cooling
Table 30 represents total heating and cooling for the base case building. The
results show that approximately 11 % of the energy demand in Riyadh consists
of heating while the percentage of energy for heating in Jeddah is close to 0 %.
Zone cooling contributes to 76 % and 71 % of the total heating and cooling for
Riyadh respectively Jeddah. There is a major difference when it comes to AHU
cooling between the two cities. For Riyadh AHU cooling stands for 12 % of
the total heating and cooling of the base case building, while it stands for 33%
in Jeddah.
Table 30 Total heating & cooling, base case
Total heating & cooling, base case
Case
Zone
heating
[kWh]
Zone
cooling
[kWh]
AHU
heating
[kWh]
AHU
cooling
[kWh]
Total heating &
cooling [kWh]
Base case,
Riyadh 7 363,4 50 275,2 5,8 8 174,4 65 819
Base case,
Jeddah 3,4 51 955,7 0,0 21 392,2 73 351

BUILDINGS IN ARID DESERT CLIMATE
52
Even though the building in Jeddah does not have cold winters as Riyadh, the
energy for heating and cooling is higher for Jeddah. This can partly be
explained by the climate of Jeddah that requires cooling all year around (see
Figure 8). That Riyadh requires less AHU cooling is partly because of the
moderately cold winters and the diurnal temperature swings in Riyadh that
works as a natural source of cooling during the nights.
Figure 7 and 8 shows the base case building total heating and cooling demand
over a year in Riyadh and Jeddah. Riyadh with its moderately cold winters at
its hot summers is in need of heating from the end of November to the end of
March and cooling from March to November (see Figure 7). Jeddah
experiences mild winters and hot summer which shows in Figure 8 with
cooling required all year around.
Figure 7 Total heating & cooling - Riyadh
Total heating & cooling - Riyadh
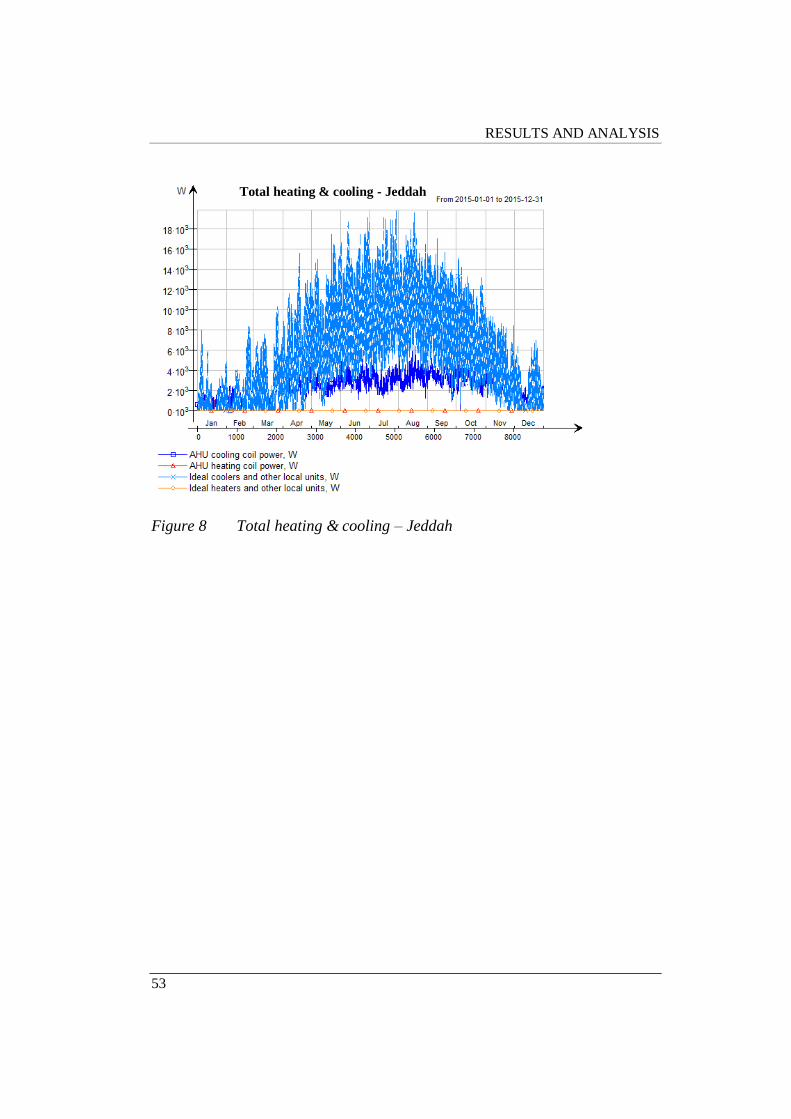
RESULTS AND ANALYSIS
53
Figure 8 Total heating & cooling – Jeddah
Total heating & cooling - Jeddah
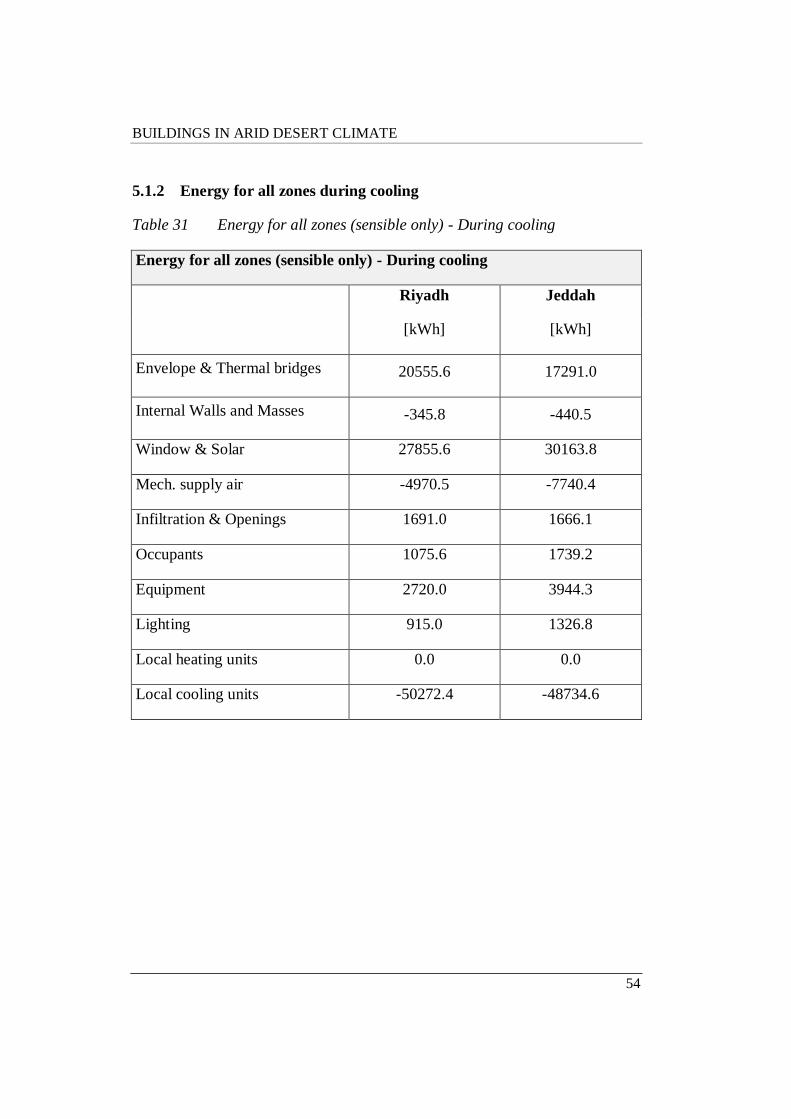
BUILDINGS IN ARID DESERT CLIMATE
54
5.1.2 Energy for all zones during cooling
Table 31 Energy for all zones (sensible only) - During cooling
Energy for all zones (sensible only) - During cooling
Riyadh Jeddah
[kWh] [kWh]
Envelope & Thermal bridges 20555.6 17291.0
Internal Walls and Masses -345.8 -440.5
Window & Solar 27855.6 30163.8
Mech. supply air -4970.5 -7740.4
Infiltration & Openings 1691.0 1666.1
Occupants 1075.6 1739.2
Equipment 2720.0 3944.3
Lighting 915.0 1326.8
Local heating units 0.0 0.0
Local cooling units -50272.4 -48734.6

RESULTS AND ANALYSIS
55
5.1.3 Peak cooling load
The buildings peak cooling load for the whole building is shown in Table 32.
Table 32 Peak cooling load – total for building
Peak cooling load – total for building
Riyadh Jeddah
25.2 kW the 15th of July 2015, 17:28 21.8 kW the 15th of July 2015, 17:38
Table 33 and 34 show the time and heat removed at peak cooling load for all
the zones. Drawings showing the location of the zones are shown in Appendix
B. For most zones the peak cooling load occurs at the 15th of July for both
cities.

BUILDINGS IN ARID DESERT CLIMATE
56
Table 33 Maximum cooling loads, Jeddah base case
Zone Heat removed
[W] Time
Room unit
cool [W]
Dry vent
cool [W]
1.1 DINING
ROOM/LIVING
ROOM
5236.0 15 Jul 18:17 4915.0 392.4
1.2 ENTRANCE
HALL 1378.0 15 Jul 17:38 1447.0 0.0
1.3 WC 242.2 15 Oct 20:19 245.2 0.0
1.4 WC 188.5 15 Oct 20:13 186.6 0.0
1.5 STAFF ROOM 699.4 15 Jul 17:28 638.6 58.9
1.6 HALLWAY 313.3 15 Jul 17:45 214.7 97.2
1.7 KITCHEN 1424.0 15 Jul 17:42 1552.0 0.0
2.1 BEDROOM 1315.0 14 Aug 18:08 1304.0 98.0
2.2 BATHROOM 333.9 15 Jul 20:58 323.3 0.0
2.3 HALLWAY 3919.0 15 Jul 17:38 4236.0 0.0
2.4 LADIES ROOM 1839.0 15 Jul 18:20 1812.0 98.1
2.5 BATHROOM 214.3 15 Oct 19:46 215.4 0.0
2.6 BEDROOM 1232.0 15 Jul 18:17 1155.0 107.9
2.7 BEDROOM 1169.0 15 Jul 17:26 1138.0 98.1

RESULTS AND ANALYSIS
57
Table 34 Maximum cooling loads, Riyadh base case
Zone Heat removed
[W] Time
Room unit
cool [W]
Dry vent
cool [W]
1.1 DINING
ROOM/LIVING
ROOM
6609.0 15 Jul 17:48 6223.0 367.9
1.2 ENTRANCE
HALL 1680.0 15 Jul 17:19 1718.0 0.0
1.3 WC 289.9 15 Sep 20:13 285.3 0.0
1.4 WC 226.9 15 Sep 19:54 226.7 0.0
1.5 STAFF ROOM 890.9 15 Jul 17:22 876.1 54.8
1.6 HALLWAY 355.6 15 Jul 18:07 276.0 90.5
1.7 KITCHEN 1708.0 15 Jul 17:20 1792.0 0.0
2.1 BEDROOM 1524.0 14 Aug 17:48 1424.0 91.4
2.2 BATHROOM 402.4 14 Aug 20:10 422.4 0.0
2.3 HALLWAY 4863.0 15 Jul 17:28 5085.0 0.0
2.4 LADIES ROOM 2203.0 15 Jul 18:04 2175.0 91.4
2.5 BATHROOM 248.5 14 Aug 19:53 250.0 0.0
2.6 BEDROOM 1594.0 15 Jul 17:54 1567.0 100.5
2.7 BEDROOM 1441.0 15 Jul 17:21 1422.0 91.4

BUILDINGS IN ARID DESERT CLIMATE
58
5.1.4 Peak heating load
Table 35 Peak heating load – total for building
Peak heating load – total for building
Riyadh Jeddah
16.1 kW the 15th of January 2015,
04:30
5.2 kW the 15th of January 2015,
06:48
5.2 Energy efficiency measures
5.2.1 Modification of external walls
Results for the simulation of different exterior walls are represented in Figure
9.
Figure 9 Energy Savings – External walls
The results represent energy savings when only the exterior walls are modified
and the other parameters are kept the same as in the base case. For Riyadh,
Wall 13, with 100 mm polystyrene and 200 mm concrete blocks is the wall that

RESULTS AND ANALYSIS
59
provides the highest energy saving of the walls compared. For the building
situated in Jeddah, Wall 3, with 250 mm lightweight concrete represents the
greatest energy saving of the walls compared. The maximum energy savings
are 20.8 % respectively 11.2 % for Riyadh and Jeddah.
Wall 15-20 with lightweight concrete do not show any difference in energy use
compared to the concrete walls and are therefore not included here. The full
result can be found in Appendix E.
The results for Riyadh are in line with the literature study, showing similar
values for energy savings achieved by increasing the thermal resistance of the
walls as for the study conducted Alaidroos & Krarti (2015). The results for
Jeddah (Figure 9) show lower energy savings than the savings in the study
conducted by Alaidroos & Krarti (2015). However it is diffucult to say why,
because a lot of parameters are not included in the study by Alaidroos & Krarti
(2015).
External walls with U-value lower than 0.25 W/m2K does not affect the energy
consumption significantly. If the wall is uninsulated, light weight concrete is
preferable over concrete because the U-value is lower. Lightweight concrete
walls show similar energy savings as insulated concrete walls with the same U-
value. If the walls are built with concrete columns, the columns should be
insulated to avoid thermal bridges.
In Jeddah, where almost no heating is required, it is not beneficial with well
insulated walls in combination with big windows with high U-value. An
explanation to why Jeddah do not get as high energy savings as Riyadh with
the same measures is that AHU cooling stands for a larger part of Jeddahs total
heating and cooling which is not affected significantly by measures concerning
thermal resistance. That AHU cooling is close to unchanged by measures on
the building envelope is shown in Appendix E.
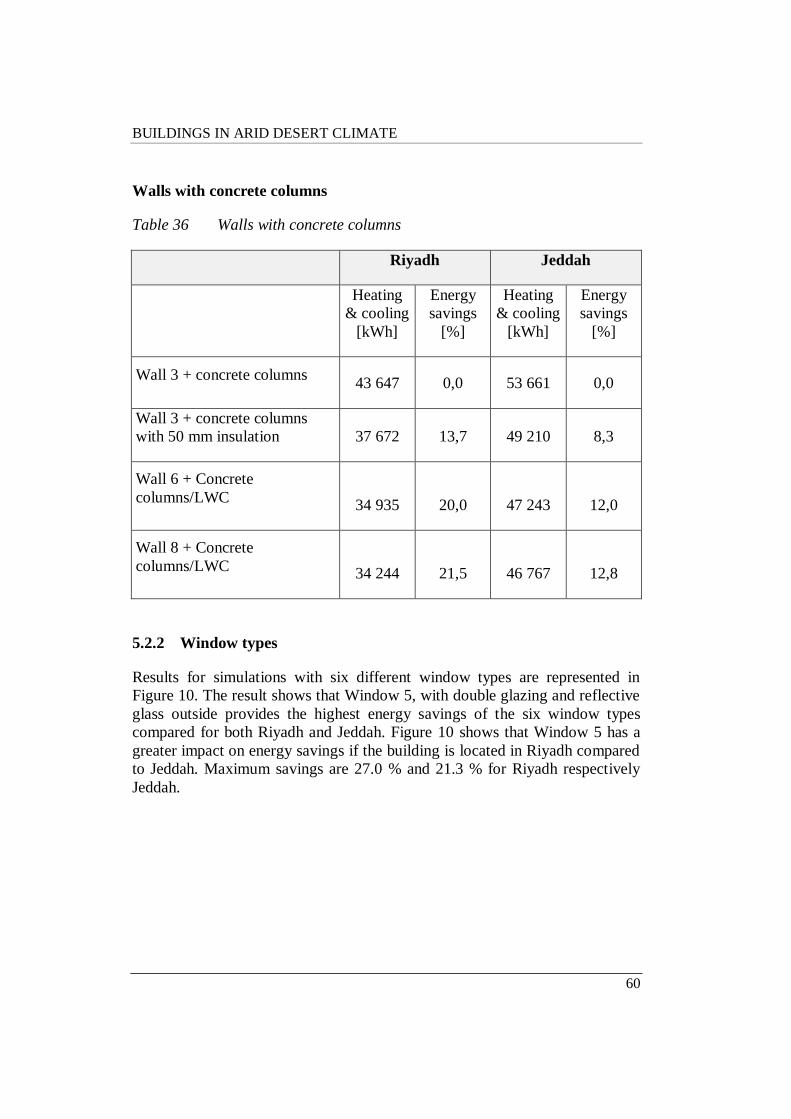
BUILDINGS IN ARID DESERT CLIMATE
60
Walls with concrete columns
Table 36 Walls with concrete columns
Riyadh Jeddah
Heating
& cooling
[kWh]
Energy
savings
[%]
Heating
& cooling
[kWh]
Energy
savings
[%]
Wall 3 + concrete columns 43 647 0,0 53 661 0,0
Wall 3 + concrete columns
with 50 mm insulation 37 672 13,7 49 210 8,3
Wall 6 + Concrete
columns/LWC 34 935 20,0 47 243 12,0
Wall 8 + Concrete
columns/LWC 34 244 21,5 46 767 12,8
5.2.2 Window types
Results for simulations with six different window types are represented in
Figure 10. The result shows that Window 5, with double glazing and reflective
glass outside provides the highest energy savings of the six window types
compared for both Riyadh and Jeddah. Figure 10 shows that Window 5 has a
greater impact on energy savings if the building is located in Riyadh compared
to Jeddah. Maximum savings are 27.0 % and 21.3 % for Riyadh respectively
Jeddah.
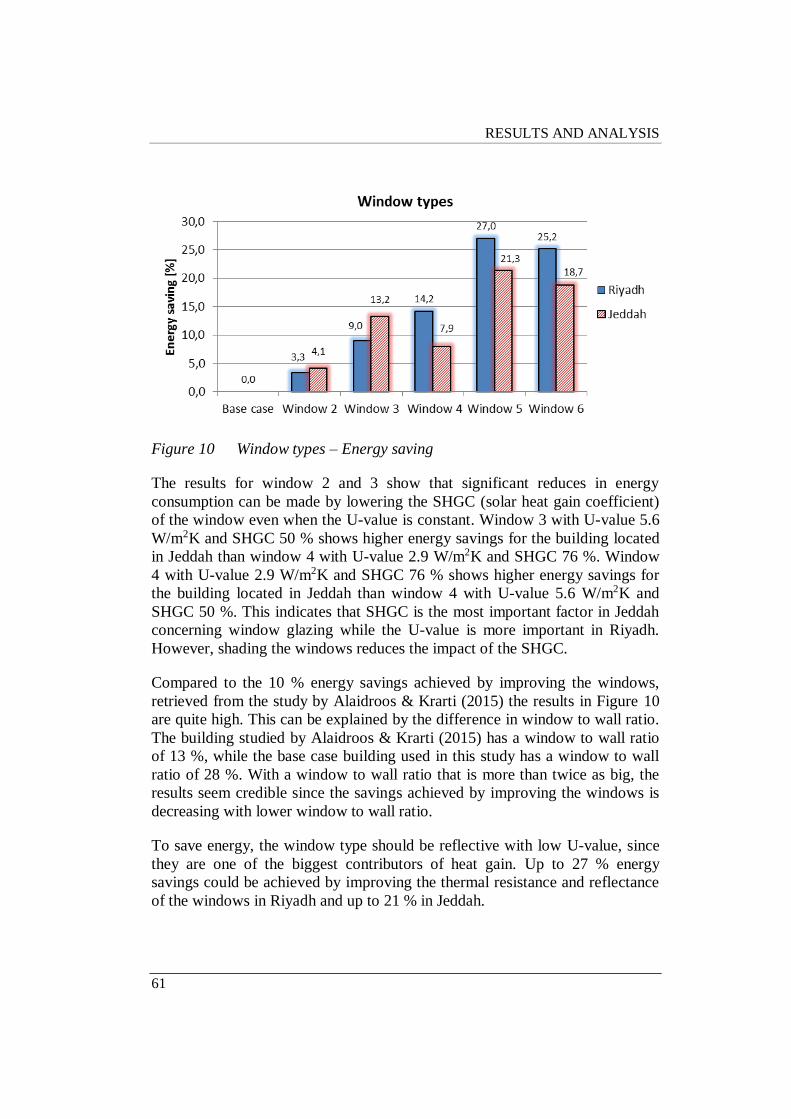
RESULTS AND ANALYSIS
61
Figure 10 Window types – Energy saving
The results for window 2 and 3 show that significant reduces in energy
consumption can be made by lowering the SHGC (solar heat gain coefficient)
of the window even when the U-value is constant. Window 3 with U-value 5.6
W/m2K and SHGC 50 % shows higher energy savings for the building located
in Jeddah than window 4 with U-value 2.9 W/m2K and SHGC 76 %. Window
4 with U-value 2.9 W/m2K and SHGC 76 % shows higher energy savings for
the building located in Jeddah than window 4 with U-value 5.6 W/m2K and
SHGC 50 %. This indicates that SHGC is the most important factor in Jeddah
concerning window glazing while the U-value is more important in Riyadh.
However, shading the windows reduces the impact of the SHGC.
Compared to the 10 % energy savings achieved by improving the windows,
retrieved from the study by Alaidroos & Krarti (2015) the results in Figure 10
are quite high. This can be explained by the difference in window to wall ratio.
The building studied by Alaidroos & Krarti (2015) has a window to wall ratio
of 13 %, while the base case building used in this study has a window to wall
ratio of 28 %. With a window to wall ratio that is more than twice as big, the
results seem credible since the savings achieved by improving the windows is
decreasing with lower window to wall ratio.
To save energy, the window type should be reflective with low U-value, since
they are one of the biggest contributors of heat gain. Up to 27 % energy
savings could be achieved by improving the thermal resistance and reflectance
of the windows in Riyadh and up to 21 % in Jeddah.
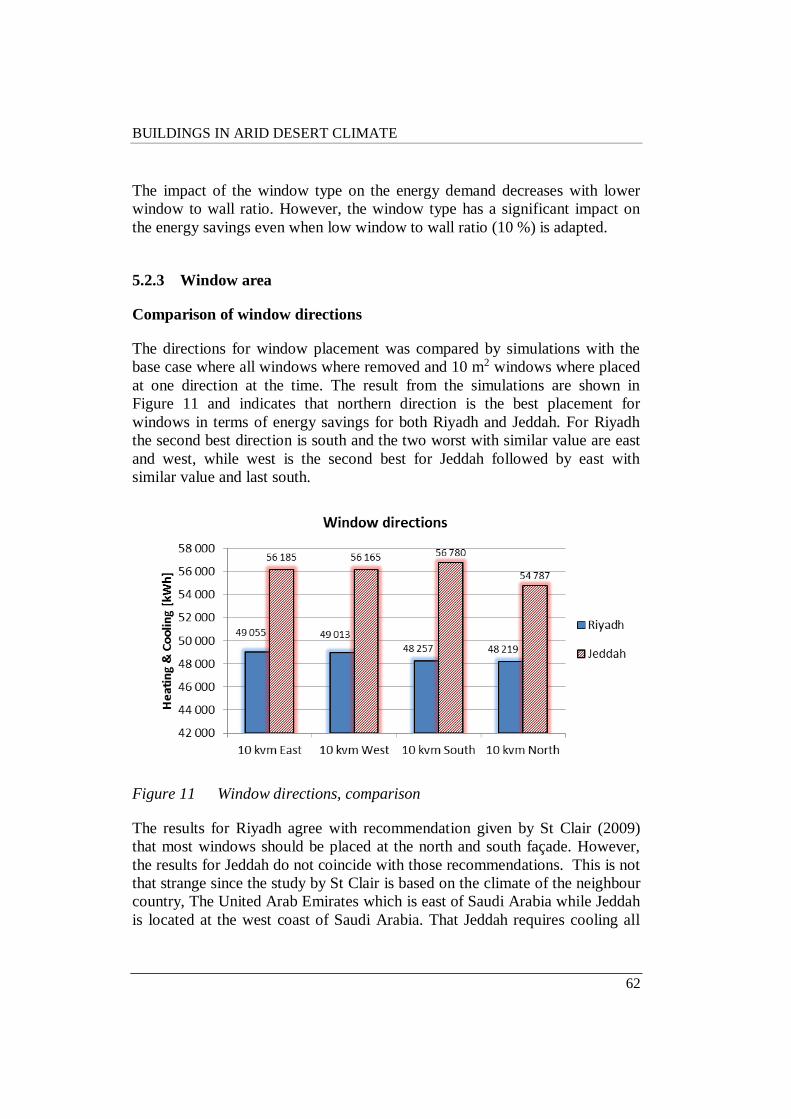
BUILDINGS IN ARID DESERT CLIMATE
62
The impact of the window type on the energy demand decreases with lower
window to wall ratio. However, the window type has a significant impact on
the energy savings even when low window to wall ratio (10 %) is adapted.
5.2.3 Window area
Comparison of window directions
The directions for window placement was compared by simulations with the
base case where all windows where removed and 10 m2 windows where placed
at one direction at the time. The result from the simulations are shown in
Figure 11 and indicates that northern direction is the best placement for
windows in terms of energy savings for both Riyadh and Jeddah. For Riyadh
the second best direction is south and the two worst with similar value are east
and west, while west is the second best for Jeddah followed by east with
similar value and last south.
Figure 11 Window directions, comparison
The results for Riyadh agree with recommendation given by St Clair (2009)
that most windows should be placed at the north and south façade. However,
the results for Jeddah do not coincide with those recommendations. This is not
that strange since the study by St Clair is based on the climate of the neighbour
country, The United Arab Emirates which is east of Saudi Arabia while Jeddah
is located at the west coast of Saudi Arabia. That Jeddah requires cooling all
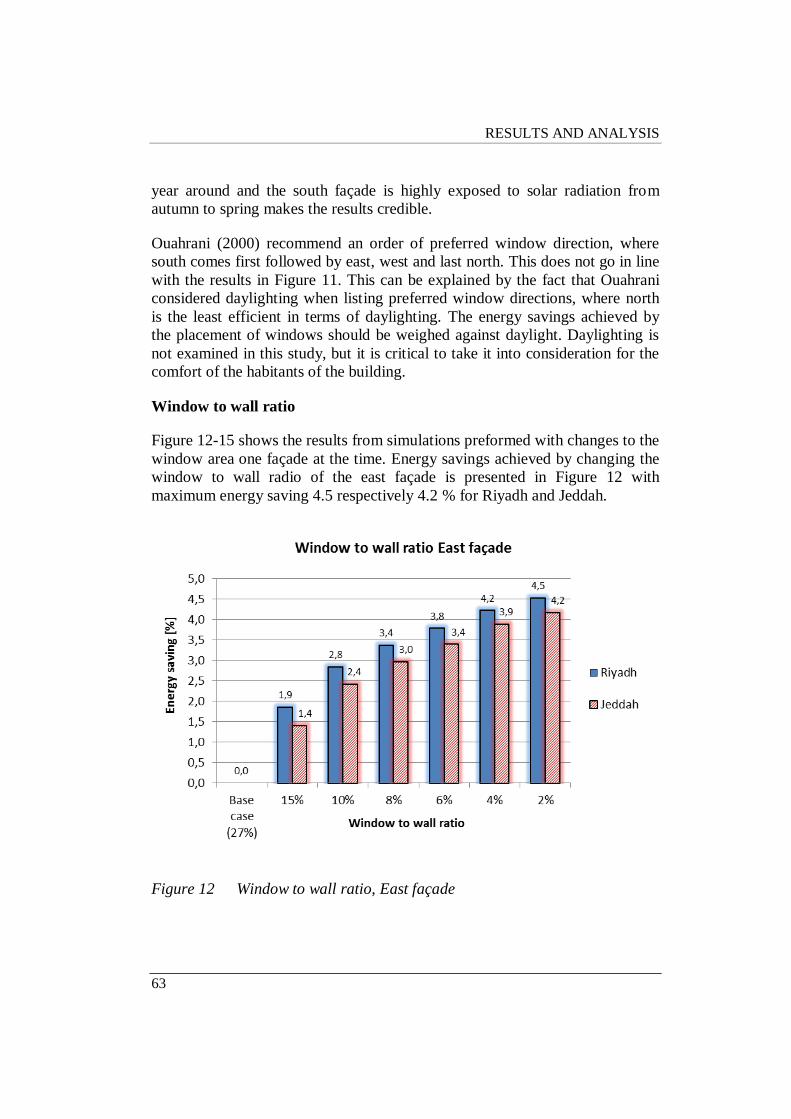
RESULTS AND ANALYSIS
63
year around and the south façade is highly exposed to solar radiation from
autumn to spring makes the results credible.
Ouahrani (2000) recommend an order of preferred window direction, where
south comes first followed by east, west and last north. This does not go in line
with the results in Figure 11. This can be explained by the fact that Ouahrani
considered daylighting when listing preferred window directions, where north
is the least efficient in terms of daylighting. The energy savings achieved by
the placement of windows should be weighed against daylight. Daylighting is
not examined in this study, but it is critical to take it into consideration for the
comfort of the habitants of the building.
Window to wall ratio
Figure 12-15 shows the results from simulations preformed with changes to the
window area one façade at the time. Energy savings achieved by changing the
window to wall radio of the east façade is presented in Figure 12 with
maximum energy saving 4.5 respectively 4.2 % for Riyadh and Jeddah.
Figure 12 Window to wall ratio, East façade
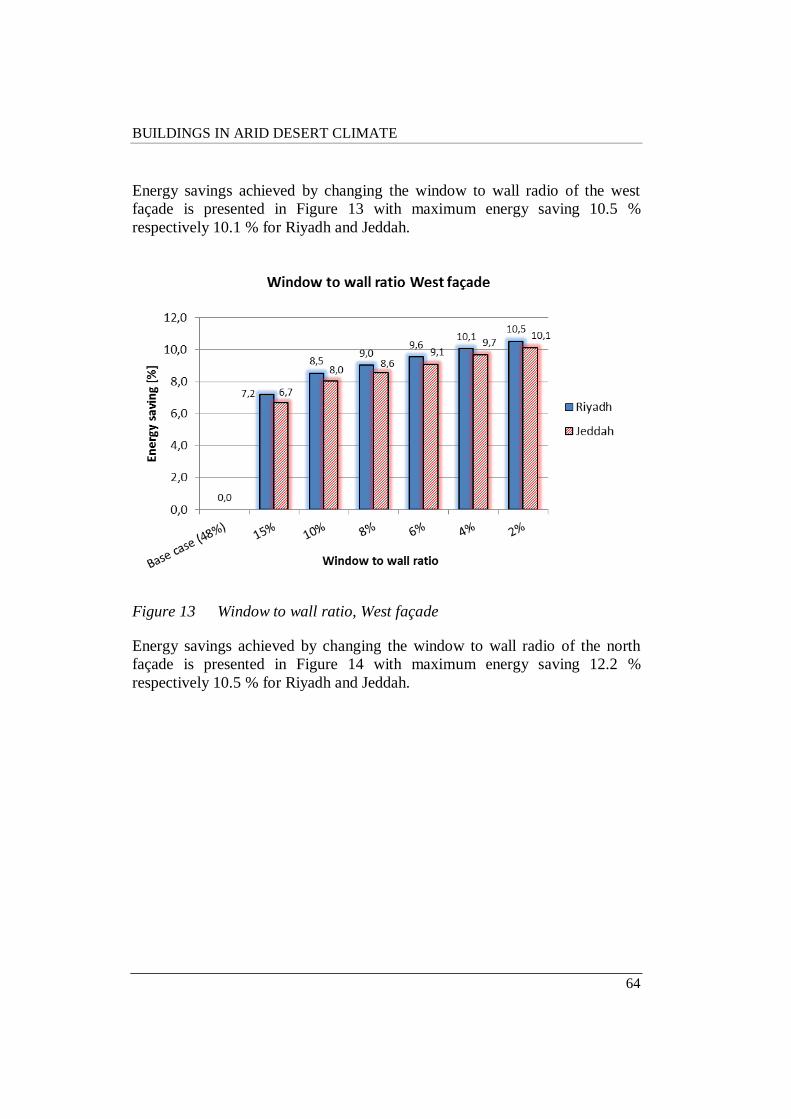
BUILDINGS IN ARID DESERT CLIMATE
64
Energy savings achieved by changing the window to wall radio of the west
façade is presented in Figure 13 with maximum energy saving 10.5 %
respectively 10.1 % for Riyadh and Jeddah.
Figure 13 Window to wall ratio, West façade
Energy savings achieved by changing the window to wall radio of the north
façade is presented in Figure 14 with maximum energy saving 12.2 %
respectively 10.5 % for Riyadh and Jeddah.
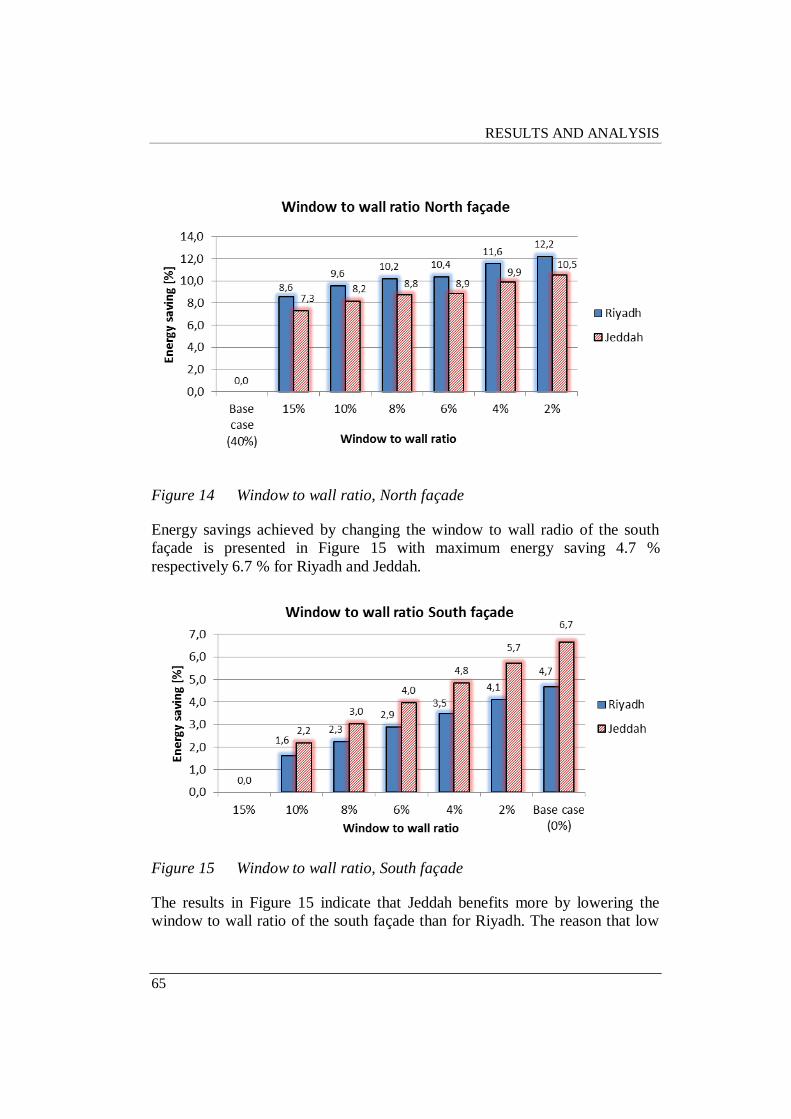
RESULTS AND ANALYSIS
65
Figure 14 Window to wall ratio, North façade
Energy savings achieved by changing the window to wall radio of the south
façade is presented in Figure 15 with maximum energy saving 4.7 %
respectively 6.7 % for Riyadh and Jeddah.
Figure 15 Window to wall ratio, South façade
The results in Figure 15 indicate that Jeddah benefits more by lowering the
window to wall ratio of the south façade than for Riyadh. The reason that low
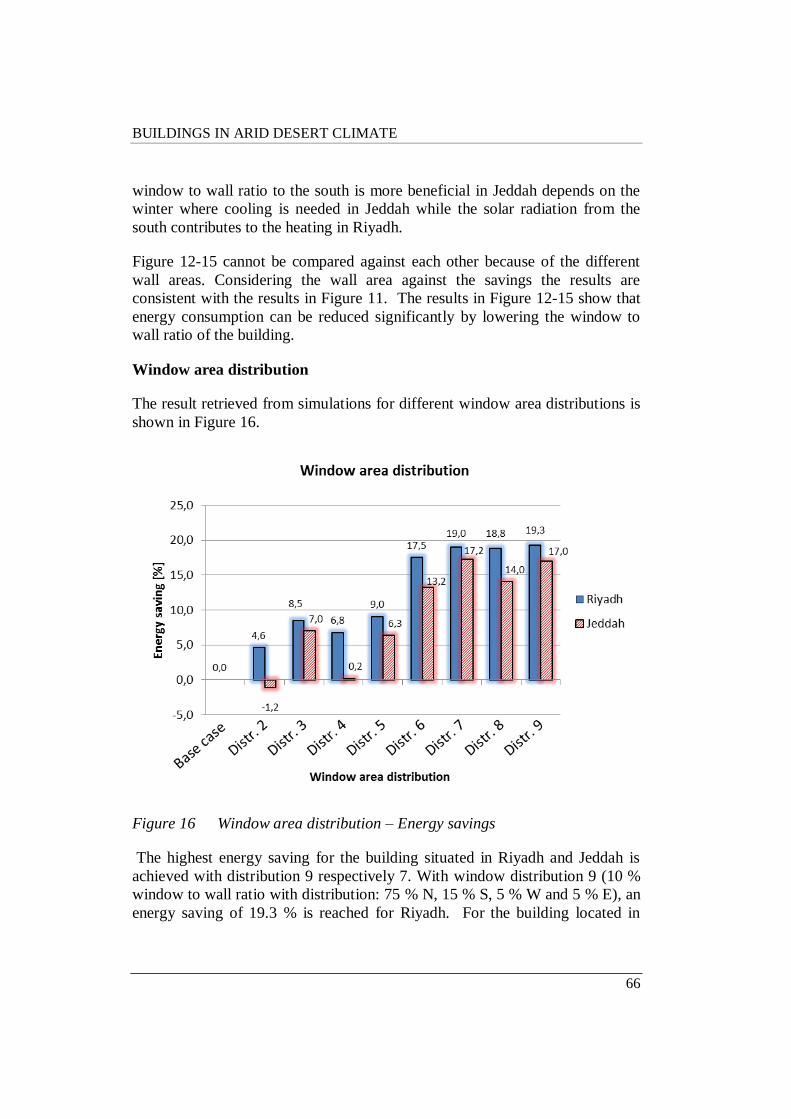
BUILDINGS IN ARID DESERT CLIMATE
66
window to wall ratio to the south is more beneficial in Jeddah depends on the
winter where cooling is needed in Jeddah while the solar radiation from the
south contributes to the heating in Riyadh.
Figure 12-15 cannot be compared against each other because of the different
wall areas. Considering the wall area against the savings the results are
consistent with the results in Figure 11. The results in Figure 12-15 show that
energy consumption can be reduced significantly by lowering the window to
wall ratio of the building.
Window area distribution
The result retrieved from simulations for different window area distributions is
shown in Figure 16.
Figure 16 Window area distribution – Energy savings
The highest energy saving for the building situated in Riyadh and Jeddah is
achieved with distribution 9 respectively 7. With window distribution 9 (10 %
window to wall ratio with distribution: 75 % N, 15 % S, 5 % W and 5 % E), an
energy saving of 19.3 % is reached for Riyadh. For the building located in
RESULTS AND ANALYSIS
67
Jeddah with window distribution 7 (10 % window to wall ratio with
distribution: 75 % N, 10 % W, 10 % E and 5 % S), an energy saving of 17.2 %
is achieved.
The results in Figure 16 show that the window to wall ratio has a larger impact
on the energy savings than the distribution of window area. However, a proper
distribution of windows can contribute to energy savings without the need of
adding extra building materials.
Window area and distribution have a major impact on the energy demand.
North façade is the most beneficial placement for windows in terms of energy
demand. Window area and distribution are important parameters in the hot
climate of Saudi Arabia. Lowering the window to wall ratio and changing the
window distribution can save up to 19 % in Riyadh and 17 % in Jeddah.
Highest energy savings are achieved with most windows at the north façade
and a few small windows on the other façades. The use of shadings affects the
impact of the window distribution. A lower total window to wall ratio than 10
% is not considered in the results with respect to daylighting. The amount of
natural daylight within the building is not considered in the simulations and
should be considered to achieve both energy savings and enough natural
daylighting.
5.2.4 Modification of the roof
The results from simulations with different roofs are represented in Figure 17.
The highest energy saving is achieved with roof 7 for both Riyadh and Jeddah.
However, the savings compared to base case are low even if the U-value is
improved considerably from 0.17 W/m2K (base case roof) to 0.06 W/m2K
(Roof 7). There is a major difference in energy use between Roof 1 without
insulation and the base case roof. Roof 4 - 7 with concrete structure achieves
higher energy savings than roof 8 – 11 with lightweight structure of wood.
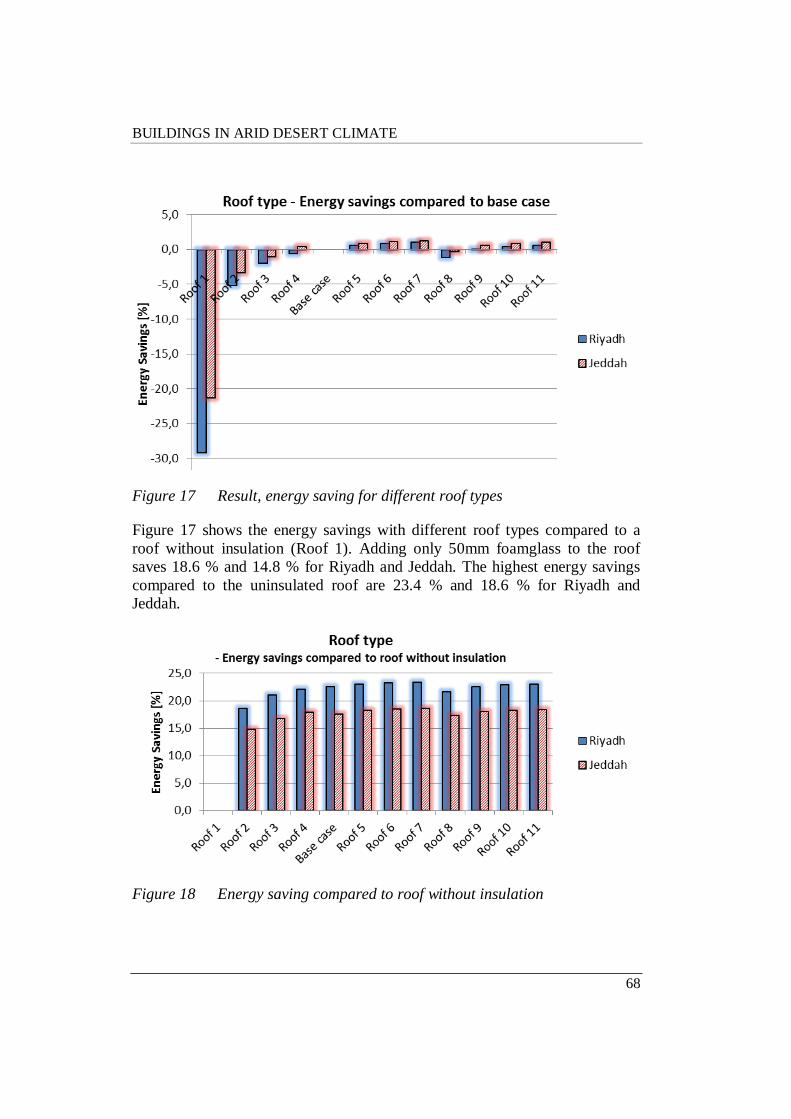
BUILDINGS IN ARID DESERT CLIMATE
68
Figure 17 Result, energy saving for different roof types
Figure 17 shows the energy savings with different roof types compared to a
roof without insulation (Roof 1). Adding only 50mm foamglass to the roof
saves 18.6 % and 14.8 % for Riyadh and Jeddah. The highest energy savings
compared to the uninsulated roof are 23.4 % and 18.6 % for Riyadh and
Jeddah.
Figure 18 Energy saving compared to roof without insulation
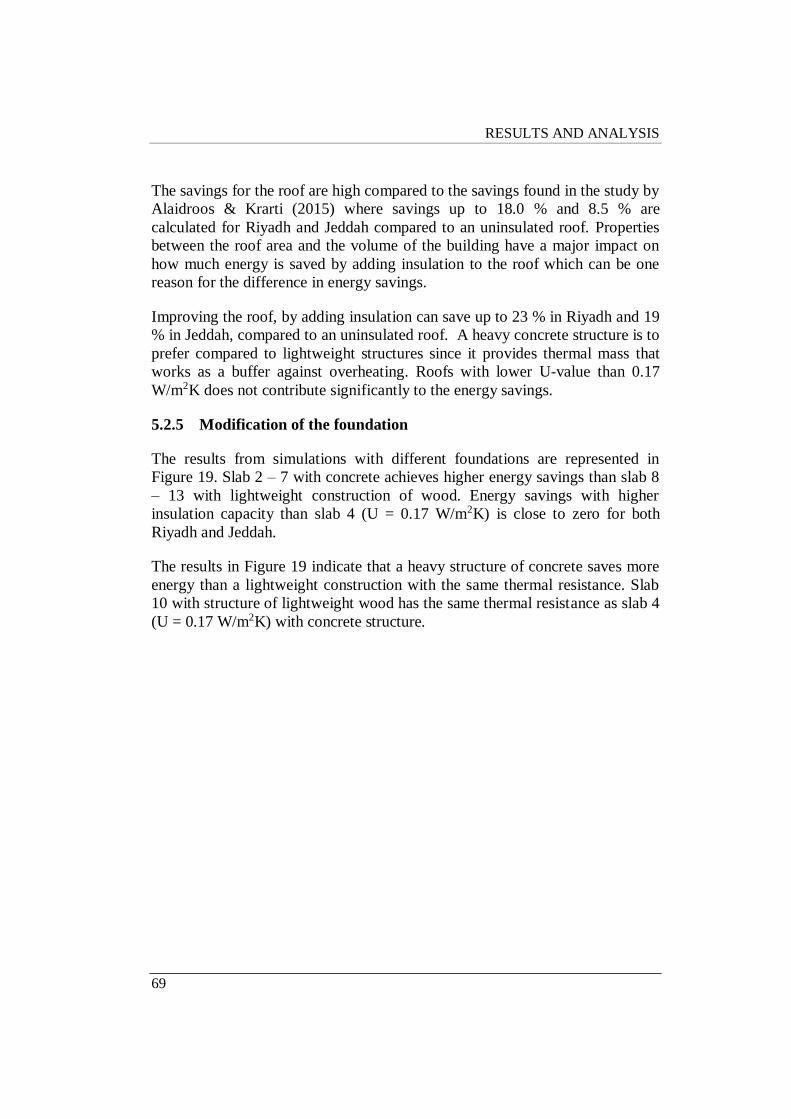
RESULTS AND ANALYSIS
69
The savings for the roof are high compared to the savings found in the study by
Alaidroos & Krarti (2015) where savings up to 18.0 % and 8.5 % are
calculated for Riyadh and Jeddah compared to an uninsulated roof. Properties
between the roof area and the volume of the building have a major impact on
how much energy is saved by adding insulation to the roof which can be one
reason for the difference in energy savings.
Improving the roof, by adding insulation can save up to 23 % in Riyadh and 19
% in Jeddah, compared to an uninsulated roof. A heavy concrete structure is to
prefer compared to lightweight structures since it provides thermal mass that
works as a buffer against overheating. Roofs with lower U-value than 0.17
W/m2K does not contribute significantly to the energy savings.
5.2.5 Modification of the foundation
The results from simulations with different foundations are represented in
Figure 19. Slab 2 – 7 with concrete achieves higher energy savings than slab 8
– 13 with lightweight construction of wood. Energy savings with higher
insulation capacity than slab 4 (U = 0.17 W/m2K) is close to zero for both
Riyadh and Jeddah.
The results in Figure 19 indicate that a heavy structure of concrete saves more
energy than a lightweight construction with the same thermal resistance. Slab
10 with structure of lightweight wood has the same thermal resistance as slab 4
(U = 0.17 W/m2K) with concrete structure.
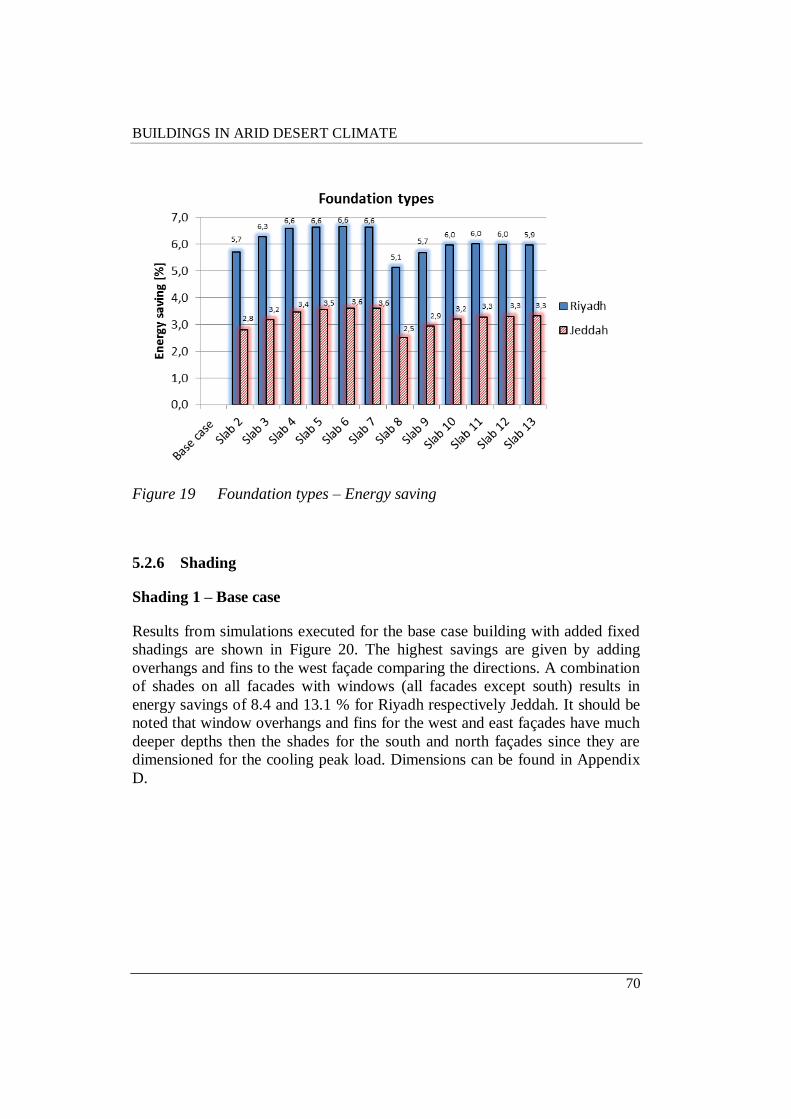
BUILDINGS IN ARID DESERT CLIMATE
70
Figure 19 Foundation types – Energy saving
5.2.6 Shading
Shading 1 – Base case
Results from simulations executed for the base case building with added fixed
shadings are shown in Figure 20. The highest savings are given by adding
overhangs and fins to the west façade comparing the directions. A combination
of shades on all facades with windows (all facades except south) results in
energy savings of 8.4 and 13.1 % for Riyadh respectively Jeddah. It should be
noted that window overhangs and fins for the west and east façades have much
deeper depths then the shades for the south and north façades since they are
dimensioned for the cooling peak load. Dimensions can be found in Appendix
D.
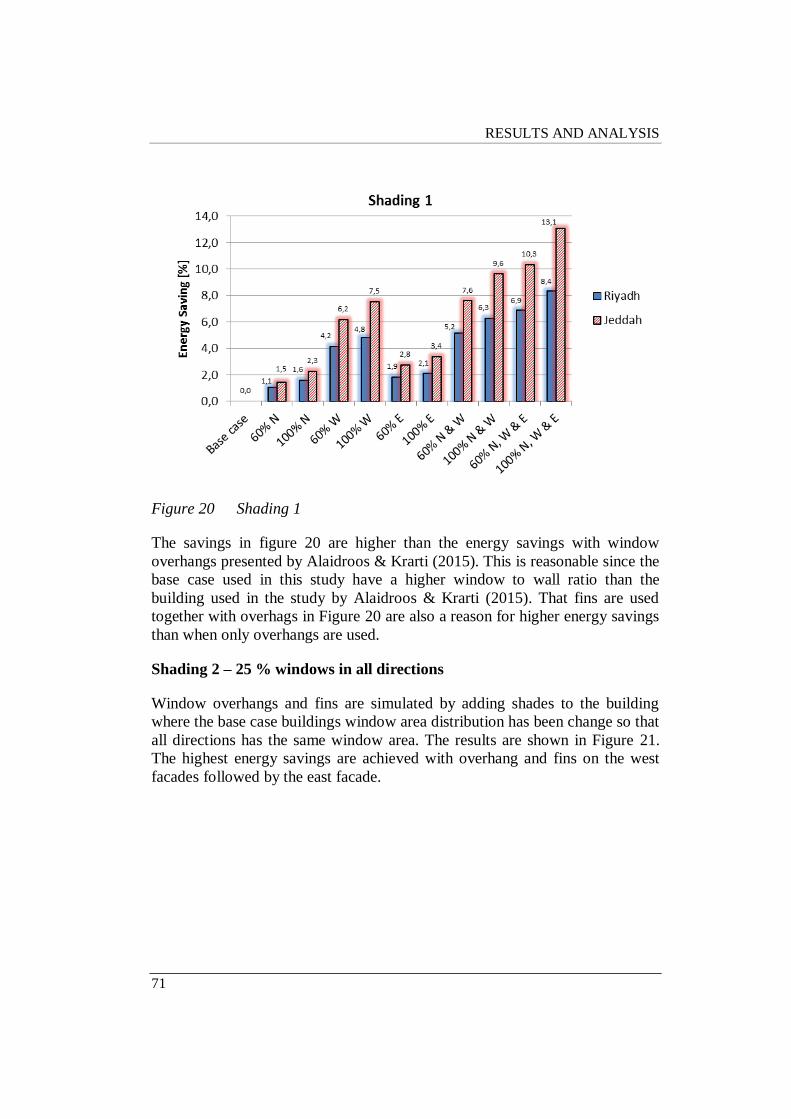
RESULTS AND ANALYSIS
71
Figure 20 Shading 1
The savings in figure 20 are higher than the energy savings with window
overhangs presented by Alaidroos & Krarti (2015). This is reasonable since the
base case used in this study have a higher window to wall ratio than the
building used in the study by Alaidroos & Krarti (2015). That fins are used
together with overhags in Figure 20 are also a reason for higher energy savings
than when only overhangs are used.
Shading 2 – 25 % windows in all directions
Window overhangs and fins are simulated by adding shades to the building
where the base case buildings window area distribution has been change so that
all directions has the same window area. The results are shown in Figure 21.
The highest energy savings are achieved with overhang and fins on the west
facades followed by the east facade.
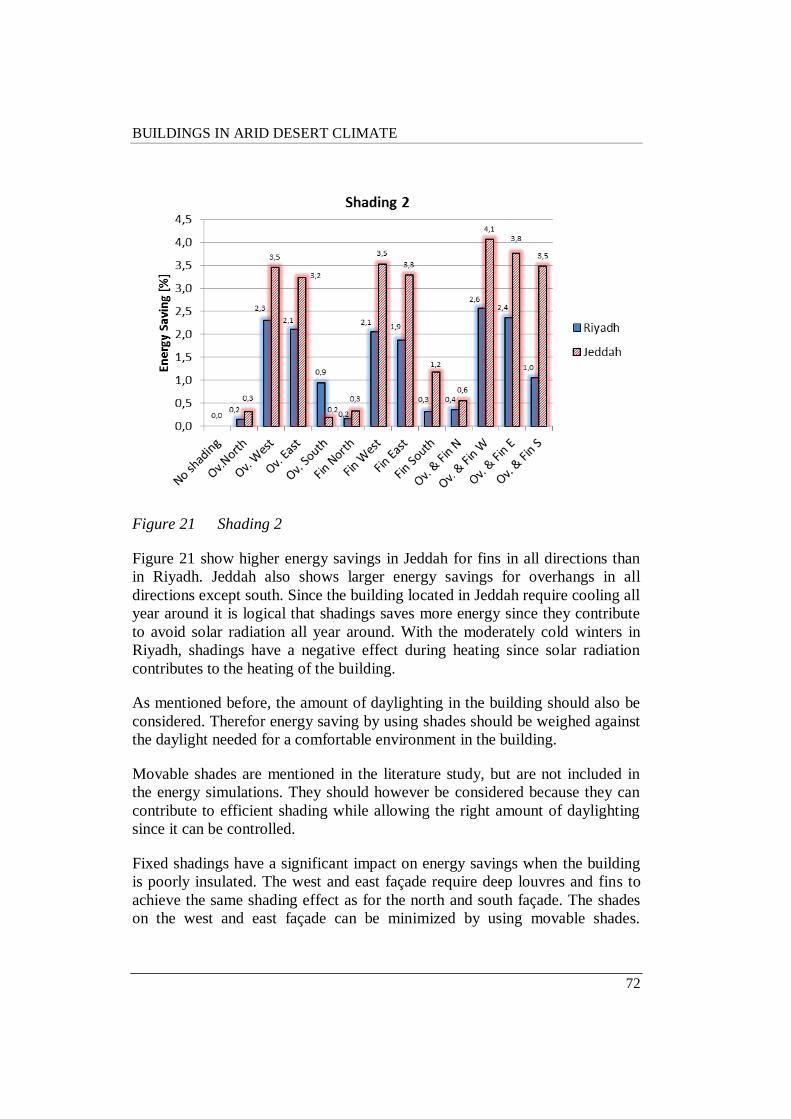
BUILDINGS IN ARID DESERT CLIMATE
72
Figure 21 Shading 2
Figure 21 show higher energy savings in Jeddah for fins in all directions than
in Riyadh. Jeddah also shows larger energy savings for overhangs in all
directions except south. Since the building located in Jeddah require cooling all
year around it is logical that shadings saves more energy since they contribute
to avoid solar radiation all year around. With the moderately cold winters in
Riyadh, shadings have a negative effect during heating since solar radiation
contributes to the heating of the building.
As mentioned before, the amount of daylighting in the building should also be
considered. Therefor energy saving by using shades should be weighed against
the daylight needed for a comfortable environment in the building.
Movable shades are mentioned in the literature study, but are not included in
the energy simulations. They should however be considered because they can
contribute to efficient shading while allowing the right amount of daylighting
since it can be controlled.
Fixed shadings have a significant impact on energy savings when the building
is poorly insulated. The west and east façade require deep louvres and fins to
achieve the same shading effect as for the north and south façade. The shades
on the west and east façade can be minimized by using movable shades.

RESULTS AND ANALYSIS
73
Shading has a greater impact on the energy demand for the climate of Jeddah
than for the climate of Riyadh. Natural daylighting should be considered when
dimensioning the shades, especially when fixed shades are used.
5.2.7 Modification of exterior surfaces
Different surfaces were tested, both for the exterior walls and the roof. The
results of simulations carried out with various roof surfaces are shown in
Figure 22. The greatest energy savings is achieved for white roof surface with
energy savings 0.9 % and 1.4 % for Riyadh respectively Jeddah. Changing the
roof surface has a greater impact in Jeddah compared to if the building is
situated in Riyadh.
Figure 22 Roof surface colour – Energy savings
Figure 23 shows energy savings with different surface colours for an
uninsulated roof.
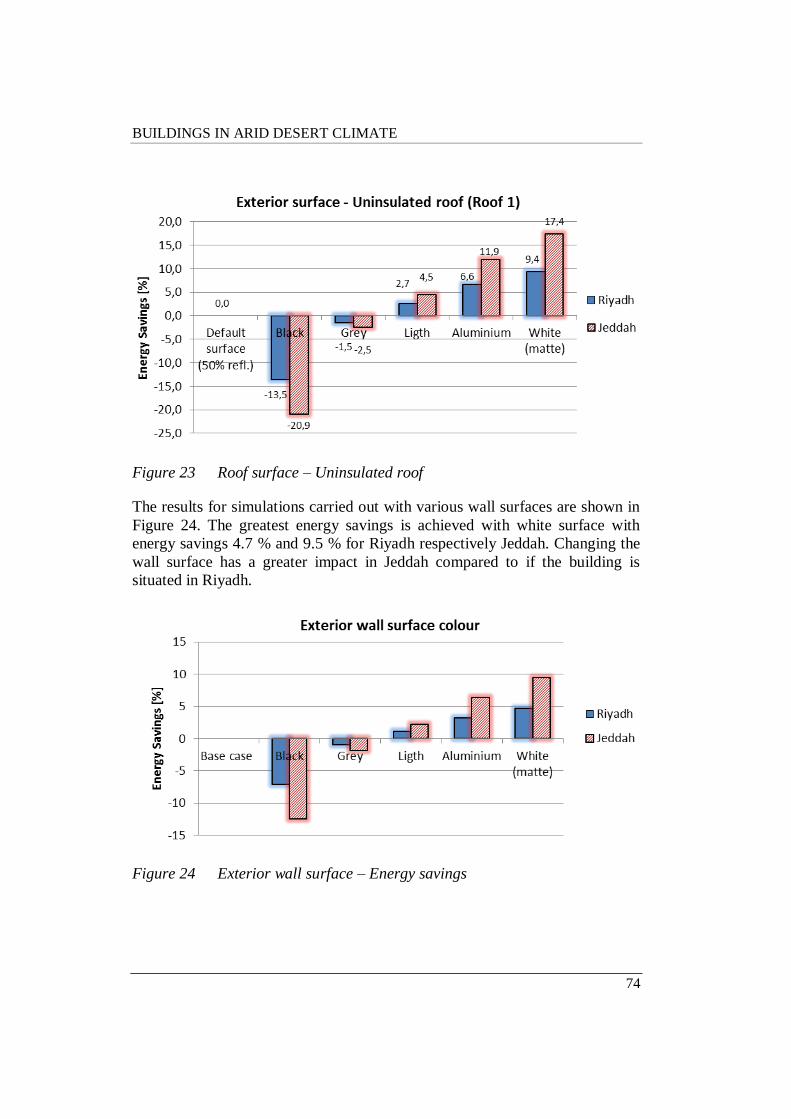
BUILDINGS IN ARID DESERT CLIMATE
74
Figure 23 Roof surface – Uninsulated roof
The results for simulations carried out with various wall surfaces are shown in
Figure 24. The greatest energy savings is achieved with white surface with
energy savings 4.7 % and 9.5 % for Riyadh respectively Jeddah. Changing the
wall surface has a greater impact in Jeddah compared to if the building is
situated in Riyadh.
Figure 24 Exterior wall surface – Energy savings
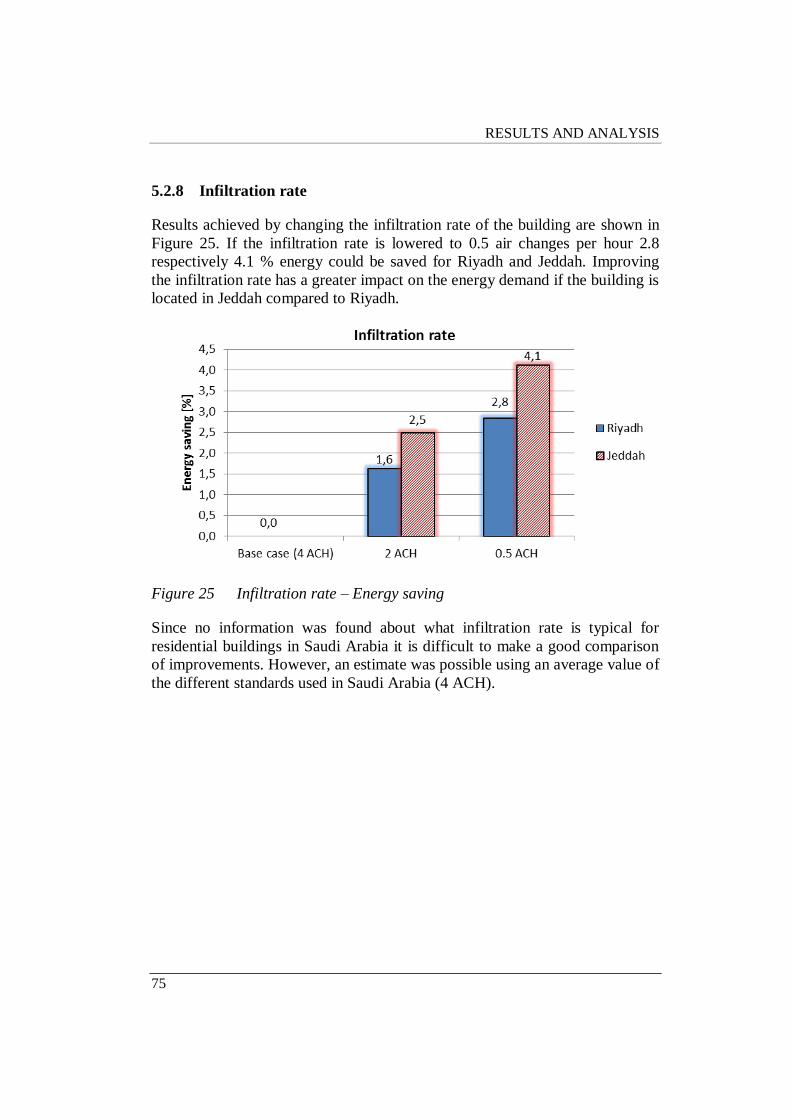
RESULTS AND ANALYSIS
75
5.2.8 Infiltration rate
Results achieved by changing the infiltration rate of the building are shown in
Figure 25. If the infiltration rate is lowered to 0.5 air changes per hour 2.8
respectively 4.1 % energy could be saved for Riyadh and Jeddah. Improving
the infiltration rate has a greater impact on the energy demand if the building is
located in Jeddah compared to Riyadh.
Figure 25 Infiltration rate – Energy saving
Since no information was found about what infiltration rate is typical for
residential buildings in Saudi Arabia it is difficult to make a good comparison
of improvements. However, an estimate was possible using an average value of
the different standards used in Saudi Arabia (4 ACH).
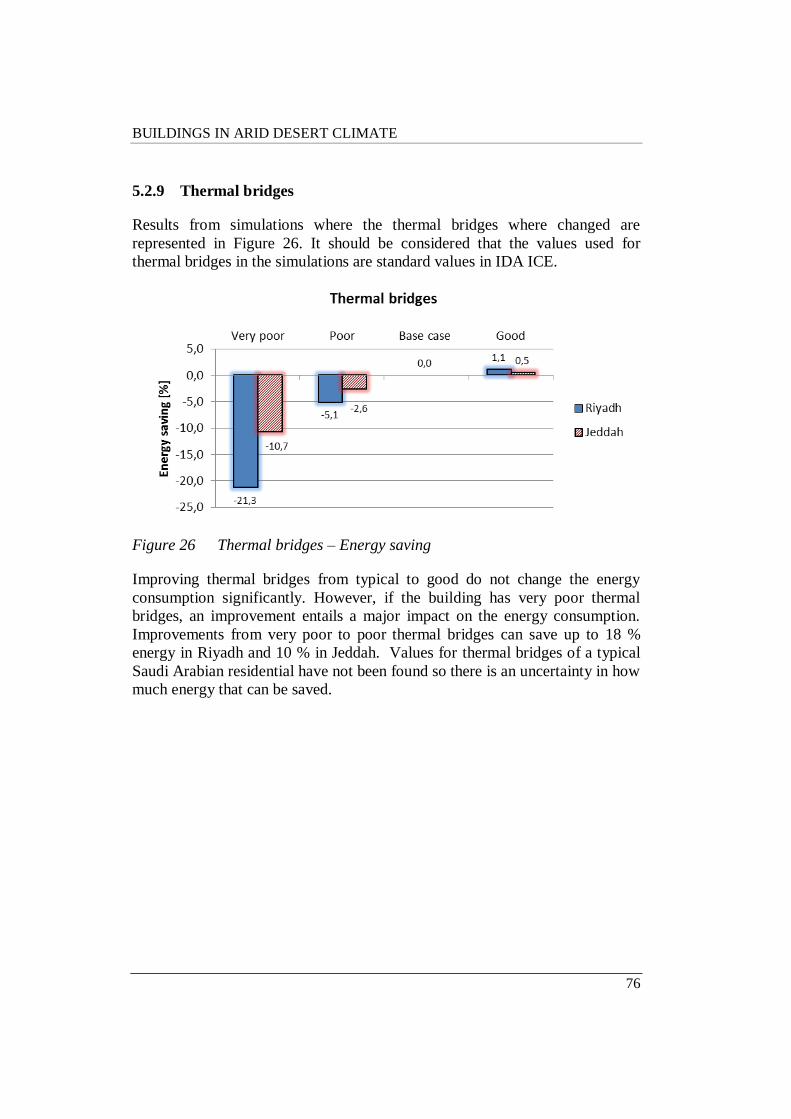
BUILDINGS IN ARID DESERT CLIMATE
76
5.2.9 Thermal bridges
Results from simulations where the thermal bridges where changed are
represented in Figure 26. It should be considered that the values used for
thermal bridges in the simulations are standard values in IDA ICE.
Figure 26 Thermal bridges – Energy saving
Improving thermal bridges from typical to good do not change the energy
consumption significantly. However, if the building has very poor thermal
bridges, an improvement entails a major impact on the energy consumption.
Improvements from very poor to poor thermal bridges can save up to 18 %
energy in Riyadh and 10 % in Jeddah. Values for thermal bridges of a typical
Saudi Arabian residential have not been found so there is an uncertainty in how
much energy that can be saved.
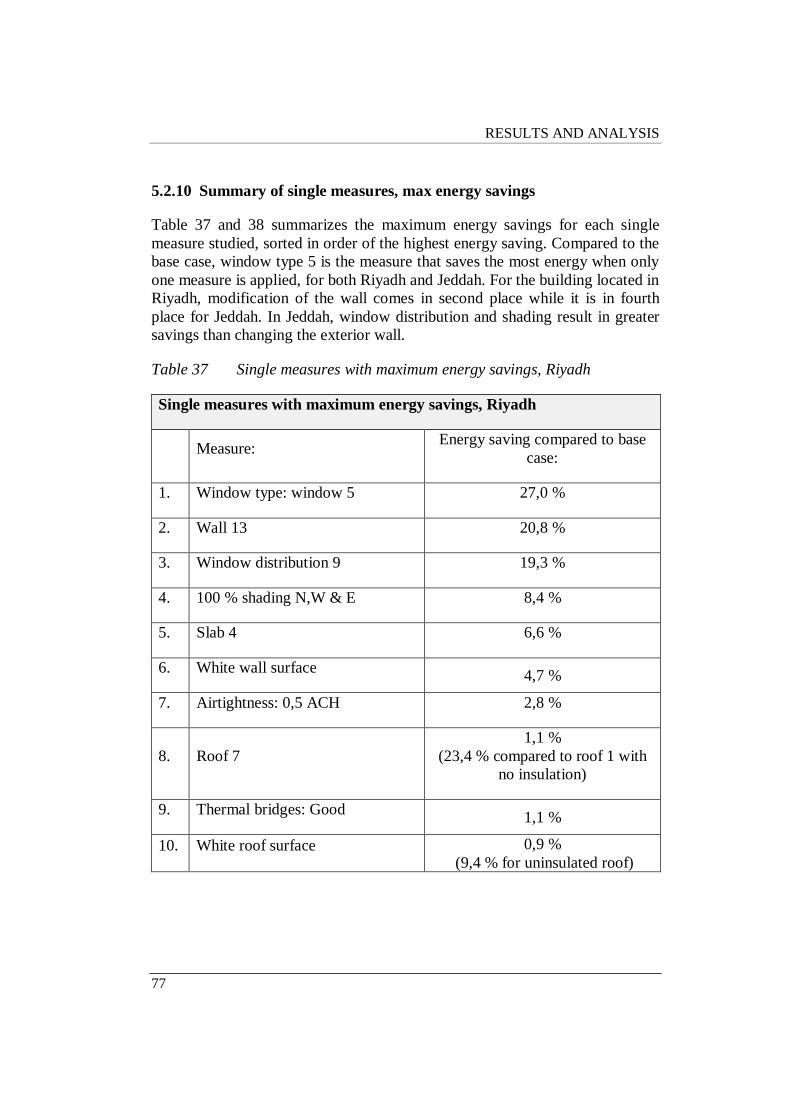
RESULTS AND ANALYSIS
77
5.2.10 Summary of single measures, max energy savings
Table 37 and 38 summarizes the maximum energy savings for each single
measure studied, sorted in order of the highest energy saving. Compared to the
base case, window type 5 is the measure that saves the most energy when only
one measure is applied, for both Riyadh and Jeddah. For the building located in
Riyadh, modification of the wall comes in second place while it is in fourth
place for Jeddah. In Jeddah, window distribution and shading result in greater
savings than changing the exterior wall.
Table 37 Single measures with maximum energy savings, Riyadh
Single measures with maximum energy savings, Riyadh
Measure: Energy saving compared to base
case:
1. Window type: window 5 27,0 %
2. Wall 13 20,8 %
3. Window distribution 9 19,3 %
4. 100 % shading N,W & E 8,4 %
5. Slab 4 6,6 %
6. White wall surface 4,7 %
7. Airtightness: 0,5 ACH 2,8 %
8. Roof 7
1,1 %
(23,4 % compared to roof 1 with
no insulation)
9. Thermal bridges: Good 1,1 %
10. White roof surface 0,9 %
(9,4 % for uninsulated roof)

BUILDINGS IN ARID DESERT CLIMATE
78
Table 38 Single measures with maximum energy savings, Jeddah
Single measures with maximum energy savings, Jeddah
Measure: Energy saving compared to base
case:
1. Window type: window 5 21,3 %
2. Window distribution 7 17,2 %
3. 100 % shading N,W & E 13,1 %
4. Wall 3 11,2 %
5. White wall surface 9,5 %
6. Airtightness: 0,5 ACH 4,1 %
7. Slab 6 3,6 %
8. White roof surface 0,9 %
(17,4 % for uninsulated roof)
9. Roof 7 0,8 %
(18,6 % compared to roof 1 with no
insulation)
10. Thermal bridges: Good 0,5 %
Both roof type and roof surface is higher up in the lists of maximum energy
savings for single measures when the roof is uninsulated which can be seen in
the parentheses in Table 35 and 36. The exterior wall surface can also be
expected to have lower impact on the energy consumption when the walls are
insulated.
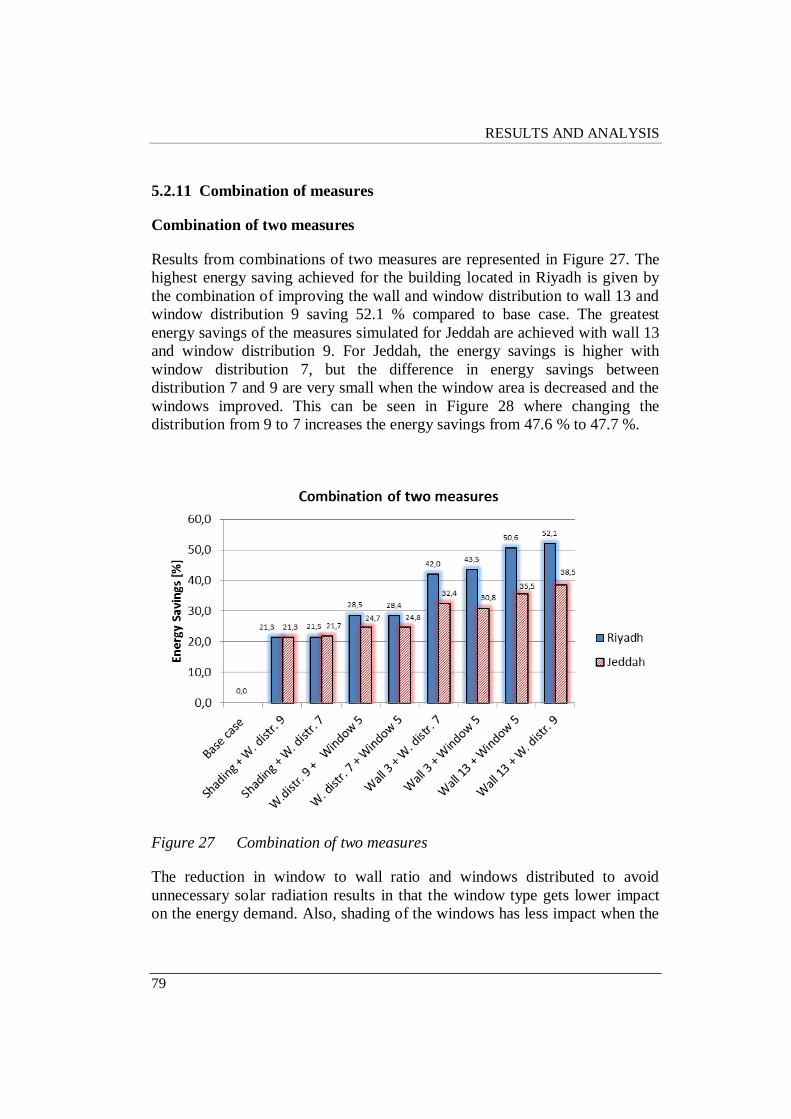
RESULTS AND ANALYSIS
79
5.2.11 Combination of measures
Combination of two measures
Results from combinations of two measures are represented in Figure 27. The
highest energy saving achieved for the building located in Riyadh is given by
the combination of improving the wall and window distribution to wall 13 and
window distribution 9 saving 52.1 % compared to base case. The greatest
energy savings of the measures simulated for Jeddah are achieved with wall 13
and window distribution 9. For Jeddah, the energy savings is higher with
window distribution 7, but the difference in energy savings between
distribution 7 and 9 are very small when the window area is decreased and the
windows improved. This can be seen in Figure 28 where changing the
distribution from 9 to 7 increases the energy savings from 47.6 % to 47.7 %.
Figure 27 Combination of two measures
The reduction in window to wall ratio and windows distributed to avoid
unnecessary solar radiation results in that the window type gets lower impact
on the energy demand. Also, shading of the windows has less impact when the
BUILDINGS IN ARID DESERT CLIMATE
80
window to wall ratio is lowered. The savings achieved with a combination of
shading and changed window distribution is only a few percent higher than
when changed window distribution is the only measure.
The energy savings achieved with a combination of improved walls and
windows (Wall 13 + Window 5) are similar to the highest energy savings
achieved with changes in window distribution and exterior walls. If only two
measures on the building envelope was to be chosen there are two ways to go.
Either to keep the bigger windows and improve the thermal resistance of the
walls combined with improving the window or improve the thermal resistance
of the walls in combination with decreasing the window area (and change
distribution). It should be considered that the roof is already insulated for the
base case and if the roof where uninsulated the measures in Figure 27 would
have less impact on the energy savings.
The impact of the thermal resistance of the exterior walls decreases
significantly with higher window to wall ratios and poorly insulated windows.
In Jeddah, where almost no heating is required, it is not beneficial with well
insulated walls in combination with big windows with high U-value. When a
reflective window with low U-value or small windows are used, well insulated
walls are beneficial. In Riyadh where heating of the building is required, it is
advantageous with insulated walls even if no other measures are made on the
building envelope.
Combination of three measures
Results from energy simulations for combinations of three measures are
represented in Figure 28. The highest energy saving achieved for the building
located in Riyadh is given by the combination of improving the wall, the
window and the window distribution to wall 13, window 5 and window
distribution 9 saving 62.2 % compared to base case. The greatest energy saving
for the building located in Jeddah is obtained by the measures; wall 13,
window 5 and window distribution 7 saving 47.7 %.
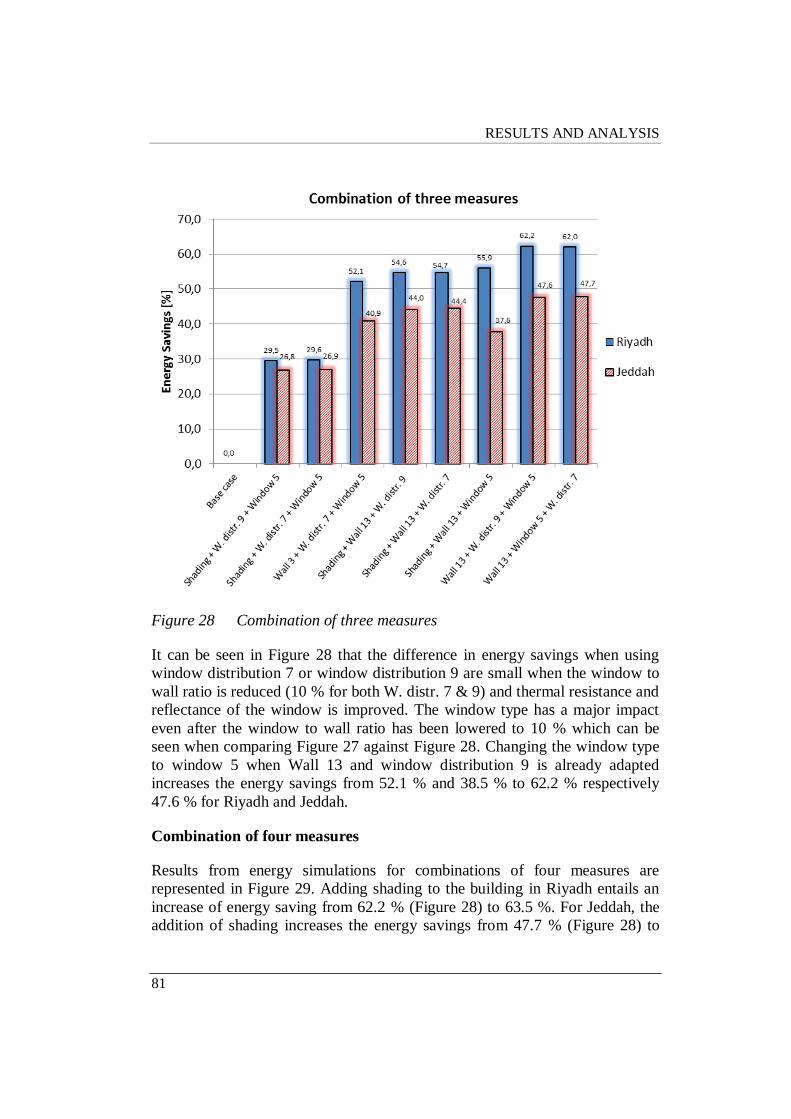
RESULTS AND ANALYSIS
81
Figure 28 Combination of three measures
It can be seen in Figure 28 that the difference in energy savings when using
window distribution 7 or window distribution 9 are small when the window to
wall ratio is reduced (10 % for both W. distr. 7 & 9) and thermal resistance and
reflectance of the window is improved. The window type has a major impact
even after the window to wall ratio has been lowered to 10 % which can be
seen when comparing Figure 27 against Figure 28. Changing the window type
to window 5 when Wall 13 and window distribution 9 is already adapted
increases the energy savings from 52.1 % and 38.5 % to 62.2 % respectively
47.6 % for Riyadh and Jeddah.
Combination of four measures
Results from energy simulations for combinations of four measures are
represented in Figure 29. Adding shading to the building in Riyadh entails an
increase of energy saving from 62.2 % (Figure 28) to 63.5 %. For Jeddah, the
addition of shading increases the energy savings from 47.7 % (Figure 28) to
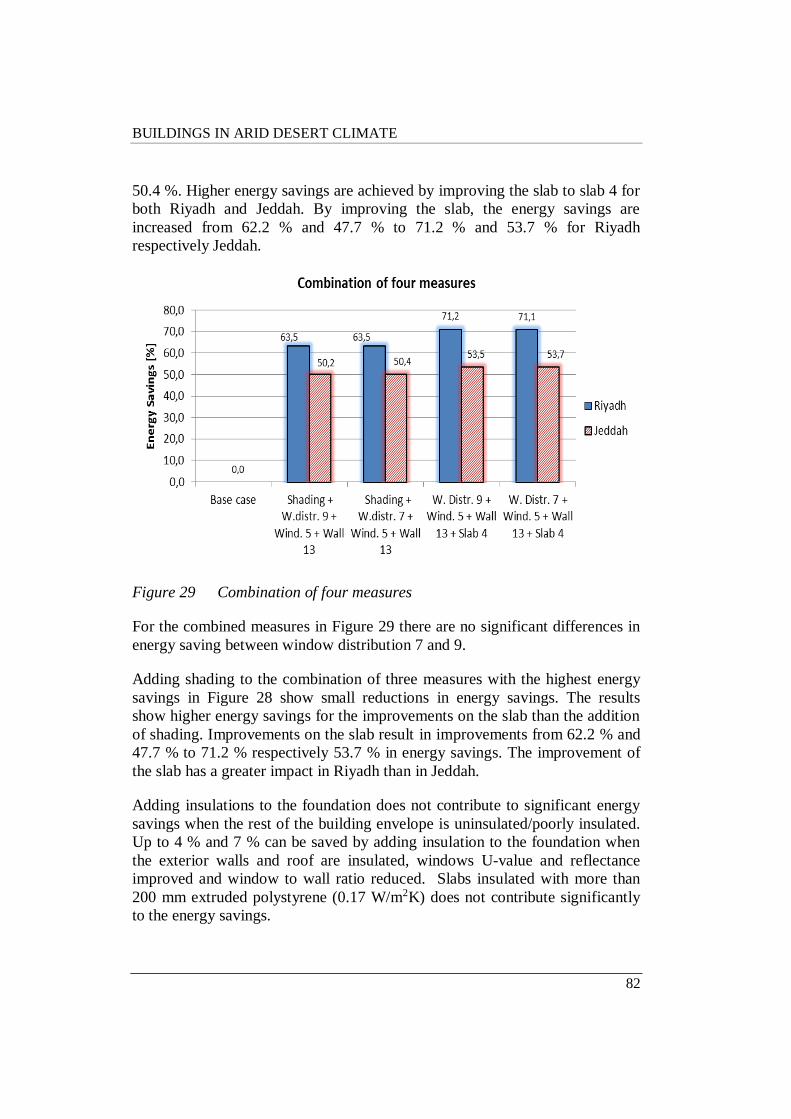
BUILDINGS IN ARID DESERT CLIMATE
82
50.4 %. Higher energy savings are achieved by improving the slab to slab 4 for
both Riyadh and Jeddah. By improving the slab, the energy savings are
increased from 62.2 % and 47.7 % to 71.2 % and 53.7 % for Riyadh
respectively Jeddah.
Figure 29 Combination of four measures
For the combined measures in Figure 29 there are no significant differences in
energy saving between window distribution 7 and 9.
Adding shading to the combination of three measures with the highest energy
savings in Figure 28 show small reductions in energy savings. The results
show higher energy savings for the improvements on the slab than the addition
of shading. Improvements on the slab result in improvements from 62.2 % and
47.7 % to 71.2 % respectively 53.7 % in energy savings. The improvement of
the slab has a greater impact in Riyadh than in Jeddah.
Adding insulations to the foundation does not contribute to significant energy
savings when the rest of the building envelope is uninsulated/poorly insulated.
Up to 4 % and 7 % can be saved by adding insulation to the foundation when
the exterior walls and roof are insulated, windows U-value and reflectance
improved and window to wall ratio reduced. Slabs insulated with more than
200 mm extruded polystyrene (0.17 W/m2K) does not contribute significantly
to the energy savings.
RESULTS AND ANALYSIS
83
Additional measures
Adding more measures to the combinations used for four measures does not
change the energy use significantly. Of the remaining measures, improving the
airtightness shows the highest impact when improved to 0.5 ACH. The surface
colour does not have that much of an impact in combination with
improvements of the thermal resistance of the envelope. Using bright/reflective
colours on the exterior wall and roof surfaces can be recommended when the
wall/roof are uninsulated. The energy savings are however small when
insulation is used in the exterior wall/roof for surfaces with reflectance higher
than 50 %. Dark colours are not recommended. The complete results for the
additional measures are represented in Appendix E.
BUILDINGS IN ARID DESERT CLIMATE
84
6 DISCUSSION AND CONCLUSION
6.1 Addressing the research questions
1. What is the climate of Saudi Arabia and how may it impact the
buildings energy consumption?
The climate of Saudi Arabia is characterized by its hot summers where
reducing the cooling load is the main challenge concerning energy demand of
buildings. There are large heat loads due to solar radiation, especially during
summer. Horizontal surfaces will receive the gratest intensity of solar
radiation. Of the vertical façades, the east and west façades are most exposed to
solar radiation. The north façade only receives solar radiation for a short part of
the year.
The Midlands (Riyadh) are dry with large diurnal temperature swings during
summer. The diurnal temperature swings cause peak cooling loads during the
day while cold nights can be used to cool the building through ventilation. In
the Midlands (Riyadh) the winters are colder with temperatures down to 2˚C
which entails a need for heating.
At the cost (Jeddah) the climate is moist, characterized by hot and humid
summers and mild short winters and heating requirements are close to zero.
The mild short winters result in a need of cooling buildings almost all year
around.
DISCUSSION AND CONCLUSION
85
2. How does it affect the energy consumption if the building is located
at the coast (Jeddah) or in the midlands (Riyadh)?
The question is partly answered in the other research questions where the
measures and their impacts on the energy demand for the two cities are
described.
Most measures on the building envelope have higher impact on the energy
demand in Riyadh than in Jeddah. This can be explained by the difference in
AHU cooling between the cities, where the energy required for AHU cooling is
barely affected by the measures on the envelope. The energy required for AHU
cooling in Jeddah is more than twice the energy required for AHU cooling in
Riyadh. Because of the major difference in energy required for AHU cooling it
is not possible to save as much energy with measures on the building envelope
in Jeddah as in Riyadh. To reach the same energy savings in Jeddah as in
Riyadh other measures should be consider for lowering the energy for AHU
cooling.
The total energy demand for heating and cooling is higher in Jeddah than in
Riyadh. However, both peak cooling load and heating load are greater for
buildings in Riyadh, which implies that the risk for overheating is higher in
Riyadh than in Jeddah. Both cities experience peak cooling load in July and
peak heating load in January. However, since there is almost no need for
heating in Jeddah, January and February are the months with the lowest energy
demand. For Riyadh, the minimum energy demand is in between the heating
and cooling seasons, in March and November.
3. How is the energy consumption affected by different measures on
the building in the climate of Riyadh and Jeddah?
The energy consumption has different affect by the varying measures on the
building and varying climate of Riyadh and Jeddah. Energy savings for single
measures on the building envelope vary from 1 – 27 % for Riyadh and 1 – 21
% for Jeddah. The measure providing the lowest energy saving for both cities
is improved thermal bridges while improved window type achieves the highest
energy savings.
The measures with the highest energy saving, was the improvement of window
type which gave up to 27 % energy savings in Riyadh an 21 % in Jeddah by
improving the thermal resistance and reflectance of the windows compared to
clear single glass windows. Up to 23 % energy savings could be achieved by
BUILDINGS IN ARID DESERT CLIMATE
86
adding insulation to the roof in Riyadh and up to 19 % in Jeddah compared to
an uninsulated roof. Lowering the window to wall ratio and changing the
window distribution can save up to 19 % in Riyadh and 17 % in Jeddah.
To save energy, the window type should be high reflective with low U-value,
since they are one of the biggest contributors of heat gain. Window area and
distribution have a major impact on the energy demand. North façade is the
most beneficial placement for windows in terms of energy demand.
The roof should always be insulated because the high amount of solar radiation
in the desert climate. However, the simulations indicate that quite thin layers
(about 100 – 200 mm) are sufficient. This was surprising, since roof insulation
is typically recommended to be about a half meter in thickness. It is easy to
think that this would be the case for the desert climate to, because of the major
amount of solar radiation.
When it comes to improving the thermal resistance of the external walls it was
surprising to see the major difference in energy savings between Riyadh and
Jeddah. Even though there is a difference in climate between the cities the
difference was higher than expected. For improvements of the walls a wall
with 200 mm LWC was the wall saving most energy of the walls simulated
while a wall with 400 mm insulation saved the most energy in Riyadh. What
was most surprising about this was that additional insulation only resulted in
even higher energy demand in Jeddah.
The result for wall simulations in Jeddah indicate that the order in which
measures on the envelope are performed are critical to achieve the energy
savings one hopes to reach, avoiding a negative effect.
4. How is the energy consumption affected by combined measures on
the building envelope in the climate of Riyadh and Jeddah?
The measures that have the highest impact on the energy savings when
combining several measures (Measures in addition to improved thermal
resistance of the roof) on the building envelope are:
• Two measures: Window area & distribution + Thermal resistance of
exterior wall
DISCUSSION AND CONCLUSION
87
• Three measures: Window area & distribution + Thermal resistance of
exterior wall + Window U-value and reflectance
• Four measures: Window area & distribution + Thermal resistance of
exterior wall + Window U-value and reflectance + Thermal resistance
of the foundation
When applying two measures (in addition to improved thermal resistance of
the roof) up to 52 % energy can be saved in Riyadh and up to 39 % in Jeddah.
For three measures, up to 62 % energy can be saved in Riyadh and up to 48 %
in Jeddah. Adding a fourth measure, energy savings up to 71 % can be
achieved in Riyadh and up to 54 % in Jeddah.
Shading loses its impact on energy savings with lower window to wall ratio
and better window in terms of thermal resistance and solar heat gain
coefficient.
When the window area is decreased and the windows improved, insulation to
the exterior walls are recommended in Jeddah. Which is a major difference
from the results for simulations of single measures where additional insulation
had a negative effect on the energy savings (where single glass windows were
used). This indicates that there is no use for improvements on the thermal
resistance of the exterior walls in Jeddah before considering heat gain trough
windows.
Applying shades for the windows as a fourth measure instead of improving the
windows achieves energy savings not far from the highest savings achieved
with improved U-value and reflectance of the windows in Jeddah. In Riyadh
there is a larger difference in energy savings between the measures and
improved window type can be recommended based on the simulations in this
study.
6.2 Conclusions
The study showed that the impact of the window type on the energy demand
decreases with lower window to wall ratio. However, the window type has a
significant impact on the energy savings even when low window to wall ratio
(10 %) is adapted.
To save energy, the window type should be reflective with low U-value, since
they are one of the biggest contributors of heat gain.
BUILDINGS IN ARID DESERT CLIMATE
88
In Jeddah shades are almost as effective as improvement of the windows
thermal resistance when measures are combined. From the simulations, it
would seem most beneficial with improved reflective windows on the west and
east façade were fixed overhangs and fins must be deep to shade the windows
during peak cooling load, while rather small overhangs and fins can shade the
windows on the south and north façade.
The roof simulation showed that a heavy concrete structure is to prefer
compared to lightweight structures since it provides thermal mass that works as
a buffer against overheating.
Both simulations for the roof and the walls showed that a thin layer of
insulation is efficient, since the effect of adding more insulation decreases
significantly with thicker insulation layers.
The simulations indicate that there is no use for improvements on the thermal
resistance of the exterior walls in Jeddah before considering heat gain trough
windows. Adding insulation can have a negative effect on energy savings if
windows have low thermal resistance and the window to wall ratio is high.
Adding insulation to the foundation only saves significant amounts of energy if
the walls and roof has been insulated and the windows improved.
Applying shades to the windows saves significant amount of energy especially
at the coast (Jeddah). From what have been shown in this study, energy savings
obtained using shades decreases with higher thermal resistance of the
windows, lower window area and higher reflectance of the windows. The same
is shown for reflective surface colours, where the savings are high when the
walls and roof are uninsulated and does not contribute significantly to the
energy savings when combined with measures regarding the thermal resistance
of the building envelope.
When combining measures on the building envelope, the windows, the roof
and the walls should be considered first to get as high energy savings as
possible.
One of the greatest difference between the cities Riyadh and Jeddah that has
been discovered in this study is that the energy savings achieved by energy
efficiency measures on the envelope is much higher in Riyadh than in Jeddah
using the same measures. This because there is a lot more energy going to
AHU cooling in Jeddah than in Riyadh during a year. About 250 % more

DISCUSSION AND CONCLUSION
89
energy during a year in Jeddah than in Riyadh. The energy for AHU cooling is
not significantly reduced by any measures on the envelope evaluated in this
study which is why there it is impossible to achieve the same energy savings in
Jeddah as in Riyadh using only measures on the building envelope.
6.3 Reliability and validity
The results and conclusions in this study are only valid for climates similar to
the climate of Riyadh and Jeddah and building similar to the building used in
this study. The energy savings will differ with different building design, while
the main conclusions can be adapted for different types of residential buildings.
There is a margin of error that comes with the assumptions made. Assumptions
that were made for the ventilation and parameters related to occupants have a
major impact on the buildings energy demand. Especially in Jeddah where
AHU cooling is a large part of the total energy demand. With higher rates of
supply and exhaust air the measures on the building envelope will most likely
have less impact on the energy demand. The air exchange rate is probably the
greatest uncertainty in this study, because of the extreme climate.
The windows are set to “never open” in IDA ICE, which also contributes to the
margin of error since open windows contributes to heat load as well as cooling
the building depending on the outside temperature.
6.4 Suggestions for further studies
This study has focused on the building envelope. Since it was found that AHU
cooling accounts for a large part of the energy consumption (mainly in
Jeddah), energy efficiency measures concerning the air handling unit should be
considered in combination with measures on the building envelope to enable
even higher energy savings.
For more accurate energy simulations, it would be beneficial to know more
about the parameters connected to the occupants in Saudi Arabia. Without a
standard, it is difficult to compare between several studies because the
assumptions are different for each one.
To learn how well insulated buildings perform in hot desert climate in terms of
condensation and durability of the materials would be essential to estimate the
gains and feasibility of improving the thermal resistance of the building
envelope.
BUILDINGS IN ARID DESERT CLIMATE
90
It would also be interesting to investigate the combination of window to wall
ratio, shading and daylighting to find a sufficient combination of energy saving
and daylighting.

References
91
REFERENCES
Abdelrahman, M. A., & Ahmad, A. (1991). Cost-effective use of thermal
insulation in hot climates. Building and Environment, 26(2), 189-194.
Aboulnaga, M. M. (2006). Towards green buildings: Glass as a building
element—the use and misuse in the gulf region. Renewable Energy, 31(5),
631-653.
Ahmad, E. H. (2002, December). Cost analysis and thickness optimization of
thermal insulation materials used in residential buildings in Saudi Arabia. In
Proceedings of the 6th Saudi Engineering Conference, Dhahran, Saudi Arabia
(pp. 14-17).
Ahmed, B. Y. M. (1997). Climatic classification of Saudi Arabia: An
application of factor--Cluster analysis. GeoJournal, 41(1), 69-84.
Al-Homoud, M. S. (2004). The effectiveness of thermal insulation in different
types of buildings in hot climates. Journal of Thermal Envelope and Building
Science, 27(3), 235-247.
Al-Saadi, S., & Budaiwi, I. (2007). Performance-based envelope design for
residential buildings in hot climates. In Proc. Building Simulation (pp. 1726-
1733).
Al-Shaalan, A., Ahmed, W., & Alohaly, A. (2014). Design guidelines for
buildings in Saudi Arabia considering energy conservation requirements. In
Applied Mechanics and Materials (Vol. 548, pp. 1601-1606). Trans Tech
Publications.
Al-Sanea, S. A. (2002). Thermal performance of building roof elements.
Building and Environment, 37(7), 665-675.
Alaidroos, A., & Krarti, M. (2015). Optimal design of residential building
envelope systems in the Kingdom of Saudi Arabia. Energy and Buildings, 86,
104-117.
Aldossary, N. A., Rezgui, Y., & Kwan, A. (2014a). Domestic energy
consumption patterns in a hot and arid climate: A multiple-case study analysis.
Renewable Energy, 62, 369-378.
BUILDINGS IN ARID DESERT CLIMATE
92
Aldossary, N. A., Rezgui, Y., & Kwan, A. (2014b). Domestic energy
consumption patterns in a hot and humid climate: A multiple-case study
analysis. Applied Energy, 114, 353-365.
Alnatheer, O. (2006). Environmental benefits of energy efficiency and
renewable energy in Saudi Arabia's electric sector. Energy Policy, 34(1), 2-10.
Alrashed, F., & Asif, M. (2015). Analysis of critical climate related factors for
the application of zero-energy homes in Saudi Arabia. Renewable and
Sustainable Energy Reviews, 41, 1395-1403.
Askar, H., Probert, S. D., & Batty, W. J. (2001). Windows for buildings in hot
arid countries. Applied Energy, 70(1), 77-101.
Budaiwi, I., Abdou, A., & Al-Homoud, M. (2002). Variations of thermal
conductivity of insulation materials under different operating temperatures:
Impact on envelope-induced cooling load. Journal of Architectural
Engineering, 8(4), 125-132.
Cheng, V., Ng, E., & Givoni, B. (2005). Effect of envelope colour and thermal
mass on indoor temperatures in hot humid climate. Solar Energy, 78(4), 528-
534.
Chow, T. T., Li, C., & Lin, Z. (2010). Innovative solar windows for cooling-
demand climate. Solar Energy Materials and Solar Cells, 94(2), 212-220.
Dabaieh, M., Wanas, O., Hegazy, M. A., & Johansson, E. (2015). Reducing
cooling demands in a hot dry climate: A simulation study for non-insulated
passive cool roof thermal performance in residential buildings. Energy and
Buildings, 89, 142-152.
Decroupet, D., & Depauw, J. M. (2010). U.S. Patent No. 7,745,009.
Washington, DC: U.S. Patent and Trademark Office.
Djamel O. (2000). NOUR. Daylighting and thermal effects of windows in
desert houses. Lund: Lund Institute of Technology
Elsarrag, E., & Alhorr, Y. (2012). Modelling the thermal energy demand of a
passive-house in the Gulf region: The impact of thermal insulation.
International Journal of Sustainable Built Environment, 1(1), 1-15.
References
93
EQUA (2010). EQUA Simulation AB. Validation of IDA Indoor Climate and
Energy 4.0 build 4 with respect to ANSI/ASHRAE Standard 14-2004.
Available at http://www.equaonline.com/iceuser/validation/ASHRAE140-
2004.pdf. Accessed 7 Sep 2016
Foamglas. (2010). Datasheet Foamglas T4+. Available at
http://www.phstore.co.uk/PDF/Foamglas/foamglas_t4_data_sheet.pdf
Accessed 5 December 2016
Givoni, B. (1994). Passive low energy cooling of buildings. John Wiley &
Sons.
Hasnain, S. M., Alawaji, S. H., Al-Ibrahim, A., & Smiai, M. S. (1999).
Applications of thermal energy storage in Saudi Arabia. International journal
of energy research, 23(2), 117-124.
IES. (2014). Apache-Tables User Guide. IES Virtual Environmen.
Kharrufa, S. N., & Adil, Y. (2012). Upgrading the building envelope to reduce
cooling loads. Energy and Buildings, 55, 389-396.
Kharseh, M., Al-Khawaja, M., & Hassani, F. (2015). Comparison between
different measures to reduce cooling requirements of residential building in
cooling-dominated environment. Energy and Buildings, 88, 409-412.
Koch-Nielsen, H. (2002). Stay cool: A design guide for the built environment
in hot climates. London: James & James (Science Publisher) Ltd.
Meir, I. A., & Roaf, S. C. (2002). Thermal comfort–thermal mass: housing in
hot dry climates. In Proc. 9th Int. Conf. on ‘Indoor air quality and
climate’,(ed. H. Levin) (Vol. 1, pp. 1050-1055).
Ouahrani, D. (2000). NOUR-Daylighting and thermal effects of windows in
desert houses (Vol. 10). Lund University.
Obaid, R. R., & Mufti, A. H. (2008). Present state, challenges, and future of
power generation in Saudi Arabia. In Energy 2030 Conference, 2008.
ENERGY 2008. IEEE (pp. 1-6). IEEE.
Robinson, A., & Selkowitz, S. (2013). Tips for Daylighting with Windows (No.
LBNL-6902E). Ernest Orlando Lawrence Berkeley National Laboratory,
Berkeley, CA (US).
BUILDINGS IN ARID DESERT CLIMATE
94
Salam, A. A., Elsegaey, I., Khraif, R., & Al-Mutairi, A. (2014). Population
distribution and household conditions in Saudi Arabia: reflections from the
2010 Census. SpringerPlus, 3(1), 1.
Saleh, M. E. (1990). Impact of thermal insulation location on buildings in hot
dry climates. Solar & Wind Technology, 7(4), 393-406.
Sidawi, B. (2009). Hindrances to the financing of affordable housing in
Kingdom of Saudi Arabia. The Emirates Journal for Engineering Research
(EJER) Vol, 14.
St Clair, P. (2009). Low-energy design in the United Arab Emirates-Building
design principles. DES-Design Strategies, 30, 1-9.
Suehrcke, H., Peterson, E. L., & Selby, N. (2008). Effect of roof solar
reflectance on the building heat gain in a hot climate. Energy and Buildings,
40(12), 2224-2235.
Sunearthtools. (n.d.) Sun Position. Available at
http://www.sunearthtools.com/dp/tools/pos_sun.php?lang=en Accessed 5
November 2016
SVEBY. (2012). Brukarindata bostäder. Sveby programmet.
Taleb, H. M., & Sharples, S. (2011). Developing sustainable residential
buildings in Saudi Arabia: A case study. Applied Energy, 88(1), 383-391.
Tan, A., & Maerten, M. (2011). Cooling system for solar housing in the
Middle East. A design study based on a concept.
Whistler, W. M. (2014). Indoor/Outdoor Air Exchange – Balancing Energy,
Building Comfort and Health Issues in Extreme Climates. CIBSE ASHRAE
Technical Symposium- Dublin, Ireland
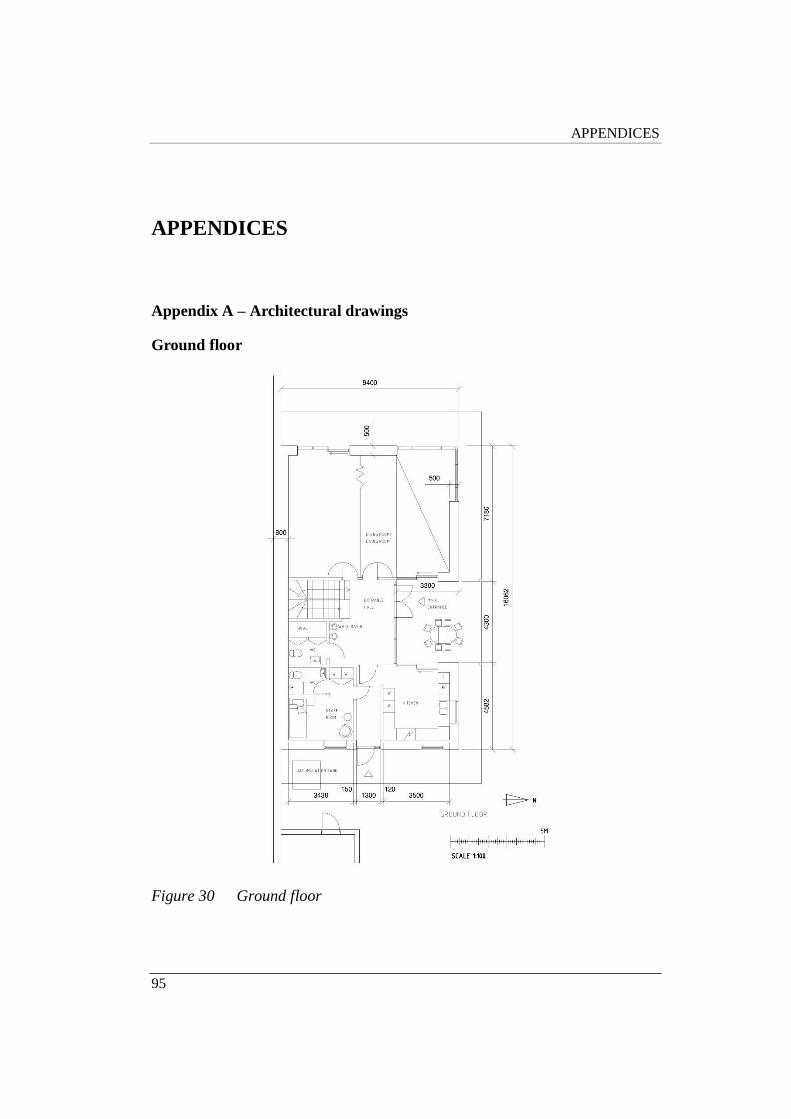
APPENDICES
95
APPENDICES
Appendix A – Architectural drawings
Ground floor
Figure 30 Ground floor
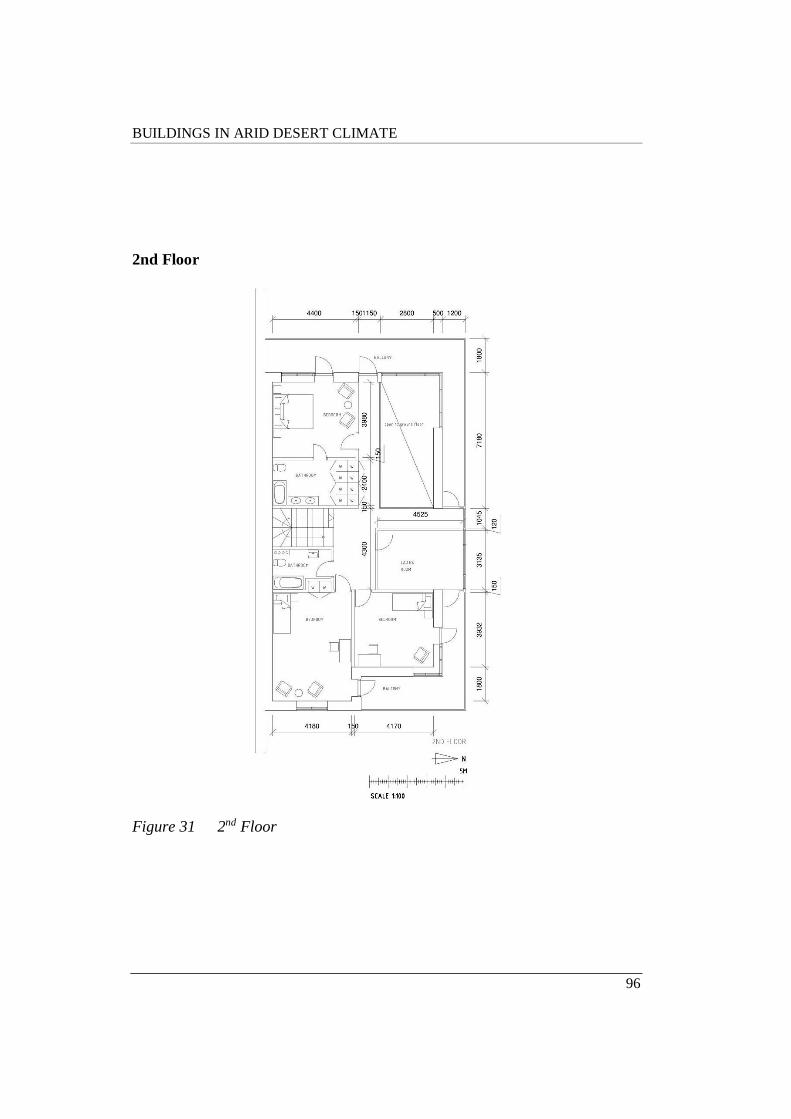
BUILDINGS IN ARID DESERT CLIMATE
96
2nd Floor
Figure 31 2nd Floor

APPENDICES
97
Appendix B – Zones used in IDA ICE
Zones used for energy simulations in IDA ICE are shown in figure 32 and 33.
Ground floor - zones
Figure 32 Ground floor – zones
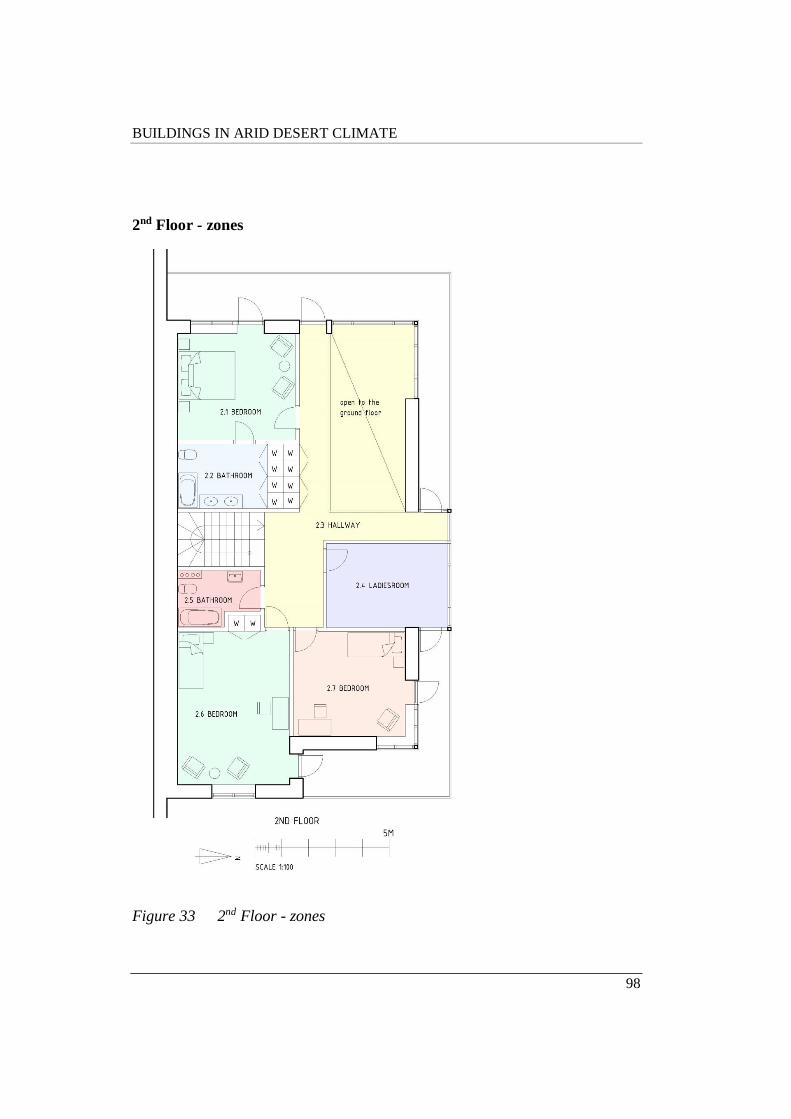
BUILDINGS IN ARID DESERT CLIMATE
98
2nd Floor - zones
Figure 33 2nd Floor - zones
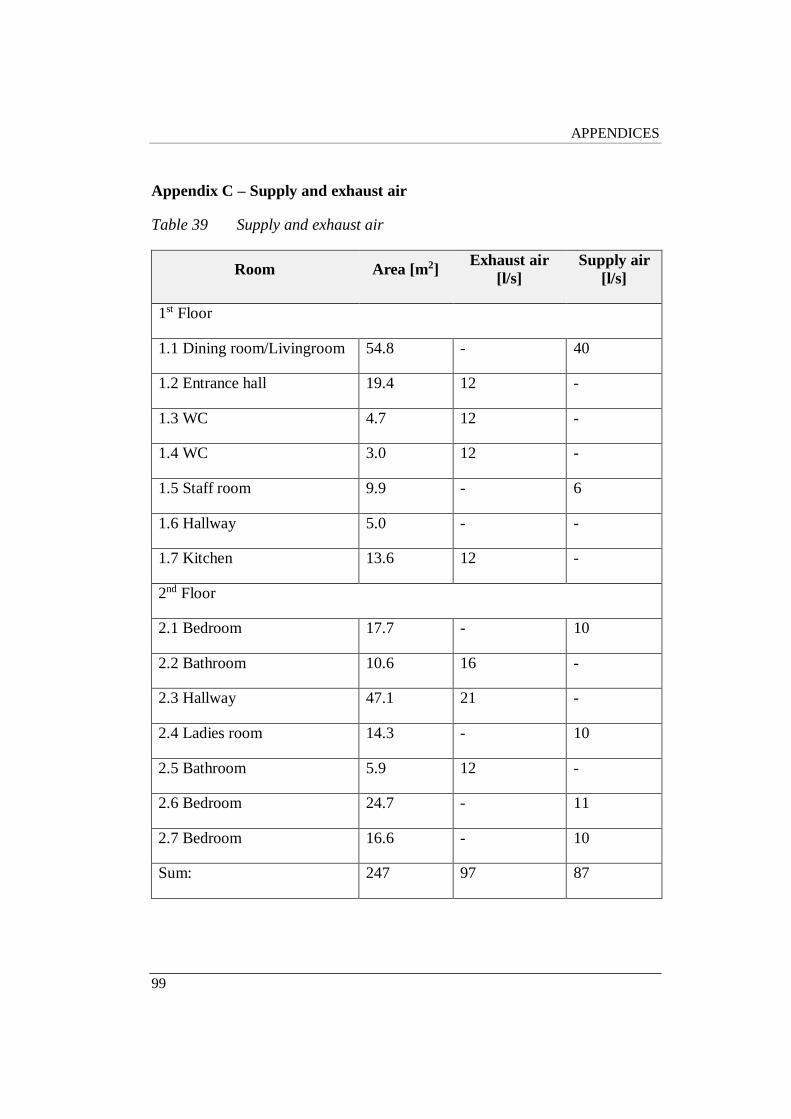
APPENDICES
99
Appendix C – Supply and exhaust air
Table 39 Supply and exhaust air
Room Area [m2] Exhaust air
[l/s]
Supply air
[l/s]
1st Floor
1.1 Dining room/Livingroom 54.8 - 40
1.2 Entrance hall 19.4 12 -
1.3 WC 4.7 12 -
1.4 WC 3.0 12 -
1.5 Staff room 9.9 - 6
1.6 Hallway 5.0 - -
1.7 Kitchen 13.6 12 -
2nd Floor
2.1 Bedroom 17.7 - 10
2.2 Bathroom 10.6 16 -
2.3 Hallway 47.1 21 -
2.4 Ladies room 14.3 - 10
2.5 Bathroom 5.9 12 -
2.6 Bedroom 24.7 - 11
2.7 Bedroom 16.6 - 10
Sum: 247 97 87
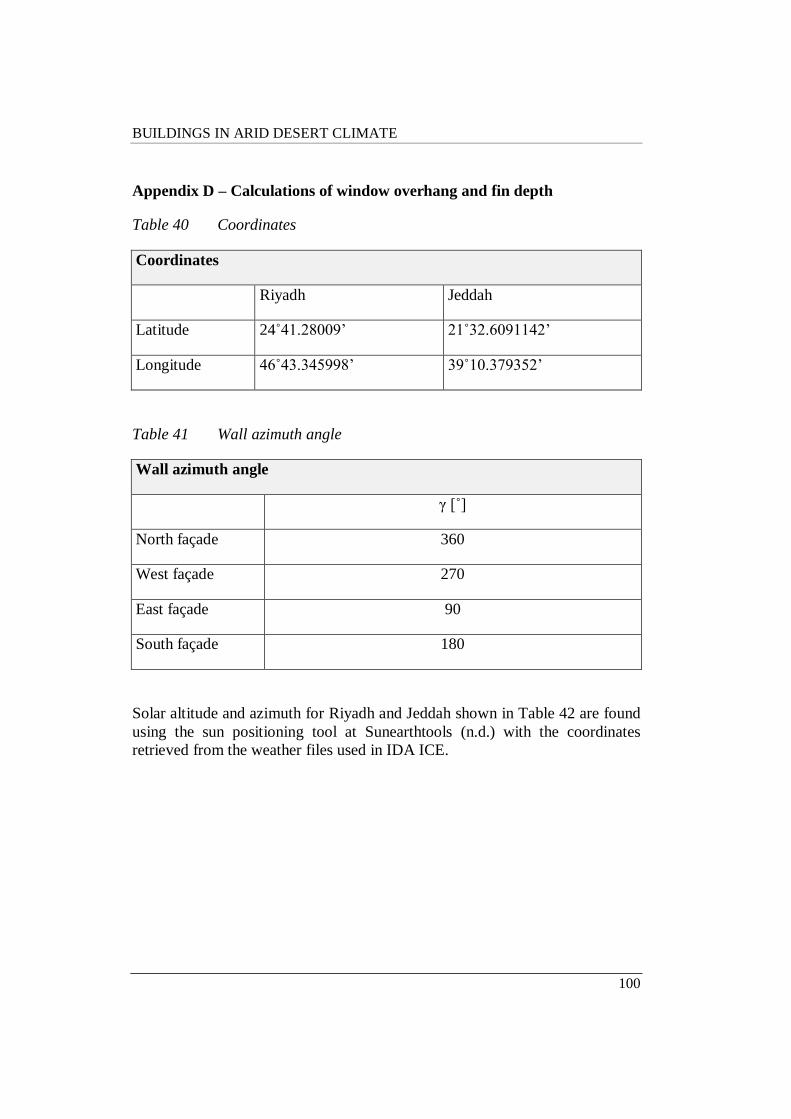
BUILDINGS IN ARID DESERT CLIMATE
100
Appendix D – Calculations of window overhang and fin depth
Table 40 Coordinates
Coordinates
Riyadh Jeddah
Latitude 24˚41.28009’ 21˚32.6091142’
Longitude 46˚43.345998’ 39˚10.379352’
Table 41 Wall azimuth angle
Wall azimuth angle
γ [˚]
North façade 360
West façade 270
East façade 90
South façade 180
Solar altitude and azimuth for Riyadh and Jeddah shown in Table 42 are found
using the sun positioning tool at Sunearthtools (n.d.) with the coordinates
retrieved from the weather files used in IDA ICE.
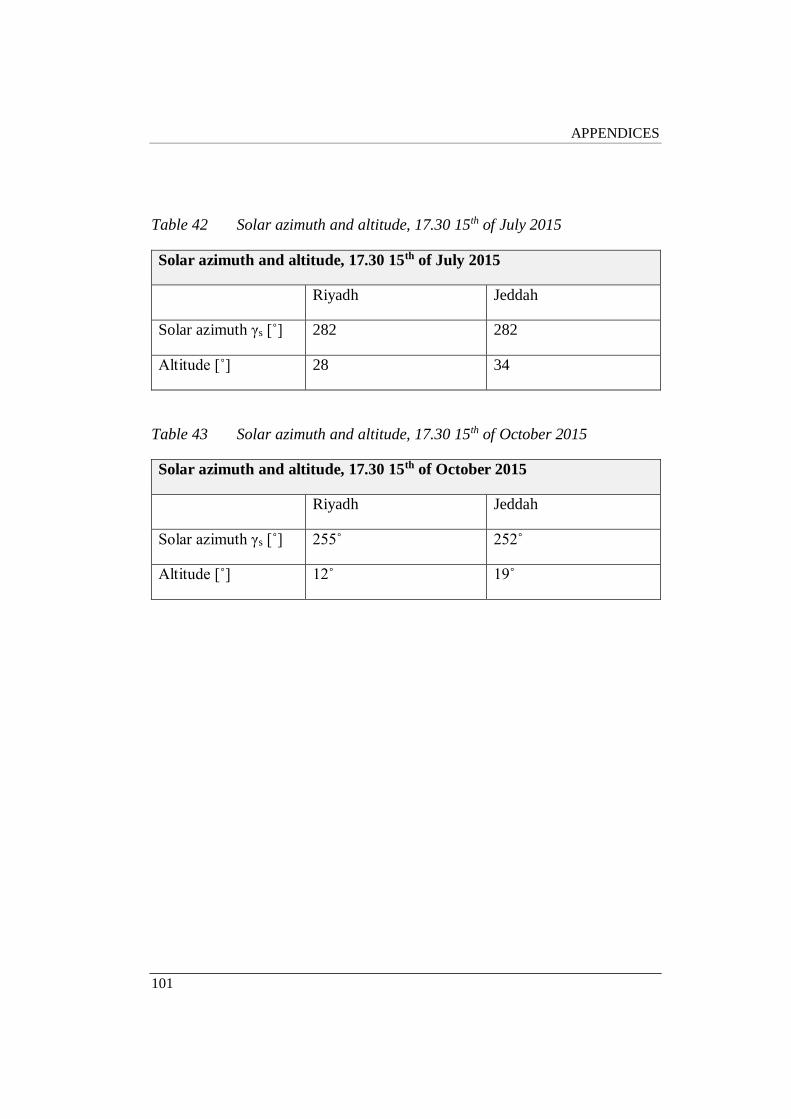
APPENDICES
101
Table 42 Solar azimuth and altitude, 17.30 15th of July 2015
Solar azimuth and altitude, 17.30 15th of July 2015
Riyadh Jeddah
Solar azimuth γs [˚] 282 282
Altitude [˚] 28 34
Table 43 Solar azimuth and altitude, 17.30 15th of October 2015
Solar azimuth and altitude, 17.30 15th of October 2015
Riyadh Jeddah
Solar azimuth γs [˚] 255˚ 252˚
Altitude [˚] 12˚ 19˚
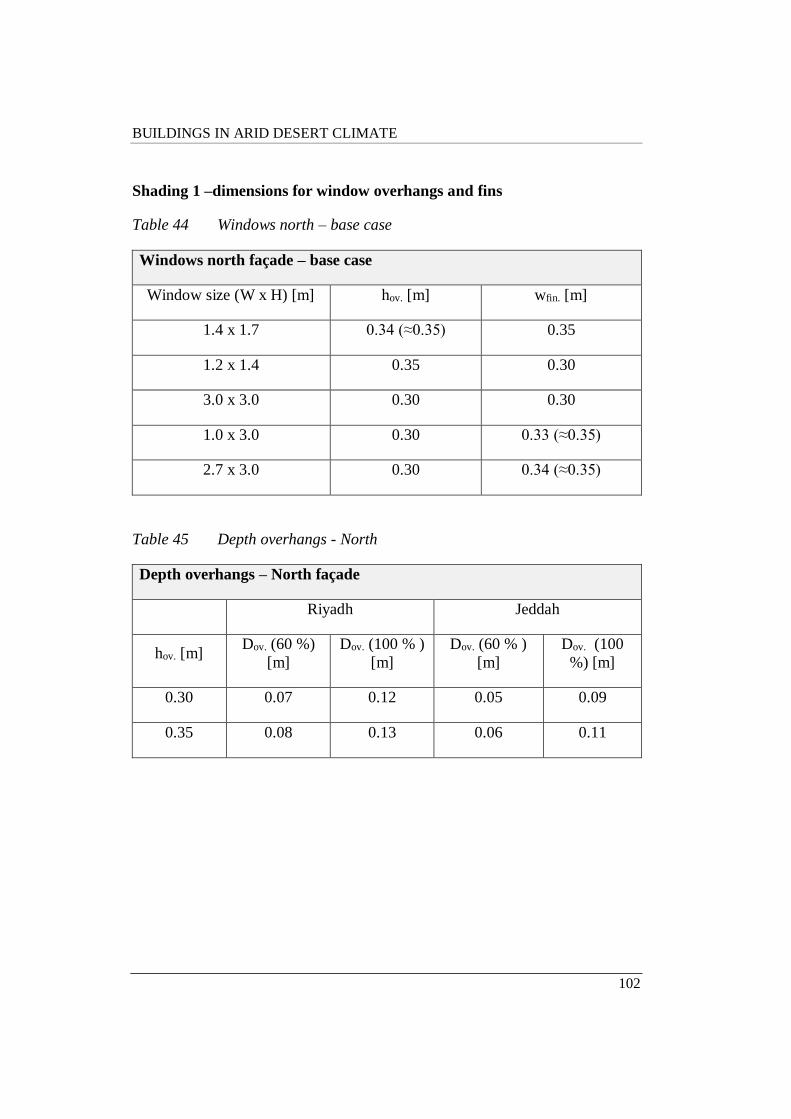
BUILDINGS IN ARID DESERT CLIMATE
102
Shading 1 –dimensions for window overhangs and fins
Table 44 Windows north – base case
Windows north façade – base case
Window size (W x H) [m] hov. [m] wfin. [m]
1.4 x 1.7 0.34 (≈0.35) 0.35
1.2 x 1.4 0.35 0.30
3.0 x 3.0 0.30 0.30
1.0 x 3.0 0.30 0.33 (≈0.35)
2.7 x 3.0 0.30 0.34 (≈0.35)
Table 45 Depth overhangs - North
Depth overhangs – North façade
Riyadh Jeddah
hov. [m] Dov. (60 %)
[m]
Dov. (100 % )
[m]
Dov. (60 % )
[m]
Dov. (100
%) [m]
0.30 0.07 0.12 0.05 0.09
0.35 0.08 0.13 0.06 0.11
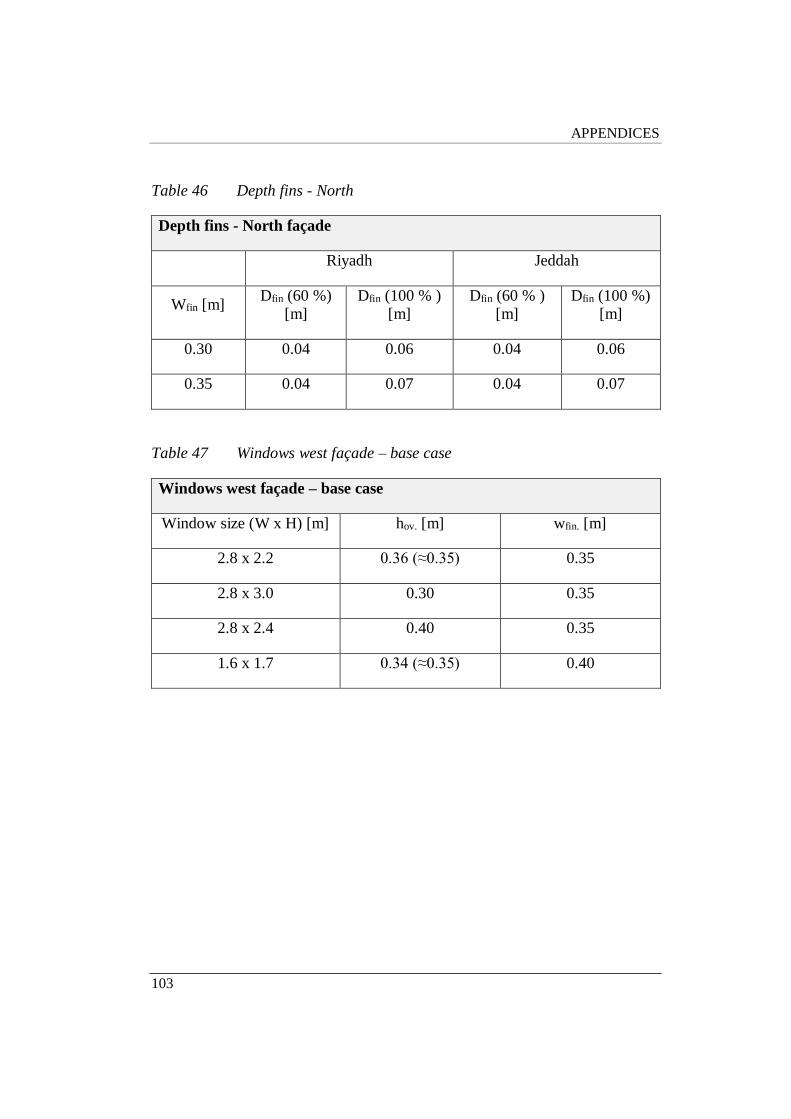
APPENDICES
103
Table 46 Depth fins - North
Depth fins - North façade
Riyadh Jeddah
Wfin [m] Dfin (60 %)
[m]
Dfin (100 % )
[m]
Dfin (60 % )
[m]
Dfin (100 %)
[m]
0.30 0.04 0.06 0.04 0.06
0.35 0.04 0.07 0.04 0.07
Table 47 Windows west façade – base case
Windows west façade – base case
Window size (W x H) [m] hov. [m] wfin. [m]
2.8 x 2.2 0.36 (≈0.35) 0.35
2.8 x 3.0 0.30 0.35
2.8 x 2.4 0.40 0.35
1.6 x 1.7 0.34 (≈0.35) 0.40

BUILDINGS IN ARID DESERT CLIMATE
104
Table 48 Windows east façade – base case
Windows east façade – base case
Window size (W x H) [m] hov. [m] wfin. [m]
1.6 x 1.7 0.34 (≈0.35) 0.40
1.2 x 1.9 0.32 (≈0.30) 0.40
1.2 x 1.4 0.35 0.40
1.4 x 1.7 0.34 (≈0.35) 0.35
Table 49 Depth overhangs – West & East façade
Depth overhangs - West & East façade
Riyadh Jeddah
hov. [m] Dov. (60 %)
[m]
Dov. (100 % )
[m]
Dov. (60 % )
[m]
Dov. (100 %)
[m]
0.30 0.32 0.54 0.26 0.43
0.35 0.38 0.63 0.30 0.50
0.40 0.43 0.72 0.34 0.57
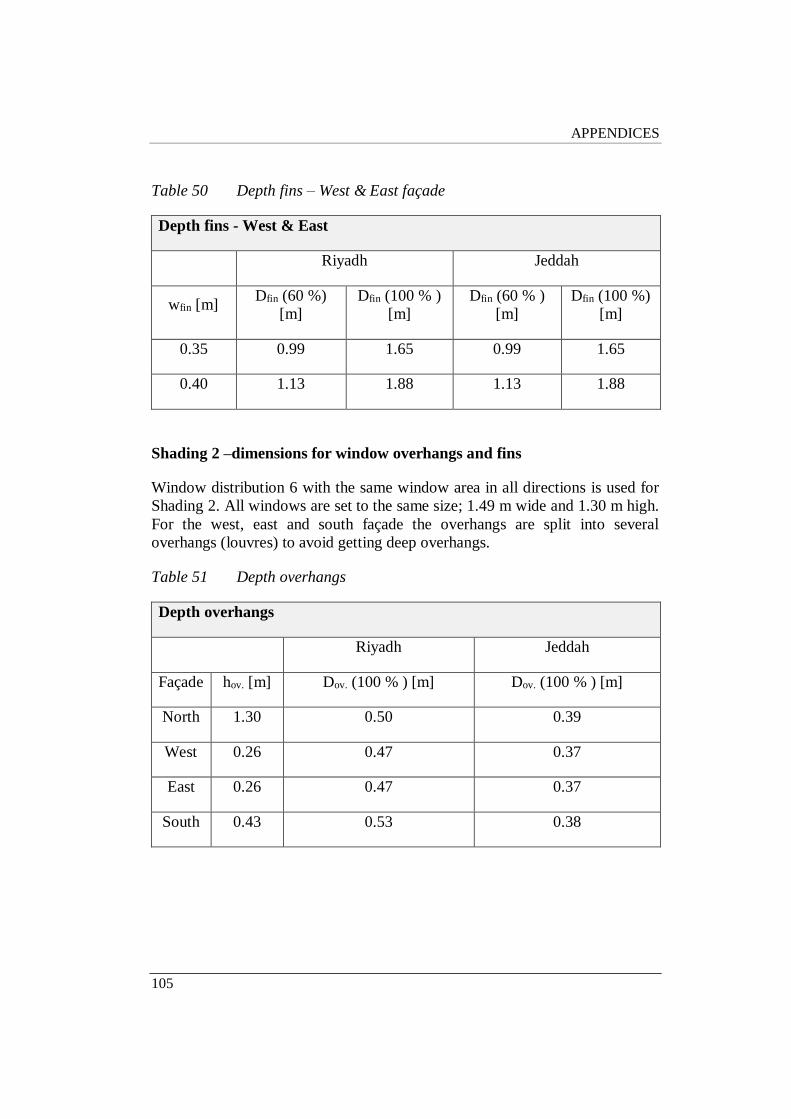
APPENDICES
105
Table 50 Depth fins – West & East façade
Depth fins - West & East
Riyadh Jeddah
wfin [m] Dfin (60 %)
[m]
Dfin (100 % )
[m]
Dfin (60 % )
[m]
Dfin (100 %)
[m]
0.35 0.99 1.65 0.99 1.65
0.40 1.13 1.88 1.13 1.88
Shading 2 –dimensions for window overhangs and fins
Window distribution 6 with the same window area in all directions is used for
Shading 2. All windows are set to the same size; 1.49 m wide and 1.30 m high.
For the west, east and south façade the overhangs are split into several
overhangs (louvres) to avoid getting deep overhangs.
Table 51 Depth overhangs
Depth overhangs
Riyadh Jeddah
Façade hov. [m] Dov. (100 % ) [m] Dov. (100 % ) [m]
North 1.30 0.50 0.39
West 0.26 0.47 0.37
East 0.26 0.47 0.37
South 0.43 0.53 0.38
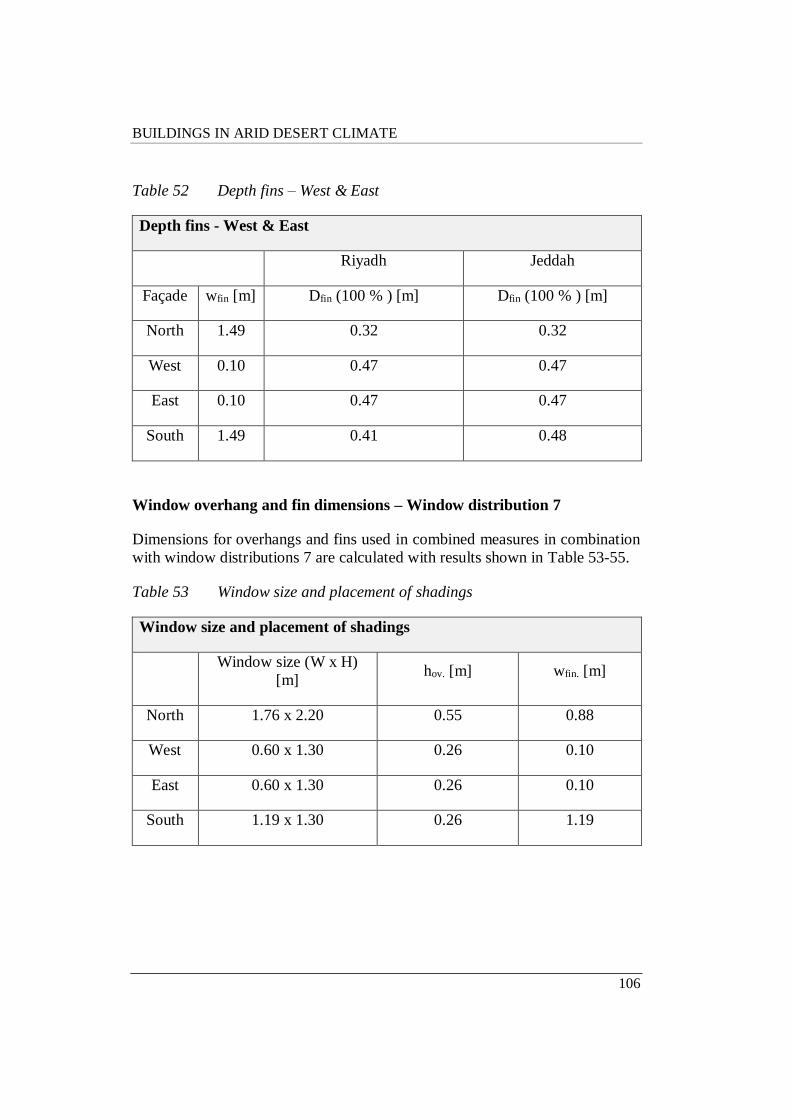
BUILDINGS IN ARID DESERT CLIMATE
106
Table 52 Depth fins – West & East
Depth fins - West & East
Riyadh Jeddah
Façade wfin [m] Dfin (100 % ) [m] Dfin (100 % ) [m]
North 1.49 0.32 0.32
West 0.10 0.47 0.47
East 0.10 0.47 0.47
South 1.49 0.41 0.48
Window overhang and fin dimensions – Window distribution 7
Dimensions for overhangs and fins used in combined measures in combination
with window distributions 7 are calculated with results shown in Table 53-55.
Table 53 Window size and placement of shadings
Window size and placement of shadings
Window size (W x H)
[m] hov. [m] wfin. [m]
North 1.76 x 2.20 0.55 0.88
West 0.60 x 1.30 0.26 0.10
East 0.60 x 1.30 0.26 0.10
South 1.19 x 1.30 0.26 1.19
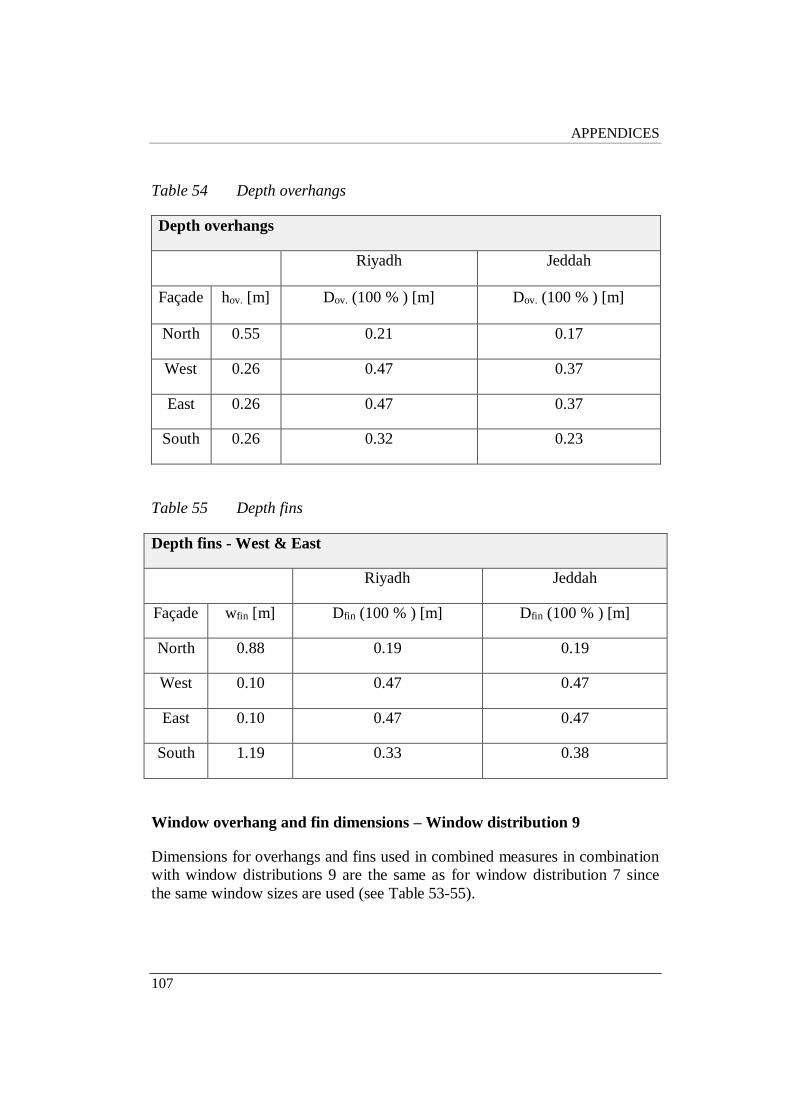
APPENDICES
107
Table 54 Depth overhangs
Depth overhangs
Riyadh Jeddah
Façade hov. [m] Dov. (100 % ) [m] Dov. (100 % ) [m]
North 0.55 0.21 0.17
West 0.26 0.47 0.37
East 0.26 0.47 0.37
South 0.26 0.32 0.23
Table 55 Depth fins
Depth fins - West & East
Riyadh Jeddah
Façade wfin [m] Dfin (100 % ) [m] Dfin (100 % ) [m]
North 0.88 0.19 0.19
West 0.10 0.47 0.47
East 0.10 0.47 0.47
South 1.19 0.33 0.38
Window overhang and fin dimensions – Window distribution 9
Dimensions for overhangs and fins used in combined measures in combination
with window distributions 9 are the same as for window distribution 7 since
the same window sizes are used (see Table 53-55).
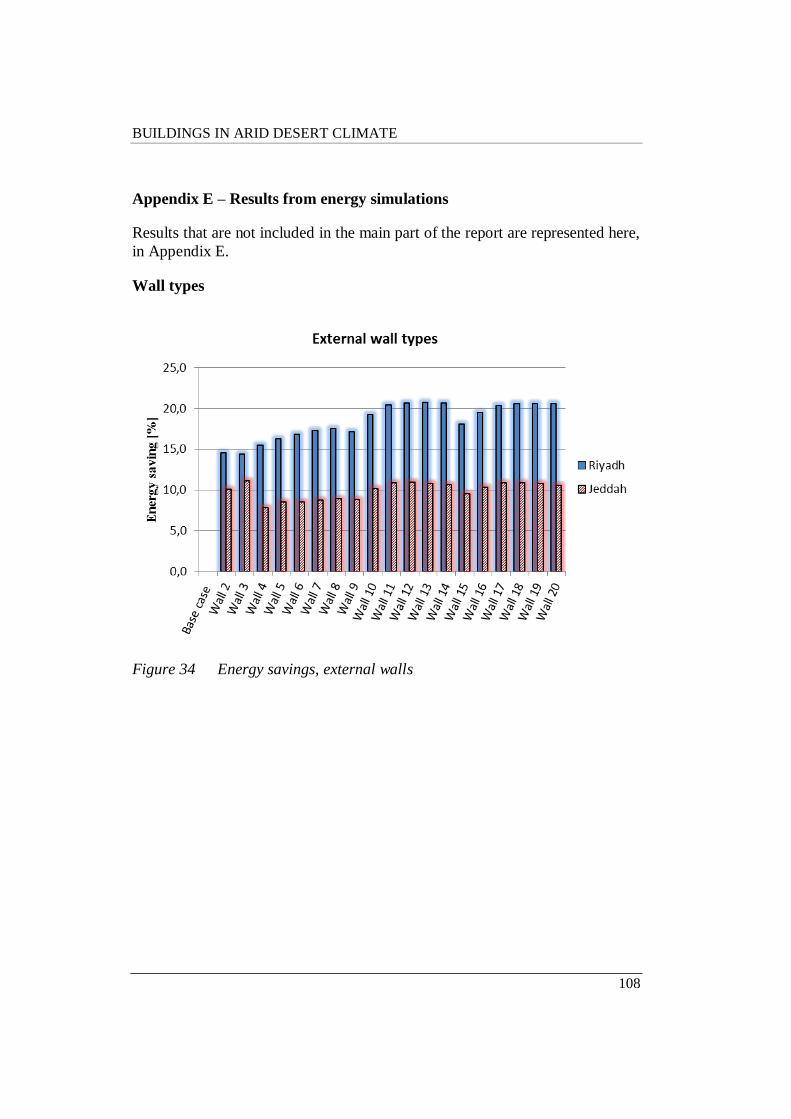
BUILDINGS IN ARID DESERT CLIMATE
108
Appendix E – Results from energy simulations
Results that are not included in the main part of the report are represented here,
in Appendix E.
Wall types
Figure 34 Energy savings, external walls
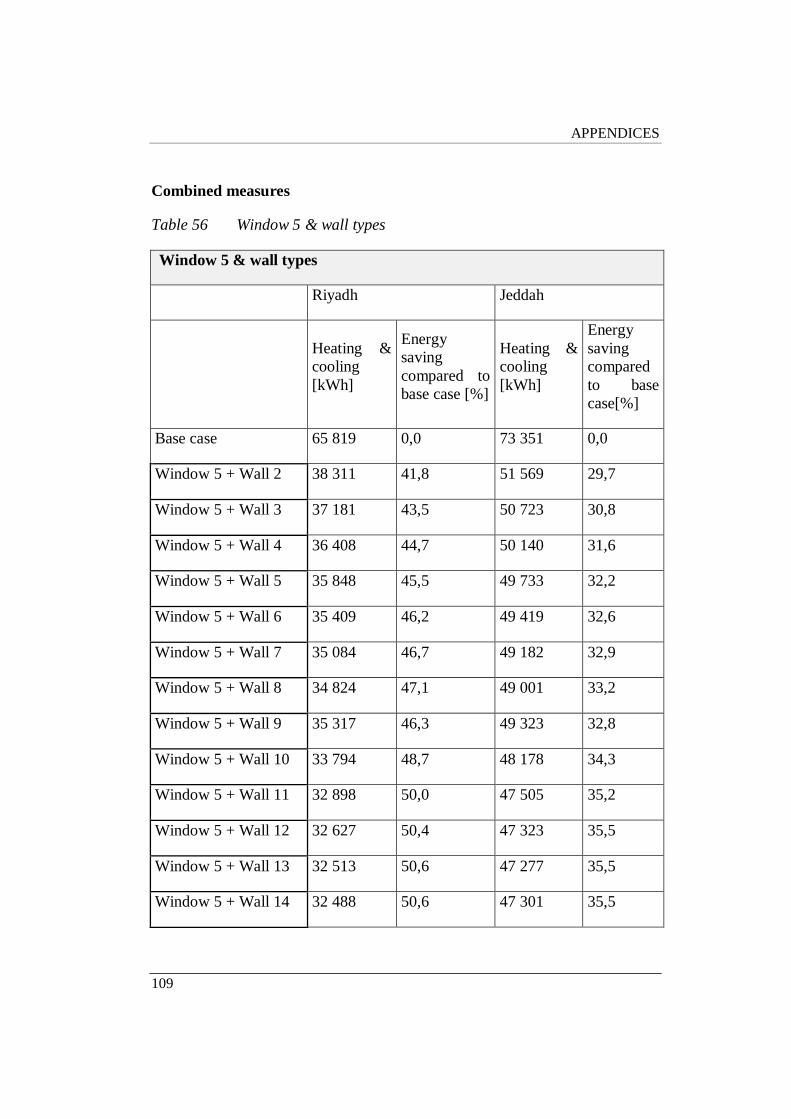
APPENDICES
109
Combined measures
Table 56 Window 5 & wall types
Window 5 & wall types
Riyadh Jeddah
Heating &
cooling
[kWh]
Energy
saving
compared to
base case [%]
Heating &
cooling
[kWh]
Energy
saving
compared
to base
case[%]
Base case 65 819 0,0 73 351 0,0
Window 5 + Wall 2 38 311 41,8 51 569 29,7
Window 5 + Wall 3 37 181 43,5 50 723 30,8
Window 5 + Wall 4 36 408 44,7 50 140 31,6
Window 5 + Wall 5 35 848 45,5 49 733 32,2
Window 5 + Wall 6 35 409 46,2 49 419 32,6
Window 5 + Wall 7 35 084 46,7 49 182 32,9
Window 5 + Wall 8 34 824 47,1 49 001 33,2
Window 5 + Wall 9 35 317 46,3 49 323 32,8
Window 5 + Wall 10 33 794 48,7 48 178 34,3
Window 5 + Wall 11 32 898 50,0 47 505 35,2
Window 5 + Wall 12 32 627 50,4 47 323 35,5
Window 5 + Wall 13 32 513 50,6 47 277 35,5
Window 5 + Wall 14 32 488 50,6 47 301 35,5
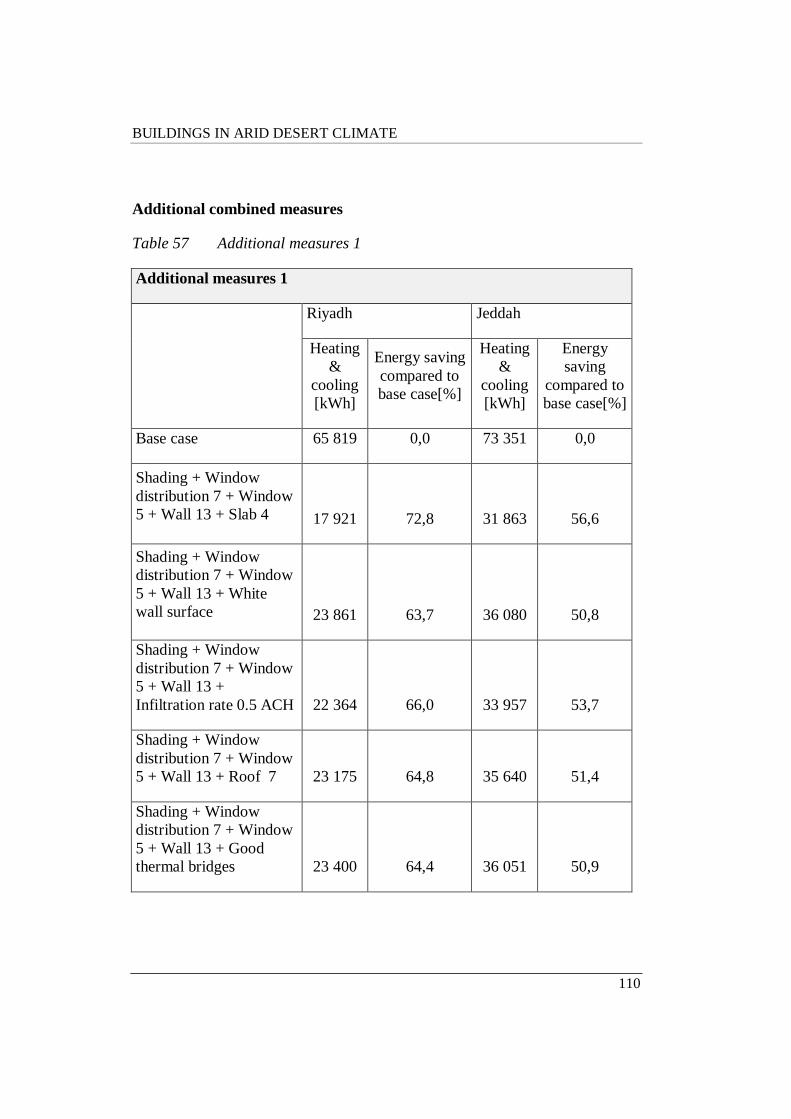
BUILDINGS IN ARID DESERT CLIMATE
110
Additional combined measures
Table 57 Additional measures 1
Additional measures 1
Riyadh Jeddah
Heating
&
cooling
[kWh]
Energy saving
compared to
base case[%]
Heating
&
cooling
[kWh]
Energy
saving
compared to
base case[%]
Base case 65 819 0,0 73 351 0,0
Shading + Window
distribution 7 + Window
5 + Wall 13 + Slab 4 17 921 72,8 31 863 56,6
Shading + Window
distribution 7 + Window
5 + Wall 13 + White
wall surface 23 861 63,7 36 080 50,8
Shading + Window
distribution 7 + Window
5 + Wall 13 +
Infiltration rate 0.5 ACH 22 364 66,0 33 957 53,7
Shading + Window
distribution 7 + Window
5 + Wall 13 + Roof 7 23 175 64,8 35 640 51,4
Shading + Window
distribution 7 + Window
5 + Wall 13 + Good
thermal bridges 23 400 64,4 36 051 50,9
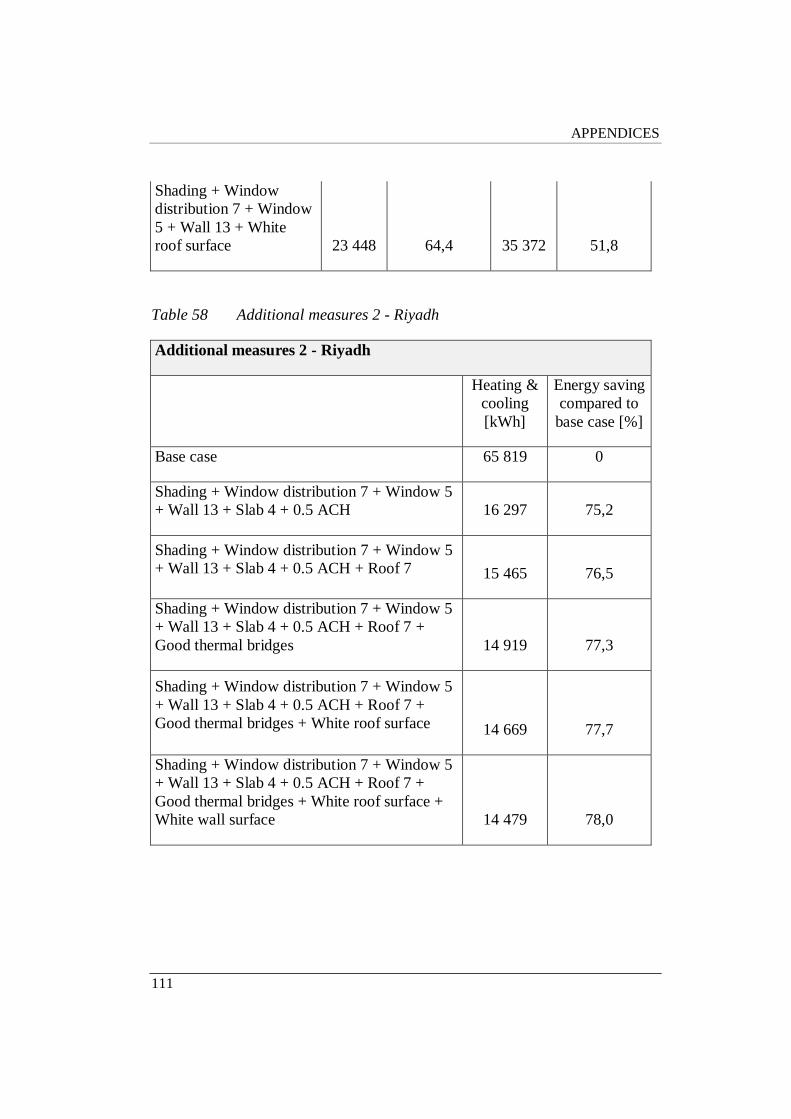
APPENDICES
111
Shading + Window
distribution 7 + Window
5 + Wall 13 + White
roof surface 23 448 64,4 35 372 51,8
Table 58 Additional measures 2 - Riyadh
Additional measures 2 - Riyadh
Heating &
cooling
[kWh]
Energy saving
compared to
base case [%]
Base case 65 819 0
Shading + Window distribution 7 + Window 5
+ Wall 13 + Slab 4 + 0.5 ACH 16 297 75,2
Shading + Window distribution 7 + Window 5
+ Wall 13 + Slab 4 + 0.5 ACH + Roof 7 15 465 76,5
Shading + Window distribution 7 + Window 5
+ Wall 13 + Slab 4 + 0.5 ACH + Roof 7 +
Good thermal bridges 14 919 77,3
Shading + Window distribution 7 + Window 5
+ Wall 13 + Slab 4 + 0.5 ACH + Roof 7 +
Good thermal bridges + White roof surface 14 669 77,7
Shading + Window distribution 7 + Window 5
+ Wall 13 + Slab 4 + 0.5 ACH + Roof 7 +
Good thermal bridges + White roof surface +
White wall surface 14 479 78,0
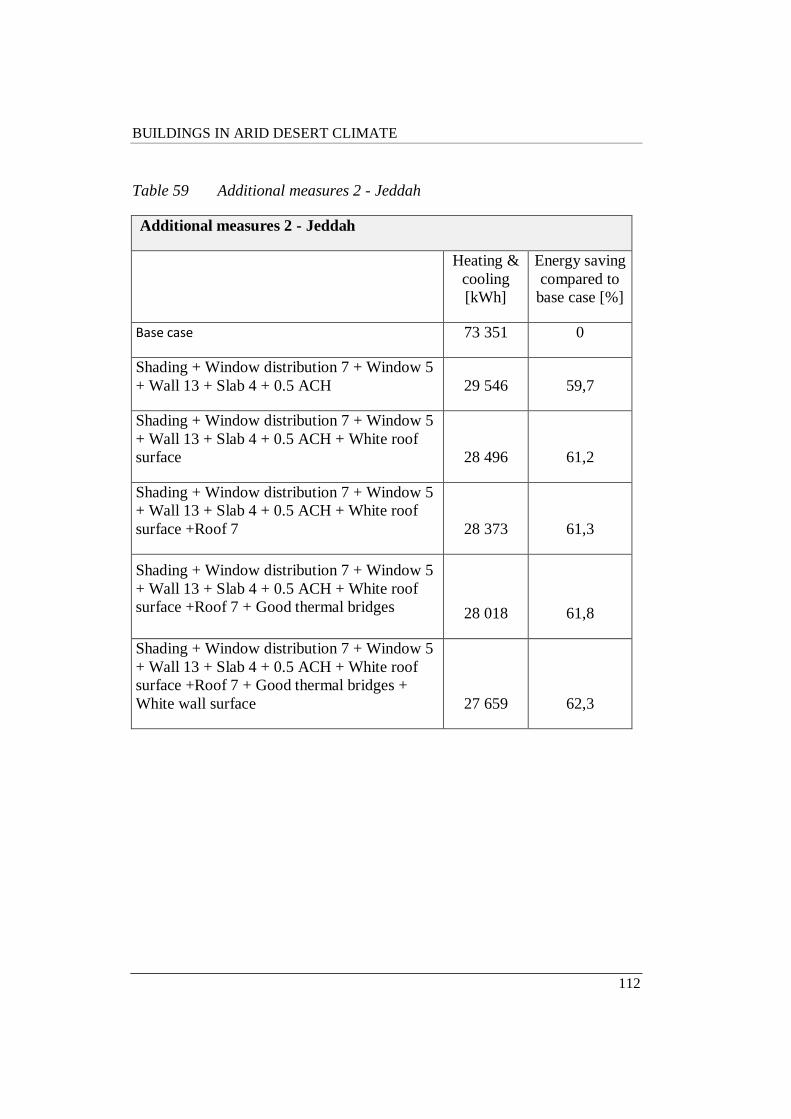
BUILDINGS IN ARID DESERT CLIMATE
112
Table 59 Additional measures 2 - Jeddah
Additional measures 2 - Jeddah
Heating &
cooling
[kWh]
Energy saving
compared to
base case [%]
Base case 73 351 0
Shading + Window distribution 7 + Window 5
+ Wall 13 + Slab 4 + 0.5 ACH 29 546 59,7
Shading + Window distribution 7 + Window 5
+ Wall 13 + Slab 4 + 0.5 ACH + White roof
surface 28 496 61,2
Shading + Window distribution 7 + Window 5
+ Wall 13 + Slab 4 + 0.5 ACH + White roof
surface +Roof 7 28 373 61,3
Shading + Window distribution 7 + Window 5
+ Wall 13 + Slab 4 + 0.5 ACH + White roof
surface +Roof 7 + Good thermal bridges 28 018 61,8
Shading + Window distribution 7 + Window 5
+ Wall 13 + Slab 4 + 0.5 ACH + White roof
surface +Roof 7 + Good thermal bridges +
White wall surface 27 659 62,3
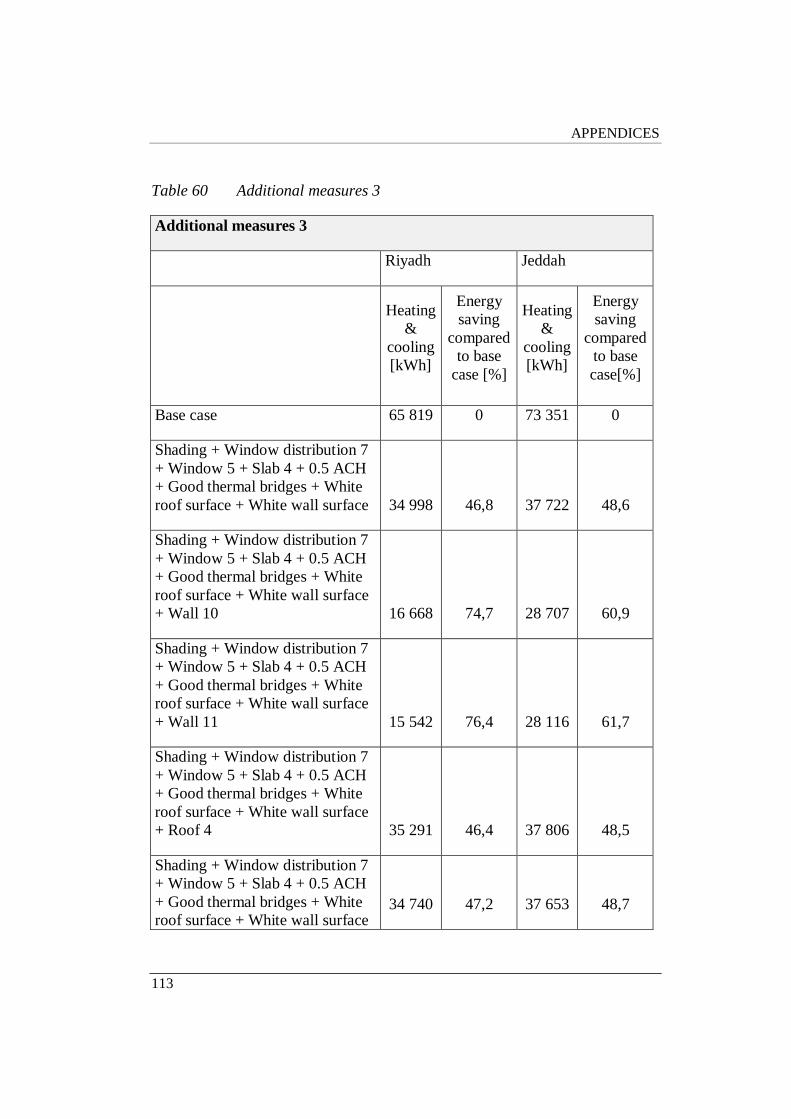
APPENDICES
113
Table 60 Additional measures 3
Additional measures 3
Riyadh Jeddah
Heating
&
cooling
[kWh]
Energy
saving
compared
to base
case [%]
Heating
&
cooling
[kWh]
Energy
saving
compared
to base
case[%]
Base case 65 819 0 73 351 0
Shading + Window distribution 7
+ Window 5 + Slab 4 + 0.5 ACH
+ Good thermal bridges + White
roof surface + White wall surface 34 998 46,8 37 722 48,6
Shading + Window distribution 7
+ Window 5 + Slab 4 + 0.5 ACH
+ Good thermal bridges + White
roof surface + White wall surface
+ Wall 10 16 668 74,7 28 707 60,9
Shading + Window distribution 7
+ Window 5 + Slab 4 + 0.5 ACH
+ Good thermal bridges + White
roof surface + White wall surface
+ Wall 11 15 542 76,4 28 116 61,7
Shading + Window distribution 7
+ Window 5 + Slab 4 + 0.5 ACH
+ Good thermal bridges + White
roof surface + White wall surface
+ Roof 4 35 291 46,4 37 806 48,5
Shading + Window distribution 7
+ Window 5 + Slab 4 + 0.5 ACH
+ Good thermal bridges + White
roof surface + White wall surface 34 740 47,2 37 653 48,7
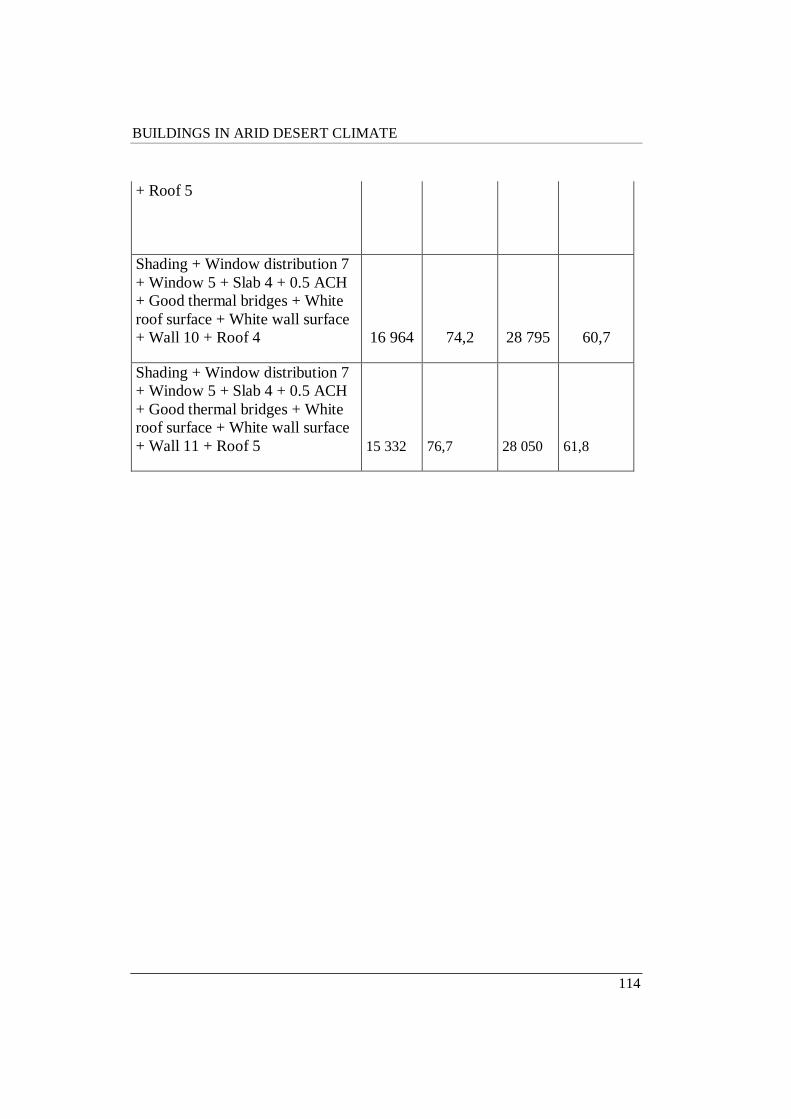
BUILDINGS IN ARID DESERT CLIMATE
114
+ Roof 5
Shading + Window distribution 7
+ Window 5 + Slab 4 + 0.5 ACH
+ Good thermal bridges + White
roof surface + White wall surface
+ Wall 10 + Roof 4 16 964 74,2 28 795 60,7
Shading + Window distribution 7
+ Window 5 + Slab 4 + 0.5 ACH
+ Good thermal bridges + White
roof surface + White wall surface
+ Wall 11 + Roof 5 15 332 76,7 28 050 61,8
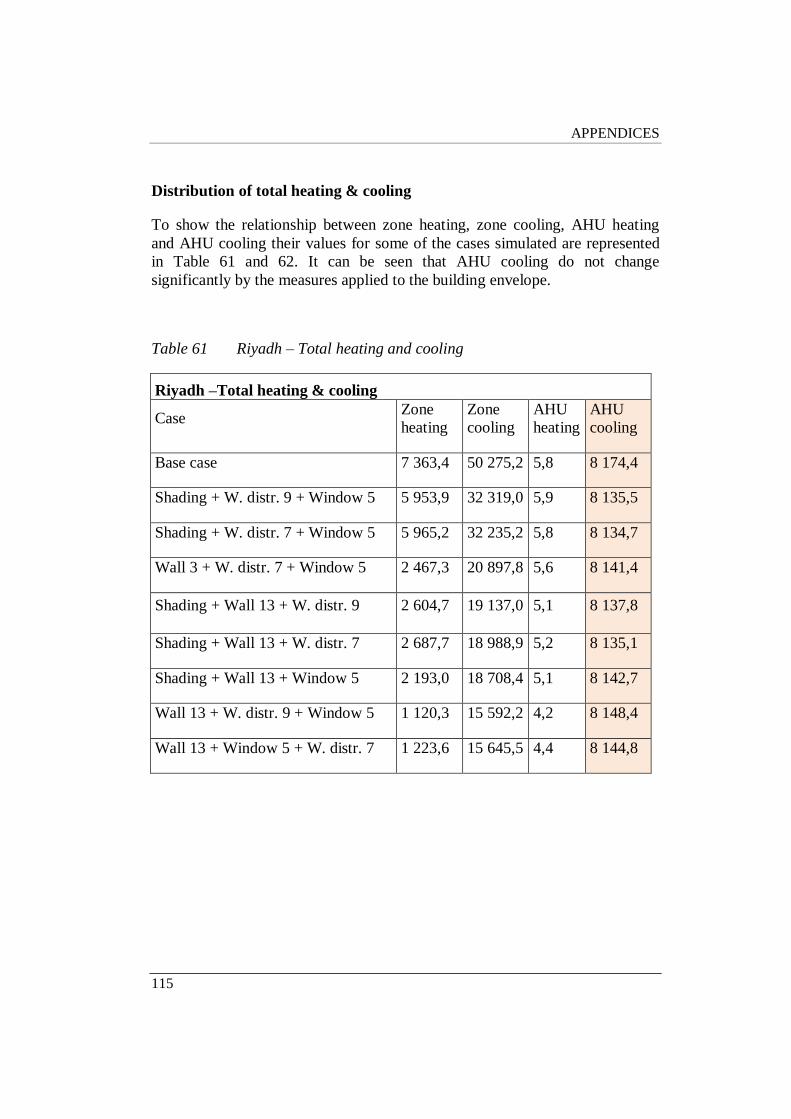
APPENDICES
115
Distribution of total heating & cooling
To show the relationship between zone heating, zone cooling, AHU heating
and AHU cooling their values for some of the cases simulated are represented
in Table 61 and 62. It can be seen that AHU cooling do not change
significantly by the measures applied to the building envelope.
Table 61 Riyadh – Total heating and cooling
Riyadh –Total heating & cooling
Case Zone
heating
Zone
cooling
AHU
heating
AHU
cooling
Base case 7 363,4 50 275,2 5,8 8 174,4
Shading + W. distr. 9 + Window 5 5 953,9 32 319,0 5,9 8 135,5
Shading + W. distr. 7 + Window 5 5 965,2 32 235,2 5,8 8 134,7
Wall 3 + W. distr. 7 + Window 5 2 467,3 20 897,8 5,6 8 141,4
Shading + Wall 13 + W. distr. 9 2 604,7 19 137,0 5,1 8 137,8
Shading + Wall 13 + W. distr. 7 2 687,7 18 988,9 5,2 8 135,1
Shading + Wall 13 + Window 5 2 193,0 18 708,4 5,1 8 142,7
Wall 13 + W. distr. 9 + Window 5 1 120,3 15 592,2 4,2 8 148,4
Wall 13 + Window 5 + W. distr. 7 1 223,6 15 645,5 4,4 8 144,8

BUILDINGS IN ARID DESERT CLIMATE
116
Table 62 Jeddah – Total heating & cooling
Jeddah – Total heating & cooling
Case Zone
heating
Zone
cooling
AHU
heating
AHU
cooling
Base case 3,4 51 955,7 0,0 21 392,2
Shading + W. distr. 9 + Window 5 0,8 32 348,1 0,0 21 374,3
Shading + W. distr. 7 + Window 5 0,8 32 221,6 0,0 21 372,2
Wall 3 + W. distr. 7 + Window 5 0,1 21 988,7 0,0 21 387,0
Shading + Wall 13 + W. distr. 9 0,4 19 685,4 0,0 21 389,5
Shading + Wall 13 + W. distr. 7 0,5 19 430,6 0,0 21 384,1
Shading + Wall 13 + Window 5 0,2 24 350,5 0,0 21 389,3
Wall 13 + W. distr. 9 + Window 5 0,0 17 050,1 0,0 21 392,1
Wall 13 + Window 5 + W. distr. 7 0,0 16 982,1 0,0 21 388,6

APPENDICES
117
Appendix F – Sun path diagrams
Figure 35 Sun path diagram, Riyadh
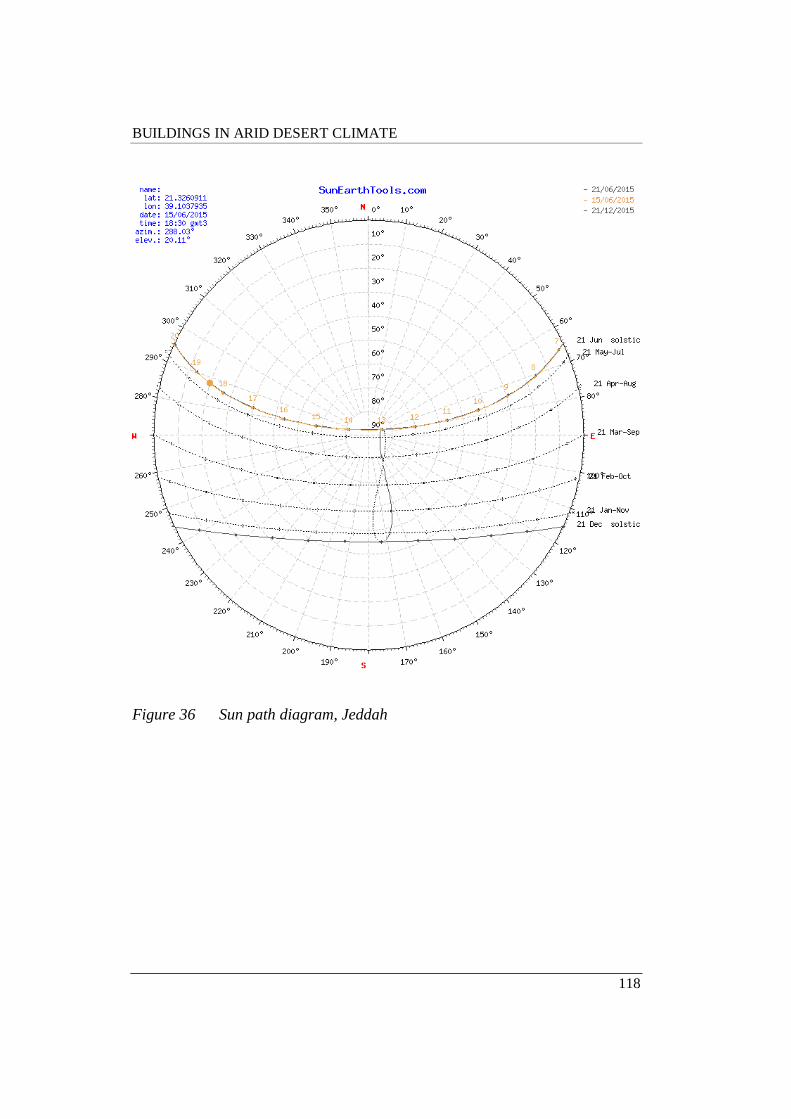
BUILDINGS IN ARID DESERT CLIMATE
118
Figure 36 Sun path diagram, Jeddah

119