bulk terminal planning trends using...
TRANSCRIPT
Bulk Terminal
Planning Trends –
Using Simulation Robert Kaptein, PE
September 11, 2013
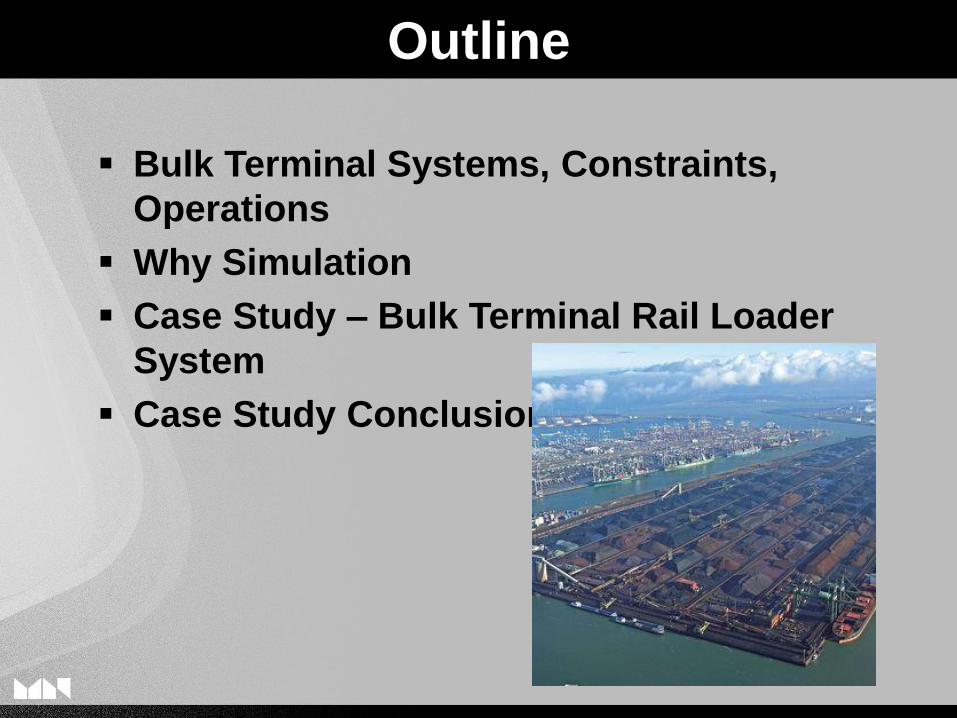
Bulk Terminal Systems, Constraints,
Operations
Why Simulation
Case Study – Bulk Terminal Rail Loader
System
Case Study Conclusions
Outline
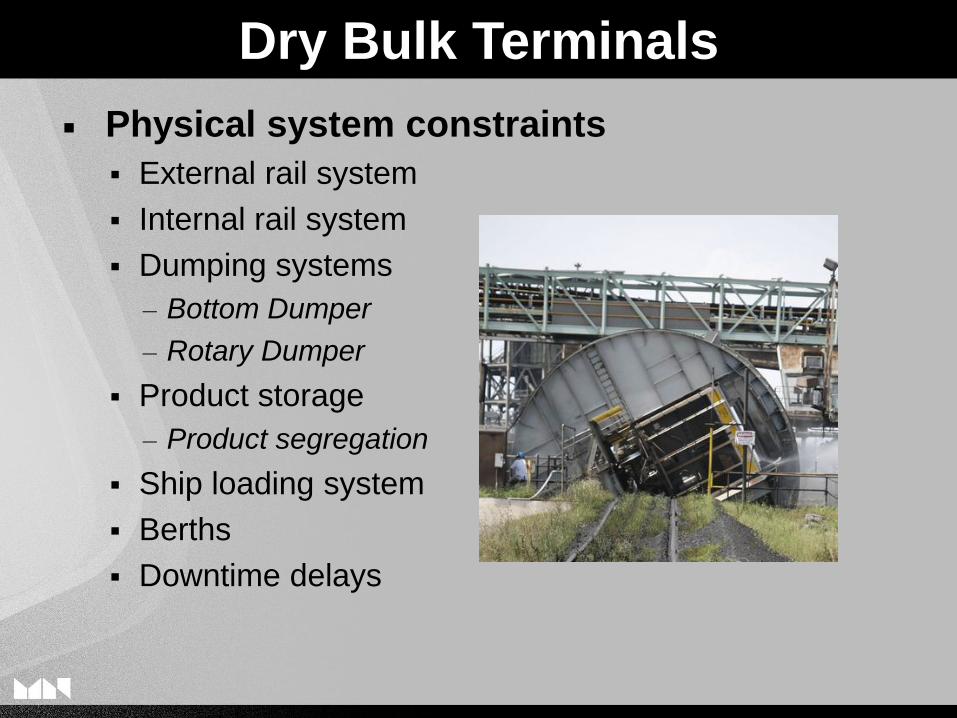
Physical system constraints
External rail system
Internal rail system
Dumping systems
– Bottom Dumper
– Rotary Dumper
Product storage
– Product segregation
Ship loading system
Berths
Downtime delays
Dry Bulk Terminals
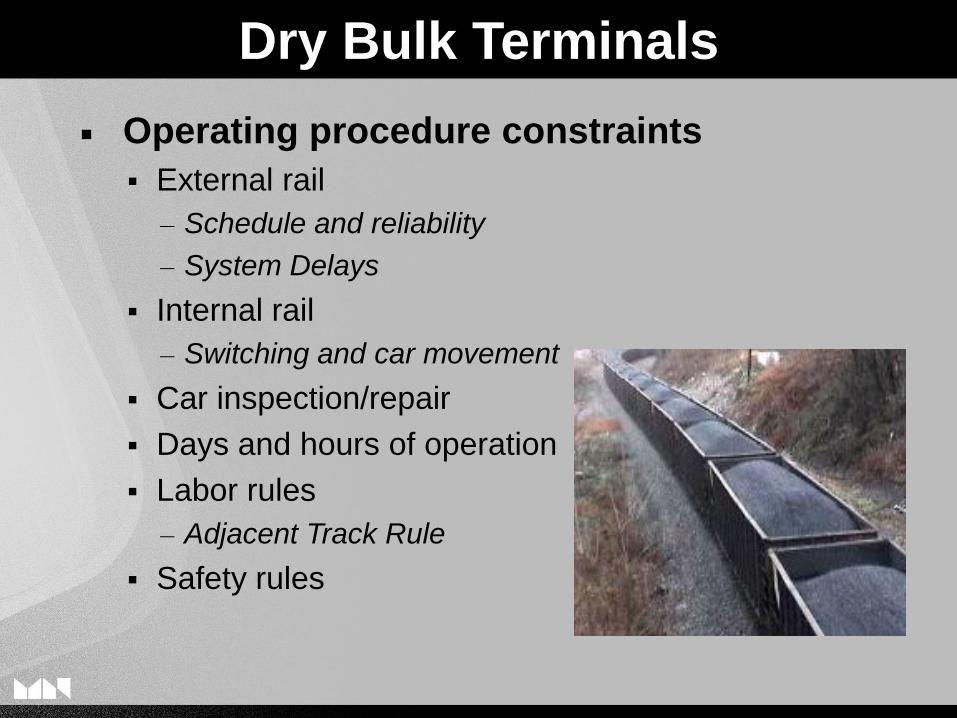
Operating procedure constraints
External rail
– Schedule and reliability
– System Delays
Internal rail
– Switching and car movement
Car inspection/repair
Days and hours of operation
Labor rules
– Adjacent Track Rule
Safety rules
Dry Bulk Terminals
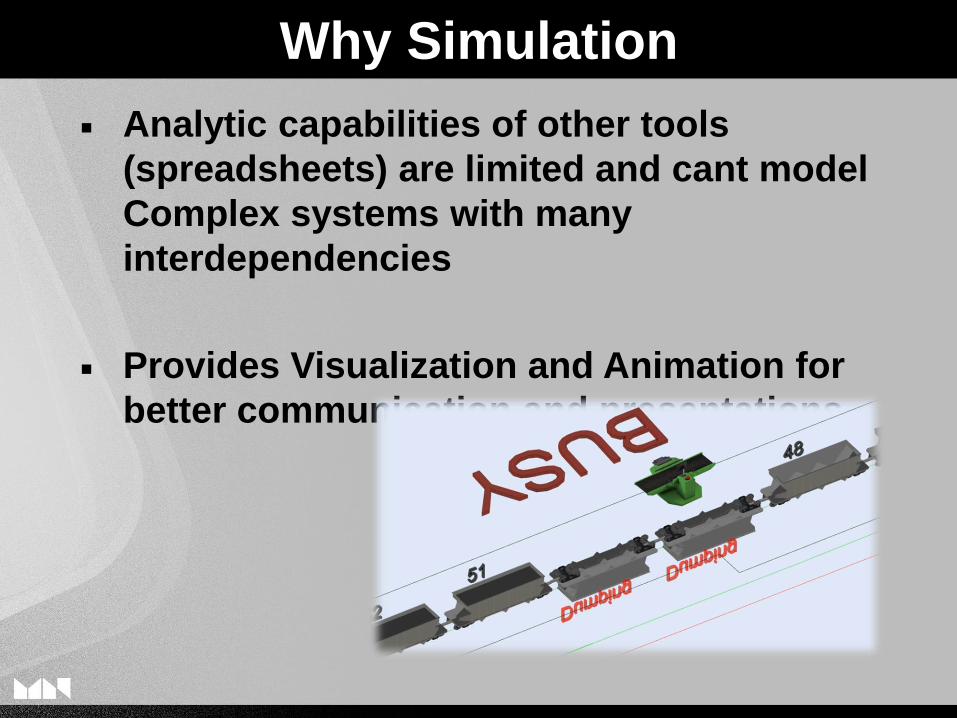
Analytic capabilities of other tools
(spreadsheets) are limited and cant model
Complex systems with many
interdependencies
Provides Visualization and Animation for
better communication and presentations
Why Simulation
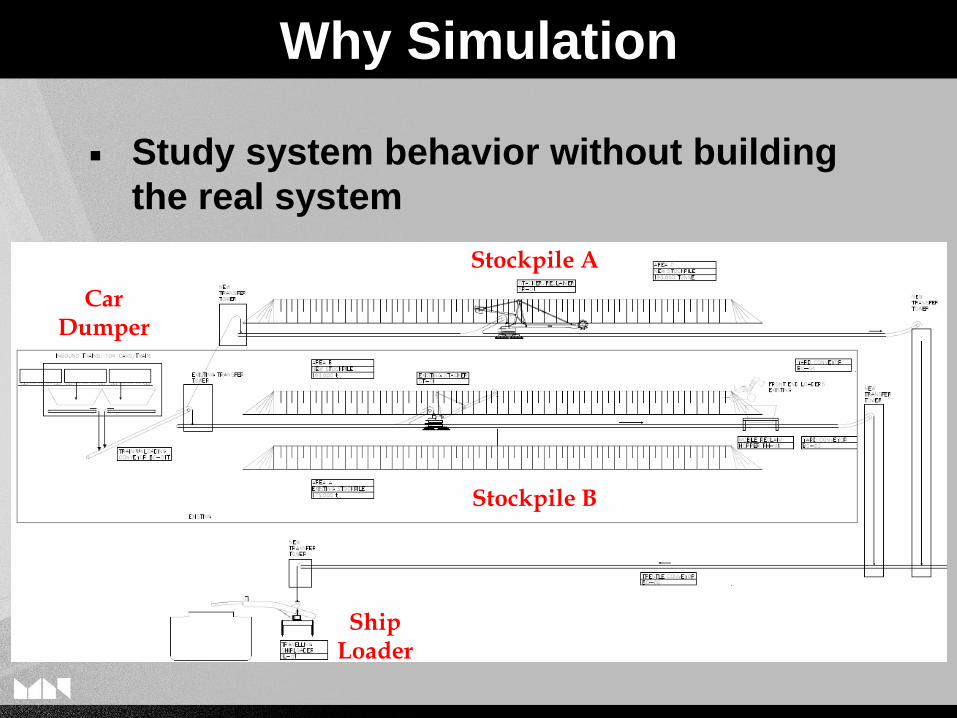
Study system behavior without building
the real system
Why Simulation
Car Dumper
Ship Loader
Stockpile A
Stockpile B
Assess proposed impacts and changes
before they are implemented
Identify system modifications that provide
the greatest benefit
Cheaper and easier than before
Why Simulation
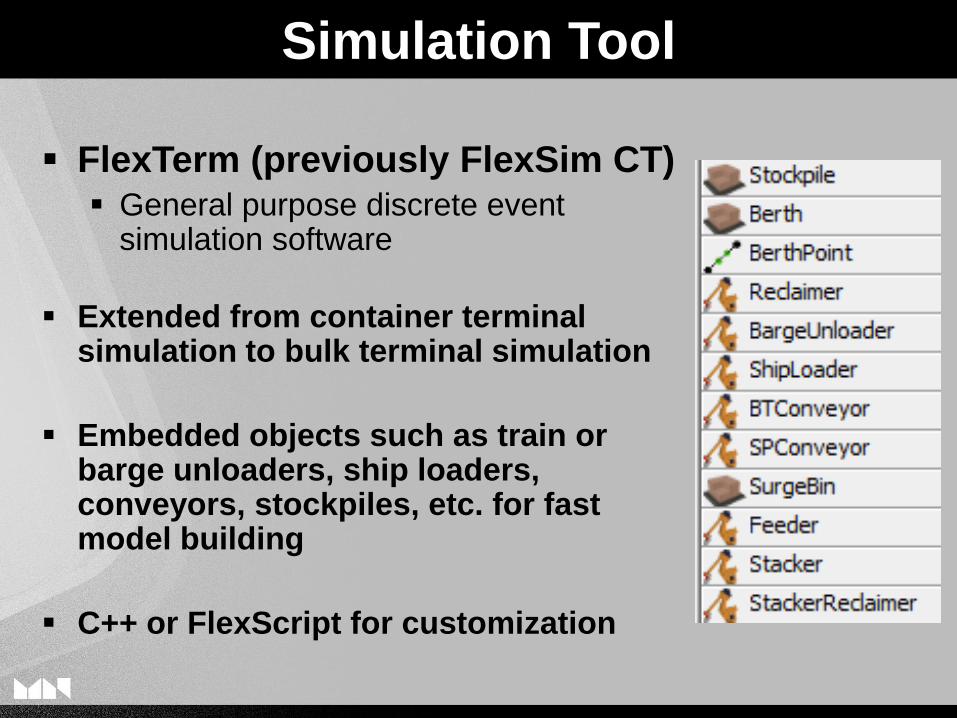
FlexTerm (previously FlexSim CT) General purpose discrete event
simulation software
Extended from container terminal simulation to bulk terminal simulation
Embedded objects such as train or barge unloaders, ship loaders, conveyors, stockpiles, etc. for fast model building
C++ or FlexScript for customization
Simulation Tool
Drag-and-Drop objects into model space
Make connections between objects to define
material flow according to Process Flow
Diagram (PFM)
Define mixing rules including direct-loading
and stockpile logic
Define events such as break-downs and other
delays
Typically run 10 years with 1 minute time
interval
Simulation Tool
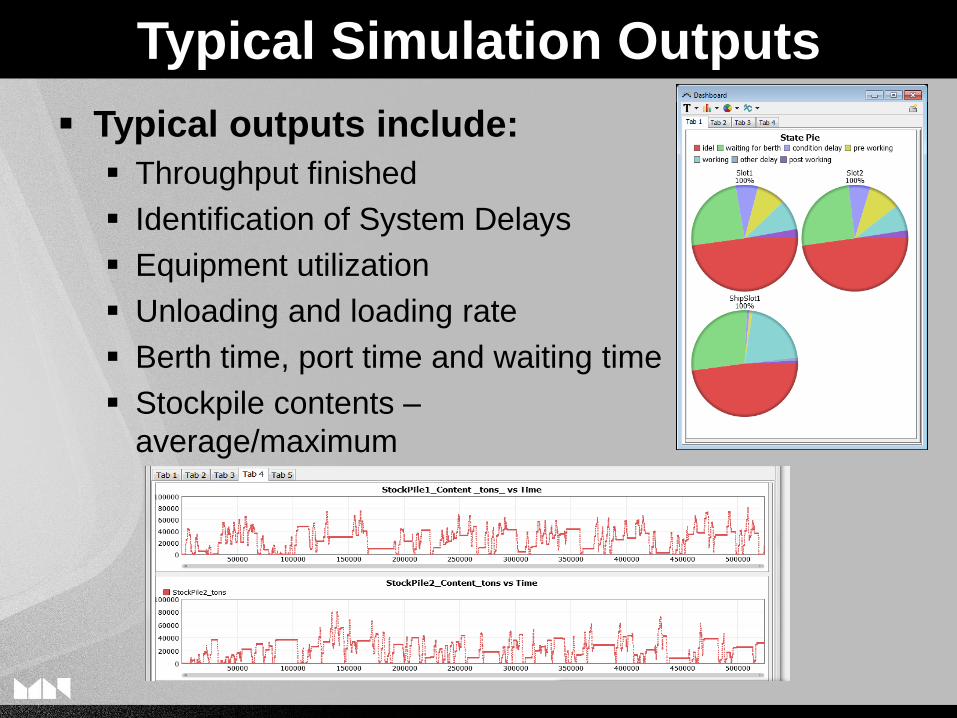
Typical outputs include:
Throughput finished
Identification of System Delays
Equipment utilization
Unloading and loading rate
Berth time, port time and waiting time
Stockpile contents –
average/maximum
Typical Simulation Outputs
Assess track improvements proposed by the Port and investigate operational changes they would allow
Build simulation model that replicated the rail delivery system for an existing bulk loading operation
Determine capacity Existing System
System with improvements
Identify any bottlenecks
Assess opportunities and their relative benefits
Case Study – Objective
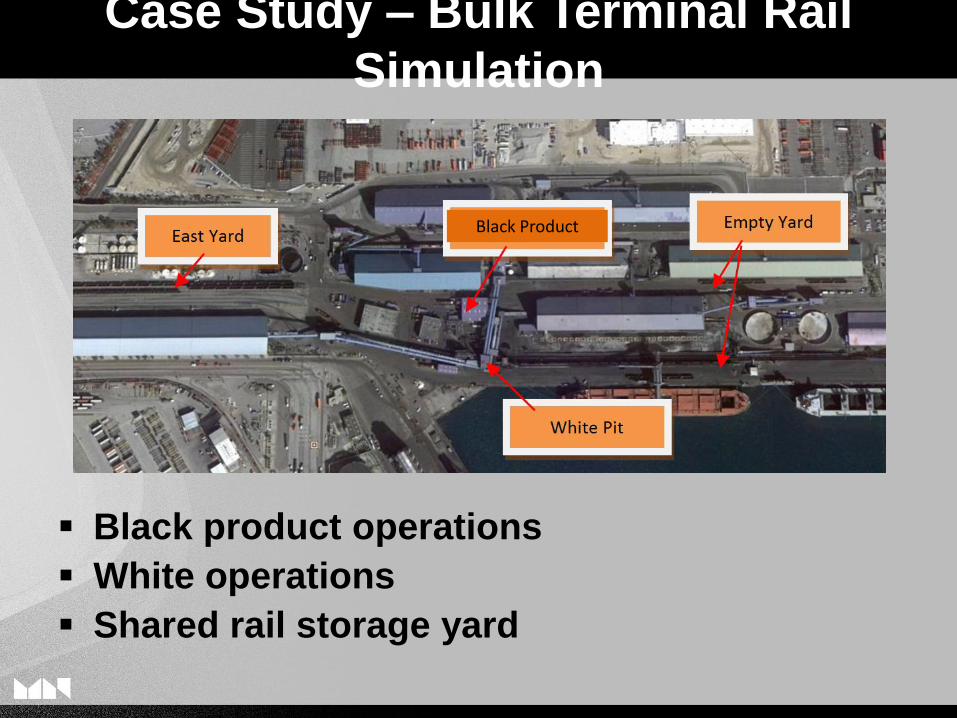
Black product operations
White operations
Shared rail storage yard
Black Product
Case Study – Bulk Terminal Rail
Simulation
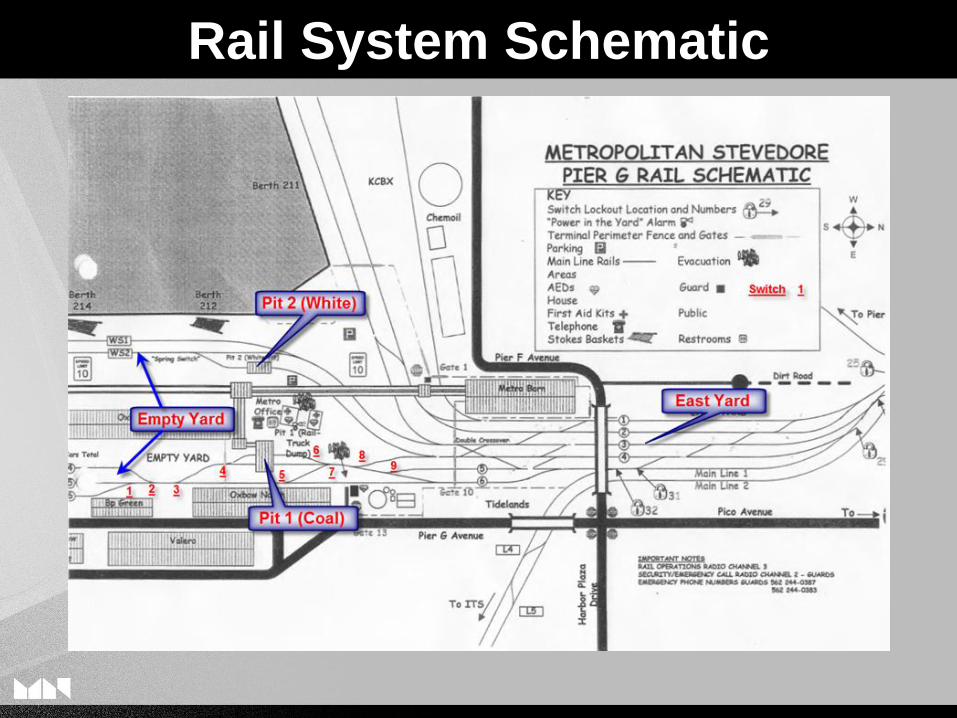
Rail System Schematic

Black product is received by train and
transferred to storage and vessels for
export
White product has no on-terminal storage
Must be transferred directly to vessels upon
dumping
Physical plant is very constrained
Limited train length for both commodities prevented
simultaneous black and white receiving
Constraints and Assumptions
Constraints and Assumptions
There is no Storage tracks for bulk product
near the Port
Staging track for inbound trains is 12 hours
away
Train cannot be released from staging track until
order has been sent to remove train from the port
facility
Minimum gap between train finish and start is 12
hours
During white product loading, receipt of
black product trains must be suspended
Impacts trains all the way back to the mine in

Constraints and Assumptions
Terminals switch engines are not allowed
to touch the mainline tracks
Limiting train Length
Required one of the terminals two switch engines
be buried on a storage track in order to dump
maximum length train
After Dumping Cars must be inspected
and bad order cars cut out before train
can be removed
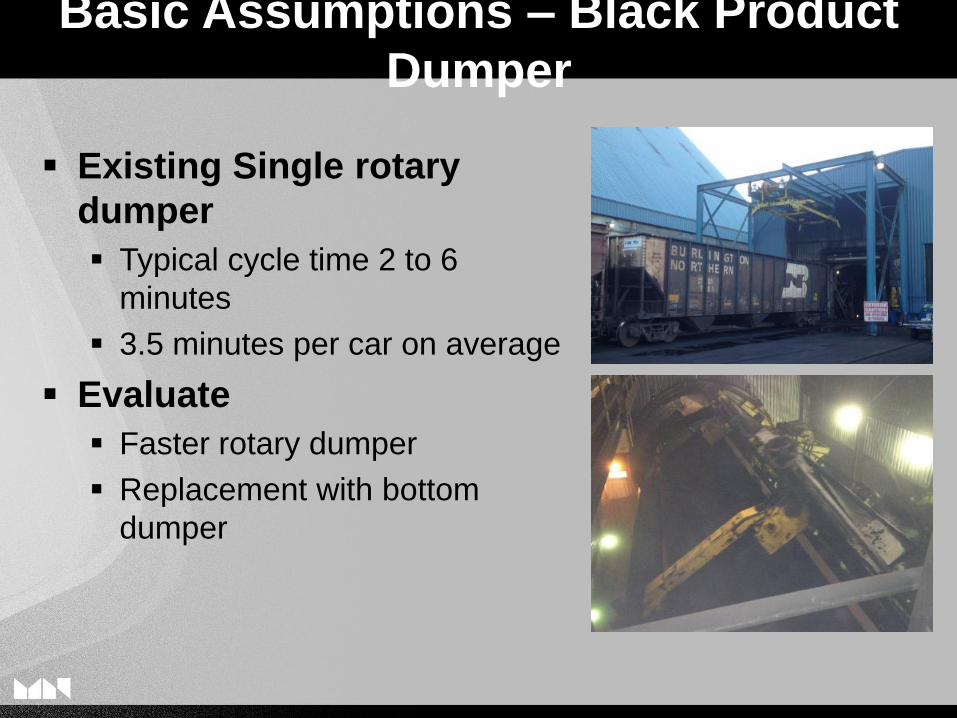
Existing Single rotary
dumper
Typical cycle time 2 to 6
minutes
3.5 minutes per car on average
Evaluate
Faster rotary dumper
Replacement with bottom
dumper
Basic Assumptions – Black Product
Dumper
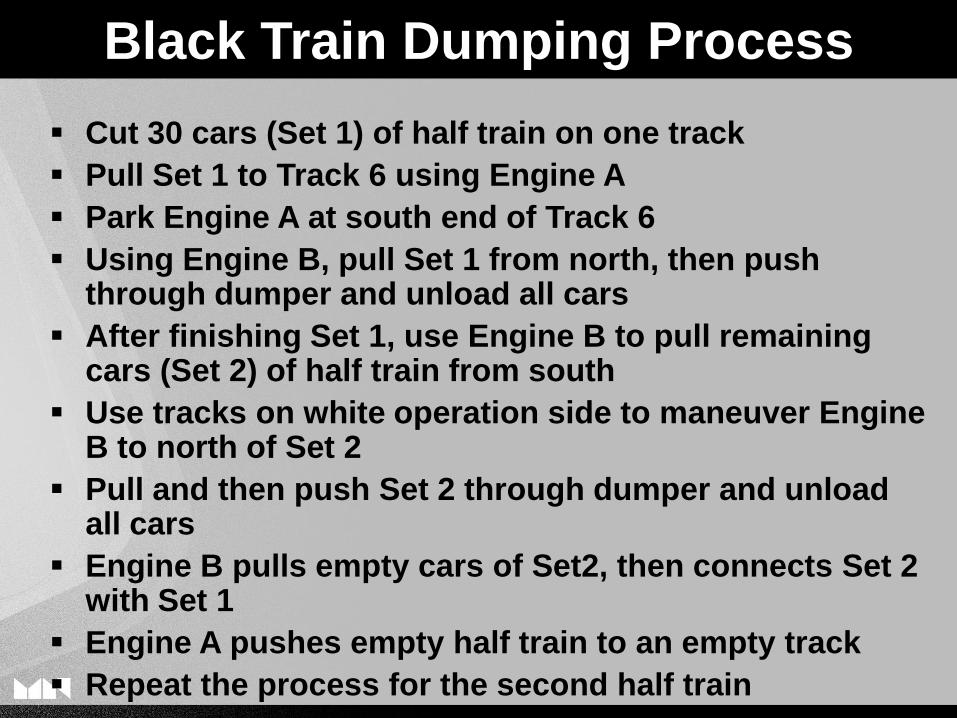
Cut 30 cars (Set 1) of half train on one track
Pull Set 1 to Track 6 using Engine A
Park Engine A at south end of Track 6
Using Engine B, pull Set 1 from north, then push through dumper and unload all cars
After finishing Set 1, use Engine B to pull remaining cars (Set 2) of half train from south
Use tracks on white operation side to maneuver Engine B to north of Set 2
Pull and then push Set 2 through dumper and unload all cars
Engine B pulls empty cars of Set2, then connects Set 2 with Set 1
Engine A pushes empty half train to an empty track
Repeat the process for the second half train
Black Train Dumping Process
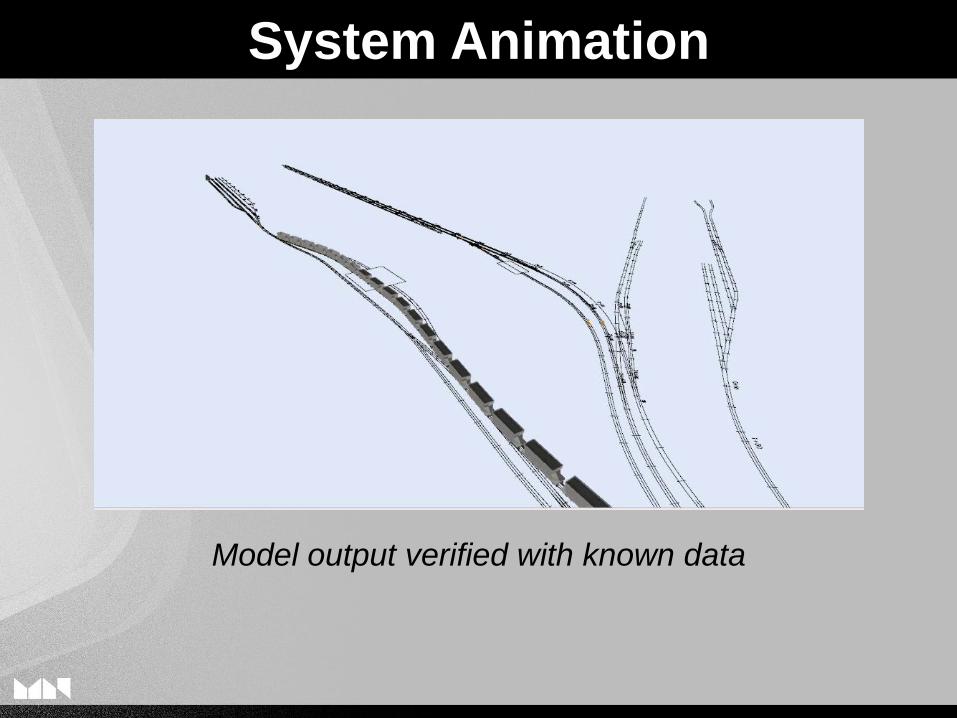
Model output verified with known data
System Animation
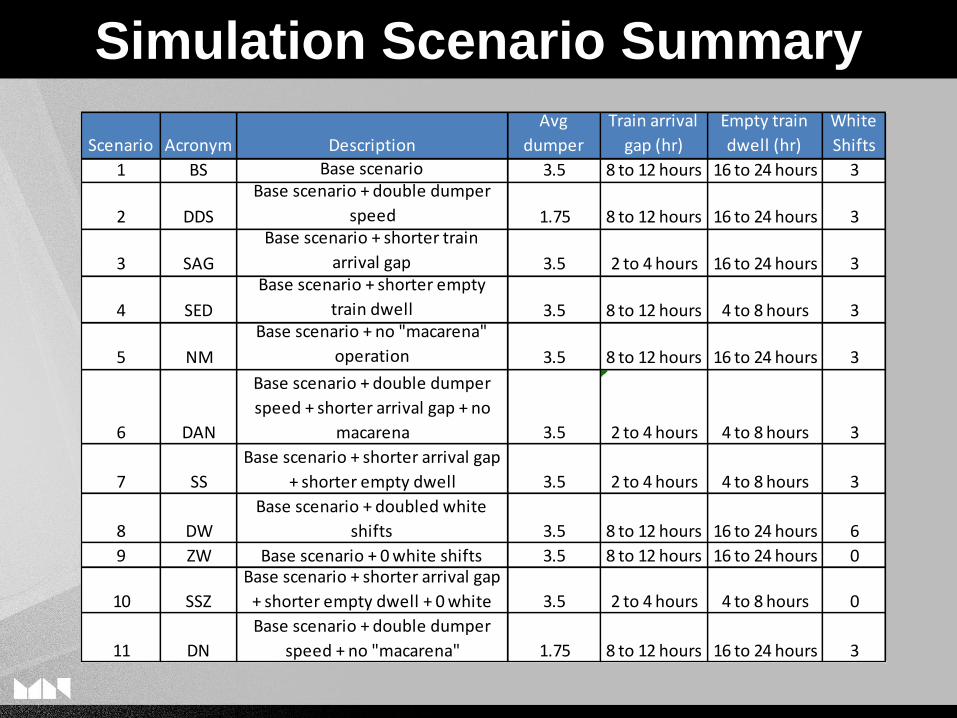
Scenario Acronym Description
Avg
dumper
Train arrival
gap (hr)
Empty train
dwell (hr)
White
Shifts
1 BS Base scenario 3.5 8 to 12 hours 16 to 24 hours 3
2 DDS
Base scenario + double dumper
speed 1.75 8 to 12 hours 16 to 24 hours 3
3 SAG
Base scenario + shorter train
arrival gap 3.5 2 to 4 hours 16 to 24 hours 3
4 SED
Base scenario + shorter empty
train dwell 3.5 8 to 12 hours 4 to 8 hours 3
5 NM
Base scenario + no "macarena"
operation 3.5 8 to 12 hours 16 to 24 hours 3
6 DAN
Base scenario + double dumper
speed + shorter arrival gap + no
macarena 3.5 2 to 4 hours 4 to 8 hours 3
7 SS
Base scenario + shorter arrival gap
+ shorter empty dwell 3.5 2 to 4 hours 4 to 8 hours 3
8 DW
Base scenario + doubled white
shifts 3.5 8 to 12 hours 16 to 24 hours 6
9 ZW Base scenario + 0 white shifts 3.5 8 to 12 hours 16 to 24 hours 0
10 SSZ
Base scenario + shorter arrival gap
+ shorter empty dwell + 0 white 3.5 2 to 4 hours 4 to 8 hours 0
11 DN
Base scenario + double dumper
speed + no "macarena" 1.75 8 to 12 hours 16 to 24 hours 3
Simulation Scenario Summary
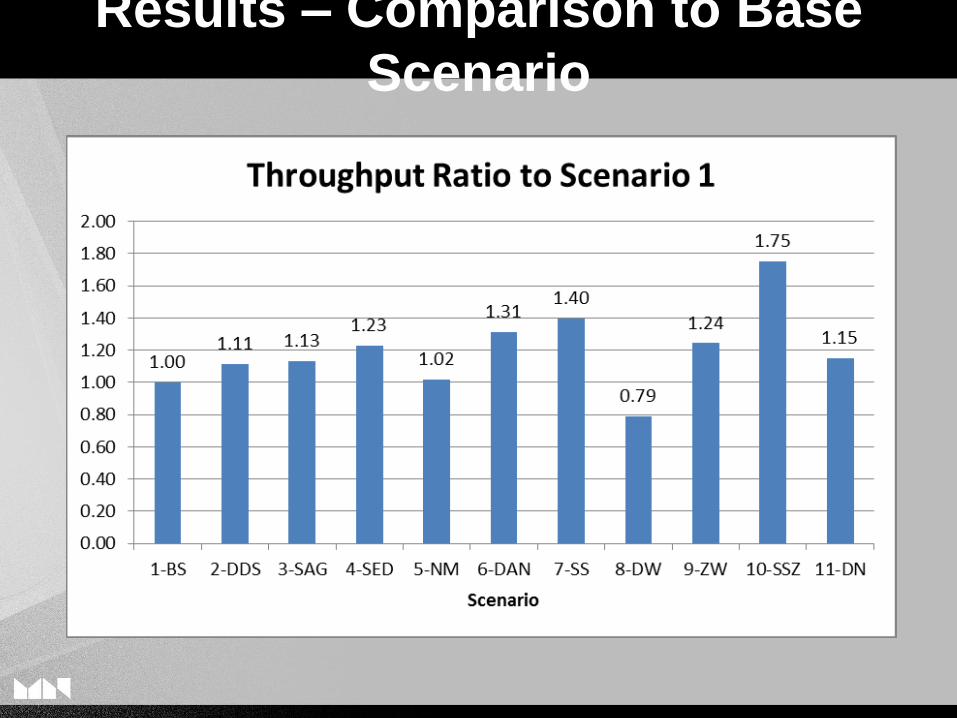
Results – Comparison to Base
Scenario
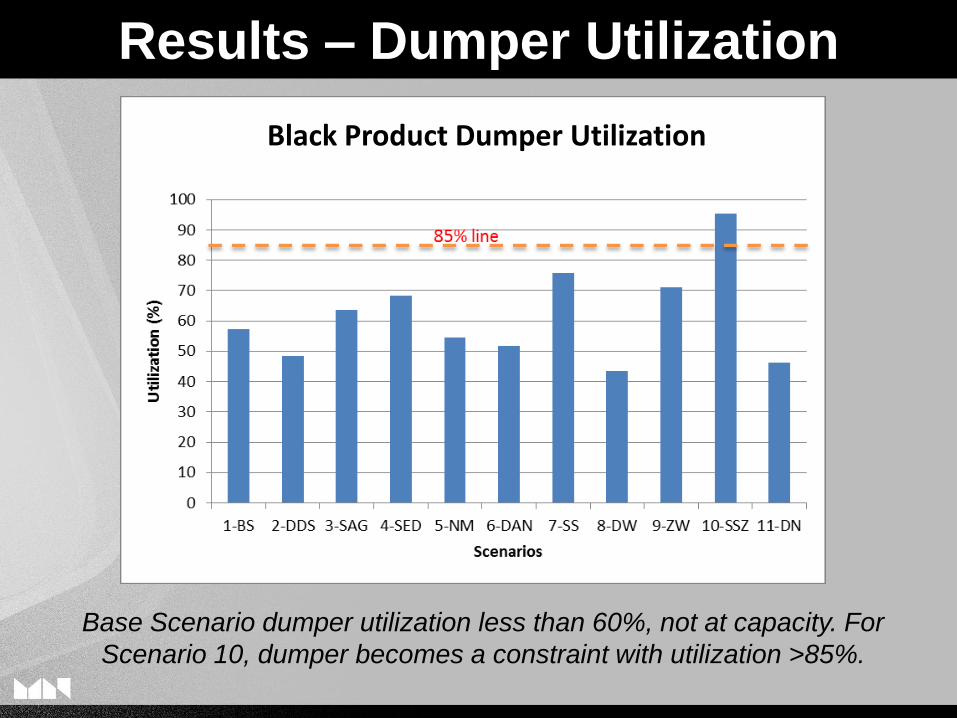
Base Scenario dumper utilization less than 60%, not at capacity. For
Scenario 10, dumper becomes a constraint with utilization >85%.
Results – Dumper Utilization
Black Product Dumper Utilization
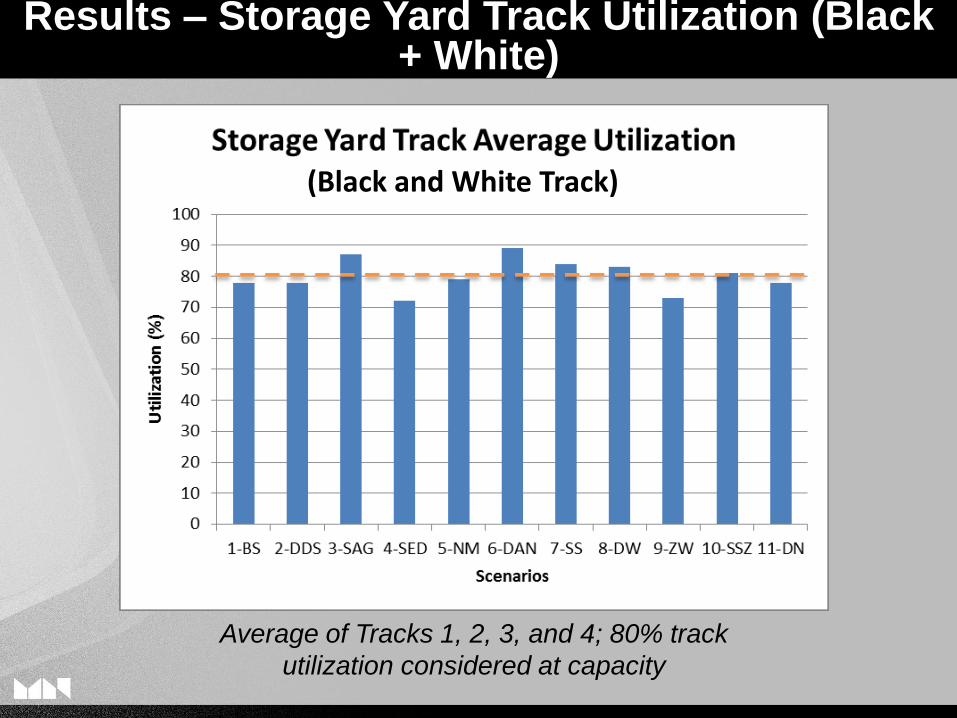
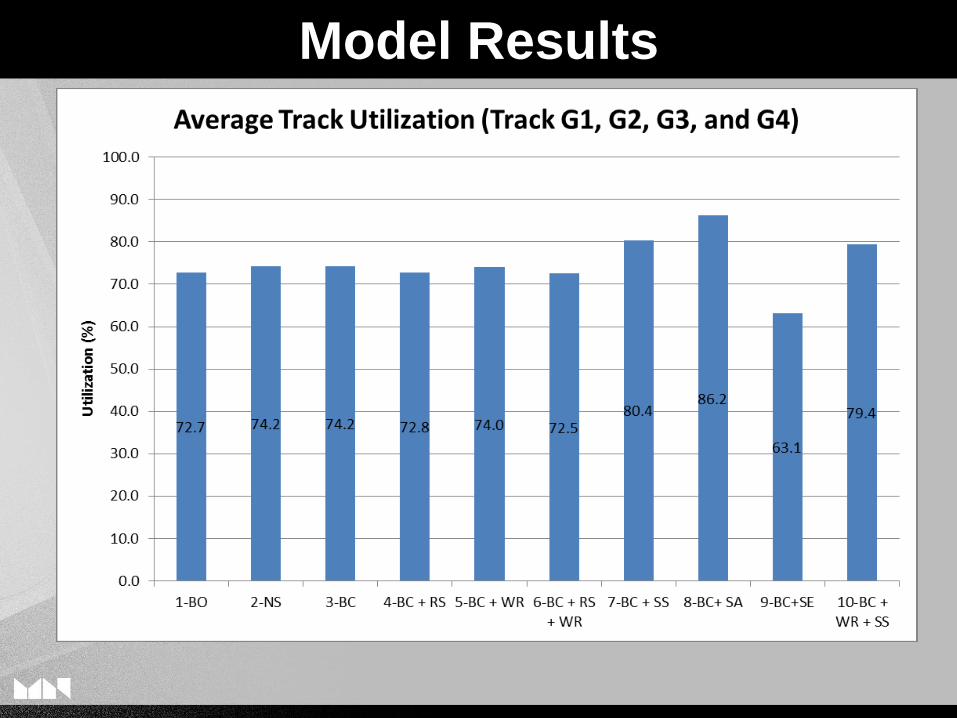
Average of Tracks 1, 2, 3, and 4; 80% track
utilization considered at capacity
Results – Storage Yard Track Utilization (Black + White)
(Black and White Track)
Black product capacity is about 283 trains per
year, assuming on average 3 white product
shifts per week
Dumper was not a capacity bottleneck for black
product operation, as indicated by its relatively
low utilization
Storage yard track is a capacity bottleneck as
indicated by its high utilization
Simulation Conclusions
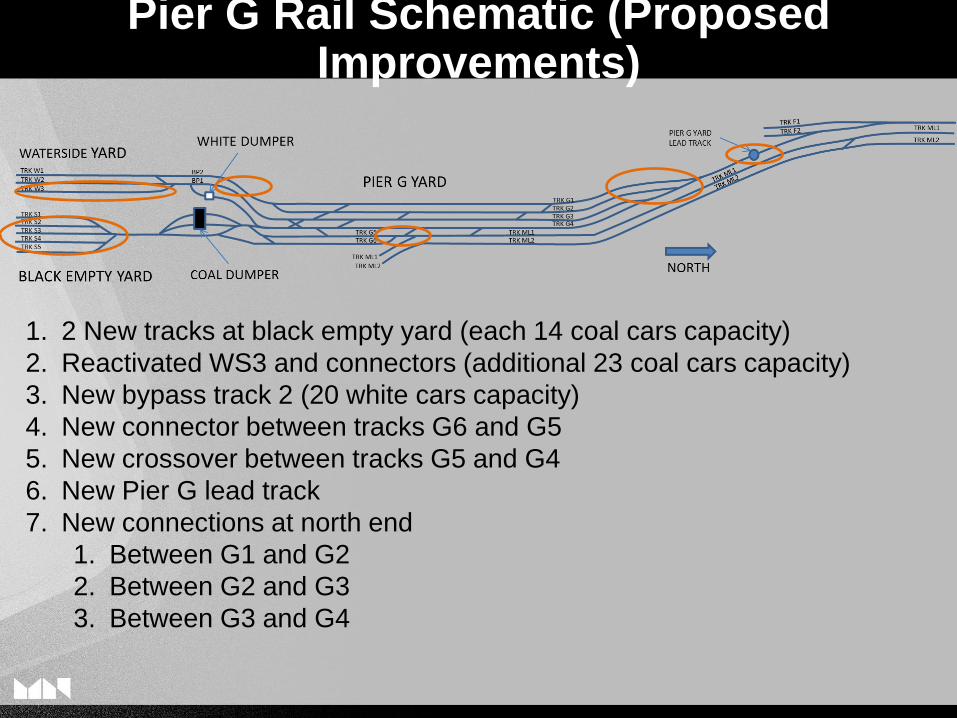
1. 2 New tracks at black empty yard (each 14 coal cars capacity)
2. Reactivated WS3 and connectors (additional 23 coal cars capacity)
3. New bypass track 2 (20 white cars capacity)
4. New connector between tracks G6 and G5
5. New crossover between tracks G5 and G4
6. New Pier G lead track
7. New connections at north end
1. Between G1 and G2
2. Between G2 and G3
3. Between G3 and G4
Pier G Rail Schematic (Proposed Improvements)
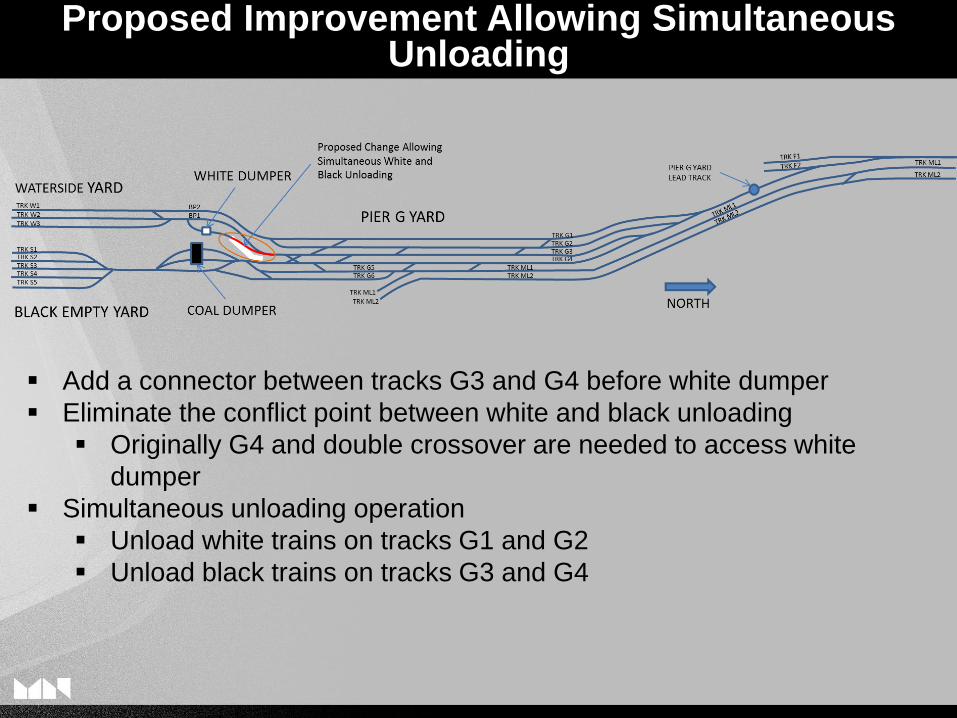
Add a connector between tracks G3 and G4 before white dumper
Eliminate the conflict point between white and black unloading
Originally G4 and double crossover are needed to access white
dumper
Simultaneous unloading operation
Unload white trains on tracks G1 and G2
Unload black trains on tracks G3 and G4
Proposed Improvement Allowing Simultaneous Unloading
What are potential operational benefits
Opportunity for simultaneous black and white Operations
Impact on capacity
Are there potential bottlenecks
Simulation Objectives
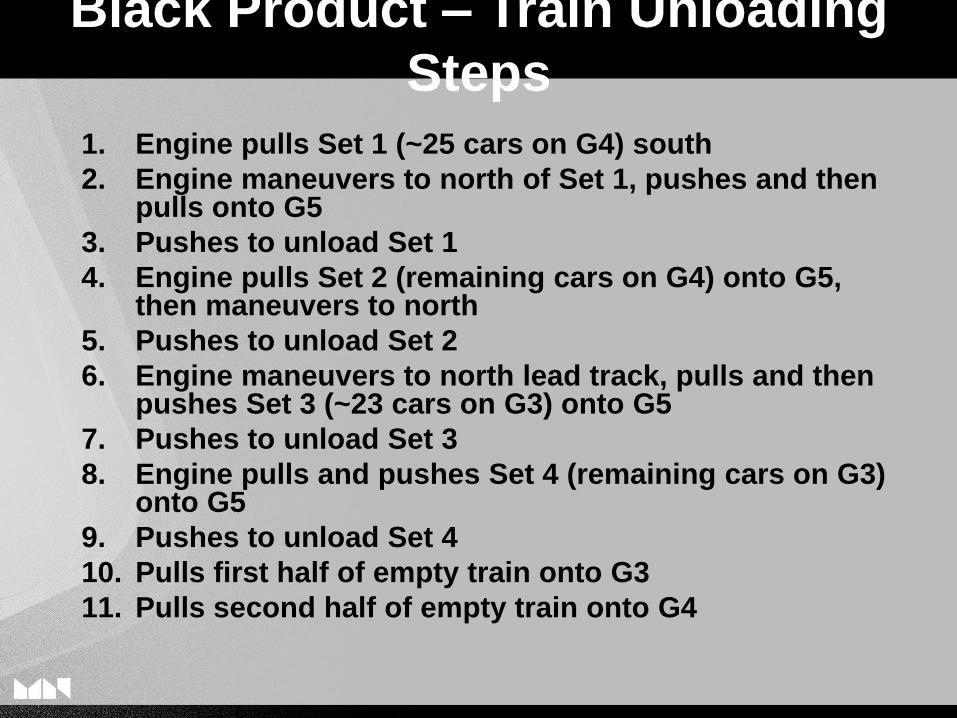
1. Engine pulls Set 1 (~25 cars on G4) south
2. Engine maneuvers to north of Set 1, pushes and then pulls onto G5
3. Pushes to unload Set 1
4. Engine pulls Set 2 (remaining cars on G4) onto G5, then maneuvers to north
5. Pushes to unload Set 2
6. Engine maneuvers to north lead track, pulls and then pushes Set 3 (~23 cars on G3) onto G5
7. Pushes to unload Set 3
8. Engine pulls and pushes Set 4 (remaining cars on G3) onto G5
9. Pushes to unload Set 4
10. Pulls first half of empty train onto G3
11. Pulls second half of empty train onto G4
Black Product – Train Unloading
Steps
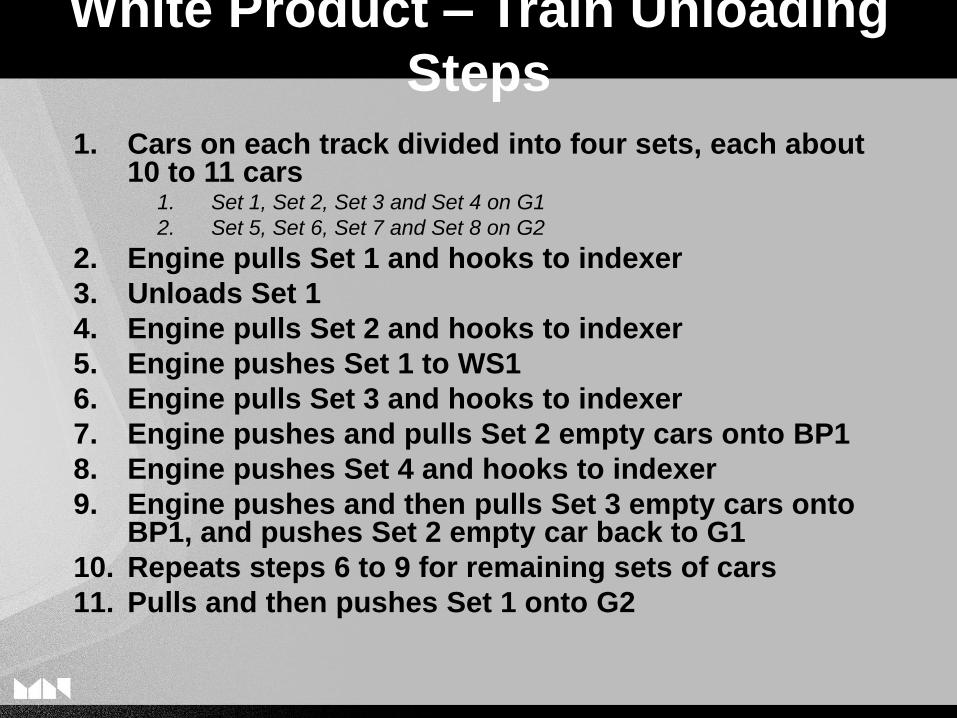
1. Cars on each track divided into four sets, each about 10 to 11 cars
1. Set 1, Set 2, Set 3 and Set 4 on G1
2. Set 5, Set 6, Set 7 and Set 8 on G2
2. Engine pulls Set 1 and hooks to indexer
3. Unloads Set 1
4. Engine pulls Set 2 and hooks to indexer
5. Engine pushes Set 1 to WS1
6. Engine pulls Set 3 and hooks to indexer
7. Engine pushes and pulls Set 2 empty cars onto BP1
8. Engine pushes Set 4 and hooks to indexer
9. Engine pushes and then pulls Set 3 empty cars onto BP1, and pushes Set 2 empty car back to G1
10. Repeats steps 6 to 9 for remaining sets of cars
11. Pulls and then pushes Set 1 onto G2
White Product – Train Unloading
Steps
Include
Dumper activity (cycle time per car)
Equipment breakdown
Labor meal and break times
Connecting/disconnecting cars/engines
Train arrival and departure delays
Train inter-arrival gap
On Terminal empty car dwell time
Simulation Settings
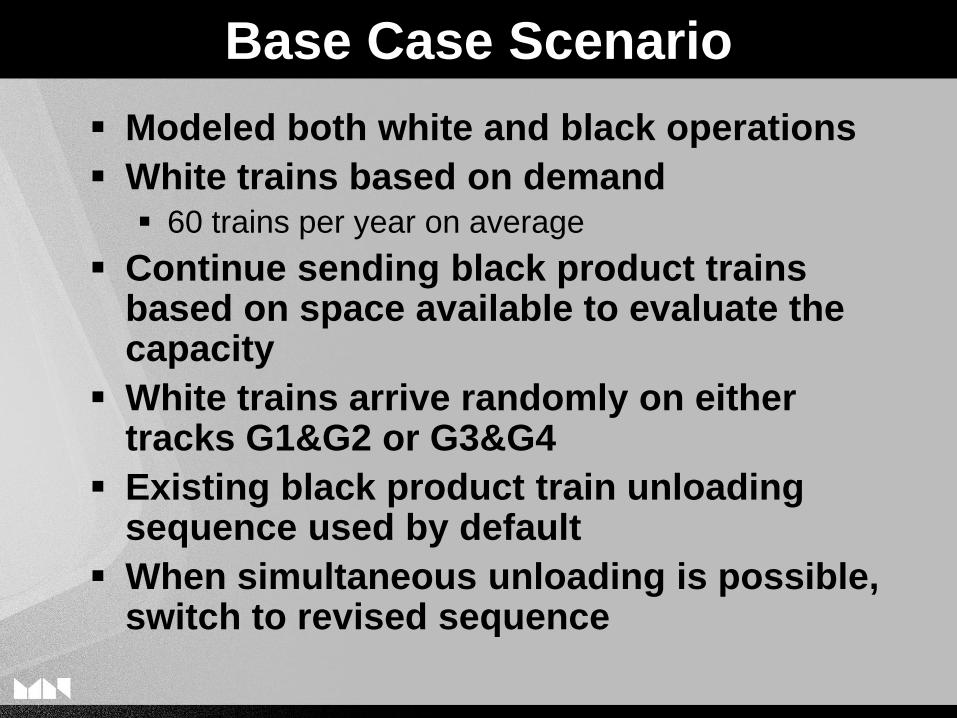
Modeled both white and black operations
White trains based on demand 60 trains per year on average
Continue sending black product trains based on space available to evaluate the capacity
White trains arrive randomly on either tracks G1&G2 or G3&G4
Existing black product train unloading sequence used by default
When simultaneous unloading is possible, switch to revised sequence
Base Case Scenario
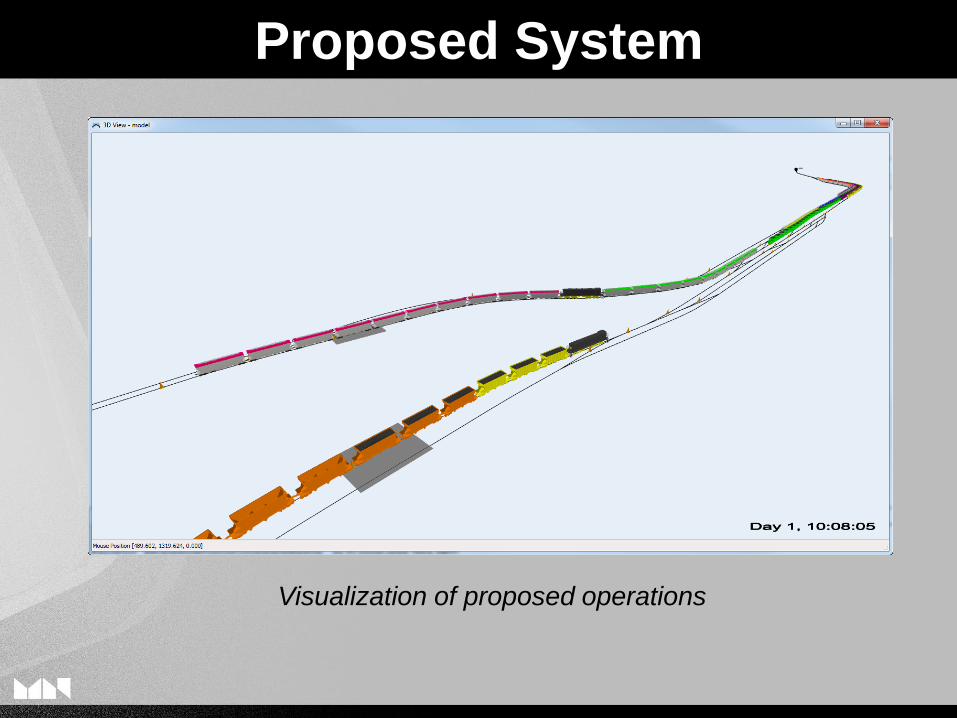
Visualization of proposed operations
Proposed System
Scenario Acronym Description
Train arrival
gap (hr)
Empty train
dwell (hr)
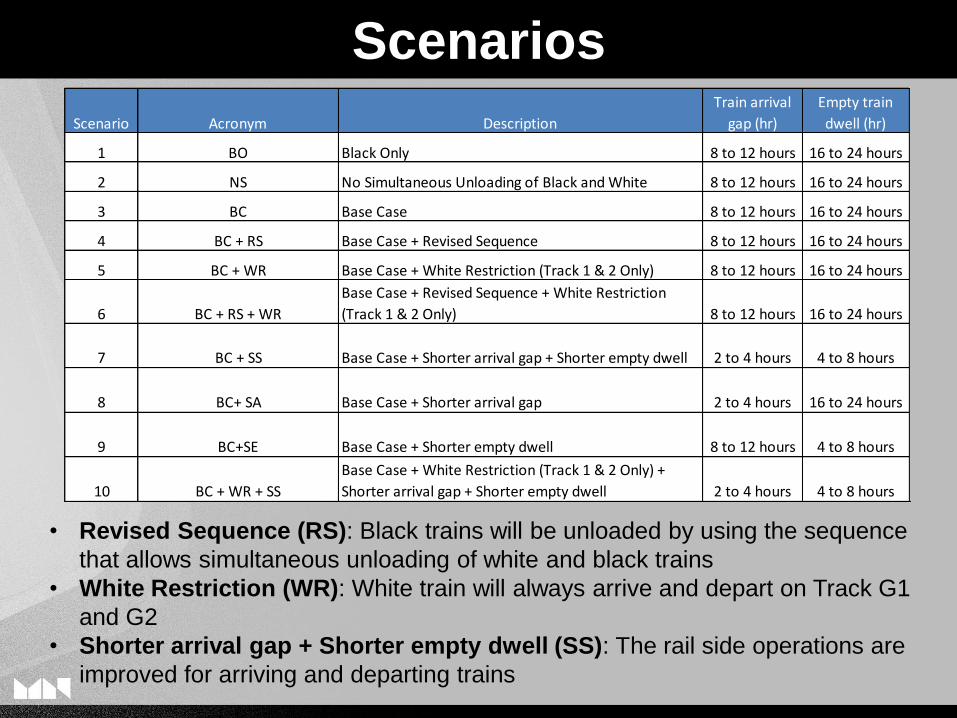
1 BO Black Only 8 to 12 hours 16 to 24 hours
2 NS No Simultaneous Unloading of Black and White 8 to 12 hours 16 to 24 hours
3 BC Base Case 8 to 12 hours 16 to 24 hours
4 BC + RS Base Case + Revised Sequence 8 to 12 hours 16 to 24 hours
5 BC + WR Base Case + White Restriction (Track 1 & 2 Only) 8 to 12 hours 16 to 24 hours
6 BC + RS + WR
Base Case + Revised Sequence + White Restriction
(Track 1 & 2 Only) 8 to 12 hours 16 to 24 hours
7 BC + SS Base Case + Shorter arrival gap + Shorter empty dwell 2 to 4 hours 4 to 8 hours
8 BC+ SA Base Case + Shorter arrival gap 2 to 4 hours 16 to 24 hours
9 BC+SE Base Case + Shorter empty dwell 8 to 12 hours 4 to 8 hours
10 BC + WR + SS
Base Case + White Restriction (Track 1 & 2 Only) +
Shorter arrival gap + Shorter empty dwell 2 to 4 hours 4 to 8 hours
• Revised Sequence (RS): Black trains will be unloaded by using the sequence
that allows simultaneous unloading of white and black trains
• White Restriction (WR): White train will always arrive and depart on Track G1
and G2
• Shorter arrival gap + Shorter empty dwell (SS): The rail side operations are
improved for arriving and departing trains
Scenarios
34
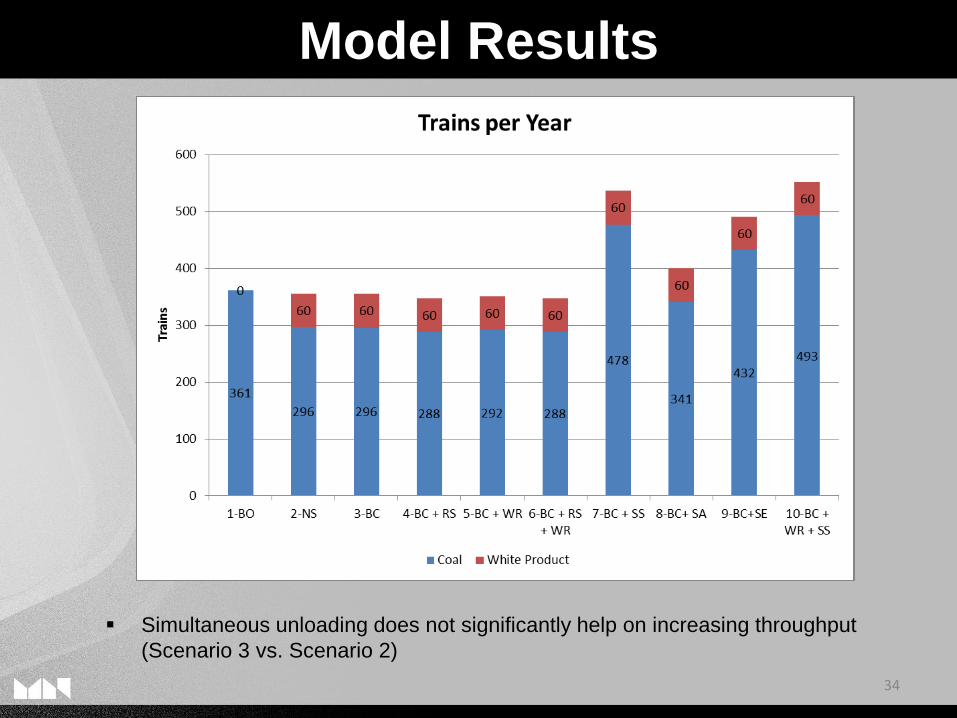
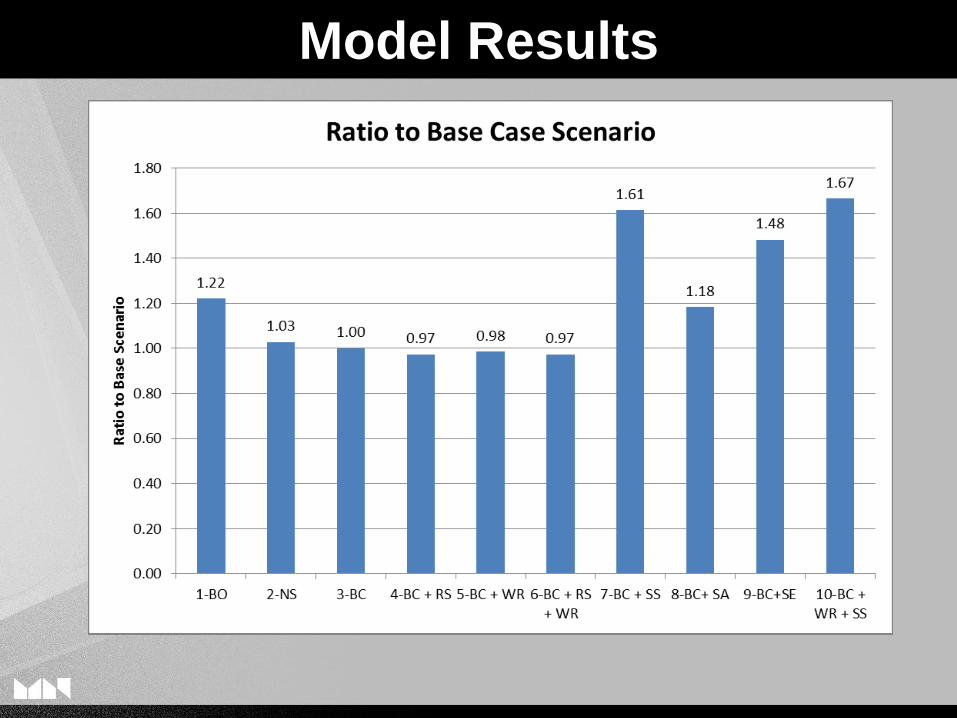
Model Results
Simultaneous unloading does not significantly help on increasing throughput
(Scenario 3 vs. Scenario 2)
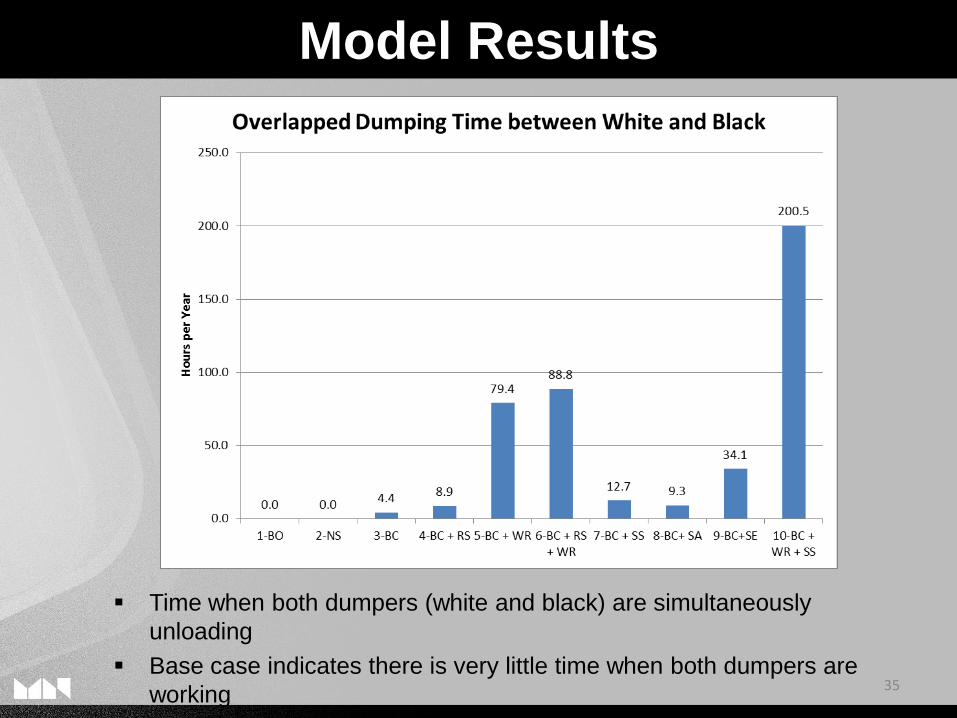
35
Model Results
Time when both dumpers (white and black) are simultaneously
unloading
Base case indicates there is very little time when both dumpers are
working
Model Results
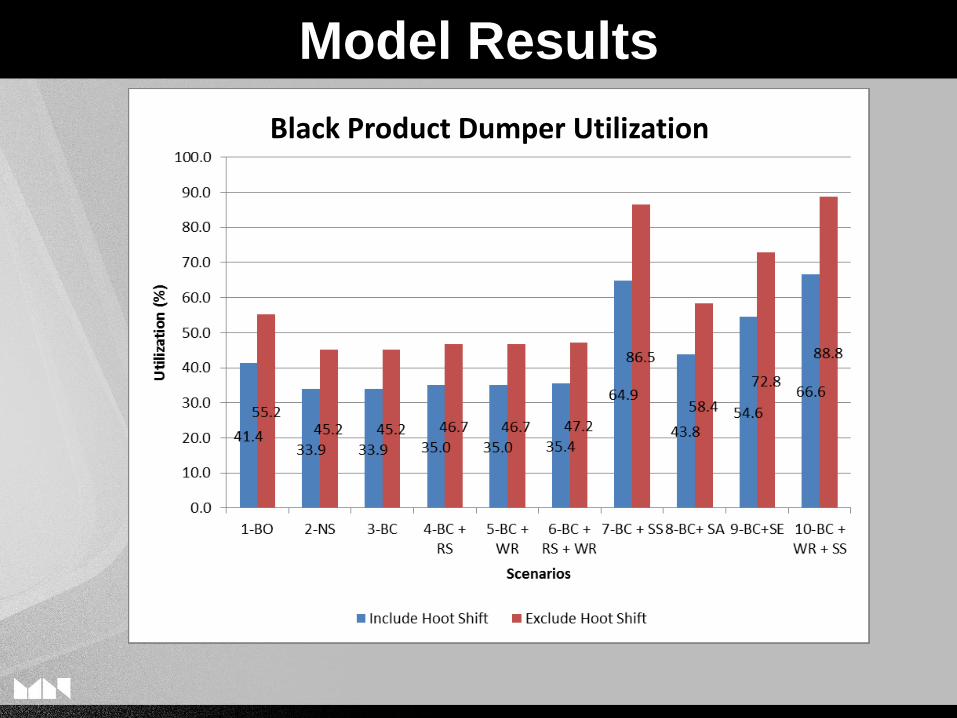
Model Results
Black Product Dumper Utilization
Model Results
Proposed improvements :
Longer trains for arrival and departure
– 84 cars/white train, 5% increase
– 96 cars/black train), 4% increase
More capacity for holding empty cars, both white and
black
Operational flexibility without impacting mainline
traffic
– Using any of G1, G2, G3, and G4 as bypass to access their north
ends
– Better use of track G5 and G6
– One more by-pass track for white
Allows simultaneous black and white operation
Black and white simultaneous unloading gives
operational flexibility, but not a significant increase in
throughput
Conclusions
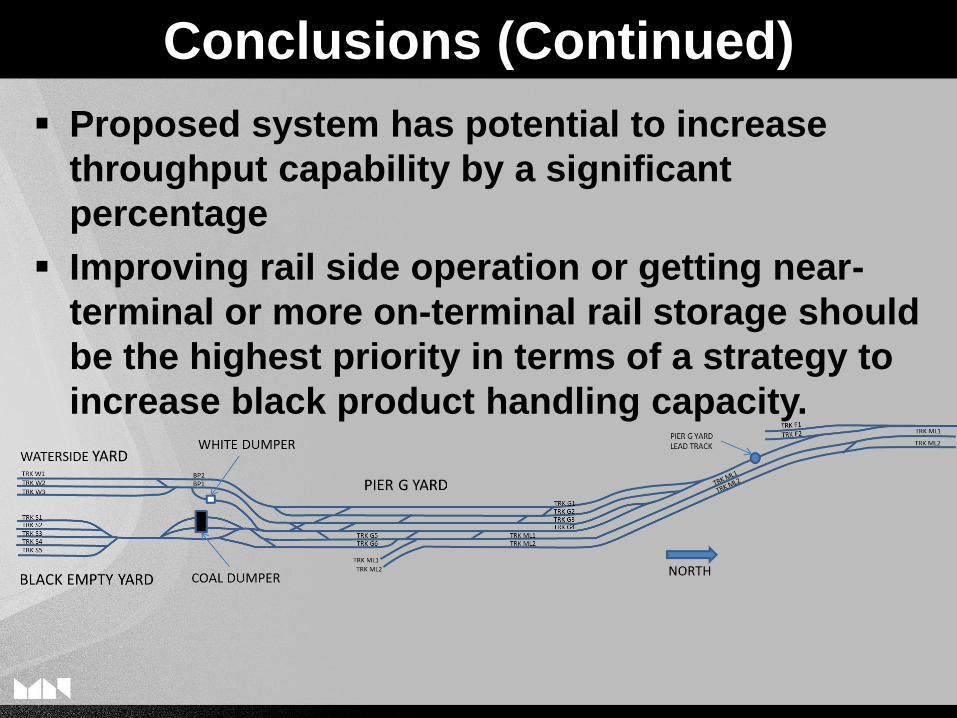
Proposed system has potential to increase
throughput capability by a significant
percentage
Improving rail side operation or getting near-
terminal or more on-terminal rail storage should
be the highest priority in terms of a strategy to
increase black product handling capacity.
Conclusions (Continued)
Modeled existing complex operations and
Proposed improvements providing a visual
and analytical tool to study the terminal
Identified
Impacts on operations
Potential bottlenecks
Assessed opportunities and their relative
benefits to facilitate decision making
process
Simulation Tool
Robert Kaptein, PE
Senior Port Planner/Analyst
3780 Kilroy Airport Way, Suite 600
Long Beach, CA 90806
562.426.9551
Contact Information