bulletin 7602-00e wt500 power analyzer - yokogawa€¦ · wt500 power analyzer wt500 ......
TRANSCRIPT

WT500Power A
nalyzer WT500
Simultaneous measurement of voltage, current, power, and harmonics
High-speed data updating (100 ms) Display of numerical values, waveforms and trends Measurement of bought and sold watt hours Easy setup and operation
Power Analyzer
0.5 to40 A
15 to1000 V
0.2% DC 0.5 Hzto 100 kHz
0.5 to40 A
15 to1000 V
0.2% DC 0.5 Hzto 100 kHz
Current Range Voltage Range
Basic Power Accuracy Frequency Range
ww
w.y
oko
ga
wa
.co
m/y
mi/
Vis
it o
ur
web
site
to
sig
n u
p f
or
emai
l up
dat
es.
Bulletin 7602-00E

FeaturesStandard feature
Option
Software (sold separately)
The WT500 Power Analyzer features a color TFT and compact body that enables single-phase and three-phase power measurement, achieving ±0.1% basic accuracy, maximum input of 1000 Vrms, 40 Arms and a measurement bandwidth of 100 kHz.
Key layout offers intuitive control
Cursor KeysCursor keys can be used to move the on-screen cursor in four different directions. The cursor keys and SET key can also be used for making selections in soft menus. The WT500’s menu structure is even more user-friendly than other models.
RANGE KeysThe RANGE keys can be used to set the voltage and current ranges. Quick intuitive range control is available by using direct keys.
DISPLAY KeysDISPLAY keys can be used to switch between numerical values, waveforms, and other displays. The display format can easily be changed.
SETUP KeyThe SETUP key can be used to enter various settings required for power measurement such as the wiring method and filters.
FILE, IMAGE, and STORE KeysThe keys related to data storage are located in the same area. Data can be easily stored in USB memory.
Features Simultaneous measurement of DC and AC signals
Evaluation of DC/AC signal conversion technology is critical in the renewable energy market. With input from 2 or more elements, the WT500 can measure DC and AC signals simultaneously and calculate input-to-output efficiency.
Separate integration functions for charge/discharge and bought/sold power The WT500 is equipped with integration functions that can not only evaluate charge and discharge current such as from secondary cells, but also bought and sold power in photovoltaic power generation systems.
Saving measured data directly to USB memory Measured data can be saved in CSV format directly to USB memory.
Easy setup with cursor keys Menu-type screen offers intuitive settings.
Simultaneous measurement of normal data and harmonic data with the harmonic measurement, /G5 option Voltage RMS, current RMS, power values, and harmonic components up to the 50 order can be measured simultaneously.
WT series for power evaluation of energy-saving equipment The WT series have been used as powermeters for Green IT, Energy Star, CO2 reduction and other energy-saving equipment. The WT series—Including the WT500—supports your power evaluation needs.
2
Voltagerange
15 to 1000 V
Currentrange
0.5 to 40 A
USBmemory
InternalMemory
20 MB
Frequencypowerrange
100 kHz
Inputs
1, 2, 3
BasicPower
Accuracy
±0.1%
Crestfactor
6 (300)
Comm
USB
Display
5.7 TFT
Dataupdatinginterval
100 ms to 5 s
Externalsensorrange
0.05 to 10 V
6 ch
/EX
Comm
GP-IB/C1
Comm
Ethernet
Software
WTViewer760122/C7
VGA
232.23 V
/V1
Harmonics
/G5
Deltacomputation
/DT
Frequencymeasurement
/FQ
CSV format
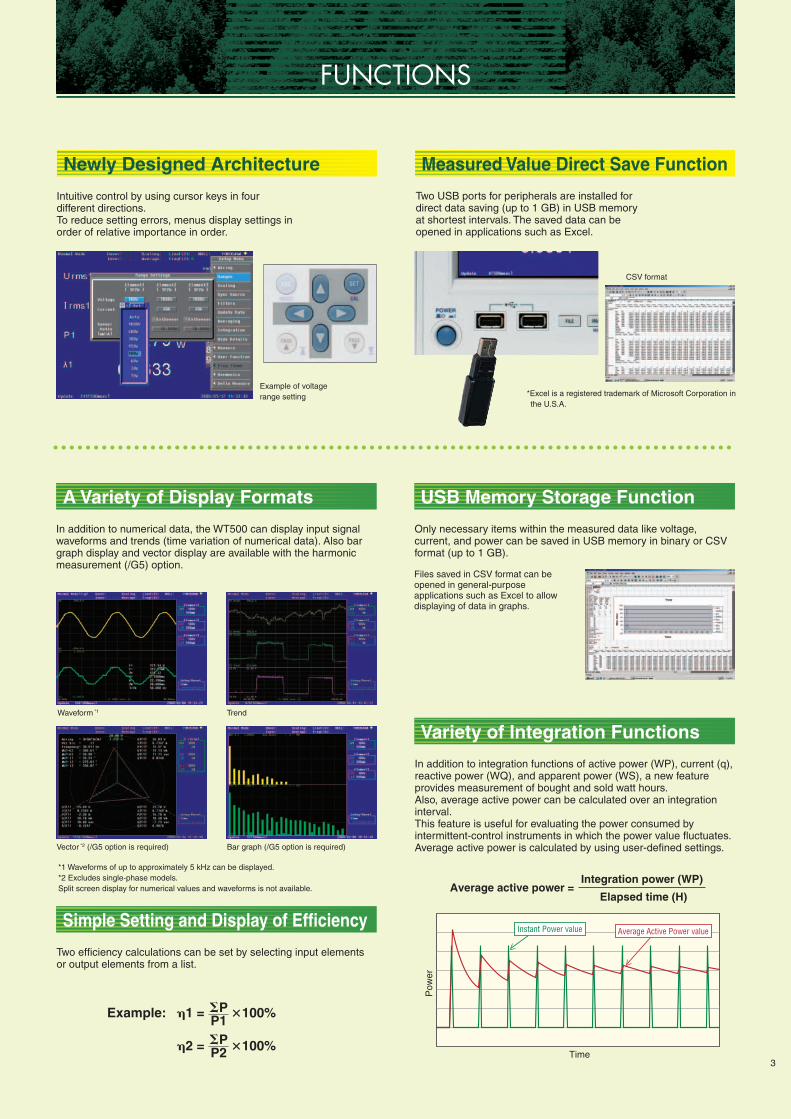
Example of voltage range setting
Waveform *1
Vector *2 (/G5 option is required) Bar graph (/G5 option is required)
Trend
*1 Waveforms of up to approximately 5 kHz can be displayed. *2 Excludes single-phase models. Split screen display for numerical values and waveforms is not available.
*Excel is a registered trademark of Microsoft Corporation in the U.S.A.
Average active power =Integration power (WP)
Elapsed time (H)
Time
Pow
er
Instant Power value Average Active Power valueSimple Setting and Display of Efficiency
Variety of Integration Functions
Intuitive control by using cursor keys in four different directions.To reduce setting errors, menus display settings in order of relative importance in order.
In addition to numerical data, the WT500 can display input signal waveforms and trends (time variation of numerical data). Also bar graph display and vector display are available with the harmonic measurement (/G5) option.
Only necessary items within the measured data like voltage, current, and power can be saved in USB memory in binary or CSV format (up to 1 GB).
In addition to integration functions of active power (WP), current (q), reactive power (WQ), and apparent power (WS), a new feature provides measurement of bought and sold watt hours.Also, average active power can be calculated over an integration interval. This feature is useful for evaluating the power consumed by intermittent-control instruments in which the power value fluctuates. Average active power is calculated by using user-defined settings.
Two efficiency calculations can be set by selecting input elements or output elements from a list.
Files saved in CSV format can be opened in general-purpose applications such as Excel to allow displaying of data in graphs.
Two USB ports for peripherals are installed for direct data saving (up to 1 GB) in USB memory at shortest intervals. The saved data can be opened in applications such as Excel.
Example: 1 = 100%
2 = 100%
A Variety of Display Formats USB Memory Storage Function
Measured Value Direct Save FunctionNewly Designed Architecture
FUNCTIONS
3
PP1PP2
APPLICATIONS
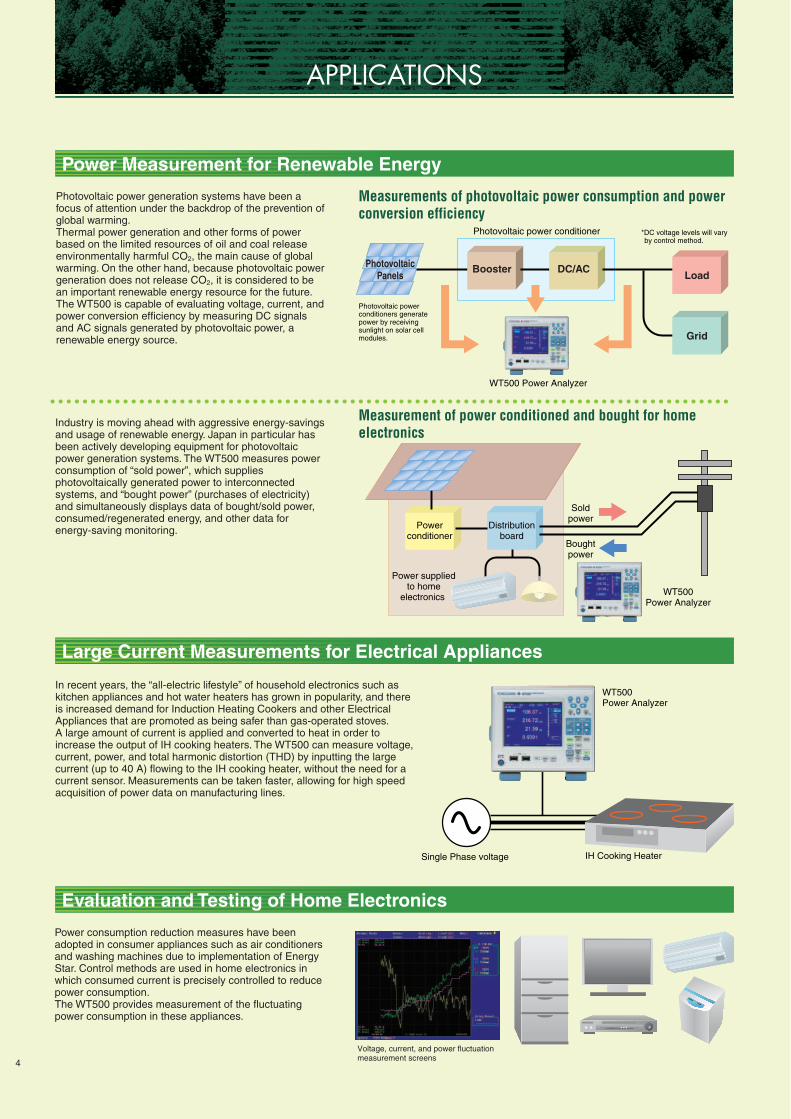
Measurements of photovoltaic power consumption and power conversion efficiency
Measurement of power conditioned and bought for home electronics
Photovoltaic power conditioner
Photovoltaic power generation systems have been a focus of attention under the backdrop of the prevention of global warming. Thermal power generation and other forms of power based on the limited resources of oil and coal release environmentally harmful CO2, the main cause of global warming. On the other hand, because photovoltaic power generation does not release CO2, it is considered to be an important renewable energy resource for the future. The WT500 is capable of evaluating voltage, current, and power conversion efficiency by measuring DC signals and AC signals generated by photovoltaic power, a renewable energy source.
Power consumption reduction measures have been adopted in consumer appliances such as air conditioners and washing machines due to implementation of Energy Star. Control methods are used in home electronics in which consumed current is precisely controlled to reduce power consumption. The WT500 provides measurement of the fluctuating power consumption in these appliances.
In recent years, the “all-electric lifestyle” of household electronics such as kitchen appliances and hot water heaters has grown in popularity, and there is increased demand for Induction Heating Cookers and other Electrical Appliances that are promoted as being safer than gas-operated stoves. A large amount of current is applied and converted to heat in order to increase the output of IH cooking heaters. The WT500 can measure voltage, current, power, and total harmonic distortion (THD) by inputting the large current (up to 40 A) flowing to the IH cooking heater, without the need for a current sensor. Measurements can be taken faster, allowing for high speed acquisition of power data on manufacturing lines.
Industry is moving ahead with aggressive energy-savings and usage of renewable energy. Japan in particular has been actively developing equipment for photovoltaic power generation systems. The WT500 measures power consumption of “sold power”, which supplies photovoltaically generated power to interconnected systems, and “bought power” (purchases of electricity) and simultaneously displays data of bought/sold power, consumed/regenerated energy, and other data for energy-saving monitoring.
PhotovoltaicPanels
WT500 Power Analyzer
BoosterLoad
Grid
DC/AC
Soldpower
Boughtpower
*DC voltage levels will vary by control method.
Photovoltaic power conditioners generate power by receiving sunlight on solar cell modules.
WT500Power Analyzer
Single Phase voltage IH Cooking Heater
Power supplied to home
electronics
Distributionboard
Powerconditioner
Voltage, current, and power fluctuation measurement screens
WT500Power Analyzer
Power Measurement for Renewable Energy
Large Current Measurements for Electrical Appliances
Evaluation and Testing of Home Electronics
4

APPLICATIONS
SOFTWARE
InverterMotor & Pump
UPS Output waveform
Various industrial motor & pump and air-conditioning fans are used in factories and other such locations. The revolution speed of these motor & pump has to be controlled in order to save energy, therefore many inverter-driven motor & pump are used.The WT500 not only measures variation of voltage, current and power to evaluate performance of these motor & pump, but also enables you to examine energy efficiency by measuring integrated power.
Uninterruptible Power Supplies (UPS) are systems that provide stable supplies of power at all times even during power failures such as power outages, instantaneous power failures, voltage fluctuations, and frequency changes. As UPS performance tests, the WT500 can calculate input-to-output efficiency, power output, frequency, and distortion factor.
WT500Power Analyzer
WT500Power Analyzer
Three phase voltage
Load
*Picture is a sample of connection with WT1800E
*LabVIEW is a registered trademark of NATIONAL INSTRUMENTS Corporation in the U.S.A.
Analysis display Multi unit connection display
Measuring Power Consumption of Various Motor Loads
Power Quality Evaluation and Testing of UPS (Uninterruptable Power Supplies)
WTViewerE 761941 LabVIEW Drivers
Data acquisition possible using LabVIEW.LabVIEW drivers can be downloaded from our Web site.(Free)
WTViewerE is an application software that reads measured numerical, waveform, and harmonic data. Data can be transferred to a personal computer via GP-IB, Ethernet, or USB communications to display and store numeric or waveform data. A communications option can be installed in the WT500 as needed.
Communication Interface: USB, GP-IB (/C1), Ethernet (/C7)
5
Note: The standard model can measure up to two frequencies.
REAR PANEL
OPTIONS
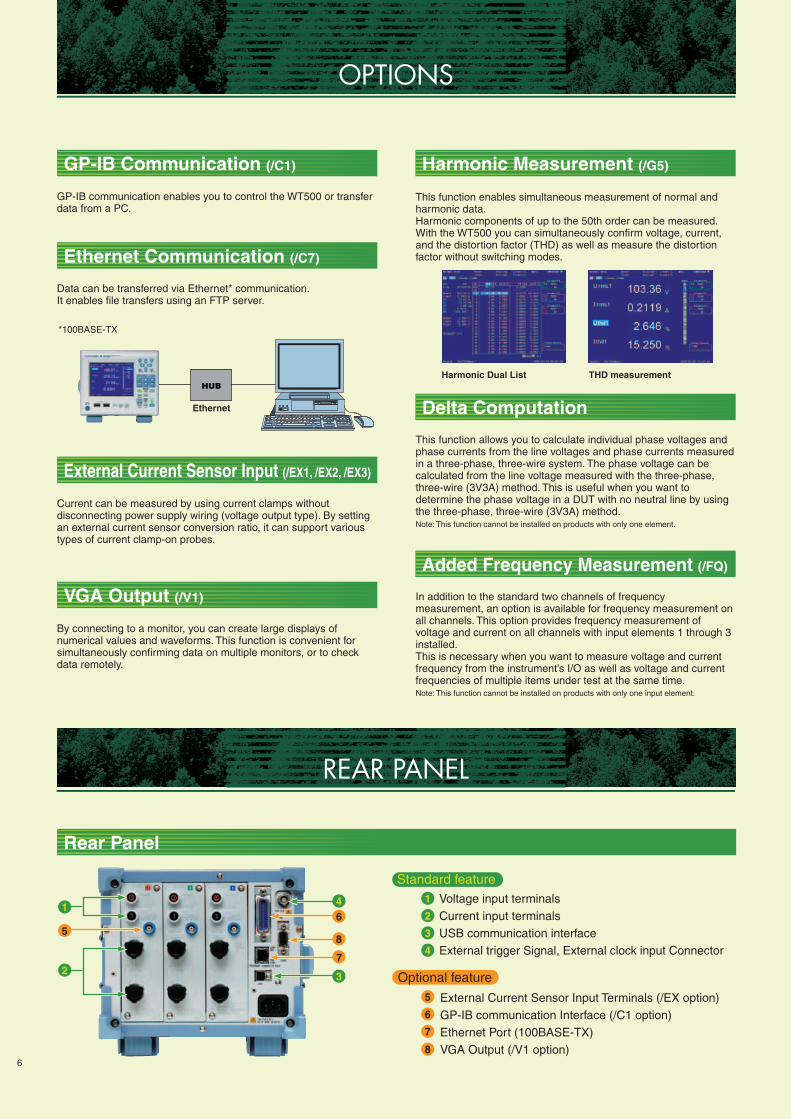
*100BASE-TX
GP-IB communication enables you to control the WT500 or transfer data from a PC.
Current can be measured by using current clamps without disconnecting power supply wiring (voltage output type). By setting an external current sensor conversion ratio, it can support various types of current clamp-on probes.
By connecting to a monitor, you can create large displays of numerical values and waveforms. This function is convenient for simultaneously confirming data on multiple monitors, or to check data remotely.
Data can be transferred via Ethernet* communication. It enables file transfers using an FTP server.
This function enables simultaneous measurement of normal and harmonic data. Harmonic components of up to the 50th order can be measured. With the WT500 you can simultaneously confirm voltage, current, and the distortion factor (THD) as well as measure the distortion factor without switching modes.
This function allows you to calculate individual phase voltages and phase currents from the line voltages and phase currents measured in a three-phase, three-wire system. The phase voltage can be calculated from the line voltage measured with the three-phase, three-wire (3V3A) method. This is useful when you want to determine the phase voltage in a DUT with no neutral line by using the three-phase, three-wire (3V3A) method. Note: This function cannot be installed on products with only one element.
6
In addition to the standard two channels of frequency measurement, an option is available for frequency measurement on all channels. This option provides frequency measurement of voltage and current on all channels with input elements 1 through 3 installed. This is necessary when you want to measure voltage and current frequency from the instrument’s I/O as well as voltage and current frequencies of multiple items under test at the same time. Note: This function cannot be installed on products with only one input element.
Harmonic Dual List THD measurementHUB
Ethernet
GP-IB Communication (/C1)
Ethernet Communication (/C7)
External Current Sensor Input (/EX1, /EX2, /EX3)
VGA Output (/V1)
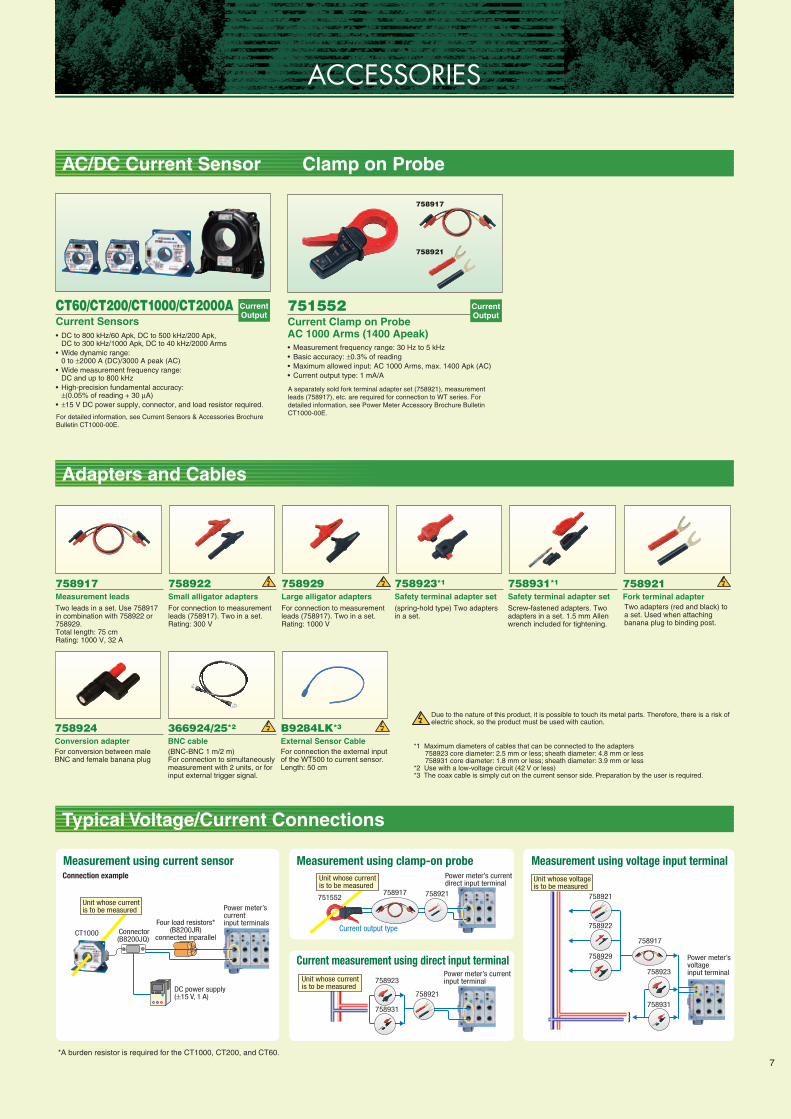
Rear Panel
Harmonic Measurement (/G5)
Delta Computation
Added Frequency Measurement (/FQ)
Voltage input terminalsCurrent input terminalsUSB communication interfaceExternal trigger Signal, External clock input Connector
External Current Sensor Input Terminals (/EX option)GP-IB communication Interface (/C1 option)Ethernet Port (100BASE-TX)VGA Output (/V1 option)
Optional feature
1
2
3
4
5
6
7
8
Standard feature
1
2
5
46
8
7
3
ACCESSORIES
7
AC/DC Current Sensor Clamp on Probe
Adapters and Cables
Typical Voltage/Current Connections
• DC to 800 kHz/60 Apk, DC to 500 kHz/200 Apk, DC to 300 kHz/1000 Apk, DC to 40 kHz/2000 Arms
• Wide dynamic range: 0 to ±2000 A (DC)/3000 A peak (AC)
• Wide measurement frequency range: DC and up to 800 kHz
• High-precision fundamental accuracy: ±(0.05% of reading + 30 µA)
• ±15 V DC power supply, connector, and load resistor required.
For detailed information, see Current Sensors & Accessories Brochure Bulletin CT1000-00E.
CT60/CT200/CT1000/CT2000ACurrent Sensors
CurrentOutput
Two leads in a set. Use 758917 in combination with 758922 or 758929.Total length: 75 cmRating: 1000 V, 32 A
758917Measurement leads
For connection to measurement leads (758917). Two in a set.Rating: 300 V
758922Small alligator adapters
For connection to measurement leads (758917). Two in a set.Rating: 1000 V
758929Large alligator adapters
(spring-hold type) Two adapters in a set.
758923*1
Safety terminal adapter setScrew-fastened adapters. Two adapters in a set. 1.5 mm Allen wrench included for tightening.
758931*1
Safety terminal adapter setTwo adapters (red and black) to a set. Used when attaching banana plug to binding post.
758921Fork terminal adapter
For conversion between male BNC and female banana plug
758924Conversion adapter
(BNC-BNC 1 m/2 m)For connection to simultaneously measurement with 2 units, or for input external trigger signal.
366924/25*2
BNC cableFor connection the external input of the WT500 to current sensor.Length: 50 cm
B9284LK*3
External Sensor Cable
Due to the nature of this product, it is possible to touch its metal parts. Therefore, there is a risk of electric shock, so the product must be used with caution.
*1 Maximum diameters of cables that can be connected to the adapters758923 core diameter: 2.5 mm or less; sheath diameter: 4.8 mm or less758931 core diameter: 1.8 mm or less; sheath diameter: 3.9 mm or less
*2 Use with a low-voltage circuit (42 V or less)*3 The coax cable is simply cut on the current sensor side. Preparation by the user is required.
Measurement using current sensor
Current measurement using direct input terminal
Measurement using voltage input terminal
Power meter’svoltageinput terminal
Power meter’scurrentinput terminals
Connector(B8200JQ)
Four load resistors*(B8200JR)
connected inparallel
DC power supply(±15 V, 1 A)
CT1000
Unit whose voltage is to be measured
Power meter’s currentinput terminal
*A burden resistor is required for the CT1000, CT200, and CT60.
Measurement using clamp-on probePower meter’s current direct input terminal
Current output type
Connection example
758921
758917
758923
758931
758922
758929
758921
758923
758931
758917751552 758921
Unit whose currentis to be measured
• Measurement frequency range: 30 Hz to 5 kHz• Basic accuracy: ±0.3% of reading• Maximum allowed input: AC 1000 Arms, max. 1400 Apk (AC)• Current output type: 1 mA/A
A separately sold fork terminal adapter set (758921), measurement leads (758917), etc. are required for connection to WT series. For detailed information, see Power Meter Accessory Brochure Bulletin CT1000-00E.
751552Current Clamp on ProbeAC 1000 Arms (1400 Apeak)
CurrentOutput
758917
758921
Unit whose currentis to be measured
Unit whose currentis to be measured
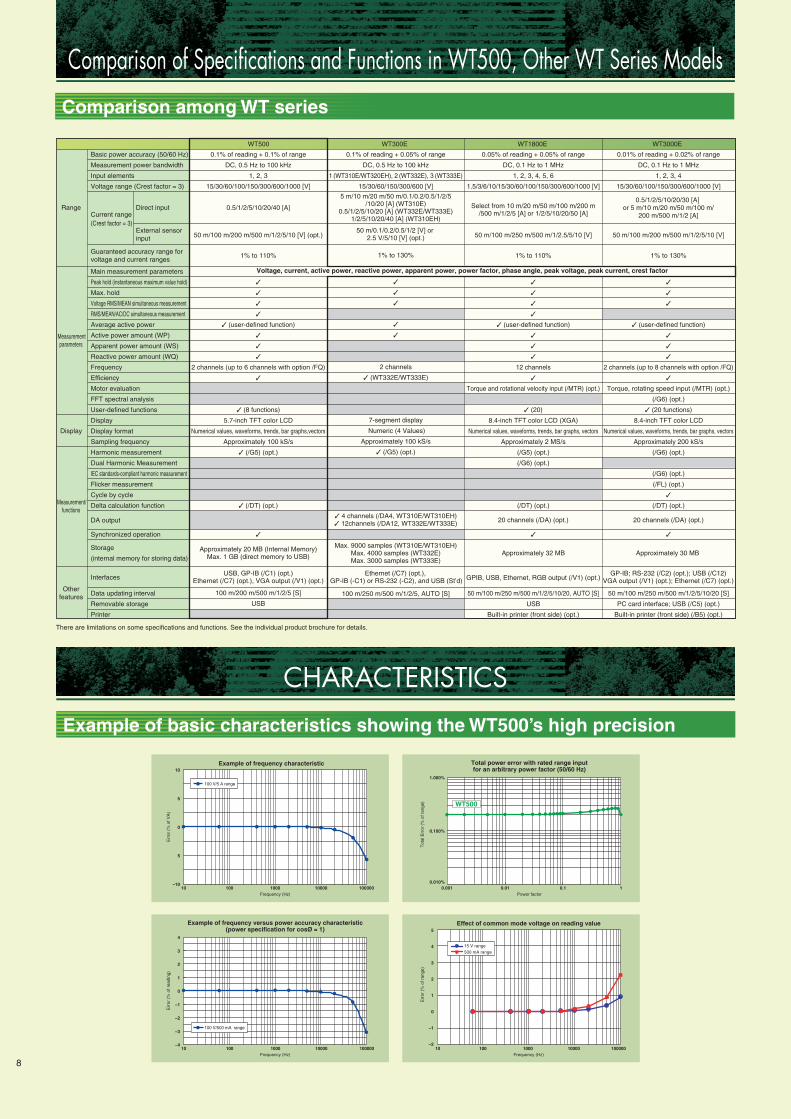
Comparison of Specifications and Functions in WT500, Other WT Series Models
CHARACTERISTICS
Comparison among WT series
Example of basic characteristics showing the WT500’s high precision
8
Voltage, current, active power, reactive power, apparent power, power factor, phase angle, peak voltage, peak current, crest factor
Select from 10 m/20 m/50 m/100 m/200 m/500 m/1/2/5 [A] or 1/2/5/10/20/50 [A]
0.5/1/2/5/10/20/30 [A] or 5 m/10 m/20 m/50 m/100 m/
200 m/500 m/1/2 [A]
–10
5
0
5
10
10 100 1000 10000 100000Frequency (Hz)
Err
or (
% o
f VA
)
–4
–3
–2
–1
0
1
2
3
4
10 100 1000 10000 100000 10 100 1000 10000 100000Frequency (Hz)
Err
or (
% o
f rea
ding
)
Example of frequency characteristic
Example of frequency versus power accuracy characteristic(power specification for cosØ = 1)
Effect of common mode voltage on reading value5
4
3
2
1
0
–1
–2
Frequency (Hz)
Err
or (
% o
f ran
ge)
15 V range500 mA range
Total power error with rated range inputfor an arbitrary power factor (50/60 Hz)
0.010%
0.100%
1.000%
0.001 0.01 0.1 1Power factor
Tot
al E
rror
(%
of r
ange
) WT500
Ethernet (/C7) (opt.), GP-IB (-C1) or RS-232 (-C2), and USB (St’d)
0.1% of reading + 0.1% of range
DC, 0.5 Hz to 100 kHz
1, 2, 3
15/30/60/100/150/300/600/1000 [V]
0.5/1/2/5/10/20/40 [A]
50 m/100 m/200 m/500 m/1/2/5/10 [V] (opt.)
1% to 110%
(user-defined function)
2 channels (up to 6 channels with option /FQ)
(8 functions)
5.7-inch TFT color LCD
Numerical values, waveforms, trends, bar graphs,vectors
Approximately 100 kS/s
(/G5) (opt.)
(/DT) (opt.)
100 m/200 m/500 m/1/2/5 [S]
USB
0.1% of reading + 0.05% of range
DC, 0.5 Hz to 100 kHz
1 (WT310E/WT320EH), 2 (WT332E), 3 (WT333E)
15/30/60/150/300/600 [V]
5 m/10 m/20 m/50 m/0.1/0.2/0.5/1/2/5/10/20 [A] (WT310E)
0.5/1/2/5/10/20 [A] (WT332E/WT333E)1/2/5/10/20/40 [A] (WT310EH)
50 m/0.1/0.2/0.5/1/2 [V] or 2.5 V/5/10 [V] (opt.)
1% to 130%
2 channels
(WT332E/WT333E)
7-segment display
Numeric (4 Values)
Approximately 100 kS/s
(/G5) (opt.)
4 channels (/DA4, WT310E/WT310EH) 12channels (/DA12, WT332E/WT333E)
Max. 9000 samples (WT310E/WT310EH)Max. 4000 samples (WT332E)Max. 3000 samples (WT333E)
100 m/250 m/500 m/1/2/5, AUTO [S]
0.01% of reading + 0.02% of range
DC, 0.1 Hz to 1 MHz
1, 2, 3, 4
15/30/60/100/150/300/600/1000 [V]
50 m/100 m/200 m/500 m/1/2/5/10 [V]
1% to 130%
(user-defined function)
2 channels (up to 8 channels with option /FQ)
Torque, rotating speed input (/MTR) (opt.)
(/G6) (opt.)
(20 functions)
8.4-inch TFT color LCD
Numerical values, waveforms, trends, bar graphs, vectors
Approximately 200 kS/s
(/G6) (opt.)
(/G6) (opt.)
(/FL) (opt.)
(/DT) (opt.)
20 channels (/DA) (opt.)
Approximately 30 MB
50 m/100 m/250 m/500 m/1/2/5/10/20 [S]
PC card interface; USB (/C5) (opt.)
Built-in printer (front side) (/B5) (opt.)
0.05% of reading + 0.05% of range
DC, 0.1 Hz to 1 MHz
1, 2, 3, 4, 5, 6
1.5/3/6/10/15/30/60/100/150/300/600/1000 [V]
50 m/100 m/250 m/500 m/1/2.5/5/10 [V]
1% to 110%
(user-defined function)
12 channels
Torque and rotational velocity input (/MTR) (opt.)
(20)
8.4-inch TFT color LCD (XGA)
Numerical values, waveforms, trends, bar graphs, vectors
Approximately 2 MS/s
(/G5) (opt.)
(/G6) (opt.)
(/DT) (opt.)
20 channels (/DA) (opt.)
Approximately 32 MB
GPIB, USB, Ethernet, RGB output (/V1) (opt.)
50 m/100 m/250 m/500 m/1/2/5/10/20, AUTO [S]
USB
Built-in printer (front side) (opt.)
Basic power accuracy (50/60 Hz)
Measurement power bandwidth
Input elements
Voltage range (Crest factor = 3)
Current range(Crest factor = 3)
Guaranteed accuracy range for voltage and current ranges
Main measurement parameters
Peak hold (instantaneous maximum value hold)
Max. hold
Voltage RMS/MEAN simultaneous measurement
RMS/MEAN/AC/DC simultaneous measurement
Average active power
Active power amount (WP)
Apparent power amount (WS)
Reactive power amount (WQ)
Frequency
Efficiency
Motor evaluation
FFT spectral analysis
User-defined functions
Display
Display format
Sampling frequency
Harmonic measurement
Dual Harmonic Measurement
IEC standards-compliant harmonic measurement
Flicker measurement
Cycle by cycle
Delta calculation function
DA output
Synchronized operation
Storage
(internal memory for storing data)
Interfaces
Data updating interval
Removable storage
Printer
Range
Measurementparameters
Display
Measurement/functions
Otherfeatures
WT500 WT3000EWT1800EWT300E
Direct input
External sensorinput
There are limitations on some specifications and functions. See the individual product brochure for details.
Approximately 20 MB (Internal Memory)Max. 1 GB (direct memory to USB)
USB, GP-IB (/C1) (opt.)Ethernet (/C7) (opt.), VGA output (/V1) (opt.)
GP-IB; RS-232 (/C2) (opt.); USB (/C12)VGA output (/V1) (opt.); Ethernet (/C7) (opt.)
100 V/5 A range
100 V/500 mA range
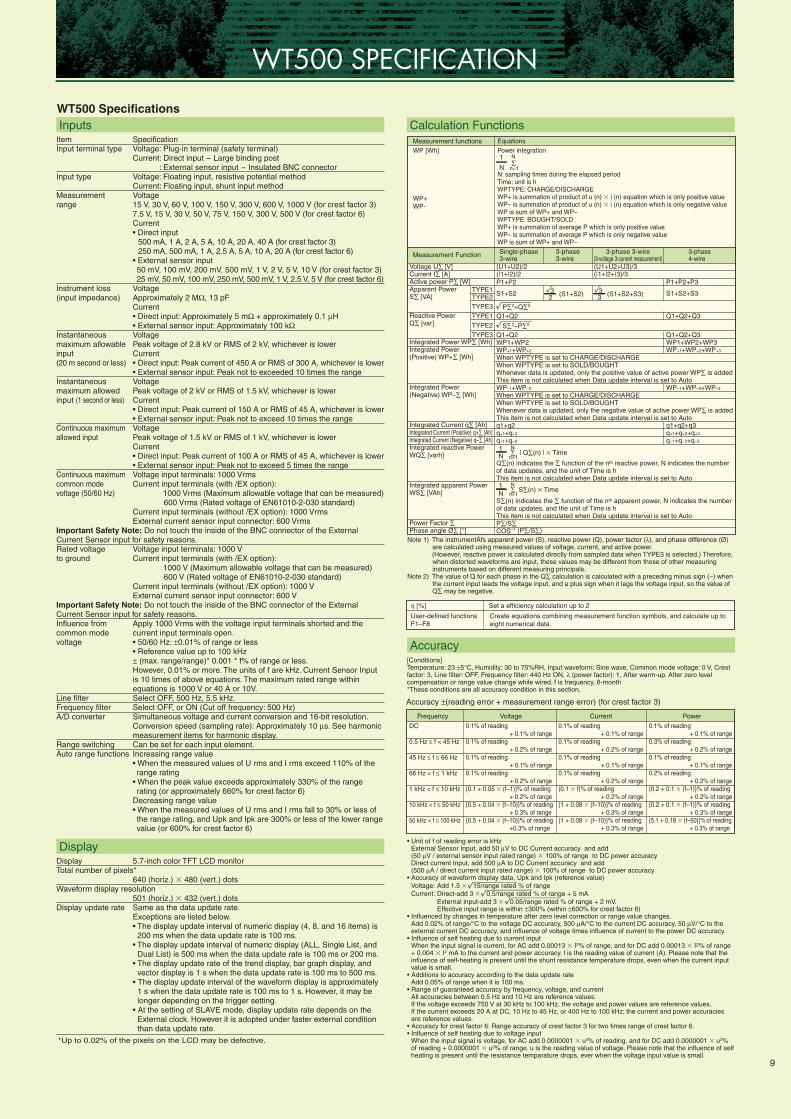
WT500 SPECIFICATION
WT500 SpecificationsInputs
SpecificationVoltage: Plug-in terminal (safety terminal)Current: Direct input - Large binding post : External sensor input - Insulated BNC connectorVoltage: Floating input, resistive potential methodCurrent: Floating input, shunt input methodVoltage15 V, 30 V, 60 V, 100 V, 150 V, 300 V, 600 V, 1000 V (for crest factor 3)7.5 V, 15 V, 30 V, 50 V, 75 V, 150 V, 300 V, 500 V (for crest factor 6)Current• Direct input
500 mA, 1 A, 2 A, 5 A, 10 A, 20 A, 40 A (for crest factor 3)250 mA, 500 mA, 1 A, 2.5 A, 5 A, 10 A, 20 A (for crest factor 6)
• External sensor input50 mV, 100 mV, 200 mV, 500 mV, 1 V, 2 V, 5 V, 10 V (for crest factor 3)25 mV, 50 mV, 100 mV, 250 mV, 500 mV, 1 V, 2.5 V, 5 V (for crest factor 6)
VoltageApproximately 2 MΩ, 13 pFCurrent• Direct input: Approximately 5 mΩ + approximately 0.1 µH• External sensor input: Approximately 100 kΩVoltagePeak voltage of 2.8 kV or RMS of 2 kV, whichever is lowerCurrent• Direct input: Peak current of 450 A or RMS of 300 A, whichever is lower• External sensor input: Peak not to exceeded 10 times the rangeVoltagePeak voltage of 2 kV or RMS of 1.5 kV, whichever is lowerCurrent• Direct input: Peak current of 150 A or RMS of 45 A, whichever is lower• External sensor input: Peak not to exceed 10 times the rangeVoltagePeak voltage of 1.5 kV or RMS of 1 kV, whichever is lowerCurrent• Direct input: Peak current of 100 A or RMS of 45 A, whichever is lower• External sensor input: Peak not to exceed 5 times the rangeVoltage input terminals: 1000 VrmsCurrent input terminals (with /EX option): 1000 Vrms (Maximum allowable voltage that can be measured) 600 Vrms (Rated voltage of EN61010-2-030 standard)Current input terminals (without /EX option): 1000 VrmsExternal current sensor input connector: 600 Vrms
Voltage input terminals: 1000 VCurrent input terminals (with /EX option): 1000 V (Maximum allowable voltage that can be measured) 600 V (Rated voltage of EN61010-2-030 standard)Current input terminals (without /EX option): 1000 VExternal current sensor input connector: 600 V
Apply 1000 Vrms with the voltage input terminals shorted and the current input terminals open.• 50/60 Hz: ±0.01% of range or less• Reference value up to 100 kHz± (max. range/range)* 0.001 * f% of range or less.However, 0.01% or more. The units of f are kHz. Current Sensor Input is 10 times of above equations. The maximum rated range within equations is 1000 V or 40 A or 10V.Select OFF, 500 Hz, 5.5 kHz.Select OFF, or ON (Cut off frequency: 500 Hz)Simultaneous voltage and current conversion and 16-bit resolution.Conversion speed (sampling rate): Approximately 10 µs. See harmonic measurement items for harmonic display.Can be set for each input element.Increasing range value• When the measured values of U rms and I rms exceed 110% of the range rating
• When the peak value exceeds approximately 330% of the range rating (or approximately 660% for crest factor 6)
Decreasing range value• When the measured values of U rms and I rms fall to 30% or less of the range rating, and Upk and Ipk are 300% or less of the lower range value (or 600% for crest factor 6)
Calculation FunctionsEquationsPower integration
N: sampling times during the elapsed periodTime: unit is hWPTYPE: CHARGE/DISCHARGEWP+ is summation of product of u (n) i (n) equation which is only positive valueWP– is summation of product of u (n) i (n) equation which is only negative valueWP is sum of WP+ and WP–WPTYPE: BOUGHT/SOLDWP+ is summation of average P which is only positive valueWP– is summation of average P which is only negative valueWP is sum of WP+ and WP–
Note 1) The instrumentÅfs apparent power (S), reactive power (Q), power factor (λ), and phase difference (Ø) are calculated using measured values of voltage, current, and active power.(However, reactive power is calculated directly from sampled data when TYPE3 is selected.) Therefore, when distorted waveforms are input, these values may be different from those of other measuring instruments based on different measuring principals.
Note 2) The value of Q for each phase in the Q∑ calculation is calculated with a preceding minus sign (–) when the current input leads the voltage input, and a plus sign when it lags the voltage input, so the value of Q∑ may be negative.
Accuracy[Conditions] Temperature: 23 ±5°C, Humidity: 30 to 75%RH, Input waveform: Sine wave, Common mode voltage: 0 V, Crest factor: 3, Line filter: OFF, Frequency filter: 440 Hz ON, λ (power factor): 1, After warm-up. After zero level compensation or range value change while wired. f is frequency, 6-month*These conditions are all accuracy condition in this section.
• Unit of f of reading error is kHzExternal Sensor Input, add 50 µV to DC Current accuracy and add(50 µV / external sensor input rated range) 100% of range to DC power accuracyDirect current Input, add 500 µA to DC Current accuracy and add(500 µA / direct current input rated range) 100% of range to DC power accuracy
• Accuracy of waveform display data, Upk and Ipk (reference value)Voltage: Add 1.5 15/range rated % of rangeCurrent: Direct-add 3 0.5/range rated % of range + 5 mA
External input-add 3 0.05/range rated % of range + 2 mV.Effective input range is within ±300% (within ±600% for crest factor 6)
• Influenced by changes in temperature after zero level correction or range value changes.Add 0.02% of range/°C to the voltage DC accuracy, 500 µA/°C to the current DC accuracy, 50 µV/°C to the external current DC accuracy, and influence of voltage times influence of current to the power DC accuracy.
• Influence of self heating due to current inputWhen the input signal is current, for AC add 0.00013 I2% of range, and for DC add 0.00013 I2% of range + 0.004 I2 mA to the current and power accuracy. I is the reading value of current (A). Please note that the influence of self-heating is present until the shunt resistance temperature drops, even when the current input value is small.
• Additions to accuracy according to the data update rateAdd 0.05% of range when it is 100 ms.
• Range of guaranteed accuracy by frequency, voltage, and currentAll accuracies between 0.5 Hz and 10 Hz are reference values.If the voltage exceeds 750 V at 30 kHz to 100 kHz, the voltage and power values are reference values.If the current exceeds 20 A at DC, 10 Hz to 45 Hz, or 400 Hz to 100 kHz; the current and power accuracies are reference values.
• Accuracy for crest factor 6: Range accuracy of crest factor 3 for two times range of crest factor 6.• Influence of self heating due to voltage input
When the input signal is voltage, for AC add 0.0000001 u2% of reading, and for DC add 0.0000001 u2% of reading + 0.0000001 u2% of range. u is the reading value of voltage. Please note that the influence of self heating is present until the resistance temparature drops, ever when the voltage input value is small.
DC
0.5 Hz ≤ f < 45 Hz
45 Hz ≤ f ≤ 66 Hz
66 Hz < f ≤ 1 kHz
1 kHz < f ≤ 10 kHz
10 kHz < f ≤ 50 kHz
50 kHz < f ≤ 100 kHz
0.1% of reading+ 0.1% of range
0.1% of reading+ 0.2% of range
0.1% of reading+ 0.1% of range
0.1% of reading+ 0.2% of range
0.1 + 0.05 (f–1)% of reading + 0.2% of range
0.5 + 0.04 (f–10)% of reading + 0.3% of range
0.5 + 0.04 (f–10)% of reading +0.3% of range
0.1% of reading+ 0.1% of range
0.1% of reading+ 0.2% of range
0.1% of reading+ 0.1% of range
0.1% of reading+ 0.2% of range
(0.1 f)% of reading + 0.2% of range
1 + 0.08 (f–10)% of reading+ 0.3% of range
1 + 0.08 (f–10)% of reading + 0.3% of range
0.1% of reading + 0.1% of range
0.3% of reading+ 0.2% of range
0.1% of reading+ 0.1% of range
0.2% of reading + 0.2% of range
0.2 + 0.1 (f–1)% of reading + 0.2% of range
0.2 + 0.1 (f–1)% of reading + 0.3% of range
5.1 + 0.18 (f–50)% of reading + 0.3% of range
9
Accuracy ±(reading error + measurement range error) (for crest factor 3)
*Up to 0.02% of the pixels on the LCD may be defective.
Frequency Voltage Current Power
Display5.7-inch color TFT LCD monitor
640 (horiz.) 480 (vert.) dots
501 (horiz.) 432 (vert.) dotsSame as the data update rate.Exceptions are listed below.• The display update interval of numeric display (4, 8, and 16 items) is
200 ms when the data update rate is 100 ms.• The display update interval of numeric display (ALL, Single List, and
Dual List) is 500 ms when the data update rate is 100 ms or 200 ms.• The display update rate of the trend display, bar graph display, and
vector display is 1 s when the data update rate is 100 ms to 500 ms.• The display update interval of the waveform display is approximately
1 s when the data update rate is 100 ms to 1 s. However, it may be longer depending on the trigger setting.
• At the setting of SLAVE mode, display update rate depends on the External clock. However it is adopted under faster external condition than data update rate.
η [%]
User-defined functionsF1–F8
Create equations combining measurement function symbols, and calculate up to eight numerical data.
Set a efficiency calculation up to 2
ItemInput terminal type
Input type
Measurementrange
Instrument loss (input impedance)
Instantaneous maximum allowable input (20 m second or less)
Instantaneous maximum allowed input (1 second or less)
Continuous maximum allowed input
Continuous maximumcommon mode voltage (50/60 Hz)
Important Safety Note: Do not touch the inside of the BNC connector of the External Current Sensor input for safety reasons.Rated voltage to ground
Important Safety Note: Do not touch the inside of the BNC connector of the External Current Sensor input for safety reasons.Influence from common mode voltage
Line filterFrequency filterA/D converter
Range switchingAuto range functions
DisplayTotal number of pixels*
Waveform display resolution
Display update rate
N
1ΣN
n=1
32 (S1+S2)
Measurement functionsWP [Wh]
WP+WP-
3-phase3-wire
3-phase 3-wire(3-voltage 3-current measurement)
3-phase4-wire
Single-phase3-wire
P1+P2+P3
S1+S2+S3
Q1+Q2+Q3
Q1+Q2+Q3WP1+WP2+WP3WP+1+WP+2+WP+3
WP–1+WP–2+WP–3
q1+q2+q3q+1+q+2+q+3
q–1+q–2+q–3
(U1+U2+U3)/3(|1+|2+|3)/3
Voltage U∑ [V]Current I∑ [A]Active power P∑ [W]Apparent Power S∑ [VA]
Reactive Power Q∑ [var]
Integrated Power WP∑ [Wh]Integrated Power (Positive) WP+∑ [Wh]
Integrated Power (Negative) WP–∑ [Wh]
Integrated Current q∑ [Ah]Integrated Current (Positive) q+∑ [Ah]Integrated Current (Negative) q–∑ [Ah]Integrated reactive Power WQ∑ [varh]
Integrated apparent PowerWS∑ [VAh]
Power Factor ∑Phase angle Ø∑ [°]
TYPE1TYPE2TYPE3TYPE1TYPE2TYPE3
(U1+U2)/2(|1+|2)/2P1+P2
S1+S2
Q1+Q2
Q1+Q2WP1+WP2WP+1+WP+2
When WPTYPE is set to CHARGE/DISCHARGEWhen WPTYPE is set to SOLD/BOUGHTWhenever data is updated, only the positive value of active power WP∑ is addedThis item is not calculated when Data update interval is set to AutoWP–1+WP–2
When WPTYPE is set to CHARGE/DISCHARGEWhen WPTYPE is set to SOLD/BOUGHTWhenever data is updated, only the negative value of active power WP∑ is addedThis item is not calculated when Data update interval is set to Autoq1+q2q+1+q+2
q–1+q–2
Q∑(n) indicates the ∑ function of the nth reactive power, N indicates the number of data updates, and the unit of Time is hThis item is not calculated when Data update interval is set to Auto
S∑(n) indicates the ∑ function of the nth apparent power, N indicates the number of data updates, and the unit of Time is hThis item is not calculated when Data update interval is set to AutoP∑/S∑COS–1 (P∑/S∑)
Measurement Function
33 (S1+S2+S3)
P∑2+Q∑2
S∑2–P∑2
N1 ∑
N
n=1 | Q∑(n) | × Time
N1 ∑
N
n=1S∑(n) × Time

WT500 SPECIFICATION
Total power error withrespect to the range foran arbitrary powerfactor λ (exclude λ = 1)
Influence of line filter
Lead/Lag Detection (d(LEAD) /G (LAG) of thephase angle andsymbols for the reactivepower Q∑ calculation) *The s symbol shows the lead/lag of each element, and “–” indicates leading.
Temperature coefficient
Effective input range
Max. display
Min. display
Measurement lowerlimit frequency
Accuracy of apparentpower SAccuracy ofreactive power QAccuracy of power factor λ
Accuracy of phasedifference Ø
One-year accuracy
—
When cutoff frequency is 500 Hz“45 to 66 Hz: Add 0.2% of readingUnder 45 Hz: Add 0.5% of reading”When cutoff frequency is 5.5 kHz“66 Hz or less: Add 0.2% of reading66 to 500 Hz: Add 0.5% of reading”
When λ = 0Apparent power reading 0.2% in the 45 to 66 Hz rangeAll other frequencies are as follows(however, these are only reference values):Apparent power reading (0.2 + 0.2 f (kHz))%0 < λ < 1(Power reading) [(Power reading Error (%)) + (power range error (%) (Power range/Apparent power reading) + power reading tanØ (influence when λ = 0%)] Ø is the phase difference of voltage and current When cutoff frequency is 500 Hz“45 to 66 Hz: Add 0.3% of readingUnder 45 Hz: Add 1% of reading”When cutoff frequency is 5.5 kHz“66 Hz or less: Add 0.4% of reading66 to 500 Hz: Add 1.2% of reading”
The phase lead and lag are detected correctly when the voltage and current signals are both sine waves, the lead/lag is 50% of the range rating (or 100% for crest factor 6), the frequency is between 20 Hz and 2 kHz, and the phase angle is ±(5° to 175°) or more.
± 0.03% of reading/°C at 5 to 18° or 28 to 40 °C.Udc and Idc are 0 to ±110% of the measurement rangeUrms and Irms are 1 to 110%* of the measurement range (or 2% to 220% for crest factor 6)Umn and Imn are 10 to ±110% of the measurement rangeUrmn and Irmn are 10 to ±110%* of the measurement rangePower is 0 to ±110%* for DC measurement, 1 to 110%* of the voltage and current range for AC measurement, and up to ±110%* of the power range.However, the synchronization source level falls below the input signal of frequency measurement.110% of the voltage range rating.140% of the voltage and current range ratingUrms, Irms, Uac and Iac are up to 0.5% relative to the measurement range (or up to 1% for a crest factor of 6).Umn, Urmn, Imn, and Irmn are up to 2% (or 4% for a crest factor of 6).Below that, zero suppress. Current integration value q also depends on the current value.
Voltage accuracy + current accuracy
Accuracy of apparent power+ ( (1.0004 – λ2) – (1 – λ2) ) 100% of range±[ (λ – λ/1.0002) + |cosØ – cos Ø + sin-1 (influence of power factor of power when λ = 0%/100) | ] ±1digit when voltage and current is at rated input of the measurement range. Ø is the phase difference of voltage and current.±[ |Ø – cos-1 (λ/1.0002) | + sin-1 (influence of power factor of power when λ = 0%) /100 ] deg ±1digit when voltage and current is at rated input of the measurement rangeAdd the accuracy of reading error (Six-month) 0.5 to the accuracy six-month
Voltage/current Power
Data update rateMeasurement lowerlimit frequency
100 ms 200 ms 500 ms 1 s 2 s 5 s
25 Hz 12.5 Hz 5 Hz 2.5 Hz 1.25 Hz 0.5 Hz
Store function
10
Internal memory size Approximately 20 MBStore interval (waveform OFF) Maximum 100 ms to 99 hour 59 minutes 59 seconds.Guideline for Storage Time (Waveform Display OFF, Integration Function OFF)
Number ofmeasurement
channels1 ch1 ch3 ch3 ch
Measured Items(Per CH)
3101020
Storage Interval
100 ms1 s
100 ms1 s
Storable Amnt. of Data
Approx. 40 hrApprox. 120 hrApprox. 4 hrApprox. 20 hr
Note: Depending on the user-defined math, integration, and other settings, the actual measurement time may be shorter than stated above.Store interval to memory depends on number of stored data and kind og the media
Functions
Integration
Added Frequency Measurement (/FQ Optional)Select up to two frequencies of the voltage or current input tothe input elements for measurement. If the frequency option (/FQ) is installed, the frequencies of the voltages and currentsbeing input to all input elements can be measured.Reciprocal method
Display
60000Select 4, 8, 16 matrix, all, single list, or dual list.
501Peak-peak compressed dataRange from 1 ms to 500 ms/div. However, it must be 1/10th of the data update rate.Approximately 100 ks/s
Edge typeSelect Auto or Normal. Triggers are turned OFF automaticallyduring integration.Select voltage, current, or external clock for the input to eachinput element.Select (Rising), (Falling), or (Rising/Falling).When the trigger source is the voltage or current input to the input elements. Set in the range from the center of the screen to ±100% (top/bottom edge of the screen). Setting resolution: 0.1%When the trigger source is Ext Clk, TTL level.Voltage and current input to the waveform vertical axis zoominput element can be zoomed along the vertical axis.Set in the range of 0.1 to 100 times.ON/OFF can be set for each voltage and current input to the input element.You can select 1, 2, 3 or 4 splits for the waveform display.Select dot or linear interpolation.Select graticule or cross-grid display.Upper/lower limit (scale value), and waveform label ON/OFF.When you place the cursor on the waveform, the value of thatpoint is measured.No time axis zoom function
Vector display of the phase difference in the fundamental waves of voltage and current.Displays the size of each harmonic in a bar graph.
Displays trends (transitions) in numerical data of themeasurement functions in a sequential line graph.Not available
Digital multiplication method3 or 6 (when inputting rated values of the measurementrange), and 300 relative to the minimum valid input.Interval for determining the measurement function andperforming calculations.Period used to determine and compute the measurementfunction.• The measurement period is set by the zero crossing of the
reference signal (synchronization source) (excluding watt hour WP as well as ampere hour q during DC mode).
• For harmonic measurement (/G5 option), the measurement period is from the beginning of the data update interval to 1024 points at the harmonic sampling frequency.
You can select one of the following five wiring settings.1P2W (single phase, two-wire), 1P3W (single phase, 3 wire),3P3W (3 phase, 3 wire), 3P4W (3 phase, 4 wire),3P3W (3V3A) (3 phase, 3 wire, 3 volt/3 amp measurement).However, the number of available wiring settings variesdepending on the number of installed input elements. Up tofour, or only one, two, or three wiring settings may beavailable.When inputting output from external current sensors, VT, orCT, set the current sensor conversion ratio, VT ratio, CT ratio,and power coefficient in the range from 0.0001 to 99999.9999.Line filter or frequency filter settings can be entered.• The average calculations below are performed on the
normal measurement parameters of voltage U, current I, power P, apparent power S, reactive power Q. Power factor λ and phase angle Ø are determined by calculating the average of P and S.Select exponential or moving averaging.
• Exponential averageSelect an attenuation constant of 2, 4, 8, 16, 32, or 64.
• Moving averageSelect the number of averages from 8, 16, 32, or 64.
• The average calculations below are performed on the harmonic display items of voltage U, current I, power P, apparent power S, reactive power Q. Power factor λ is determined by calculating the average of P and Q.
Only exponential averaging is performed. Select an attenuation constant of 2, 4, 8, 16, 32 or 64Select 100 ms, 200 ms, 500 ms, 1 s, 2 s, or 5 s.At maximum, two times the data update rate (only duringnumerical display)
Holds the data display.Executes a single measurement during measurement hold.Compensates the zero level. the range: ±10% of range
StorageSettings, waveform display data, numerical data, and screenimage data can be saved to media*.Saved settings can be loaded from a media*.
*USB memory
Select a mode of Manual, Standard, Continuous (repeat),Real Time Control Standard, or Real Time Control Continuous (Repeat).Integration can be stopped automatically using the integrationtimer setting. 0000 h 00 m 00 s to 10000 h 00 m 00 sIf the count over integration time reaches the maximumintegration time (10000 hours), or if the integration valuereaches max./min. display integration value (±999999 MWh or ±999999 Mah), the elapsed time and value is saved and the operation is stopped.Power: ±(power accuracy + 0.02% of WS)Current: ±(current accuracy + 0.02 elapsed time (h) % of
range) (when select dc)±(current accuracy + 0.02% of reading) (when selected others)It does not sample for approximately 70 µs at each data update. The period is compensated.
±0.02% of reading
Mode
Timer
Count over
Accuracy
Time accuracy
Device under measurement
Measurement method
Numerical display functionDisplay resolutionNumber of display itemsWaveform display itemsNo. of display rastersDisplay formatTime axis
Sample rateTriggers
Trigger TypeTrigger Mode
Trigger Source
Trigger SlopeTrigger Level
Vertical axis Zoom
ON/OFF
FormatInterpolationGraticuleOther display ON/OFFCursor measurements
Zoom function*Since the sampling frequency is approximately 100 kHz, waveforms that can be accurately reproduced are those of about 5 kHz.
Vector Display/Bar Graph Display (/G5 option is required)Vector display
Bar graph displayTrend displayNumber of measurement channels Up to 8 parameters
Simultaneous display
Saving and Loading Data
Measurement methodCrest factor
Measurement period
Wiring
Scaling
Input filterAveraging
Data update rateResponse time
HoldSingleZero level compensation/Null
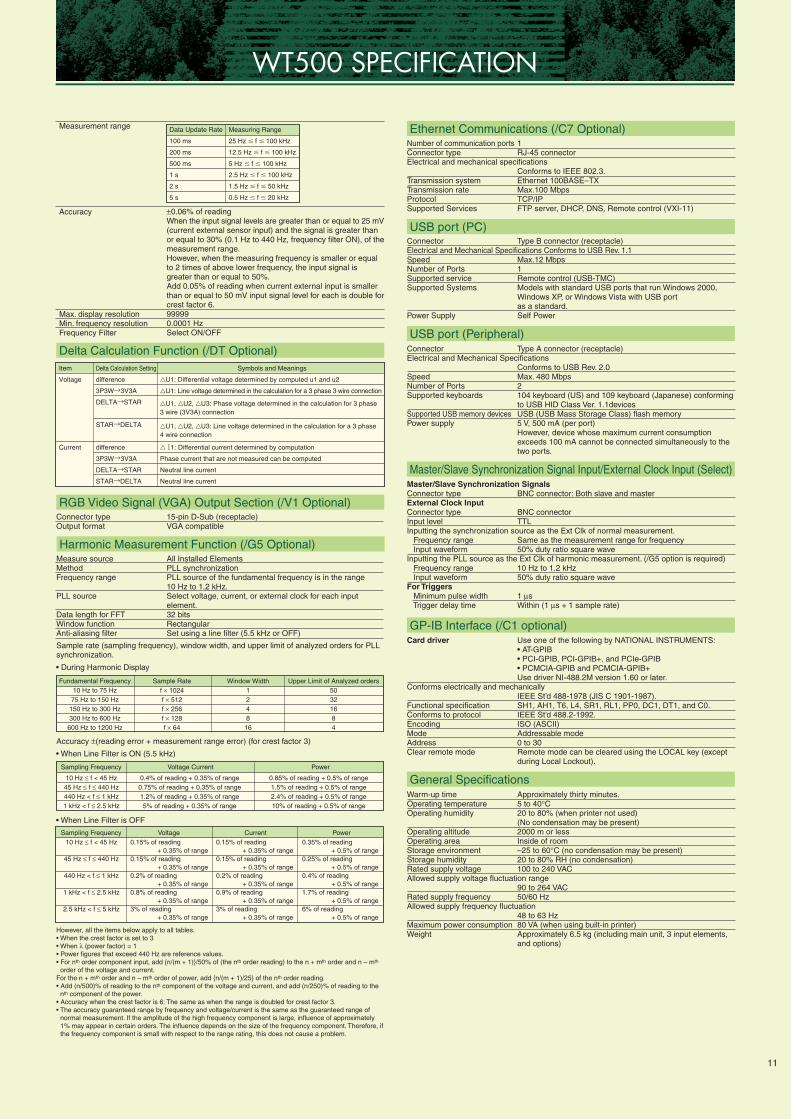
WT500 SPECIFICATION
Data Update Rate Measuring Range
100 ms 25 Hz f 100 kHz
200 ms 12.5 Hz f 100 kHz
500 ms 5 Hz f 100 kHz
1 s 2.5 Hz f 100 kHz
2 s 1.5 Hz f 50 kHz
5 s 0.5 Hz f 20 kHz
±0.06% of readingWhen the input signal levels are greater than or equal to 25 mV (current external sensor input) and the signal is greater than or equal to 30% (0.1 Hz to 440 Hz, frequency filter ON), of the measurement range.However, when the measuring frequency is smaller or equal to 2 times of above lower frequency, the input signal is greater than or equal to 50%.Add 0.05% of reading when current external input is smaller than or equal to 50 mV input signal level for each is double for crest factor 6.999990.0001 HzSelect ON/OFF
Harmonic Measurement Function (/G5 Optional)
• During Harmonic Display
10 Hz ≤ f < 45 Hz45 Hz ≤ f ≤ 440 Hz440 Hz < f ≤ 1 kHz1 kHz < f ≤ 2.5 kHz
0.4% of reading + 0.35% of range0.75% of reading + 0.35% of range1.2% of reading + 0.35% of range5% of reading + 0.35% of range
0.85% of reading + 0.5% of range1.5% of reading + 0.5% of range2.4% of reading + 0.5% of range10% of reading + 0.5% of range
• When Line Filter is ON (5.5 kHz)
10 Hz ≤ f < 45 Hz
45 Hz ≤ f ≤ 440 Hz
440 Hz < f ≤ 1 kHz
1 kHz < f ≤ 2.5 kHz
2.5 kHz < f ≤ 5 kHz
0.15% of reading+ 0.35% of range
0.15% of reading+ 0.35% of range
0.2% of reading+ 0.35% of range
0.8% of reading+ 0.35% of range
3% of reading+ 0.35% of range
0.15% of reading+ 0.35% of range
0.15% of reading+ 0.35% of range
0.2% of reading+ 0.35% of range
0.9% of reading+ 0.35% of range
3% of reading+ 0.35% of range
0.35% of reading + 0.5% of range
0.25% of reading + 0.5% of range
0.4% of reading + 0.5% of range
1.7% of reading + 0.5% of range
6% of reading + 0.5% of range
• When Line Filter is OFF
11
Fundamental Frequency10 Hz to 75 Hz75 Hz to 150 Hz150 Hz to 300 Hz300 Hz to 600 Hz600 Hz to 1200 Hz
Sample Ratef × 1024f × 512f × 256f × 128f × 64
Window Width124816
Upper Limit of Analyzed orders50321684
Sampling Frequency Voltage Current Power
Sampling Frequency Voltage Current Power
However, all the items below apply to all tables. • When the crest factor is set to 3• When λ (power factor) = 1• Power figures that exceed 440 Hz are reference values. • For nth order component input, add n/(m + 1)/50% of (the nth order reading) to the n + mth order and n – mth
order of the voltage and current. For the n + mth order and n – mth order of power, add n/(m + 1)/25 of the nth order reading. • Add (n/500)% of reading to the nth component of the voltage and current, and add (n/250)% of reading to the
nth component of the power. • Accuracy when the crest factor is 6: The same as when the range is doubled for crest factor 3.• The accuracy guaranteed range by frequency and voltage/current is the same as the guaranteed range of
normal measurement. If the amplitude of the high frequency component is large, influence of approximately 1% may appear in certain orders. The influence depends on the size of the frequency component. Therefore, if the frequency component is small with respect to the range rating, this does not cause a problem.
Delta Calculation Function (/DT Optional)
RGB Video Signal (VGA) Output Section (/V1 Optional)15-pin D-Sub (receptacle)VGA compatible
Ethernet Communications (/C7 Optional)1RJ-45 connector
Conforms to IEEE 802.3.Ethernet 100BASE–TXMax.100 MbpsTCP/IPFTP server, DHCP, DNS, Remote control (VXI-11)
USB port (PC)Type B connector (receptacle)
Max.12 Mbps1Remote control (USB-TMC)Models with standard USB ports that run Windows 2000, Windows XP, or Windows Vista with USB portas a standard.Self Power
USB port (Peripheral)Type A connector (receptacle)
Conforms to USB Rev. 2.0Max. 480 Mbps2104 keyboard (US) and 109 keyboard (Japanese) conformingto USB HID Class Ver. 1.1devicesUSB (USB Mass Storage Class) flash memory5 V, 500 mA (per port)However, device whose maximum current consumptionexceeds 100 mA cannot be connected simultaneously to thetwo ports.
Master/Slave Synchronization Signal Input/External Clock Input (Select)
BNC connector: Both slave and master
BNC connectorTTL
Same as the measurement range for frequency 50% duty ratio square wave
10 Hz to 1.2 kHz50% duty ratio square wave
1 µsWithin (1 µs + 1 sample rate)
GP-IB Interface (/C1 optional)Use one of the following by NATIONAL INSTRUMENTS:• AT-GPIB• PCI-GPIB, PCI-GPIB+, and PCIe-GPIB• PCMCIA-GPIB and PCMCIA-GPIB+Use driver NI-488.2M version 1.60 or later.
IEEE St’d 488-1978 (JIS C 1901-1987).SH1, AH1, T6, L4, SR1, RL1, PP0, DC1, DT1, and C0.IEEE St’d 488.2-1992.ISO (ASCII)Addressable mode0 to 30Remote mode can be cleared using the LOCAL key (except during Local Lockout).
General SpecificationsApproximately thirty minutes.5 to 40°C20 to 80% (when printer not used)(No condensation may be present)2000 m or lessInside of room–25 to 60°C (no condensation may be present)20 to 80% RH (no condensation)100 to 240 VAC
90 to 264 VAC50/60 Hz
48 to 63 Hz80 VA (when using built-in printer)Approximately 6.5 kg (including main unit, 3 input elements, and options)
All Installed ElementsPLL synchronizationPLL source of the fundamental frequency is in the range 10 Hz to 1.2 kHz.Select voltage, current, or external clock for each input element.32 bitsRectangularSet using a line filter (5.5 kHz or OFF)
Item
Voltage
Current
Delta Calculation Setting
difference
3P3W→3V3A
DELTA→STAR
STAR→DELTA
difference
3P3W→3V3A
DELTA→STAR
STAR→DELTA
Symbols and Meanings
U1: Differential voltage determined by computed u1 and u2
U1: Line voltage determined in the calculation for a 3 phase 3 wire connection
U1, U2, U3: Phase voltage determined in the calculation for 3 phase 3 wire (3V3A) connection
U1, U2, U3: Line voltage determined in the calculation for a 3 phase 4 wire connection
11: Differential current determined by computation
Phase current that are not measured can be computed
Neutral line current
Neutral line current
Sample rate (sampling frequency), window width, and upper limit of analyzed orders for PLL synchronization.
Accuracy ±(reading error + measurement range error) (for crest factor 3)
Measurement range
Accuracy
Max. display resolutionMin. frequency resolutionFrequency Filter
Connector typeOutput format
Number of communication portsConnector typeElectrical and mechanical specifications
Transmission systemTransmission rateProtocolSupported Services
ConnectorElectrical and Mechanical Specifications Conforms to USB Rev. 1.1Speed Number of Ports Supported serviceSupported Systems
Power Supply
ConnectorElectrical and Mechanical Specifications
SpeedNumber of PortsSupported keyboards
Supported USB memory devicesPower supply
Master/Slave Synchronization SignalsConnector typeExternal Clock InputConnector typeInput levelInputting the synchronization source as the Ext Clk of normal measurement. Frequency range Input waveformInputting the PLL source as the Ext Clk of harmonic measurement. (/G5 option is required) Frequency range Input waveformFor Triggers Minimum pulse width Trigger delay time
Card driver
Conforms electrically and mechanically
Functional specificationConforms to protocolEncodingMode AddressClear remote mode
Warm-up timeOperating temperatureOperating humidity
Operating altitudeOperating areaStorage environmentStorage humidityRated supply voltageAllowed supply voltage fluctuation range
Rated supply frequencyAllowed supply frequency fluctuation
Maximum power consumption Weight
Measure sourceMethodFrequency range
PLL source
Data length for FFTWindow functionAnti-aliasing filter
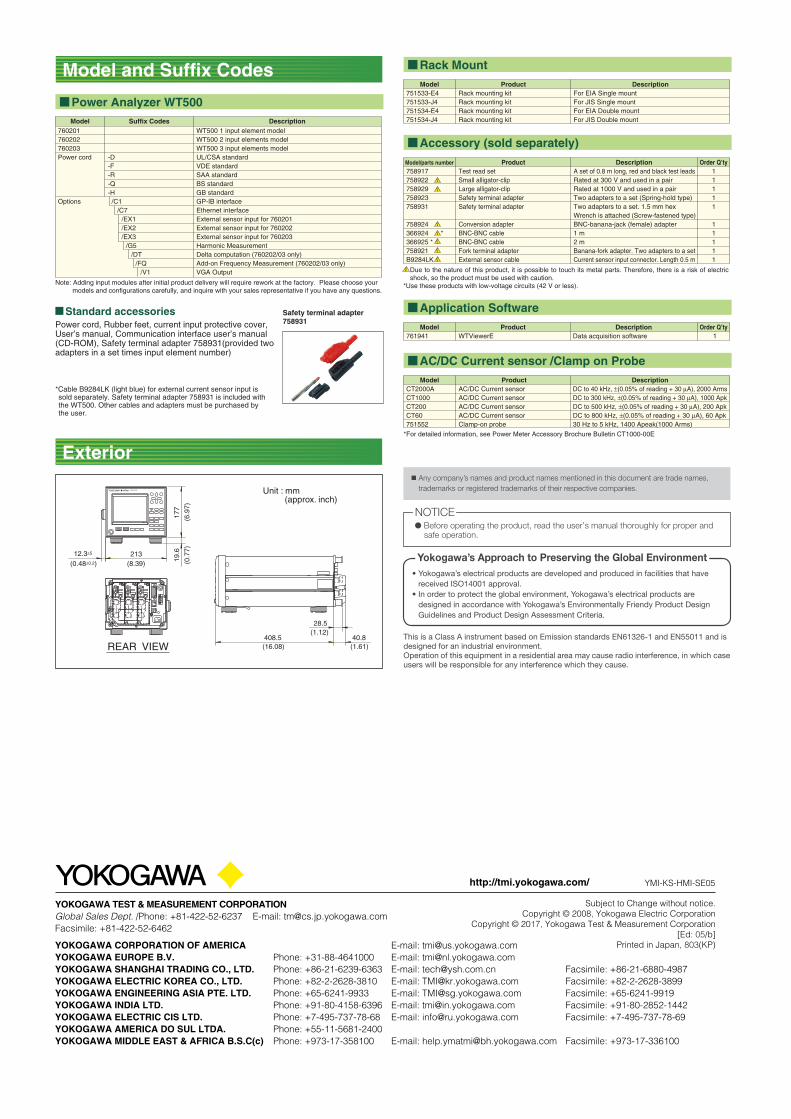
Model and Suffix Codes
Exterior
Accessory (sold separately)
Rack Mount
Due to the nature of this product, it is possible to touch its metal parts. Therefore, there is a risk of electric shock, so the product must be used with caution.
*Use these products with low-voltage circuits (42 V or less).
Model Product Description
Model Product Description
Model/parts number Product Description Order Q’ty
751533-E4751533-J4751534-E4751534-J4
Rack mounting kitRack mounting kitRack mounting kitRack mounting kit
For EIA Single mountFor JIS Single mountFor EIA Double mountFor JIS Double mount
758917758922758929758923758931
758924366924366925 *758921B9284LK
Test read setSmall alligator-clipLarge alligator-clipSafety terminal adapterSafety terminal adapter
Conversion adapterBNC-BNC cableBNC-BNC cableFork terminal adapterExternal sensor cable
A set of 0.8 m long, red and black test leadsRated at 300 V and used in a pairRated at 1000 V and used in a pairTwo adapters to a set (Spring-hold type) Two adapters to a set. 1.5 mm hex Wrench is attached (Screw-fastened type) BNC-banana-jack (female) adapter1 m2 mBanana-fork adapter. Two adapters to a setCurrent sensor input connector. Length 0.5 m
11111
11111
*
CT2000ACT1000CT200CT60751552
AC/DC Current sensorAC/DC Current sensorAC/DC Current sensorAC/DC Current sensorClamp-on probe
DC to 40 kHz, ±(0.05% of reading + 30 µA), 2000 ArmsDC to 300 kHz, ±(0.05% of reading + 30 µA), 1000 ApkDC to 500 kHz, ±(0.05% of reading + 30 µA), 200 ApkDC to 800 kHz, ±(0.05% of reading + 30 µA), 60 Apk30 Hz to 5 kHz, 1400 Apeak(1000 Arms)
AC/DC Current sensor /Clamp on Probe
*For detailed information, see Power Meter Accessory Brochure Bulletin CT1000-00E
Model Product Description761941 WTViewerE Data acquisition software 1
Application SoftwareOrder Q’ty
Power Analyzer WT500
Standard accessoriesPower cord, Rubber feet, current input protective cover, User’s manual, Communication interface user’s manual(CD-ROM), Safety terminal adapter 758931(provided two adapters in a set times input element number)
Safety terminal adapter 758931
Note: Adding input modules after initial product delivery will require rework at the factory. Please choose your models and configurations carefully, and inquire with your sales representative if you have any questions.
Model760201760202760203Power cord
Options
WT500 1 input element modelWT500 2 input elements modelWT500 3 input elements modelUL/CSA standardVDE standardSAA standardBS standardGB standardGP-IB interfaceEthernet interfaceExternal sensor input for 760201External sensor input for 760202External sensor input for 760203Harmonic MeasurementDelta computation (760202/03 only)Add-on Frequency Measurement (760202/03 only)VGA Output
-D-F-R-Q-H/C1
/C7/EX1/EX2/EX3
/G5/DT
/FQ/V1
Suffix Codes Description
*Cable B9284LK (light blue) for external current sensor input issold separately. Safety terminal adapter 758931 is included withthe WT500. Other cables and adapters must be purchased bythe user.
Unit : mm (approx. inch)
REAR VIEW
213
19.6
177
408.5
28.5
40.8(16.08)
(1.12)
(1.61)
(6.9
7)(0
.77)
(8.39)(0.48±0.2)12.3±5