bullying in u.s. schools - olweus bullying prevention ...olweus.sites.clemson.edu/documents/bullying...
TRANSCRIPT
©2015 by Hazelden Betty Ford Foundation. All rights reserved.
Bullying in U.S. Schools 2014 STATUS REPORT
Assessed using data collected from the Olweus Bullying Questionnaire™
Harlan Luxenberg, MA, Professional Data Analysts, Inc.Susan P. Limber, PhD, Clemson UniversityDan Olweus, PhD, Uni Health, University of Bergen, Norway
Published by Hazelden Publishing, 2015
©2015 by Hazelden Betty Ford Foundation. All rights reserved. Duplicating this material for personal or group use is permissible. 1
BULLYING IN U.S. SCHOOLS: 2014 STATUS REPORT
This report updates the 2013 Status Report (Luxenberg, Limber, and Olweus
2014) and reflects the status of bullying around the United States during
the 2013–2014 school year (August 1, 2013, through June 30, 2014). The
researchers and organizations who created the previous report updated
this report, including Harlan Luxenberg, Matt Christenson, and Angie
Ficek at Professional Data Analysts, Inc.; Susan P. Limber, PhD, at Clemson
University; Dan Olweus, PhD, at Uni Health, University of Bergen, Norway;
and the Hazelden Betty Ford Foundation. Using data collected from the
Olweus Bullying Questionnaire (OBQ), a representative sample was created
based on more than 150,000 questionnaires administered to students at
schools that intended to, but had not yet implemented the Olweus Bullying
Prevention Program, an internationally respected anti-bullying program.
The same questionnaire items were asked of all students in grades
three through twelve across the United States. This consistency of questions
across grades and regions provides a rare opportunity to view a snapshot of
bullying behavior in our nation’s schools, based on the reports of children and
youth themselves. A representative sample was used from this dataset to
explore the following bullying topics:
• What percentage of students are bullied and/or bully others?
• What are the ways in which students are most often bullied?
• In how many ways are most students bullied?
• How long does bullying last?
• Where are students bullied?
• How is bullying related to liking school?
• Whom do students tell about being bullied?
• How do students respond to bullying?
• Are students afraid of being bullied?
• How do students and adults respond to bullying?
We hope that this report helps teachers, administrators, parents,
policymakers, and concerned citizens raise national awareness about bullying
and improve school environments so every child can feel safe at school.
Bullying in U.S. Schools:Report Purpose
We hope that this report helps teachers, administrators, parents, policymakers, and concerned citizens raise national awareness about bullying and improve school environments so every child can feel safe at school.
BULLYING IN U.S. SCHOOLS: 2014 STATUS REPORT
©2015 by Hazelden Betty Ford Foundation. All rights reserved. Duplicating this material for personal or group use is permissible. 2
DESPITE A DRAMATIC INCREASE in public awareness and anti-bullying legislation
nationwide, the prevalence of bullying is still one of the most pressing issues
facing our nation’s youth. Bullying affects individuals across ethnicity, gender,
grade, and socioeconomic status, whether they live in urban, suburban, or
rural communities. Bullying can have serious effects during the school years
and into adulthood. One of the best tools that schools have for decreasing the
problems associated with bullying behavior is to implement evidence-based
prevention programs.
One of the most widely researched and highly regarded of these programs is the Olweus Bullying
Prevention Program (OBPP), developed by Dan Olweus, PhD. This unique program uses a comprehensive
schoolwide, systems-change approach that involves teachers, students, parents, and other school and community
personnel in an effort to reduce existing bullying problems and prevent future problems from occurring. The
program has been used in more than a dozen countries by millions of students worldwide, receiving high
accolades in the United States and abroad.1
The Olweus Bullying QuestionnaireAs part of OBPP, school staff administer the Olweus Bullying Questionnaire, or OBQ (Olweus 1996, 2007), typically
at the same time each year, to monitor and measure changes in bullying and antisocial behavior in their schools.
This is an anonymous forty-item questionnaire that students in third through twelfth grades fill out about their
experiences and observations related to bullying. The questionnaire has two main parts that measure a student’s
involvement in nine forms of bullying (as one who has experienced bullying and also as one who has bullied others).
The questionnaire also includes questions about students’ reactions to bullying incidents that they have observed,
self-reports regarding school climate, and observations of others’ reactions to bullying. The questionnaires can be
administered online by using a computer or tablet, by employing an interactive whiteboard in the classroom, or by
filling out a paper booklet.
The OBQ has undergone rigorous psychometric testing through the years to ensure the data collected from it
can be used to accurately understand a school’s or district’s prevalence of bullying and to assess the effectiveness of
OBPP. Multiple studies have demonstrated strong consistency among subgroups of questionnaire items, with alpha
reliability coefficients in the 0.80 to 0.95 range (e.g., Pellegrini 2001; Solberg and Olweus 2003; see Olweus 2013 for
an overview) as well as evidence of construct validity (Kyriakides, Kaloyirou, and Lindsay 2006; Solberg and Olweus
2003) and criterion-related validity (Olweus 2010, 2012; Pellegrini 2001). Collectively, these measures provide
evidence that the results of the questionnaire accurately illustrate the prevalence of bullying in schools.
____________________
1. OBPP is listed as a Promising Program by Blueprints for Healthy Youth Development, and a large, systematic review of anti-bullying programs worldwide concluded that “programs inspired by the work of Dan Olweus worked best” (Ttofi and Farrington 2011, 41–42).
Bullying in U.S. Schools:Report Background
BULLYING IN U.S. SCHOOLS: 2014 STATUS REPORT
©2015 by Hazelden Betty Ford Foundation. All rights reserved. Duplicating this material for personal or group use is permissible. 3
Before students are asked about their bullying experiences, they are provided with a definition of what does
and does not constitute bullying. According to OBPP, an individual is being bullied when he or she is the target
of aggressive behavior by another student or students (for example, when others say mean things, deliberately
and systematically ignore someone, physically hurt others, spread negative rumors, or do other hurtful things),
when a power imbalance exists between the individuals involved, and when the bullying behavior happens more
than once. All three conditions must be present for the actions to constitute bullying behavior. After reading a
clear definition of bullying, students are asked in the OBQ’s question 4, “How often have you been bullied at
school in the past couple of months?” and later in question 24, “How often have you taken part in bullying another
student(s) at school in the past couple of months?”
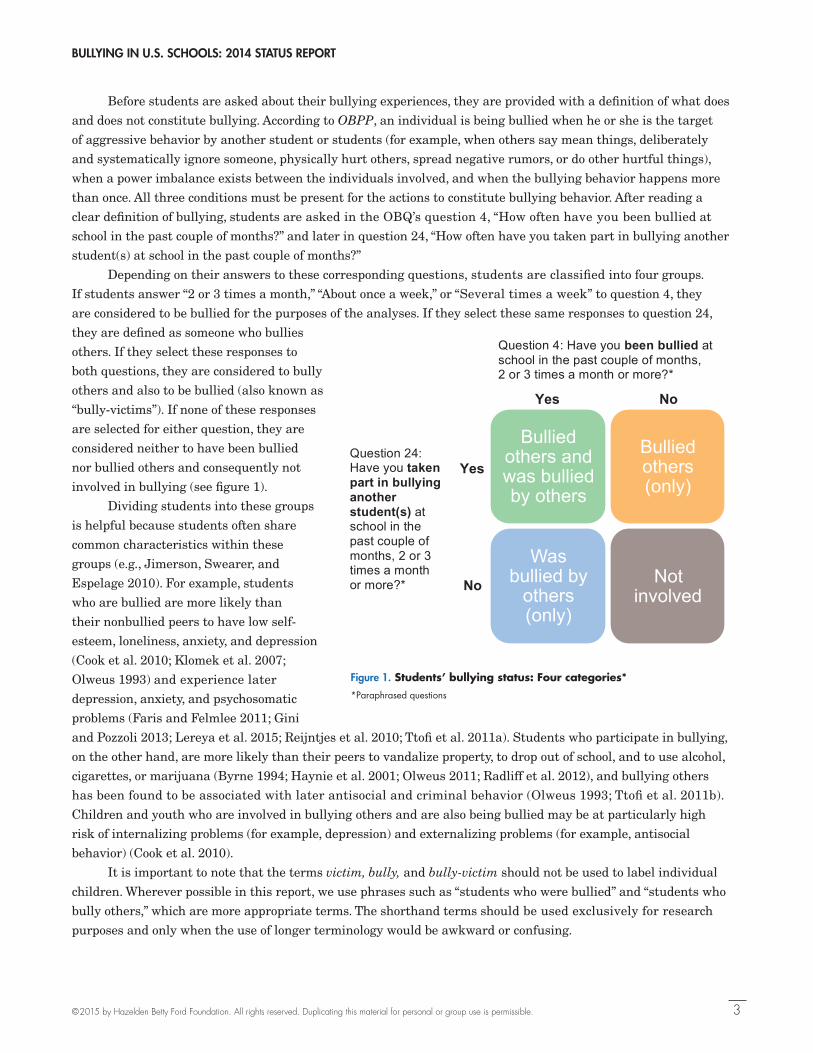
Depending on their answers to these corresponding questions, students are classified into four groups.
If students answer “2 or 3 times a month,” “About once a week,” or “Several times a week” to question 4, they
are considered to be bullied for the purposes of the analyses. If they select these same responses to question 24,
they are defined as someone who bullies
others. If they select these responses to
both questions, they are considered to bully
others and also to be bullied (also known as
“bully-victims”). If none of these responses
are selected for either question, they are
considered neither to have been bullied
nor bullied others and consequently not
involved in bullying (see figure 1).
Dividing students into these groups
is helpful because students often share
common characteristics within these
groups (e.g., Jimerson, Swearer, and
Espelage 2010). For example, students
who are bullied are more likely than
their nonbullied peers to have low self-
esteem, loneliness, anxiety, and depression
(Cook et al. 2010; Klomek et al. 2007;
Olweus 1993) and experience later
depression, anxiety, and psychosomatic
problems (Faris and Felmlee 2011; Gini
and Pozzoli 2013; Lereya et al. 2015; Reijntjes et al. 2010; Ttofi et al. 2011a). Students who participate in bullying,
on the other hand, are more likely than their peers to vandalize property, to drop out of school, and to use alcohol,
cigarettes, or marijuana (Byrne 1994; Haynie et al. 2001; Olweus 2011; Radliff et al. 2012), and bullying others
has been found to be associated with later antisocial and criminal behavior (Olweus 1993; Ttofi et al. 2011b).
Children and youth who are involved in bullying others and are also being bullied may be at particularly high
risk of internalizing problems (for example, depression) and externalizing problems (for example, antisocial
behavior) (Cook et al. 2010).
It is important to note that the terms victim, bully, and bully-victim should not be used to label individual
children. Wherever possible in this report, we use phrases such as “students who were bullied” and “students who
bully others,” which are more appropriate terms. The shorthand terms should be used exclusively for research
purposes and only when the use of longer terminology would be awkward or confusing.
Figure 1.
Bullied others and was bullied by others
Bullied others (only)
Was bullied by
others (only)
Not involved
Yes
Yes
No
Question 24: Have you taken part in bullying another student(s) at school in the past couple of months, 2 or 3 times a month or more?*
No
Question 4: Have you been bullied at school in the past couple of months, 2 or 3 times a month or more?*
Figure 1. Students’ bullying status: Four categories**Paraphrased questions
BULLYING IN U.S. SCHOOLS: 2014 STATUS REPORT
©2015 by Hazelden Betty Ford Foundation. All rights reserved. Duplicating this material for personal or group use is permissible. 4
Characteristics of the sampleSince 2007, the OBQ has been administered more than three million times to students across the United States.
During the 2013–2014 school year, more than 150,000 questionnaires were collected from 629 schools that had
purchased the OBQ but not yet implemented OBPP. These schools had identified a need but had not yet begun
using the program. It was from this collection of questionnaires that a representative sample was drawn for this
report so that these data would not be affected by OBPP.
A stratified random sample of 2,000 questionnaires was selected from each grade (third through twelfth)
with 1,000 girls and 1,000 boys in each of the ten grades for a total of 20,000 questionnaires in the sample.
The sample was purposefully drawn so that the distribution of bullying status (not involved, bullied by
others only, bully others only, and bully others and also are bullied) within gender and grade was consistent
with the distribution for all of the more than 150,000 students surveyed. This means that the 20,000 student
questionnaires sampled were representative, with regard to bullying status, gender, and grade, of all the student
questionnaires collected in the 2013–2014 school year at schools that had never implemented OBPP.
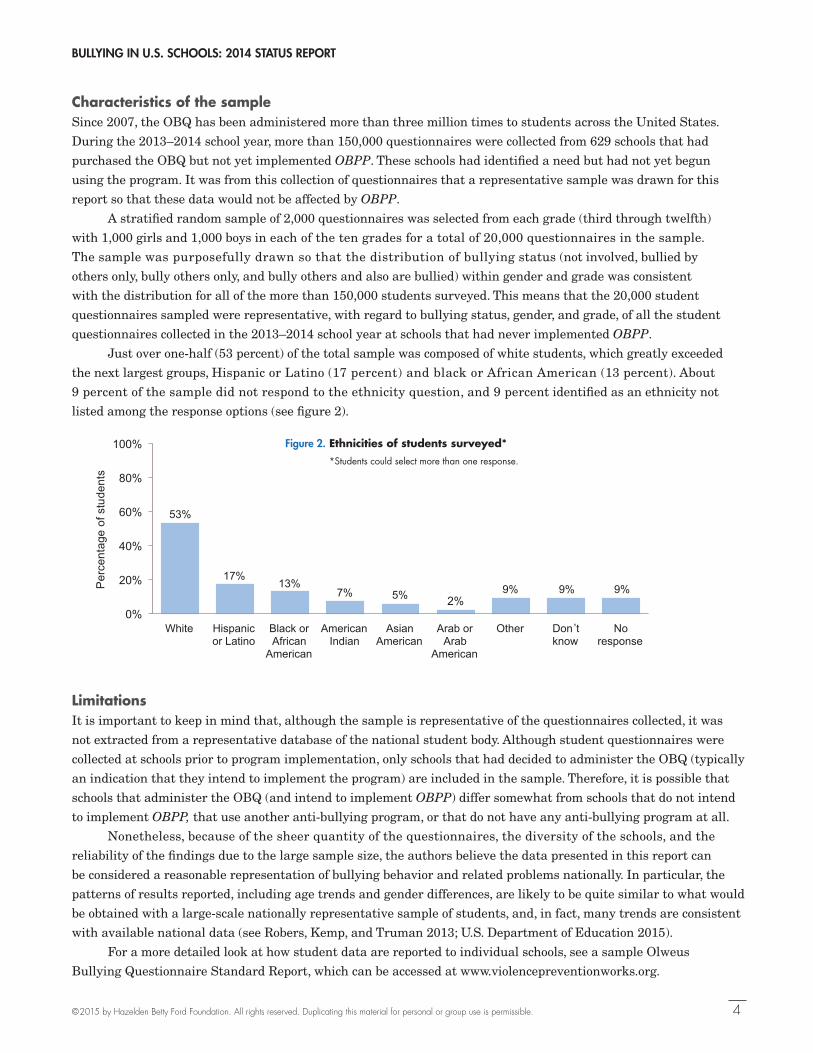
Just over one-half (53 percent) of the total sample was composed of white students, which greatly exceeded
the next largest groups, Hispanic or Latino (17 percent) and black or African American (13 percent). About
9 percent of the sample did not respond to the ethnicity question, and 9 percent identified as an ethnicity not
listed among the response options (see figure 2).
LimitationsIt is important to keep in mind that, although the sample is representative of the questionnaires collected, it was
not extracted from a representative database of the national student body. Although student questionnaires were
collected at schools prior to program implementation, only schools that had decided to administer the OBQ (typically
an indication that they intend to implement the program) are included in the sample. Therefore, it is possible that
schools that administer the OBQ (and intend to implement OBPP) differ somewhat from schools that do not intend
to implement OBPP, that use another anti-bullying program, or that do not have any anti-bullying program at all.
Nonetheless, because of the sheer quantity of the questionnaires, the diversity of the schools, and the
reliability of the findings due to the large sample size, the authors believe the data presented in this report can
be considered a reasonable representation of bullying behavior and related problems nationally. In particular, the
patterns of results reported, including age trends and gender differences, are likely to be quite similar to what would
be obtained with a large-scale nationally representative sample of students, and, in fact, many trends are consistent
with available national data (see Robers, Kemp, and Truman 2013; U.S. Department of Education 2015).
For a more detailed look at how student data are reported to individual schools, see a sample Olweus
Bullying Questionnaire Standard Report, which can be accessed at www.violencepreventionworks.org.
Figure 2. Ethnicities of students surveyed*
*Students could select more than one response.
53%
17%
13%
7%
5%
2%
9%
9%
9%
0% 20% 40% 60% 80% 100%
White
Hispanic or Latino
Black or African American
American Indian
Asian American
Arab or Arab American
Other
Don't know
No response
53%
17% 13%
7% 5% 2% 9% 9% 9%
0%
20%
40%
60%
80%
100%
White Hispanic or Latino
Black or African
American
American Indian
Asian American
Arab or Arab
American
Other Don t know
No response
Per
cent
age
ofst
uden
ts
Percentage of students
*Students could select more than one response.
Figure 2. Ethnicities of students surveyed* *Students could select more than one response.
BULLYING IN U.S. SCHOOLS: 2014 STATUS REPORT
©2015 by Hazelden Betty Ford Foundation. All rights reserved. Duplicating this material for personal or group use is permissible. 5
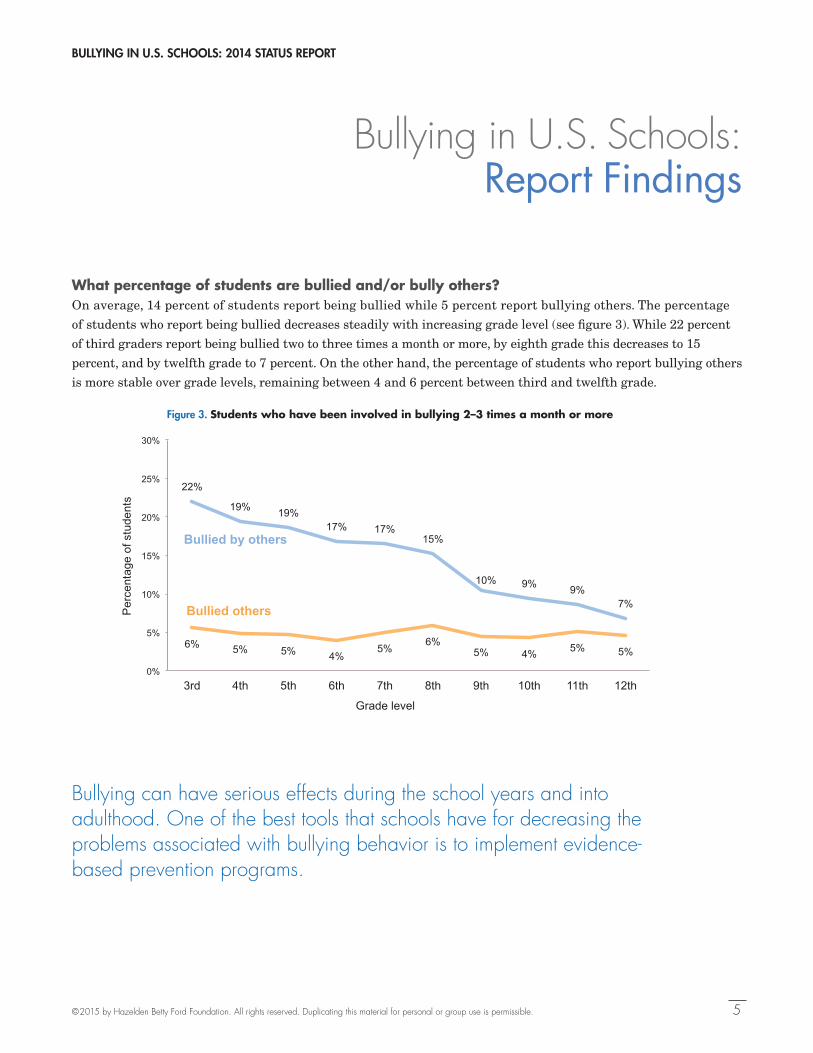
What percentage of students are bullied and/or bully others?On average, 14 percent of students report being bullied while 5 percent report bullying others. The percentage
of students who report being bullied decreases steadily with increasing grade level (see figure 3). While 22 percent
of third graders report being bullied two to three times a month or more, by eighth grade this decreases to 15
percent, and by twelfth grade to 7 percent. On the other hand, the percentage of students who report bullying others
is more stable over grade levels, remaining between 4 and 6 percent between third and twelfth grade.
Bullying in U.S. Schools:Report Findings
Figure 3. Students who have been involved in bullying 2–3 times a month or more
Bullying can have serious effects during the school years and into adulthood. One of the best tools that schools have for decreasing the problems associated with bullying behavior is to implement evidence- based prevention programs.
Figure 3. Students who have been involved in bullying 2–3 times a month or more
22%
19% 19% 17% 17%
15%
10% 9% 9% 7%
6% 5% 5% 4% 5% 6%
5% 4% 5% 5%
0%
5%
10%
15%
20%
25%
30%
3rd 4th 5th 6th 7th 8th 9th 10th 11th 12th
Grade level
Bullied by others
Bullied others Per
cent
age
of s
tude
nts
BULLYING IN U.S. SCHOOLS: 2014 STATUS REPORT
©2015 by Hazelden Betty Ford Foundation. All rights reserved. Duplicating this material for personal or group use is permissible. 6
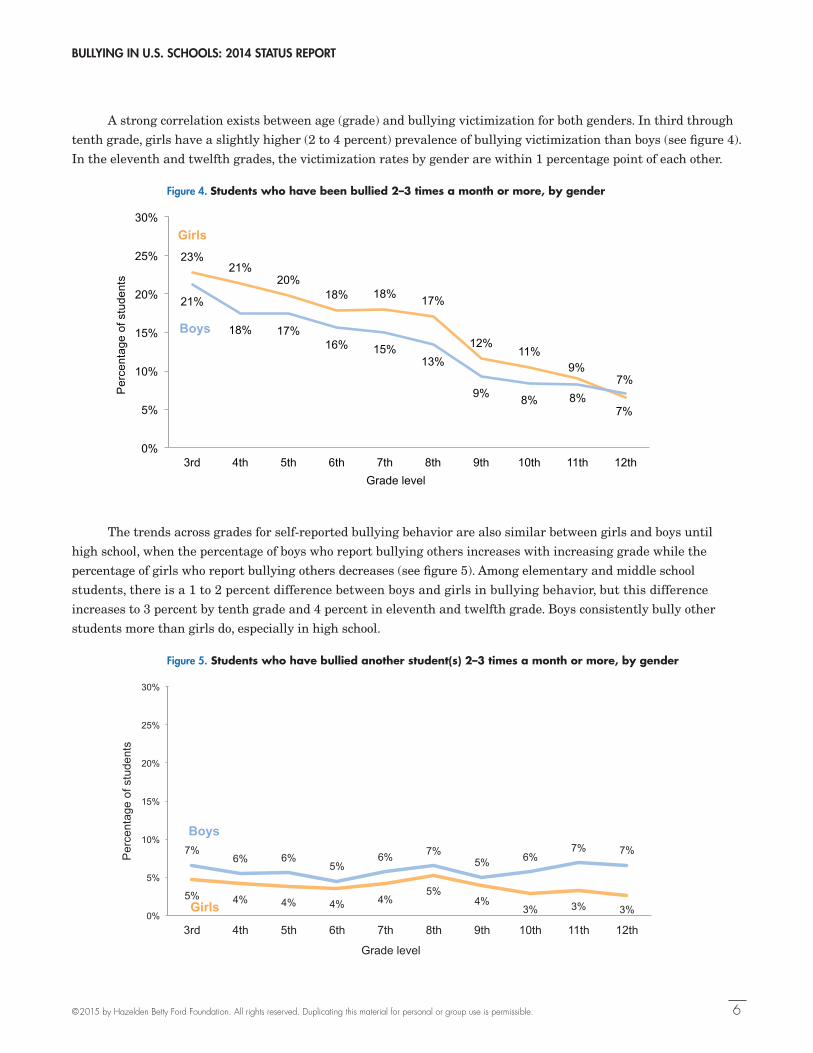
A strong correlation exists between age (grade) and bullying victimization for both genders. In third through
tenth grade, girls have a slightly higher (2 to 4 percent) prevalence of bullying victimization than boys (see figure 4).
In the eleventh and twelfth grades, the victimization rates by gender are within 1 percentage point of each other.
The trends across grades for self-reported bullying behavior are also similar between girls and boys until
high school, when the percentage of boys who report bullying others increases with increasing grade while the
percentage of girls who report bullying others decreases (see figure 5). Among elementary and middle school
students, there is a 1 to 2 percent difference between boys and girls in bullying behavior, but this difference
increases to 3 percent by tenth grade and 4 percent in eleventh and twelfth grade. Boys consistently bully other
students more than girls do, especially in high school.
Figure 5. Students who have bullied another student(s) 2–3 times a month or more, by gender
Figure 4. Students who have been bullied 2–3 times a month or more, by gender
Figure 4. Students who have been bullied 2–3 times a month or more, by gender
23% 21%
20% 18% 18% 17%
12% 11%
9%
7%
21%
18% 17% 16% 15%
13%
9% 8% 8% 7%
0%
5%
10%
15%
20%
25%
30%
3rd 4th 5th 6th 7th 8th 9th 10th 11th 12th Grade level
Girls
Boys
Per
cent
age
of s
tude
nts
Figure 5. Students who have bullied another student(s) 2–3 times a month or more, by gender
5% 4% 4% 4% 4% 5%
4% 3% 3% 3%
7% 6% 6%
5% 6% 7%
5% 6% 7% 7%
0%
5%
10%
15%
20%
25%
30%
3rd 4th 5th 6th 7th 8th 9th 10th 11th 12th
Grade level
Boys
Girls
Per
cent
age
of s
tude
nts
BULLYING IN U.S. SCHOOLS: 2014 STATUS REPORT
©2015 by Hazelden Betty Ford Foundation. All rights reserved. Duplicating this material for personal or group use is permissible. 7
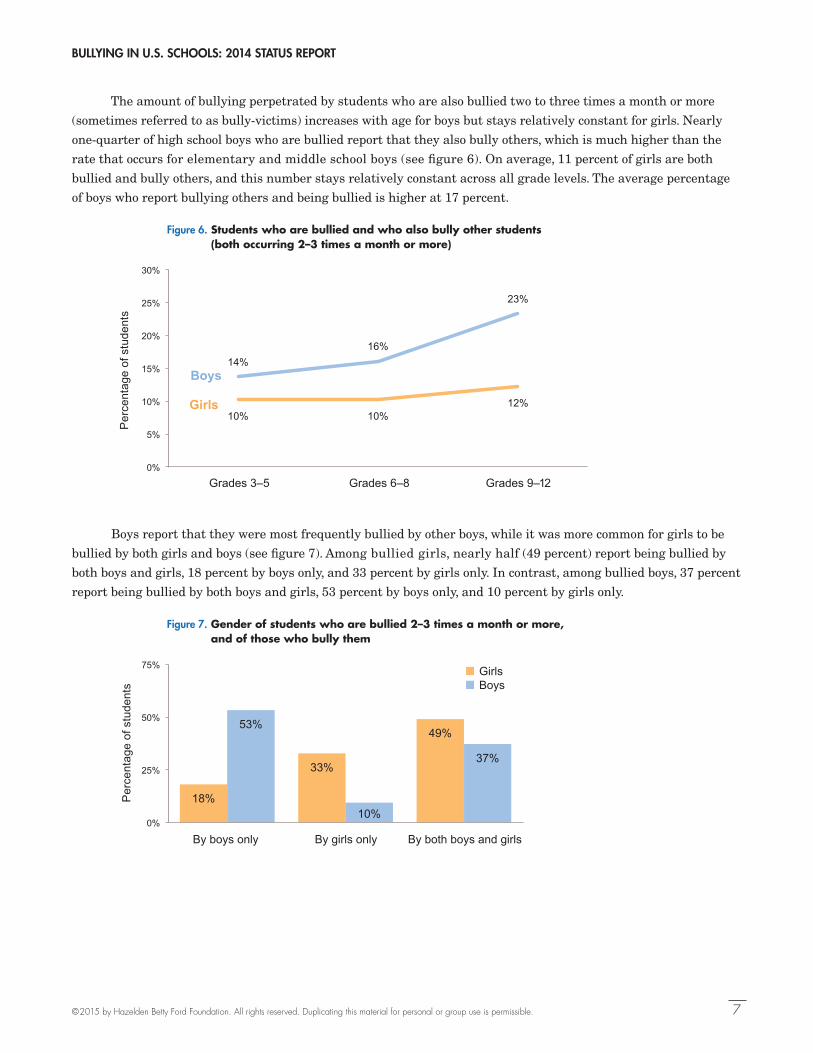
The amount of bullying perpetrated by students who are also bullied two to three times a month or more
(sometimes referred to as bully-victims) increases with age for boys but stays relatively constant for girls. Nearly
one-quarter of high school boys who are bullied report that they also bully others, which is much higher than the
rate that occurs for elementary and middle school boys (see figure 6). On average, 11 percent of girls are both
bullied and bully others, and this number stays relatively constant across all grade levels. The average percentage
of boys who report bullying others and being bullied is higher at 17 percent.
Boys report that they were most frequently bullied by other boys, while it was more common for girls to be
bullied by both girls and boys (see figure 7). Among bullied girls, nearly half (49 percent) report being bullied by
both boys and girls, 18 percent by boys only, and 33 percent by girls only. In contrast, among bullied boys, 37 percent
report being bullied by both boys and girls, 53 percent by boys only, and 10 percent by girls only.
Figure 7. Gender of students who are bullied 2–3 times a month or more, and of those who bully them
Figure 6. Students who are bullied and who also bully other students (both occurring 2–3 times a month or more)
Figure 6. Students who are bullied and who also bully other students (both occurring 2–3 times a month or more)
Figure 7. Gender of students who are bullied 2–3 times a month or more, and of those who bully them
10% 10% 12%
14% 16%
23%
0%
5%
10%
15%
20%
25%
30%
Grades 3–5 Grades 6–8 Grades 9–12
Boys
Girls
18%
33%
49% 53%
10%
37%
0%
25%
50%
75%
Per
cent
age
of s
tude
nts
Per
cent
age
of s
tude
nts
Girls Boys
By boys only By girls only By both boys and girls
BULLYING IN U.S. SCHOOLS: 2014 STATUS REPORT
©2015 by Hazelden Betty Ford Foundation. All rights reserved. Duplicating this material for personal or group use is permissible. 8
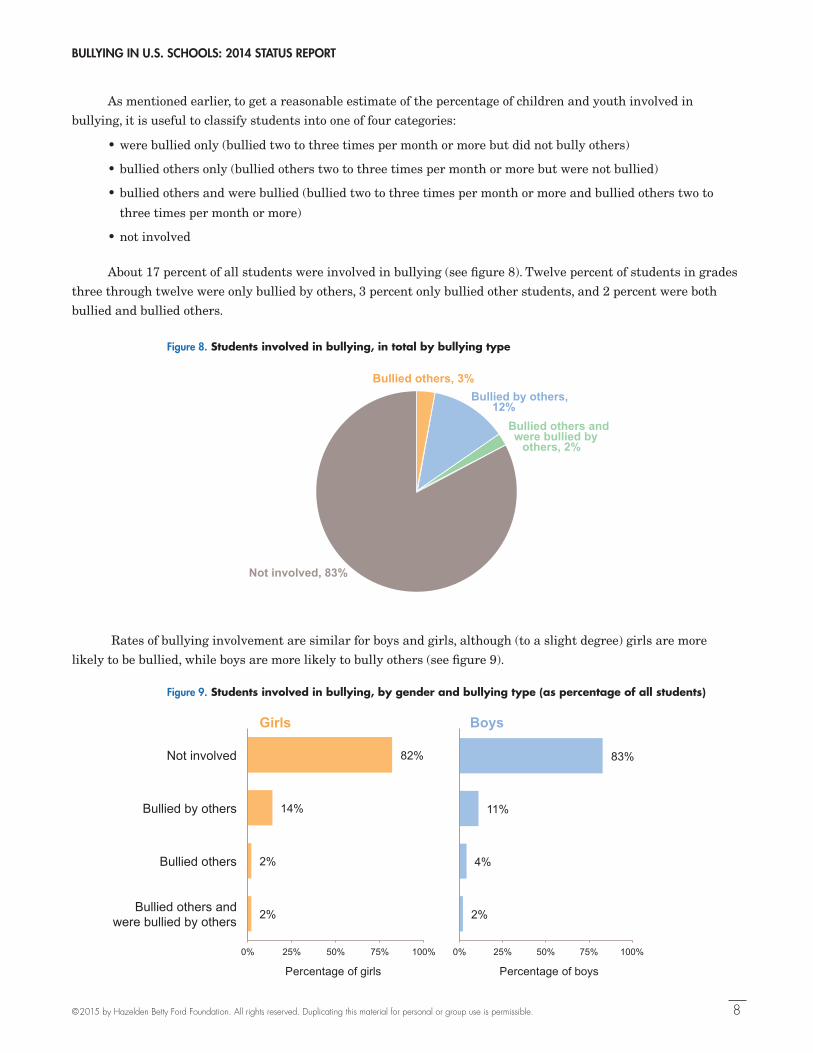
As mentioned earlier, to get a reasonable estimate of the percentage of children and youth involved in
bullying, it is useful to classify students into one of four categories:
• were bullied only (bullied two to three times per month or more but did not bully others)
• bullied others only (bullied others two to three times per month or more but were not bullied)
• bullied others and were bullied (bullied two to three times per month or more and bullied others two to
three times per month or more)
• not involved
About 17 percent of all students were involved in bullying (see figure 8). Twelve percent of students in grades
three through twelve were only bullied by others, 3 percent only bullied other students, and 2 percent were both
bullied and bullied others.
Rates of bullying involvement are similar for boys and girls, although (to a slight degree) girls are more
likely to be bullied, while boys are more likely to bully others (see figure 9).
Figure 8. Students involved in bullying, in total by bullying type
Figure 9. Students involved in bullying, by gender and bullying type (as percentage of all students)
Figure 9. Students involved in bullying, by gender and bullying type (as percentage of all students) [typesetter: change “& was” to “and were”; add “Percentage of students” under “boys” diagram too]
Bullied others, 3% Bullied by others,
12% Bullied others and were bullied by
others, 2%
Not involved, 83%
82%
14%
2%
2%
0% 25% 50% 75% 100%
Not involved
Bullied by others
Bullied others
Bullied others andwere bullied by others
Girls
83%
11%
4%
2%
0% 25% 50% 75% 100%
Boys
Percentage of girls Percentage of boys
BULLYING IN U.S. SCHOOLS: 2014 STATUS REPORT
©2015 by Hazelden Betty Ford Foundation. All rights reserved. Duplicating this material for personal or group use is permissible. 9
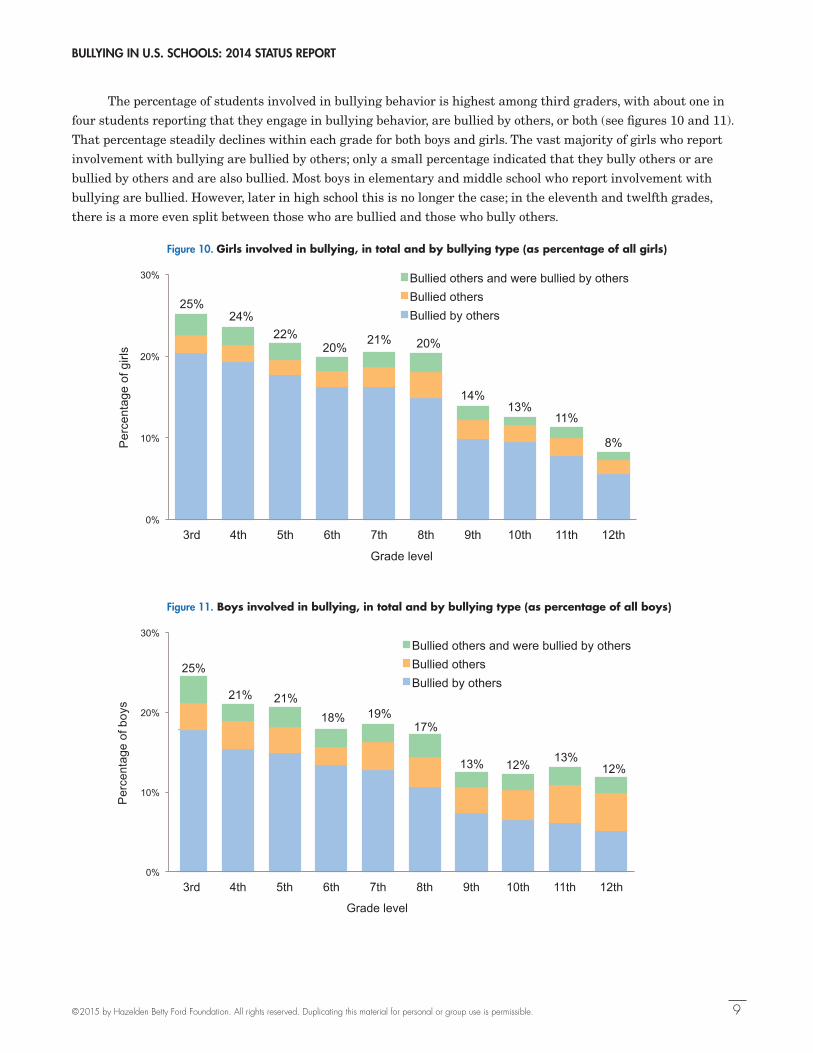
The percentage of students involved in bullying behavior is highest among third graders, with about one in
four students reporting that they engage in bullying behavior, are bullied by others, or both (see figures 10 and 11).
That percentage steadily declines within each grade for both boys and girls. The vast majority of girls who report
involvement with bullying are bullied by others; only a small percentage indicated that they bully others or are
bullied by others and are also bullied. Most boys in elementary and middle school who report involvement with
bullying are bullied. However, later in high school this is no longer the case; in the eleventh and twelfth grades,
there is a more even split between those who are bullied and those who bully others.
Figure 10. Girls involved in bullying, in total and by bullying type (as percentage of all girls)
Figure 11. Boys involved in bullying, in total and by bullying type (as percentage of all boys)
Figure 10. Girls involved in bullying, in total and by bullying type (as percentage of all girls)
25% 24%
22% 20%
21% 20%
14% 13%
11%
8%
0%
10%
20%
30%
3rd 4th 5th 6th 7th 8th 9th 10th 11th 12th
Bullied others and were bullied by others Bullied others Bullied by others
Grade level
Per
cent
age
of g
irls
Figure 11. Boys involved in bullying, in total and by bullying type (as percentage of all boys)
25%
21% 21% 18% 19%
17%
13% 12% 13% 12%
0%
10%
20%
30%
3rd 4th 5th 6th 7th 8th 9th 10th 11th 12th
Bullied others and were bullied by others
Bullied others
Bullied by others
Grade level
Per
cent
age
of b
oys
Figure 10. Girls involved in bullying, in total and by bullying type (as percentage of all girls)
25% 24%
22% 20%
21% 20%
14% 13%
11%
8%
0%
10%
20%
30%
3rd 4th 5th 6th 7th 8th 9th 10th 11th 12th
Bullied others and were bullied by others Bullied others Bullied by others
Grade level
Per
cent
age
of g
irls
BULLYING IN U.S. SCHOOLS: 2014 STATUS REPORT
©2015 by Hazelden Betty Ford Foundation. All rights reserved. Duplicating this material for personal or group use is permissible. 10
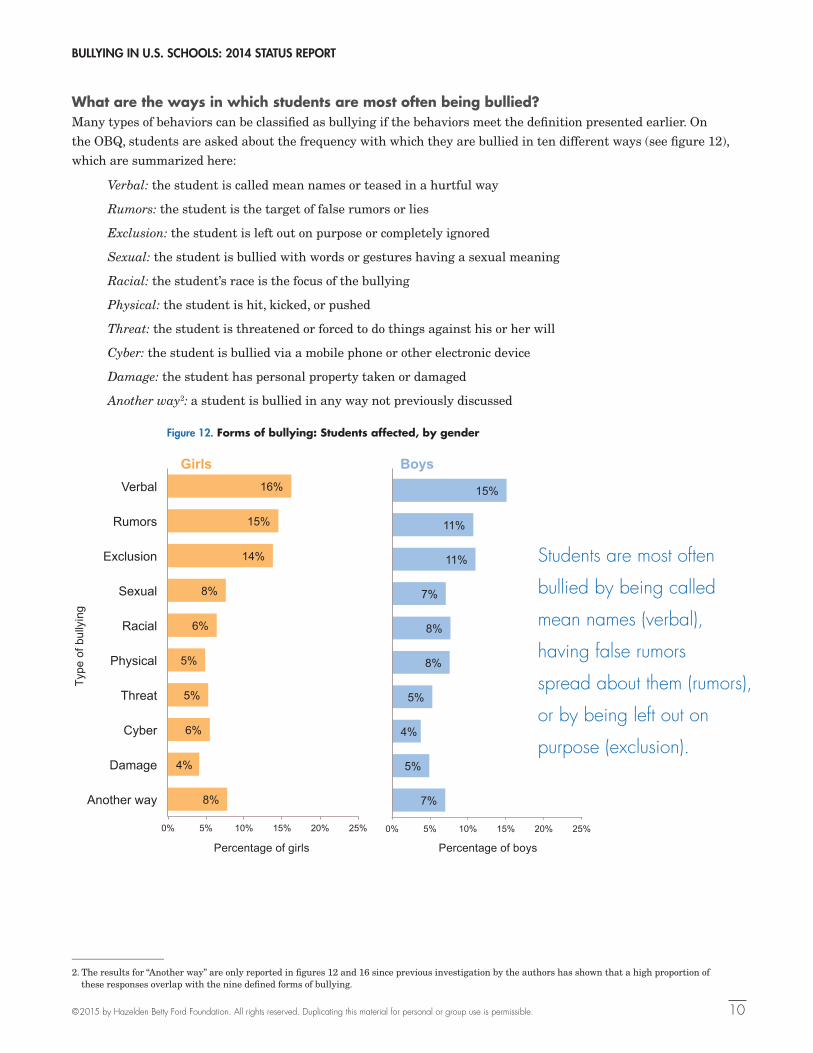
What are the ways in which students are most often being bullied?Many types of behaviors can be classified as bullying if the behaviors meet the definition presented earlier. On
the OBQ, students are asked about the frequency with which they are bullied in ten different ways (see figure 12),
which are summarized here:
Verbal: the student is called mean names or teased in a hurtful way
Rumors: the student is the target of false rumors or lies
Exclusion: the student is left out on purpose or completely ignored
Sexual: the student is bullied with words or gestures having a sexual meaning
Racial: the student’s race is the focus of the bullying
Physical: the student is hit, kicked, or pushed
Threat: the student is threatened or forced to do things against his or her will
Cyber: the student is bullied via a mobile phone or other electronic device
Damage: the student has personal property taken or damaged
Another way2: a student is bullied in any way not previously discussed
____________________
2. The results for “Another way” are only reported in figures 12 and 16 since previous investigation by the authors has shown that a high proportion of these responses overlap with the nine defined forms of bullying.
Students are most often
bullied by being called
mean names (verbal),
having false rumors
spread about them (rumors),
or by being left out on
purpose (exclusion).
Figure 12. Forms of bullying: Students affected, by gender
Figure 12. Form of bullying: Students affected, by gender
16%
15%
14%
8%
6%
5%
5%
6%
4%
8%
0% 5% 10% 15% 20% 25%
Verbal
Rumors
Exclusion
Sexual
Racial
Physical
Threat
Cyber
Damage
Another way
Girls
15%
11%
11%
7%
8%
8%
5%
4%
5%
7%
0% 5% 10% 15% 20% 25%
Boys
Type
of b
ully
ing
Percentage of girls Percentage of boys
BULLYING IN U.S. SCHOOLS: 2014 STATUS REPORT
©2015 by Hazelden Betty Ford Foundation. All rights reserved. Duplicating this material for personal or group use is permissible. 11
Among all boys and girls, being verbally bullied occurs more
often than any other form of bullying, with 16 percent of girls and
15 percent of boys reporting being verbally bullied two to three times
a month or more. The spreading of rumors and being excluded are
the next most common ways students report being bullied and occur
more often for girls than boys. Another gender difference is observed
for physical bullying, where 8 percent of boys report being physically
bullied compared to 5 percent of girls (see also Harris, Petrie, and
Willoughby 2002 and U.S. Department of Education 2015 for findings
of similar gender differences in physical bullying among nationally
representative samples).
Cyberbullying ranks as the least commonly reported form of
bullying for boys (4 percent) and one of the lowest for girls (6 percent).
This low rate of cyberbullying may seem counterintuitive given the
great deal of media attention it has received in recent years, suggesting
a more widespread prevalence. These results and a good deal of
empirical research, however, suggest that the threat of cyberbullying is
exaggerated in the media (see Olweus 2013). Nonetheless, cyberbullying
can certainly be very hurtful and devastating and needs to be taken
seriously. It is important to keep in mind that even while cyberbullying
must be addressed, the key problem facing our nation’s students is the
more traditional forms of bullying.
Whereas figure 12 shows the percentage of all students who
report being bullied by the various forms of bullying, the following two
figures look at a smaller group of students, only those students who
report being bullied two or three times a month or more to question 4
(How often have you been bullied at school in the past couple of
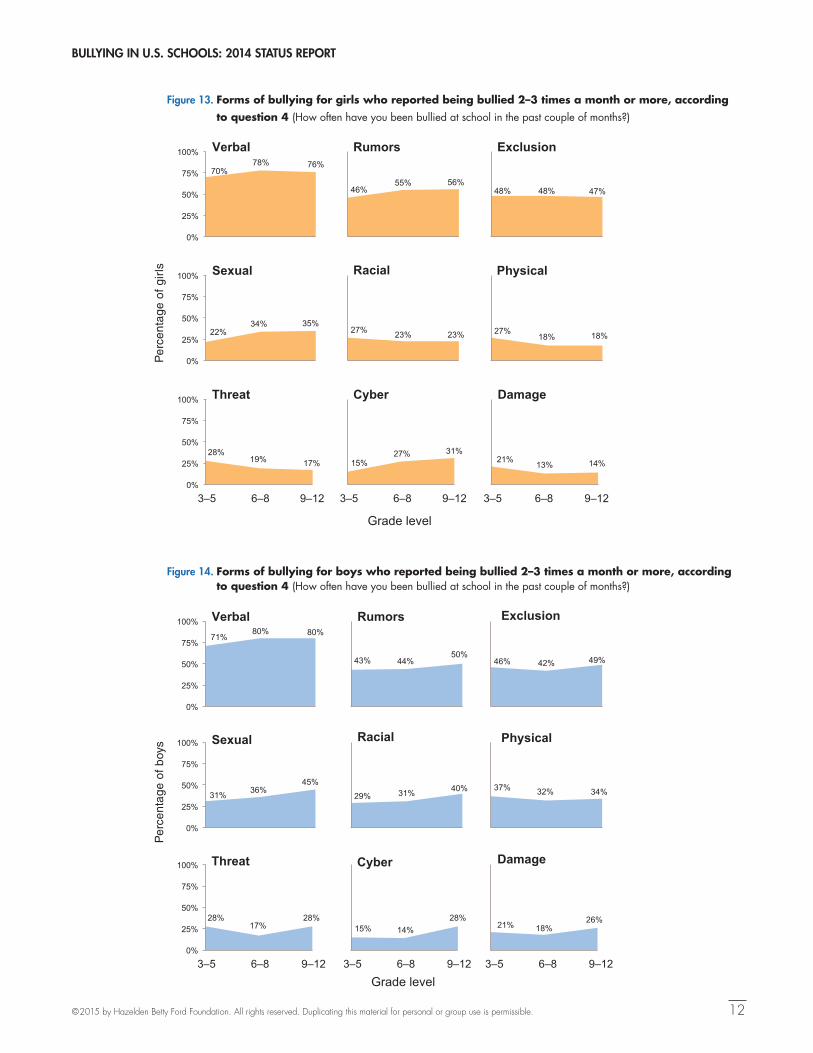
months?). In figures 13 and 14, we can see possible changes in how often
certain forms of bullying are used at various grade levels as perceived
by students who are bullied two to three times a month or more often.
In the higher grades, for example, girls are bullied significantly more
often through verbal bullying, the spreading of rumors, sexual bullying,
and cyberbullying than in the lower grades. They are also bullied less
frequently with more physical forms of bullying (physical, threats, and
damage). Some of these differences are quite marked: Girls report that
they are bullied through cyberbullying twice as much in high school
as in elementary school. Being bullied by exclusion is the only type of
bullying that stays relatively the same for girls across their school years
and occurs for nearly half of girls who are bullied two or more times a
month (see figure 13).
Boys who are bullied experience more verbal bullying, bullying
with a sexual meaning, racial bullying, and cyberbullying in high
school than in elementary school grades (see figure 14). As with girls,
cyberbullying is experienced about twice as often by high school boys
than boys in elementary school.
Among all boys and girls,
being verbally bullied
occurs more often than
any other form of bullying,
with 16 percent of girls
and 15 percent of boys
reporting being verbally
bullied two to three times
a month or more.
BULLYING IN U.S. SCHOOLS: 2014 STATUS REPORT
©2015 by Hazelden Betty Ford Foundation. All rights reserved. Duplicating this material for personal or group use is permissible. 12
Figure 13. Forms of bullying for girls who reported being bullied 2–3 times a month or more, according to question 4 (How often have you been bullied at school in the past couple of months?)
Figure 14. Forms of bullying for boys who reported being bullied 2–3 times a month or more, according to question 4 (How often have you been bullied at school in the past couple of months?)
Figure 13. Forms of bullying for girls who reported being bullied 2–3 times a month or more*
Grade level
*According to question 4 (How often have you been bullied at school in the past couple of months?)
70% 78% 76%
0%
25%
50%
75%
100% Verbal
46% 55% 56%
Rumors
48% 48% 47%
Exclusion
22% 34% 35%
0%
25%
50%
75%
100% Sexual
27% 23% 23%
Racial
27% 18% 18%
Physical
28% 19% 17%
0%
25%
50%
75%
100%
3–5 6–8 9–12
Threat
15% 27% 31%
3–5 6–8 9–12
Cyber
21% 13% 14%
3–5 6–8 9–12
Damage
Figure 14. Forms of bullying for boys who reported being bullied 2–3 times a month or more*
Grade level
*According to question 4 (How often have you been bullied at school in the past couple of months?)
71% 80% 80%
0%
25%
50%
75%
100% Verbal
43% 44% 50%
Rumors
46% 42% 49%
Exclusion
31% 36% 45%
0%
25%
50%
75%
100% Sexual
29% 31% 40%
Racial
37% 32% 34%
Physical
28% 17%
28%
0%
25%
50%
75%
100%
3–5 6–8 9–12
Threat
15% 14% 28%
3–5 6–8 9–12
Cyber
21% 18% 26%
3–5 6–8 9–12
Damage
Per
cent
age
of b
oys
Per
cent
age
of g
irls
BULLYING IN U.S. SCHOOLS: 2014 STATUS REPORT
©2015 by Hazelden Betty Ford Foundation. All rights reserved. Duplicating this material for personal or group use is permissible. 13
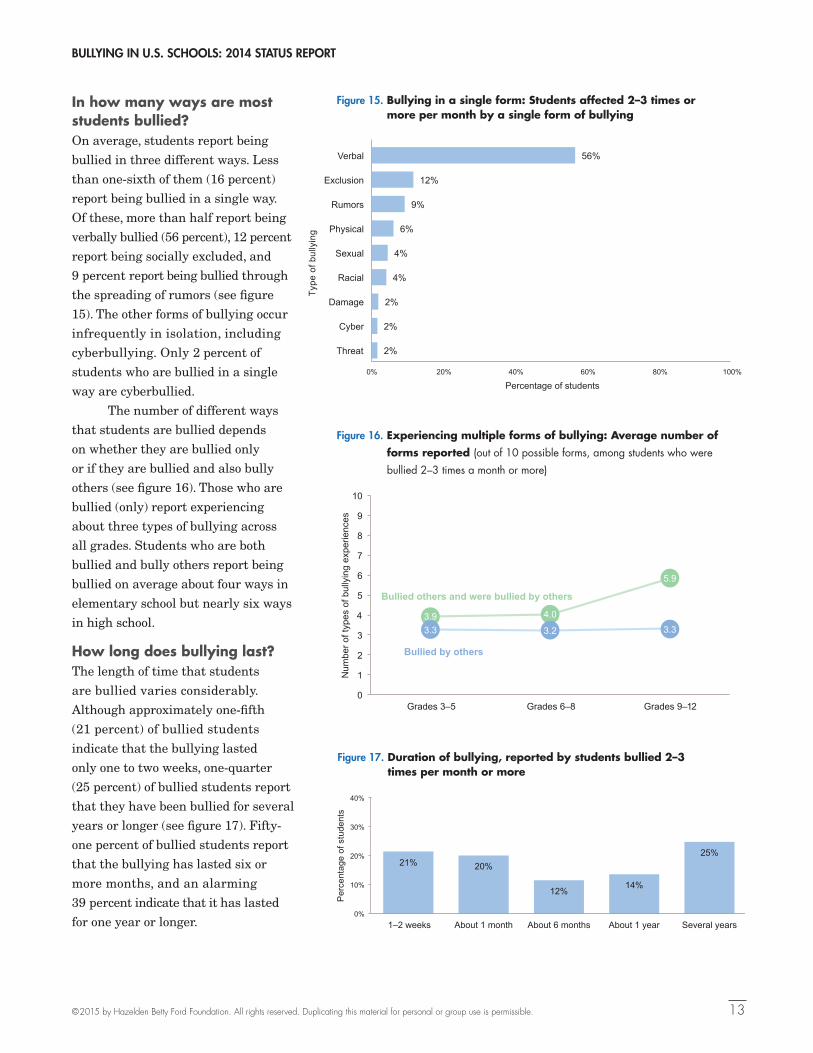
In how many ways are most students bullied?On average, students report being
bullied in three different ways. Less
than one-sixth of them (16 percent)
report being bullied in a single way.
Of these, more than half report being
verbally bullied (56 percent), 12 percent
report being socially excluded, and
9 percent report being bullied through
the spreading of rumors (see figure
15). The other forms of bullying occur
infrequently in isolation, including
cyberbullying. Only 2 percent of
students who are bullied in a single
way are cyberbullied.
The number of different ways
that students are bullied depends
on whether they are bullied only
or if they are bullied and also bully
others (see figure 16). Those who are
bullied (only) report experiencing
about three types of bullying across
all grades. Students who are both
bullied and bully others report being
bullied on average about four ways in
elementary school but nearly six ways
in high school.
How long does bullying last?The length of time that students
are bullied varies considerably.
Although approximately one-fifth
(21 percent) of bullied students
indicate that the bullying lasted
only one to two weeks, one-quarter
(25 percent) of bullied students report
that they have been bullied for several
years or longer (see figure 17). Fifty-
one percent of bullied students report
that the bullying has lasted six or
more months, and an alarming
39 percent indicate that it has lasted
for one year or longer.
Figure 15. Bullying in a single form: Students affected 2–3 times or more per month by a single form of bullying
Figure 16. Experiencing multiple forms of bullying: Average number of forms reported (out of 10 possible forms, among students who were
bullied 2–3 times a month or more)
Figure 17. Duration of bullying, reported by students bullied 2–3 times per month or more
Figure 15. Bullying in a single form: Students affected 2–3 times or more per month by a single form of bullying
2%
2%
2%
4%
4%
6%
9%
12%
56%
0% 20% 40% 60% 80% 100%
Threat
Cyber
Damage
Racial
Sexual
Physical
Rumors
Exclusion
Verbal
Percentage of students
Type
of b
ully
ing
Figure 16. Experiencing multiple forms of bullying: Average number of forms reported (out of 10 possible forms)*
Figure 17. Duration of bullying, reported by students bullied 2–3 times per month or more
3.9 4.0
5.9
3.3 3.2 3.3
0
1
2
3
4
5
6
7
8
9
10
Grades 3–5 *Among students who were bullied 2–3 times a month or more
Grades 6–8 Grades 9–12
Num
ber o
f typ
es o
f bul
lyin
g ex
perie
nces
Bullied others and were bullied by others
Bullied by others
21% 20%
12% 14%
25%
0%
10%
20%
30%
40%
1–2 weeks About 1 month About 6 months About 1 year Several years
Per
cent
age
of s
tude
nts
21% 20%
12% 14%
25%
0%
10%
20%
30%
40%
1–2weeks
About 1month
About 6months
About 1year
Severalyears
Per
cent
age
of s
tude
nts
BULLYING IN U.S. SCHOOLS: 2014 STATUS REPORT
©2015 by Hazelden Betty Ford Foundation. All rights reserved. Duplicating this material for personal or group use is permissible. 14
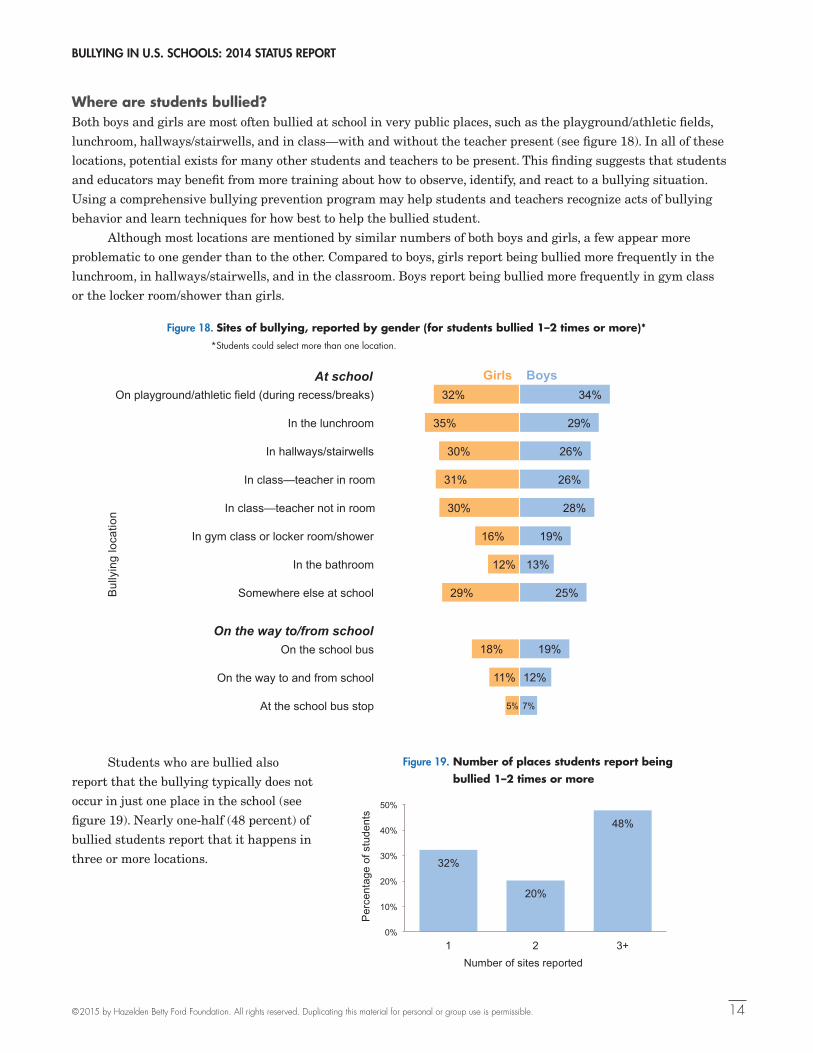
Where are students bullied? Both boys and girls are most often bullied at school in very public places, such as the playground/athletic fields,
lunchroom, hallways/stairwells, and in class—with and without the teacher present (see figure 18). In all of these
locations, potential exists for many other students and teachers to be present. This finding suggests that students
and educators may benefit from more training about how to observe, identify, and react to a bullying situation.
Using a comprehensive bullying prevention program may help students and teachers recognize acts of bullying
behavior and learn techniques for how best to help the bullied student.
Although most locations are mentioned by similar numbers of both boys and girls, a few appear more
problematic to one gender than to the other. Compared to boys, girls report being bullied more frequently in the
lunchroom, in hallways/stairwells, and in the classroom. Boys report being bullied more frequently in gym class
or the locker room/shower than girls.
Students who are bullied also
report that the bullying typically does not
occur in just one place in the school (see
figure 19). Nearly one-half (48 percent) of
bullied students report that it happens in
three or more locations.
Figure 18. Sites of bullying, reported by gender (for students bullied 1–2 times or more)* *Students could select more than one location.
Figure 19. Number of places students report being bullied 1–2 times or more
*Students could select more than one location.
32%
35%
30%
31%
30%
16%
12%
29%
18%
11%
5%
34%
29%
26%
26%
28%
19%
13%
25%
19%
12%
7%
On playground/athletic field (during recess/breaks)
In the lunchroom
In hallways/stairwells
In class—teacher in room
In class—teacher not in room
In gym class or locker room/shower
In the bathroom
Somewhere else at school
On the school bus
On the way to and from school
At the school bus stop
Girls Boys At school
On the way to/from school
Bul
lyin
g lo
catio
n
Figure 19. Number of places students report being bullied 1–2 times or more
32%
20%
48%
0%
10%
20%
30%
40%
50%
1 2 3+ Number of sites reported
Per
cent
age
of s
tude
nts
BULLYING IN U.S. SCHOOLS: 2014 STATUS REPORT
©2015 by Hazelden Betty Ford Foundation. All rights reserved. Duplicating this material for personal or group use is permissible. 15
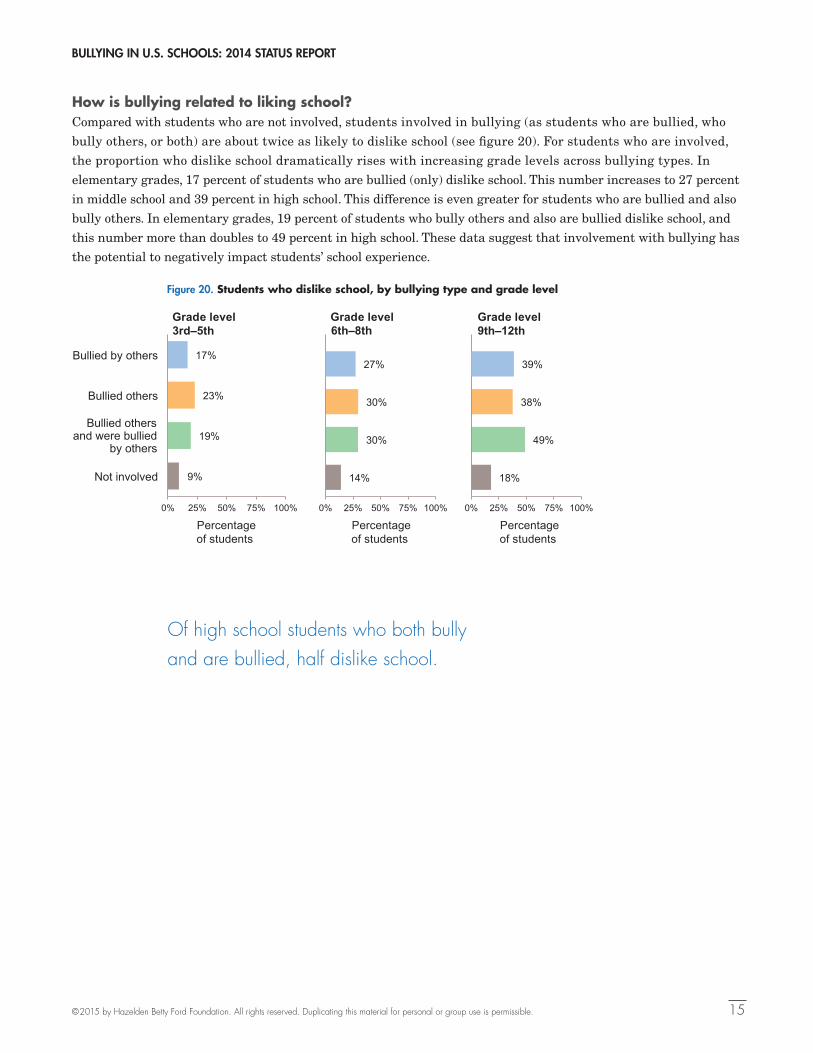
How is bullying related to liking school?Compared with students who are not involved, students involved in bullying (as students who are bullied, who
bully others, or both) are about twice as likely to dislike school (see figure 20). For students who are involved,
the proportion who dislike school dramatically rises with increasing grade levels across bullying types. In
elementary grades, 17 percent of students who are bullied (only) dislike school. This number increases to 27 percent
in middle school and 39 percent in high school. This difference is even greater for students who are bullied and also
bully others. In elementary grades, 19 percent of students who bully others and also are bullied dislike school, and
this number more than doubles to 49 percent in high school. These data suggest that involvement with bullying has
the potential to negatively impact students’ school experience.
Of high school students who both bully and are bullied, half dislike school.
Figure 20. Students who dislike school, by bullying type and grade level
Figure 20. Students who dislike school, by bullying type and grade level
17%
23%
19%
9%
0% 25% 50% 75% 100%
Bullied by others
Bullied others
Bullied others and were bullied
by others
Not involved
3rd–5th
27%
30%
30%
14%
0% 25% 50% 75% 100%
6th–8th
39%
38%
49%
18%
0% 25% 50% 75% 100%
9th–12th
Percentageof students
Percentageof students
Percentageof students
Grade level Grade level Grade level
BULLYING IN U.S. SCHOOLS: 2014 STATUS REPORT
©2015 by Hazelden Betty Ford Foundation. All rights reserved. Duplicating this material for personal or group use is permissible. 16
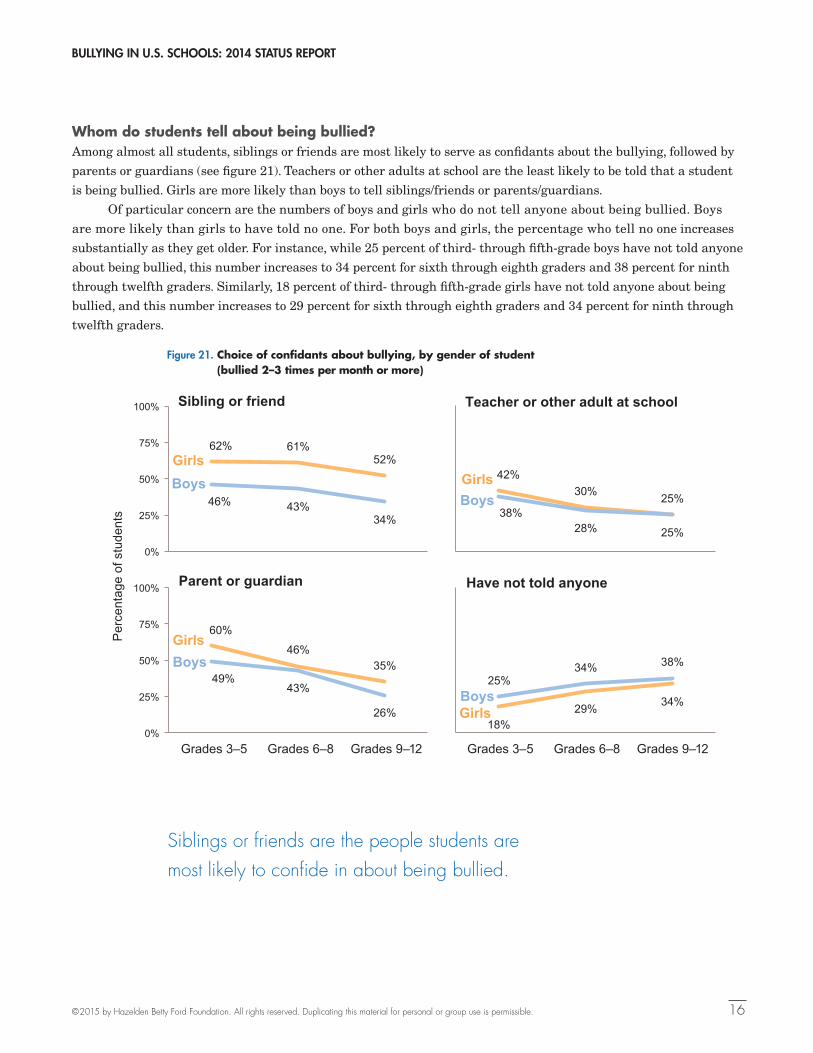
Whom do students tell about being bullied?Among almost all students, siblings or friends are most likely to serve as confidants about the bullying, followed by
parents or guardians (see figure 21). Teachers or other adults at school are the least likely to be told that a student
is being bullied. Girls are more likely than boys to tell siblings/friends or parents/guardians.
Of particular concern are the numbers of boys and girls who do not tell anyone about being bullied. Boys
are more likely than girls to have told no one. For both boys and girls, the percentage who tell no one increases
substantially as they get older. For instance, while 25 percent of third- through fifth-grade boys have not told anyone
about being bullied, this number increases to 34 percent for sixth through eighth graders and 38 percent for ninth
through twelfth graders. Similarly, 18 percent of third- through fifth-grade girls have not told anyone about being
bullied, and this number increases to 29 percent for sixth through eighth graders and 34 percent for ninth through
twelfth graders.
Figure 21. Choice of confidants about bullying, by gender of student (bullied 2–3 times per month or more)
Siblings or friends are the people students are most likely to confide in about being bullied.
Figure 21. Choice of confidants about bullying, by gender of student (bullied 2–3 times per month or more)
62% 61% 52%
46% 43% 34%
0%
25%
50%
75%
100%
Boys Girls
Sibling or friend
60%
46% 35%
49% 43%
26%
0%
25%
50%
75%
100% Parent or guardian
Girls Boys
42% 30% 25%
38% 28% 25%
Teacher or other adult at school
Girls Boys
18% 29% 34%
25% 34% 38%
Grades 3–5 Grades 6–8 Grades 9–12 Grades 3–5 Grades 6–8 Grades 9–12
Have not told anyone
Boys Girls
Per
cent
age
of s
tude
nts
BULLYING IN U.S. SCHOOLS: 2014 STATUS REPORT
©2015 by Hazelden Betty Ford Foundation. All rights reserved. Duplicating this material for personal or group use is permissible. 17
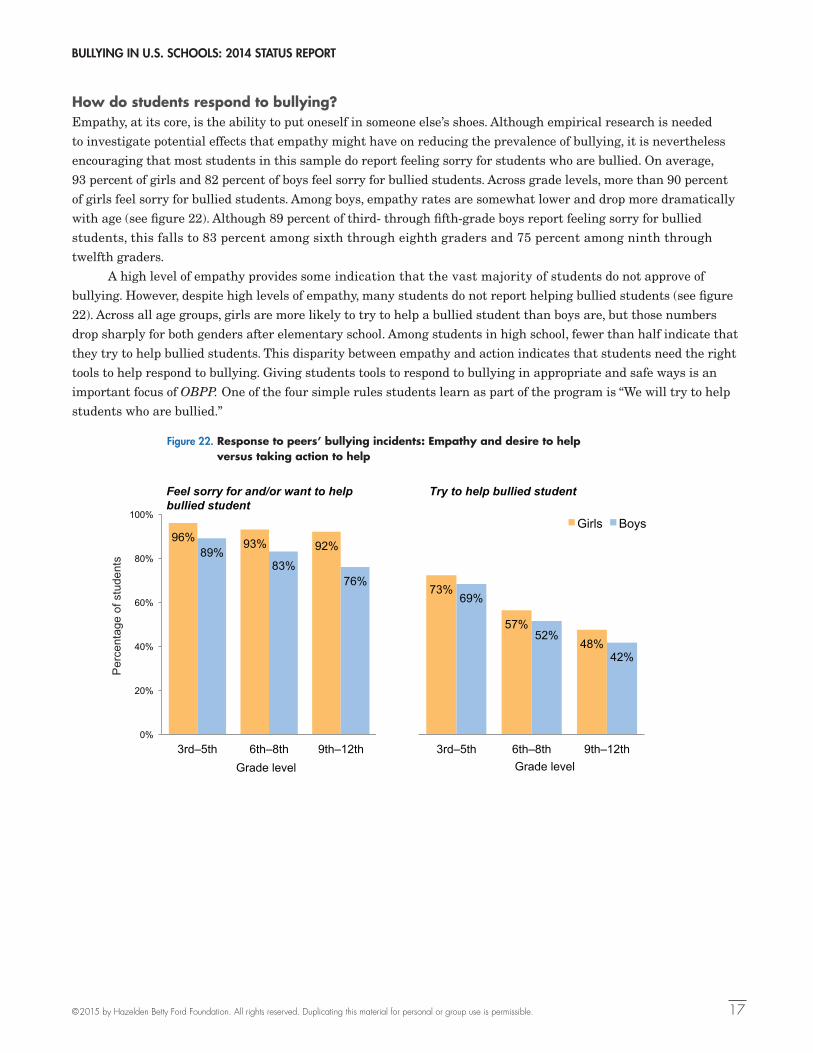
How do students respond to bullying?Empathy, at its core, is the ability to put oneself in someone else’s shoes. Although empirical research is needed
to investigate potential effects that empathy might have on reducing the prevalence of bullying, it is nevertheless
encouraging that most students in this sample do report feeling sorry for students who are bullied. On average,
93 percent of girls and 82 percent of boys feel sorry for bullied students. Across grade levels, more than 90 percent
of girls feel sorry for bullied students. Among boys, empathy rates are somewhat lower and drop more dramatically
with age (see figure 22). Although 89 percent of third- through fifth-grade boys report feeling sorry for bullied
students, this falls to 83 percent among sixth through eighth graders and 75 percent among ninth through
twelfth graders.
A high level of empathy provides some indication that the vast majority of students do not approve of
bullying. However, despite high levels of empathy, many students do not report helping bullied students (see figure
22). Across all age groups, girls are more likely to try to help a bullied student than boys are, but those numbers
drop sharply for both genders after elementary school. Among students in high school, fewer than half indicate that
they try to help bullied students. This disparity between empathy and action indicates that students need the right
tools to help respond to bullying. Giving students tools to respond to bullying in appropriate and safe ways is an
important focus of OBPP. One of the four simple rules students learn as part of the program is “We will try to help
students who are bullied.”
Figure 22. Response to peers’ bullying incidents: Empathy and desire to help versus taking action to help
96% 93% 92% 89% 83%
76%
0%
20%
40%
60%
80%
100%
3rd–5th 6th–8th 9th–12th Grade level
Feel sorry for and/or want to help bullied student
73%
57%
48%
69%
52%
42%
3rd–5th 6th–8th 9th–12th
Girls Boys
Grade level
Try to help bullied student
Figure 22. Response to peers’ bullying incidents: Empathy and desire to help versus taking action to help
95% 93% 92% 89% 83%
75%
0%
20%
40%
60%
80%
100%
3rd–5th 6th–8th 9th–12th Grade level
Feel sorry for and/or want to help bullied student
74%
53% 47%
69%
49%
40%
3rd–5th 6th–8th 9th–12th
Girls Boys
Grade level
Try to help bullied student
Per
cent
age
of s
tude
nts
BULLYING IN U.S. SCHOOLS: 2014 STATUS REPORT
©2015 by Hazelden Betty Ford Foundation. All rights reserved. Duplicating this material for personal or group use is permissible. 18
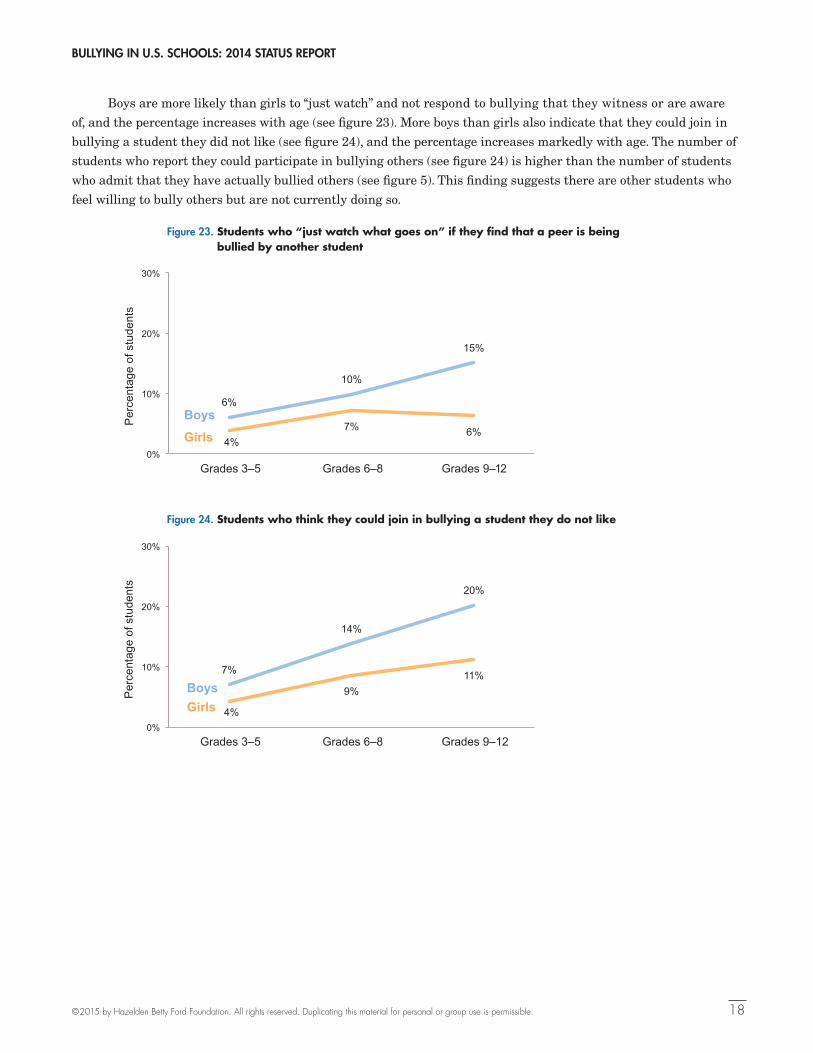
Boys are more likely than girls to “just watch” and not respond to bullying that they witness or are aware
of, and the percentage increases with age (see figure 23). More boys than girls also indicate that they could join in
bullying a student they did not like (see figure 24), and the percentage increases markedly with age. The number of
students who report they could participate in bullying others (see figure 24) is higher than the number of students
who admit that they have actually bullied others (see figure 5). This finding suggests there are other students who
feel willing to bully others but are not currently doing so.
Figure 23. Students who “just watch what goes on” if they find that a peer is being bullied by another student
Figure 24. Students who think they could join in bullying a student they do not like
Figure 23. Students who “just watch what goes on” if they find that a peer is being bullied by another student
6%
10%
15%
4% 7% 6%
0%
10%
20%
30%
Grades 3–5 Grades 6–8 Grades 9–12
Boys
Girls P
erce
ntag
e of
stu
dent
s
6%
10%
15%
4% 7% 6%
0%
10%
20%
30%
Grades 3–5 Grades 6–8 Grades 9–12
Boys
Girls
Per
cent
age
of s
tude
nts
Figure 24. Students who think they could join in bullying a student they do not like
7%
14%
20%
4%
9% 11%
0%
10%
20%
30%
Grades 3–5 Grades 6–8 Grades 9–12
Boys Girls
Per
cent
age
of s
tude
nts
7%
14%
20%
4%
9% 11%
0%
10%
20%
30%
Grades 3–5 Grades 6–8 Grades 9–12
Boys Girls
Per
cent
age
of s
tude
nts
BULLYING IN U.S. SCHOOLS: 2014 STATUS REPORT
©2015 by Hazelden Betty Ford Foundation. All rights reserved. Duplicating this material for personal or group use is permissible. 19
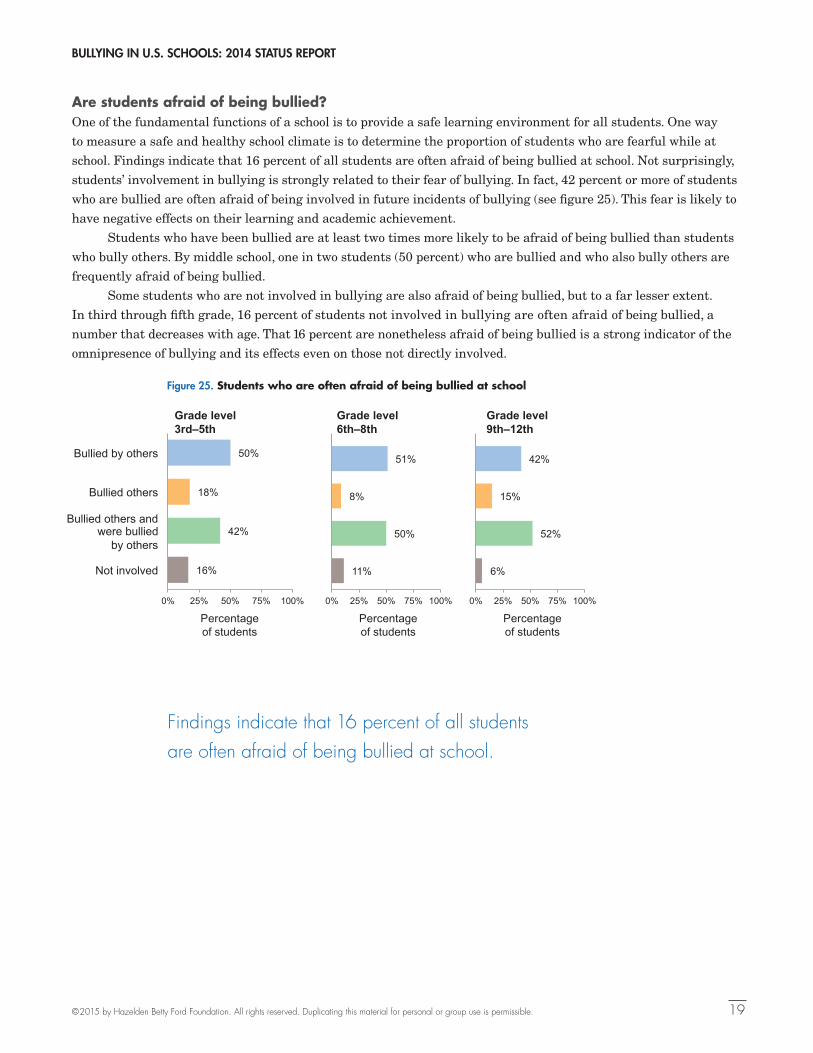
Figure 25. Students who are often afraid of being bullied at school
Are students afraid of being bullied?One of the fundamental functions of a school is to provide a safe learning environment for all students. One way
to measure a safe and healthy school climate is to determine the proportion of students who are fearful while at
school. Findings indicate that 16 percent of all students are often afraid of being bullied at school. Not surprisingly,
students’ involvement in bullying is strongly related to their fear of bullying. In fact, 42 percent or more of students
who are bullied are often afraid of being involved in future incidents of bullying (see fi gure 25). This fear is likely to
have negative effects on their learning and academic achievement.
Students who have been bullied are at least two times more likely to be afraid of being bullied than students
who bully others. By middle school, one in two students (50 percent) who are bullied and who also bully others are
frequently afraid of being bullied.
Some students who are not involved in bullying are also afraid of being bullied, but to a far lesser extent.
In third through fi fth grade, 16 percent of students not involved in bullying are often afraid of being bullied, a
number that decreases with age. That 16 percent are nonetheless afraid of being bullied is a strong indicator of the
omnipresence of bullying and its effects even on those not directly involved.
Findings indicate that 16 percent of all students are often afraid of being bullied at school.
50%
18%
42%
16%
0% 25% 50% 75% 100%
Bullied by others
Bullied others
Bullied others and were bullied
by others
Not involved
Grade level3rd–5th
Grade level6th–8th
Grade level9th–12th
51%
8%
50%
11%
0% 25% 50% 75% 100%
42%
15%
52%
6%
0% 25% 50% 75% 100%
50% 44%
36%
26% 17% 13%
0%
25%
50%
75%
100%
Grades 3–5 Grades 6–8 Grades 9–12
Teachers/ Other adults
Other students
Percentageof students
Percentageof students
Percentageof students
Percentage of students
Per
cent
age
of s
tude
nts
BULLYING IN U.S. SCHOOLS: 2014 STATUS REPORT
©2015 by Hazelden Betty Ford Foundation. All rights reserved. Duplicating this material for personal or group use is permissible. 20
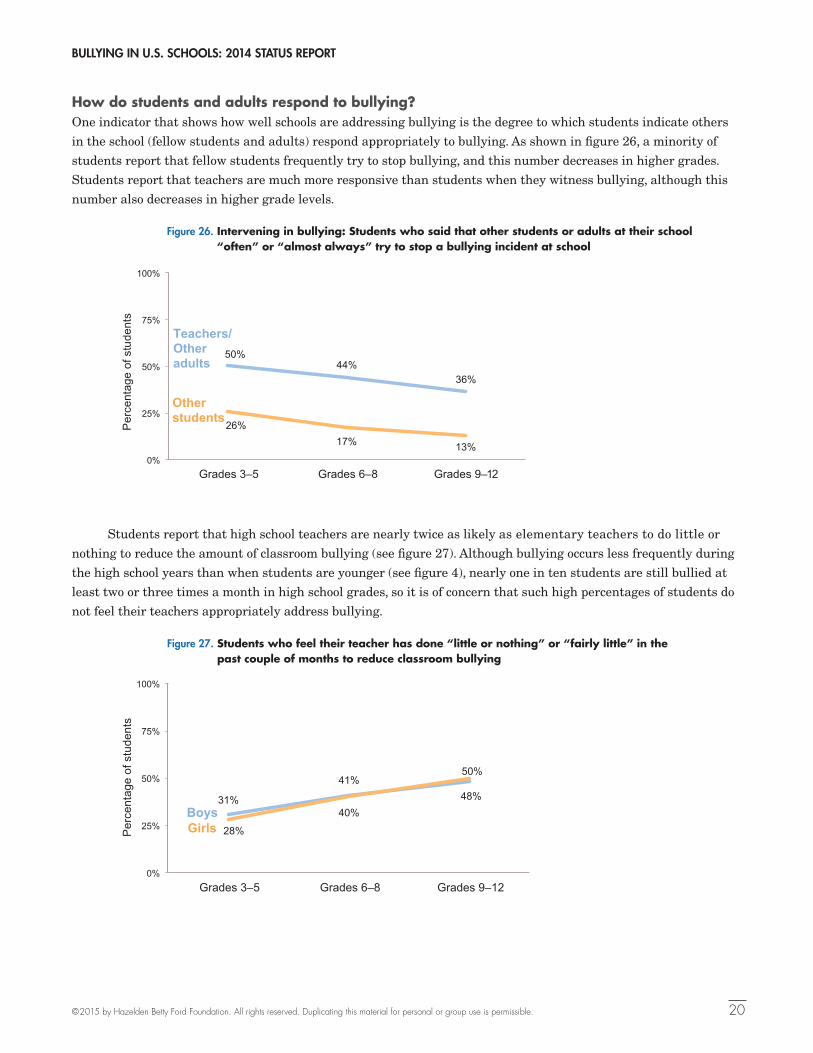
Students report that high school teachers are nearly twice as likely as elementary teachers to do little or
nothing to reduce the amount of classroom bullying (see fi gure 27). Although bullying occurs less frequently during
the high school years than when students are younger (see fi gure 4), nearly one in ten students are still bullied at
least two or three times a month in high school grades, so it is of concern that such high percentages of students do
not feel their teachers appropriately address bullying.
How do students and adults respond to bullying?One indicator that shows how well schools are addressing bullying is the degree to which students indicate others
in the school (fellow students and adults) respond appropriately to bullying. As shown in fi gure 26, a minority of
students report that fellow students frequently try to stop bullying, and this number decreases in higher grades.
Students report that teachers are much more responsive than students when they witness bullying, although this
number also decreases in higher grade levels.
Figure 27. Students who feel their teacher has done “little or nothing” or “fairly little” in the past couple of months to reduce classroom bullying
Figure 26. Intervening in bullying: Students who said that other students or adults at their school “often” or “almost always” try to stop a bullying incident at school
Figure 27. Students who feel their teacher has done “little ornothing” or “fairly little” in the past couple of months to
reduce classroom bullying
31%
41% 48%
28%
40%
50%
0%
25%
50%
75%
100%
Grades 3–5 Grades 6–8 Grades 9–12
Boys Girls P
erce
ntag
e of
stu
dent
s
50%
18%
42%
16%
0% 25% 50% 75% 100%
Bullied by others
Bullied others
Bullied others and were bullied
by others
Not involved
Grade level3rd–5th
Grade level6th–8th
Grade level9th–12th
51%
8%
50%
11%
0% 25% 50% 75% 100%
42%
15%
52%
6%
0% 25% 50% 75% 100%
50% 44%
36%
26% 17% 13%
0%
25%
50%
75%
100%
Grades 3–5 Grades 6–8 Grades 9–12
Teachers/ Other adults
Other students
Percentageof students
Percentageof students
Percentageof students
Percentage of students
Per
cent
age
of s
tude
nts
BULLYING IN U.S. SCHOOLS: 2014 STATUS REPORT
©2015 by Hazelden Betty Ford Foundation. All rights reserved. Duplicating this material for personal or group use is permissible. 21
THIS REPORT reviews key findings related to children’s self-reported
observations about the nature and prevalence of bullying across the United
States during the 2013–2014 school year. Some findings are worrisome but
others are more positive. These analyses indicate that bullying continues
to affect a great number of children in all age groups, with the highest
prevalence observed in third and fourth grades, where roughly 22 percent
of school children report that they are bullied two or three times or more per
month. Bullied students are more likely to dislike school and feel afraid of
being bullied than uninvolved students. Over 42 percent of bullied students
are often afraid of being bullied.
Cyberbullying, despite high media attention and elevated concerns in
our communities, is not as common as many other forms of bullying. In fact,
only 4 percent of boys and 6 percent of girls report being cyberbullied two
or three times a month or more. Although cyberbullying can be devastating
to those who experience it, the small number of children it affects compared
with other forms of bullying suggests it is important not to sensationalize
this phenomenon. Moreover, just 2 percent of all students who experienced a
single form of bullying report being bullied through cyber technology alone.
This very low percentage is supported by empirical research that has shown
that those who are bullied via cyber technology are very often also bullied by
more traditional means (Olweus 2012). These findings suggest that systematic
efforts to address traditional forms of bullying will have positive effects with
regard to cyberbullying.
Students who are bullied report that they are usually not the targets of
only one form of bullying, but are bullied in slightly more than three different
ways on average. The frequency with which these forms of bullying are
reported change depending on the students’ grade level. For instance, there
are four forms of bullying that are more likely among bullied girls in higher
grades than lower grades (verbal, rumors, sexual, and cyber) and three forms
that are more likely among bullied girls in lower grades compared with higher
grades (physical, threats, and damage). Boys also report that they are bullied
more in high school than elementary school grades for four types of bullying
(verbal, sexual, racial, and cyber). There are three types of bullying that affect
both genders more often in high school than in lower grades (verbal, sexual,
and cyber). These numbers showcase the complexity of bullying and how,
Bullying in U.S. Schools:Report Discussion
On average, 93 percent of girls and 82 percent of boys feel sorry for bullied students.
BULLYING IN U.S. SCHOOLS: 2014 STATUS REPORT
©2015 by Hazelden Betty Ford Foundation. All rights reserved. Duplicating this material for personal or group use is permissible. 22
despite the overall reduction in bullying behavior by high school, certain
forms of bullying are still prevalent and must be effectively addressed.
While just 17 percent of boys who are bullied and 11 percent of girls
who are bullied also report bullying others, this group of students is bullied
in more ways than students who report being bullied only. In addition
to their known risk for internalizing and externalizing problems, a large
proportion of these students report disliking school. These numbers suggest
that the school environment may be especially difficult for these students
and demonstrate a need for school personnel to adequately distinguish and
address the needs of these youth.
One of the positive trends to emerge from these analyses is the large
proportion of students who feel empathy toward students being bullied. On
average, 93 percent of girls and 82 percent of boys across all grade levels feel
sorry for bullied students. However, even though an overwhelming majority
of students empathize with bullied students, far fewer report actually
reaching out to help them. To teach students how to help other students
who are bullied, we need to provide them with the appropriate tools and
guidance. One of the best ways to help students help others, as well as to
reduce the overall prevalence of bullying, is to implement a schoolwide
anti-bullying program, such as the Olweus Bullying Prevention Program
(e.g., Olweus and Limber 2010). According to two recent, partly overlapping
meta-analyses reviewing the effects of anti-bullying programs throughout
the world (Ttofi and Farrington 2009, 2011), researchers noted that anti-
bullying programs are an effective way to reduce victimization, with an
expected reduction of 20 percent to 23 percent.
A good evidence-based anti-bullying program will have the power to
restructure and strengthen the school environment by teaching everyone
how to identify acts of bullying, how to react to bullying, and how to work
together to reduce opportunities and rewards for bullying behavior. The
results from this report show that bullying remains a major issue facing
a large number of our nation’s students and that further commitment is
needed from schools and communities around the country to work together
to systematically counteract bullying and make schools a safe place for all
students to learn.
One of the best ways to help students help others, as well as to reduce the overall prevalence of bullying, is to implement a schoolwide anti-bullying program.
For more information about the Olweus Bullying Prevention Program
or the Olweus Bullying Questionnaire, visit www.violencepreventionworks.org
or call Hazelden Publishing at 1-800-328-9000.
BULLYING IN U.S. SCHOOLS: 2014 STATUS REPORT
©2015 by Hazelden Betty Ford Foundation. All rights reserved. Duplicating this material for personal or group use is permissible. 23
Byrne, B. J. 1994. “Bullies and Victims in School Settings with Reference to Some Dublin
Schools.” Irish Journal of Psychology 15 (4): 574–86.
Cook, C. R., K. R. Williams, N. G. Guerra, T. E. Kim, and S. Sadek. 2010. “Predictors
of Bullying and Victimization in Childhood and Adolescence: A Meta-analytic
Investigation.” School Psychology Quarterly 25 (2): 65–83.
Faris, R., and D. Felmlee. 2011. “Status Struggles: Network Centrality and Gender
Segregation in Same- and Cross-Gender Aggression.” American Sociological Review
76 (1): 48–73.
Gini, G., and T. Pozzoli. 2013. “Bullied Children and Psychosomatic Problems: A Meta-
analysis.” Pediatrics 132: 720–29.
Harris, S., G. Petrie, and W. Willoughby. 2002. “Bullying among 9th Graders: An Exploratory
Study.” National Association of Secondary Schools Bulletin 86 (630): 3–14.
Haynie, D. L., T. Nansel, P. Eitel, A. D. Crump, K. Saylor, K. Yu, and B. Simons-Morton. 2001.
“Bullies, Victims, and Bully/Victims: Distinct Groups of At-Risk Youth.” Journal of
Early Adolescence 21 (1): 29–49.
Jimerson, S. R., S. M. Swearer, and D. L. Espelage. 2010. Handbook of School Bullying:
An International Perspective. New York: Routledge.
Klomek, A. B., F. Marrocco, M. Kleinman, L. S. Schonfeld, and M. S. Gould. 2007. “Bullying,
Depression, and Suicidality in Adolescents.” Journal of the American Academy of Child
and Adolescent Psychiatry 46 (1): 40–49.
Kyriakides, L., C. Kaloyirou, and G. Lindsay. 2006. “An Analysis of the Revised Olweus
Bully/Victim Questionnaire Using the Rasch Measurement Model.” British Journal
of Educational Psychology 76 (4): 781–801.
Lereya, S. T., W. E. Copeland, E. J. Costello, and D. Wolke. 2015. “Adult Mental Health
Consequences of Peer Bullying and Maltreatment in Childhood: Two Cohorts in
Two Countries.” Lancet Psychiatry 2 (6): 524–531.
Luxenberg, H., S. P. Limber, and D. Olweus. 2014. “Bullying in U.S. Schools: 2013 Status
Report.” Retrieved from www.violencepreventionworks.org/public/document/
obppbullyingtrends_2014_final.pdf.
Olweus, D. 1993. Bullying at School: What We Know and What We Can Do. New York:
Blackwell.
Olweus, D. 1996. The Revised Olweus Bully/Victim Questionnaire. Mimeo. Bergen, Norway:
Research Center for Health Promotion (HEMIL), University of Bergen.
Olweus, D. 2007. The Olweus Bullying Questionnaire. Center City, MN: Hazelden.
Bullying in U.S. Schools:References
BULLYING IN U.S. SCHOOLS: 2014 STATUS REPORT
©2015 by Hazelden Betty Ford Foundation. All rights reserved. Duplicating this material for personal or group use is permissible. 24
Olweus, D. 2010. “Understanding and Researching Bullying: Some Critical Issues.”
In Handbook of Bullying in Schools: An International Perspective, edited by
S. R. Jimerson, S. M. Swearer, and D. L. Espelage, 9–33. New York: Routledge.
Olweus, D. 2011. “Bullying at School and Later Criminality: Findings from Three Swedish
Community Samples of Males.” Criminal Behaviour and Mental Health 21: 151–56.
Olweus, D. 2012. “Cyber Bullying: An Overrated Phenomenon?” European Journal of
Developmental Psychology 9 (5): 520–38.
Olweus, D. 2013. “School Bullying: Development and Some Important Challenges.” Annual
Review of Clinical Psychology 9: 751–80.
Olweus, D., and S. P. Limber. 2010. “The Olweus Bullying Prevention Program:
Implementation and Evaluation over Two Decades.” In Handbook of Bullying in
Schools: An International Perspective, edited by S. R. Jimerson, S. M. Swearer, and D. L.
Espelage, 377–402. New York: Routledge.
Pellegrini, A. D. 2001. “Sampling Instances of Victimization in Middle School: A
Methodological Comparison.” In Peer Harassment in School: The Plight of the
Vulnerable and Victimized, edited by J. Juvonen and S. Graham, 125–44. New York/
London: The Guilford Press.
Radliff, K. M., J. E. Wheaton, K. Robinson, and J. Morris. 2012. “Illuminating the
Relationship between Bullying and Substance Use among Middle and High School
Youth.” Addictive Behaviors 37 (4): 569–72.
Reijntjes, A., J. H. Kamphuis, P. Prinzie, and M. J. Telch. 2010. “Peer Victimization and
Internalizing Problems in Children: A Meta-analysis of Longitudinal Studies.” Child
Abuse & Neglect 34 (4): 244–52.
Robers, S., J. Kemp, and J. Truman. 2013. Indicators of School Crime and Safety: 2012
(NCES 2013-036/NCJ 241446). Washington, DC: National Center for Education
Statistics, U.S. Department of Education, and Bureau of Justice Statistics, Office
of Justice Programs, U.S. Department of Justice.
Solberg, M., and D. Olweus. 2003. “Prevalence Estimation of School Bullying with the
Olweus Bully/Victim Questionnaire.” Aggressive Behavior 29 (3): 239–68.
Ttofi, M. M., and D. P. Farrington. 2009. “What Works in Preventing Bullying: Effective
Elements of Anti-bullying Programmes.” Journal of Aggression, Conflict and Peace
Research 1 (1): 13–24.
Ttofi, M. M., and D. P. Farrington. 2011. “Effectiveness of School-Based Programs to
Reduce Bullying: A Systematic and Meta-analytic Review.” Journal of Experimental
Criminology 7 (1): 27–56.
Ttofi, M. M., D. P. Farrington, F. Lösel, and R. Loeber. 2011a. “Do the Victims of School
Bullies Tend to Become Depressed Later in Life? A Systematic Review and Meta-analysis
of Longitudinal Studies.” Journal of Aggression, Conflict and Peace Research 3: 63–73.
Ttofi, M. M., D. P. Farrington, F. Lösel, and R. Loeber. 2011b. “The Predictive Efficiency
of School Bullying versus Later Offending: A Systematic/Meta-analytic Review of
Longitudinal Studies.” Criminal Behaviour and Mental Health 21: 80–89.
U.S. Department of Education. 2015. “Student Reports of Bullying and Cyber-Bullying:
Results from the 2013 School Crime Supplement to the National Crime Victimization
Survey.” Available from http://nces.ed.gov/pubs2015/2015056.pdf.
BULLYING IN U.S. SCHOOLS: 2014 STATUS REPORT
©2015 by Hazelden Betty Ford Foundation. All rights reserved. Duplicating this material for personal or group use is permissible. 25
Since 2007, Professional Data Analysts Inc. (PDA) has been providing
reports for a fee to schools and school districts that use the Olweus
Bullying Prevention Program about their prevalence of bullying recorded
using the Olweus Bullying Questionnaire. PDA also received a small fee
from Hazelden Publishing for its work on this report.
For more information about the Olweus Bullying Prevention Program or
the Olweus Bullying Questionnaire, visit www.violencepreventionworks.org or call 1-800-328-9000.
Bullying in U.S. Schools:Declaration of Interests