bumrungrad hospital public company...
TRANSCRIPT

PG.1
Bumrungrad Hospital Public Company Limited
6 March 2015
Analyst Meeting No.1/2015 (4Q14 and 2014 Results Update)

PG.2
Disclaimer • The information contained in this presentation is for information purposes only and does not constitute an offer or invitation to sell or
the solicitation of an offer or invitation to purchase or subscribe for any securities of Bumrungrad Hospital Public Company Limited (the
"Company") in any jurisdiction nor should it or any part of it form the basis of, or be relied upon in connection with, any contract or
commitment whatsoever.
• This presentation is being communicated only to persons who have professional experience in matters relating to investments and/or
to persons to whom it is lawful to communicate it under the laws of applicable jurisdictions. Other persons should not rely or act upon
this presentation or any of its contents.
• Certain information and statements made in this presentation contain the Company's forward-looking statements. All forward-looking
statements are the Company's current expectation of future events and are subject to a number of factors that could cause actual
results to differ materially from those described in the forward-looking statements. Prospective investors should take care with respect
to such statements and should not place undue reliance on any such forward-looking statements.
• This presentation has been prepared by the Company solely for the use at this presentation. The information in this presentation has
not been independently verified. No representation, warranty, express or implied, is made as to, and no reliance should be placed on,
the fairness, accuracy, completeness or correctness of the information and opinions in this presentation. None of the Company, any of
its affiliates or any of their respective agents, advisors or representatives, shall have any liability (in negligence or otherwise) for any
loss or damage howsoever arising from any use of this presentation or its contents or otherwise arising in connection with this
presentation. The information presented or contained in this presentation is current as of the date hereof and is subject to change
without notice and its accuracy is not guaranteed. None of the Company, any of its affiliates or any of their respective agents, advisors
or representatives, makes any undertaking to update any such information subsequent to the date hereof.
• This presentation should not be construed as legal, tax, investment or other advice. No part of this presentation shall be relied upon
directly or indirectly for any investment decision-making or for any other purposes. Prospective investors should undertake their own
assessment with regard to any investment and should obtain independent advice on any such investment’s suitability, inherent risks
and merits and any tax, legal and accounting implications which it may have for them.
• Certain data in this presentation were obtained from various external data sources, and none of the Company, any of its affiliates or
any of their respective agents, advisors or representatives have verified such data with independent sources. Accordingly, the Company
makes no representation as to the accuracy or completeness of those data, and such data involve risks and uncertainties and are
subject to change based on various factors.

PG.3
Overview
• Outpatient and inpatient volumes advanced 14.9% and 19.8%, respectively, in 4Q14 compared with 4Q13, with most of the increase due to volumes contributed by the UBSD acquisition, and strong growth in international volumes. Excluding UBSD, outpatient and inpatient volumes grew 3.7% and 7.4%, respectively. International outpatient volumes increased 8.2%, while inpatient volumes jumped 12.7%. Impacted by the significantly lower intensity services provided by UBSD compared to those provided by the Company, revenue intensity declined 7.0% and 11.3% for outpatient and inpatient services, respectively. Revenue intensity, excluding UBSD, declined 0.3% for inpatient services and rose 2.1% for outpatient services. The combined results of the above resulted in outpatient service revenues advancing 14.4% while inpatient service revenues grew 13.9%.
Operational Update
Financial Performance
• Bangkok - Obtained EIA Approval for Petchburi project
• Thailand - Continuing Bumrungrad network development
• International - Mongolia, developing and improving the capability of UBSD
Updates and Ongoing
Focus
4Q14 growth 2014 growth
Total revenues 13.8% 8.6%
EBITDA 16.9% 12.4%
Net profit 9.9% 8.3%

PG.4
Agenda
Strategy
Operational Update
Financial Performance

PG.5
Strategy
• Campus expansion
• Doctor recruitment in subspecialties
• Advanced technology
• Skilled work force
Bumrungrad International
Hospital
• Development of the Bumrungrad Network • Expand into a new market segment – 2nd Brand
Thailand
• Evolve UB Songdo into a regional referral hospital
• Review of selective opportunities in existing referral markets
International

PG.6
Strategy (Detail)
• Opened 5 floors in Bumrungrad International Clinic
• Renovate and expand clinics in Bumrungrad International Hospital
Clinics
• Added 18 ICU beds and 58 ward beds in Bumrungrad International Hospital building
• Renovate and expand ancillary services Inpatient
• Bought 8,200 sq. meters of land on Petchburi Road.
• EIA approval received 2nd Campus
• Bought 6,178 sq. meters of land on Sukhumvit Soi 1 to initially develop a parking structure
• Grand opening of Bumrungrad Tower on 6 March 2015 for employee houses and back office functions
Acquire Additional Capacity
• Acquired controlling interest in UB Songdo hospital International
Estimated Capital Investment (Million THB)
Y15 Y16 Y17 Y18 Total
1,598 3,231 4,550 392 9,771
PG.7
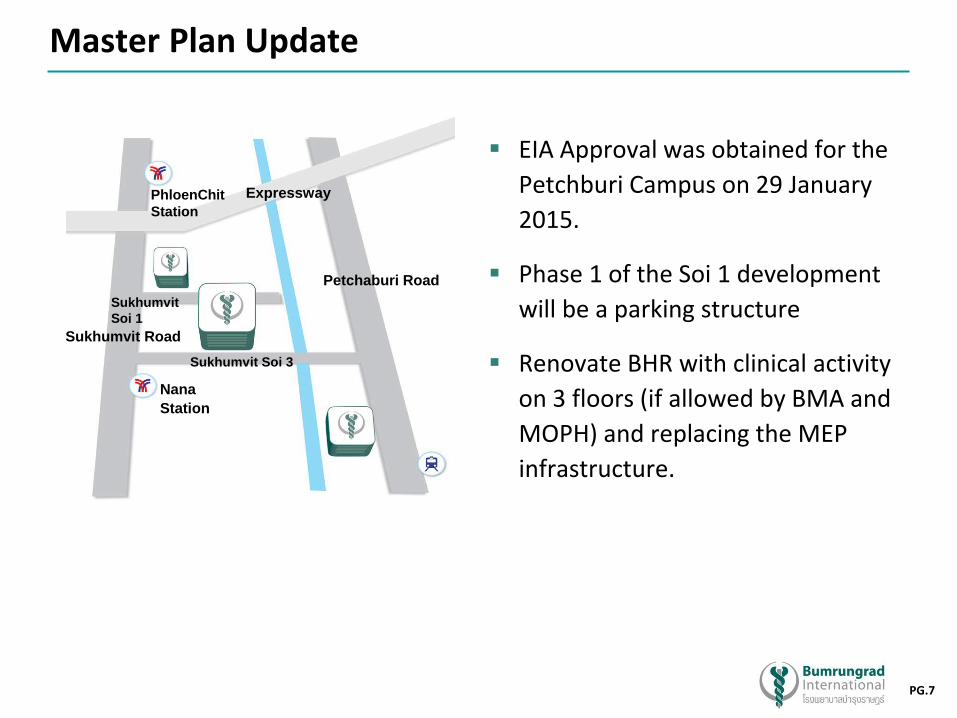
Master Plan Update
EIA Approval was obtained for the
Petchburi Campus on 29 January
2015.
Phase 1 of the Soi 1 development
will be a parking structure
Renovate BHR with clinical activity
on 3 floors (if allowed by BMA and
MOPH) and replacing the MEP
infrastructure.
Sukhumvit
Soi 1
Petchaburi Road
Sukhumvit Soi 3
Nana Station
Sukhumvit Road
Expressway PhloenChit
Station

PG.8
Current Status – Petchburi Project
• EIA Approval was obtained for the Petchburi Campus on 29 January 2015.
• The EIA Approval allows:
• 100% FAR: 8,204 x 8 = 65,632 m2
• 19.2% Bonus FAR = 12,601 m2
• Maximum FAR = 78,233 m2
• Construction Area is likely to be around 85,000 m2
• Construction expected to start in November 2015

PG.9
Strategy
Operational Update
Financial Performance
Agenda

PG.10
Outpatient Visits Volume Trend
4th Quarter: Outpatient volumes advanced 14.9% in 4Q14 compared with 4Q13, with most of the increase due to volumes contributed by the UBSD acquisition, and strong growth in international volumes. Excluding UBSD, outpatient volumes grew 3.7% in 4Q14.
YTD Dec: Outpatient volumes advanced 7.5% in 2014 compared with 2013 as a result of volumes added by the UBSD acquisition. Excluding UBSD volumes, outpatient volumes declined 1.5% in 2014.
Visits
Average Visits per Day
0.1% 7.5%
3,017 3,021 3,021 3,021
3,249
2,976
0
800
1,600
2,400
3,200
4,000
2012 2013 2014
(exc. HHE)
1.5%
3,004 2,958 3,069 3,022 3,038 2,958 2,958 2,820
3,348 3,424 3,397 3,068
0
1,000
2,000
3,000
4,000
4Q 1Q 2Q(inc. HHE)
3Q(inc. HHE)
4Q(inc. HHE)
4Q(exc.HHE)
2012 2013 2014
Visits
Average Visits per Day
8.1% 10.8% 1.5% 12.7% 3.7% 14.9%

PG.11
Admissions Volume Trend
Admissions
Average Admissions per Day
11.2%
85 84 84 84
94 86
0
20
40
60
80
100
2012 2013 2014
1.0%
4th Quarter: Inpatient volumes advanced 19.8% in 4Q14 compared with 4Q13, with most of the increase due to volumes contributed by the UBSD acquisition, and strong growth in international volumes. Excluding UBSD, inpatient volumes grew 7.4% in 4Q14.
YTD Dec: Inpatient volumes advanced 11.2% in 2014 compared with 2013 as a result of volumes added by the UBSD acquisition. Excluding UBSD volumes, inpatient volume grew 1.8% in 2014.
1.8%
(exc. HHE)
84 83 86 80
89 83 83
84 91
101 99 89
0
20
40
60
80
100
120
4Q 1Q 2Q(inc.HHE)
3Q(inc.HHE)
4Q(inc.HHE)
4Q(exc.HHE)
2012 2013 2014
Admissions
Average Admissions per Day
2.0% 1.9% 13.1% 13.7% 7.4% 19.8%

PG.12
Average Daily Census Volume Trend
ADC
Average Daily Census
12.2%
379
370 370 370
415
371
340
360
380
400
420
2012 2013 2014
(exc. HHE)
2.4%
4th Quarter: ADC advanced 19.7% in 4Q14 compared with 4Q13, with most of the increase due to volumes contributed by the UBSD acquisition, and strong growth in international volumes. Excluding UBSD, ADC grew 3.7% in 4Q14. YTD Dec: ADC advanced 12.2% in 2014 compared with 2013, with most of the increase due to volumes contributed by the UBSD acquisition. Excluding UBSD, ADC grew 0.3% in 2014.
ADC
Average Daily Census
378 368
381
356 374 368 368
374
406
438 440
381
300
320
340
360
380
400
420
440
460
4Q 1Q 2Q(inc.HHE)
3Q(inc.HHE)
4Q(inc.HHE)
4Q(exc.HHE)
2012 2013 2014
2.7% 1.9% 14.1% 17.3% 3.7% 19.7%
0.3%

PG.13
Revenue per episode reflects an increase from the
1st Jan 2014 price adjustment.
OPD Revenue intensity :
4th Quarter YTD Dec
Including HHE Consolidated FS -7.0% -8.9%
Excluding HHE Consolidated FS 2.1% -1.7%
OPD Revenue Intensity
Bt
Revenue per Visit
6,560
7,428 7,428 7,428 7,341
7,891
4,000
5,000
6,000
7,000
8,000
9,000
2012 2013 2014(exc. HHE) (inc. HHE)
Bt
Revenue per Visit
7,192
7,411 7,459 7,652 7,652 7,531
6,982 7,254
7,624
8,289
4,000
5,000
6,000
7,000
8,000
9,000
1Q 2Q(inc.HHE)
3Q(inc.HHE)
4Q(inc.HHE)
4Q(exc.HHE)
2012 2013 2014
5.8% 4.7% 8.3% 0.4%
6.2%
2.8%
13.2% 1.2%

PG.14
IPD Revenue Intensity
Revenue per episode reflects an increase from the
1st Jan 2014 price adjustment.
IPD Revenue intensity per admission:
4th Quarter YTD Dec
Including HHE Consolidated FS -11.3% -6.7%
Excluding HHE Consolidated FS -0.3% 1.7%
Bt
Revenue per Admission
220,001
241,340 241,340 241,340
242,410 262,366
0
50,000
100,000
150,000
200,000
250,000
300,000
350,000
2012 2013 2014(exc. HHE) (inc. HHE)
Bt
Revenue per Admission
233,385 246,372 234,988 251,356 251,356
263,996
238,899 231,289
238,959 263,404
0
50,000
100,000
150,000
200,000
250,000
300,000
350,000
1Q 2Q(inc.HHE)
3Q(inc.HHE)
4Q(inc.HHE)
4Q(exc.HHE)
2013 2014
3.0% 13.1% 4.8% 4.9%
8.7%
1.6%
9.7% 0.4%

PG.15
Volume Contribution by Nationality
Revenue Contribution by Nationality
International Breakdown
• For 4Q14: Revenues by market segment international patients
accounted for 63.2% of the total in 4Q14, with the remaining
36.8% from Thai patients, reflecting a decrease in the 39.1%
from Thai patients in 4Q13, and the noted improvement of the
international business.
• 2014 Top 5 revenue contribution by Non-Thai Nationalities
Myanmar 8%
UAE 7%
Oman 7%
USA 5%
Cambodia 3%
62% 61% 60% 61% 59% 62% 60% 63%
38% 39% 40% 39% 41% 38% 40% 37%
0%
20%
40%
60%
80%
100%
1Q13 2Q13 3Q13 4Q13 1Q14 2Q14 3Q14 4Q14
International Thai
47% 47% 46% 47% 44% 52% 52% 53%
53% 53% 54% 53% 56% 48% 48% 47%
0%
20%
40%
60%
80%
100%
1Q13 2Q13 3Q13 4Q13 1Q14 2Q14 3Q14 4Q14
International Thai

PG.16
Revenue Breakdown
Inpatient vs. Outpatient (% of revenue) Method of Payment (% of revenue)
Y2014
• 4Q14 Revenue growth:
Outpatient revenue increased by 14.4% y-o-y
Inpatient revenue increased by 13.9% y-o-y
• Self-pay remains the primary method of payment
48% 47% 48% 48% 51% 48% 48% 48%
52% 53% 52% 52% 49% 52% 52% 52%
0%
20%
40%
60%
80%
100%
1Q13 2Q13 3Q13 4Q13 1Q14 2Q14 3Q14 4Q14
Inpatient Outpatient
Corporate Contracts - Domestic
9%
Corporate Contracts -
Intl 8%
Self-pay 69%
Insurance 14%

PG.17
Agenda
Strategy
Operational Update
Financial Performance

PG.18
Revenue from Hospital Operations
Revenue from Hospital Operations (THB mm)
3,641
14,251
4,166
15,571
0
4,000
8,000
12,000
16,000
4th Quarter YTD Dec
Y2013 Y20149.3%
14.4%
• 2014: Revenues from hospital operations were Baht 15,571 million for
2014, a 9.3% improvement year-over-year from Baht 14,251 million in
2013. Outpatient and inpatient volumes advanced 7.5% and 11.2%,
respectively, in 2014 compared with 2013 as a result of volumes
added by the UBSD acquisition. Excluding UBSD volumes, outpatient
volumes declined 1.5% in 2014 while inpatient volume grew 1.8% in
2014, both impacted by the ongoing political environment in Thailand
that began in 1Q14 and continued to contribute to weak volumes and
lower revenue intensity, especially through 2Q14. Volumes from the
international market segment were significantly more impacted than
volumes from the Thai and expat market segments during this period,
although international volumes progressively recovered after 2Q14
and exhibited strong growth in 4Q14. Thai volumes ended 2014 with a
2.6% increase in admissions and a 1.2% decrease in outpatient visits,
while international volumes, excluding UBSD, slightly increased 0.9%
in admissions with a 1.9% decrease in outpatient visits year-over-year.
Impacted by the significantly lower intensity services provided by
UBSD compared to the Company’s, and to a lesser degree the drop in
international volumes and elective procedures caused by the unstable
Thailand political environment, revenue intensity decreased by 8.9%
and 6.7% for outpatient and inpatient services, respectively. Revenue
intensity, excluding UBSD, decreased 1.7% for outpatient services,
while inpatient services intensity improved 3.1% on a patient-day
basis and 1.7% on an admission basis. The combined results of the
above resulted in outpatient service revenues advancing 6.3% while
inpatient service revenues grew by 11.7%.
• 4Q14: The Company reported Revenues from hospital operations of Baht
4,166 million, a 14.4% improvement year-over-year from Baht 3,641
million in 4Q13. Outpatient and inpatient volumes advanced 14.9% and
19.8%, respectively, in 4Q14 compared with 4Q13, with most of the
increase due to volumes contributed by the UBSD acquisition, and strong
growth in international volumes. Excluding UBSD, outpatient and
inpatient volumes grew 3.7% and 7.4%, respectively. International
outpatient volumes increased 8.2%, while inpatient volumes jumped
12.7%. Impacted by the significantly lower intensity services provided by
UBSD compared to those provided by the Company, revenue intensity
declined 7.0% and 11.3% for outpatient and inpatient services,
respectively. Revenue intensity, excluding UBSD, declined 0.3% for
inpatient services and rose 2.1% for outpatient services. The combined
results of the above resulted in outpatient service revenues advancing
14.4% while inpatient service revenues grew 13.9%.

PG.19
EBITDA and EBITDA Margin
EBITDA (THB mm)
EBITDA Margin
27.4% 27.7% 28.0% 28.6%
20.0%
22.0%
24.0%
26.0%
28.0%
30.0%
32.0%
4th Quarter YTD Dec
Y2013 Y2014
16.9%
12.4%
1,011
4,016
1,182
4,516
0
600
1,200
1,800
2,400
3,000
3,600
4,200
4,800
4th Quarter YTD Dec
Y2013 Y2014
• 4Q14: Cost of hospital operations (including Depreciation and amortization) was Baht 2,574 million for 4Q14, or 14.2% more year-over-year from Baht 2,253 million in 4Q13, compared to the 14.4% growth in Revenues from hospital operations. Administrative expenses (including Depreciation and amortization) were Baht 757 million in 4Q14, or 3.5% more than Baht 732 million in 4Q13. The small percentage increase in Administrative expenses was mostly due to Baht 27 million increase in repairs and maintenance expense, Baht 26 million associated with a physical inventory adjustment, and Baht 19 million in additional software support and maintenance offset by a Baht 46 million reduction in Depreciation and amortization associated with the revised estimated useful lives of certain assets in 4Q13, and Baht 11 million decrease in Bad debt expense, as a result of additional reserves taken in 4Q13. EBITDA grew 16.9% year-over-year from Baht 1,011 million in 4Q13 to Baht 1,182 million in 4Q14, with an EBITDA margin of 28.0% in 4Q14 compared to 27.4% in 4Q13.
• 2014: Cost of hospital operations (including Depreciation and amortization) was Baht 9,496 million for 2014, or 7.5% more year-over-year from Baht 8,836 million in 2013, compared to the 9.3% growth in Revenues from hospital operations. The percentage of Cost of hospital operations to Revenues from hospital operations improved from 62.0% in 2013 to 61.0% in 2014. Administrative expenses (including Depreciation and amortization) were Baht 2,806 million in 2014, increasing 11.0% from Baht 2,527 million in 2013. This change included Baht 74 million in additional repair and maintenance expense, Baht 69 million in donations to support nurse recruitment, Baht 43 million in inflationary increases in staff cost, Baht 29 million in Depreciation and amortization associated with the campus expansion and revised estimated useful lives of certain assets, and Baht 20 million more in software support and maintenance. EBITDA grew 12.4% year-over-year from Baht 4,016 million in 2013 to Baht 4,516 million in 2014, with the EBITDA margin advancing to 28.6% in 2014 compared with 27.7% in 2013.

PG.20
Net Profit (THB mm)
Diluted EPS (THB)
Net Profit Margin
Net Profit, Net Profit Margin and Diluted EPS
17.2%17.2%16.8%
16.2%
12.0%
14.0%
16.0%
18.0%
20.0%
4th Quarter YTD Dec
Y2013 Y2014
• 4Q14 : Net profit for 4Q14 grew 9.9% to Baht 689 million from Baht 626 million in 4Q13, with Net profit margin at 16.2% in 4Q14 compared to 16.8% in 4Q13.The change in Net profit margin was due to a decrease in capitalized interest expense associated with the campus expansion caused by the full Y2013 amount recorded in 4Q13, versus monthly recording in Y2014. Excluding this variance, Net profit margin for 2013 would have been 15.0%.Diluted EPS increased at the same rate as Net profit to Baht 0.79 from Baht 0.72 in 4Q13.
• 2014 : Net profit advanced 8.3% to Baht 2,730 million in 2014 from Baht 2,521 million in 2013, with Net profit margin at 17.2% for both 2014 and 2013. Diluted EPS increased at the same rate as Net profit to Baht 3.15 from Baht 2.91 in 2013.
626
2,521
689
2,730
0
500
1,000
1,500
2,000
2,500
3,000
4th Quarter YTD Dec
Y2013 Y2014
9.9%
8.3%
0.72
2.91
0.79
3.15
0.00
0.40
0.80
1.20
1.60
2.00
2.40
2.80
3.20
4th Quarter YTD Dec
2013 2014
9.9%
8.3%

PG.21
Leverage x Interest Coverage
x
Net Debt to EBITDA
x
Net Debt to Equity
x
** *
0.2
0.6
(0.1)
0.2
0.0
(0.25)
0.00
0.25
0.50
0.75
2010 20112012
2013 2014
0.4
1.3
(0.3)
0.5
0.1
(0.50)
0.00
0.50
1.00
1.50
2010 2011
2012
2013 2014
35.9
14.9 13.8 16.4
18.8
0
10
20
30
40
2010 2011 2012 2013 2014
• As a result of the increase in Cash and cash equivalents, Net debt to equity improved to 0.0x as at 31 December 2014 from 0.2x as at 31 December 2013.
• After adding back the 2014 and 2013 capitalized interest expense related to the campus expansion of Baht 55 million and Baht 97 million, respectively, the Company’s Interest coverage ratio improved to 18.8x in 2014 from 16.4x in 2013, due to higher EBITDA in 2014 compared to 2013.
**
*Interest expense related to the purchase of common shares of Bangkok Chain Hospital PCL (doing business as "Kasemrad Hospital Group") to calculate interest coverage ratio was Baht 111 million based on remaining days after the transaction settled. Assuming this interest expense was incurred for the full year, interest expense from this transaction would be Baht 140 million and interest coverage ratio will be 12.9x **After adding back the 2014 and 2013 capitalized interest expense related to the campus expansion.
Note: Net debt excludes fixed deposits with a maturity exceeding three months but not more than one year which are reported as Short-term investments of Baht 1,922 million in 2014 and Baht 2,718 million in 2013.

PG.22
Q & A