bund removal to re-establish tidal flow, remove aquatic
TRANSCRIPT
RESEARCH ARTICLE
Bund removal to re-establish tidal flow,
remove aquatic weeds and restore coastal
wetland services—North Queensland,
Australia
Brett N. AbbottID1*, Jim Wallace1,2, David M. Nicholas1,3, Fazlul Karim4, Nathan
J. Waltham2
1 CSIRO Land and Water, Australian Tropical Science and Innovation Precinct, Townsville, Australia,
2 Centre for Tropical Water & Aquatic Ecosystem Research (TropWATER), James Cook University,
Townsville, Australia, 3 Independent Consultant, Townsville, Australia, 4 CSIRO Land and Water, Black
Mountain Laboratories, Canberra, Australia
Abstract
The shallow tidal and freshwater coastal wetlands adjacent to the Great Barrier Reef lagoon
provide a vital nursery and feeding complex that supports the life cycles of marine and fresh-
water fish, important native vegetation and vital bird habitat. Urban and agricultural develop-
ment threaten these wetlands, with many of the coastal wetlands becoming lost or changed
due to the construction of artificial barriers (e.g. bunds, roads, culverts and floodgates).
Infestation by weeds has become a major issue within many of the wetlands modified
(bunded) for ponded pasture growth last century. A range of expensive chemical and
mechanical control methods have been used in an attempt to restore some of these coastal
wetlands, with limited success. This study describes an alternative approach to those meth-
ods, investigating the impact of tidal reinstatement after bund removal on weed infestation,
associated changes in water quality, and fish biodiversity, in the Boolgooroo lagoon region
of the Mungalla wetlands, East of Ingham in North Queensland. High resolution remote
sensing, electrofishing and in-water logging was used to track changes over time– 1 year
before and 4 years after removal of an earth bund. With tides only penetrating the wetland a
few times yearly, gross changes towards a more natural system occurred within a relatively
short timeframe, leading to a major reduction in infestation of olive hymenachne, water hya-
cinth and salvina, reappearance of native vegetation, improvements in water quality, and a
tripling of fish diversity. Weed abundance and water quality does appear to oscillate how-
ever, dependent on summer rainfall, as changes in hydraulic pressure stops or allows tidal
ingress (fresh/saline cycling). With an estimated 30% of coastal wetlands bunded in the
Great Barrier Reef region, a passive remediation method such as reintroduction of tidal flow
by removal of an earth bund or levee could provide a more cost effective and sustainable
means of controlling freshwater weeds and improving coastal water quality into the future.
PLOS ONE | https://doi.org/10.1371/journal.pone.0217531 January 24, 2020 1 / 33
a1111111111
a1111111111
a1111111111
a1111111111
a1111111111
OPEN ACCESS
Citation: Abbott BN, Wallace J, Nicholas DM,
Karim F, Waltham NJ (2020) Bund removal to re-
establish tidal flow, remove aquatic weeds and
restore coastal wetland services—North
Queensland, Australia. PLoS ONE 15(1):
e0217531. https://doi.org/10.1371/journal.
pone.0217531
Editor: Judi Hewitt, University of Waikato, NEW
ZEALAND
Received: May 9, 2019
Accepted: January 2, 2020
Published: January 24, 2020
Copyright: © 2020 Abbott et al. This is an open
access article distributed under the terms of the
Creative Commons Attribution License, which
permits unrestricted use, distribution, and
reproduction in any medium, provided the original
author and source are credited.
Data Availability Statement: All relevant data are
available from figshare at 10.6084/m9.figshare.
8104973.
Funding: This research was funded by the
Australian government as part of national
biodiversity funding through the Department of
Sustainability, Environment, Water, Population and
Communities (SEWPaC) – Project: 1173.2
Mungalla: Revegetation & restoration. The funders
had no role in study design, data collection and

Introduction
Coastal floodplains around the world have been modified for human gain, most notably being
hydrologically altered either totally or partially reducing connectivity between floodplains and
coastal areas [1, 2]. Floodplain, coastal tidal and freshwater wetlands are essential habitat
because they provide important biodiversity, hydrological, cultural and economic goods and
services [3–5]. However, these wetlands are under great pressure due to urban and industrial
development [6, 7] or agricultural and grazing land expansion, with many coastal wetlands
becoming lost due to the construction of artificial barriers (e.g. bunds, roads, culverts and
floodgates). These have stopped or reduced tidal flushing, which has negatively impacted aes-
thetic and ecological values [8]. The widespread degradation of coastal wetlands has led to
major shifts in species assemblages and declines in aquatic species productivity. In response,
there has been increased effort to rehabilitate coastal wetlands by removing these artificial bar-
riers [9, 10], and provide protection and restoration of coastal wetlands [11]. The ultimate goal
is to improve ecosystem services including their connectivity and functionality as productive
fish habitat [12, 13] and to deliver opportunities for carbon sequestration and storage [14, 15].
The coastal wetlands of north Queensland contain unique and valuable biodiversity at the
interface between two World Heritage areas; the Great Barrier Reef and Australia’s tropical
rainforests [16, 17]. These wetlands are important ecological assets with significant cultural
and economic values [18]. In their natural state they provide habitat for native plants, animals
and migratory birds as well as potential water quality improvement and hydrology regulatory
functions [19–21]. The aboriginal peoples of Australia associate great cultural value to wet-
lands [22, 23], which also have commercial and recreational value [24, 25]. However, many of
the wetlands along the north Queensland coast, and the services they provide, have been lost;
for example, it has been estimated that between 60 and 90% of freshwater and saline wetlands
have vanished in favour of rural and urban development [6, 26, 27]. Of the wetlands that
remain, many are degraded via a combination of earth bunding, to exclude seawater and
reclaim land for pasture [28–30], upstream agricultural use (grazing and sugar cane produc-
tion) which leaches ecologically damaging nutrients and sediments [31, 32], and extensive
aquatic invasive weed chokes [33, 34] which contributes to hypoxic conditions and fish kills
[35, 36].
The Mungalla wetlands east of Ingham, on the north Queensland coast, are characteristic of
the many degraded intertidal wetlands adjacent to the Great Barrier Reef lagoon [33]. The deg-
radation began after an earth bund was constructed in the mid-1940s, initially to provide
access across the wetlands [37], which excluded seawater and created a ponded pasture for
grazing [22]. A short time later para grass (Urochloa mutica) was introduced into the freshwa-
ter ponded area, which formed above the bund. Para grass was introduced into Queensland in
1884 for improving river bank stabilization [38] and has been used as ponded pasture in
bunded areas of coastal marine plains since artificial ponding for grazing started in Queens-
land in the 1930’s [39]. More recently two other ponded pasture species have been introduced
—olive hymenachne (Hymenachne amplexicaulis) and Aleman grass (Echinochloa polysta-chya). These two species were introduced into Queensland in 1988 [40] despite apparent warn-
ing of possible weedy invasion by the Queensland Environmental Protection Agency [41, 42].
Subsequently the two grasses have been recognized regionally as weeds, with olive hyme-
nachne being declared a weed of national significance (WONS) 10 years after release [43].
Aside from the pasture introductions, two other nationally declared weeds are present in the
wetlands, salvinia (Salvinia molesta), and water hyacinth (Eichhornia crassipes), both of which
are spread by spore/seed or asexually through fragmentation. Weed growth and expansion
into the wetland was exacerbated by Palm Creek carrying nutrients downstream from a large
Bund removal to re-establish tidal flow, remove aquatic weeds and restore coastal wetland services
PLOS ONE | https://doi.org/10.1371/journal.pone.0217531 January 24, 2020 2 / 33
analysis, decision to publish, or preparation of the
manuscript.
Competing interests: The authors have declared
that no competing interests exist.
area of sugar cane and a sugar mill [33]. In response, the Mungalla Wetland Management
Strategy [44] prescribed weed control using aerial and ground based application of chemical
herbicides in the first instance with the possibility of exploring bund removal. The initial
efforts were expensive and ecologically undesirable as freshwater weed removal was partial
and short-lived. With the limited success of the chemical weed control, it was decided to inves-
tigate bund removal as a natural form of weed control using tidal ingress from the seaward
side of the wetland. There was however, some uncertainty around the frequency, duration and
extent of seawater penetration into the wetland once the bund was removed. Hydro-dynamic
modelling simulations by Karim et al., [45] predicted that large (king) tides occurring in
December/January and June/July each year should penetrate upstream of the existing bund.
However, these simulations took no account of the impact of different depths of standing
water within the wetland, which could form a hydrological barrier to, and potentially inhibit,
on-going ingress of seawater. Despite these uncertainties it was decided to remove sections of
the earth bund wall.
This paper gives an overview of the changes in weed infestation, fish biodiversity and
detailed monitoring of the depth and quality of the water within the wetland for 1 year before,
and 4 years following reinstatement of tidal flow into the Boolgooroo lagoon region of the
Mungalla wetlands complex, North Queensland (Fig 1). The success of this intervention was
assessed in the context of the local (Mungalla) wetland management strategy [44] which specif-
ically targeted weed removal, and explore the broader implications of this management strat-
egy for coastal wetland restoration.
Methods
Ethics statement–“The fish biodiversity study was completed in accordance with the Queens-
land Animal Care and Protection Act 2001, and James Cook University animal ethics permit
number A2178.”
Location and climate
Mungalla Station (146o16’19”E, 18o42’55”S), is a 830 ha property located in the lower part of
the Herbert River catchment south east of Ingham, North Queensland (Fig 1). Mungalla sta-
tion has been run as a cattle-grazing enterprise for over a century, and since 1999 by the
Nywaigi Aboriginal people, who also manage the wetland area. Until bund removal on 6th
October 2013 the wetland area above the bund was palustrine with saline estuarine wetland
and saltmarsh below it. Typically saltmarsh would merge into intertidal grass-sedge wetlands
dominated by Bulkuru (Eleocharis dulcis) [46]—the common name Bulkuru is a derivative of
the indigenous term “Boolgooroo” for which this wetland is named, providing a clear indicator
of the wetlands pre-European state. The Boolgooroo wetland covers 60 ha of the total 160 ha
Mungalla wetland complex (Fig 1), is bounded to the west by grazing lands and to the east by
regrowth forest on coastal sand ridges. Mangroves and saltmarsh patches are present along the
coast and to the south of the property, which is adjacent to Halifax Bay within the Great Barrier
Reef lagoon. Inland, the surrounding catchment is dominated by sugar cane farms, with some
areas of grazing.
The area has a wet tropical climate with highly variable seasonal and annual rainfall. The
long term mean rainfall at nearby Allingham is 2060 mm and is strongly seasonal with 85%
falling in the six wettest months, November to April. Temperatures are highest in December
(daily average 29.1˚C) and lowest in July (daily average 20.4˚C), with high humidity (~63–
77%) throughout the year.
Bund removal to re-establish tidal flow, remove aquatic weeds and restore coastal wetland services
PLOS ONE | https://doi.org/10.1371/journal.pone.0217531 January 24, 2020 3 / 33

Because of the highly seasonal rainfall, freshwater only enters the wetland in the wet season
as direct rainfall input, runoff from the surrounding sub-catchments and overbank flow from
Palm Creek, which runs along the western boundary of Mungalla station. Once the bund was
removed, the upstream wetland was again connected to the coastline, with the possibility of
being fed tidally with seawater from a tributary of Palm Creek (just south of Forrest Beach)
and Cassady Creek (Fig 1).
Water depth and quality measurements
Wetland water depth, temperature and electrical conductivity (EC) were monitored by loggers
(CTD-Diver, Eijkelkamp Soil & Water, The Netherlands) located in five permanent positions
in the wetland, beginning on 24th October 2012. The locations were 450 m, 250 m and 50 m
above, and, 50 m and 250 m below the bund wall (Fig 1). The above bund logger locations
Fig 1. Location of wetlands within Mungalla station in the lower Herbert River catchment, Queensland, Northern Australia. The Mungalla wetlands are hatched in
dark grey, the Boolgooroo region of the wetland complex is shown in yellow. Also shown are the locations of the logger sites above and below the earth bund which was
removed on 6th October 2013.
https://doi.org/10.1371/journal.pone.0217531.g001
Bund removal to re-establish tidal flow, remove aquatic weeds and restore coastal wetland services
PLOS ONE | https://doi.org/10.1371/journal.pone.0217531 January 24, 2020 4 / 33
were all within the weed infested parts of the wetland. The loggers captured data from the bot-
tom of the water column (10 cm above the soil surface) every 15 minutes and were down-
loaded as part of monthly routine maintenance visits. An additional water quality logger
(Hydrolab, OTT Hydromet, Colorado, USA) was used above the bund at the 50 m location,
adjacent to the Diver logger (Fig 1). The Hydrolab logger recorded values of EC, depth, pH
and dissolved oxygen (DO) concentration every 30 minutes at 10 cm above the soil surface.
To examine the effect of bund removal and location (above and below the bund) on depth,
EC and temperature, Two-way analysis of variance (ANOVA) was carried out. Similarly, one-
way ANOVA were run to examine the effects of bund removal on pH and DO (pH and DO
were not measured at the below bund location). Data for both analyses were aggregated to
daily averages from the 15 and 30-minute raw data. Normality of data residuals was assessed
through inspection of residual and Q-Q plots and although there was some deviation it is not
problematic given sample sizes (n = 7445, CTD-Diver and n = 1218, Hydrolab), there also
appeared to be some heteroscedasticity. As a result, analysis was run using a heteroscedasti-
city-corrected coefficient covariance matrix (hc3). ANOVA data presented are mean ± stan-
dard deviation, unless otherwise stated. Non-linear correlation was performed to assess the
linear and non-linear strength of relationships between water quality measures. Time series
analysis was used to detect diel variations and lags between variables. Ancillary data used in
conjunction with the wetland monitoring data are daily meteorological data measured at
Allingham (Australian Bureau of Meteorology (BOM) station No 032117) and tide data
recorded at the Lucinda Jetty; which was then extrapolated to Forrest Beach; 1.5 km east of the
wetland (4min offset). Further details of the tidal extrapolation method are given by Karim
et al, [47].
Vegetation monitoring
Vegetation monitoring and mapping in the wetland was carried out using Worldview-3
8-band satellite imagery (DigitalGlobe Inc. Longmont, CO, USA) pan sharpened to a resolu-
tion of 0.31m. Imagery was collected once each year between August and September over the
Mungalla station region, then cropped to an extent around the Boolgooroo wetland (Fig 1).
Classification of the imagery into major vegetation types was carried out using object-based
image classification techniques [48], using nearest neighbour supervised classification, and
manual classification in more difficult areas. Complexity of the wetland area required separate
classification of small regions, incorporating different segmentation levels within the object-
based process, which were later merged. To aid the supervised and manual classification, dom-
inant species were recorded at 50 fixed ground truthing sites across the imagery extent each
year. In addition, high-resolution aerial photography was obtained with a Go-Pro camera
attached to the underside of a helicopter flying along several transects that ran parallel and
across the wetland site from west to east and at an elevation of approximately 100 m. Images
were geo-referenced to preselected ground control points (geo-located with a differential
GPS). Major vegetation groups were clearly identified visually from the high-resolution aerial
photography, which was used as further ‘ground truth’ of the World-3 imagery classification.
A comparison of final classification imagery was carried out between consecutive collection
dates (Aug/Sep yearly), to identify differences in the area inhabited by these major vegetation
groups.
Fish biodiversity
Prior to this project a fish survey was conducted in the wetlands using baited collapsible
box traps along with cast nets, electrofishing, and visual observation at sites among the invasive
Bund removal to re-establish tidal flow, remove aquatic weeds and restore coastal wetland services
PLOS ONE | https://doi.org/10.1371/journal.pone.0217531 January 24, 2020 5 / 33
vegetation [49]. For comparison another fish survey was conducted with the use of a boat-
mounted electrofisher (Smith-Root 2.5 GPP generator mounted vessel) in May 2016. In this
second survey, approximately one third of the wetland was surveyed over a 55 min period,
around fringing vegetation and woody debris (the remaining two thirds of the wetland were
too shallow for the boat to access). All native fish were identified and immediately released
after capture, while pest fish species were euthanised using accepted methods. Given the differ-
ences in the sampling methods before and after bund wall removal, the data presented denotes
a presence/absence of the catch records.
Results
Water depth and quality measurements
Two way ANOVA for measurements of depth, EC and temperature all showed statistically sig-
nificant interaction between period (before and after bund removal) and location (above and
below bund) F(1,7744) = 223.87, p< .001, ηp2 = .023, F(1,7744) = 15.692, p< .001, ηp
2 = .003,
and F(1,7744) = 33.11, p< .001, ηp2 = .004 respectively. Given the interactions simple contrasts
were run that compared the difference between means for the before and after bund removal
periods, above and below bund location combinations (Table 1). Additionally one way
ANOVA for measurements of both DO and pH revealed a statistically significant difference
between period for means of DO, F(1,1217) = 271.36, p< .001, ηp2 = .03I and pH F(1,1217) =
187.21, p< .001, ηp2 = .027. Contrast results comparing difference between period for mean
DO and pH also appear in Table 1.
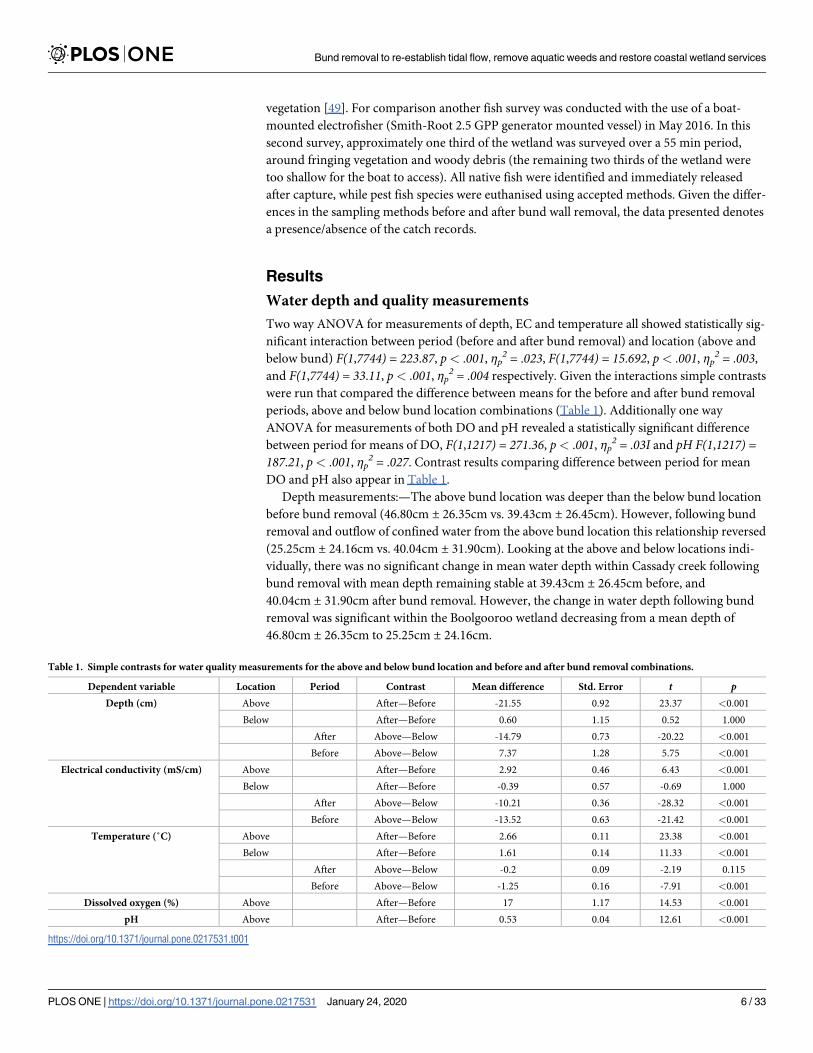
Depth measurements:—The above bund location was deeper than the below bund location
before bund removal (46.80cm ± 26.35cm vs. 39.43cm ± 26.45cm). However, following bund
removal and outflow of confined water from the above bund location this relationship reversed
(25.25cm ± 24.16cm vs. 40.04cm ± 31.90cm). Looking at the above and below locations indi-
vidually, there was no significant change in mean water depth within Cassady creek following
bund removal with mean depth remaining stable at 39.43cm ± 26.45cm before, and
40.04cm ± 31.90cm after bund removal. However, the change in water depth following bund
removal was significant within the Boolgooroo wetland decreasing from a mean depth of
46.80cm ± 26.35cm to 25.25cm ± 24.16cm.
Table 1. Simple contrasts for water quality measurements for the above and below bund location and before and after bund removal combinations.
Dependent variable Location Period Contrast Mean difference Std. Error t pDepth (cm) Above After—Before -21.55 0.92 23.37 <0.001
Below After—Before 0.60 1.15 0.52 1.000
After Above—Below -14.79 0.73 -20.22 <0.001
Before Above—Below 7.37 1.28 5.75 <0.001
Electrical conductivity (mS/cm) Above After—Before 2.92 0.46 6.43 <0.001
Below After—Before -0.39 0.57 -0.69 1.000
After Above—Below -10.21 0.36 -28.32 <0.001
Before Above—Below -13.52 0.63 -21.42 <0.001
Temperature (˚C) Above After—Before 2.66 0.11 23.38 <0.001
Below After—Before 1.61 0.14 11.33 <0.001
After Above—Below -0.2 0.09 -2.19 0.115
Before Above—Below -1.25 0.16 -7.91 <0.001
Dissolved oxygen (%) Above After—Before 17 1.17 14.53 <0.001
pH Above After—Before 0.53 0.04 12.61 <0.001
https://doi.org/10.1371/journal.pone.0217531.t001
Bund removal to re-establish tidal flow, remove aquatic weeds and restore coastal wetland services
PLOS ONE | https://doi.org/10.1371/journal.pone.0217531 January 24, 2020 6 / 33

During 2012 wetland depth at all locations declined steadily with only 0 to 20 cm of water
depth above the bund and even less (0 to 10 cm) below the bund (Fig 2A and 2B) by the middle
of December 2012. Subsequent rainfall (Fig 2C) increased the wetland depth, which reached a
maximum of ~170 cm (above and below the bund) at the end of January 2013.
Fig 2. Changes in depth above and below the bund location and daily rainfall—October 2012 to August 2017. Logger distances above the bund (a) are 450 m, 250 m
and 50 m and below (b) are 50 m and 250 m. The bund was removed on the 6th October 2013. Daily rainfall (c) was derived from the nearby Bureau of Meteorology
station at Allingham approximately 2.5 km distant.
https://doi.org/10.1371/journal.pone.0217531.g002
Bund removal to re-establish tidal flow, remove aquatic weeds and restore coastal wetland services
PLOS ONE | https://doi.org/10.1371/journal.pone.0217531 January 24, 2020 7 / 33

After February 2013, water levels dropped rapidly, and then more slowly as drainage from
the wetland slowed. Smaller rainfall inputs to the wetland in March, April and May 2013
resulted in only modest increases in water depth (~ 10 cm). After this time water depth again
dropped steadily, approaching zero in October 2013 just before bund removal. During this
same period there were multiple occasions when depth increased, at approximately monthly
intervals at the below bund locations (Fig 2B) with no corresponding increase in depth above
the bund (Fig 2A); therefore it would appear that the depth increases below the bund were due
to tidal pulses alone indicating that there was no tidal penetration beyond the bund before its
removal. Further investigation, using cross-correlation between tide height at the coast and
depth at 250m below the bund, revealed that there is a lag of 3 to 4.25 hrs between coastal inun-
dation and change in depth at the below bund location (Fig 3).
Following bund removal (6th October 2013), re-establishment of connectivity to Cassady
creek was immediately evident with slow freshwater outflow from Boolgooroo lagoon to reach
an equilibrium depth of ~10 cm lower than the bunded state at that time. The 2013/14 wet sea-
son (November to April inclusive) had just below average wet season rainfall (1443 mm) that
did not start until late-January 2014. As a result, water depths at most of the locations
remained close to zero from the end of October 2013 to mid-February 2014. In contrast,
depths at the 250 m below location continued to rise at monthly intervals, corresponding to
the high tides at the nearby coast. None of the tides in November and December 2013 reached
Fig 3. Cross-correlation between tide height and depth measured at the 250m below bund location. Maximum correlation occurs at a lag of 12 to 17 which is
equivalent to a 3 to 4.25 hr delay between tides experienced at the coast and measured changes in depth at the 250m below bund location– 15 min data records. 95% CI
has been omitted from the graph falling at ± 0.05.
https://doi.org/10.1371/journal.pone.0217531.g003
Bund removal to re-establish tidal flow, remove aquatic weeds and restore coastal wetland services
PLOS ONE | https://doi.org/10.1371/journal.pone.0217531 January 24, 2020 8 / 33

further than the 250 m below location. However, very large tides at the end of January 2014,
culminating with 4.3 m, reached further inland inundating both the 250 and 50 m below loca-
tions as well all three monitored locations within the Boolgooroo wetland increasing wetland
depth to 25cm at 50m above the bund location and 16cm at the 450m above bund location.
Changepoint analysis of wetland depth and tide height during periods where inundation
occurred before the influence of rainfall (2014,2015,2016) indicate that 3.63m (SE = 0.29, 95%
CI [2.89,4.03]) is the lower limit of tide height that will increase water depth within the wetland
(measured at the 50m above bund location). The 4.3 m tide experienced at that time is within
the 95th percentile for the region and a good indicator of maximum tidal inflow that could be
expected within the wetland. The second wet season after bund removal (2014/15) had only
47% of average wet season rainfall (751 mm) leading to relatively low wetland depths (maxi-
mum ~ 70 cms) in this season (Fig 2A) falling to very low levels in August 2015, continuing to
dry out until December of 2016 when tidal flow marginally affected the lower wetland before
drying out again until February 2016. The 2015/16 wet season started late with the majority of
rainfall falling in March 2016, continuing until July 2016. As a result, mean wetland depth
remained high, eventually falling to close to zero for a very short period in December 2016,
with rainfall then maintaining water levels at>50cm until the end of the study in August 2017.
Electrical conductivity (EC) measurements:—Prior to bund removal the Boolgooroo wet-
land remained freshwater, 0.29mS/cm ± 0.11mS/cm, compared to the brackish waters of Cas-
sady creek, 13.82mS/cm ± 19.35mS/cm. Following bund removal, the mean EC at the above
bund location, whilst becoming brackish, remained significantly lower than the below bund
location (3.22mS/cm ± 8.77mS/cm vs. 13.42mS/cm ± 19.39mS/cm). Looking at the above and
below bund locations individually, there was no significant change in EC at the below bund
location following bund removal with mean EC remaining stable in Cassady creek below the
Boolgooroo wetland at 13.82mS/cm ± 19.35mS/cm before and 13.42mS/cm ± 19.39mS/cm
after bund removal. However, the change in EC following bund removal (due to sea water
ingress) was significant within the Boolgooroo wetland itself increasing from a mean EC of
0.29mS/cm ± 0.11mS/cm to 3.22mS/cm ± 8.77mS/cm. In January 2014 the wetland experi-
enced the first single tides over 3.6 m which did not affect the wetland above the bund location.
These were followed by 5 tides over 3.6m at the end of the month (Fig 4C).
These tides were unusually high due to a severe tropical low in the Coral Sea at that time.
As a result, the wetland became influenced by tidal ingress (> 46 mS cm-1) and remained so
before rainfall again suppressed conditions (Fig 4A and 4C), with conductivity levels becoming
brackish (> 1< 46 mS cm-1) before returning to freshwater (< 1 mS cm-1). In 2014 there were
7 tidal periods (most with 3 consecutive tides over 3.7m) that affected the wetland through
increased residence times of brackish and saline water (Fig 5). The following year (2015) saw 4
tidal periods over 3.7 m with 3 periods being recorded at the 450 m above bund location. 2015
was the driest year on record for the region, which accounts for the differences in tidal inunda-
tion residence times (Fig 5), as wetland depth and associated freshwater outflow did not
restrict tidal inflow to the same degree as the previous year.
In addition, lack of freshwater flows in the 2014/15 season also led to less dilution of the sea-
water in the wetland with evaporation processes reducing wetland depth markedly and con-
tributing to particularly high (>55mS/cm) and prolonged salinity levels in the wetland (Figs
2A and 4A). Notably there was a single high tide of ~3.7 m in February of 2016 which did not
enter the wetland (Fig 4A and 4C) with a similar occurrence in early January of 2014. On fur-
ther investigation cross-correlation of tide height and EC (using daily aggregated data from
the 50m above bund site) revealed a maximum correlation at a lag of 3 days (Fig 6) giving an
indication that maximum increases in EC will only occur when there are 2–3 consecutive
tides.
Bund removal to re-establish tidal flow, remove aquatic weeds and restore coastal wetland services
PLOS ONE | https://doi.org/10.1371/journal.pone.0217531 January 24, 2020 9 / 33

Further investigation using non-linear correlation between depth and EC reveals a moder-
ate but significant relationship (r = 0.39, P< 0.01). Piecewise correlations for the above analy-
sis are visualised in Fig 7, showing increases in EC with increases in depth representing tidal
inundation, along with decreases in EC with increased depth due to rainfall.
Changepoint analysis of this dataset (a subset of the 50m above bund location including
only low rainfall periods) indicates that EC stops increasing at a wetland depth of 36cm
Fig 4. Changes in salinity above and below the bund location and tides> = 3.6 m—October 2012 to August 2017. Logger distances above the bund are 450 m,
250 m and 50 m and below are 50 m and 250 m. The bund was removed on the 6th October 2013. High tides (> = 3.6 m) are for Forrest Beach.
https://doi.org/10.1371/journal.pone.0217531.g004
Bund removal to re-establish tidal flow, remove aquatic weeds and restore coastal wetland services
PLOS ONE | https://doi.org/10.1371/journal.pone.0217531 January 24, 2020 10 / 33

(SE = 3.79, 95% CI [28.31,43.15). Therefore, not only are several high tides required to increase
wetland EC, it will only occur when wetland depth is below ~40cm, or outflow is non-existent
or very low as in January of 2015. There was a large amount of rainfall during March of 2016
with constant rainfall input until July. The wetland remained as freshwater until early October
with tidal water reaching upstream areas of the bund wall in December resulting in only small
conductivity peaks (Fig 4A). In the final 7 months of the study (2017) 3 tides affected the wet-
land, but only to the above 50 m location (Fig 4A) with minor impact.
Temperature:—Prior to bund removal the above bund location was significantly cooler
than the below bund location, (24.50˚C ± 3.57˚C vs. 25.75˚C ± 3.19˚C). However following
bund removal, the mean temperature for the above and below bund location increased signifi-
cantly, becoming uniform (27.16˚C ± 3.24˚C vs. 27.36˚C ± 3.42˚C) (Table 1). Water tempera-
ture in the wetland following bund removal varied seasonally, being coolest in June/July
(mean = 22.5˚C ± 1.7˚C) and warmest in January/February (mean = 30.7˚C ± 1.6˚C) (Fig 8B).
Water temperatures at the three locations above the bund were very similar with the highest
temperatures being recorded in January/February 2015, averaging 31˚C ± 1.7˚C above the
bund location, compared to 29.5˚C ± 1.2˚C and 29˚C ± 1.2˚C in the two previous summer sea-
sons, and to 30.5˚C ± 0.8˚C and 29.4˚C ± 0.8˚C in the following two seasons. The higher tem-
peratures in 2015 coincided with the low rainfall received that wet season, leaving the wetland
very shallow, averaging only 11 cm above the bund location in January and February (Fig 2A).
Fig 5. The percentage of time EC exceeded any given EC threshold during pre and post bund removal years within the Boolgooroo wetland. Horizontal dashed
lines show boundaries between fresh, brackish, saline and briny water from left to right.
https://doi.org/10.1371/journal.pone.0217531.g005
Bund removal to re-establish tidal flow, remove aquatic weeds and restore coastal wetland services
PLOS ONE | https://doi.org/10.1371/journal.pone.0217531 January 24, 2020 11 / 33

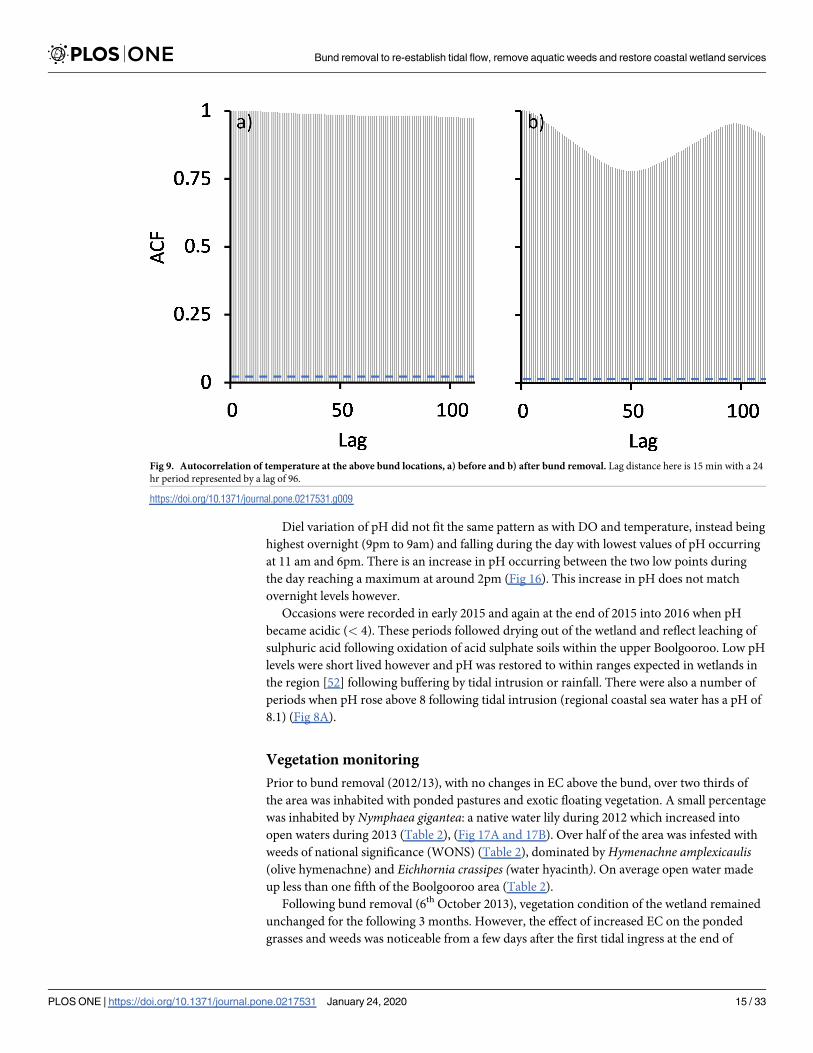
Autocorrelation analysis reveals that prior to bund removal water temperature did not exhibit
diel variation (Fig 9A).
However, this changed following bund removal (Fig 9B) with temperature reaching a maxi-
mum at 5pm falling to a minimum at 7am (Fig 10).
There were notable periods when the diel oscillations increased to> 10 degrees; for exam-
ple, during the period of October 2013 to January 2014 and October 2015 to January 2016 (Fig
8B). Large oscillations in temperature coincided with periods of shallow wetland depths. The
thermal regimes 250 m above and 250 m below the bund are compared in (Fig 11). These plots
show how often water temperature exceeded a given temperature threshold and are compiled
from all 15-minute recordings made from the warmest time of the year in January, February
and March (JFM) 2013 (before bund removal) and the same three months in 2014 and the dri-
est year 2015 (after bund removal).
Water above the bund was greater than 26˚C during JFM 2013, but rarely exceeded 32˚C
(Fig 11A). Water was warmer below the bund during this period, reaching 35˚C. The exceed-
ance of the preferred temperature threshold for some tropical freshwater fish (see [50]), Tpref =
31˚C, was much higher below the bund (23% of the time) compared with above the bund
(6.9% of the time). Comparison of 2013 and 2014 thermal frequency curves (Fig 11B) shows
that bund removal per se did not markedly affect the wetland thermal regime. However, water
temperature was very dependent on (shallow) wetland depths, which were mainly determined
by the timing and amount of wet season rainfall. This was the situation in the 2014/15 season
Fig 6. Cross-correlation between tide height and EC measured at the 50m above bund location. Maximum correlation occurs at a lag of 3 which is equivalent to a
3-day delay between tides experienced at the coast and measured changes in EC.
https://doi.org/10.1371/journal.pone.0217531.g006
Bund removal to re-establish tidal flow, remove aquatic weeds and restore coastal wetland services
PLOS ONE | https://doi.org/10.1371/journal.pone.0217531 January 24, 2020 12 / 33

where the low rainfall led to shallow wetland depths (Fig 2A). As a result, diel temperature
oscillations were very high (Fig 8B) and led to prolonged periods of high temperature, as
shown by the temperature frequency curve for JFM 2015 (Fig 11B). For example, the exceed-
ance of the temperature threshold Tpref = 31˚C, was 61% in JFM 2015, compared with 7.3%
and 6.9% in 2014 and 2013 respectively. Temperatures never exceeded 34˚C in 2013 and 2104,
but this temperature was exceeded 34% of the time in 2015, and even approached 40˚C at
times.
Dissolved oxygen % (DO):—Dissolved oxygen saturation (recorded 10 cm above the
bottom of the wetland) was consistently close to zero before the bund was removed
(mean = 0.72% ± 2.45%) (Fig 8A) with no diel variation in DO saturation evident (Fig 12A).
However, in the first wet season after bund removal, DO improved following the first series of
seawater pulses that entered the wetland in January and February 2014 (Fig 4A), reaching ~
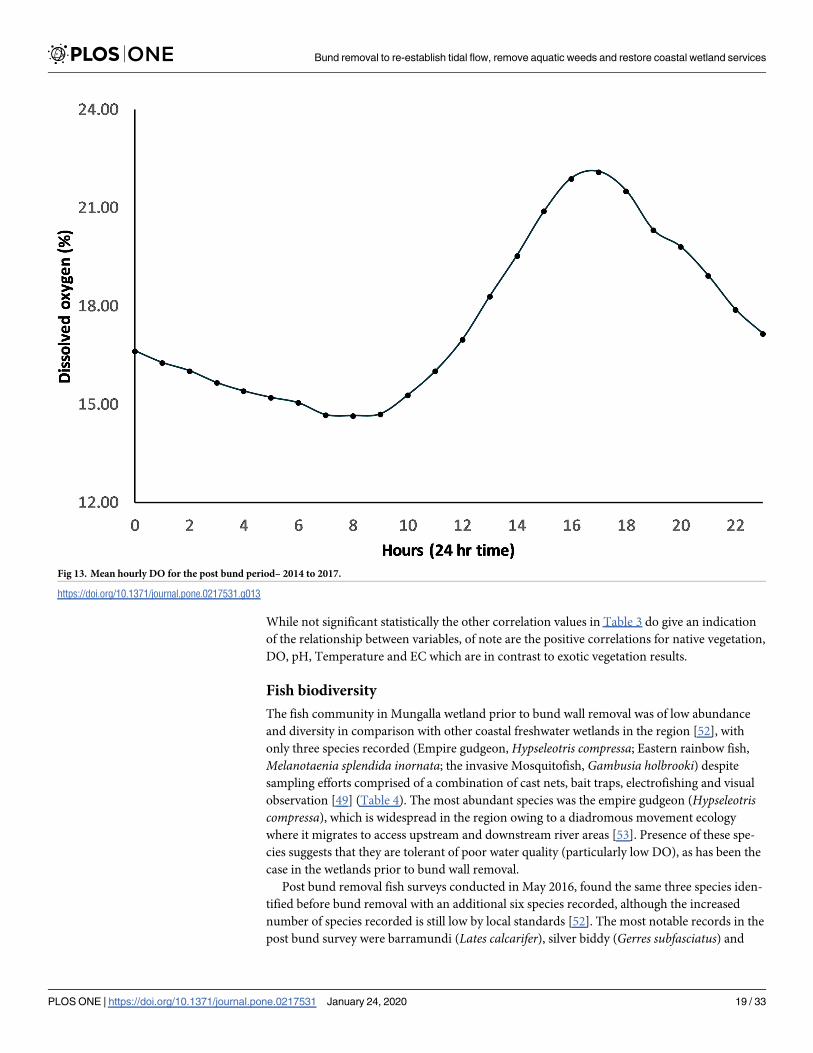
100% saturation (Fig 8A). Diel variation in DO saturation became evident at this time (Fig
12B), continuing across the post bund period, reaching a maximum late in the afternoon (Fig
13).
DO declined again for several weeks after this until the freshwater pulses in March and
April 2014 again improved DO; however, initially there were relatively few days when DO
reached 100% saturation. By June and July 2014 DO improved further, approaching 100% sat-
uration on many days. As wetland depth dropped below 40 cm in August and September
2014, the seawater pulses that could now enter the wetland continued to sustain reasonably
Fig 7. Piecewise visualisation of non-linear correlation between depth and EC. Red lines represent linear correlation segments from within the non-linear
correlation. Here we can see increases in EC with Depth and decreases in EC with depth associated with tidal ingress and rainfall respectively.
https://doi.org/10.1371/journal.pone.0217531.g007
Bund removal to re-establish tidal flow, remove aquatic weeds and restore coastal wetland services
PLOS ONE | https://doi.org/10.1371/journal.pone.0217531 January 24, 2020 13 / 33

high DO with 7 days exceeding a daily average DO of 100% about two weeks after the seawater
ingress in August 2014. Despite the low water levels in January and February 2015, DO con-
centrations reached 80 to 100% on many days, however much lower DO was recorded during
the next few months until an increase in August following a seawater pulse. There were few
increases in DO in 2016 with DO generally remaining very low compared to the two previous
years. 2017 levels approached pre-bund removal periods (Fig 14) remaining below acute DO
levels [51].
Some spikes did occur after tidal intrusion in February of 2016 directly following drying
out of the wetland, and again in October to November following tidal intrusion. 2017 experi-
enced very few short-lived increases in DO between February and April of that year due to
rainfall, with DO remaining close to zero. Generally, while DO has improved following bund
removal it has remained low with only 8–10% of the time between 2014 and 2016 being above
the critical DO saturation level for maintaining healthy fish species in this region.
pH:—pH recorded above the bund location was more acidic before bund removal com-
pared to post bund removal levels (Fig 5A) (6.08 ± 0.21 vs. 6.60 ± 1.13). As with temperature
and DO, pH exhibited diel variation following bund removal but not before (Fig 15).
Fig 8. Seasonal changes in dissolved oxygen, pH and temperature. Daily average dissolved oxygen (% saturation) and pH were recorded by the Hydrolab logger at
the above 50 m location (a). Daily average water temperatures shown are as measured 250 m above the bund location (b). Diurnal oscillations in dissolved oxygen
(30-minute intervals) and water temperature (15-minute intervals) are also shown (a), (b).
https://doi.org/10.1371/journal.pone.0217531.g008
Bund removal to re-establish tidal flow, remove aquatic weeds and restore coastal wetland services
PLOS ONE | https://doi.org/10.1371/journal.pone.0217531 January 24, 2020 14 / 33
Diel variation of pH did not fit the same pattern as with DO and temperature, instead being
highest overnight (9pm to 9am) and falling during the day with lowest values of pH occurring
at 11 am and 6pm. There is an increase in pH occurring between the two low points during
the day reaching a maximum at around 2pm (Fig 16). This increase in pH does not match
overnight levels however.
Occasions were recorded in early 2015 and again at the end of 2015 into 2016 when pH
became acidic (< 4). These periods followed drying out of the wetland and reflect leaching of
sulphuric acid following oxidation of acid sulphate soils within the upper Boolgooroo. Low pH
levels were short lived however and pH was restored to within ranges expected in wetlands in
the region [52] following buffering by tidal intrusion or rainfall. There were also a number of
periods when pH rose above 8 following tidal intrusion (regional coastal sea water has a pH of
8.1) (Fig 8A).
Vegetation monitoring
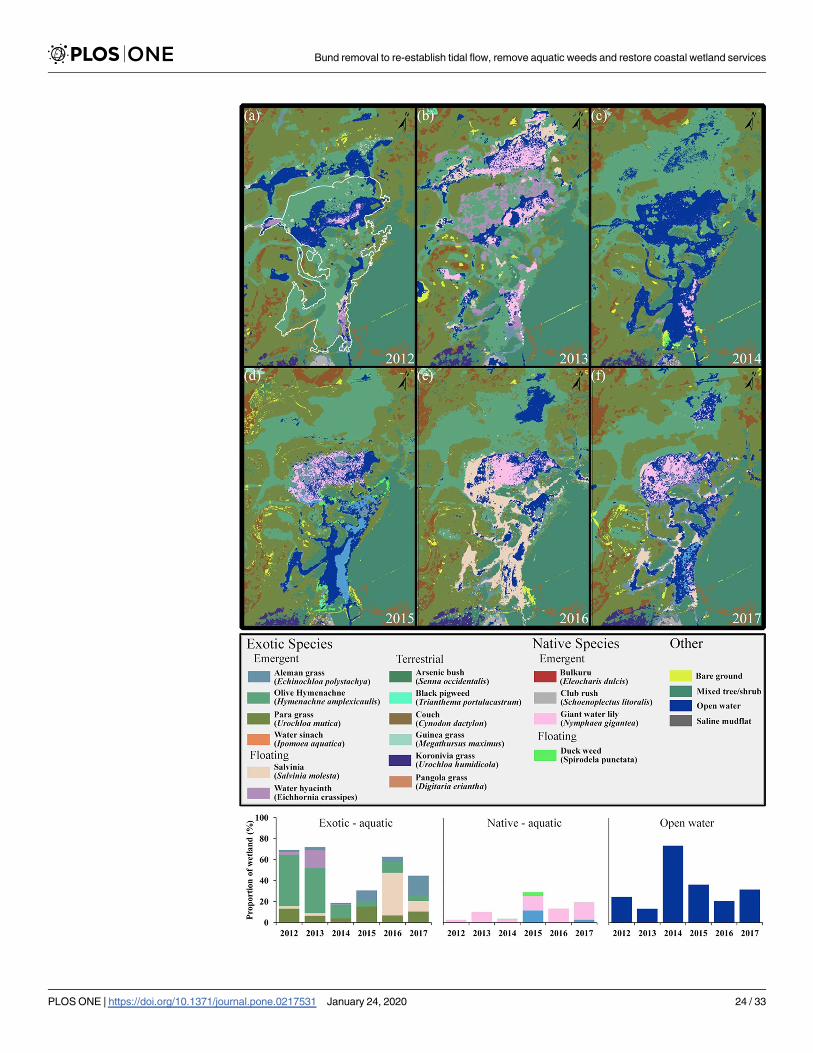
Prior to bund removal (2012/13), with no changes in EC above the bund, over two thirds of
the area was inhabited with ponded pastures and exotic floating vegetation. A small percentage
was inhabited by Nymphaea gigantea: a native water lily during 2012 which increased into
open waters during 2013 (Table 2), (Fig 17A and 17B). Over half of the area was infested with
weeds of national significance (WONS) (Table 2), dominated by Hymenachne amplexicaulis(olive hymenachne) and Eichhornia crassipes (water hyacinth). On average open water made
up less than one fifth of the Boolgooroo area (Table 2).
Following bund removal (6th October 2013), vegetation condition of the wetland remained
unchanged for the following 3 months. However, the effect of increased EC on the ponded
grasses and weeds was noticeable from a few days after the first tidal ingress at the end of
Fig 9. Autocorrelation of temperature at the above bund locations, a) before and b) after bund removal. Lag distance here is 15 min with a 24
hr period represented by a lag of 96.
https://doi.org/10.1371/journal.pone.0217531.g009
Bund removal to re-establish tidal flow, remove aquatic weeds and restore coastal wetland services
PLOS ONE | https://doi.org/10.1371/journal.pone.0217531 January 24, 2020 15 / 33

January 2014, with a rapid yellowing of the vegetation occurring. Weed death continued after
this and by the time of the next remote vegetation survey in August 2014 exotic species
reduced to below 20% within the tidally effected area (Table 2). This was driven by large reduc-
tions in olive hymenachne (H. amplexicaulis), water hyacinth (E. crassipes) and salvinia (S.
molesta) with only small decreases in Para grass (U. mutica) and Aleman grass (E. polystachya)
which occurred on the wetland margins. Nymphaea gigantea also decreased by two thirds at
this point (Fig 17C), (Table 2). A dramatic change is evident (Fig 17C) with most of the exotic
vegetation being replaced by open water. The following year (2015) saw 4 tidal periods over
3.7 m with the wetland becoming more saline for an average of 13 days and then brackish for
178 days, again with 3 periods being recorded at the 450 m above bund location. 2015 was the
driest year on record for the region, which accounts for the differences in tidal inundation
(days), as wetland depth and associated freshwater outflow did not restrict tidal inflow to the
same degree as the previous year. Satellite imagery recorded an increase in two of the ponded
pastures—Aleman (E. polystachya) and Para grass (U. mutica)—invading areas previously
inhabited by olive hymenachne (H. amplexicaulis) this occurred on the wetland margins and
comprised ~25% of the site (Fig 17D), (Table 2). Olive hymenachne was reduced to ~5% with
salvinia and water hyacinth being undetectable on the remote sensing imagery (Fig 17D),
(Table 2). There was an increase in native aquatic plants driven by the appearance of Eleocharisdulcis (Bulkuru) within the lower half of the site as well as an increase in N. gigantea in the
Fig 10. Mean hourly temperature for the post bund period– 2014 to 2017.
https://doi.org/10.1371/journal.pone.0217531.g010
Bund removal to re-establish tidal flow, remove aquatic weeds and restore coastal wetland services
PLOS ONE | https://doi.org/10.1371/journal.pone.0217531 January 24, 2020 16 / 33

upper site. Spirodela punctata (Duck weed) was also present (~3.5%) in some of the shallower
areas originally inhabited by H. amplexicaulis. These native species generally took advantage of
the disappearance of exotic species and newly available open water. The entire wetland dried
out in October 2015 remaining dry for two months (Fig 4A) and then received small flushes of
rainfall until March 2016 (pH as low as ~3 occurred for a short period due to acid sulphate soil
oxidation and leaching). At this time, as a result of increased wetland accessibility, predation
by feral pigs removed most of the native Bulkuru (E. dulcis).There was a large amount of rainfall during March of 2016 with constant rainfall input
until July with no tidal influence measured. This period saw the return of S. molesta (~40% of
the area) invading open water and the areas previously inhabited by E. dulcis and N. giganteain the upper reaches (Fig 17E). E. polystachya and U. mutica were reduced slightly from the
margins to be replaced by H. amplexicaulis. Whilst some of the area occupied by N. giganteawere now used by salvinia, the water lily had become denser (Fig 17E) and remained stable at
Fig 11. The percentage of time water temperature exceeded any given temperature threshold during the warmest
months (January, February and March) in the Mungalla wetland (Boolgooroo). (a) compares the temperatures 250
m above (black) and 250 m below (grey) the bund before it was removed. (b) compares the temperatures 250 m above
the bund before (black) and after (2014; short-dashed black; 2015; long-dashed black) it was removed. The exceedance
of threshold Tpref = 31˚C is also shown.
https://doi.org/10.1371/journal.pone.0217531.g011
Bund removal to re-establish tidal flow, remove aquatic weeds and restore coastal wetland services
PLOS ONE | https://doi.org/10.1371/journal.pone.0217531 January 24, 2020 17 / 33

around ~13% of the Boolgooroo area (Table 2). E. dulcis was no longer detectable on the imag-
ery after the feral pig predation event of 2016, however some individual plants were observed
in the lower Boolgooroo area at this time. Available DO dropped to close to zero after the
March 2016 rainfall with increases in salvinia. In the final 7 months of the study (2017) 3 tides
affected the wetland, but only to the above 50 m location (Fig 4C) although the spikes in EC
from September and December 2016 tides could be considered here in regards to vegetation
change as tidal input during this period was observed to drastically reduced the population of
salvinia. The 2017 image classification (Fig 17F) clearly shows the reduction in salvinia to mar-
ginal locations with N. gigantea moving into the areas that it previously occupied in the upper
Boolgooroo, and the native sedge, Bulkuru, reappearing in the lower Boolgooroo wetland. At
this time the saltmarsh species S. litoralis (Club rush) appeared in a small area (Table 2)
directly above the eastern end of the bund location (Fig 17F). Ponded grasses, which had
remained on the wetland margins since 2014, showed a further decrease in H. amplexicaulisextent down to ~5%, this is similar to the 2015 level and most likely representative of the extent
of effective weed control of tidal intrusion. Growth of U. mutica and E. polystachya increased
however inhabiting areas previously occupied by H. amplexicaulis in 2016. Increase by Aleman
grass (E. polystachya) even more pronounced in this period. Whilst the dataset is limited to
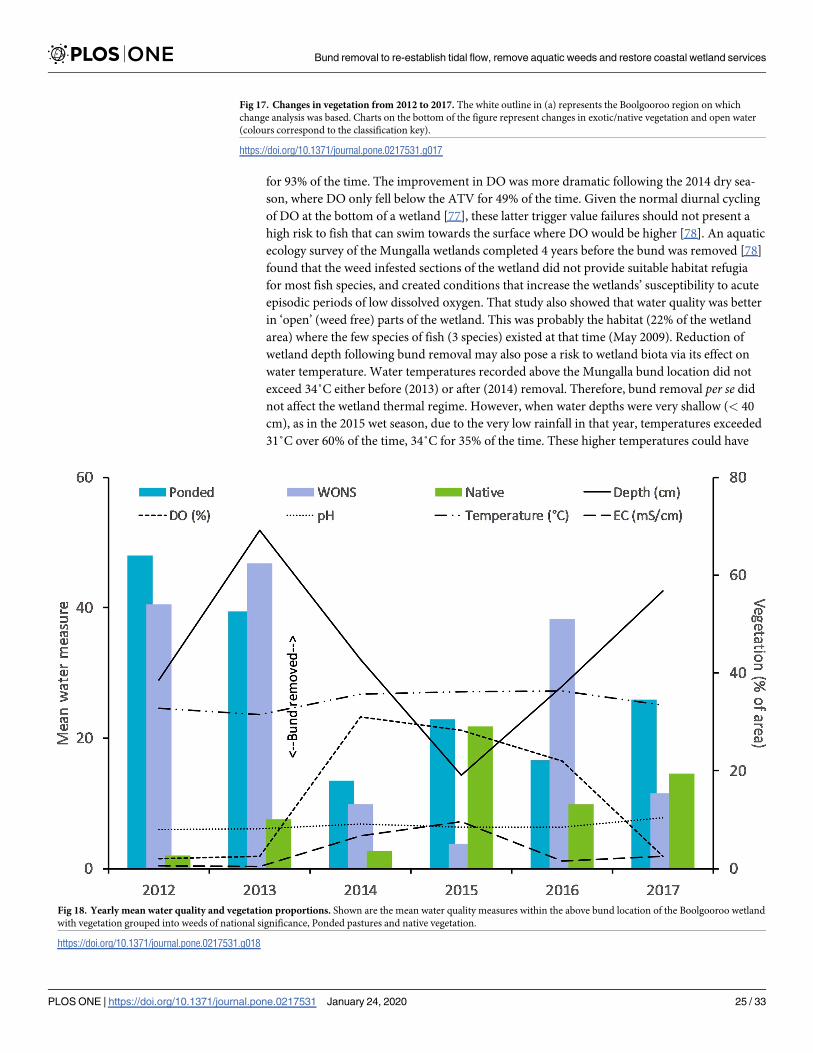
only 6 yearly aggregates the relationships between Vegetation and water quality measures (Fig
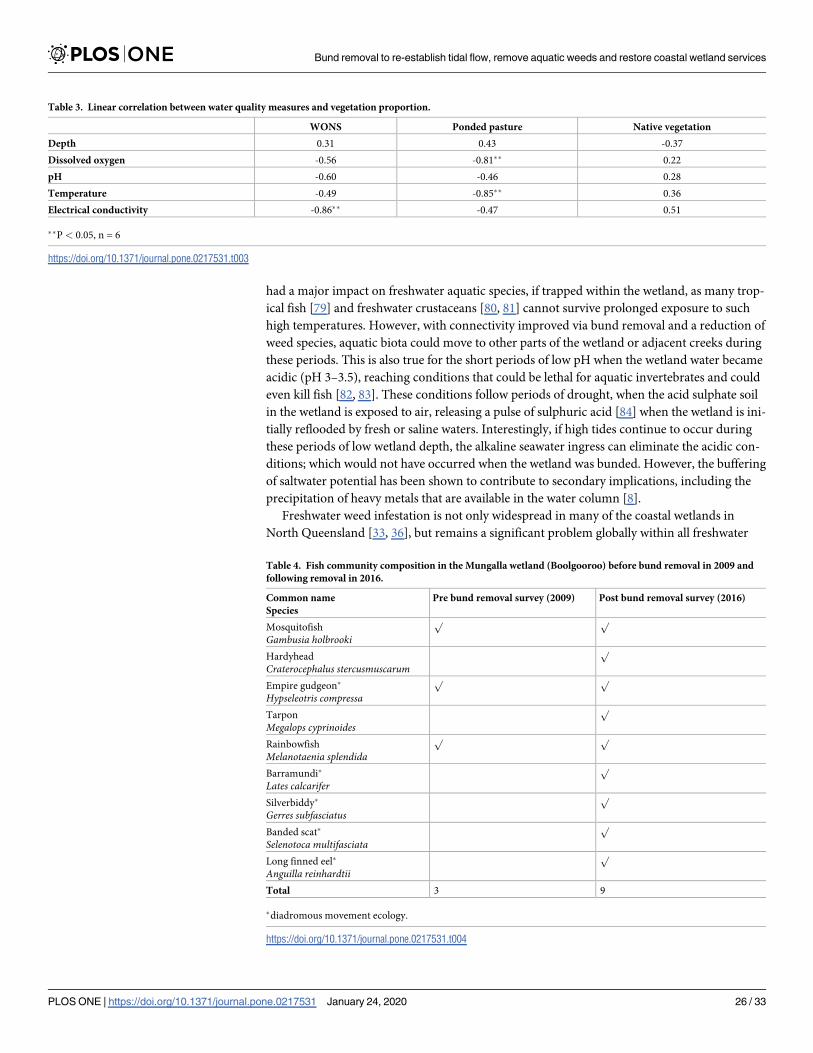
18) can still be assessed in general terms and with simple linear correlation (Table 3).
Most notable here are the significant correlations for WONS and Ponded pastures, with
WONS decreasing notably with increases in EC (Table 3), (Fig 18 – 2014 and 2015), and
increases in DO and Temperature occurring as ponded pastures decline from 2014 to 2016.
Fig 12. Autocorrelation of DO at the above bund locations, a) before and b) after bund removal. Lag distance here is 15 min with a 24-hr period represented by a
lag of 96.
https://doi.org/10.1371/journal.pone.0217531.g012
Bund removal to re-establish tidal flow, remove aquatic weeds and restore coastal wetland services
PLOS ONE | https://doi.org/10.1371/journal.pone.0217531 January 24, 2020 18 / 33
While not significant statistically the other correlation values in Table 3 do give an indication
of the relationship between variables, of note are the positive correlations for native vegetation,
DO, pH, Temperature and EC which are in contrast to exotic vegetation results.
Fish biodiversity
The fish community in Mungalla wetland prior to bund wall removal was of low abundance
and diversity in comparison with other coastal freshwater wetlands in the region [52], with
only three species recorded (Empire gudgeon, Hypseleotris compressa; Eastern rainbow fish,
Melanotaenia splendida inornata; the invasive Mosquitofish, Gambusia holbrooki) despite
sampling efforts comprised of a combination of cast nets, bait traps, electrofishing and visual
observation [49] (Table 4). The most abundant species was the empire gudgeon (Hypseleotriscompressa), which is widespread in the region owing to a diadromous movement ecology
where it migrates to access upstream and downstream river areas [53]. Presence of these spe-
cies suggests that they are tolerant of poor water quality (particularly low DO), as has been the
case in the wetlands prior to bund wall removal.
Post bund removal fish surveys conducted in May 2016, found the same three species iden-
tified before bund removal with an additional six species recorded, although the increased
number of species recorded is still low by local standards [52]. The most notable records in the
post bund survey were barramundi (Lates calcarifer), silver biddy (Gerres subfasciatus) and
Fig 13. Mean hourly DO for the post bund period– 2014 to 2017.
https://doi.org/10.1371/journal.pone.0217531.g013
Bund removal to re-establish tidal flow, remove aquatic weeds and restore coastal wetland services
PLOS ONE | https://doi.org/10.1371/journal.pone.0217531 January 24, 2020 19 / 33

banded scat (Selenotoca multifasciata); each of these species have a diadromous movement
ecology, requiring access to wetlands to fulfil critical life cycle stages.
Discussion
The restriction of seawater from coastal wetlands using earth bunds (e.g. dams, dykes or
levees) is widespread and has been seen to cause the degradation and/or loss of salt marsh eco-
systems worldwide [3, 9, 54]. Prolonged exclusion of seawater leads to the loss of native halo-
phytes and widespread invasions of freshwater species, in addition to major changes in
sedimentation rates and soil chemistry [55]. These hydrological changes not only influence
larger wetland species, but also microscopic species [56], as well as, more generally, nutrient
dynamics and water quality conditions [57, 58]. Recognition that these bunded wetlands are
not natural has led to an increasing number of tidal restoration projects [9]. For example,
Smith et al., [59] describe how freshwater plants are being replaced by native salt marsh plants
following the restoration of tidal flows to the Hatches Harbor salt marsh in Cape Cod, Massa-
chusetts, USA. In Australia, tidal flows were reinstated into coastal wetlands in the Hunter
estuary in New South Wales and this increased the area of salt marsh, largely through
Fig 14. The percentage of time DO exceed any given DO threshold in the Boolgooroo wetland. Vertical dashed lines represent critical values of DO affecting fish
species, a) acute trigger value, b) chronic trigger value and b) to c) optimal DO for fish species. From dissolved oxygen guidelines for freshwater habitats of Northern
Australia [51].
https://doi.org/10.1371/journal.pone.0217531.g014
Bund removal to re-establish tidal flow, remove aquatic weeds and restore coastal wetland services
PLOS ONE | https://doi.org/10.1371/journal.pone.0217531 January 24, 2020 20 / 33

expansion into areas of pasture [28]. Conversely seawater intrusion into coastal wetlands such
as the Gippsland lakes in Victoria [60] and the rivers in the Northern Territory [61] has also
caused changes in wetland ecology., These cases however, are generally seen as undesirable,
since they changed the wetlands from their natural freshwater state. These salinization effects
are reported worldwide and are attributed to a range of anthropogenic impacts including sea
level rise [62]. In the case of the Boolgooroo wetland on Mungalla station the removal of the
earth bund and subsequent reintroduction of tidal water ingress, returning the wetland to its
historical halophytic state was a desirable outcome, where the receipt of occasional tidal pulses
was enough to assist with naturally supressing invasive aquatic freshwater plant species.
The extent of tidal inundation in coastal floodplains, in terms of duration and frequency, is
critical in the delivery of successful restoration outcomes [63]; which has become particularly
relevant for managers when considering future climate change [64, 65]. Seawater entry into
the Mungalla wetlands does not occur often since, with the bund removed, only the highest of
tides, of approximately 3.6 m, are able to penetrate the wetland. These usually occur in
sequences of 2 to 3 consecutive days on four occasions during the summer (December to
March) and a similar number in winter (June to September). However, if the wetland contains
water deeper than ~ 0.4 m a ‘hydraulic barrier’ is formed meaning that tides effectively need to
be greater than 3.6 m to penetrate the wetland upstream of the bund wall location. This may
not happen frequently as tides in excess of 4.0 m only occur about once a year. Seawater ingress
is therefore more likely to happen when the wetland depths are lowest, either during late win-
ter or in years of low summer rainfall (experienced during this research program). However,
when hydraulic pressure is low during low rainfall years and in the pre-summer period the fre-
quency and duration of seawater ingress to the Boolgooroo region of the Mungalla wetland
can exceed that required to cause permanent damage to the invasive freshwater weeds. Salinity
Fig 15. Autocorrelation of pH at the above bund locations, a) before and b) after bund removal. Lag distance here is 15 min with a 24-hr
period represented by a lag of 96.
https://doi.org/10.1371/journal.pone.0217531.g015
Bund removal to re-establish tidal flow, remove aquatic weeds and restore coastal wetland services
PLOS ONE | https://doi.org/10.1371/journal.pone.0217531 January 24, 2020 21 / 33

tolerance tests carried out by Reid et al., [66] found that the growth and survival of Aleman
grass (Echinochloa polystachya), olive hymenachne (Hymenachne amplexicaulis), Para-grass
(Urochloa mutica) and water hyacinth (Eichhornia crassipes) were all affected by changes in
EC, even when exposed to only 30% seawater concentration for as little as a single day.
Although tolerance varied between these four weed species (Aleman grass being most toler-
ant), each had stopped photosynthesis and mortality rates were very high when exposed to
100% seawater equivalent for longer than 7 days. Clearly removal of the earth bund allowed
seawater to effectively penetrate the wetland on multiple occasions creating saline conditions
that would be expected to have a marked impact on the freshwater adapted weeds found above
the bund location. Indeed, surveys of the wetland vegetation before and after the removal of
the bund show that there was a large and relatively rapid reduction in freshwater weeds (pri-
marily olive hymenachne, water hyacinth and salvinia) above the bund location, with the re-
emergence of native salt tolerant plants after only 2–3 years. However, since wetland depth
and tidal height conditions required to change the wetland vegetation towards a more halo-
phytic composition may only occur in the driest of years (as in 2015), or during dry pre-sum-
mer conditions, there is a risk of the wetland reverting to dominance by invasive freshwater
species. In fact, this occurred in 2016 with an initial re-invasion of the floating species S.
molesta (salvinia) followed by some encroachment of ponded pastures from the wetland mar-
gins. Of great interest, following saltwater ingress, has been the expansion of Aleman grass (E.
Fig 16. Mean hourly pH for the post bund period– 2014 to 2017.
https://doi.org/10.1371/journal.pone.0217531.g016
Bund removal to re-establish tidal flow, remove aquatic weeds and restore coastal wetland services
PLOS ONE | https://doi.org/10.1371/journal.pone.0217531 January 24, 2020 22 / 33

polystachya), being the most tolerant to saline conditions [66], which will most likely continue
to dominate from the wetland margins inwards, replacing Para grass (U. mutica) and Hyme-
nachne (H. amplexicaulis) when conditions are suitable.
Fish accessing coastal transitional waters on floodplains is important for completion of life-
cycle stages [13, 67, 68], but this access is generally prohibited in urban, industrial and agricul-
tural areas because of human engineered modification to the natural landscape [69–71]. On
floodplains considerable effort has gone into restoring this connectivity for the purposes of
reconnecting fish access and extending habitat areas. Here, removing the bund wall resulted in
fish biodiversity increasing presumably as a result of amended connectivity between the wet-
land and the ocean, but also because of improved water quality conditions available for fish
when they access the wetland. The very poor water quality in the wetland, especially the
extremely low dissolved oxygen which would regularly expose, such as fish (and other aquatic
fauna), to acute and chronic hypoxia risks led to low fish numbers in the wetland prior to
bund removal. The low oxygen levels before bund removal were likely to have been due to the
presence of the dense mat of freshwater weeds that limited oxygen transfer and light penetra-
tion to the bottom of the wetland. The challenge of limited oxygen and light availability for
plant growth and respiration recovery in waterways is a global problem [72–76]. Butler and
Burrows [51] found that there were significant risks of acute exposure when DO was below
30% saturation (the ‘acute trigger value’ ATV). Prior to bund removal hypoxia risks were
severe, as DO was below the ATV threshold virtually 100% of the time. With the earth bund
removed, DO gradually increased in the first wet season (2013/14), but still fell below the ATV
Table 2. Area inhabited by vegetation groups (%).
Survey Year
Exotic aquatic plants 2012 2013 2014 2015 2016 2017
Aleman grass†
(Echinochloa polystachya)
1.85 3.12 1.18 10.26 4.87 18.93
Olive hymenachne�†
(Hymenachne amplexicaulis)48.94 43.04 12.61 5.11 10.51 5.23
Para grass†
(Urochloa mutica)
13.26 6.45 4.24 15.16 6.83 10.42
Salvinia�
(Salvinia molesta)
2.41 2.61 0.04 0.00 40.53 10.12
Water hyacinth�
(Eichhornia crassipes)2.68 16.72 0.55 0.03 0.00 0.00
Native aquatic plants
Bulkuru
(Eleocharis dulcis)0.00 0.00 0.00 11.46 0.26 2.59
Club rush
(Schoenoplectus litoralis)0.00 0.00 0.00 0.00 0.00 0.10
Duck weed
(Spirodela punctata)0.00 0.00 0.31 3.57 0.00 0.00
Water lilily
(Nymphaea gigantea)
2.66 10.16 3.31 14.07 12.91 17.54
Other
Open Water 24.56 13.38 73.71 36.38 20.56 31.70
Satellite classification (% of site) showing pre (2012/13) and post (2014–2017) bund removal.
�Weeds of national significance
†Ponded pasture grasses.
https://doi.org/10.1371/journal.pone.0217531.t002
Bund removal to re-establish tidal flow, remove aquatic weeds and restore coastal wetland services
PLOS ONE | https://doi.org/10.1371/journal.pone.0217531 January 24, 2020 23 / 33
Bund removal to re-establish tidal flow, remove aquatic weeds and restore coastal wetland services
PLOS ONE | https://doi.org/10.1371/journal.pone.0217531 January 24, 2020 24 / 33
for 93% of the time. The improvement in DO was more dramatic following the 2014 dry sea-
son, where DO only fell below the ATV for 49% of the time. Given the normal diurnal cycling
of DO at the bottom of a wetland [77], these latter trigger value failures should not present a
high risk to fish that can swim towards the surface where DO would be higher [78]. An aquatic
ecology survey of the Mungalla wetlands completed 4 years before the bund was removed [78]
found that the weed infested sections of the wetland did not provide suitable habitat refugia
for most fish species, and created conditions that increase the wetlands’ susceptibility to acute
episodic periods of low dissolved oxygen. That study also showed that water quality was better
in ‘open’ (weed free) parts of the wetland. This was probably the habitat (22% of the wetland
area) where the few species of fish (3 species) existed at that time (May 2009). Reduction of
wetland depth following bund removal may also pose a risk to wetland biota via its effect on
water temperature. Water temperatures recorded above the Mungalla bund location did not
exceed 34˚C either before (2013) or after (2014) removal. Therefore, bund removal per se did
not affect the wetland thermal regime. However, when water depths were very shallow (< 40
cm), as in the 2015 wet season, due to the very low rainfall in that year, temperatures exceeded
31˚C over 60% of the time, 34˚C for 35% of the time. These higher temperatures could have
Fig 17. Changes in vegetation from 2012 to 2017. The white outline in (a) represents the Boolgooroo region on which
change analysis was based. Charts on the bottom of the figure represent changes in exotic/native vegetation and open water
(colours correspond to the classification key).
https://doi.org/10.1371/journal.pone.0217531.g017
Fig 18. Yearly mean water quality and vegetation proportions. Shown are the mean water quality measures within the above bund location of the Boolgooroo wetland
with vegetation grouped into weeds of national significance, Ponded pastures and native vegetation.
https://doi.org/10.1371/journal.pone.0217531.g018
Bund removal to re-establish tidal flow, remove aquatic weeds and restore coastal wetland services
PLOS ONE | https://doi.org/10.1371/journal.pone.0217531 January 24, 2020 25 / 33
had a major impact on freshwater aquatic species, if trapped within the wetland, as many trop-
ical fish [79] and freshwater crustaceans [80, 81] cannot survive prolonged exposure to such
high temperatures. However, with connectivity improved via bund removal and a reduction of
weed species, aquatic biota could move to other parts of the wetland or adjacent creeks during
these periods. This is also true for the short periods of low pH when the wetland water became
acidic (pH 3–3.5), reaching conditions that could be lethal for aquatic invertebrates and could
even kill fish [82, 83]. These conditions follow periods of drought, when the acid sulphate soil
in the wetland is exposed to air, releasing a pulse of sulphuric acid [84] when the wetland is ini-
tially reflooded by fresh or saline waters. Interestingly, if high tides continue to occur during
these periods of low wetland depth, the alkaline seawater ingress can eliminate the acidic con-
ditions; which would not have occurred when the wetland was bunded. However, the buffering
of saltwater potential has been shown to contribute to secondary implications, including the
precipitation of heavy metals that are available in the water column [8].
Freshwater weed infestation is not only widespread in many of the coastal wetlands in
North Queensland [33, 36], but remains a significant problem globally within all freshwater
Table 3. Linear correlation between water quality measures and vegetation proportion.
WONS Ponded pasture Native vegetation
Depth 0.31 0.43 -0.37
Dissolved oxygen -0.56 -0.81�� 0.22
pH -0.60 -0.46 0.28
Temperature -0.49 -0.85�� 0.36
Electrical conductivity -0.86�� -0.47 0.51
��P < 0.05, n = 6
https://doi.org/10.1371/journal.pone.0217531.t003
Table 4. Fish community composition in the Mungalla wetland (Boolgooroo) before bund removal in 2009 and
following removal in 2016.
Common name
Species
Pre bund removal survey (2009) Post bund removal survey (2016)
Mosquitofish
Gambusia holbrooki
p p
Hardyhead
Craterocephalus stercusmuscarum
p
Empire gudgeon�
Hypseleotris compressa
p p
Tarpon
Megalops cyprinoides
p
Rainbowfish
Melanotaenia splendida
p p
Barramundi�
Lates calcarifer
p
Silverbiddy�
Gerres subfasciatus
p
Banded scat�
Selenotoca multifasciata
p
Long finned eel�
Anguilla reinhardtii
p
Total 3 9
�diadromous movement ecology.
https://doi.org/10.1371/journal.pone.0217531.t004
Bund removal to re-establish tidal flow, remove aquatic weeds and restore coastal wetland services
PLOS ONE | https://doi.org/10.1371/journal.pone.0217531 January 24, 2020 26 / 33

systems [85, 86], with the primary control mechanisms being herbicide and mechanical
removal [36, 87, 88]. However, these methods are expensive, can have undesirable ecological
consequences, and are only effective for a limited time. In some cases, these methods have
been shown to have little to no impact [89]. For example, in the years before bund removal on
Boolgooroo chemical spraying with herbicide did increase the open water area, but this mitiga-
tion measure provided only a temporary solution with aquatic weeds such as olive hyme-
nachne again present only 2–3 months after spraying and Aleman grass largely unaffected
most likely due to herbicide resistance at the application rates used [90]. Although spraying
with more ecologically acceptable saline water has been attempted for control of water hya-
cinth [91] it is not yet widely used for freshwater weed control. With approximately 30% of
coastal wetlands being bunded in the Great Barrier Reef region [92], removal of an earth bund
or levee could provide a more cost effective and sustainable means of controlling freshwater
weeds and improving water quality. However, landholders and government do still need to
take care to fully consider tidal boundary laws and amendments when considering ponded
pasture reconversion projects [93].
Conclusions
With the limited success of control methods to restore wetlands as productive coastal features
in the Great Barrier Reef catchment area, this study revealed that reinstatement of tidal flows
into bunded estuarine wetlands is relatively effective in the removal of some freshwater weeds
and ponded pastures. As a passive remediation method reintroduction of tidal flow is a sus-
tainable, efficient and cost-effective management option for restoring aesthetic and ecological
values of coastal wetlands. Surprisingly, gross changes towards a more natural system occurred
within a relatively short timeframe, with the reappearance of native vegetation, Water lilies
and Bulkuru, improvements in water quality and fish biodiversity taking less than 3 years.
However, the weight of evidence presented here after 5 years of monitoring, shows that the
abundance of native and invasive plant species appears to oscillate depending on seasonal rain-
fall which can induce hydrologic pressure to repress tidal water ingress, which in turn drives
dissolved oxygen and temperature regimes (through vegetation and depth changes) within the
wetland, affecting fish occupancy. These changes are modelled conceptually in Fig 19, describ-
ing what is happening on the Mungalla wetland post-bund removal, showing the oscillation or
cycle between freshwater and saltwater tolerant plant species, associated water quality, and fish
presence, associated with the preceding years’ weather conditions (primarily summer rainfall).
Variation in wetland salinity, due to tidal intrusion, and related species and water quality
variation described here may be viewed as a short term effect with the wetland reaching an
equilibrium similar to other local natural estuarine wetlands in the longer term, i.e. Bulkuru
dominant toward the seaward end of the wetlands along with other saltmarsh-adapted species.
Vegetation in the upper reaches will most likely remain primarily freshwater adapted species,
with tidal influence in only very dry years (such as 2015). A particularly interesting outcome
from this research has been the replacement of other ponded pastures by Aleman grass (Echi-nochloa polystachya). Aleman grass appears to be tolerant of marginally brackish conditions–
giving it the ability to reinvade on years of lower tidal ingress, and has already shown some
herbicide resistance [90]. Further research is necessary to understand more around the effects
of saltwater impact on Aleman grass, including a combination of herbicide and seawater treat-
ment, as removal of this grass may become the next challenge.
Whilst reinstatement of tidal flow has been successfully applied elsewhere to restore eco-
logical function, this study appears to be the first of its kind targeting wetland weeds and spe-
cifically ponded pastures in the Great Barrier Reef region, and as such is an important case
Bund removal to re-establish tidal flow, remove aquatic weeds and restore coastal wetland services
PLOS ONE | https://doi.org/10.1371/journal.pone.0217531 January 24, 2020 27 / 33

study for similar restoration efforts needed to effect reef water quality and the Australian gov-
ernment’s plan of coastal wetland restoration and protection under the Reef 2050 plan[94].
Acknowledgments
The authors would like to acknowledge and thank the Traditional Owners, the Nywaigi people,
for allowing this important project to be sited on Mungalla and for having the desire to reha-
bilitate their country. A special thanks to Mr J. Cassady, who encouraged and supported this
project, we also acknowledge the important role Dr T. Grice has had in the establishment and
conduct of the scientific monitoring. Thanks to Mr B. Butler for discussions on thermal and
hypoxia tolerances on wetland aquatic species.
Author Contributions
Conceptualization: Brett N. Abbott, David M. Nicholas.
Data curation: Brett N. Abbott.
Formal analysis: Brett N. Abbott, Jim Wallace, Fazlul Karim, Nathan J. Waltham.
Funding acquisition: Brett N. Abbott, David M. Nicholas.
Fig 19. Conceptual model showing changes due to seasonal oscillations within the shallow Boolgooroo region of the Mungalla wetlands. This oscillation/cycle is
likely to occur on other shallow wetlands if this method of passive remediation is employed.
https://doi.org/10.1371/journal.pone.0217531.g019
Bund removal to re-establish tidal flow, remove aquatic weeds and restore coastal wetland services
PLOS ONE | https://doi.org/10.1371/journal.pone.0217531 January 24, 2020 28 / 33
Investigation: Brett N. Abbott, David M. Nicholas, Fazlul Karim, Nathan J. Waltham.
Methodology: Brett N. Abbott, Jim Wallace, Fazlul Karim, Nathan J. Waltham.
Project administration: Brett N. Abbott, David M. Nicholas.
Supervision: Brett N. Abbott, David M. Nicholas.
Writing – original draft: Brett N. Abbott, Jim Wallace, Nathan J. Waltham.
Writing – review & editing: Brett N. Abbott, Jim Wallace, David M. Nicholas, Fazlul Karim,
Nathan J. Waltham.
References
1. Barbier E, B., Hacker SD, Kennedy C, Koch EW, Stier AC, Silliman BR. Thevalue of estuarine and
coastal ecosystem services. Ecol Monogr. 2011; 81:169–93.
2. Lee SY, Dunn RJK, Young RA, Connolly RM, Dale PER, Dehayr R, et al. Impact of urbanization on
coastal wetland structure and function. Austral Ecology. 2006; 31:149–63.
3. Barbier EB, Hacker SD, Kennedy C, Koch EW, Stier AC, Silliman BR. The value of estuarine and
coastal ecosystem services. Ecological Monographs. 2011; 81(2):169–93.
4. Lee S, Dunn R, Young R, Connolly R, Dale P, Dehayr R, et al. Impact of urbanization on coastal wetland
structure and function. Austral Ecology. 2006; 31(2):149–63.
5. Costanza R, d’Arge R, De Groot R, Farber S, Grasso M, Hannon B, et al. The value of the world’s eco-
system services and natural capital. 1997; 387(6630):253.
6. Waltham NJ, Sheaves M. Expanding coastal urban and industrial seascape in the Great Barrier Reef
World Heritage Area: Critical need for coordinated planning and policy. Marine Policy. 2015; 57:78–84.
7. Murray NJ, Phinn SR, DeWitt M, Ferrari R, Johnston R, Lyons MB, et al. The global distribution and tra-
jectory of tidal flats. Nature. 2019; 565(7738):222. https://doi.org/10.1038/s41586-018-0805-8 PMID:
30568300
8. Luke H, Martens MA, Moon EM, Smith D, Ward NJ, Bush RT. Ecological restoration of a severely
degraded coastal acid sulfate soil: A case study of the East Trinity wetland, Queensland. Ecological
Management & Restoration. 2017; 18(2):103–14.
9. Gedan KB, Silliman BR, Bertness MD. Centuries of Human-Driven Change in Salt Marsh Ecosystems.
Annual Review of Marine Science. 2009; 1:117–41. https://doi.org/10.1146/annurev.marine.010908.
163930 PMID: 21141032
10. Howe AJ, Rodrıguez JF, Spencer J, MacFarlane GR, Saintilan N. Response of estuarine wetlands to
reinstatement of tidal flows. Marine and Freshwater Research. 2010; 61:702–13.
11. Li F, Pennings SC. Response and Recovery of Low-Salinity Marsh Plant Communities to Presses and
Pulses of Elevated Salinity. Estuaries and Coasts. 2018:1–11.
12. Creighton C, Hobday AJ, Lockwood M, Pecl GT. Adapting management of marine environments to a
changing climate: a checklist to guide reform and assess progress. Ecosystems. 2016; 19(2):187–219.
13. Weinstein MP, Litvin SY. Macro-restoration of tidal wetlands: a whole estuary approach. Ecological
Restoration. 2016; 34(1):27–38.
14. Crooks S, D. Herr, J. Tamelander, D. Laffoley, and J. Vandever. “Mitigating Climate Change through
Restoration and Management of Coastal Wetlands and Near-shore Marine Ecosystems: Challenges
and Opportunities.” Environment department papers;no. 121. Washington, DC.: World Bank; 2011.
15. Chmura GL, Anisfeld SC, Cahoon DR, Lynch JCJGbc. Global carbon sequestration in tidal, saline wet-
land soils. 2003; 17(4).
16. Authority GBRMP. Great Barrier Reef Region Strategic Assessment: Strategic assessment report.
Report ER. Townsville: Great Barrier Reef Marine Park Authority; 2014 2014.
17. Arthington AH, Godfrey PC, Pearson RG, Karim F, Wallace J. Biodiversity values of remnant freshwater
floodplain lagoons in agricultural catchments: evidence for fish of the Wet Tropics bioregion, northern
Australia. Aquatic Conservation: Marine and Freshwater Ecosystems. 2015; 25:336–52.
18. McCook LJ, Ayling T, Cappo M, Choat JH, Evans RD, De Freitas DM, et al. Adaptive management of
the Great Barrier Reef: a globally significant demonstration of the benefits of networks of marine
reserves. Proc Natl Acad Sci U S A. 2010; 107(43):18278–85. https://doi.org/10.1073/pnas.
0909335107 PMID: 20176947
Bund removal to re-establish tidal flow, remove aquatic weeds and restore coastal wetland services
PLOS ONE | https://doi.org/10.1371/journal.pone.0217531 January 24, 2020 29 / 33

19. Pearson RG, Godfrey PC, Arthington AH, Wallace J, Karim F, Ellison M. Biophysical status of remnant
freshwater floodplain lagoons in the Great Barrier Reef catchment: a challenge for assessment and
monitoring. Marine and Freshwater Research. 2013; 64(3):208–22.
20. Houston WA, Duivenvoorden LJ. Replacement of littoral native vegetation with the ponded pasture
grass Hymenachne amplexicaulis: effects on plant, macroinvertebrate and fish biodiversity of backwa-
ters in the Fitzroy River, Central Queensland, Australia. Marine and Freshwater Research. 2002;
53:1235–44.
21. Landers JC, Knuth BAJEM. Use of wetlands for water quality improvement under the USEPA Region V
clean lakes program. 1991; 15(2):151–62.
22. Grice AC, Cassady J, Nicholas DM. Indigenous and non-Indigenous knowledge and values combine to
support management of Nywaigi lands in the Queensland coastal tropics. Ecological Management &
Restoration. 2012; 13:93–7.
23. Dobbs RJ, Davies CL, Walker ML, Pettit NE, Pusey BJ, Close PG, et al. Collaborative research partner-
ships inform monitoring and management of aquatic ecosystems by Indigenous rangers. Rev Fish Biol
Fisher. 2016; 26(4):711–25.
24. Sheaves M, Brookes J, Coles R, Freckelton M, Groves P, Johnston R, et al. Repair and revitalisation of
Australia׳ s tropical estuaries and coastal wetlands: Opportunities and constraints for the reinstatement
of lost function and productivity. Marine Policy. 2014; 47:23–38.
25. Stumpf R, Haines JW. Variations in tidal level in the Gulf of Mexico and implications for tidal wetlands.
Estuarine, Coastal and Shelf Science. 1998; 46:165–73.
26. Great Barrier Reef Marine Park Authority. Great Barrier Reef Region Strategic Assessment: Strategic
assessment report. Townsville: GBRMPA; 2014.
27. Sheaves M, Brookes J, Coles R, Freckelton M, Groves P, Johnston R, et al. Repair and revitalisation of
Australia׳s tropical estuaries and coastal wetlands: Opportunities and constraints for the reinstatement
of lost function and productivity. Marine Policy. 2014; 47:23–38.
28. Howe AJ, Rodrıguez JF, Spencer J, MacFarlane GR, Saintilan N. Response of estuarine wetlands to
reinstatement of tidal flows. Marine and Freshwater Research. 2010; 61(6):702–13.
29. GBRMPA. Coastal ecosystems management—case study: water quality management. Townsville:
Australian Government; 2013.
30. Waltham NJ, Burrows D, Wegscheidl C, Buelow C, Ronan M, Connolly N, et al. Lost Floodplain Wetland
Environments and Efforts to Restore Connectivity, Habitat, and Water Quality Settings on the Great
Barrier Reef. Frontiers in Marine Science. 2019; 6(71).
31. Arthington AH, Godfrey PC, Pearson RG, Karim F, Wallace J. Biodiversity values of remnant freshwater
floodplain lagoons in agricultural catchments: evidence for fish of the Wet Tropics bioregion, northern
Australia. Aquatic Conservation: Marine and Freshwater Ecosystems. 2015; 25(3):336–52.
32. Pearson R, Godfrey P, Arthington A, Wallace J, Karim F, Ellison M. Biophysical status of remnant fresh-
water floodplain lagoons in the Great Barrier Reef catchment: a challenge for assessment and monitor-
ing. Marine and Freshwater Research. 2013; 64(3):208–22.
33. Butler B, Dominica L, Damien B, Glenn M. AQUATIC ECOLOGY ASSESSMENT OF MUNGALLA
WETLANDS. ACTFR Report. Townsville: Australian Centre for Tropical Freshwater Research; 2009
2009. Report No.: 09/38.
34. Veitch V, Sawynok B, Authority GBRMP, Queensland S. Freshwater wetlands and fish: importance of
freshwater wetlands to marine fisheries resources in the Great Barrier Reef. Townsville, Qld.: The
Authority; 2005 2005.
35. Flint N, Crossland M, Pearson R. Sublethal effects of fluctuating hypoxia on juvenile tropical Australian
freshwater fish. Marine and Freshwater Research. 2015; 66(4):293.
36. Perna CN, Cappo M, Pusey BJ, Burrows DW, Pearson RG. Removal of Aquatic Weeds Greatly
Enhances Fish Community Richness and Diversity: An Example from the Burdekin River Floodplain,
Tropical Australia. River Research and Applications. 2012; 28:1093–104.
37. Staines S. History of the first occupation of Mungalla by the Atkinson Family—Transcription from origi-
nal letter by Richard Wallace. Townsville; 1990.
38. Middleton CH, editor History of para grass in Queensland. Probing ponded pastures workshop; 1991
1991: Queensland Department of Primary Industries and Department of Environment and Heritage.
39. Wildin JH, editor Ponded pasture systems. Probing Ponded Pastures Workshop; 1991 July 16–18
1991. Rockhamton: University of Central Queensland.
40. Register of Australian Herbage Plant Cultivars. A: Grasses, 24. Hymenachne and 25. Aleman. Austra-
lian Journal of Experimental Agriculture. 1989; 29:293–4.
Bund removal to re-establish tidal flow, remove aquatic weeds and restore coastal wetland services
PLOS ONE | https://doi.org/10.1371/journal.pone.0217531 January 24, 2020 30 / 33

41. Csurhes S, Edwards R. Potential Environmental Weeds in Australia: Candidate Species for Preventa-
tive Control. Canberra: Department of Environment and Heritage; 1998 1998.
42. Csurhes SM, Macka AP, Fitzsimmons L. Hymenachne (Hymenachne amplexicaulis) in Queensland.
Brisbane, Australia: Department of Natural Resources; 1999 1999.
43. Wearne LJ, Clarkson J, Grice AC, van Klinken RD, Vitelli JS. The biology of Australian weeds 56.
Hymenachne amplexicaulis (Rudge) Nees. Plant Protection Quarterly. 2010; 25:146–61.
44. Grice AC. A STRATEGY FOR THE MANAGEMENT OF THE MUNGALLA WETLANDS. Strategy.
Townsville, QLD, Australia: CSIRO; 2008 November 2008.
45. Karim F, Nicholas M, Grice T, Marvanek S, Wallace J. Hydrodynamic modelling of seawater intrusion in
a riverine wetland in north Queensland, Australia. Hydrology and Water Resources Symposium 2014.
2014:645.
46. Blackman JG, Perry TW, Ford GI, Craven SA, Gardener SJ, De Lai RJ. Characteristics of important
wetlands in Queensland / J.G. Blackman . . . [et al.]. Brisbane: Queensland Government, Environmental
Protection Agency; 1999 1999.
47. Karim F, Nicholas M, Grice T, Marvanek S, Wallace J, editors. Hydrodynamic modelling of seawater
intrusion in a riverine wetland in north Queensland, Australia. Hydrology and Water Resources Sympo-
sium 2014; 2014: Engineers Australia.
48. Knight J, Corcoran J, Rampi L, Pelletier K. Theory and Applications of Object-Based Image Analysis
and Emerging Methods in Wetland Mapping. 2015. p. 574 pp.
49. Butler B, Dominica L, Damien B, Glenn M. Aquatic ecology assessment of the Mungalla wetlands: May
to August 2009. ACTFR Report. Townsville: Australian Centre for Tropical Freshwater Research; 2009
2009. Report No.: 09/38.
50. Wallace J, Waltham N, Burrows D. A comparison of temperature regimes in dry-season waterholes in
the Flinders and Gilbert catchments in northern Australia. Marine and Freshwater Research. 2017; 68
(4):650–67.
51. Butler B, Burrows DW. Dissolved oxygen guidelines for freshwater habitats of northern Australia. 2007
2007.
52. Waltham N, Davis A. Fish survey Lilliesmere creek: Pre-fish barrier construction. 2016 2016.
53. Pusey B, Kennard M, Arthington A. Freshwater fishes of north-eastern Australia: CSIRO publishing;
2004.
54. Rozas L P., Reed D J. Comparing nekton assemblages of subtidal habitats in pipeline canals traversing
brackish and saline marshes in coastal Louisiana1994. 262–75 p.
55. Portnoy JW. Salt Marsh Diking and Restoration: Biogeochemical Implications of Altered Wetland
Hydrology. Environ Manage. 1999; 24(1):111–20. https://doi.org/10.1007/s002679900219 PMID:
10341067
56. Ferreira J, Wolff W, Simas T, Bricker S. Does biodiversity of estuarine phytoplankton depend on hydrol-
ogy? Ecological Modelling. 2005; 187(4):513–23.
57. Newton A, Mudge SM. Lagoon-sea exchanges, nutrient dynamics and water quality management of
the Ria Formosa (Portugal). Estuarine, Coastal and Shelf Science. 2005; 62(3):405–14.
58. Bullock JM, Aronson J, Newton AC, Pywell RF, Rey-Benayas JM. Restoration of ecosystem services
and biodiversity: conflicts and opportunities. Trends in ecology & evolution. 2011; 26(10):541–9.
59. Smith SM, Roman CT, James-Pirri M-J, Chapman K, Portnoy J, Gwilliam E. Responses of Plant Com-
munities to Incremental Hydrologic Restoration of a Tide-Restricted Salt Marsh in Southern New
England (Massachusetts, U.S.A.). Restoration Ecology. 2009; 17(5):606–18.
60. Boon PI, Cook P, Woodland R. The Gippsland Lakes: management challenges posed by long-term
environmental change. Marine and Freshwater Research. 2016; 67(6):721–37.
61. Winn K, Saynor M, Eliot M, Elio I. Saltwater intrusion and morphological change at the mouth of the
East Alligator River, Northern Territory. Journal of Coastal research. 2006:137–49.
62. Herbert ER, Boon P, Burgin AJ, Neubauer SC, Franklin RB, Ardon M, et al. A global perspective on wet-
land salinization: ecological consequences of a growing threat to freshwater wetlands. Ecosphere.
2015; 6(10):1–43.
63. Tempest JA, Harvey GL, Spencer KL. Modified sediments and subsurface hydrology in natural and rec-
reated salt marshes and implications for delivery of ecosystem services. Hydrological Processes. 2015;
29(10):2346–57.
64. Oosterlee L, Cox TJ, Vandenbruwaene W, Maris T, Temmerman S, Meire P. Tidal marsh restoration
design affects feedbacks between inundation and elevation change. Estuaries and coasts. 2018; 41
(3):613–25.
Bund removal to re-establish tidal flow, remove aquatic weeds and restore coastal wetland services
PLOS ONE | https://doi.org/10.1371/journal.pone.0217531 January 24, 2020 31 / 33

65. Van Coppenolle R, Temmerman S. A global exploration of tidal wetland creation for nature-based flood
risk mitigation in coastal cities. Estuarine, Coastal and Shelf Science. 2019:106262.
66. Reid B, Grice T, Holtum J, Nicholas M, Wallace J, Waltham N. Assessing the potential for controlling
four invasive aquatic plant species (aleman grass, water hyacinth, olive hymenachne and para grass)
using seawater in northern Australian coastal wetlands. Townwsville: James Cook University; 2018.
67. Poulakis GR, Shenker JM, Taylor S. Habitat use by fishes after tidal reconnection of an impounded
estuarine wetland in the Indian River Lagoon, Florida (USA). Wetlands Ecology and Management.
2002; 10:51–69.
68. Rozas LP, Minello TJ. Effects of structural marsh management on fishery species and other nekton
before and during a spring drawdown. Wetlands Ecology and Management. 1999; 7(3).
69. Bishop KA, Pidgeon RWJ, Walden DJ. Studies on fish movement dynamics in a tropical floodplain river:
Prerequisites for procedure to monitor the impacts of mining. Australian Journal of Ecology. 1995;
20:81–107.
70. Gillanders BM, Kingsford MJ. Impact of changes in flow of freshwater on estuarine and open coastal
habitats and the associated organisms. Oceanography and Marine Biology. 2002; 40:233–309.
71. Waltham NJ, Burrows D, Wegscheidl C, Buelow C, Ronan M, Connolly N, et al. Lost floodplain wetland
environments and efforts to restore connectivity, habitat and water quality settings on the Great Barrier
Reef. Frontiers in Marine Science. 2019; 6:71.
72. Sharma A, Aggarwal NK, Saini A, Yadav A. Beyond biocontrol: water hyacinth-opportunities and chal-
lenges. Journal of Environmental Science and Technology. 2016; 9(1):26–48.
73. Villamagna AM, Murphy BR. Ecological and socio-economic impacts of invasive water hyacinth (Eich-
hornia crassipes): a review. Freshwater Biology. 2010; 55(2):282–98.
74. Waltham N, Fixler S. Aerial herbicide spray to control invasive water hyacinth (Eichhornia crassipes):
Water quality concerns fronting fish occupying a tropical floodplain wetland. Tropical Conservation Sci-
ence. 2017; 10:1940082917741592.
75. Wang Z, Zhang Z, Zhang J, Zhang Y, Liu H, Yan S. Large-scale utilization of water hyacinth for nutrient
removal in Lake Dianchi in China: the effects on the water quality, macrozoobenthos and zooplankton.
Chemosphere. 2012; 89(10):1255–61. https://doi.org/10.1016/j.chemosphere.2012.08.001 PMID:
22939513
76. Yan S-H, Song W, Guo J-Y. Advances in management and utilization of invasive water hyacinth (Eich-
hornia crassipes) in aquatic ecosystems–a review. Critical reviews in biotechnology. 2016:1–11. https://
doi.org/10.3109/07388551.2013.811636
77. Mitsch WJ, Gosselink JG. Wetlands. 2nd ed. New York: Van Nostrand Reinhold; 1993.
78. Butler B, Loong D, Burrows D, Morgan G. Aquatic ecology assessment of Mungalla wetlands. James
Cook University: TropWATER; 2009.
79. Burrows D, Butler B. Priminary studies of temperature regimes and temperature tolerance of aquatic
fauna in freshwater habitats of northern Australia. Australian Centre of Tropical Freshwater Research
(12/01): James Cook University, Townsville; 2012. Contract No.: 12/01.
80. Waltham NJ. Acute thermal effects in an inland freshwater crab Austrothelphusa transversa (von Mar-
tens, 1868) occupying seasonal, tropical rivers. Journal of Crustacean Biology. 2018; 38(4):497–503.
81. Stewart BA, Close PG, Cook PA, Davies PM. Upper thermal tolerances of key taxonomic groups of
stream invertebrates. Hydrobiologia. 2013; 718(1):131–40.
82. AJSaL R. Extreme pH value, In Water Quality Criteria for Freshwater Fish. 2nd Edition ed. London,
UK.: Butterworth-Heinemann; 1982.
83. Australian and New Zealand Environment andConservation Council AaRCoAaNZ. Australian and New
Zealand guidelines for freshand marine water quality. Volume 2, Aquaticecosystems. Australia: Envi-
ronment Australia; 2000.
84. Cook FJ, Hicks W, Gardner EA, Carlin GD, Froggatt DW. Export of Acidity in Drainage Water from Acid
Sulphate Soils. Marine Pollution Bulletin. 2000; 41(7):319–26.
85. Murphy K. Aquatic weed problems and their management: a review I. The worldwide scale of the
aquatic weed problem. Crop Protection. 1988; 7(4):232–48.
86. Hussner A, Stiers I, Verhofstad M, Bakker E, Grutters B, Haury J, et al. Management and control meth-
ods of invasive alien freshwater aquatic plants: a review. Aquatic Botany. 2017; 136:112–37.
87. Veitch V, Burrows D, Hudson D, Butler B. Removal of Aquatic Weeds From Lagoon Creek, Herbert
Catchment North Queensland: Trialling Novel Removal Methods and Demonstration of Environmental
Benefits. Townsville, Australia: Australian Centre for Tropical Freshwater Research; 2007. Report No.:
07/15.
Bund removal to re-establish tidal flow, remove aquatic weeds and restore coastal wetland services
PLOS ONE | https://doi.org/10.1371/journal.pone.0217531 January 24, 2020 32 / 33

88. Chisholm WP, editor Review of aquatic weed control methods in New Zealand. Proceedings of the 15th
Australian Weeds Conference (C Preston, JH Watts, ND Crossman, eds) Weed Management Society
of South Australia, Adelaide, Australia; 2006.
89. Hurst T, Boon PI. Agricultural weeds and coastal saltmarsh in south-eastern Australia: an insurmount-
able problem? Australian journal of botany. 2016; 64(4):308–24.
90. Lemcke B. Aleman Grass—A high value grazing species grown in flooded or ponded areas. Northern
Territory, Australia; 2019.
91. Veitch V, Tait J, Burrows DW. Fish passage connectivity issues lower Sheep Station Creek: dry and wet
season investigations of water quality and fish assemblages. James Cook University, Townsville: Aus-
tralian Centre for Tropical Freshwater Research (08/02); 2008. Contract No.: 08/02.
92. Great Barrier Reef Marine Park Authority. Informing the outlook for Great Barrier Reef coastal ecosys-
tems. Townsville, Australia.: Great Barrier Reef Marine Park Authority; 2012.
93. Bell-James J, Lovelock CE. Tidal boundaries and climate change mitigation–the curious case of ponded
pastures. Australian Property Law Journal. 2019; 27(2):114–33.
94. Great Barrier Reef Marine Park Authority. Reef 2050 Long-Term Sustainability Plan. Australia: Com-
monwealth of Australia; 2018.
Bund removal to re-establish tidal flow, remove aquatic weeds and restore coastal wetland services
PLOS ONE | https://doi.org/10.1371/journal.pone.0217531 January 24, 2020 33 / 33