burden of healthcare associated infection (bhai
TRANSCRIPT
I
ResearchReport/Date8April2016
Burden of Healthcare Associated
Infection (BHAI)
- evidence-based and comorbidity-
adjusted outcome trees for estimation
of burden of disease -
Prepared by Robert Koch Institute, Germany:
Muna Abu Sin, Hans‐Peter Blank, Tanja Ducomble, Tim Eckmanns, Sebastian Haller, Thomas Harder,
Anja Klingeberg, Ute Preuß, Madlen Sixtensson, Edward Velasco, Bettina Weiß
Correspondence address:
Tim Eckmanns
Robert Koch Institute
Seestraße 10
D‐13353 Berlin‐Wedding
Germany
Email: [email protected]
Phone: +49 30 18754 3485

II
Acknowledgements
We thank all external experts Benedetta Allegranzi, WHO, Philipp Deindl, University Hamburg, Maria
Deja, Charité, Mathias Pletz, University Jena, Walter Zingg, University Geneva and the supporting
team of the ECDC Alessandro Cassini, Andreas Jansen, Diamantis Plachouras, Carl Suetens.
III
Table of Content
1 Introduction ................................................................................................................................... 10
1.1 Objective................................................................................................................................ 10
2 Methods ........................................................................................................................................ 11
2.1 Outcome tree ........................................................................................................................ 11
2.2 Selection and definition of HAI .............................................................................................. 11
2.3 Systematic literature search, data extraction and data synthesis ........................................ 12
3 Methods, Results and Discussion of five HAIs ............................................................................... 15
3.1 Urinary tract infection ........................................................................................................... 16
3.1.1 Methods ........................................................................................................................ 16
3.1.2 Results ........................................................................................................................... 17
3.1.3 Discussion ...................................................................................................................... 23
3.2 Primary blood stream infection (BSI) in Adults ..................................................................... 25
3.2.1 Methods ........................................................................................................................ 25
3.2.2 Results ........................................................................................................................... 28
3.2.3 Discussion ...................................................................................................................... 40
3.3 Neonatal sepsis ...................................................................................................................... 45
3.4 Clostridium difficile infection ................................................................................................ 46
3.4.1 Methods ........................................................................................................................ 46
3.4.2 Results ........................................................................................................................... 49
3.4.3 Discussion ...................................................................................................................... 64
3.5 Pneumonia and lower respiratory tract infection ................................................................. 68
3.5.1 Methods ........................................................................................................................ 68
3.5.2 Results ........................................................................................................................... 69
3.5.3 Discussion ...................................................................................................................... 77
4 General Discussion and Outlook ................................................................................................... 81
5 Appendices .................................................................................................................................... 84
5.1 Urinary tract infection (UTI) .................................................................................................. 84
IV
5.2 Primary blood stream infection (BSI) in Adults ..................................................................... 96
5.3 Clostridium difficile infection (CDI) ..................................................................................... 143
5.4 Pneumonia and lower respiratory tract infection (LRTI) ..................................................... 174
6 Bibliography ................................................................................................................................. 190
V
Index of Figures
Figure 1: In- and exclusion of systematic reviews on UTI .................................................................... 17
Figure 2: Outcome tree for UTI and mortality ..................................................................................... 22
Figure 3: In- and exclusion of systematic reviews on primary BSI and their health outcomes ......... 28
Figure 4: In- and exclusion of original research articles on primary BSI and their health outcomes 29
Figure 5: In- and exclusion of original research articles on primary BSI and Post Traumatic Stress
Disorder ................................................................................................................................................ 30
Figure 6: In- and exclusion of original research articles on primary BSI and Critical Illness
Myopathy/ Polyneuropathy ................................................................................................................... 31
Figure 7: In- and exclusion of original research articles on primary BSI and Sepsis Associated
Encephalopathy ...................................................................................................................................... 32
Figure 8: Results of the non-systematic search on long-term Renal Replacement Therapy (RRT)
following acute renal failure .................................................................................................................. 33
Figure 9: Literature used for the outcome tree that was proposed by clinical experts (PTSD: Post
Traumatic Stress Disorder, HRQOL: Health Related Quality of Life) ................................................. 33
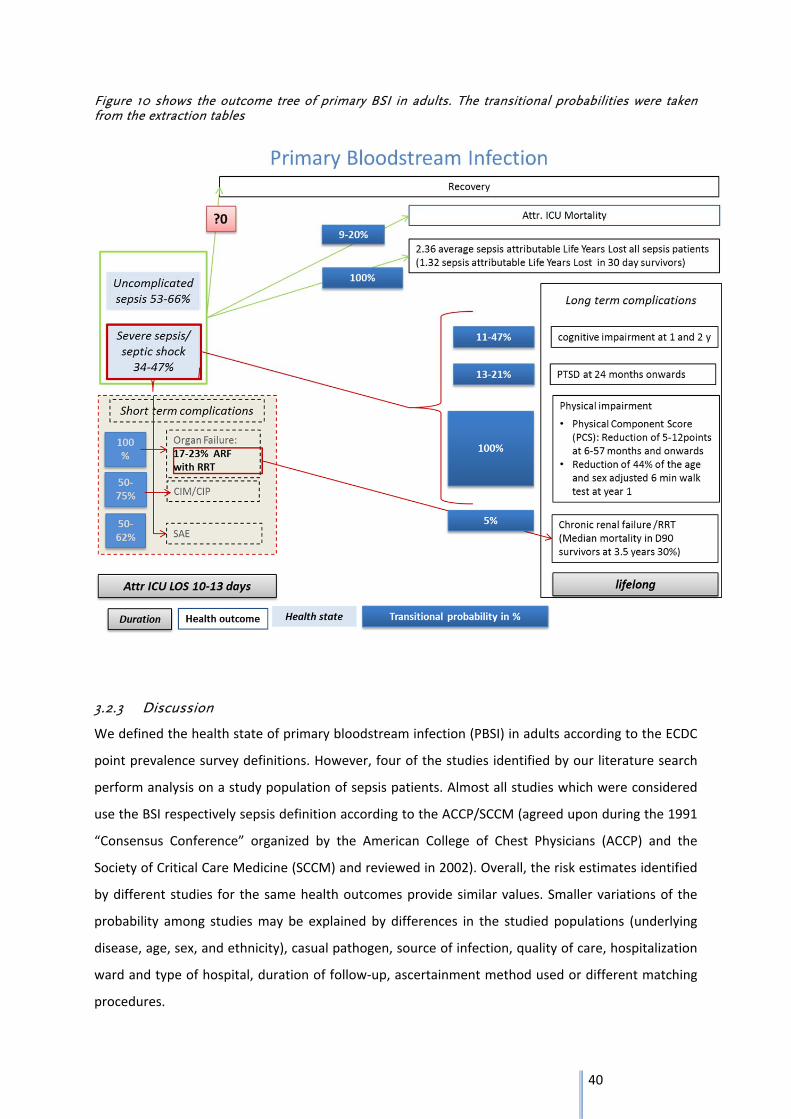
Figure 10 shows the outcome tree of primary BSI in adults. The transitional probabilities were taken
from the extraction tables ..................................................................................................................... 40
Figure 11: Outcome tree neonatal sepsis, deviance from Haller et al., transitional probability for
neurodevelopmental impairment 13%, as the most conservative estimate. ...................................... 45
Figure 12: Flow chart of the selection process for systematic reviews on Clostridium difficile
infections and their outcomes ............................................................................................................. 49
Figure 13: Flow chart of the selection process for primary studieson Clostridium difficile infections
and mortality/LOS ................................................................................................................................. 54
Figure 14: Flow chart of the selection process for primary studies on Clostridium difficile infections
and sepsis ............................................................................................................................................. 60
Figure 15: Outcome tree for Clostridium difficile infection ................................................................. 64
Figure 16: In- and exclusion of systematic reviews on pneumonia and lower respiratory tract
infections and their health outcomes .................................................................................................. 70
Figure 17: In- and exclusion of original research articles on pneumonia and lower respiratory tract
infections and sepsis ............................................................................................................................. 71
Figure 18: In- and exclusion of original research articles on pneumonia and lower respiratory tract
infections and mortality ......................................................................................................................... 72
Figure 19: Outcome tree for ventilator associated pneumonia ........................................................... 77
VI
Index of Tables
Table 1: Key words used to search for „UTI“ - search 1, systematic reviews, run on DIMDI,
17.10.2013 ............................................................................................................................................... 16
Table 2: Short extraction table of the systematic review on UTI and the health outcomes (CAUTI:
catheter associated unrinary tract infection) ........................................................................................ 18
Table 3: Short extraction table on original articles on bacteremia ....................................................... 18
Table 4: Short extraction table on original articles on UTI and attributable mortality ....................... 20
Table 5: Short extraction table on original articles on UTI and increased length of stay (LOS) in ICU
and LOS in hospital ............................................................................................................................... 21
Table 6: Key words used to search for „Primary Bloodstream Infections and their outcomes“–
systematic reviews, meta-analysis ....................................................................................................... 26
Table 7: Key words used to search for „Primary Bloodstream Infections and their outcomes“–
original article search ............................................................................................................................ 26
Table 8: Key words used to search for „Primary Bloodstream Infections and Post Traumatic Stress
Disorder“– original article search ......................................................................................................... 27
Table 9: Key words used to search for „Primary Bloodstream Infections and Critical Illness
Myopathy/Polyneuropathy“– original article search ............................................................................ 27
Table 10: Key words used to search for „Sepsis Associated Encephalopathy“– original article search
................................................................................................................................................................ 27
Table 11: Distribution of uncomplicated and complicated sepsis (severe sepsis and septic shock) . 34
Table 12: Risk Difference in Hospital or ICU Mortality and Difference in Length of Stay (LOS) ........ 34
Table 13: Proportion of Primary and Secondary BSI ............................................................................. 35
Table 14: Proportion of short term complication: Acute Renal Failure (ARF) Renal Replacement
Therapy (RRT) ....................................................................................................................................... 36
Table 15: Proportion of short term complication: Critical illness myopathy (CIM) / Critical illness
polyneuropathy (CIP) ............................................................................................................................ 36
Table 16: Proportion of short term complication: Sepsis Associated Encephalopathy (SAE) ............ 37
Table 17: Proportion of long term complication: Renal Replacement Therapy (RRT) ........................ 37
Table 18: Proportion of long term complication: cognitive impairment ............................................. 37
Table 19: Proportion of long term complication: Post Traumatic Stress Disorder (PTSD) ................ 38
Table 20: Proportion of long term complication: physical impairment .............................................. 38
Table 21: Key words used to search for „Clostridium difficile infections and their outcomes“– search
for systematic reviews in EMBASE and MEDLINE .............................................................................. 47
Table 22: Key words used to search for Clostridium difficile infections and mortality/LOS– search
for primary articles ................................................................................................................................ 48
Table 23: Key words used to search for Clostridium difficile infections and sepsis– search for
primary articles ..................................................................................................................................... 48
VII
Table 24: Overview of selected systematic reviews on Clostridium difficile infections and their
outcomes .............................................................................................................................................. 50
Table 25: Characteristics of selected studies for the outcome colectomy, selected from the review of
Bhangu et al. .......................................................................................................................................... 52
Table 26: Short extraction table on selected primary studies on outcome death ............................... 55
Table 27: Short extraction table on selected primary studies on outcome length of stay .................. 57
Table 28: Overview of data sets selected for severity of CDI .............................................................. 62
Table 29: Key words used to search for „Pneumonia and lower respiratory tract infections and their
outcomes“ – systematic reviews, meta-analysis ................................................................................. 68
Table 30: Key words used to search for „Pneumonia and lower respiratory tract infections and their
health outcome mortality“ – original articles ...................................................................................... 69
Table 31: Key words used to search for „Pneumonia and lower respiratory tract infections and their
health outcome sepsis“ – original articles ........................................................................................... 69
Table 32: Short extraction table of relevant systematic reviews on pneumonia and lower respiratory
tract infections and their health outcomes ........................................................................................... 73
Table 33: Short extraction table on original articles on pneumonia and lower respiratory tract
infection and attributable mortality ..................................................................................................... 74
Table 34: Short extraction table on original articles on pneumonia and lower respiratory tract
infection and extra length of stay .......................................................................................................... 75
Table 35: Short extraction table of original articles on pneumonia and lower respiratory tract
infections and secondary sepsis .......................................................................................................... 76
VIII
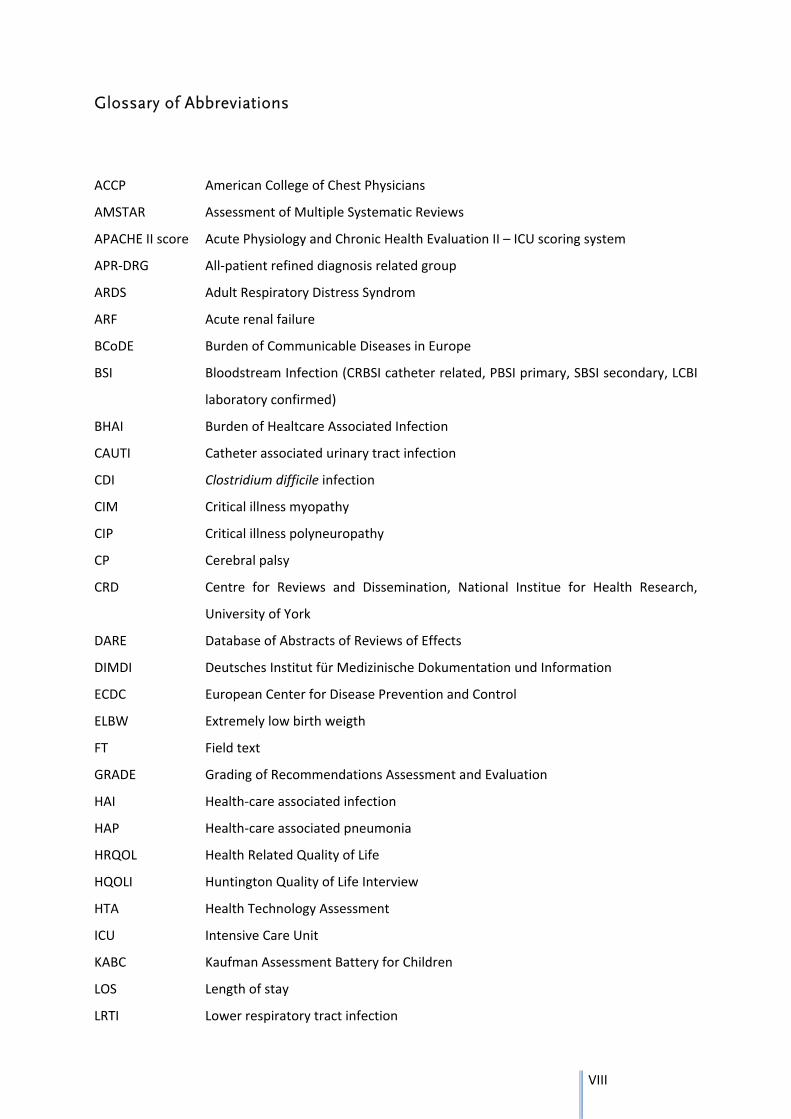
Glossary of Abbreviations
ACCP
AMSTAR
APACHE II score
APR‐DRG
ARDS
ARF
BCoDE
American College of Chest Physicians
Assessment of Multiple Systematic Reviews
Acute Physiology and Chronic Health Evaluation II – ICU scoring system
All‐patient refined diagnosis related group
Adult Respiratory Distress Syndrom
Acute renal failure
Burden of Communicable Diseases in Europe
BSI
BHAI
Bloodstream Infection (CRBSI catheter related, PBSI primary, SBSI secondary, LCBI
laboratory confirmed)
Burden of Healtcare Associated Infection
CAUTI
CDI
CIM
CIP
CP
CRD
DARE
DIMDI
ECDC
ELBW
Catheter associated urinary tract infection
Clostridium difficile infection
Critical illness myopathy
Critical illness polyneuropathy
Cerebral palsy
Centre for Reviews and Dissemination, National Institue for Health Research,
University of York
Database of Abstracts of Reviews of Effects
Deutsches Institut für Medizinische Dokumentation und Information
European Center for Disease Prevention and Control
Extremely low birth weigth
FT
GRADE
Field text
Grading of Recommendations Assessment and Evaluation
HAI
HAP
HRQOL
HQOLI
HTA
ICU
KABC
Health‐care associated infection
Health‐care associated pneumonia
Health Related Quality of Life
Huntington Quality of Life Interview
Health Technology Assessment
Intensive Care Unit
Kaufman Assessment Battery for Children
LOS Length of stay
LRTI Lower respiratory tract infection
IX
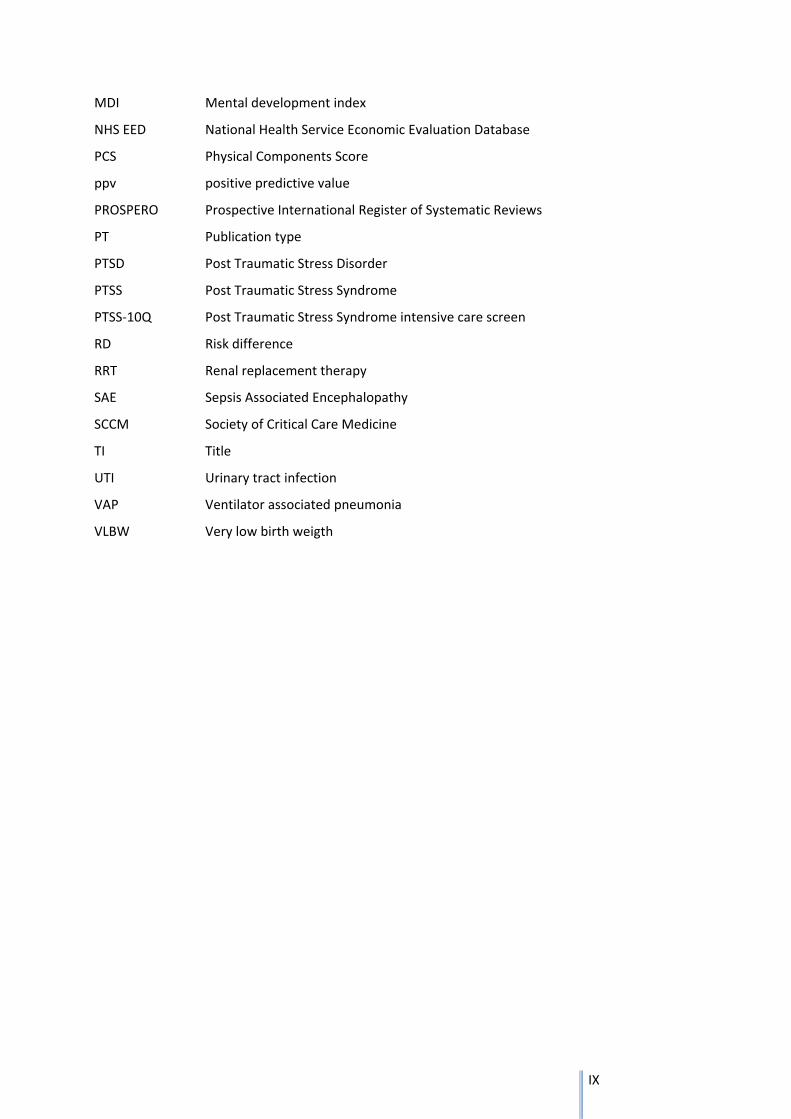
MDI
NHS EED
PCS
ppv
PROSPERO
Mental development index
National Health Service Economic Evaluation Database
Physical Components Score
positive predictive value
Prospective International Register of Systematic Reviews
PT
PTSD
PTSS
PTSS‐10Q
RD
RRT
SAE
SCCM
Publication type
Post Traumatic Stress Disorder
Post Traumatic Stress Syndrome
Post Traumatic Stress Syndrome intensive care screen
Risk difference
Renal replacement therapy
Sepsis Associated Encephalopathy
Society of Critical Care Medicine
TI Title
UTI Urinary tract infection
VAP
VLBW
Ventilator associated pneumonia
Very low birth weigth
10
1 Introduction
During the last two decades substantial effort has been put into estimating the burden of diseases,
especially by the Global Burden of Disease project (1‐3). Current measures for the burden of
infectious diseases do not consider long‐term sequelae and may thereby underestimate the burden
of infectious diseases. Therefore, a new methodology called the pathogen‐based incidence approach
was developed within the Burden of Communicable Diseases in Europe (BCoDE)‐project to also
account for sequelae of infectious diseases (4). This entails the development of outcome trees for
each of the respective pathogen. These outcome trees represent qualitatively the course of the
infectious disease by ordering relevant health outcomes by time starting with the acute disease and
ending with persistent health outcomes, death or recovery. During the process of developing the
pathogen‐based incidence approach several challenges regarding simple incorporation of health‐care
associated infections (HAI) into BCoDE were identified. Especially the risk of overestimating the
burden of HAIs by not properly addressing co‐morbidity and mortality among the mostly hospitalized
population is of importance. A pathogen based approach seemed further not to be appropriate since
a large amount of different pathogens causes similar outcomes (e.g. pneumonia, sepsis, urinary tract
infection). The pathogen‐based incidence approach must thus be altered to a syndromic approach
also because prevalence/incidence data on HAI are mostly available by disease and rarely by
pathogen. These issues outlined above have so far hampered to estimate the burden of HAI. We
created outcome trees adjusted for co‐morbidity and including the main sequelae of HAI to enable
estimation of the burden of HAI. This will also allow comparisons of the burden of HAIs to the burden
of other infectious as also non‐infectious diseases. The incidence based approach of the BHAI‐project
will enable us to estimate the potential gain of interventions to prevent HAI.
1.1 Objective
Conducting systematic literature searches to identify relevant and important literature to
health outcomes of the respective HAI,
extracting key measures (attributable morbidity and mortality) and duration of non‐
permanent health outcomes,
summarizing the body of evidence of key measures in a qualitative and if possible in a
quantitative manner,
critically appraising the quality of the body of evidence by developing further existing tools
and methods of evidence grading (in 1 HAI),
to develop outcome trees with transitional probabilities for mortality and sequelae
11
2 Methods
2.1 Outcome tree
The estimation of burden of infectious diseases applying outcome trees was recently introduced by
the BCoDE consortium (4) and already successfully applied to non‐typhoidal Salmonella spp. and
Campylobacter spp. (5). An outcome tree describes the course of a disease over time, starting at the
infection and followed by all subsequent relevant health outcomes and ending with persistent health
outcomes or recovery. The conditional dependency of each health outcome is defined as the
transitional probability, which is in case of HAI the attributable risk (risk difference) for the respective
health outcome. This is the comparison of the absolute risks between patients with the respective
HAI and patients (with similar characteristics) but without HAI. Moreover, each health outcome, if
not permanent, has to be assigned a disease duration in order to compute the respective composite
measures of burden of disease.
The creation of outcome trees follows the rules of vertical and horizontal disaggregation. This means
that if there are two different, distinguishable health conditions in one and the same person this
would be expressed as two health outcomes (horizontal disaggregation). However, sometimes there
exist within one health outcome several subcategories or forms of the disease, e.g. mild, moderate,
severe, which would be expressed as health states. These health states belong all to one health
outcome and describe the vertical disaggregation in outcome trees ((6); (4); (5)). In order to compute
the burden of disease based on outcome trees, disease weights have to be assigned to each health
outcome as well as each health state. These disease weights quantify the severity of the respective
health condition and range between zero and one. Estimation of such disease weights were not part
of the herein described project and are results from usually very laborious research incorporating
large surveys (7).
2.2 Selection and definition of HAI
Following HAI were selected after expert consultation:
• Urinary tract infection
• Primary blood stream infection: Neonatal sepsis
• Primary blood stream infection: sepsis in adults
• Clostridium difficile infection
• Pneumonia and lower respiratory tract infections
12
Primary BSI was devided into neonatal late‐onset sepsis and sepsis in adults in order to acknowledge
the differences in course and outcomes of sepsis depending on age of onset.
Healthcare associated infections were defined according to the definitions used for the ECDC point
prevalence survey of healthcare‐associated infections and antimicrobial use in European acute care
hospitals (8). In the identified literature different HAI definitions were used, thus we discuss
consecutive bias.
2.3 Systematic literature search, data extraction and data synthesis
Data sources and inclusion criteria
To identify potentially eligible studies, we followed a two‐step approach. We first searched for
existing systematic reviews which addressed our research questions. If no systematic review was
identified, we conducted a search for primary studies.
To identify relevant systematic reviews, we searched Cochrane Database of Systematic Reviews,
EMBASE, Medline, HTA database, NHS EED and DARE. We applied “health‐evidence.ca” filter (1.
MEDLINE.tw, 2. systematic review.tw, 3. meta‐analysis.pt, 4. intervention$.ti, 5 or/1‐4) published by
Lee et al. This search strategy was supplemented by a search for ongoing and unpublished systematic
reviews in the Prospective International Register of Systematic Reviews (PROSPERO).
If this strategy did not lead to identification of systematic reviews we conducted systematic reviews
for original articles. These were obtained by searching MEDLINE, EMBASE and Cochrane Central
Register of Controlled Trials (CENTRAL). Reference lists of relevant articles were checked to identify
additional studies (cross‐reference search). No language restrictions were made.
To be eligible, a study had to fulfill the following inclusion criteria defined a priori:
1. Clinical trial, cohort study or case‐control study
2. Published after 01.01.2000
3. Only studies conducted in a healthcare setting within an upper‐middle‐ or high‐income
country (http://data.worldbank.org/about/country‐and‐lending‐groups)
4. Conducted in a hospital setting
5. Data to calculate attributable morbidity or mortality reported or available
We were primarily interested in studies published after 01.01.2000. In some instances articles
published before 2000 had to be considered since they provided the best available evidence on the
respective HAI. All searches were supplemented by expert consultations to identify additional
13
studies. We decided not to include grey literature (e.g. conference proceedings, presentations,
unpublished manuscripts) because they did not provide enough details.
Search strategy
The search strategy was built similarly for all HAI and included following domains and its synonyms:
healthcare‐associated, pathogen or syndrome, outcome in general, mortality, and specific HAI
related health outcomes. These specific health outcomes were defined according to preliminary
outcome trees created at the very beginning of the project.
Selection of relevant literature
Two independent reviewers screened the obtained literature by title and abstract to determine the
eligibility of studies. Potential disagreement was resolved by discussion. Identified studies were
retrieved in full text and were checked again for eligibility. In case of exclusion of the study the
reason was documented. Moreover, cross‐references were also considered by screening the
bibliography of eligible studies as well as bibliography of cross‐references.
From each eligible study the following information was extracted: general information (including
bibliographic data), location of study, study period, study design, funding, inclusion and exclusion
criteria for participants, definition of HAI, description of control group, length of follow‐up,
proportion men or women, ethnicity, initial number of participants, final number of participants,
number (or % or incidence) of participants with relevant health outcomes. Data extraction was
performed by one of the two reviewers and checked for correctness by the second reviewer. All data
were extracted in EXCEL and respective extraction tables are shown in the results section or in the
appendix.
14
Summary of body of evidence
The body of evidence was depicted in tables, including judgment by the Newcastle Ottawa scale (10)
for original articles and their respective health outcomes. An exception was the outcome tree for
neonatal sepsis for which a number of comparable original articles on several health outcomes were
available and for which meta‐analyses were conducted using STATA IC12 (Stata Inc.). The results of
the meta‐analyses were depicted in forest plots providing a summary estimate of the respective key
measure.
In some instances the health outcome of interest was not defined as such or defined differently in
the published literature. In order still to be able to depict the respective health outcome in the
outcome tree, “bridging” was used. This means that a surrogate outcome, which was defined and
published in the available literature, was used to make a statement on the health outcome of
interest. Examples are: Mental Development Index (MDI) for impaired neurodevelopment for
neonatal sepsis, walking distance for physical fitness in sepsis tree.
Grading of evidence
The quality of bodies of evidence was exemplary assessed for the results of the systematic review on
neonatal sepsis. We adapted the methodology of the Grading of Recommendations Assessment and
Evaluation (GRADE) working group to assess the quality of the body of evidence(11). The GRADE
methodology provides a transparent framework for evidence quality assessment, which was initially
developed to assess intervention studies. According to GRADE, the quality of evidence indicates the
extent to which one can be confident that the estimate of effect is correct. The “units of analysis” of
GRADE are outcomes, i.e. assessments are done by outcome. Taking into account the entire body of
evidence (not an individual study) on one outcome, four levels of evidence quality are applied: + very
low, ++ low, +++ moderate, ++++ high. Adapting the original GRADE approach, all bodies of evidence
(irrespective of study design) are initially graded as high quality of evidence. Considering the
following criteria might lead to decreasing (downgrading) evidence quality: 1) risk of bias, 2)
inconsistency, 3) indirectness, 4) imprecision and 5) publication bias.
External expert group
After the first development of the outcome trees and conducting the first round of systematic
reviews to get an impression of the literature a workshop with ECDC experts and external clinical and
infection control experts (see acknowledgement) was held. A second workshop was held before
finalizing the report.
15
3 Methods, Results and Discussion of five HAIs
The literature search, including the available body of evidence, is presented in the following sections
entitled Methods, Results and Discussion. Relevant articles identified by the systematic searches
were extracted.
16
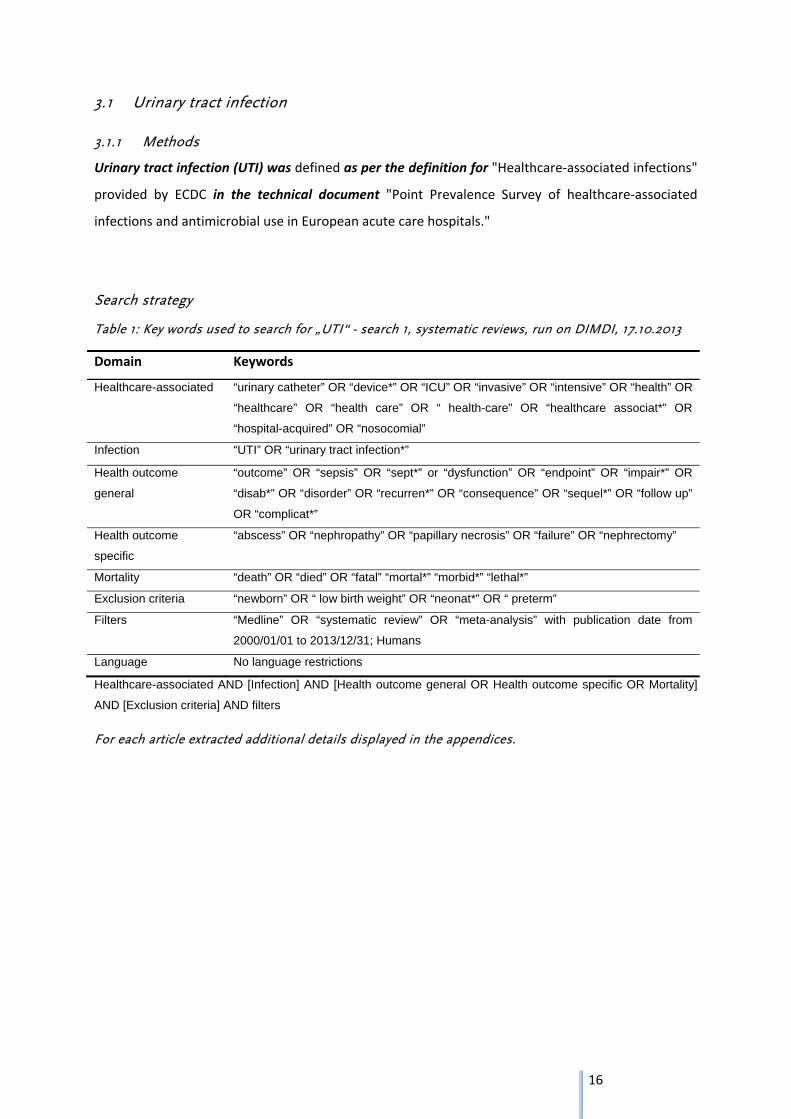
3.1 Urinary tract infection
3.1.1 Methods
Urinary tract infection (UTI) was defined as per the definition for "Healthcare‐associated infections"
provided by ECDC in the technical document "Point Prevalence Survey of healthcare‐associated
infections and antimicrobial use in European acute care hospitals."
Search strategy
Table 1: Key words used to search for „UTI“ - search 1, systematic reviews, run on DIMDI, 17.10.2013
Domain Keywords
Healthcare-associated “urinary catheter” OR “device*” OR “ICU” OR “invasive” OR “intensive” OR “health” OR
“healthcare” OR “health care” OR “ health-care” OR “healthcare associat*” OR
“hospital-acquired” OR “nosocomial”
Infection “UTI” OR “urinary tract infection*”
Health outcome
general
“outcome” OR “sepsis” OR “sept*” or “dysfunction” OR “endpoint” OR “impair*” OR
“disab*” OR “disorder” OR “recurren*” OR “consequence” OR “sequel*” OR “follow up”
OR “complicat*”
Health outcome
specific
“abscess” OR “nephropathy” OR “papillary necrosis” OR “failure” OR “nephrectomy”
Mortality “death” OR “died” OR “fatal” “mortal*” “morbid*” “lethal*”
Exclusion criteria “newborn” OR “ low birth weight” OR “neonat*” OR “ preterm”
Filters “Medline” OR “systematic review” OR “meta-analysis” with publication date from
2000/01/01 to 2013/12/31; Humans
Language No language restrictions
Healthcare-associated AND [Infection] AND [Health outcome general OR Health outcome specific OR Mortality]
AND [Exclusion criteria] AND filters
For each article extracted additional details displayed in the appendices.
17
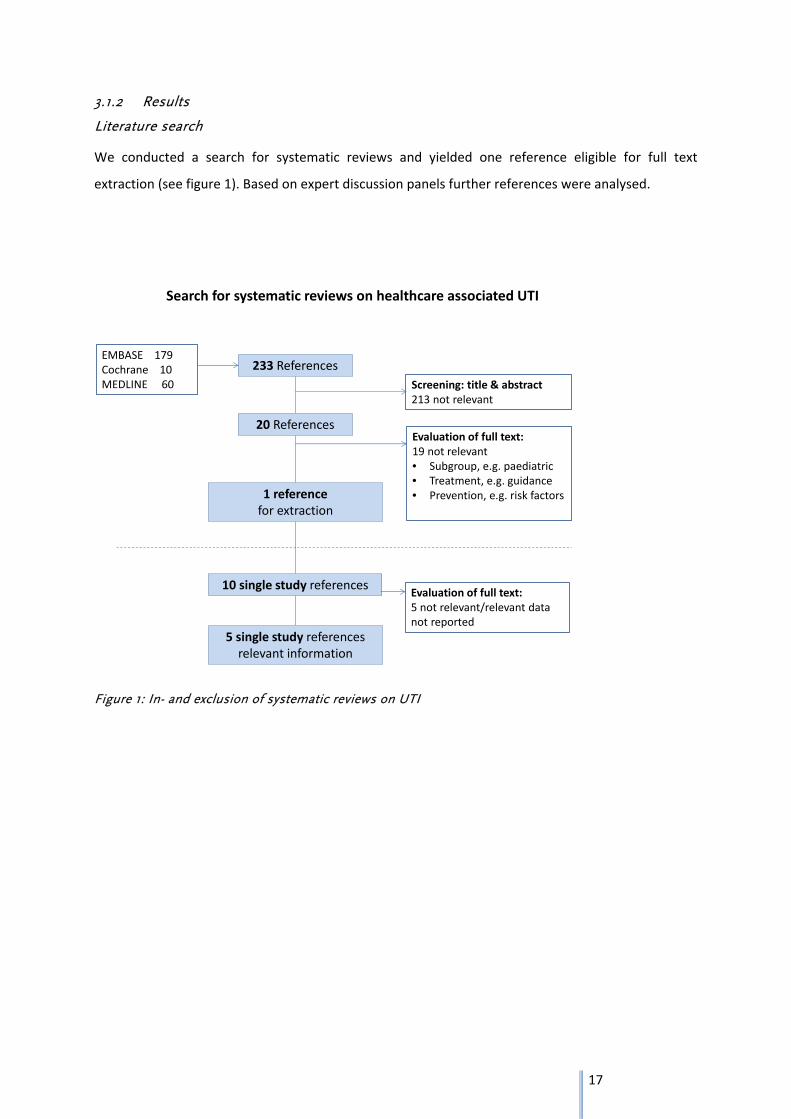
3.1.2 Results
Literature search
We conducted a search for systematic reviews and yielded one reference eligible for full text
extraction (see figure 1). Based on expert discussion panels further references were analysed.
Figure 1: In- and exclusion of systematic reviews on UTI
Search for systematic reviews on healthcare associated UTI
233 ReferencesEMBASE 179Cochrane 10MEDLINE 60
20 References
Screening: title & abstract213 not relevant
1 referencefor extraction
Evaluation of full text:19 not relevant• Subgroup, e.g. paediatric• Treatment, e.g. guidance• Prevention, e.g. risk factors
10 single study referencesEvaluation of full text:5 not relevant/relevant datanot reported
5 single study referencesrelevant information
18
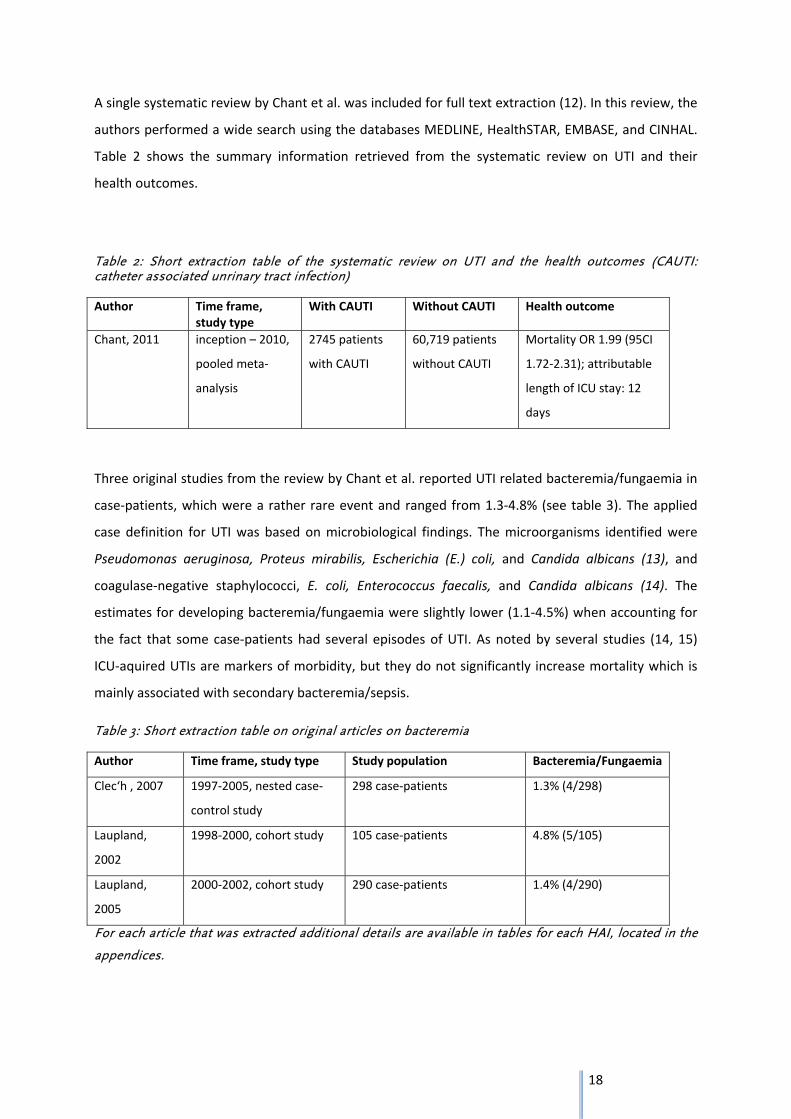
A single systematic review by Chant et al. was included for full text extraction (12). In this review, the
authors performed a wide search using the databases MEDLINE, HealthSTAR, EMBASE, and CINHAL.
Table 2 shows the summary information retrieved from the systematic review on UTI and their
health outcomes.
Table 2: Short extraction table of the systematic review on UTI and the health outcomes (CAUTI: catheter associated unrinary tract infection)
Author Time frame, study type
With CAUTI Without CAUTI Health outcome
Chant, 2011 inception – 2010,
pooled meta‐
analysis
2745 patients
with CAUTI
60,719 patients
without CAUTI
Mortality OR 1.99 (95CI
1.72‐2.31); attributable
length of ICU stay: 12
days
Three original studies from the review by Chant et al. reported UTI related bacteremia/fungaemia in
case‐patients, which were a rather rare event and ranged from 1.3‐4.8% (see table 3). The applied
case definition for UTI was based on microbiological findings. The microorganisms identified were
Pseudomonas aeruginosa, Proteus mirabilis, Escherichia (E.) coli, and Candida albicans (13), and
coagulase‐negative staphylococci, E. coli, Enterococcus faecalis, and Candida albicans (14). The
estimates for developing bacteremia/fungaemia were slightly lower (1.1‐4.5%) when accounting for
the fact that some case‐patients had several episodes of UTI. As noted by several studies (14, 15)
ICU‐aquired UTIs are markers of morbidity, but they do not significantly increase mortality which is
mainly associated with secondary bacteremia/sepsis.
Table 3: Short extraction table on original articles on bacteremia
Author Time frame, study type Study population Bacteremia/Fungaemia
Clec‘h , 2007 1997‐2005, nested case‐
control study
298 case‐patients
1.3% (4/298)
Laupland,
2002
1998‐2000, cohort study 105 case‐patients 4.8% (5/105)
Laupland,
2005
2000‐2002, cohort study 290 case‐patients 1.4% (4/290)
For each article that was extracted additional details are available in tables for each HAI, located in the
appendices.
19
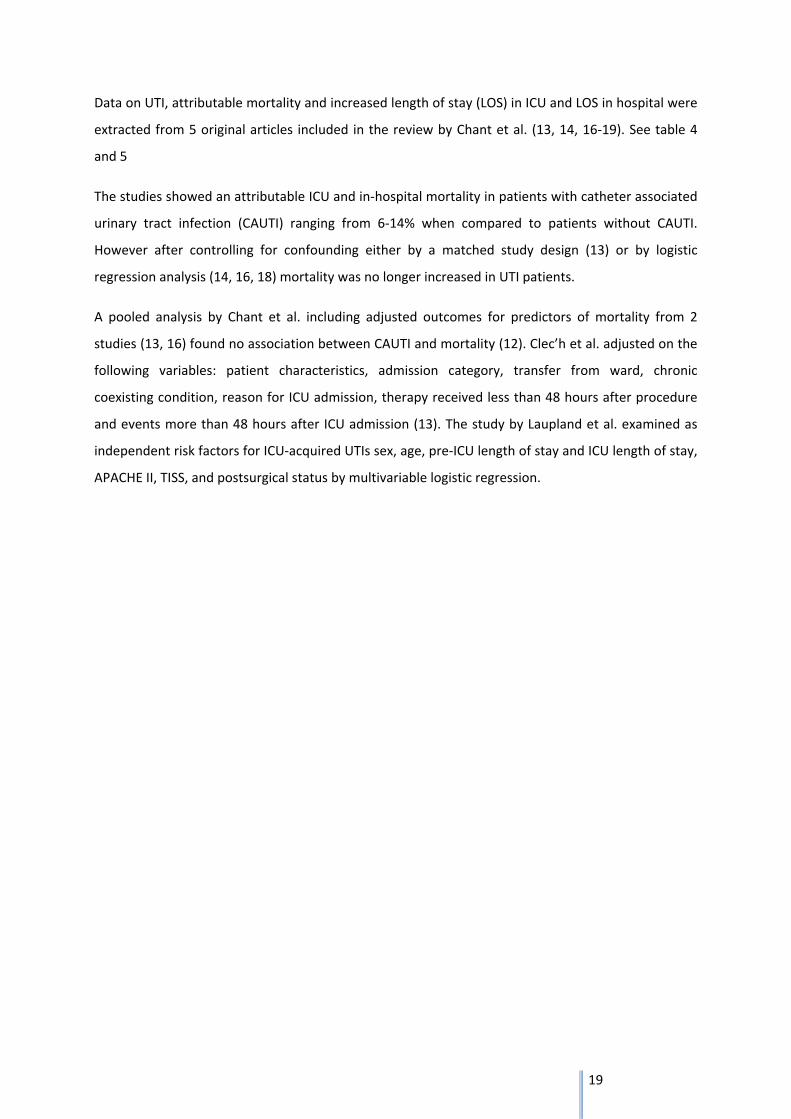
Data on UTI, attributable mortality and increased length of stay (LOS) in ICU and LOS in hospital were
extracted from 5 original articles included in the review by Chant et al. (13, 14, 16‐19). See table 4
and 5
The studies showed an attributable ICU and in‐hospital mortality in patients with catheter associated
urinary tract infection (CAUTI) ranging from 6‐14% when compared to patients without CAUTI.
However after controlling for confounding either by a matched study design (13) or by logistic
regression analysis (14, 16, 18) mortality was no longer increased in UTI patients.
A pooled analysis by Chant et al. including adjusted outcomes for predictors of mortality from 2
studies (13, 16) found no association between CAUTI and mortality (12). Clec’h et al. adjusted on the
following variables: patient characteristics, admission category, transfer from ward, chronic
coexisting condition, reason for ICU admission, therapy received less than 48 hours after procedure
and events more than 48 hours after ICU admission (13). The study by Laupland et al. examined as
independent risk factors for ICU‐acquired UTIs sex, age, pre‐ICU length of stay and ICU length of stay,
APACHE II, TISS, and postsurgical status by multivariable logistic regression.
20
Table 4: Short extraction table on original articles on UTI and attributable mortality, 5 deriving from systematic review, the study of Garcia-Martin was added after consultation with the experts.
Author Time frame,
study type
Study
population
Matching or
inclusion criteria
Attributable mortality
Appelgren,
2001
1989‐1993,
cohort study
562 patients, 31
case‐patients
Presence of
urinary catheter;
infection >48
hours after
admission to ICU
14%
Clec‘h , 2007 1997‐2005,
matched nested
case‐control
study
273 cases, 896
controls
Presence of
urinary catheter;
sex, age, SAPS II,
duration of UT
catherization,
diabetes mellitus
7% ICU/13% in‐hospital
mortality;
adjusted analysis ICU
0.85 (0.66‐1.09)/in‐
hospital 0.95 (0.76‐1.18)
Garcia‐Martin,
2001
1990‐1991,
matched case‐
control study
335 matched
pairs
Admission
diagnosis,
admission date,
hospital stay ≥48
h
OR 2.29 (CI 95: 1.30‐
4.06); Adjusted OR 1.82
(CI 95: 0.92‐3.57)
Laupland, 2005 2000‐2002,
cohort study
4465 patients,
290 case‐
patients
ICU acquired UTI 6% ICU/9% in‐hospital;
logistic regression:
OR 1.02 (0.76‐1.37)
Laupland, 2002 1999‐2000,
cohort study
1,158 patients;
105 case‐
patients
ICU admission 6% ICU/in‐hospital;
logistic regression
no statistically significant
increase of in‐hospital
mortality
van der Kooi,
2007
1997‐2000,
cohort study
2259 patients,
172 case‐
patients
ICU patients 10%; logistic regression
no association
For each article that was extracted additional details are available in tables for each HAI, located in the
appendices.
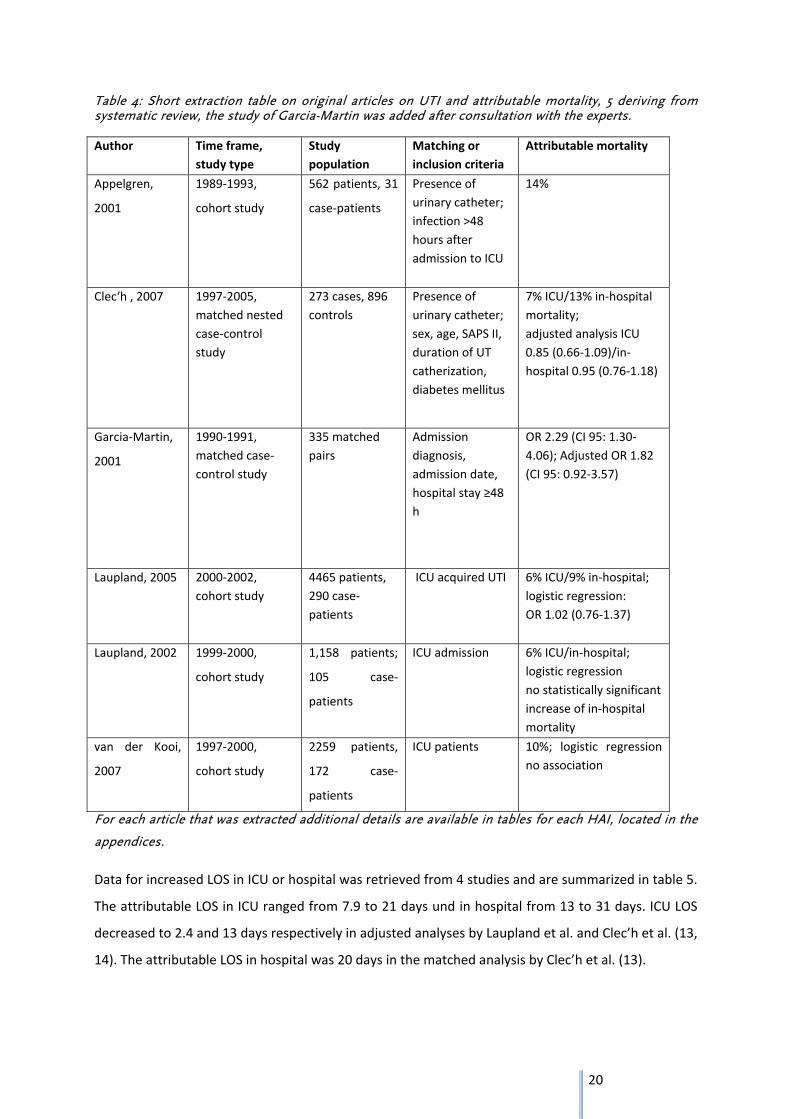
Data for increased LOS in ICU or hospital was retrieved from 4 studies and are summarized in table 5.
The attributable LOS in ICU ranged from 7.9 to 21 days und in hospital from 13 to 31 days. ICU LOS
decreased to 2.4 and 13 days respectively in adjusted analyses by Laupland et al. and Clec’h et al. (13,
14). The attributable LOS in hospital was 20 days in the matched analysis by Clec’h et al. (13).
21
Table 5: Short extraction table on original articles on UTI and increased length of stay (LOS) in ICU and LOS in hospital
Author Time frame,study type
Study population
Inclusion criteria Attributable LOS in ICU, median (days)
Attributable LOS in hospital (days), median
Clec’h, 2007 1997‐2005,
matched
nested case‐
control study
273 cases, 896
controls
Presence of urinary
catheter; sex, age, SAPS
II, duration of UT
catherization, diabetes
mellitus
21;
13 (matched
analysis)
31;
20 (matched
analysis)
Laupland,
2005
2000‐2002,
cohort study
4465 patients,
290 case‐
patients
ICU acquired UTI 7.9 14
Laupland,
2002
1999‐2000,
cohort study
1,147 (ICU
LOS) and 1,146
(hospital LOS)
patients, 104
case‐patients
ICU admission 9.6;
2.4 (adjusted
analysis)
15
Van der
Kooi, 2007
1997‐2000,
cohort study
2259 patients,
172 case‐
patients
ICU patients 12.5 No data
For each article that was extracted additional details are available in tables for each HAI, located in the
appendices.
22
Outcome tree
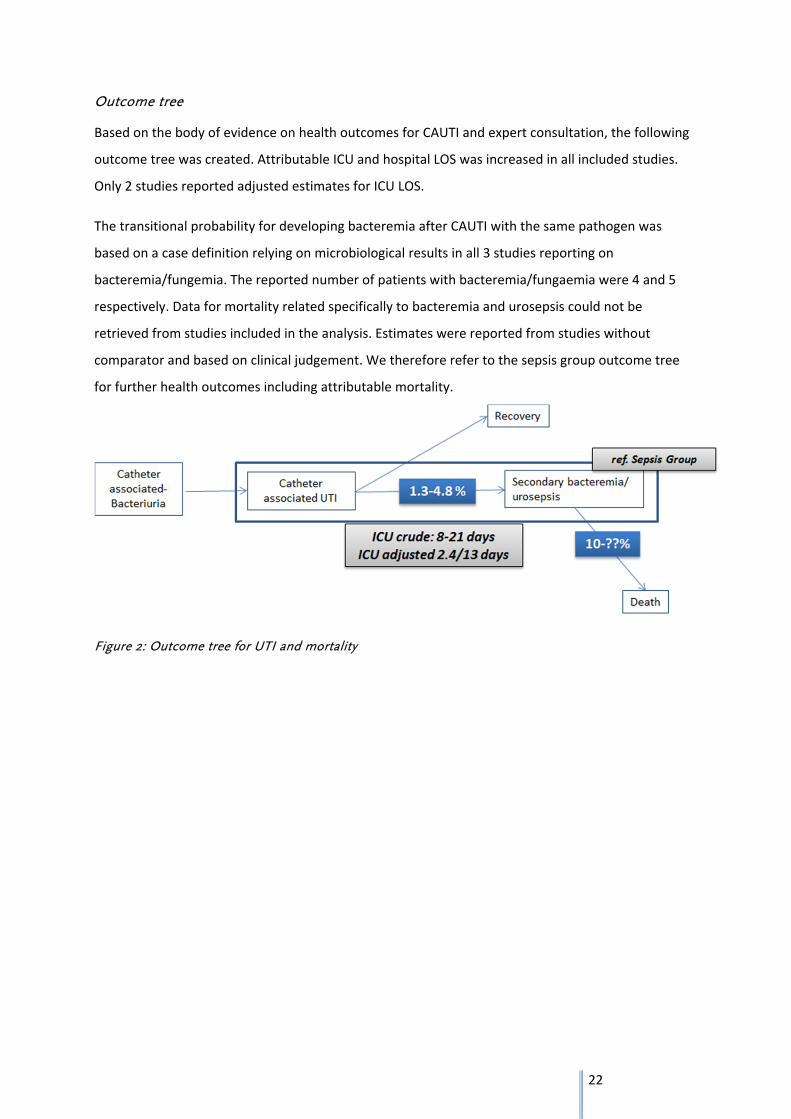
Based on the body of evidence on health outcomes for CAUTI and expert consultation, the following
outcome tree was created. Attributable ICU and hospital LOS was increased in all included studies.
Only 2 studies reported adjusted estimates for ICU LOS.
The transitional probability for developing bacteremia after CAUTI with the same pathogen was
based on a case definition relying on microbiological results in all 3 studies reporting on
bacteremia/fungemia. The reported number of patients with bacteremia/fungaemia were 4 and 5
respectively. Data for mortality related specifically to bacteremia and urosepsis could not be
retrieved from studies included in the analysis. Estimates were reported from studies without
comparator and based on clinical judgement. We therefore refer to the sepsis group outcome tree
for further health outcomes including attributable mortality.
Figure 2: Outcome tree for UTI and mortality
23
3.1.3 Discussion
Data from observational studies on healthcare associated UTI‐related outcomes as attributable
measures with a comparator derived from the hospital population are relatively sparse. Studies may
provide percentage of secondary sepsis due to UTI origin but comparator data are often missing as
well as data on the probability to develop urosepsis after symptomatic UTI.
The estimates for attributable mortality and LOS were retrieved from studies included in a review by
Chant et al. (12). The study population was in most cases ICU patients with catheterization and may
therefore not be representative for healthcare‐associated UTI regarding relevant health outcomes.
However catheterization is one major risk factors for healthcare‐associated urinary tract infection
with a huge potential for prevention (20) (ECDC PPS study).
All included studies reported an increased attributable mortality. This association was no longer
significant after controlling for confounding. However only few studies provided adjusted risk
measures.
The estimate for attributable mortality depends also on the respective comparator. The estimate for
attributable mortality was 14% when compared to all non‐case patients regardless of infection status
other than UTI and 20% respectively when compared to all non‐infected patients in the study by
Appelgren et al. (17).
Mortality attributable to UTI is observed in more severe disease manifestations such as bacteremia
or urosepsis. Only 3 studies reported data on bacteremia/fungemia in the respective study
population and the number of reported case‐patients were low (13, 14, 16). All 3 studies based the
UTI case definition on microbiological results and did not include clinical symptoms which may be
difficult to assess in ICU patients with catheterization. The estimates for the transitional probability
developing bacteremia were consistent with data from a review by Saint reporting a pooled estimate
of 3.6% for the probability to develop bacteremia after bacteriuria (21).
As number of case‐patients with bacteremia was low, included studies from the review by Chant et
al. could not provide sufficient data on bacteremia‐related mortality. Saint reported an estimate of
12.7% for attributable mortality due to catheter‐related bacteremia, however this figure was based
on clinical judgement (21). Lee et al. reported a similar estimate for attributable mortality for
urosepsis which was also based on clinical judgement (9).
Available data suggest an increased attributable LOS due to UTI. However similar to attributable
mortality only few studies provided adjusted estimates for LOS (13, 14). Both studies reported a

24
significantly increase in ICU LOS after adjustment. Due to the heterogeneity of studies a pooled
analysis showed a nonsignificant increase (12).
A further limitation regarding LOS is the often observed time‐dependent bias by insufficient
correction for time to event for both cases and non‐cases. Length of stay may have been therefore
rather classified as risk factor than as outcome.
25
3.2 Primary blood stream infection (BSI) in Adults
3.2.1 Methods
Before conducting the literature review it was agreed upon the study team to use following
definition for primary blood stream infection in adults:
Primary bloodstream infection was defined according: European Centre for Disease Prevention and
Control. Point prevalence survey of healthcare‐associated infections and antimicrobial use in
European acute care hospitals – protocol version 4.3. Stockholm: ECDC; 2012, pages 47.
One positive blood culture for a recognized pathogen or patient has at least one of the following
signs or symptoms: fever (> 38°C), chills, or hypotension and two positive blood cultures for a
common skin contaminant (from two separate blood samples, usually within 48 hours)
Skin contaminants = coagulase‐negative staphylococci (including S. epidermidis), Micrococcus spp.,
Propionibacterium acnes, Bacillus spp., Corynebacterium spp
But almost all studies we retrieved use the BSI respectively sepsis definition according to the
ACCP/SCCM (agreed upon during the 1991 “Consensus Conference” organized by the American
College of Chest Physicians (ACCP) and the Society of Critical Care Medicine (SCCM) and reviewed in
2002).
26
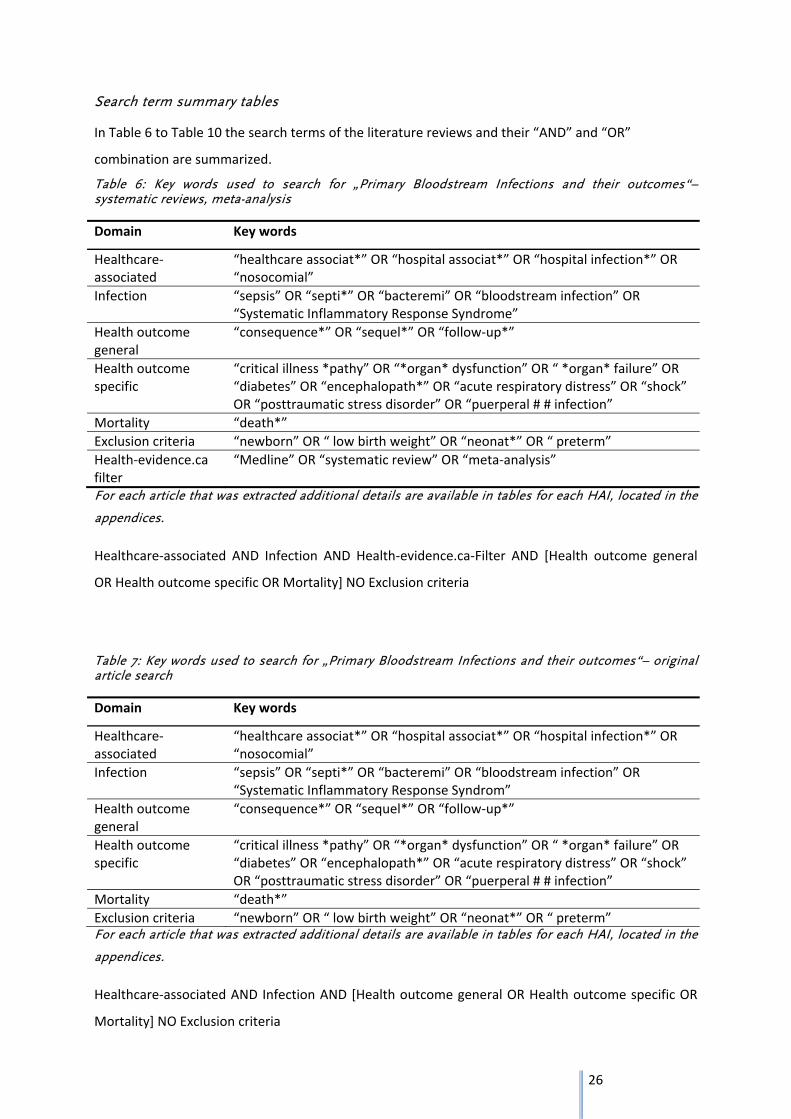
Search term summary tables
In Table 6 to Table 10 the search terms of the literature reviews and their “AND” and “OR”
combination are summarized.
Table 6: Key words used to search for „Primary Bloodstream Infections and their outcomes“– systematic reviews, meta-analysis
Domain Key words
Healthcare‐associated
“healthcare associat*” OR “hospital associat*” OR “hospital infection*” OR “nosocomial”
Infection “sepsis” OR “septi*” OR “bacteremi” OR “bloodstream infection” OR “Systematic Inflammatory Response Syndrome”
Health outcome general
“consequence*” OR “sequel*” OR “follow‐up*”
Health outcome specific
“critical illness *pathy” OR “*organ* dysfunction” OR “ *organ* failure” OR “diabetes” OR “encephalopath*” OR “acute respiratory distress” OR “shock” OR “posttraumatic stress disorder” OR “puerperal # # infection”
Mortality “death*”
Exclusion criteria “newborn” OR “ low birth weight” OR “neonat*” OR “ preterm”
Health‐evidence.ca filter
“Medline” OR “systematic review” OR “meta‐analysis”
For each article that was extracted additional details are available in tables for each HAI, located in the
appendices.
Healthcare‐associated AND Infection AND Health‐evidence.ca‐Filter AND [Health outcome general
OR Health outcome specific OR Mortality] NO Exclusion criteria
Table 7: Key words used to search for „Primary Bloodstream Infections and their outcomes“– original article search
Domain Key words
Healthcare‐associated
“healthcare associat*” OR “hospital associat*” OR “hospital infection*” OR “nosocomial”
Infection “sepsis” OR “septi*” OR “bacteremi” OR “bloodstream infection” OR “Systematic Inflammatory Response Syndrom”
Health outcome general
“consequence*” OR “sequel*” OR “follow‐up*”
Health outcome specific
“critical illness *pathy” OR “*organ* dysfunction” OR “ *organ* failure” OR “diabetes” OR “encephalopath*” OR “acute respiratory distress” OR “shock” OR “posttraumatic stress disorder” OR “puerperal # # infection”
Mortality “death*”
Exclusion criteria “newborn” OR “ low birth weight” OR “neonat*” OR “ preterm” For each article that was extracted additional details are available in tables for each HAI, located in the
appendices.
Healthcare‐associated AND Infection AND [Health outcome general OR Health outcome specific OR
Mortality] NO Exclusion criteria
27
Table 8: Key words used to search for „Primary Bloodstream Infections and Post Traumatic Stress Disorder“– original article search
Domain Key words
Infection “sepsis” OR “septi*” OR “bacteremi” OR “bloodstream infection” OR “Systematic Inflammatory Response Syndrom”
Health outcome specific
“posttraumatic stress disorder”
For each article that was extracted additional details are available in tables for each HAI, located in the
appendices.
Infection AND Health outcome specific
Table 9: Key words used to search for „Primary Bloodstream Infections and Critical Illness Myopathy/Polyneuropathy“– original article search
Domain Key words
Infection “sepsis” OR “septi*” OR “bacteremi” OR “bloodstream infection” OR “Systematic Inflammatory Response Syndrom”
Health outcome specific
“critical illness *pathy”
For each article that was extracted additional details are available in tables for each HAI, located in the
appendices.
Infection AND Health outcome specific
Table 10: Key words used to search for „Sepsis Associated Encephalopathy“– original article search
Domain Key words
Infection “sepsis” OR “septi*” OR “bacteremi” OR “bloodstream infection” OR “Systematic Inflammatory Response Syndrom”
Health outcome specific
“encephalopath*”
For each article that was extracted additional details are available in tables for each HAI, located in the
appendices.
Infection AND Health outcome specific
One non‐systematic literature search was performed subsequent to clinical experts recommendation
to search for literature estimating the risk among patients with acute renal failure to require long‐
term renal replacement therapy.
28
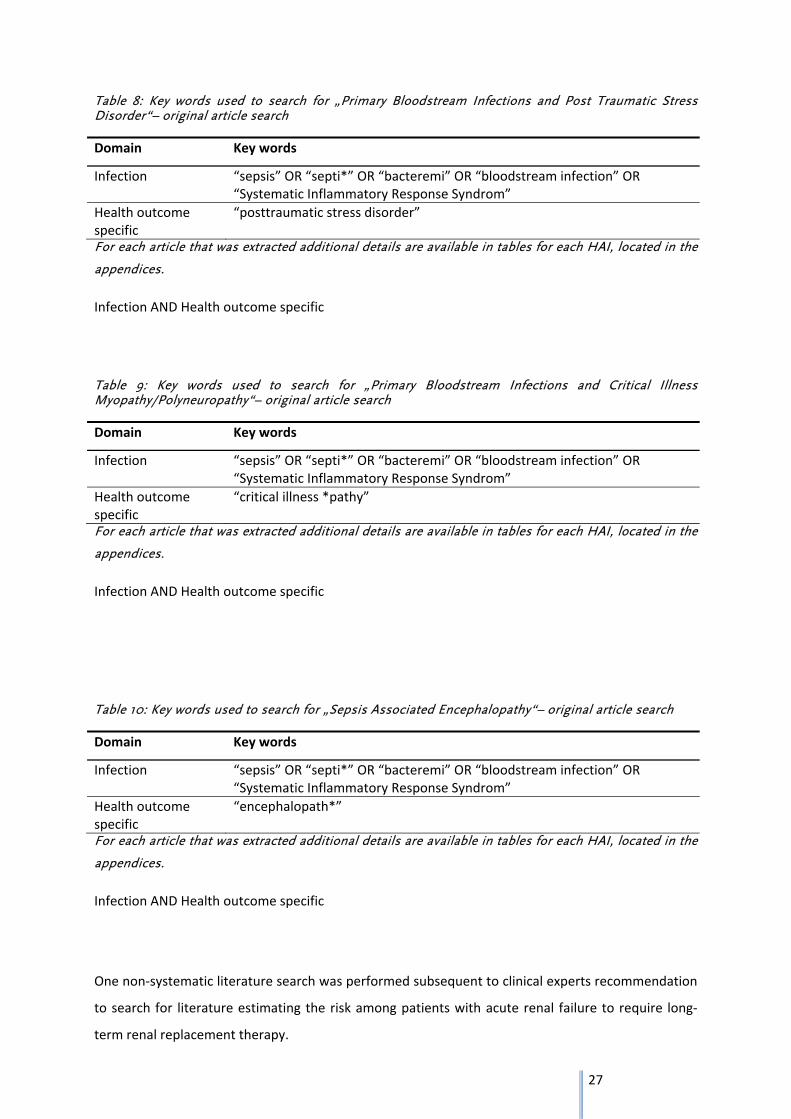
3.2.2 Results
In the following the results from the literature search and the aggregation of the available body of
evidence are presented in literature trees and short extraction tables.
Figure 3: In- and exclusion of systematic reviews on primary BSI and their health outcomes
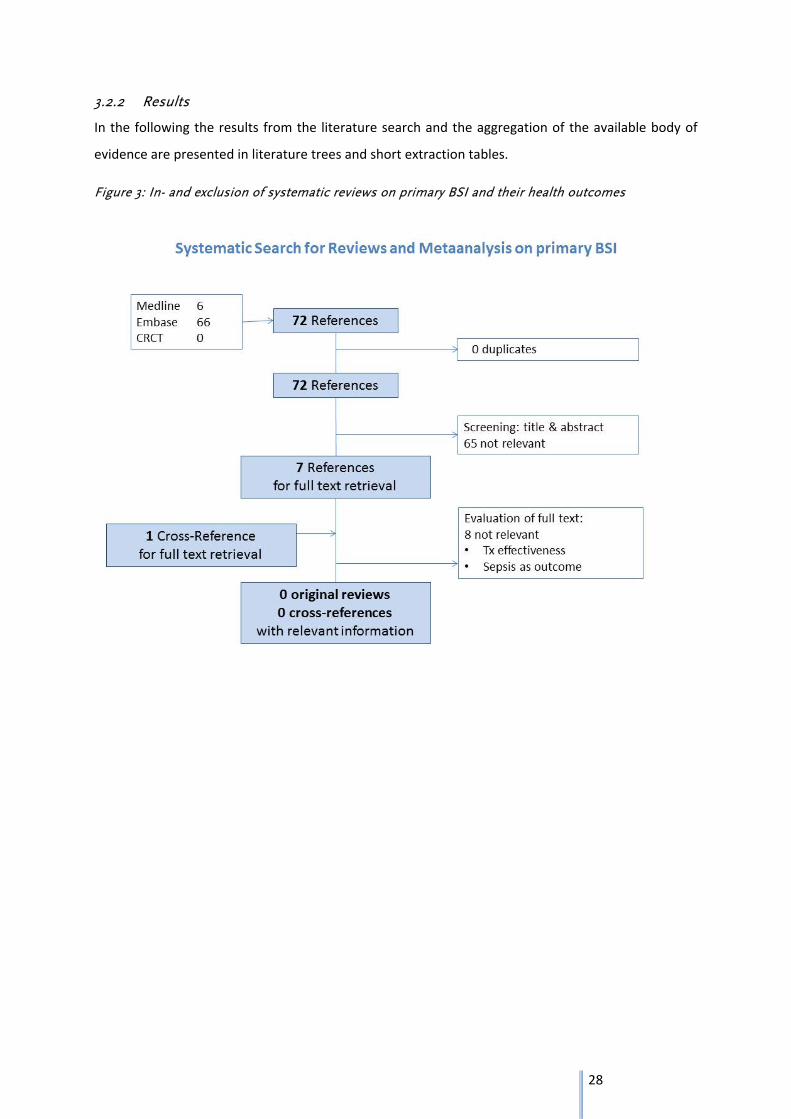
29
Figure 4: In- and exclusion of original research articles on primary BSI and their health outcomes
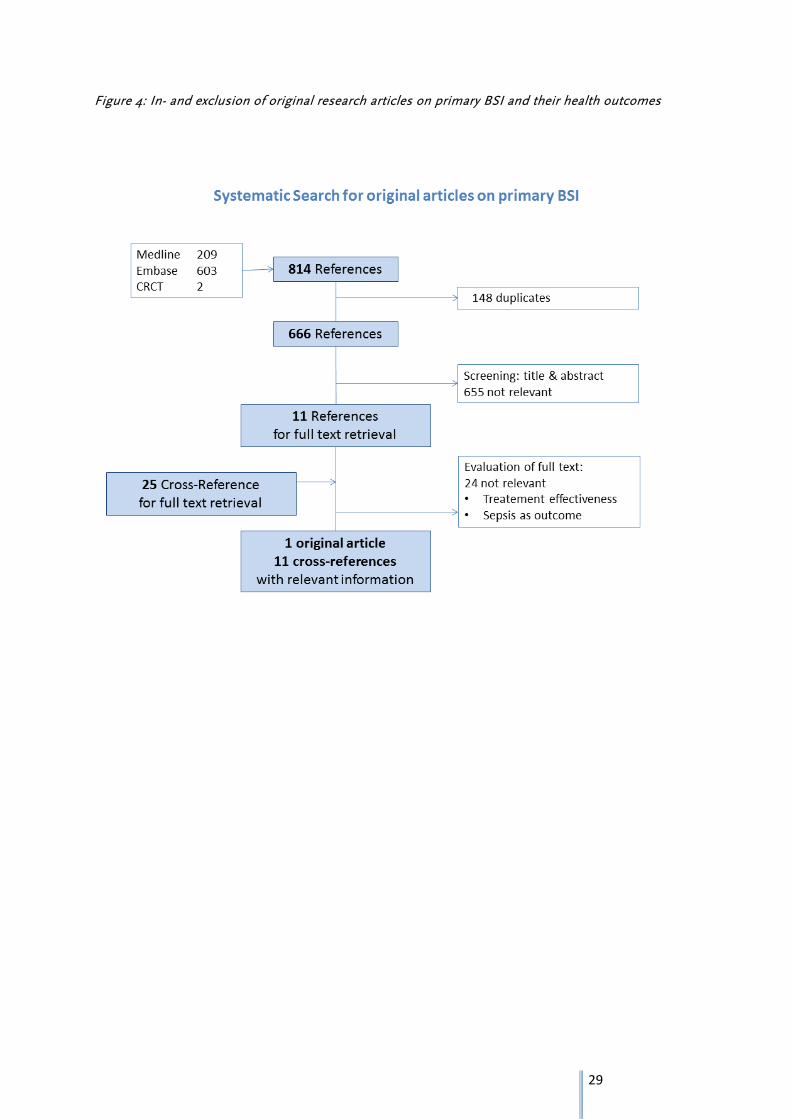
30
Figure 5: In- and exclusion of original research articles on primary BSI and Post Traumatic Stress Disorder
31
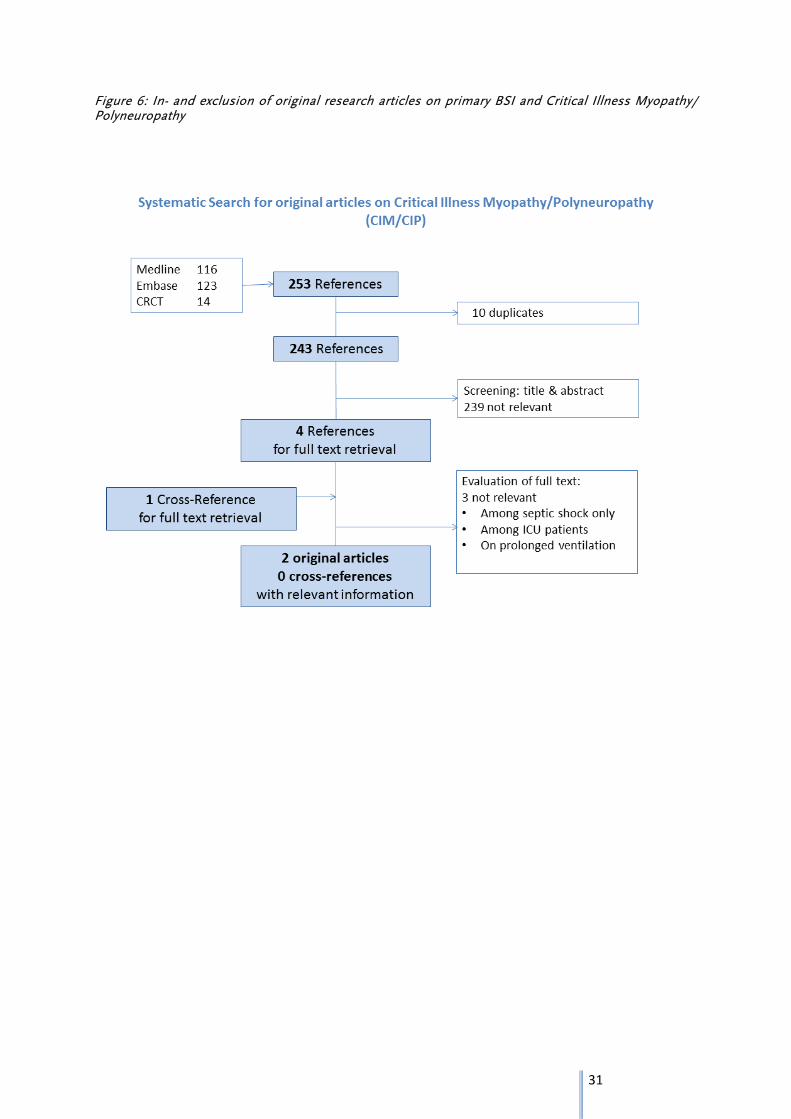
Figure 6: In- and exclusion of original research articles on primary BSI and Critical Illness Myopathy/ Polyneuropathy
32
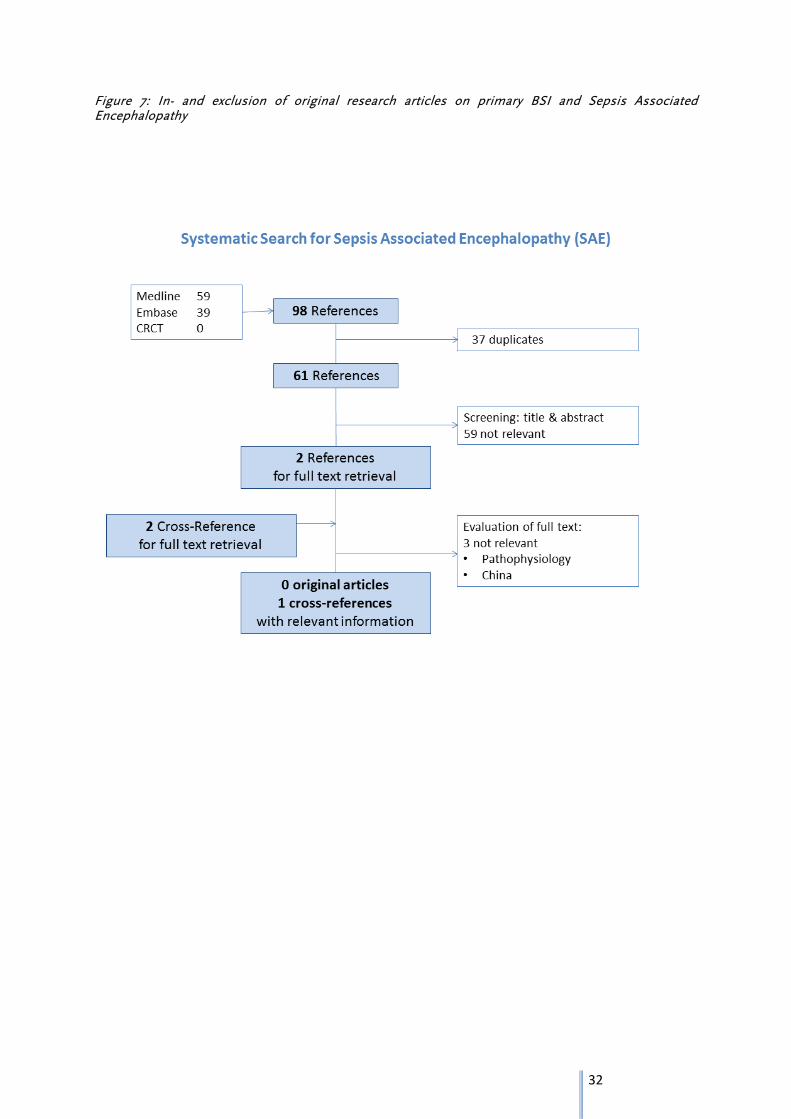
Figure 7: In- and exclusion of original research articles on primary BSI and Sepsis Associated Encephalopathy
33
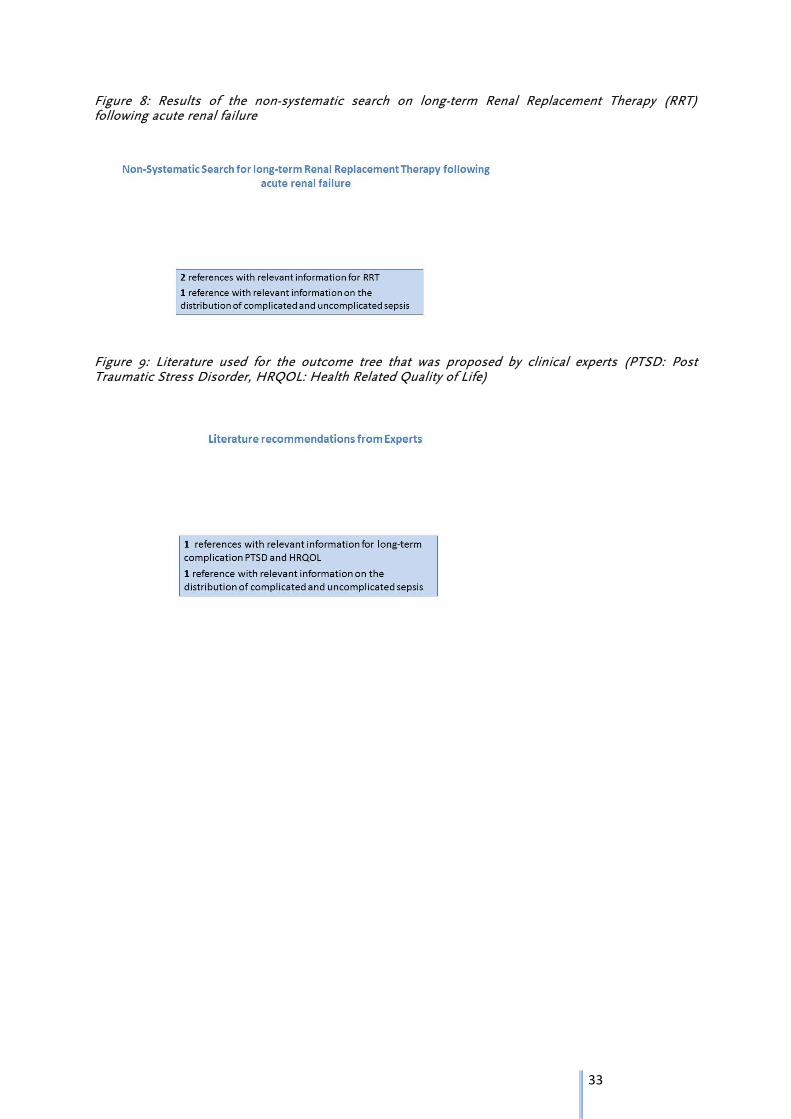
Figure 8: Results of the non-systematic search on long-term Renal Replacement Therapy (RRT) following acute renal failure
Figure 9: Literature used for the outcome tree that was proposed by clinical experts (PTSD: Post Traumatic Stress Disorder, HRQOL: Health Related Quality of Life)
34
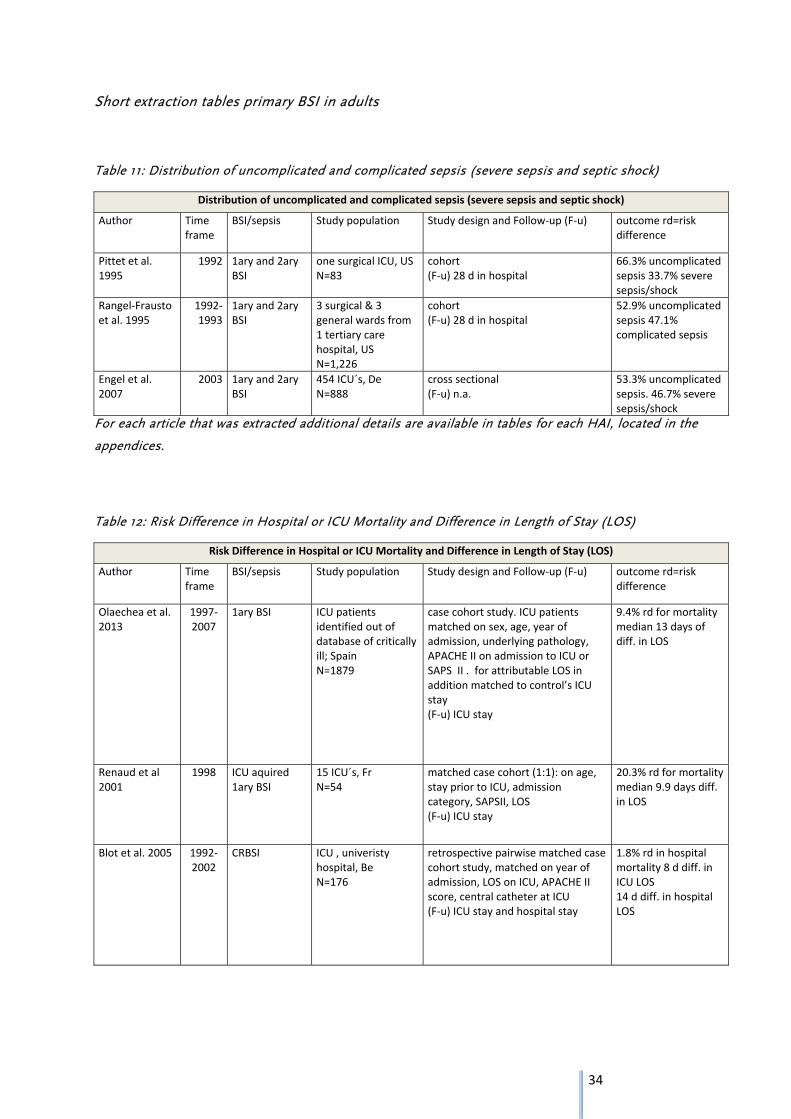
Short extraction tables primary BSI in adults
Table 11: Distribution of uncomplicated and complicated sepsis (severe sepsis and septic shock)
Distribution of uncomplicated and complicated sepsis (severe sepsis and septic shock)
Author Time frame
BSI/sepsis Study population Study design and Follow‐up (F‐u) outcome rd=risk difference
Pittet et al. 1995
1992 1ary and 2ary BSI
one surgical ICU, USN=83
cohort (F‐u) 28 d in hospital
66.3% uncomplicated sepsis 33.7% severe sepsis/shock
Rangel‐Frausto et al. 1995
1992‐1993
1ary and 2ary BSI
3 surgical & 3 general wards from 1 tertiary care hospital, US N=1,226
cohort (F‐u) 28 d in hospital
52.9% uncomplicated sepsis 47.1% complicated sepsis
Engel et al. 2007
2003 1ary and 2ary BSI
454 ICU´s, De N=888
cross sectional (F‐u) n.a.
53.3% uncomplicated sepsis. 46.7% severe sepsis/shock
For each article that was extracted additional details are available in tables for each HAI, located in the
appendices.
Table 12: Risk Difference in Hospital or ICU Mortality and Difference in Length of Stay (LOS)
Risk Difference in Hospital or ICU Mortality and Difference in Length of Stay (LOS)
Author Time frame
BSI/sepsis Study population Study design and Follow‐up (F‐u) outcome rd=risk difference
Olaechea et al. 2013
1997‐2007
1ary BSI ICU patients identified out of database of critically ill; Spain N=1879
case cohort study. ICU patients matched on sex, age, year of admission, underlying pathology, APACHE II on admission to ICU or SAPS II . for attributable LOS in addition matched to control’s ICU stay (F‐u) ICU stay
9.4% rd for mortality median 13 days of diff. in LOS
Renaud et al 2001
1998 ICU aquired 1ary BSI
15 ICU´s, Fr N=54
matched case cohort (1:1): on age, stay prior to ICU, admission category, SAPSII, LOS (F‐u) ICU stay
20.3% rd for mortality median 9.9 days diff. in LOS
Blot et al. 2005 1992‐2002
CRBSI ICU , univeristy hospital, Be N=176
retrospective pairwise matched case cohort study, matched on year of admission, LOS on ICU, APACHE II score, central catheter at ICU (F‐u) ICU stay and hospital stay
1.8% rd in hospital mortality 8 d diff. in ICU LOS 14 d diff. in hospital LOS
35
Digiovine et al.1999
1994‐1996
CRBSI ICU, US N=68
case cohort study, matched on predicted mortality at Day 1 , sex, age , race, length of stay, prior admissions, admitting diagnosis or group and chronic health (F‐u) hospital stay
4.4% rd in ICU mortality 10.3 d diff. in ICU LOS
Orsi et al. 2002 1994‐1995
hospital aquired, 1ary and 2ary BSI
university hospital, Italy mortality N=105 LOS N=36
matched case cohort study, matched on ward, sex, age, diagnosis, central venous catheter, LOS+‐20% (F‐u) hospital stay
35,2% diff. in hospital mortality median 20.0 d diff. in LOS
Quartin et al. 1997
1983‐1986
1ary and 2ary sepsis
10 Departments of the Veterans Affairs Medical Centers, USN=1,505
case cohort, Survival Model (CPSM) created from control population by Cox proportional hazards technique, assessing the influence of undelying disease infection history, inpatient days, age , race and sex (F‐u) 8 y
sepsis costs the average 30 day survivor 1.32 years during the 8 year follow‐up period and all sepsis patients 2.36 years
For each article that was extracted additional details are available in tables for each HAI, located in the
appendices.
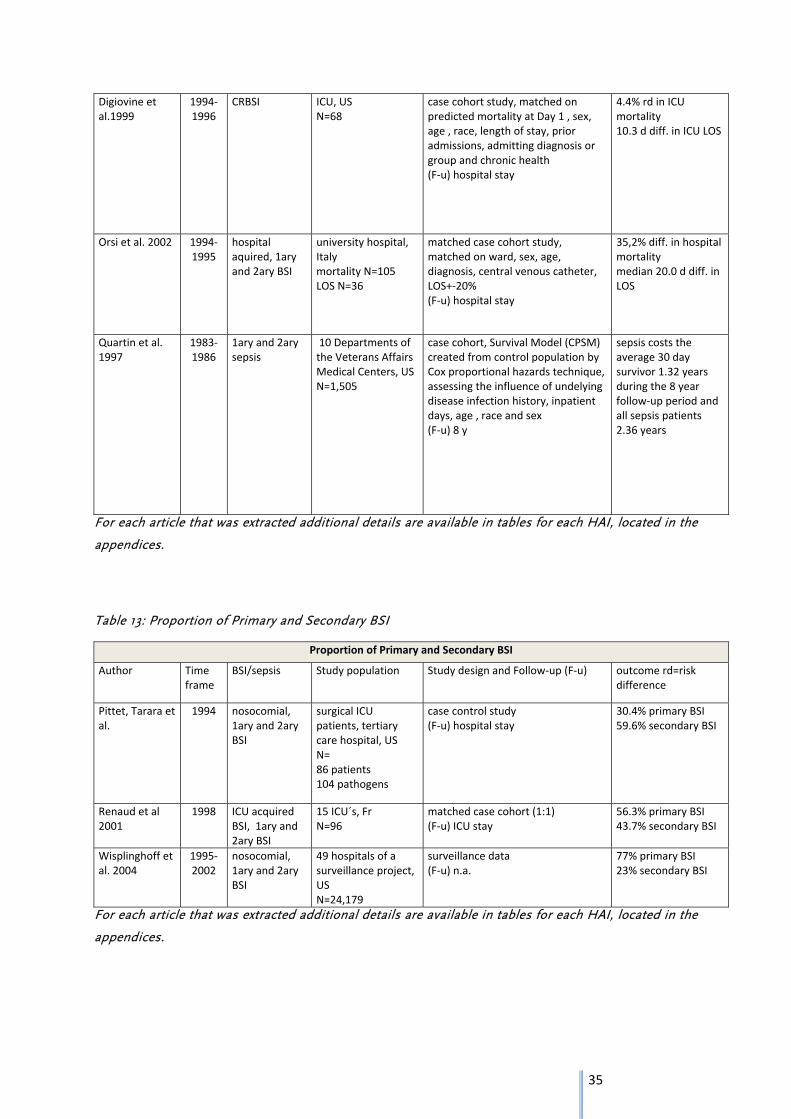
Table 13: Proportion of Primary and Secondary BSI
Proportion of Primary and Secondary BSI
Author Time frame
BSI/sepsis Study population Study design and Follow‐up (F‐u) outcome rd=risk difference
Pittet, Tarara et al.
1994 nosocomial, 1ary and 2ary BSI
surgical ICU patients, tertiary care hospital, US N= 86 patients 104 pathogens
case control study (F‐u) hospital stay
30.4% primary BSI 59.6% secondary BSI
Renaud et al 2001
1998 ICU acquired BSI, 1ary and 2ary BSI
15 ICU´s, Fr N=96
matched case cohort (1:1) (F‐u) ICU stay
56.3% primary BSI 43.7% secondary BSI
Wisplinghoff et al. 2004
1995‐2002
nosocomial, 1ary and 2ary BSI
49 hospitals of a surveillance project, US N=24,179
surveillance data (F‐u) n.a.
77% primary BSI 23% secondary BSI
For each article that was extracted additional details are available in tables for each HAI, located in the
appendices.
36
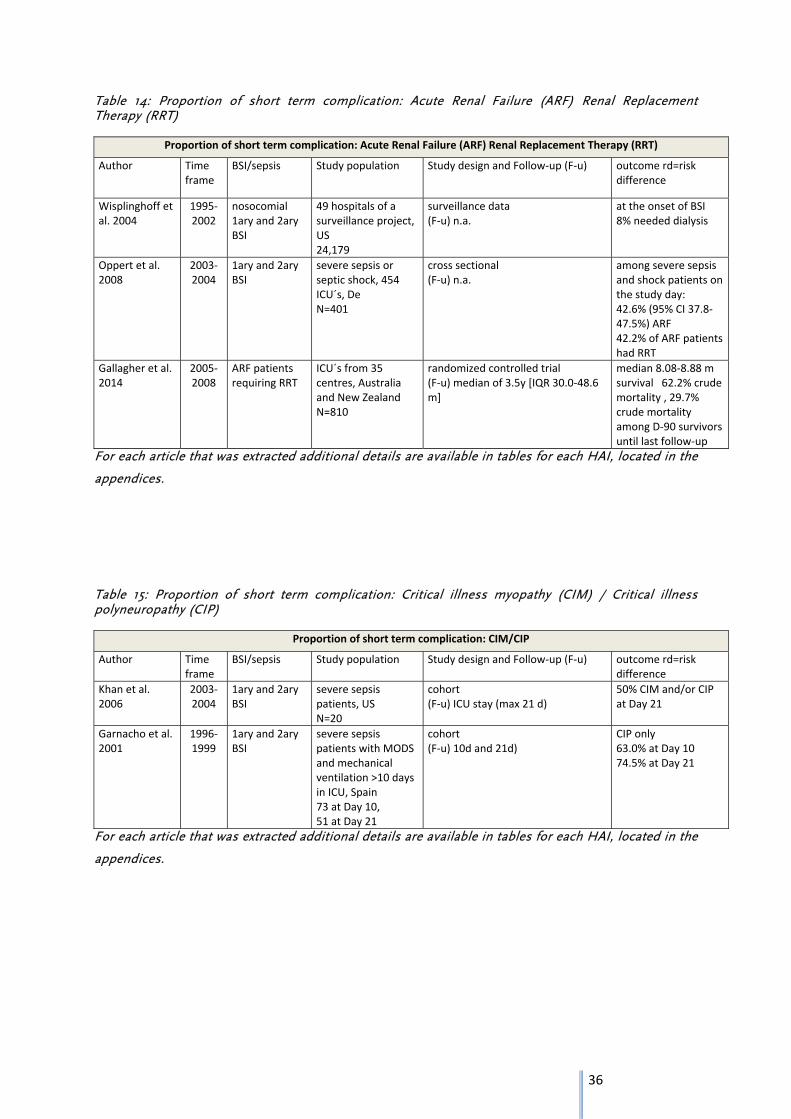
Table 14: Proportion of short term complication: Acute Renal Failure (ARF) Renal Replacement Therapy (RRT)
Proportion of short term complication: Acute Renal Failure (ARF) Renal Replacement Therapy (RRT)
Author Time frame
BSI/sepsis Study population Study design and Follow‐up (F‐u) outcome rd=risk difference
Wisplinghoff et al. 2004
1995‐2002
nosocomial 1ary and 2ary BSI
49 hospitals of a surveillance project, US 24,179
surveillance data (F‐u) n.a.
at the onset of BSI 8% needed dialysis
Oppert et al. 2008
2003‐2004
1ary and 2ary BSI
severe sepsis or septic shock, 454 ICU´s, De N=401
cross sectional (F‐u) n.a.
among severe sepsis and shock patients on the study day: 42.6% (95% CI 37.8‐47.5%) ARF 42.2% of ARF patients had RRT
Gallagher et al. 2014
2005‐2008
ARF patients requiring RRT
ICU´s from 35 centres, Australia and New Zealand N=810
randomized controlled trial (F‐u) median of 3.5y [IQR 30.0‐48.6 m]
median 8.08‐8.88 m survival 62.2% crude mortality , 29.7% crude mortality among D‐90 survivors until last follow‐up
For each article that was extracted additional details are available in tables for each HAI, located in the
appendices.
Table 15: Proportion of short term complication: Critical illness myopathy (CIM) / Critical illness polyneuropathy (CIP)
Proportion of short term complication: CIM/CIP
Author Time frame
BSI/sepsis Study population Study design and Follow‐up (F‐u) outcome rd=risk difference
Khan et al. 2006
2003‐2004
1ary and 2ary BSI
severe sepsis patients, US N=20
cohort (F‐u) ICU stay (max 21 d)
50% CIM and/or CIP at Day 21
Garnacho et al. 2001
1996‐1999
1ary and 2ary BSI
severe sepsis patients with MODS and mechanical ventilation >10 days in ICU, Spain 73 at Day 10, 51 at Day 21
cohort (F‐u) 10d and 21d)
CIP only 63.0% at Day 10 74.5% at Day 21
For each article that was extracted additional details are available in tables for each HAI, located in the
appendices.

37
Table 16: Proportion of short term complication: Sepsis Associated Encephalopathy (SAE)
Proportion of short term complication: SAE
Author Time frame
BSI/sepsis Study population Study design and Follow‐up (F‐u) outcome rd=risk difference
Eidelmann et al. 1996
1992‐1996
1ary and 2ary BSI, severe sepsis
severe sepsis patients, Israel N=50
cohort (F‐u) hospital stay
50‐62% SAE
For each article that was extracted additional details are available in tables for each HAI, located in the
appendices.
Table 17: Proportion of long term complication: Renal Replacement Therapy (RRT)
Proportion of long term complication: Renal Replacement Therapy (RRT)
Author Time frame
BSI/sepsis Study population Study design and Follow‐up (F‐u) outcome rd=risk difference
Gallagher et al. 2014
2005‐2008
ARF patients requiring RRT
35 ICU´s, Australia Day 90, survivors N=810
randomized controlled trial (F‐u) median of 3,5y [IQR 30.0‐48.6 m]
of Day 90 survivors 5.4% on RRT 31.9% crude mortality at a median of 42.4m follow‐up
For each article that was extracted additional details are available in tables for each HAI, located in the
appendices.
Table 18: Proportion of long term complication: cognitive impairment
Proportion of long term complication: cognitive impairment
Author Time frame
BSI/sepsis Study population Study design and Follow‐up (F‐u) outcome rd=risk difference
Iwashyna et al. 2010
1998‐2006
1ary and 2ary BSI, severe sepsis
severe sepsis patients, US N=516
cohort (F‐u) median of 0.9 y and 2.8 y
Among all severe sepsis patients 10.6% diff. of cognitive impairment at year 1 and 2 after sepsis compared to 1.1 years before sepsis
Hopkins et al. 2005
1994‐1999
ARDS ARDS survivors, US year 1 : N=66; year 2: N=62
cohort (F‐u) 1y and 2y
neurocognitive sequelae year 1 46% year 2 47%
For each article that was extracted additional details are available in tables for each HAI, located in the
appendices.
38
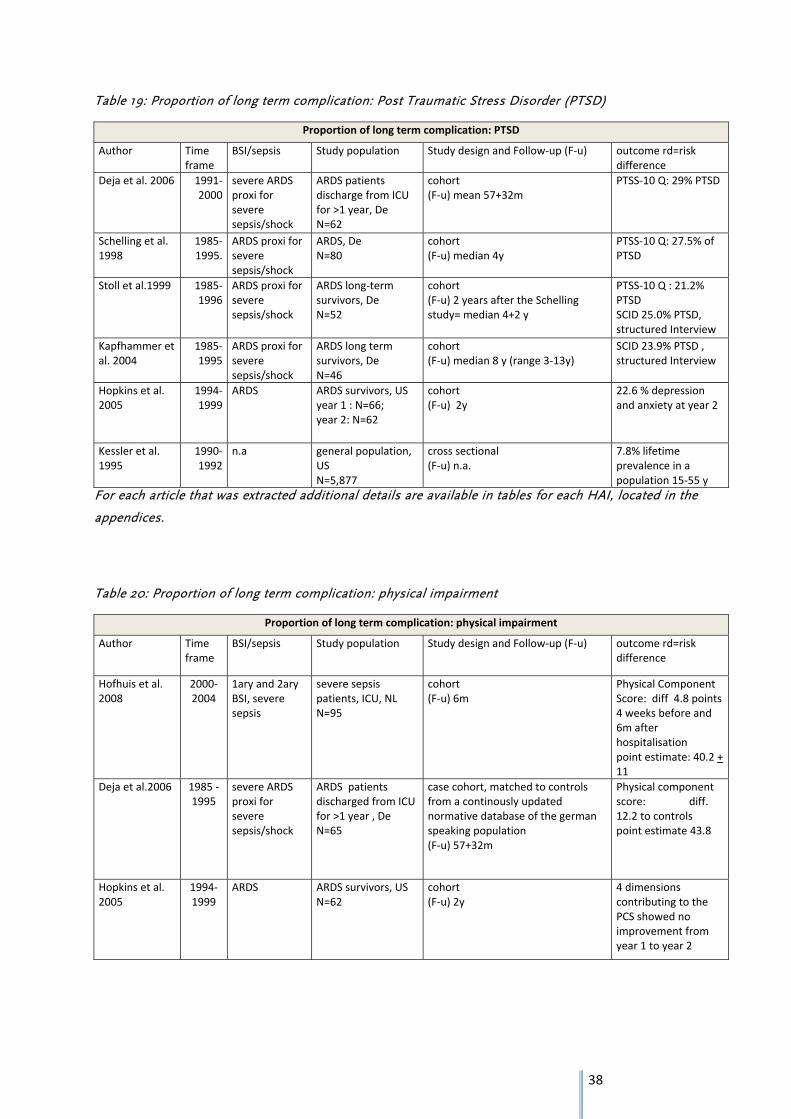
Table 19: Proportion of long term complication: Post Traumatic Stress Disorder (PTSD)
Proportion of long term complication: PTSD
Author Time frame
BSI/sepsis Study population Study design and Follow‐up (F‐u) outcome rd=risk difference
Deja et al. 2006 1991‐2000
severe ARDS proxi for severe sepsis/shock
ARDS patients discharge from ICU for >1 year, De N=62
cohort (F‐u) mean 57+32m
PTSS‐10 Q: 29% PTSD
Schelling et al. 1998
1985‐1995.
ARDS proxi for severe sepsis/shock
ARDS, De N=80
cohort (F‐u) median 4y
PTSS‐10 Q: 27.5% of PTSD
Stoll et al.1999 1985‐1996
ARDS proxi for severe sepsis/shock
ARDS long‐term survivors, De N=52
cohort (F‐u) 2 years after the Schelling study= median 4+2 y
PTSS‐10 Q : 21.2% PTSD SCID 25.0% PTSD, structured Interview
Kapfhammer et al. 2004
1985‐1995
ARDS proxi for severe sepsis/shock
ARDS long term survivors, De N=46
cohort (F‐u) median 8 y (range 3‐13y)
SCID 23.9% PTSD , structured Interview
Hopkins et al. 2005
1994‐1999
ARDS ARDS survivors, US year 1 : N=66; year 2: N=62
cohort (F‐u) 2y
22.6 % depression and anxiety at year 2
Kessler et al. 1995
1990‐1992
n.a general population, US N=5,877
cross sectional (F‐u) n.a.
7.8% lifetime prevalence in a population 15‐55 y
For each article that was extracted additional details are available in tables for each HAI, located in the
appendices.
Table 20: Proportion of long term complication: physical impairment
Proportion of long term complication: physical impairment
Author Time frame
BSI/sepsis Study population Study design and Follow‐up (F‐u) outcome rd=risk difference
Hofhuis et al. 2008
2000‐2004
1ary and 2ary BSI, severe sepsis
severe sepsis patients, ICU, NL N=95
cohort (F‐u) 6m
Physical Component Score: diff 4.8 points 4 weeks before and 6m after hospitalisation point estimate: 40.2 + 11
Deja et al.2006 1985 ‐1995
severe ARDS proxi for severe sepsis/shock
ARDS patients discharged from ICU for >1 year , De N=65
case cohort, matched to controls from a continously updated normative database of the german speaking population (F‐u) 57+32m
Physical component score: diff. 12.2 to controls point estimate 43.8
Hopkins et al. 2005
1994‐1999
ARDS ARDS survivors, US N=62
cohort (F‐u) 2y
4 dimensions contributing to the PCS showed no improvement from year 1 to year 2
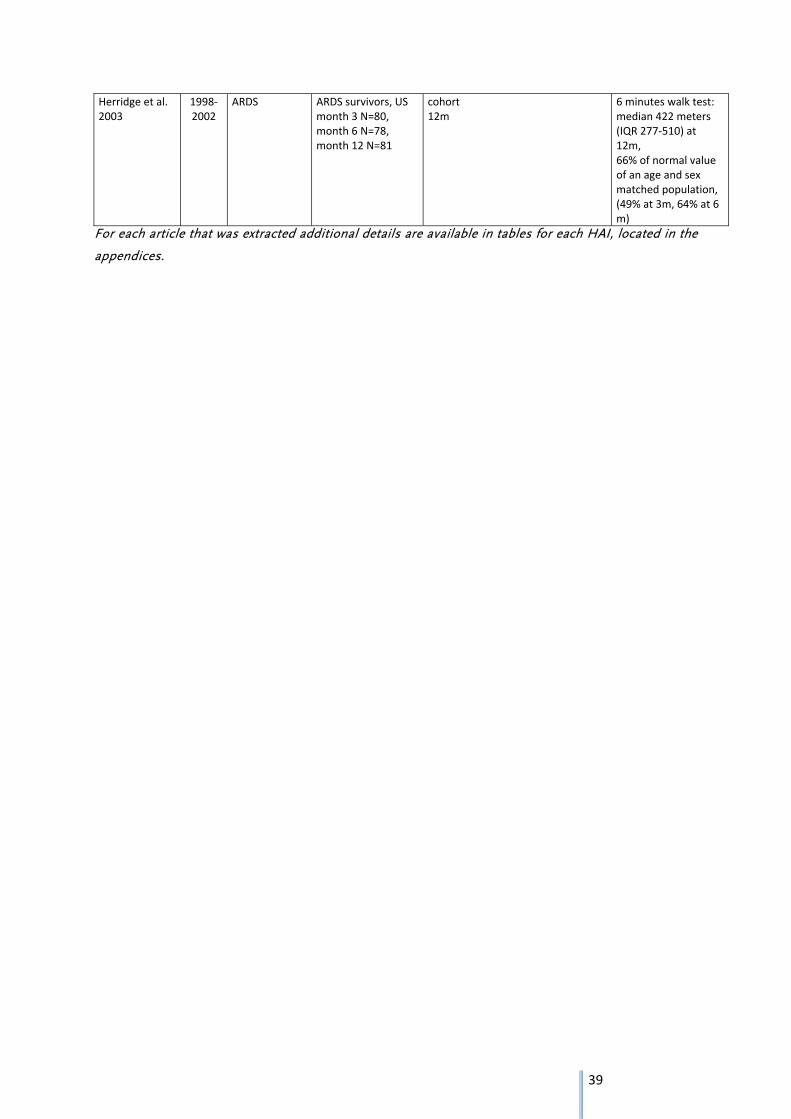
39
Herridge et al. 2003
1998‐2002
ARDS ARDS survivors, US month 3 N=80, month 6 N=78, month 12 N=81
cohort 12m
6 minutes walk test: median 422 meters (IQR 277‐510) at 12m, 66% of normal value of an age and sex matched population, (49% at 3m, 64% at 6 m)
For each article that was extracted additional details are available in tables for each HAI, located in the
appendices.
40
Figure 10 shows the outcome tree of primary BSI in adults. The transitional probabilities were taken from the extraction tables
3.2.3 Discussion
We defined the health state of primary bloodstream infection (PBSI) in adults according to the ECDC
point prevalence survey definitions. However, four of the studies identified by our literature search
perform analysis on a study population of sepsis patients. Almost all studies which were considered
use the BSI respectively sepsis definition according to the ACCP/SCCM (agreed upon during the 1991
“Consensus Conference” organized by the American College of Chest Physicians (ACCP) and the
Society of Critical Care Medicine (SCCM) and reviewed in 2002). Overall, the risk estimates identified
by different studies for the same health outcomes provide similar values. Smaller variations of the
probability among studies may be explained by differences in the studied populations (underlying
disease, age, sex, and ethnicity), casual pathogen, source of infection, quality of care, hospitalization
ward and type of hospital, duration of follow‐up, ascertainment method used or different matching
procedures.
41
The disability weights of the ICU hospitalization and of complicated sepsis include already the disease
weight of the short‐term complications. However, we provide information on those risk differences
for informative purpose. Finally this information is not necessary for the outcome tree.
Literature on outcomes of mixed infection sources without differentiation between primary and
secondary sepsis are most frequent. Nevertheless, we estimate that this has limited bias on our
outcome tree as we identified two studies (46), (25) using PBSI patients, providing risk differences in
mortality and differences in length of ICU stay, the two outcomes most varying according to the
source of infection. As probabilities (risk/ risk differences) for the development of long term
complications are indicated only for the subcategory of patients with complicated sepsis (severe
sepsis and septic shock), we estimate that probabilities do not differ according to the initial source of
infection (primary or secondary BSI). For some of the long‐term complications we did not identify any
relevant literature on a population with a health status of sepsis or BSI but with ARDS (Acute
Respiratory Distress Syndrome). As ARDS frequently occurs following severe sepsis, we agreed with
the clinical experts that ARDS may be used as a proxy for complicated sepsis. Nevertheless, as ARDS
patients have frequent mechanical ventilation some of the long‐term consequences may be worse
following ARDS compared to complicated sepsis without ARDS, and thus may be overestimated in
our outcome tree.
Distribution of sepsis severity (proportions of uncomplicated and complicated sepsis)
All information on the distribution of the severity of sepsis is drawn from studies on mixed primary
and secondary sepsis populations. Because complications may develop less frequently following
CRBSI as following secondary BSI, we risk an overestimation of the proportion of complicated sepsis.
Proportion of primary BSI and secondary BSI
For informative purposes we provide information on the proportion of primary and secondary BSI
among all BSI cases. Two of the identified studies (25) and (30) have been conducted in the 90´s and
report similar proportions. A third study (31) conducted from 1995 until 2002 found a much higher
proportion of primary BSI, which most probably is because this study is conducted with surveillance
data including a higher proportion of BSI of unknown source.
42
Risk difference in mortality and LOS
The risk difference in mortality reported by Renaud et al. is twice as high as that reported by
Olaechea et al., which may be explained by some major differences between the two studies e.g
study year: 1998 versus 1997‐2007, study participants: 1879 cases vs 54 cases and study design:
number of controls per case 1:1 vs 4:1.
To countercheck if the identified risk differences in mortality due to PBSI are in relation to risk
differences due to CRBSI (expected to be lower as PBSI) or mixed primary and secondary BSI
populations (expected to be higher as PBSI only), we provide additional information of studies on
those health states. In line, we identified in our search studies that report lower risk differences in
mortality due to CRBSI (1.8%‐4.4%) and higher risk differences in mortality (35.2%) due to mixed
primary and secondary BSI compared to the risk difference following PBSI.
Renaud et al. reports a shorter difference in LOS as Olaechea et al. (9.9 vs 13 d). The prolonged LOS
may be explained by the improved survival rate of sepsis patients in later years, going along with
longer hospitalization of those patients, especially in ICU.
As the long‐term risk difference in mortality is difficult to investigate, we only identified one single
study (29) that examined sepsis attributable life years lost in all or in “30‐day‐survivors” during a
period of 8 years. Participants were recruited between 1983 and 1986. Mortality would probably be
lower today due to improved treatment.
Risk difference in long-term cognitive impairment
The two identified studies report values of a fourfold difference. Major methodological differences
including different ascertainment method and health state of the study participants may be the
cause of that. Hopkins et al. investigated the prevalence of cognitive impairment in ARDS patients
and excluded those with impairment prior to the infection. In contrast Iwashyna et al. compared the
proportion of cognitive impairment in cases that developed severe sepsis with the proportion of
cognitive impairment in the same cases but one year before the infection. The risk to develop
cognitive impairment may be slightly overestimated since in both studies some of the participants
would probably have developed cognitive impairment independent of the infection.
Risk difference in long-term PTSD
Of the five studies identified, four report on the prevalence of PTSD at a certain time after the
participants experienced ARDS and one reports on the prevalence of depression which is a part of
the PTSD symptomatic. As described before, ARDS is used as a proxy for complicated BSI. Thus, there
is a risk that we overestimate the prevalence of PTSD. One study, by Kapfhammer et al. used a
different ascertainment method (SCID) than the three other studies (PTSS‐10). To take into
43
consideration that not all PTSD may be due to ARDS, we subtract a PTSD background prevalence
reported by Kessler et al. in the US. Three studies, namely Schelling et al., Kapfhammer et al. and
Stoll et al, investigated the same ARDS population at different intervals from the infection. Looking at
the reported crude PTSD prevalence in the four studies on a time line, we observe that the outcome
shows a slow decrease over time (27.5% at a median of 48m to 23.9% at a median of 96m).
According to the Kessler et al. study only a minor proportion of PTSD cases further improved later as
24m after the traumatic event and that after 6 years no more improvement is observed any more.
Risk difference in long-term physical impairment
Two studies (39), (44) measured physical impairment by applying the Short‐form 36 health status
questionnaire (SF‐36) to evaluate the Health Related Quality of Life (HRQOL). Of the eight dimension
assessed in the questionnaire, a physical components score (PCS) is extracted mainly from four
dimensions: physical functioning, role‐physical, bodily pain and general health. In the SF‐36 form
higher scores represent a better functioning, with a range from 0 to 100. The difference of PCS scores
differ quiet largely among the two studies (4.8 vs 12.2 scores) which may be due to that Hofhuis et al.
use a severe sepsis population and Deja et al. use an ARDS population. Also the fact that Deja et al.
compare the scores to the normative PCS values, adjusted for age and sex, assumes that the PCS
scores of the study participants were up to the normative values before the infection. The 6 minute
walk test used by Herridge et al. is commonly applied to assess physical impairment; the reference is
a normative population value and thus potentially overestimating the difference due to the ARDS
event. No improvement may be assumed after one year post ARDS as reported by Hopkins et al. and
Herridge et al..
Risk of renal replacement therapy (RRT)
In the identified studies the health status of the participants is acute renal failure and not sepsis
respectively BSI. We assume that the risk of chronic/long‐term RRT is the same for all acute renal
failure, independent of its cause. By non‐systematic search we identified the recent study by
Gallagher et al. that assesses the prevalence of maintenance dialysis in 810 “Day‐90 acute renal
failure (ARF)‐survivors” since their initiation of RRT.
Wisplinghoff et al. report that 8% of their BSI patients needed RRT at the onset of BSI. According to
the ACCP/SCCM definition we classify BSI patients with ARF as complicated sepsis cases. Thus we
weighted the 8% with the severity proportions (complicated sepsis in 33.7%‐47.1%) and calculated a
range of 16.6%‐23.2% of complicated sepsis patients that require RRT at the onset of BSI. For
comparison we used a second study by Oppert et al. and calculated that 18.0% of the complicated
44
sepsis patients require RRT (of complicated sepsis patients 42.6% had ARF and 42.17% of those ARF
patients required RRT).
Thus, of all complicated sepsis patients 16.6%‐23.2% require RRT at short‐term and of those 5.4%
require long‐term maintenance RRT. In conclusion the risk to require long‐term RRT after severe
sepsis is 0.9‐1.3%, assuming a background risk of zero.
While calculating the disease burden, the reduced survival of patients with RRT should be considered
in the duration of disease, as reported by Gallagher et al. (33).
45
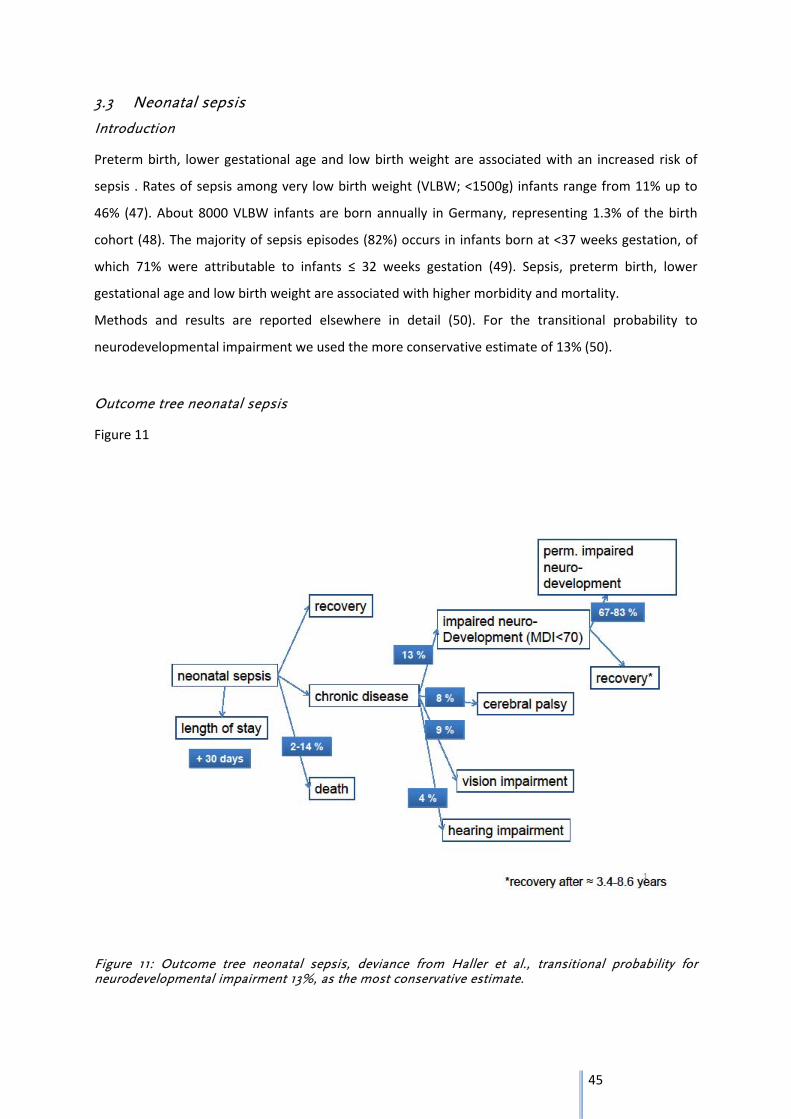
3.3 Neonatal sepsis
Introduction
Preterm birth, lower gestational age and low birth weight are associated with an increased risk of
sepsis . Rates of sepsis among very low birth weight (VLBW; <1500g) infants range from 11% up to
46% (47). About 8000 VLBW infants are born annually in Germany, representing 1.3% of the birth
cohort (48). The majority of sepsis episodes (82%) occurs in infants born at <37 weeks gestation, of
which 71% were attributable to infants ≤ 32 weeks gestation (49). Sepsis, preterm birth, lower
gestational age and low birth weight are associated with higher morbidity and mortality.
Methods and results are reported elsewhere in detail (50). For the transitional probability to
neurodevelopmental impairment we used the more conservative estimate of 13% (50).
Outcome tree neonatal sepsis
Figure 11
Figure 11: Outcome tree neonatal sepsis, deviance from Haller et al., transitional probability for neurodevelopmental impairment 13%, as the most conservative estimate.
46
3.4 Clostridium difficile infection
3.4.1 Methods
We applied a two‐step approach to identify relevant studies. First, we performed a systematic review
of systematic reviews on health outcomes after CDI. Second, we conducted a systematic review of
primary studies focussing on those outcomes for which the already identified systematic reviews did
not provide sufficient data to be included in the outcome tree (for outcomes length of hospital stay,
death and sepsis).
Furthermore for the differentiation of health states (mild+moderate vs. severe CDI) data on the
severity of CDI were collected non‐systematically.
CDI was defined by a positive laboratory test for C. difficile (C. difficile toxin A or B OR positive culture
for toxin‐producing C. difficile or cell cytotoxicity assay or PCR) OR pseudomembranous colitis
(identified through colonoscopy or histopathology or autopsy).
For the outcomes death, LOS and sepsis we extracted risk differences whereas for the outcome
recurrence and colectomy absolute risks were used. This was considered to be adequate as 1) CDI
recurrences are specific for the disease and 2) colectomy in CDI patients was assumed to be
attributable to CDI.
47
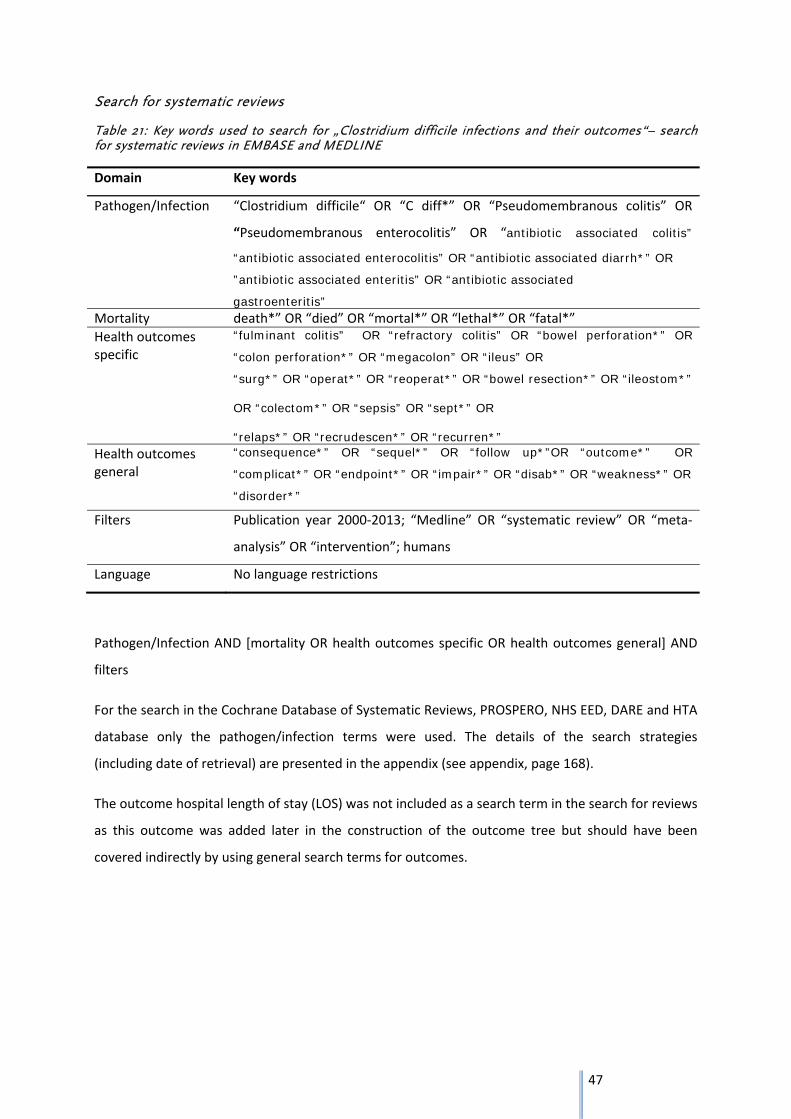
Search for systematic reviews
Table 21: Key words used to search for „Clostridium difficile infections and their outcomes“– search for systematic reviews in EMBASE and MEDLINE
Domain Key words
Pathogen/Infection “Clostridium difficile“ OR “C diff*” OR “Pseudomembranous colitis” OR
“Pseudomembranous enterocolitis” OR “antibiotic associated colitis”
“antibiotic associated enterocolitis” OR “antibiotic associated diarrh*” OR
”antibiotic associated enteritis” OR “antibiotic associated
gastroenteritis” Mortality death*” OR “died” OR “mortal*” OR “lethal*” OR “fatal*”
Health outcomes specific
“fulminant colitis” OR “refractory colitis” OR “bowel perforation*” OR
“colon perforation*” OR “megacolon” OR “ileus” OR
“surg*” OR “operat*” OR “reoperat*” OR “bowel resection*” OR “ileostom*” OR “colectom*” OR “sepsis” OR “sept*” OR “relaps*” OR “recrudescen*” OR “recurren*”
Health outcomes general
“consequence*” OR “sequel*” OR “follow up*”OR “outcome*” OR
“complicat*” OR “endpoint*” OR “impair*” OR “disab*” OR “weakness*” OR
“disorder*”
Filters Publication year 2000‐2013; “Medline” OR “systematic review” OR “meta‐
analysis” OR “intervention”; humans
Language No language restrictions
Pathogen/Infection AND [mortality OR health outcomes specific OR health outcomes general] AND
filters
For the search in the Cochrane Database of Systematic Reviews, PROSPERO, NHS EED, DARE and HTA
database only the pathogen/infection terms were used. The details of the search strategies
(including date of retrieval) are presented in the appendix (see appendix, page 168).
The outcome hospital length of stay (LOS) was not included as a search term in the search for reviews
as this outcome was added later in the construction of the outcome tree but should have been
covered indirectly by using general search terms for outcomes.
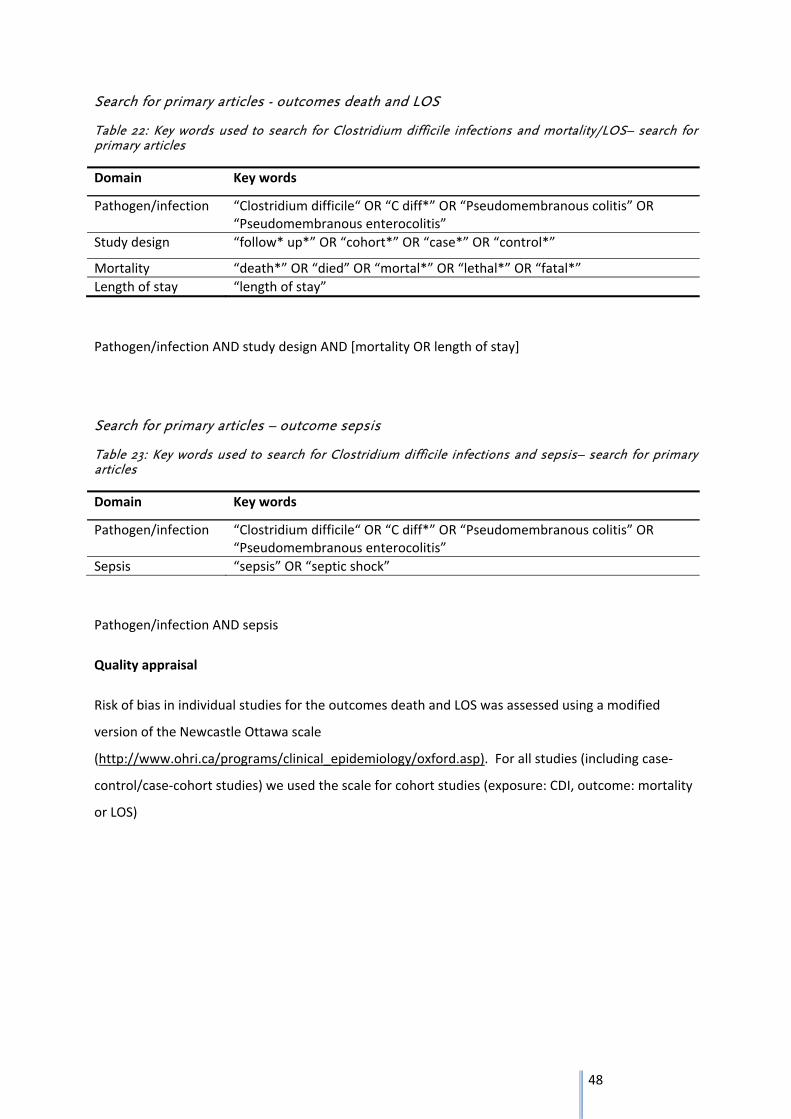
48
Search for primary articles - outcomes death and LOS
Table 22: Key words used to search for Clostridium difficile infections and mortality/LOS– search for primary articles
Domain Key words
Pathogen/infection “Clostridium difficile“ OR “C diff*” OR “Pseudomembranous colitis” OR “Pseudomembranous enterocolitis”
Study design “follow* up*” OR “cohort*” OR “case*” OR “control*”
Mortality “death*” OR “died” OR “mortal*” OR “lethal*” OR “fatal*”
Length of stay “length of stay”
Pathogen/infection AND study design AND [mortality OR length of stay]
Search for primary articles – outcome sepsis
Table 23: Key words used to search for Clostridium difficile infections and sepsis– search for primary articles
Domain Key words
Pathogen/infection “Clostridium difficile“ OR “C diff*” OR “Pseudomembranous colitis” OR “Pseudomembranous enterocolitis”
Sepsis “sepsis” OR “septic shock”
Pathogen/infection AND sepsis
Quality appraisal
Risk of bias in individual studies for the outcomes death and LOS was assessed using a modified
version of the Newcastle Ottawa scale
(http://www.ohri.ca/programs/clinical_epidemiology/oxford.asp). For all studies (including case‐
control/case‐cohort studies) we used the scale for cohort studies (exposure: CDI, outcome: mortality
or LOS)
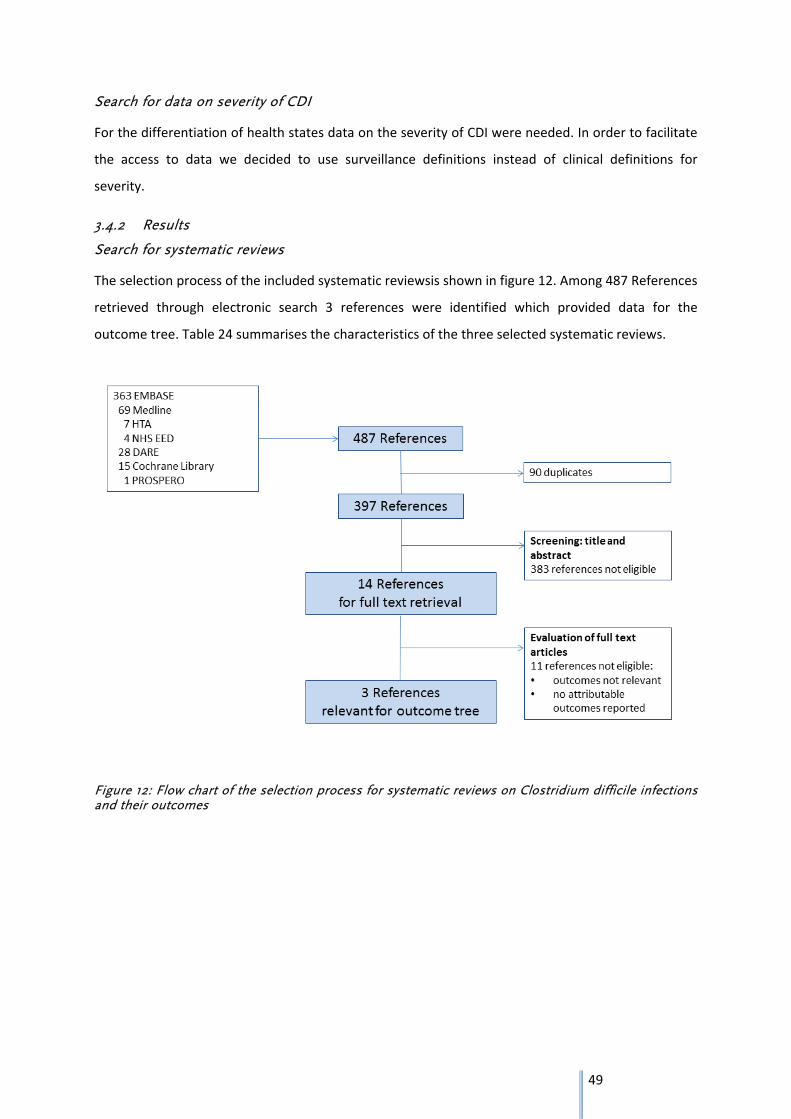
49
Search for data on severity of CDI
For the differentiation of health states data on the severity of CDI were needed. In order to facilitate
the access to data we decided to use surveillance definitions instead of clinical definitions for
severity.
3.4.2 Results
Search for systematic reviews
The selection process of the included systematic reviewsis shown in figure 12. Among 487 References
retrieved through electronic search 3 references were identified which provided data for the
outcome tree. Table 24 summarises the characteristics of the three selected systematic reviews.
Figure 12: Flow chart of the selection process for systematic reviews on Clostridium difficile infections and their outcomes
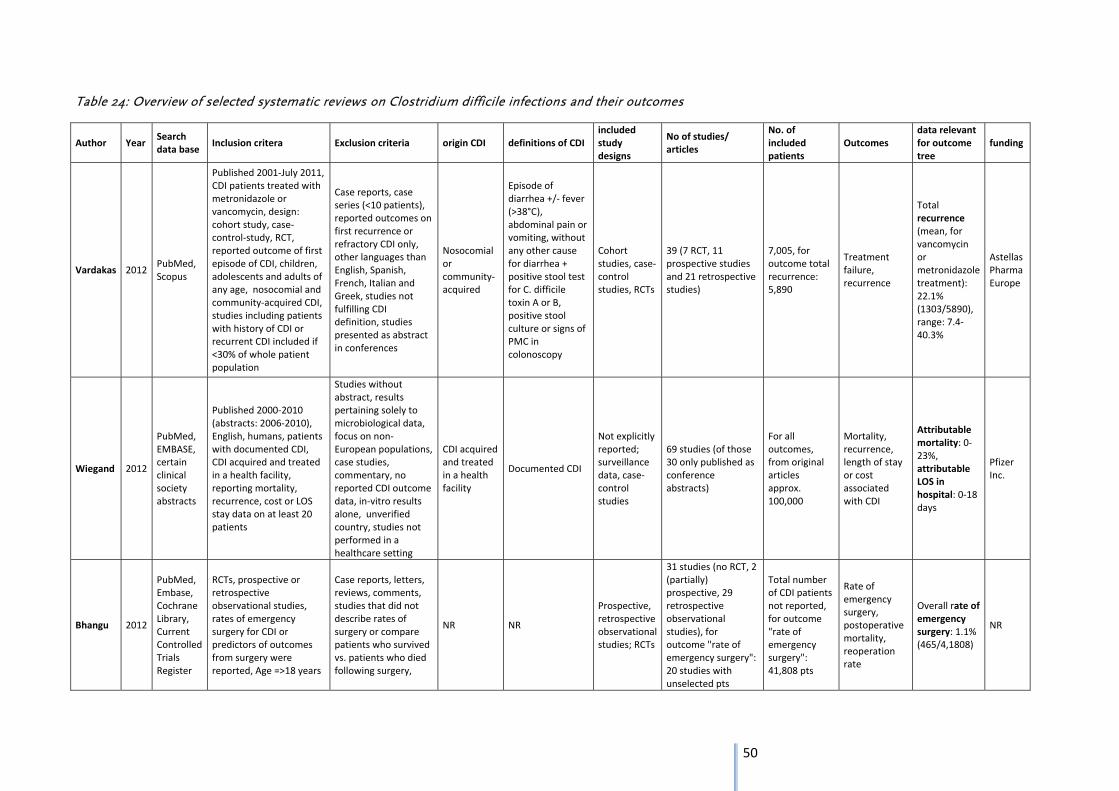
50
Table 24: Overview of selected systematic reviews on Clostridium difficile infections and their outcomes
Author Year Search data base
Inclusion critera Exclusion criteria origin CDI definitions of CDI included study designs
No of studies/ articles
No. of included patients
Outcomes data relevant for outcome tree
funding
Vardakas 2012 PubMed, Scopus
Published 2001‐July 2011, CDI patients treated with metronidazole or vancomycin, design: cohort study, case‐control‐study, RCT, reported outcome of first episode of CDI, children, adolescents and adults of any age, nosocomial and community‐acquired CDI, studies including patients with history of CDI or recurrent CDI included if <30% of whole patient population
Case reports, case series (<10 patients), reported outcomes on first recurrence or refractory CDI only, other languages than English, Spanish, French, Italian and Greek, studies not fulfilling CDI definition, studies presented as abstract in conferences
Nosocomial or community‐acquired
Episode of diarrhea +/‐ fever (>38°C), abdominal pain or vomiting, without any other cause for diarrhea + positive stool test for C. difficile toxin A or B, positive stool culture or signs of PMC in colonoscopy
Cohort studies, case‐control studies, RCTs
39 (7 RCT, 11 prospective studies and 21 retrospective studies)
7,005, for outcome total recurrence: 5,890
Treatment failure, recurrence
Total recurrence (mean, for vancomycin or metronidazole treatment): 22.1% (1303/5890), range: 7.4‐40.3%
Astellas Pharma Europe
Wiegand 2012
PubMed, EMBASE, certain clinical society abstracts
Published 2000‐2010 (abstracts: 2006‐2010), English, humans, patients with documented CDI, CDI acquired and treated in a health facility, reporting mortality, recurrence, cost or LOS stay data on at least 20 patients
Studies without abstract, results pertaining solely to microbiological data, focus on non‐European populations, case studies, commentary, no reported CDI outcome data, in‐vitro results alone, unverified country, studies not performed in a healthcare setting
CDI acquired and treated in a health facility
Documented CDI
Not explicitly reported; surveillance data, case‐control studies
69 studies (of those 30 only published as conference abstracts)
For all outcomes, from original articles approx. 100,000
Mortality, recurrence, length of stay or cost associated with CDI
Attributable mortality: 0‐23%, attributable LOS in hospital: 0‐18 days
Pfizer Inc.
Bhangu 2012
PubMed, Embase, Cochrane Library, Current Controlled Trials Register
RCTs, prospective or retrospective observational studies, rates of emergency surgery for CDI or predictors of outcomes from surgery were reported, Age =>18 years
Case reports, letters, reviews, comments, studies that did not describe rates of surgery or compare patients who survived vs. patients who died following surgery,
NR NR
Prospective, retrospective observational studies; RCTs
31 studies (no RCT, 2 (partially) prospective, 29 retrospective observational studies), for outcome "rate of emergency surgery": 20 studies with unselected pts
Total number of CDI patients not reported, for outcome "rate of emergency surgery": 41,808 pts
Rate of emergency surgery, postoperative mortality, reoperation rate
Overall rate of emergency surgery: 1.1% (465/4,1808)
NR
51
For the outcome recurrence the review of Vardakas et al. included 39 studies (randomized controlled
trials, prospective and retrospective cohort studies) with 5,890 patients and reported a mean total
recurrence rate of 22.1% after metronidazole or vancomycin treatment with a range from 7.4‐40.3%
(51). They as well stratified analysis according to funding, time period, treatment, geographical
region, duration of follow‐up, age and study design. As this outcome was not included in the final
outcome tree the primary studies were not further screened.
The review of Bhangu et al. that analysed outcomes of emergency surgery for CDI presented 20
studies with unselected patients and details of the total number of hospitalized patients with CDI
(52). The overall emergency operation rate was 1.1%. We screened the 20 primary studies that are
presented in table 2 of the review with data on unselected patientsmeaning that all patients with CDI
admitted to the hospital within a certain time period were the denominator. . Eleven of them were
excluded, 2 of them because they were restricted to patients with inflammatory bowel disease ((53);
(54)) following the recommendation from the first expert meeting. Eight studies were excluded
because their study period ended before the year 2000 ((55); (56); (57); (58); (59); (60); (61); (62))
and one study because of insufficient information (colectomy rate only reported as background
information in an outbreak report (63). The characteristics of the remaining 9 studies with 30,829
patients predominantly from the USA are presented in table 25..
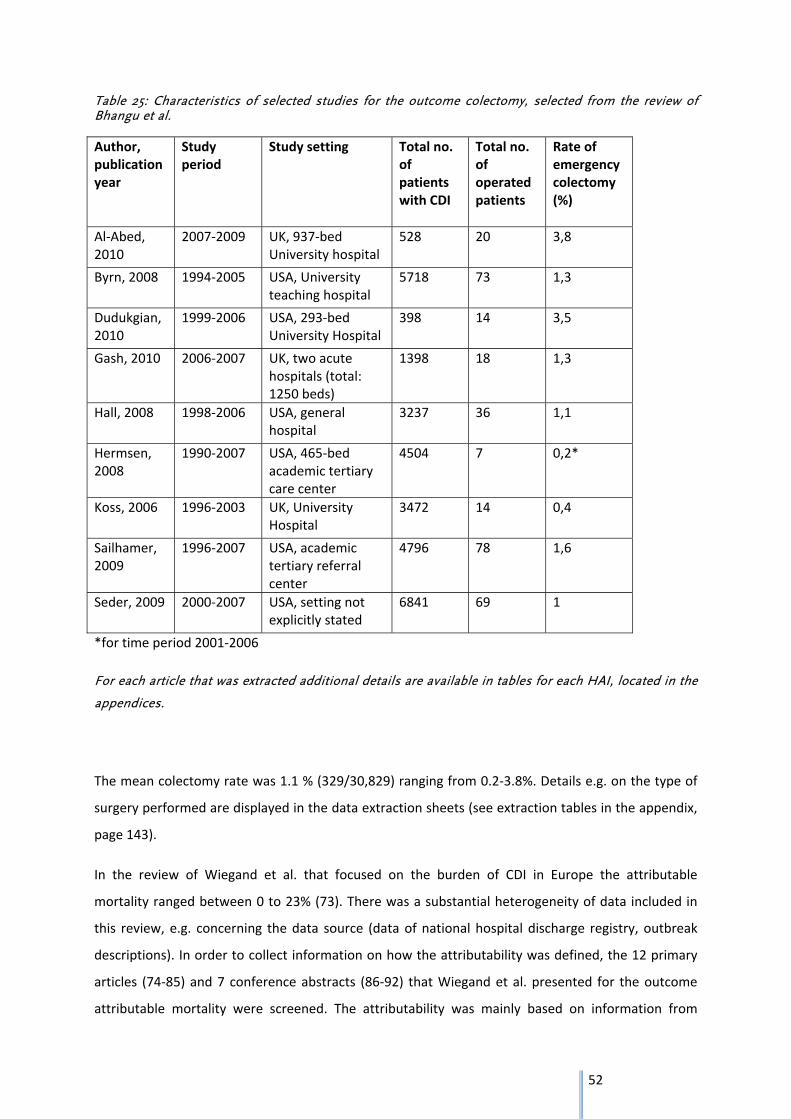
52
Table 25: Characteristics of selected studies for the outcome colectomy, selected from the review of Bhangu et al.
Author, publication year
Study period
Study setting
Total no. of patients with CDI
Total no. of operated patients
Rate of emergency colectomy (%)
Al‐Abed, 2010
2007‐2009 UK, 937‐bed University hospital
528 20 3,8
Byrn, 2008 1994‐2005 USA, University teaching hospital
5718 73 1,3
Dudukgian, 2010
1999‐2006 USA, 293‐bed University Hospital
398 14 3,5
Gash, 2010 2006‐2007 UK, two acute hospitals (total: 1250 beds)
1398 18 1,3
Hall, 2008 1998‐2006 USA, general hospital
3237 36 1,1
Hermsen, 2008
1990‐2007 USA, 465‐bed academic tertiary care center
4504 7 0,2*
Koss, 2006 1996‐2003 UK, University Hospital
3472 14 0,4
Sailhamer, 2009
1996‐2007 USA, academic tertiary referral center
4796 78 1,6
Seder, 2009 2000‐2007 USA, setting not explicitly stated
6841 69 1
*for time period 2001‐2006
For each article that was extracted additional details are available in tables for each HAI, located in the
appendices.
The mean colectomy rate was 1.1 % (329/30,829) ranging from 0.2‐3.8%. Details e.g. on the type of
surgery performed are displayed in the data extraction sheets (see extraction tables in the appendix,
page 143).
In the review of Wiegand et al. that focused on the burden of CDI in Europe the attributable
mortality ranged between 0 to 23% (73). There was a substantial heterogeneity of data included in
this review, e.g. concerning the data source (data of national hospital discharge registry, outbreak
descriptions). In order to collect information on how the attributability was defined, the 12 primary
articles (74‐85) and 7 conference abstracts (86‐92) that Wiegand et al. presented for the outcome
attributable mortality were screened. The attributability was mainly based on information from
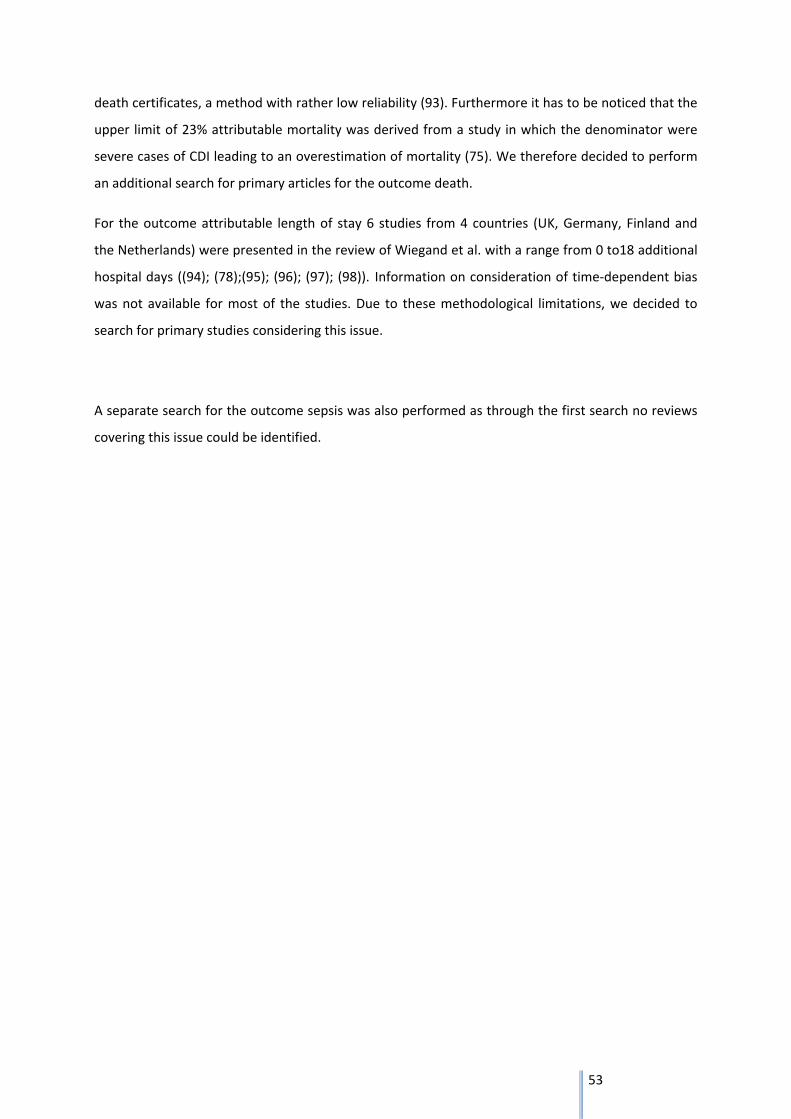
53
death certificates, a method with rather low reliability (93). Furthermore it has to be noticed that the
upper limit of 23% attributable mortality was derived from a study in which the denominator were
severe cases of CDI leading to an overestimation of mortality (75). We therefore decided to perform
an additional search for primary articles for the outcome death.
For the outcome attributable length of stay 6 studies from 4 countries (UK, Germany, Finland and
the Netherlands) were presented in the review of Wiegand et al. with a range from 0 to18 additional
hospital days ((94); (78);(95); (96); (97); (98)). Information on consideration of time‐dependent bias
was not available for most of the studies. Due to these methodological limitations, we decided to
search for primary studies considering this issue.
A separate search for the outcome sepsis was also performed as through the first search no reviews
covering this issue could be identified.
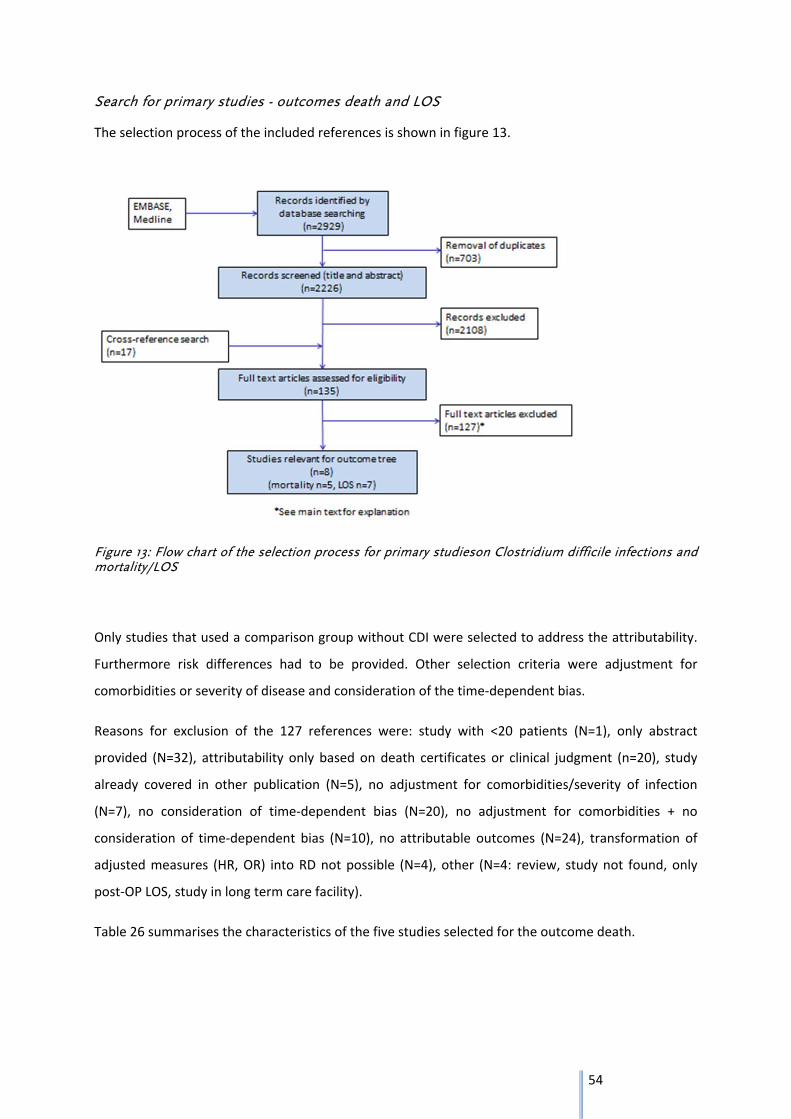
54
Search for primary studies - outcomes death and LOS
The selection process of the included references is shown in figure 13.
Figure 13: Flow chart of the selection process for primary studieson Clostridium difficile infections and mortality/LOS
Only studies that used a comparison group without CDI were selected to address the attributability.
Furthermore risk differences had to be provided. Other selection criteria were adjustment for
comorbidities or severity of disease and consideration of the time‐dependent bias.
Reasons for exclusion of the 127 references were: study with <20 patients (N=1), only abstract
provided (N=32), attributability only based on death certificates or clinical judgment (n=20), study
already covered in other publication (N=5), no adjustment for comorbidities/severity of infection
(N=7), no consideration of time‐dependent bias (N=20), no adjustment for comorbidities + no
consideration of time‐dependent bias (N=10), no attributable outcomes (N=24), transformation of
adjusted measures (HR, OR) into RD not possible (N=4), other (N=4: review, study not found, only
post‐OP LOS, study in long term care facility).
Table 26 summarises the characteristics of the five studies selected for the outcome death.
55
Table 26: Short extraction table on selected primary studies on outcome death
Author, publication year
study period
Study setting
Study design
NoCDI cases
/controls*(analysed)
Adjustment type of mortality, attributable mortality
Risk of bias
Dodek, 2013
2006‐2011
6 medical‐surgical ICUs (tertiary care + community hospitals), Canada
retrospective cohort study, unmatched and matched design/analysis
complete cohort: 15314 pts, matched CDI cases/controls: 227/658
for complete cohort analysis: adjustment for hospital site, age, APACHE II score, year of ICU admission, matching criteria: hospital site, age, APACHE II score, presence of any infection as an ICU admitting or acquired diagnosis,
in‐hospital mortality, complete cohort analysis: HR of dying in hospital 1.19 (95%CI 0.93‐1.52), in matched cohort analysis: risk difference 2%, Cox proportional hazard regression: HR 1.08 (95%CI 0.82‐1.43)
unclear
Oake, 2010
2002‐2009
tertiary care teaching facility, Canada
retrospective cohort study
1393/ 135,484
stratified analysis for baseline mortality risk: model includes age, sex, comorbidities, acuity of admission, admitting hospital service and severity of acute disease
#
in‐hospital mortality, pooled absolute risk difference over deciles of baseline risk: 11% (95% CI: 9‐13%), Cox proportional hazard regression: HR 2.98 (95% CI 2.42‐3.65)
high
Pépin, 2005
2003‐2004
tertiary care hospital, Canada
retrospective case‐control/case‐cohort study, matched design
161/656 matching criteria: sex, age, Charlson Comorbidity Index score, control remained in hospital at least as long as corresponding case
1‐year mortality, risk difference 16.7% (95% CI 8.6%‐25.2%)
high
Song, 2008
2000‐2005
tertiary care hospital, U.S.
retrospective case‐control/case‐cohort study, matched design
630 matched pairs, 540 pairs matched for APR‐DRG‐severity level
matching criteria: exposure time, age, ward, discharge calender month, at least 2 of 3 variables measuring comorbidity and severity of underlying illness (APR‐DRG, modified Charlson comorbidity index, propensity score)
in‐hospital mortality: risk difference ‐3% for both comparisons, for 540 pairs matched for APR‐DRG severity level: OR 0.62 (95%CI 0.36‐1.06)
high
Tabak, 2013
2007‐2008
6 hospitals (2 academic centers, 4 community facilities), U.S.
retrospective case‐control/case‐cohort study, matched desgin
255/765 propensity score matching (on demographics, prior healthcare exposure, markers of illness severity at admission, potential exposure LOS)
in‐hospital mortality, risk difference: 4.5% (95%CI: 0.2%‐8.7%, p<.05)
unclear
* resp. cohort pts
# in Cox proportional hazards regression (CDI and baseline mortality risk as predictors, covariates: number of admissions, number of emergency department visits, inpatient days in previous year and year of admission
For each article that was extracted additional details are available in tables for each HAI, located in
the appendices
56
All five selected studies were conducted in Canada or the USA. Two were cohort studies, three were
case‐control/case‐cohort studies. Four studies had a matched design. It should be noted that
although the CDI patients are often referred to as cases, CDI is the exposure in these studies. In‐
hospital mortality was provided in four studies, whereas one study reported a 30‐day, 90 day, 6
months and a 1‐year mortality (99).
The overall in‐hospital mortality for CDI cases ranged between 11.8 and 29% ((100);(101);(102)) (see
extraction tables in the appendix, page 143). Regarding attributable mortality the study of Dodek et
al. reported a risk difference of 2% for in‐hospital mortality in the matched cohort analysis (no
confidence interval provided). In the Cox proportional hazard regression analysis of the matched
cohort ICU‐acquired CDI was not associated with an increased in‐hospital mortality (HR 1.08, 95% CI
0.82‐1.43). The same was true for the analysis of the complete cohort (HR 1.19 (95%CI 0.93‐1.52)
(100).
Oake et al. calculated first the baseline mortality risk using a regression model (patients risk of dying
in‐hospital using data available at admission). The pooled absolute risk difference over deciles of this
baseline risk was 11% (95% CI 9‐13%). The Cox proportional hazard regression analysis showed that
hospital‐acquired CDI increased the hazard of dying in hospital almost 3‐fold (HR 2.98; 95% CI 2.42‐
3.65) (103). Pépin et al. conducted a study during the epidemic caused by the hypervirulent C.
difficile toxinotype III PCR ribotype 027 strain and reported a high attributable mortality of 16.7%
(95% CI 8.6‐25.2%). Within this period the hypervirulent strain represented two thirds of all isolates
of hospital‐acquired CDI (99). The attributable mortality estimated by Song et al. was ‐3%. But it
should be taken into account that 111 infected patients could not be matched due to a very long LOS
before onset of CDI and high APR‐DRG complexity scores(101) (APR‐DRG: all‐patient refined
diagnosis related group. Score determined on basis of complexity levels of secondary diagnosis in
combination with the principle diagnosis and the patients age). Tabak et al. showed in their study a
risk difference of 4.5% (95%CI 0.2‐8.7, p<.05) (102). In summary three of five studies provided a
significantly increasing mortality due to CDI ((103); (99); (102)). The mortality estimate ranged
between ‐3 and 11% for all studies.
According to the Newcastle‐Ottawa Scale, three studies had high risk of bias, while the remaining
two showed an unclear risk of bias.
For the outcome LOS in hospital seven studies were selected (table 27).
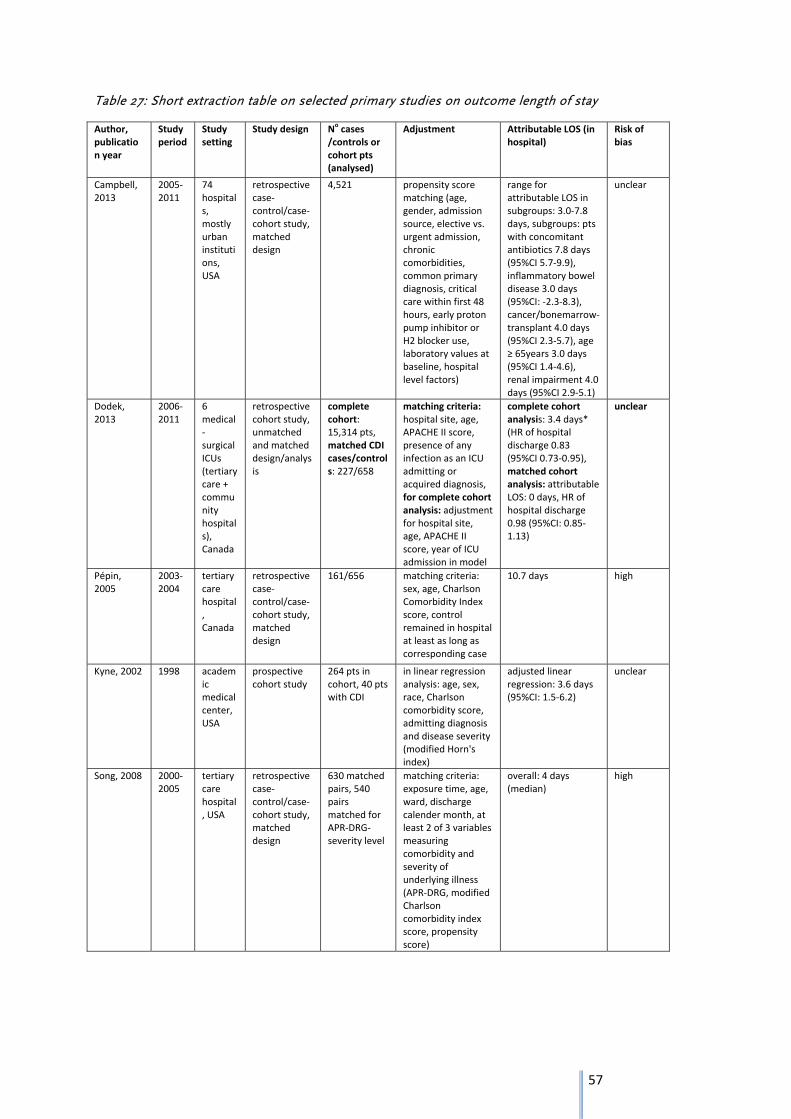
57
Table 27: Short extraction table on selected primary studies on outcome length of stay
Author, publication year
Study period
Study setting
Study design Nocases
/controls or cohort pts (analysed)
Adjustment Attributable LOS (in hospital)
Risk of bias
Campbell, 2013
2005‐2011
74 hospitals, mostly urban institutions, USA
retrospective case‐control/case‐cohort study, matched design
4,521 propensity score matching (age, gender, admission source, elective vs. urgent admission, chronic comorbidities, common primary diagnosis, critical care within first 48 hours, early proton pump inhibitor or H2 blocker use, laboratory values at baseline, hospital level factors)
range for attributable LOS in subgroups: 3.0‐7.8 days, subgroups: pts with concomitant antibiotics 7.8 days (95%CI 5.7‐9.9), inflammatory bowel disease 3.0 days (95%CI: ‐2.3‐8.3), cancer/bonemarrow‐transplant 4.0 days (95%CI 2.3‐5.7), age ≥ 65years 3.0 days (95%CI 1.4‐4.6), renal impairment 4.0 days (95%CI 2.9‐5.1)
unclear
Dodek, 2013
2006‐2011
6 medical‐surgical ICUs (tertiary care + community hospitals), Canada
retrospective cohort study, unmatched and matched design/analysis
complete cohort: 15,314 pts, matched CDI cases/controls: 227/658
matching criteria:hospital site, age, APACHE II score, presence of any infection as an ICU admitting or acquired diagnosis, for complete cohort analysis: adjustment for hospital site, age, APACHE II score, year of ICU admission in model
complete cohort analysis: 3.4 days* (HR of hospital discharge 0.83 (95%CI 0.73‐0.95), matched cohort analysis: attributable LOS: 0 days, HR of hospital discharge 0.98 (95%CI: 0.85‐1.13)
unclear
Pépin, 2005
2003‐2004
tertiary care hospital, Canada
retrospective case‐control/case‐cohort study, matched design
161/656 matching criteria: sex, age, Charlson Comorbidity Index score, control remained in hospital at least as long as corresponding case
10.7 days high
Kyne, 2002 1998 academic medical center, USA
prospective cohort study
264 pts in cohort, 40 pts with CDI
in linear regression analysis: age, sex, race, Charlson comorbidity score, admitting diagnosis and disease severity (modified Horn's index)
adjusted linear regression: 3.6 days (95%CI: 1.5‐6.2)
unclear
Song, 2008 2000‐2005
tertiary care hospital, USA
retrospective case‐control/case‐cohort study, matched design
630 matched pairs, 540 pairs matched for APR‐DRG‐severity level
matching criteria: exposure time, age, ward, discharge calender month, at least 2 of 3 variables measuring comorbidity and severity of underlying illness (APR‐DRG, modified Charlson comorbidity index score, propensity score)
overall: 4 days (median)
high
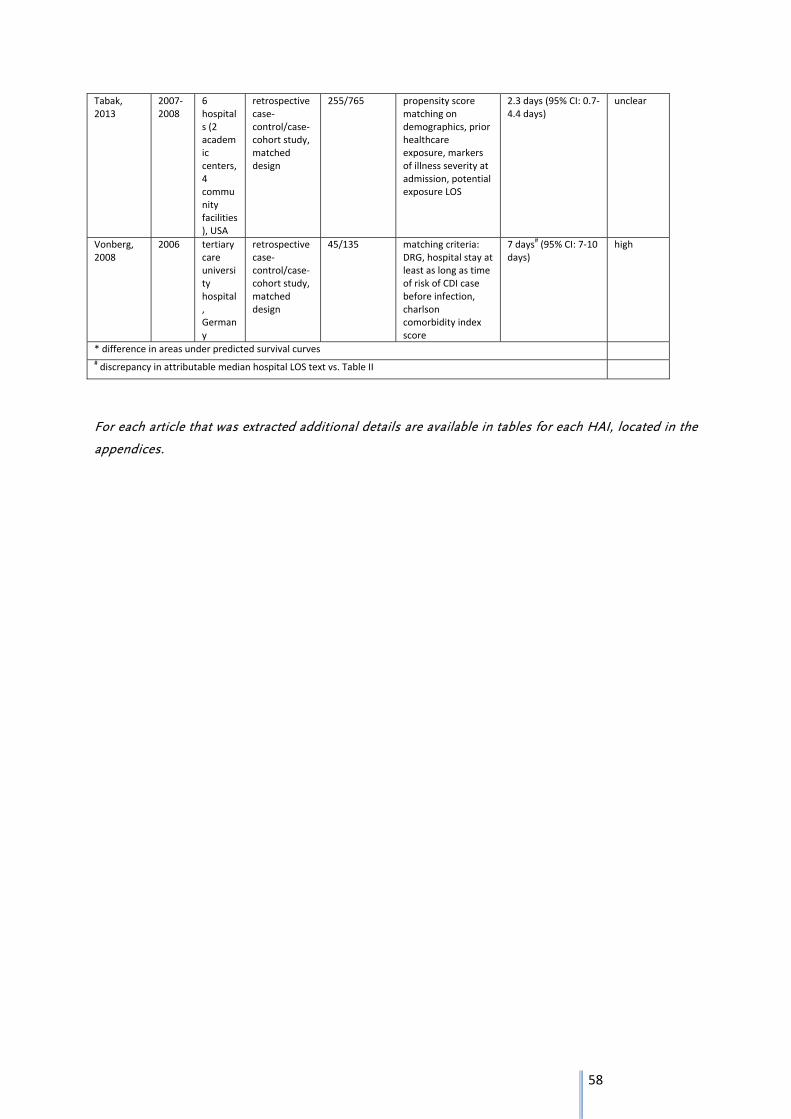
58
Tabak, 2013
2007‐2008
6 hospitals (2 academic centers, 4 community facilities), USA
retrospective case‐control/case‐cohort study, matched design
255/765 propensity score matching on demographics, prior healthcare exposure, markers of illness severity at admission, potential exposure LOS
2.3 days (95% CI: 0.7‐4.4 days)
unclear
Vonberg, 2008
2006 tertiary care university hospital, Germany
retrospective case‐control/case‐cohort study, matched design
45/135 matching criteria: DRG, hospital stay at least as long as time of risk of CDI case before infection, charlson comorbidity index score
7 days#(95% CI: 7‐10
days) high
* difference in areas under predicted survival curves # discrepancy in attributable median hospital LOS text vs. Table II
For each article that was extracted additional details are available in tables for each HAI, located in the
appendices.
59
Of the seven selected studies six were conducted in Canada or the USA and one in Germany. It
should be noted that attributable LOS was derived by different methods.
The overall LOS in hospital for CDI patients ranged between 12 and 38 days.
Campbell et al. provided data on attributable LOS only for a subgroup of patients with concomitant
antibiotics, inflammatory bowel disease, cancer/bone marrow transplant, age ≥65 years and renal
impairment. Attributable LOS in these subgroups ranged between 3.0 to 7.8 days (104). Dodek et al.,
showed in the analysis of the complete cohort an attributable LOS of 3.4 days, while hazard of
hospital discharge in patients with CDI was decreased (HR 0.83, 95% CI: 0.73‐0.95). However in the
matched cohort analysis there was no attributable hospital LOS (0 days) and the HR of hospital
discharge of 0.98 (95%CI: 0.85‐1.13) pointed in the same direction (100). Similar to the results for the
attributable mortality the study of Pépin et al. showed a high estimate for the attributable length of
hospital stay with 10.7 days (99) in this special setting (see above). In the prospective cohort study of
Kyne et al. with a relatively small number of CDI patients an attributable LOS of 3.6 days (95%CI: 1.5‐
6.2) was provided in the linear regression. It should be noted that the time‐dependent bias was not
directly considered by design or analysis, but "time at risk" in patients with and without CDI was
similar (6 versus 5 days) (105). In the study of Song et al. CDI patients stayed 4 days longer in hospital
than patients without CDI. Again the high number of infected patients that could not be matched
should be considered (101). Tabak et al. reported a significant increase in LOS in CDI patients of 2.3
days (95%CI 0.9‐3.8)(102). The only European study conducted by Vonberg et al. presented an
attributable LOS of 7 days (95%CI 7‐10). Of the 116 CDI patients only 45 were included in the
matched analysis, no matching on sex or age was performed (98).
According to the Newcastle‐Ottawa Scale, three studies had high risk of bias, while the remaining
four studies showed an unclear risk of bias.
In summary three of seven studies showed a significant increase in LOS in hospital among CDI
patients. The estimate ranged between 0 and 8 days for all studies.
As for the outcome death it should be noted that not all studies provided confidence intervals for
their estimates.
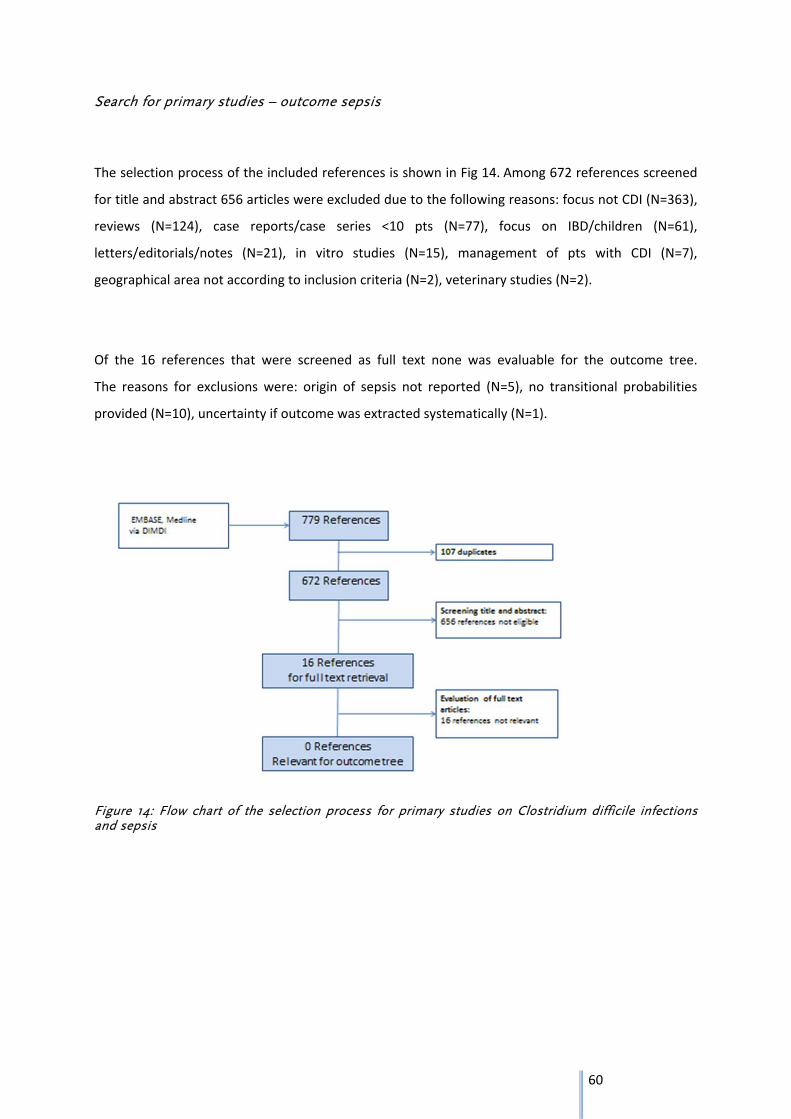
60
Search for primary studies – outcome sepsis
The selection process of the included references is shown in Fig 14. Among 672 references screened
for title and abstract 656 articles were excluded due to the following reasons: focus not CDI (N=363),
reviews (N=124), case reports/case series <10 pts (N=77), focus on IBD/children (N=61),
letters/editorials/notes (N=21), in vitro studies (N=15), management of pts with CDI (N=7),
geographical area not according to inclusion criteria (N=2), veterinary studies (N=2).
Of the 16 references that were screened as full text none was evaluable for the outcome tree.
The reasons for exclusions were: origin of sepsis not reported (N=5), no transitional probabilities
provided (N=10), uncertainty if outcome was extracted systematically (N=1).
Figure 14: Flow chart of the selection process for primary studies on Clostridium difficile infections and sepsis
61
Search for data on severity of CDI
Four sources that provided data on severe CDI were selected (table 28). In three of them data came
from national surveillance programmes ((106) (107, 108)) whereas one was a large European
hospital‐based survey (76)). All data sets used at least the following three criteria: ICU admission for
treatment of CDI/its complications, surgery required for toxic megacolon, large bowel perforation or
refractory colitis and death within 30 days after diagnosis and CDI being the primary or a contributive
cause. In the German and Finnish surveillance for CDI a fourth criterion, admission due to recurrent
CDI, was added. The proportion of severe cases in the four data sets ranged between 1.5‐15%.
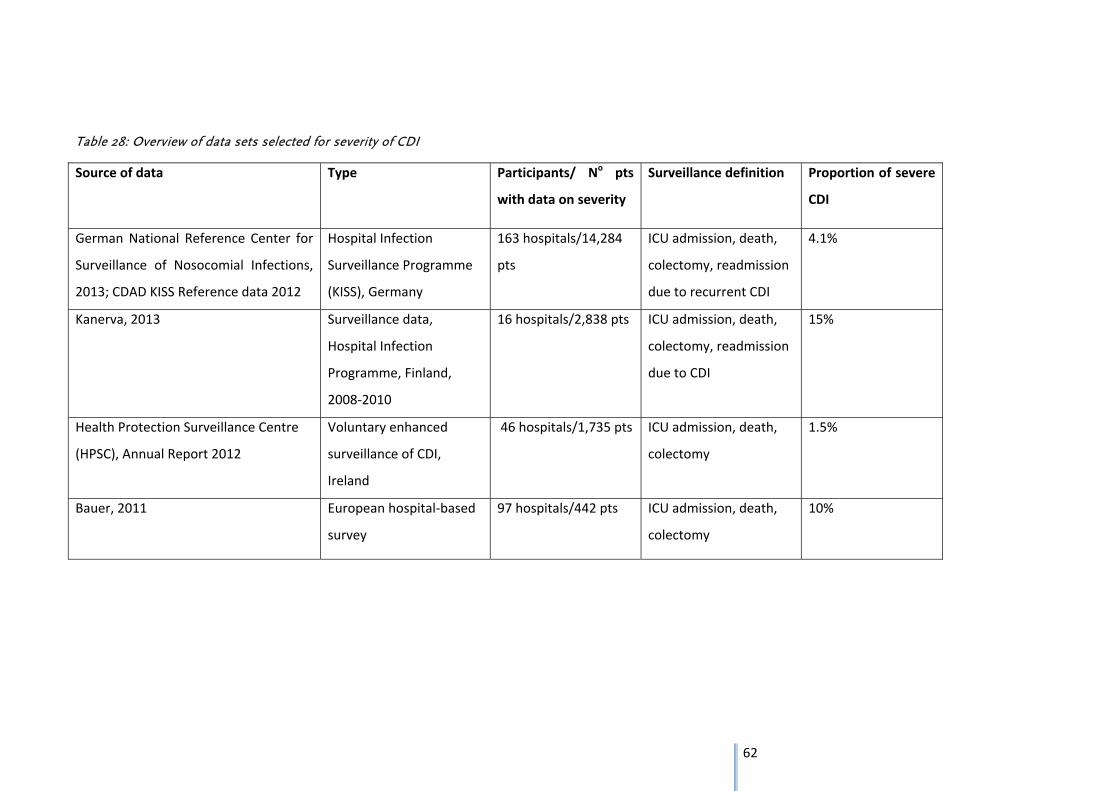
62
Table 28: Overview of data sets selected for severity of CDI
Source of data Type Participants/ No pts
with data on severity
Surveillance definition Proportion of severe
CDI
German National Reference Center for
Surveillance of Nosocomial Infections,
2013; CDAD KISS Reference data 2012
Hospital Infection
Surveillance Programme
(KISS), Germany
163 hospitals/14,284
pts
ICU admission, death,
colectomy, readmission
due to recurrent CDI
4.1%
Kanerva, 2013 Surveillance data,
Hospital Infection
Programme, Finland,
2008‐2010
16 hospitals/2,838 pts ICU admission, death,
colectomy, readmission
due to CDI
15%
Health Protection Surveillance Centre
(HPSC), Annual Report 2012
Voluntary enhanced
surveillance of CDI,
Ireland
46 hospitals/1,735 pts ICU admission, death,
colectomy
1.5%
Bauer, 2011 European hospital‐based
survey
97 hospitals/442 pts ICU admission, death,
colectomy
10%
63
Outcome tree
The outcome tree was constructed starting from the acute CDI that can be divided into two different
health states: Mild and moderate versus severe, the latter constituting 1.5‐15% of CDI. The duration of
the acute disease is described by the attributable LOS in hospital, a surrogate marker for short term
complications like e.g. toxic megacolon. The attributable LOS ranges between 0 and 8 days. The
transitional probability for the health outcome death is expressed by the overall attributable mortality
(including death after colectomy) of 0 to 11 % (lower boundary of ‐3% was set to null).
A quantitative analysis of the transitional probabilities for the outcomes death and LOS by pooling the
data was not possible for the following reasons: first the methods of adjustment by design or analysis
differed between the studies (matching, propensity score matching, multivariate analysis). Second, the
factors for which were adjusted were not comparable between the studies. And third, not for all studies
variance estimates were provided.
The study of Pépin et al, conducted within an epidemic due to PCR ribotype 027 provided the highest
estimates for LOS and attributable mortality. As this study setting is not representative we decided not to
include this study after consultation with the experts.
The transitional probabilities for the health outcome colectomy or better post‐colectomy state ranged
between 0.2 and 3.8%. The duration of the health outcome is lifelong.
Calculation of a point estimate by pooling of incidences didn’t seem appropriate without knowing the
baseline risks for colectomy within the studies. In the majority of articles the characteristics of the study
population only refer to patients with colectomy as the selected studies are focused on outcomes after
colectomy.
As the systematic search for sepsis did not reveal any eligible studies this outcome had to be omitted (see
discussion 3.4.3).
From the clinical point of view recurrence is one of the major problems in C. difficile infections.
Nevertheless inclusion of recurrence e.g. by introducing one or more loops in the outcome tree might
lead to double counting of cases. Depending on how the prevalence data that are fitted into the tree are
dealing with this issue it might lead to an overestimation of the burden of disease. In the expert meeting
we therefore agreed on not including this outcome but providing the data separately.
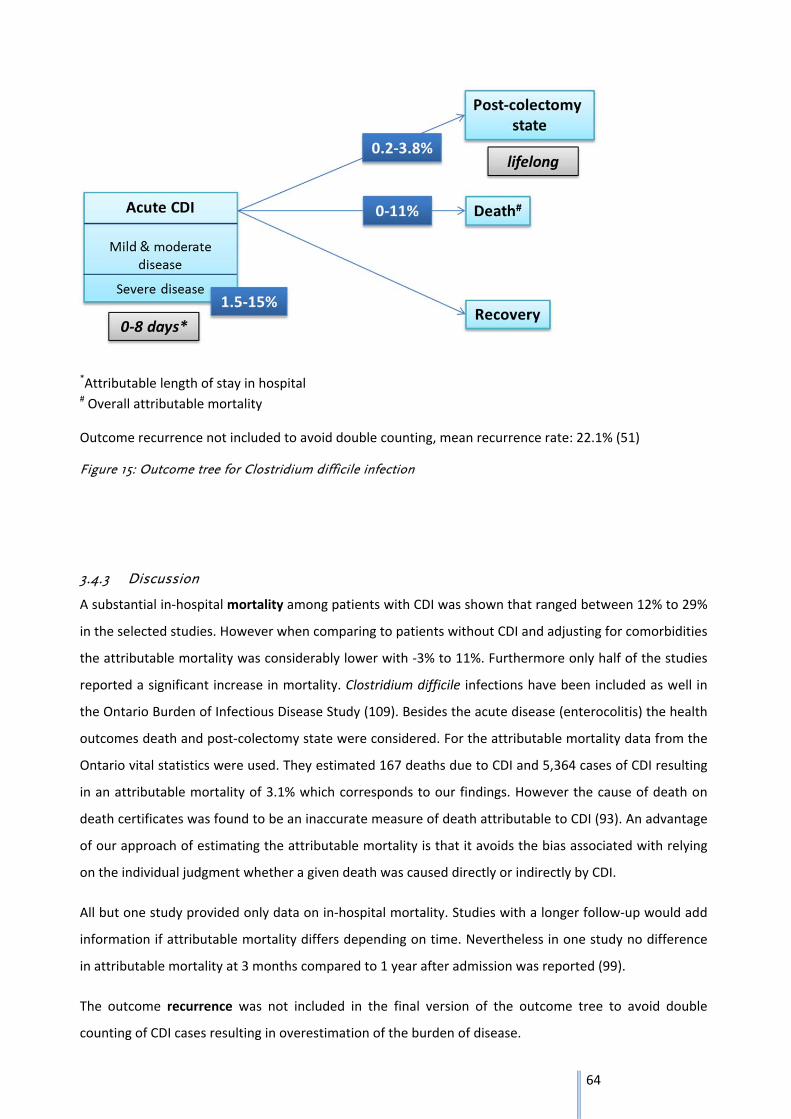
64
*Attributable length of stay in hospital # Overall attributable mortality
Outcome recurrence not included to avoid double counting, mean recurrence rate: 22.1% (51)
Figure 15: Outcome tree for Clostridium difficile infection
3.4.3 Discussion
A substantial in‐hospital mortality among patients with CDI was shown that ranged between 12% to 29%
in the selected studies. However when comparing to patients without CDI and adjusting for comorbidities
the attributable mortality was considerably lower with ‐3% to 11%. Furthermore only half of the studies
reported a significant increase in mortality. Clostridium difficile infections have been included as well in
the Ontario Burden of Infectious Disease Study (109). Besides the acute disease (enterocolitis) the health
outcomes death and post‐colectomy state were considered. For the attributable mortality data from the
Ontario vital statistics were used. They estimated 167 deaths due to CDI and 5,364 cases of CDI resulting
in an attributable mortality of 3.1% which corresponds to our findings. However the cause of death on
death certificates was found to be an inaccurate measure of death attributable to CDI (93). An advantage
of our approach of estimating the attributable mortality is that it avoids the bias associated with relying
on the individual judgment whether a given death was caused directly or indirectly by CDI.
All but one study provided only data on in‐hospital mortality. Studies with a longer follow‐up would add
information if attributable mortality differs depending on time. Nevertheless in one study no difference
in attributable mortality at 3 months compared to 1 year after admission was reported (99).
The outcome recurrence was not included in the final version of the outcome tree to avoid double
counting of CDI cases resulting in overestimation of the burden of disease.
65
Nevertheless it should be noted that the selected systematic review of Vardakas et al. focused on
recurrence rates following vancomycin or metronidazole treatment (51). Fidaxomicin, a novel
macrocyclic antibiotic approved for treatment of CDI, was associated with a significant reduction in
recurrence rate compared to vancomycin in CDI, except for infections due to PCR ribotype 027 strains
(110). Recently the treatment guidance document of the European Society of Clinical Microbiology and
Infectious Diseases (ESCMID) was updated (111). The Strength of Recommendation for treating a first
recurrence or multiple recurrences of CDI with oral vancomycin or oral fidaxomicin were considered
equal. Therefore the increased use of fidaxomicin might influence the burden of disease in the future.
We estimated that colectomy is performed in 0.2‐3.8 % of patients with CDI. This is in line with the 1%
colectomy rate that is used in the Ontario Burden of Infectious Disease Study and was derived from the
Canadian Nosocomial Infection Surveillance Program (112). Total colectomy with end ileostomy is the
current standard procedure. However there is a new surgical approach, the diverting loop ileostomy with
colonic lavage (113) that should be combined with antibiotic treatment (intracolonic antegrade
vancomycin and intravenous metronidazole) (111). As this method avoids colectomy an increasing use of
this technique in the future would influence the burden of disease estimates.
We aimed at estimating the transitional probability for sepsis due to CDI as we planned to include the
long‐term sequelae of sepsis by referring to the outcome tree for primary bloodstream infections.
But the results of the literature search underlined the difficulties in assigning this outcome to CDI.
In the study of Zahiruddin et al. patients with CDI and sepsis had 43.2% positive blood cultures, most
frequently with Staphylocccus aureus (22.1%), coagulase‐negative Staphylococcus (21.1%), Klebsiella
pneumoniae (11.6%) and Enterococcus faecalis (11.6%). In these patients 17.7% positive urine cultures
were identified with Klebsiella pneumoniae, Enterococcus faecalis and Escherichia coli being seen most
frequently (114). This shows that in the usually multimorbid patients with CDI sepsis is likely to be caused
by other coinfections. Furthermore the attributability is complicated by the fact that one might find a
variety of bacteria from the bowel flora due to disruption of the gastrointestinal barrier function.
Clostridium difficile itself is only rarely encountered in blood culture (115). As the problem of
attributability of this outcome to CDI could not been solved, sepsis and the long‐term sequelae of sepsis
were not included in the final version of the outcome tree.
The irritable bowel syndrome (IBS) was not addressed in the systematic reviews we screened for
outcomes of CDI. Nevertheless postinfectious IBS was included in the BCoDE‐project for the outcome
tree for other gastrointestinal disease like salmonellosis. Concerning Clostridium difficile infections Sethi
et al. showed in a small cohort study with 41 cases and 41 matched comparators that 5 CDI patients
(12.2%) reported new onset IBS compared to 0 patients without CDI when contacted 6 months after
diagnosis of CDI (116). Due to time constraints we will perform a systematic search for this outcome after
completion of the research report.
66
The studies we selected did not provide stratified analysis according to PCR ribotype. As the epidemic
due to PCR ribotype 027 has been associated with an increased morbidity and mortality (117) we decided
to exclude the study of Pépin et al. that was conducted in 2003 in Canada (99).
In the endemic setting the association of certain strain types with outcome measures like mortality has
been discussed controversely. In the large study of Walker et al. an increased 14‐day mortality (adjusted
P < .0001) of 25% for ST clade 5 (ribotype 078), 20% for ST clade 2 (ribotype 027), and 12% for ST clade 1
(multiple ribotypes) was reported (118). In contrast Walk et al. showed that the association of severe CDI
(ICU admission, interventional surgery, or 30‐day mortality) with PCR ribotypes 027 and 078 was not
significant after adjustment for covariates (119).
Infections due to PCR ribotype 027 are now less frequent in many European countries, except for
Germany, Hungary, Poland and Romania (120). In conclusion, the burden of disease might be influenced
by the distribution of ribotypes which is dynamic. Studies on attributable outcomes stratified for
ribotypes could clarify this situation.
In addition to the limitations specified in the general discussion (see page 81) the following points have
to be considered:
In most of the selected studies for the outcomes death and LOS patients with CDI were matched to
patients without CDI to account for potential confounding factors. This approach leads to two problems.
First, the risk of selection bias by exclusion of sicker CDI patients without appropriate controls and
second the risk of overadjustment both leading to underestimation of effects.
67
Furthermore different definitions of CDI were used. In some articles the study population consisted of
healthcare–associated and community‐associated cases or the origin of CDI was not stated at all.
Community‐associated CDI have been generally associated with a less severe course of disease, although
severe courses do occur ((121); (122)). Including community‐associated cases could therefore result in an
underestimation of e.g. mortality for healthcare‐associated CDI.
Finally, almost all studies for the outcomes LOS and mortality were conducted in the USA or Canada
limiting the representativeness of results.
In conclusion, the body of evidence is still relatively sparse and further studies reporting on CDI‐
attributable outcomes of CDI are needed.
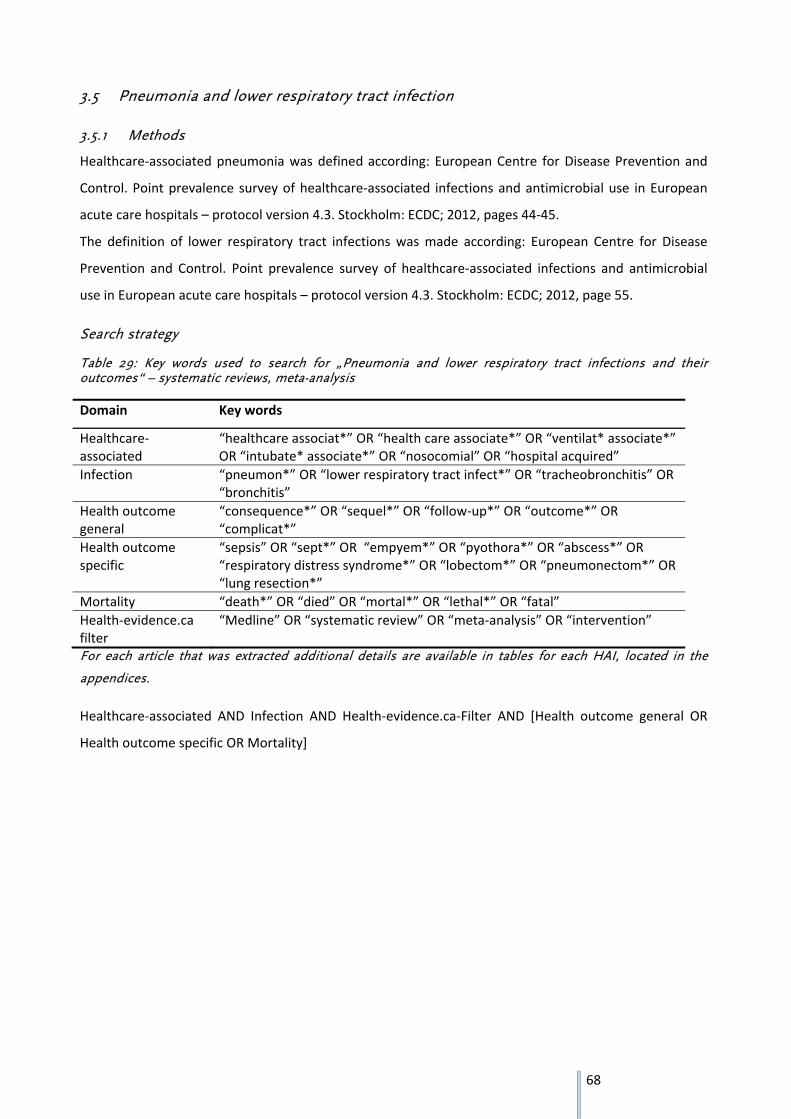
68
3.5 Pneumonia and lower respiratory tract infection
3.5.1 Methods
Healthcare‐associated pneumonia was defined according: European Centre for Disease Prevention and
Control. Point prevalence survey of healthcare‐associated infections and antimicrobial use in European
acute care hospitals – protocol version 4.3. Stockholm: ECDC; 2012, pages 44‐45.
The definition of lower respiratory tract infections was made according: European Centre for Disease
Prevention and Control. Point prevalence survey of healthcare‐associated infections and antimicrobial
use in European acute care hospitals – protocol version 4.3. Stockholm: ECDC; 2012, page 55.
Search strategy
Table 29: Key words used to search for „Pneumonia and lower respiratory tract infections and their outcomes“ – systematic reviews, meta-analysis
Domain Key words
Healthcare‐associated
“healthcare associat*” OR “health care associate*” OR “ventilat* associate*” OR “intubate* associate*” OR “nosocomial” OR “hospital acquired”
Infection “pneumon*” OR “lower respiratory tract infect*” OR “tracheobronchitis” OR “bronchitis”
Health outcome general
“consequence*” OR “sequel*” OR “follow‐up*” OR “outcome*” OR “complicat*”
Health outcome specific
“sepsis” OR “sept*” OR “empyem*” OR “pyothora*” OR “abscess*” OR “respiratory distress syndrome*” OR “lobectom*” OR “pneumonectom*” OR “lung resection*”
Mortality “death*” OR “died” OR “mortal*” OR “lethal*” OR “fatal”
Health‐evidence.ca filter
“Medline” OR “systematic review” OR “meta‐analysis” OR “intervention”
For each article that was extracted additional details are available in tables for each HAI, located in the
appendices.
Healthcare‐associated AND Infection AND Health‐evidence.ca‐Filter AND [Health outcome general OR
Health outcome specific OR Mortality]
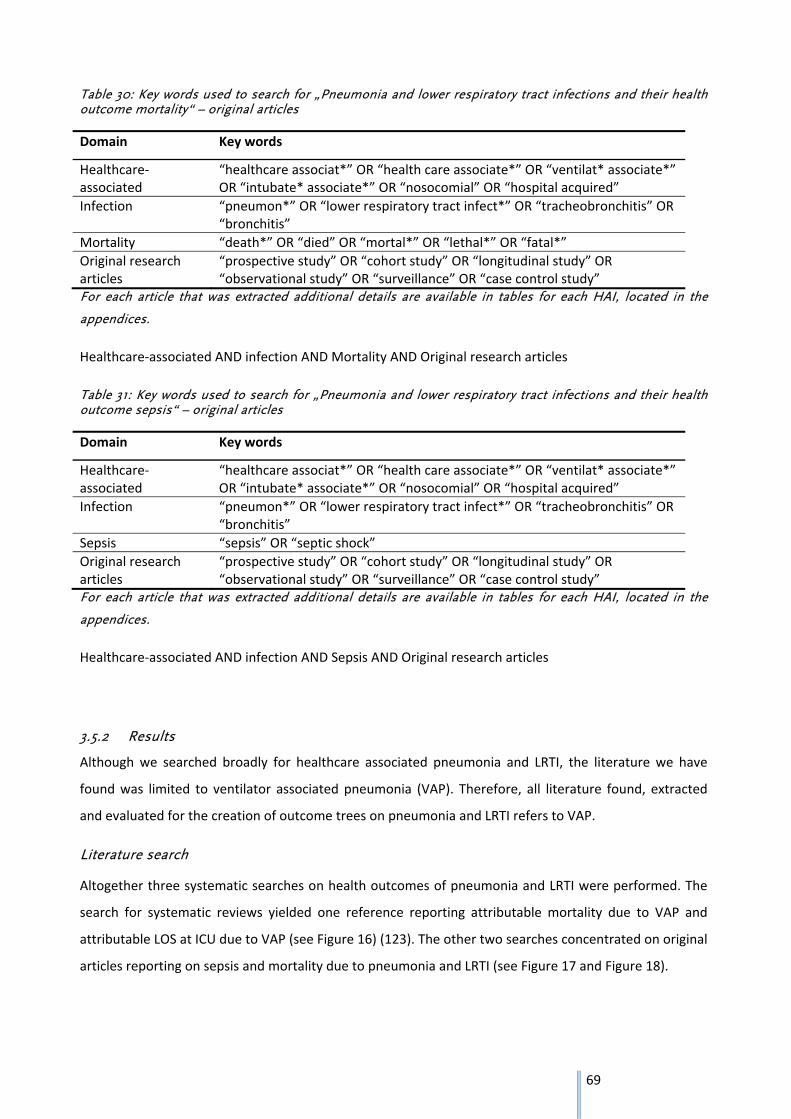
69
Table 30: Key words used to search for „Pneumonia and lower respiratory tract infections and their health outcome mortality“ – original articles
Domain Key words
Healthcare‐associated
“healthcare associat*” OR “health care associate*” OR “ventilat* associate*” OR “intubate* associate*” OR “nosocomial” OR “hospital acquired”
Infection “pneumon*” OR “lower respiratory tract infect*” OR “tracheobronchitis” OR “bronchitis”
Mortality “death*” OR “died” OR “mortal*” OR “lethal*” OR “fatal*”
Original research articles
“prospective study” OR “cohort study” OR “longitudinal study” OR “observational study” OR “surveillance” OR “case control study”
For each article that was extracted additional details are available in tables for each HAI, located in the
appendices.
Healthcare‐associated AND infection AND Mortality AND Original research articles
Table 31: Key words used to search for „Pneumonia and lower respiratory tract infections and their health outcome sepsis“ – original articles
Domain Key words
Healthcare‐associated
“healthcare associat*” OR “health care associate*” OR “ventilat* associate*” OR “intubate* associate*” OR “nosocomial” OR “hospital acquired”
Infection “pneumon*” OR “lower respiratory tract infect*” OR “tracheobronchitis” OR “bronchitis”
Sepsis “sepsis” OR “septic shock”
Original research articles
“prospective study” OR “cohort study” OR “longitudinal study” OR “observational study” OR “surveillance” OR “case control study”
For each article that was extracted additional details are available in tables for each HAI, located in the
appendices.
Healthcare‐associated AND infection AND Sepsis AND Original research articles
3.5.2 Results
Although we searched broadly for healthcare associated pneumonia and LRTI, the literature we have
found was limited to ventilator associated pneumonia (VAP). Therefore, all literature found, extracted
and evaluated for the creation of outcome trees on pneumonia and LRTI refers to VAP.
Literature search
Altogether three systematic searches on health outcomes of pneumonia and LRTI were performed. The
search for systematic reviews yielded one reference reporting attributable mortality due to VAP and
attributable LOS at ICU due to VAP (see Figure 16) (123). The other two searches concentrated on original
articles reporting on sepsis and mortality due to pneumonia and LRTI (see Figure 17 and Figure 18).
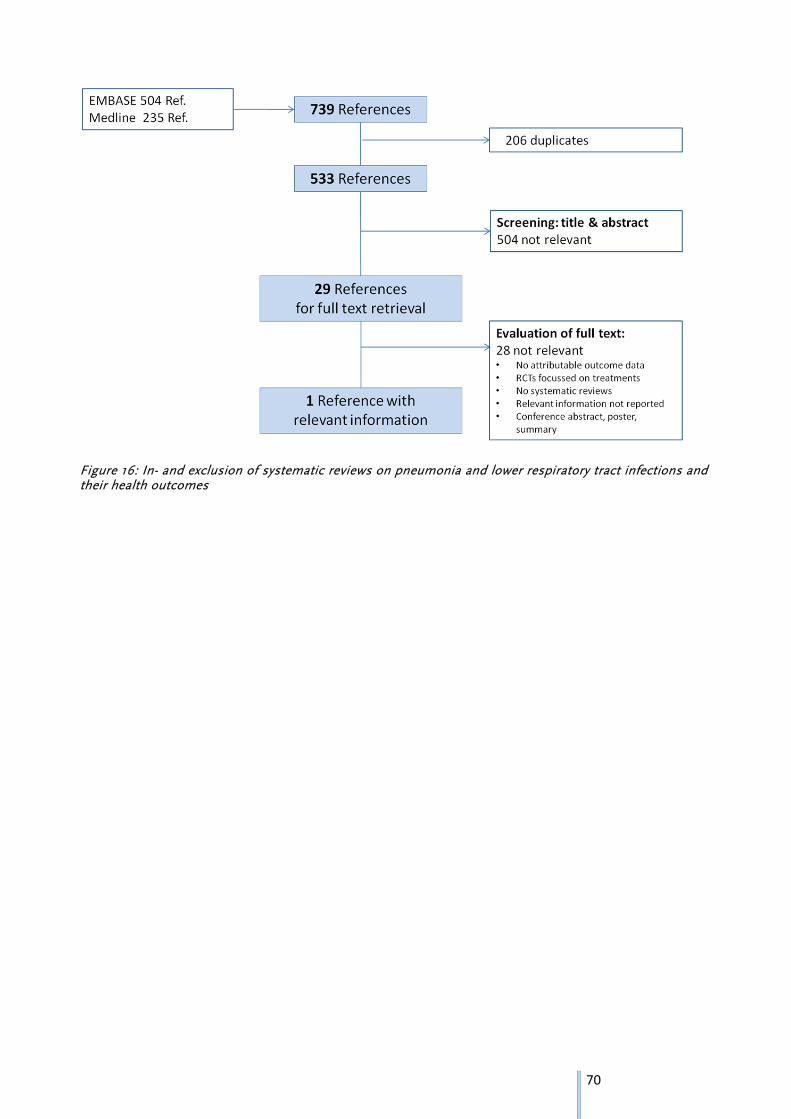
70
Figure 16: In- and exclusion of systematic reviews on pneumonia and lower respiratory tract infections and their health outcomes
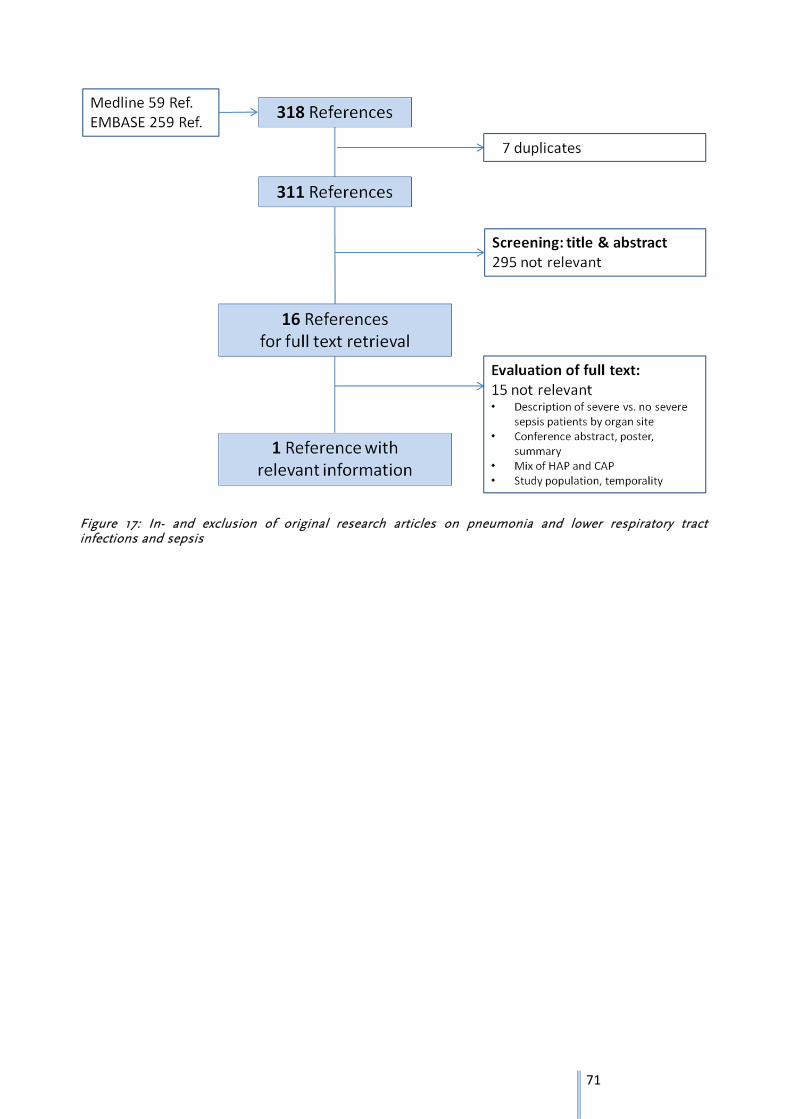
71
Figure 17: In- and exclusion of original research articles on pneumonia and lower respiratory tract infections and sepsis
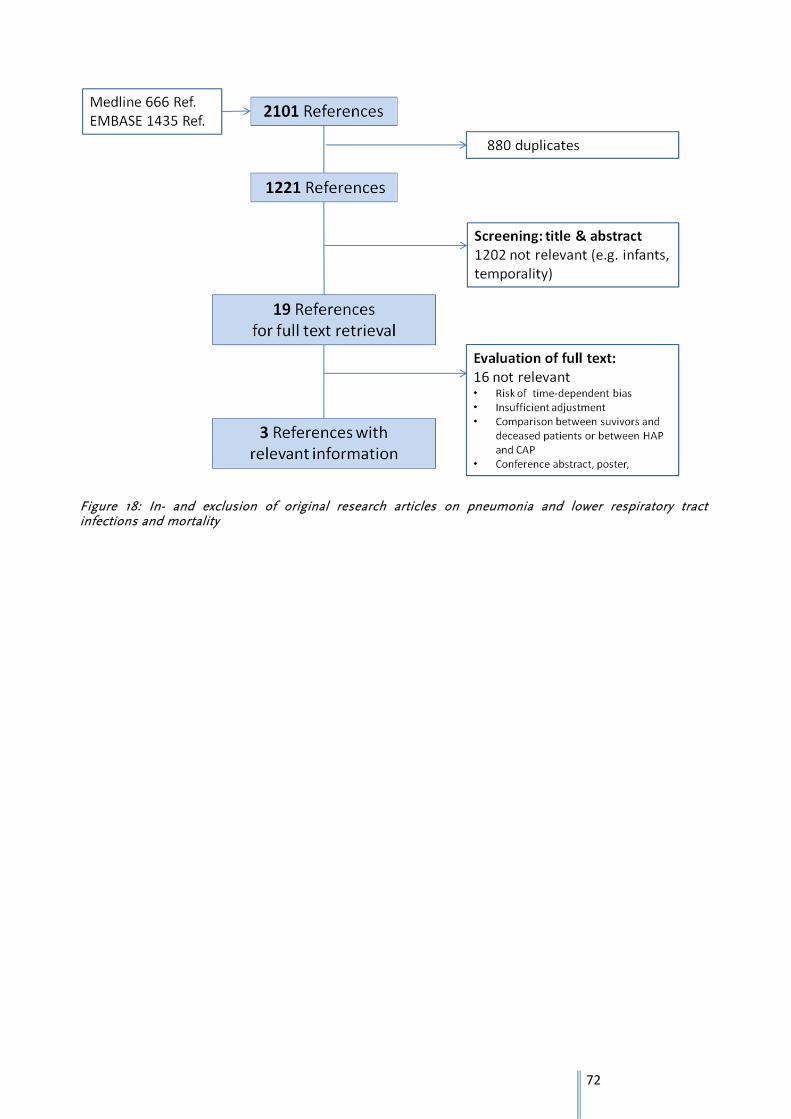
72
Figure 18: In- and exclusion of original research articles on pneumonia and lower respiratory tract infections and mortality
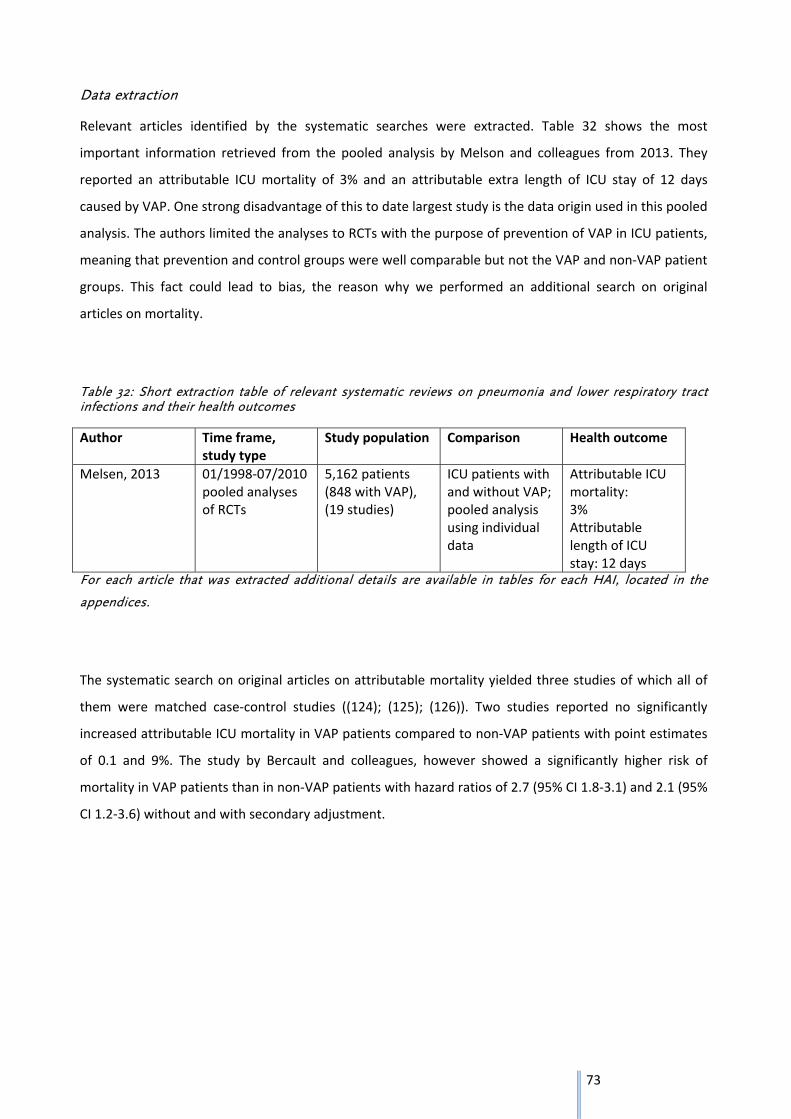
73
Data extraction
Relevant articles identified by the systematic searches were extracted. Table 32 shows the most
important information retrieved from the pooled analysis by Melson and colleagues from 2013. They
reported an attributable ICU mortality of 3% and an attributable extra length of ICU stay of 12 days
caused by VAP. One strong disadvantage of this to date largest study is the data origin used in this pooled
analysis. The authors limited the analyses to RCTs with the purpose of prevention of VAP in ICU patients,
meaning that prevention and control groups were well comparable but not the VAP and non‐VAP patient
groups. This fact could lead to bias, the reason why we performed an additional search on original
articles on mortality.
Table 32: Short extraction table of relevant systematic reviews on pneumonia and lower respiratory tract infections and their health outcomes
Author Time frame, study type
Study population Comparison Health outcome
Melsen, 2013 01/1998‐07/2010 pooled analyses of RCTs
5,162 patients (848 with VAP), (19 studies)
ICU patients with and without VAP; pooled analysis using individual data
Attributable ICU mortality: 3% Attributable length of ICU stay: 12 days
For each article that was extracted additional details are available in tables for each HAI, located in the
appendices.
The systematic search on original articles on attributable mortality yielded three studies of which all of
them were matched case‐control studies ((124); (125); (126)). Two studies reported no significantly
increased attributable ICU mortality in VAP patients compared to non‐VAP patients with point estimates
of 0.1 and 9%. The study by Bercault and colleagues, however showed a significantly higher risk of
mortality in VAP patients than in non‐VAP patients with hazard ratios of 2.7 (95% CI 1.8‐3.1) and 2.1 (95%
CI 1.2‐3.6) without and with secondary adjustment.
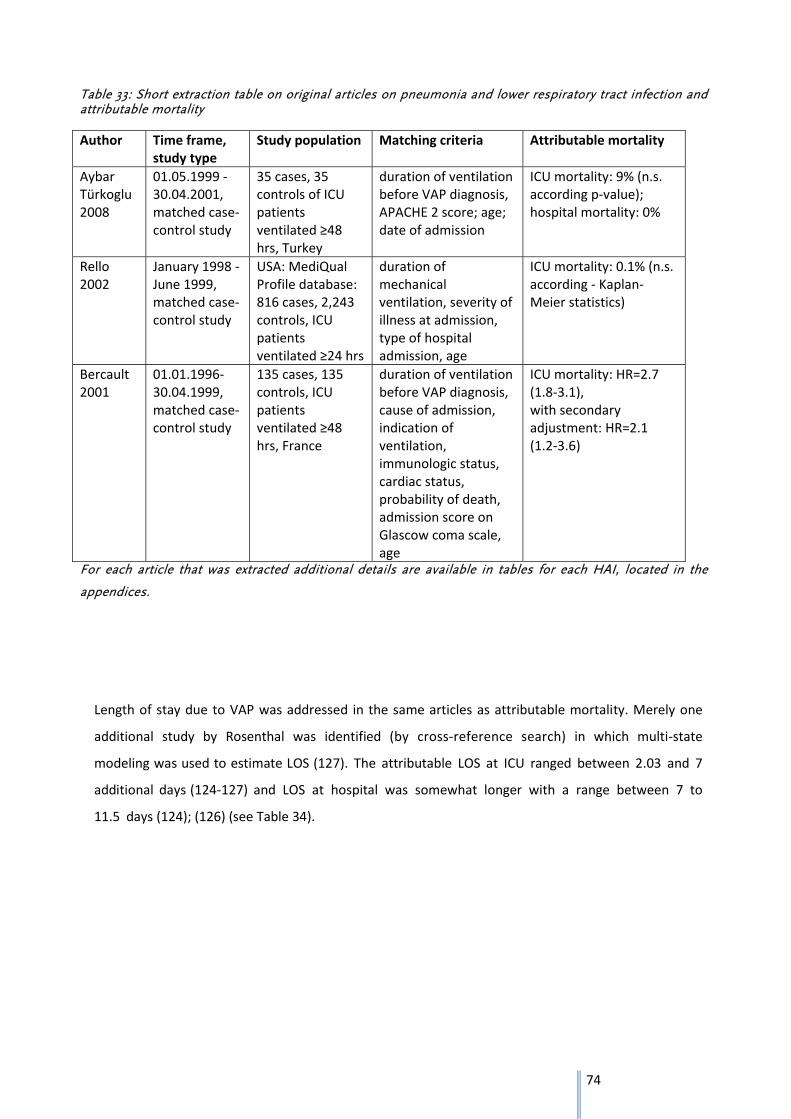
74
Table 33: Short extraction table on original articles on pneumonia and lower respiratory tract infection and attributable mortality
Author Time frame, study type
Study population Matching criteria Attributable mortality
Aybar Türkoglu 2008
01.05.1999 ‐ 30.04.2001, matched case‐control study
35 cases, 35 controls of ICU patients ventilated ≥48 hrs, Turkey
duration of ventilation before VAP diagnosis, APACHE 2 score; age; date of admission
ICU mortality: 9% (n.s. according p‐value); hospital mortality: 0%
Rello 2002
January 1998 ‐ June 1999, matched case‐control study
USA: MediQual Profile database: 816 cases, 2,243 controls, ICU patients ventilated ≥24 hrs
duration of mechanical ventilation, severity of illness at admission, type of hospital admission, age
ICU mortality: 0.1% (n.s. according ‐ Kaplan‐Meier statistics)
Bercault 2001
01.01.1996‐30.04.1999, matched case‐control study
135 cases, 135 controls, ICU patients ventilated ≥48 hrs, France
duration of ventilation before VAP diagnosis, cause of admission, indication of ventilation, immunologic status, cardiac status, probability of death, admission score on Glascow coma scale, age
ICU mortality: HR=2.7 (1.8‐3.1), with secondary adjustment: HR=2.1 (1.2‐3.6)
For each article that was extracted additional details are available in tables for each HAI, located in the
appendices.
Length of stay due to VAP was addressed in the same articles as attributable mortality. Merely one
additional study by Rosenthal was identified (by cross‐reference search) in which multi‐state
modeling was used to estimate LOS (127). The attributable LOS at ICU ranged between 2.03 and 7
additional days (124‐127) and LOS at hospital was somewhat longer with a range between 7 to
11.5 days (124); (126) (see Table 34).
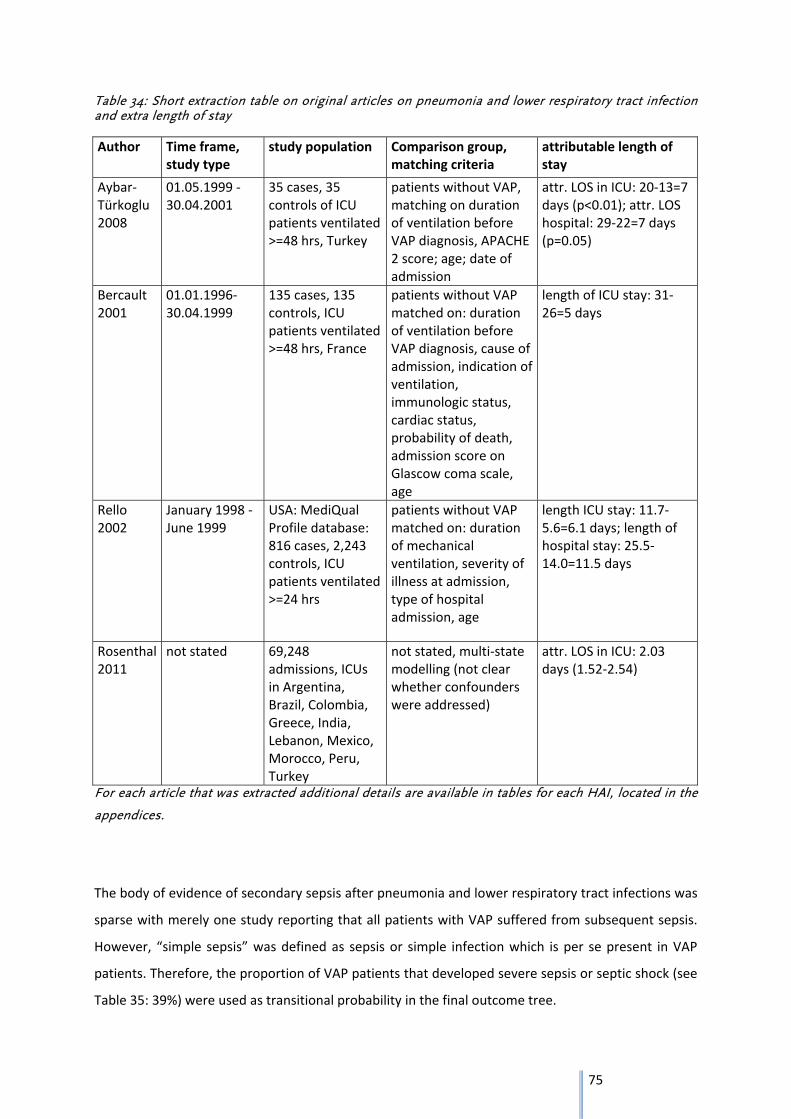
75
Table 34: Short extraction table on original articles on pneumonia and lower respiratory tract infection and extra length of stay
Author Time frame, study type
study population Comparison group, matching criteria
attributable length of stay
Aybar‐Türkoglu 2008
01.05.1999 ‐ 30.04.2001
35 cases, 35 controls of ICU patients ventilated >=48 hrs, Turkey
patients without VAP, matching on duration of ventilation before VAP diagnosis, APACHE 2 score; age; date of admission
attr. LOS in ICU: 20‐13=7 days (p<0.01); attr. LOS hospital: 29‐22=7 days (p=0.05)
Bercault 2001
01.01.1996‐30.04.1999
135 cases, 135 controls, ICU patients ventilated >=48 hrs, France
patients without VAP matched on: duration of ventilation before VAP diagnosis, cause of admission, indication of ventilation, immunologic status, cardiac status, probability of death, admission score on Glascow coma scale, age
length of ICU stay: 31‐26=5 days
Rello 2002
January 1998 ‐ June 1999
USA: MediQual Profile database: 816 cases, 2,243 controls, ICU patients ventilated >=24 hrs
patients without VAP matched on: duration of mechanical ventilation, severity of illness at admission, type of hospital admission, age
length ICU stay: 11.7‐5.6=6.1 days; length of hospital stay: 25.5‐14.0=11.5 days
Rosenthal 2011
not stated 69,248 admissions, ICUs in Argentina, Brazil, Colombia, Greece, India, Lebanon, Mexico, Morocco, Peru, Turkey
not stated, multi‐state modelling (not clear whether confounders were addressed)
attr. LOS in ICU: 2.03 days (1.52‐2.54)
For each article that was extracted additional details are available in tables for each HAI, located in the
appendices.
The body of evidence of secondary sepsis after pneumonia and lower respiratory tract infections was
sparse with merely one study reporting that all patients with VAP suffered from subsequent sepsis.
However, “simple sepsis” was defined as sepsis or simple infection which is per se present in VAP
patients. Therefore, the proportion of VAP patients that developed severe sepsis or septic shock (see
Table 35: 39%) were used as transitional probability in the final outcome tree.
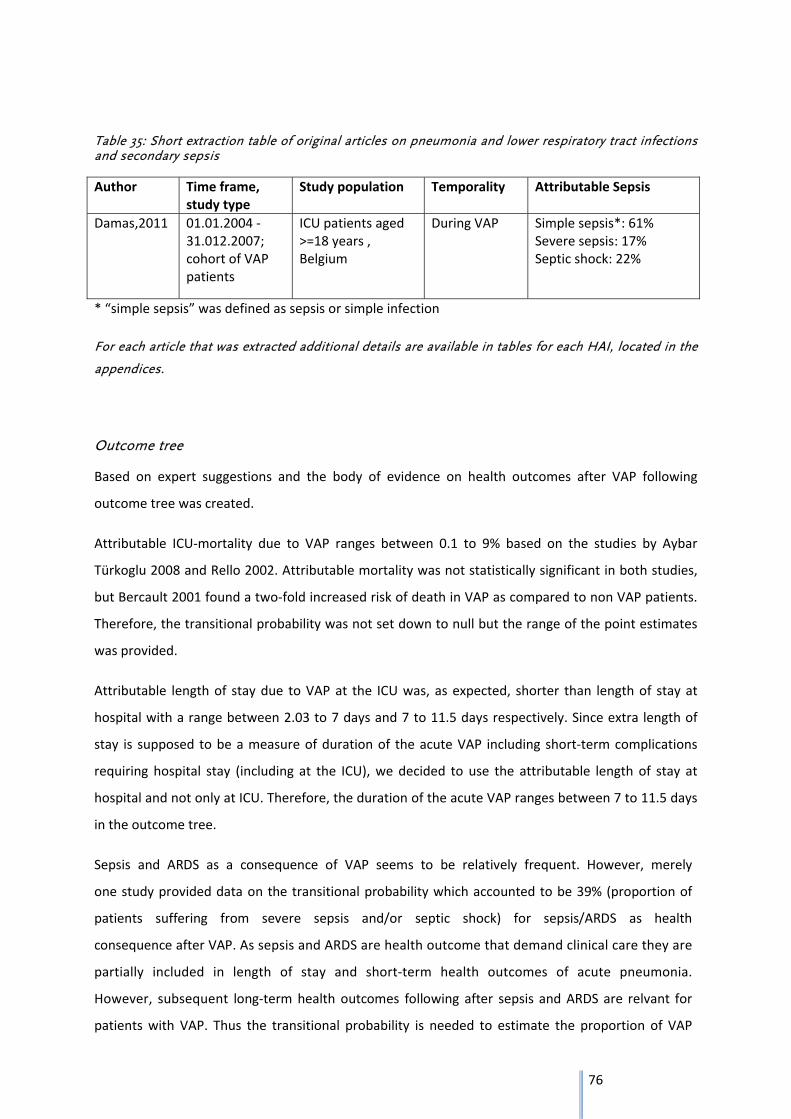
76
Table 35: Short extraction table of original articles on pneumonia and lower respiratory tract infections and secondary sepsis
Author Time frame, study type
Study population Temporality Attributable Sepsis
Damas,2011 01.01.2004 ‐31.012.2007; cohort of VAP patients
ICU patients aged >=18 years , Belgium
During VAP Simple sepsis*: 61% Severe sepsis: 17% Septic shock: 22%
* “simple sepsis” was defined as sepsis or simple infection
For each article that was extracted additional details are available in tables for each HAI, located in the
appendices.
Outcome tree
Based on expert suggestions and the body of evidence on health outcomes after VAP following
outcome tree was created.
Attributable ICU‐mortality due to VAP ranges between 0.1 to 9% based on the studies by Aybar
Türkoglu 2008 and Rello 2002. Attributable mortality was not statistically significant in both studies,
but Bercault 2001 found a two‐fold increased risk of death in VAP as compared to non VAP patients.
Therefore, the transitional probability was not set down to null but the range of the point estimates
was provided.
Attributable length of stay due to VAP at the ICU was, as expected, shorter than length of stay at
hospital with a range between 2.03 to 7 days and 7 to 11.5 days respectively. Since extra length of
stay is supposed to be a measure of duration of the acute VAP including short‐term complications
requiring hospital stay (including at the ICU), we decided to use the attributable length of stay at
hospital and not only at ICU. Therefore, the duration of the acute VAP ranges between 7 to 11.5 days
in the outcome tree.
Sepsis and ARDS as a consequence of VAP seems to be relatively frequent. However, merely
one study provided data on the transitional probability which accounted to be 39% (proportion of
patients suffering from severe sepsis and/or septic shock) for sepsis/ARDS as health
consequence after VAP. As sepsis and ARDS are health outcome that demand clinical care they are
partially included in length of stay and short‐term health outcomes of acute pneumonia.
However, subsequent long‐term health outcomes following after sepsis and ARDS are relvant for
patients with VAP. Thus the transitional probability is needed to estimate the proportion of VAP
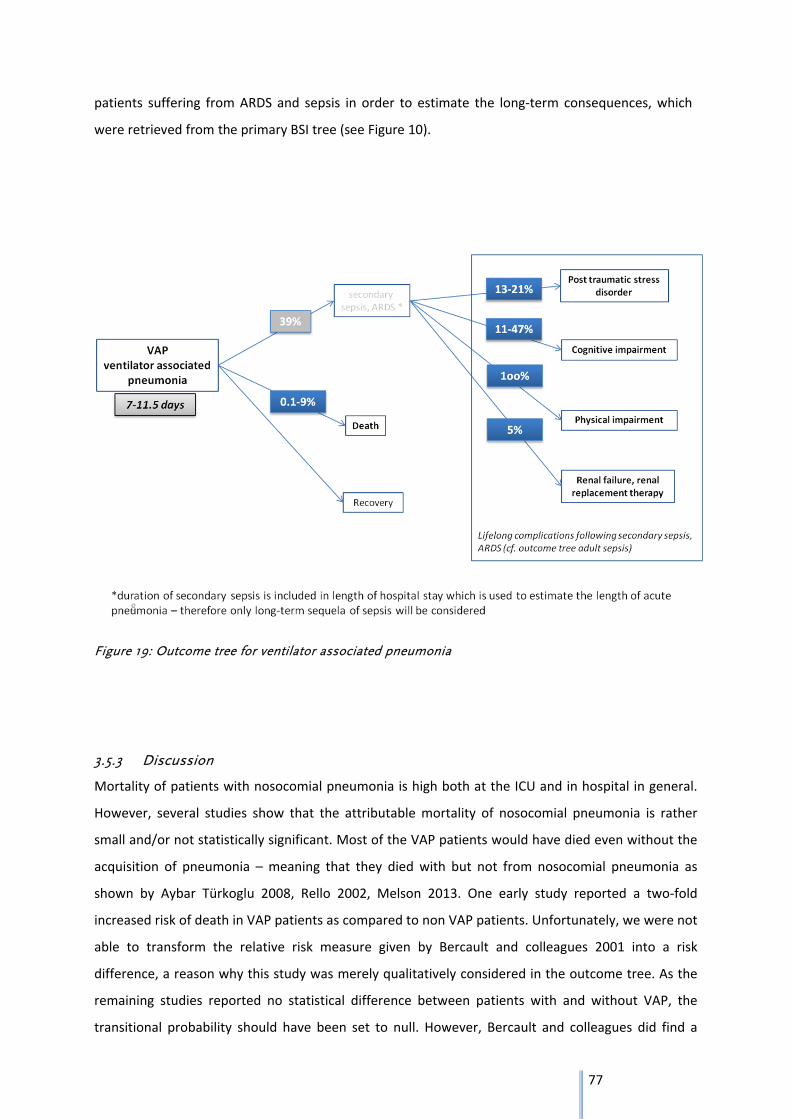
77
patients suffering from ARDS and sepsis in order to estimate the long‐term consequences, which
were retrieved from the primary BSI tree (see Figure 10).
Figure 19: Outcome tree for ventilator associated pneumonia
3.5.3 Discussion
Mortality of patients with nosocomial pneumonia is high both at the ICU and in hospital in general.
However, several studies show that the attributable mortality of nosocomial pneumonia is rather
small and/or not statistically significant. Most of the VAP patients would have died even without the
acquisition of pneumonia – meaning that they died with but not from nosocomial pneumonia as
shown by Aybar Türkoglu 2008, Rello 2002, Melson 2013. One early study reported a two‐fold
increased risk of death in VAP patients as compared to non VAP patients. Unfortunately, we were not
able to transform the relative risk measure given by Bercault and colleagues 2001 into a risk
difference, a reason why this study was merely qualitatively considered in the outcome tree. As the
remaining studies reported no statistical difference between patients with and without VAP, the
transitional probability should have been set to null. However, Bercault and colleagues did find a
78
significantly increased risk of mortality due to VAP and thus we provided the range of point estimates
of the risk differences given by Aybar Türkoglu 2008 and Rello 2002.
The methodological quality of the original studies ((124); (125); (126)) was rather good as they all
considered the time of ventilation in cases when selecting their controls in order to prevent time‐
dependent bias. Moreover, matching on severity of illness at hospitalization and age was done since
these factors influence substantially the risk of mortality. Bercault 2001 considered even more
matching criteria e.g. immunologic and cardiac status, indication of ventilation or probability of death
which may be somewhat redundant and could have led to overmatching. The largest study
performed by Melsen 2013 comprising almost 6,000 patients, did not match or control for length of
ventilation, severity of illness at hospitalization or age between cases and control. Thus, patients with
and without VAP may not be entirely comparable regarding their risk of mortality which may have
led to overestimation of the attributable mortality as the patients without VAP may be the ones with
the better prognosis. Given 3% attributable mortality as reported by Melsen 2013 may be an
overestimation of the attributable mortality, the true estimate may be close to the null. Thus this
large‐scale study comprising many different studies does support our result of a relatively low or
even absent attributable mortality due to nosocomial pneumonia.
All original studies on length of stay considered the duration of ventilation of cases and controls in
order prevent time‐dependent bias. The estimates of LOS at ICU were generally shorter than LOS at
hospital showing that estimates are reliable and comparable. For the final outcome tree, the LOS at
hospital was used because it is assumed that this reflects best the length of the acute nosocomial
pneumonia and its short‐term health outcomes, i.e. sepsis and ARDS. Since LOS at hospital was
reported by only two studies ((124); (126)) with very different data sources (register data vs. primary
study data) we did not pool the estimates but rather provided a range of LOS at hospital.
According to the results of the expert meeting secondary sepsis and ARDS was considered as one
health outcome because each patient suffering from ARDS also fulfills the criteria of a secondary
sepsis. To circumvent overestimation of the burden of disease, both health outcomes were
considered together. Since sepsis comprises a wider definition than ARDS, a systematic literature
search on sepsis only was performed. Nonetheless, when searching for ARDS as a consequence of
pneumonia, no relevant literature could have been retrieved. The literature on sepsis as a
consequence of pneumonia was also sparse and most of the articles were not included due to lack of
temporality – it was not clear whether or not sepsis was diagnosed after a manifest pneumonia.
Another disadvantage was the poor definition of sepsis. The only study that qualified for the creation
of the outcome tree because the temporality was clearly stated defined “simple sepsis” as “patients
suffering from sepsis or a simple infection”. Since pneumonia, or in this special case VAP, is already
79
an infection, all VAP patients were consequently defined of having a simple sepsis. Besides “simple
sepsis”, two further stages were reported with severe sepsis and septic shock. Again a clear
definition was unfortunately lacking. However, as there is no better data available both proportions
of VAP patients in the categories “severe sepsis” and “septic shock” were used to define a
transitional probability of sepsis.
No duration of sepsis after VAP was assigned because the expert group reported from their clinical
experience that the duration of sepsis as acute disease is most likely already included in the length of
stay at ICU or hospital respectively. Sepsis due to pneumonia is a short‐term health outcome and the
respective duration of this outcome will thus be covered by extended length of stay in hospital due
to VAP.
For the purpose of computing the DALYs due to sepsis after VAP, long‐term consequences of sepsis
but not sepsis per se will be considered by multiplying the transitional probability of sepsis/ARDS
after VAP (39%) with the respective long‐term outcome after sepsis/ARDS. Doing so, one estimates
the proportion of VAP patients that suffer from long‐term health outcomes after VAP related to
sepsis/ARDS. These long‐term consequences (except for mortality) and respective transitional
probabilities and duration of disease were assigned based on the outcome tree on nosocomial BSI in
adults (see Figure 10).
ARDS is also an important health outcome after VAP. It is present in some but not all sepsis patients
and has similar long‐term consequences as sepsis. Designating an own health outcome for ARDS
would probably lead to overestimation because all ARDS patients fulfill the criteria of sepsis.
Therefore, the health outcome comprises both sepsis and ARDS patients.
The literature retrieved via the systematic searches was limited exclusively to patients with and
without VAP despite the wide key words and synonyms for hospital acquired pneumonia and lower
respiratory tract infection. VAP patients are only a subpopulation of HAP patients and may thus differ
in some characteristics. However, this difference may not be as strong as suspected as reported by
several studies ((129); (130), (131)). Especially key measures for building the outcome tree, i.e. length
of hospital stay or hospital mortality were reported not to differ significantly. Still, VAP patients were
the ones with higher APACHE II score, younger age, lower number of co‐morbidities such as cancer
and cardio‐vascular diseases and higher proportion of antibiotic use before admission to hospital.
Information on comparison between VAP patients and patients with lower respiratory tract infection
is lacking and it is unclear to what extend this may have affected the transitional probabilities and
duration of health outcomes. Therefore, further research in patients with HAP and LRTI is warranted
especially studies controlling for prior length of hospital stay before diagnosis of HAP and LRTI and

80
controlling for severity of illness or co‐morbidities. Such studies may be possible using registry data
or surveillance data which should be explored for building and updating the outcome trees.
81
4 General Discussion and Outlook
Outcome trees for five HAIs were created based on systematic literature searches. In all outcome
trees (out of the one of CDI in part) attributable risks were used to express transitional probabilities
from one health outcome to another. This point is of special importance because HAIs can only
occur, if the respective patient has been hospitalized – a necessary condition for acquiring HAIs. The
hospitalized population is part of the general population but suffers disproportionally more often
from severe underlying diseases and co‐morbidities, which are the reason for the hospitalization.
Thus, the hospital population is highly selected and at higher risks for adverse health outcomes than
the general non‐hospitalized population. Consequently, premature mortality and life time spent in
incomplete health due to chronic diseases is much more common in persons admitted to healthcare
facilities than in the general population. Therefore, persons admitted to healthcare facilities without
the respective HAI have to be considered as comparator. Simply collecting incidences of health
outcomes in patients with HAI would not be sufficient and lead to overestimation of the burden of
disease.
Due to the precondition of a valid comparator, we considered at first only classical study types, i.e.
cohort studies and randomized clinical trial or systematic reviews based on these two study types.
However, during the search we found a great number of well‐conducted matched case‐control
studies which also provided reliable and valid information for the creation of outcome trees.
Therefore, the research protocol was extended to case‐control studies.
In order to estimate the burden of HAI based on outcome trees the duration of the acute infection
had to be estimated. We had two options to quantify/estimate the acute disease duration: first
length of treatment and second additional length of stay. As treatment options change, medication
regimes tended to become shorter in the last decades, we decided to rely on additional length of
stay at hospital or ICU as surrogate measure for acute disease duration (consensus decision at expert
workshop October 2013). For that matter it was of importance to have a valid comparator – namely
patients with comparable characteristics (e.g. severity and type of underlying disease) but without
the respective HAI. We are aware that this is merely an approximation of the duration of the acute
disease.
A few well conducted studies provided relative risk estimates (risk ratios, odds ratios or hazard
ratios) only. In case where adjustment for severity of disease at admission to hospital is of great
importance, e.g. CDI or pneumonia, adjusted relative risk estimates would be the effect measures of
choice to be included into the outcome trees. However, we could not quantitatively consider them in
the outcome trees because key information e.g. respective person time of the control group or the
adjusted risk/odds of the non‐exposed groups were not provided. Therefore, a recalculation of these
82
adjusted relative risk estimates was done for unadjusted risk estimates, e.g. for neonatal sepsis, was
not possible. Instead, we tried to qualitatively consider these estimates and checked whether their
direction and significance level was in line with risk differences found in other articles.
During the process of reviewing the literature it became evident that time‐dependent bias may be an
important criterion when selecting relevant and reliable literature for the creation of outcome trees.
This type of bias was most prominently addressed in the context of CDI. For the device‐associated
infections, VAP and UTI, this issue was quite rarely considered while for primary BSI and SSI this issue
was not mentioned at all in publications.
Time‐dependent bias also known as length bias, survival bias or immortal time bias is present when
an individual has to survive until a certain point in time to be included in the study. A famous
example is the study published in 2001 on whether Oscar winners live longer than actors or actresses
that did not win or were ever nominated for an Oscar ((132); (133)). This analysis showed that Oscar
nominees or winners live longer than their peers from the same era without an Oscar prize or
nomination. However, usually the longer an actor/actress lives, that more time they have to become
successful and the higher is also the chance to win or be nominated for an Oscar. The only condition
is, that these actors (cases) survive until this event. Their peers (controls) however, may have died
before the great success and did thus not have had the chance to be a nominee or a winner of the
Oscar. Therefore, controlling for the time of being an actor is very important. Transferring this
example to the hospital setting and nosocomial infections, both the cases and the controls should
have the same exposure time for acquiring the infections, meaning similar ventilation time in case of
VAP, similar time with catheter in case of UTI or similar time at hospital in case of CDI. In cases (those
with the infections) the time between onset of the respective treatment (ventilation or catheter) and
diagnosis of the infection is counted because the time of treatment after diagnosis of infection may
be rather a consequence and can by definition not be a predisposing factor for the infection. In case
of non‐consideration of the predisposing time for an infection, the estimates may be biased because
cases tend to be longer exposed to the potential risk (ventilation, catheter, hospital) for acquiring an
infection than controls. This, however, also inbears that for severe cases hardly any controls can be
found, which was reported in some studies on CDI and pneumonia ((125); (126)), which consequently
may lead to underestimation of the transitional probability.
However, it has been discussed in the literature that time‐dependent bias might operate in all studies
on nosocomial infections which do not treat exposure status as a time‐dependent variable (i.e., by
Cox regression) (134). According to these authors, conventional analysis would lead to an
overestimation of the burden of nosocomial infections which cannot be corrected for by adjusting for
confounder.
83
Outlook
The herein created outcome trees are not static but rather subject for improvement as soon as
better and more information on HAIs and their health outcomes are available.
The available body of evidence is relatively sparse and of moderate to low quality. Many studies,
although relatively narrow methodological selection criteria were defined for inclusion of the studies,
were still prone to bias. Thus, future additional research is needed that quantifies the attributable
risk of health outcomes following HAIs, which requires the selection of a suitable comparison group
and consideration of predisposing factors for the outcome of interest. Reporting of absolute risks of
health outcomes of HAIs is also important for healthcare planning purposes but can unfortunately
not be used for the creation of outcome trees HAIs and their estimation of burden of disease.
Moreover, antimicrobial resistance should be considered when creating outcome trees and
estimating the burden of HAIs. An important proportion of HAIs are caused by resistant pathogens
which may lead to a more severe course of disease. So far, it is unknown how large the true burden
of disease (DALY) due to resistant pathogens really is. Quantifying this burden would outline and
support the potential of preventive measures on resistant pathogens and probably underline the
strong need of action against antimicrobial resistance.
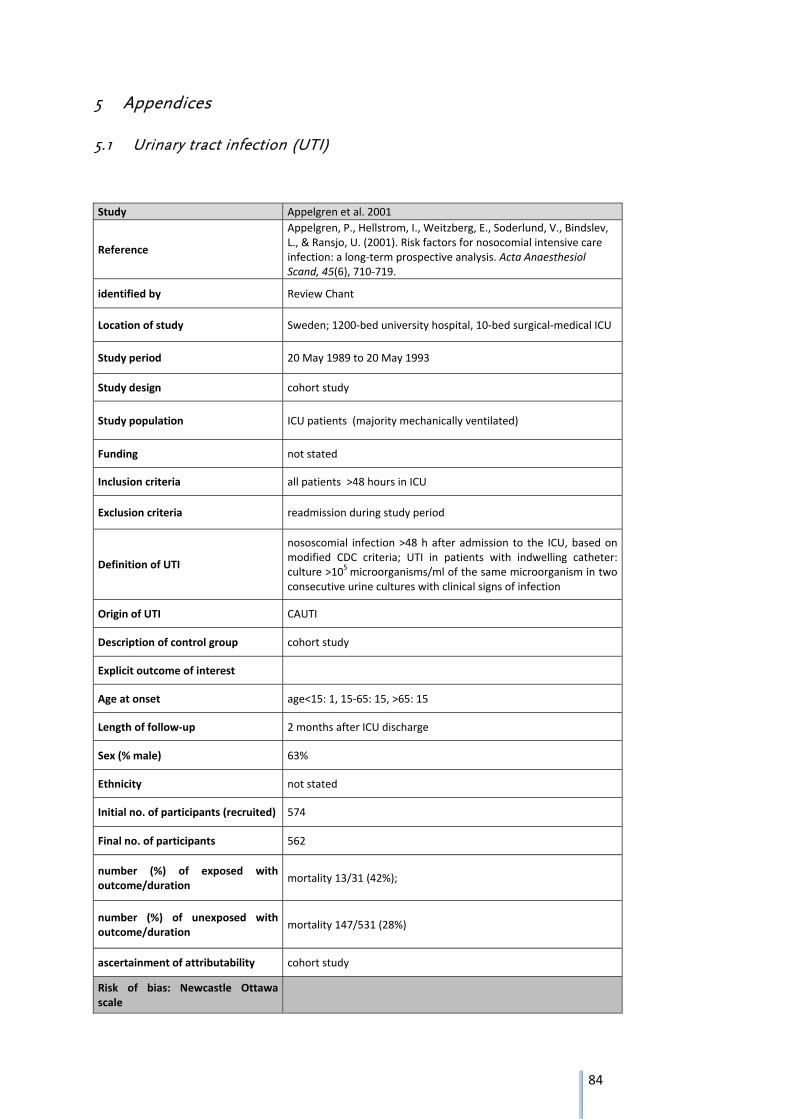
84
5 Appendices
5.1 Urinary tract infection (UTI)
Study Appelgren et al. 2001
Reference
Appelgren, P., Hellstrom, I., Weitzberg, E., Soderlund, V., Bindslev, L., & Ransjo, U. (2001). Risk factors for nosocomial intensive care infection: a long‐term prospective analysis. Acta Anaesthesiol Scand, 45(6), 710‐719.
identified by Review Chant
Location of study Sweden; 1200‐bed university hospital, 10‐bed surgical‐medical ICU
Study period 20 May 1989 to 20 May 1993
Study design cohort study
Study population ICU patients (majority mechanically ventilated)
Funding not stated
Inclusion criteria all patients >48 hours in ICU
Exclusion criteria readmission during study period
Definition of UTI
nososcomial infection >48 h after admission to the ICU, based on modified CDC criteria; UTI in patients with indwelling catheter: culture >105 microorganisms/ml of the same microorganism in two consecutive urine cultures with clinical signs of infection
Origin of UTI CAUTI
Description of control group cohort study
Explicit outcome of interest
Age at onset age<15: 1, 15‐65: 15, >65: 15
Length of follow‐up 2 months after ICU discharge
Sex (% male) 63%
Ethnicity not stated
Initial no. of participants (recruited) 574
Final no. of participants 562
number (%) of exposed with outcome/duration
mortality 13/31 (42%);
number (%) of unexposed with outcome/duration
mortality 147/531 (28%)
ascertainment of attributability cohort study
Risk of bias: Newcastle Ottawa scale
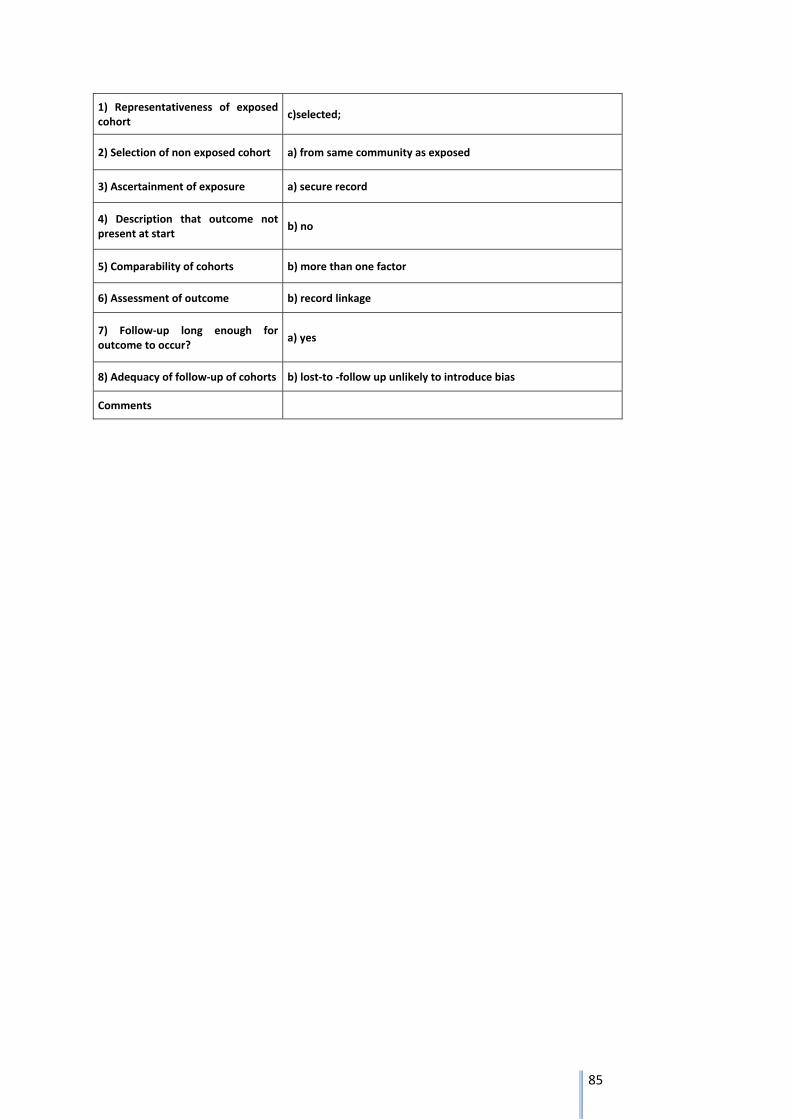
85
1) Representativeness of exposed cohort
c)selected;
2) Selection of non exposed cohort a) from same community as exposed
3) Ascertainment of exposure a) secure record
4) Description that outcome not present at start
b) no
5) Comparability of cohorts b) more than one factor
6) Assessment of outcome b) record linkage
7) Follow‐up long enough for outcome to occur?
a) yes
8) Adequacy of follow‐up of cohorts b) lost‐to ‐follow up unlikely to introduce bias
Comments
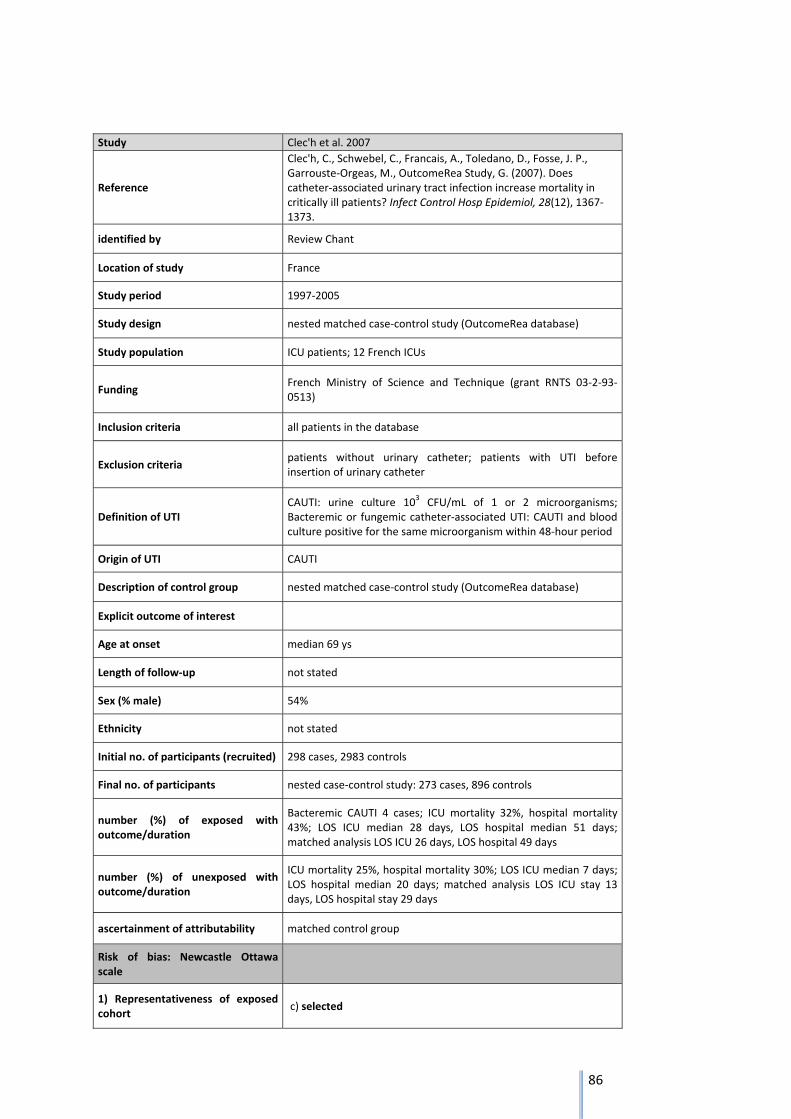
86
Study Clec'h et al. 2007
Reference
Clec'h, C., Schwebel, C., Francais, A., Toledano, D., Fosse, J. P., Garrouste‐Orgeas, M., OutcomeRea Study, G. (2007). Does catheter‐associated urinary tract infection increase mortality in critically ill patients? Infect Control Hosp Epidemiol, 28(12), 1367‐1373.
identified by Review Chant
Location of study France
Study period 1997‐2005
Study design nested matched case‐control study (OutcomeRea database)
Study population ICU patients; 12 French ICUs
Funding French Ministry of Science and Technique (grant RNTS 03‐2‐93‐0513)
Inclusion criteria all patients in the database
Exclusion criteria patients without urinary catheter; patients with UTI before insertion of urinary catheter
Definition of UTI CAUTI: urine culture 103 CFU/mL of 1 or 2 microorganisms; Bacteremic or fungemic catheter‐associated UTI: CAUTI and blood culture positive for the same microorganism within 48‐hour period
Origin of UTI CAUTI
Description of control group nested matched case‐control study (OutcomeRea database)
Explicit outcome of interest
Age at onset median 69 ys
Length of follow‐up not stated
Sex (% male) 54%
Ethnicity not stated
Initial no. of participants (recruited) 298 cases, 2983 controls
Final no. of participants nested case‐control study: 273 cases, 896 controls
number (%) of exposed with outcome/duration
Bacteremic CAUTI 4 cases; ICU mortality 32%, hospital mortality 43%; LOS ICU median 28 days, LOS hospital median 51 days; matched analysis LOS ICU 26 days, LOS hospital 49 days
number (%) of unexposed with outcome/duration
ICU mortality 25%, hospital mortality 30%; LOS ICU median 7 days; LOS hospital median 20 days; matched analysis LOS ICU stay 13 days, LOS hospital stay 29 days
ascertainment of attributability matched control group
Risk of bias: Newcastle Ottawa scale
1) Representativeness of exposed cohort
c) selected
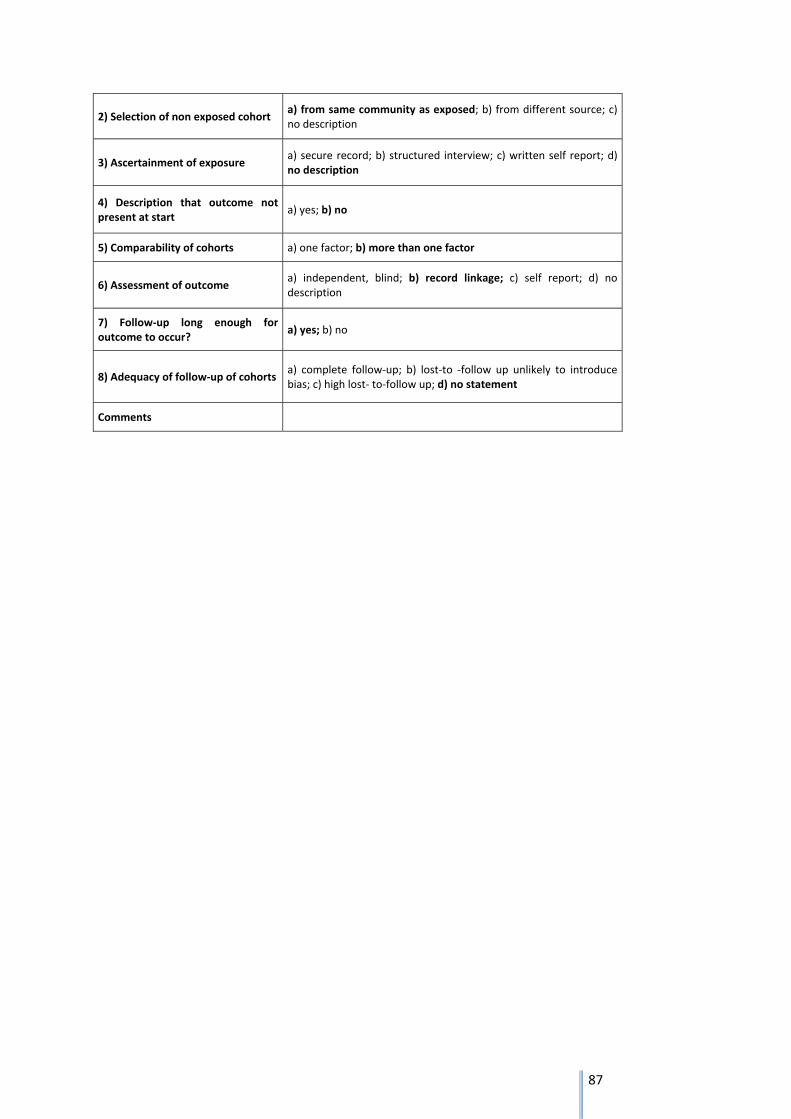
87
2) Selection of non exposed cohort a) from same community as exposed; b) from different source; c) no description
3) Ascertainment of exposure a) secure record; b) structured interview; c) written self report; d) no description
4) Description that outcome not present at start
a) yes; b) no
5) Comparability of cohorts a) one factor; b) more than one factor
6) Assessment of outcome a) independent, blind; b) record linkage; c) self report; d) no description
7) Follow‐up long enough for outcome to occur?
a) yes; b) no
8) Adequacy of follow‐up of cohorts a) complete follow‐up; b) lost‐to ‐follow up unlikely to introduce bias; c) high lost‐ to‐follow up; d) no statement
Comments
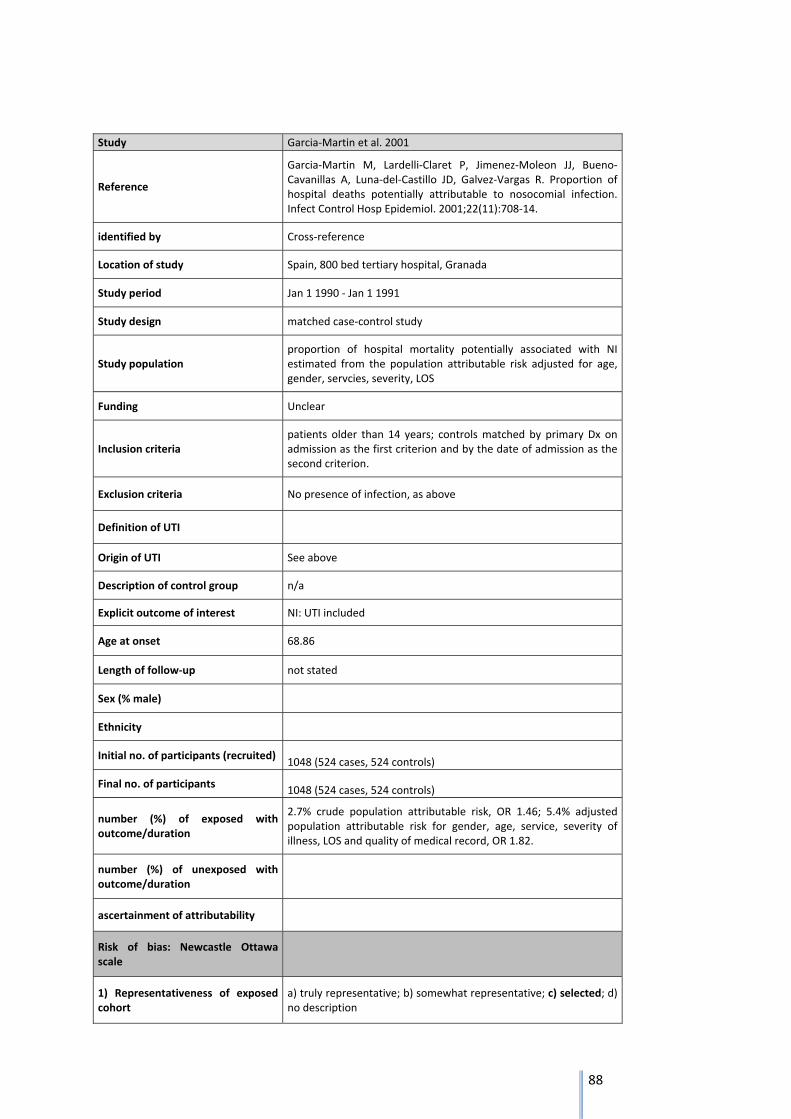
88
Study Garcia‐Martin et al. 2001
Reference
Garcia‐Martin M, Lardelli‐Claret P, Jimenez‐Moleon JJ, Bueno‐Cavanillas A, Luna‐del‐Castillo JD, Galvez‐Vargas R. Proportion of hospital deaths potentially attributable to nosocomial infection. Infect Control Hosp Epidemiol. 2001;22(11):708‐14.
identified by Cross‐reference
Location of study Spain, 800 bed tertiary hospital, Granada
Study period Jan 1 1990 ‐ Jan 1 1991
Study design matched case‐control study
Study population proportion of hospital mortality potentially associated with NI estimated from the population attributable risk adjusted for age, gender, servcies, severity, LOS
Funding Unclear
Inclusion criteria patients older than 14 years; controls matched by primary Dx on admission as the first criterion and by the date of admission as the second criterion.
Exclusion criteria No presence of infection, as above
Definition of UTI
Origin of UTI See above
Description of control group n/a
Explicit outcome of interest NI: UTI included
Age at onset 68.86
Length of follow‐up not stated
Sex (% male)
Ethnicity
Initial no. of participants (recruited) 1048 (524 cases, 524 controls)
Final no. of participants 1048 (524 cases, 524 controls)
number (%) of exposed with outcome/duration
2.7% crude population attributable risk, OR 1.46; 5.4% adjusted population attributable risk for gender, age, service, severity of illness, LOS and quality of medical record, OR 1.82.
number (%) of unexposed with outcome/duration
ascertainment of attributability
Risk of bias: Newcastle Ottawa scale
1) Representativeness of exposed cohort
a) truly representative; b) somewhat representative; c) selected; d) no description
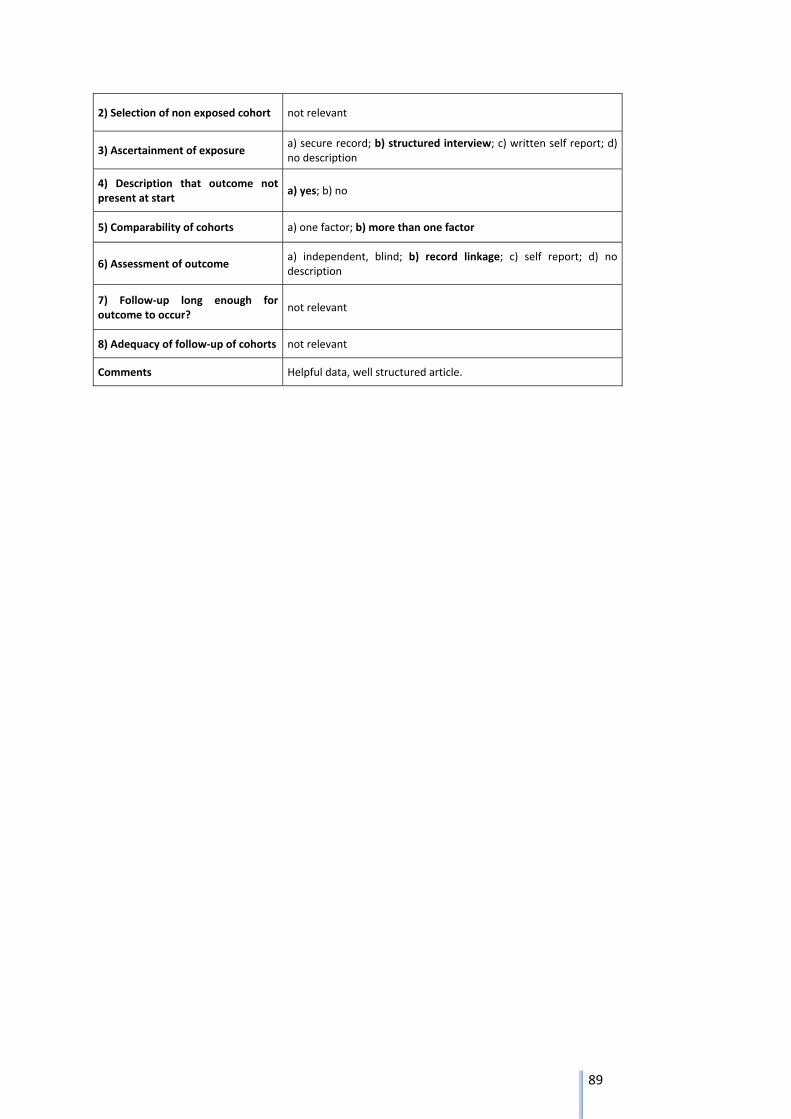
89
2) Selection of non exposed cohort not relevant
3) Ascertainment of exposure a) secure record; b) structured interview; c) written self report; d) no description
4) Description that outcome not present at start
a) yes; b) no
5) Comparability of cohorts a) one factor; b) more than one factor
6) Assessment of outcome a) independent, blind; b) record linkage; c) self report; d) no description
7) Follow‐up long enough for outcome to occur?
not relevant
8) Adequacy of follow‐up of cohorts not relevant
Comments Helpful data, well structured article.
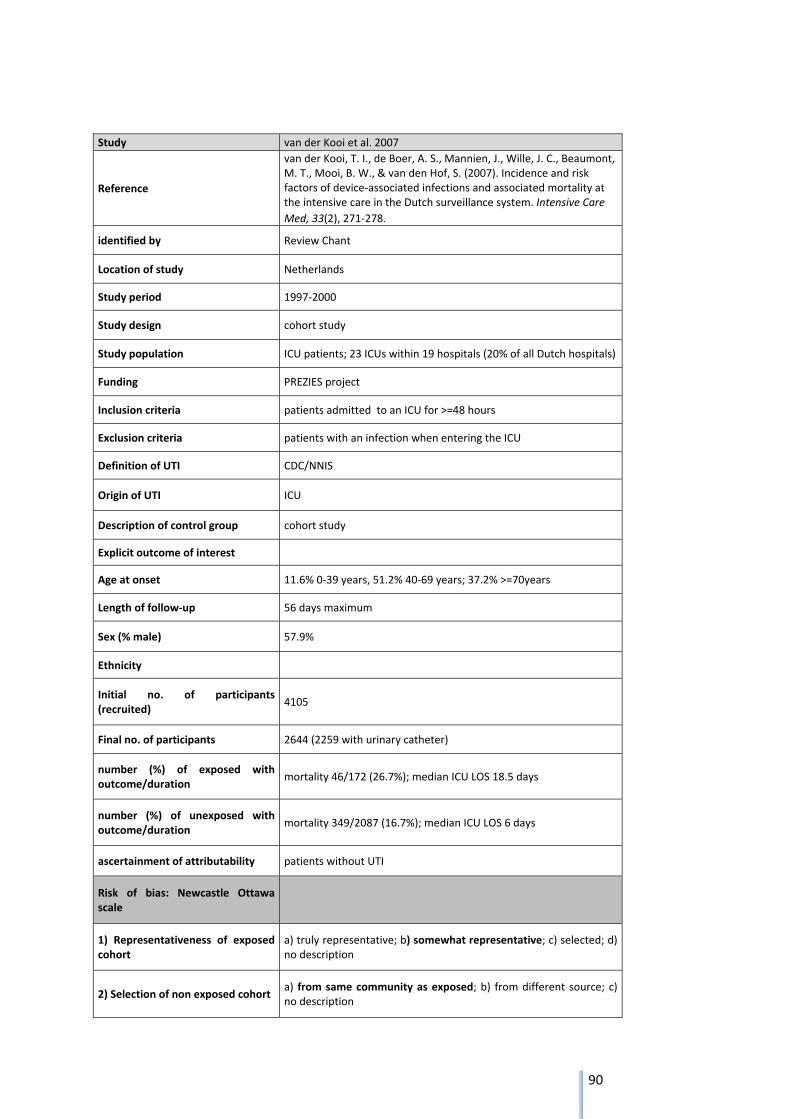
90
Study van der Kooi et al. 2007
Reference
van der Kooi, T. I., de Boer, A. S., Mannien, J., Wille, J. C., Beaumont, M. T., Mooi, B. W., & van den Hof, S. (2007). Incidence and risk factors of device‐associated infections and associated mortality at the intensive care in the Dutch surveillance system. Intensive Care
Med, 33(2), 271‐278.
identified by Review Chant
Location of study Netherlands
Study period 1997‐2000
Study design cohort study
Study population ICU patients; 23 ICUs within 19 hospitals (20% of all Dutch hospitals)
Funding PREZIES project
Inclusion criteria patients admitted to an ICU for >=48 hours
Exclusion criteria patients with an infection when entering the ICU
Definition of UTI CDC/NNIS
Origin of UTI ICU
Description of control group cohort study
Explicit outcome of interest
Age at onset 11.6% 0‐39 years, 51.2% 40‐69 years; 37.2% >=70years
Length of follow‐up 56 days maximum
Sex (% male) 57.9%
Ethnicity
Initial no. of participants (recruited)
4105
Final no. of participants 2644 (2259 with urinary catheter)
number (%) of exposed with outcome/duration
mortality 46/172 (26.7%); median ICU LOS 18.5 days
number (%) of unexposed with outcome/duration
mortality 349/2087 (16.7%); median ICU LOS 6 days
ascertainment of attributability patients without UTI
Risk of bias: Newcastle Ottawa scale
1) Representativeness of exposed cohort
a) truly representative; b) somewhat representative; c) selected; d) no description
2) Selection of non exposed cohort a) from same community as exposed; b) from different source; c) no description
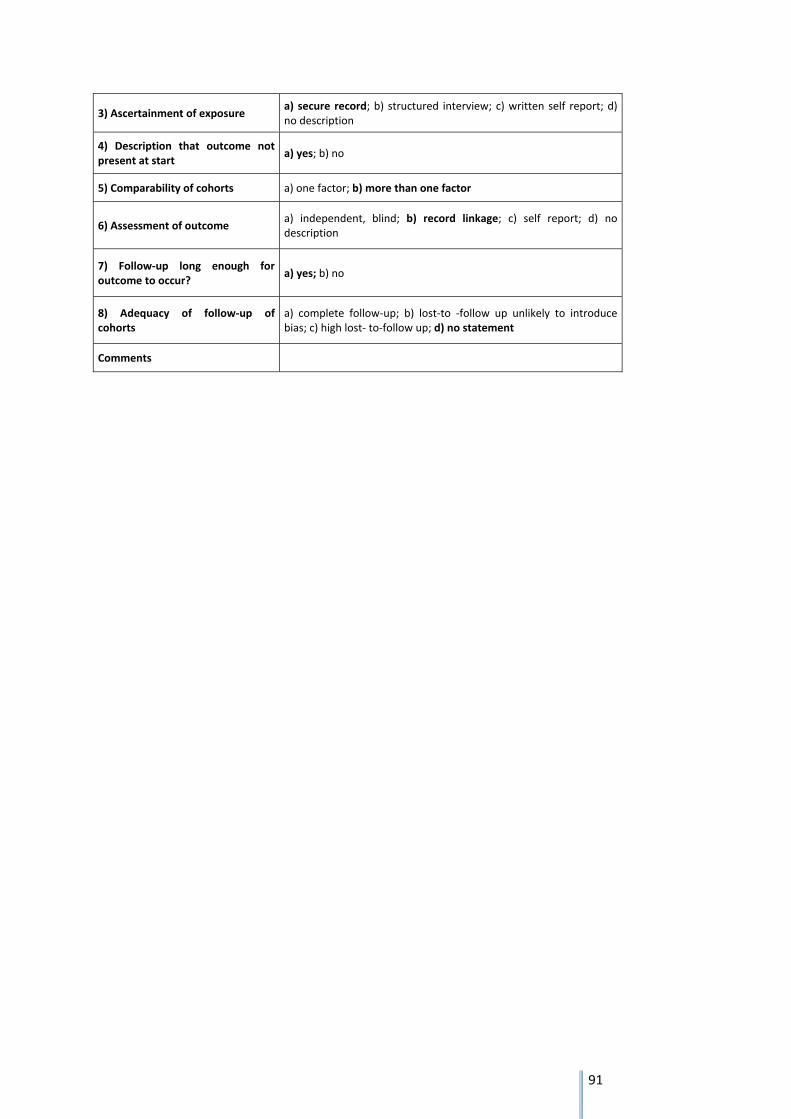
91
3) Ascertainment of exposure a) secure record; b) structured interview; c) written self report; d) no description
4) Description that outcome not present at start
a) yes; b) no
5) Comparability of cohorts a) one factor; b) more than one factor
6) Assessment of outcome a) independent, blind; b) record linkage; c) self report; d) no description
7) Follow‐up long enough for outcome to occur?
a) yes; b) no
8) Adequacy of follow‐up of cohorts
a) complete follow‐up; b) lost‐to ‐follow up unlikely to introduce bias; c) high lost‐ to‐follow up; d) no statement
Comments
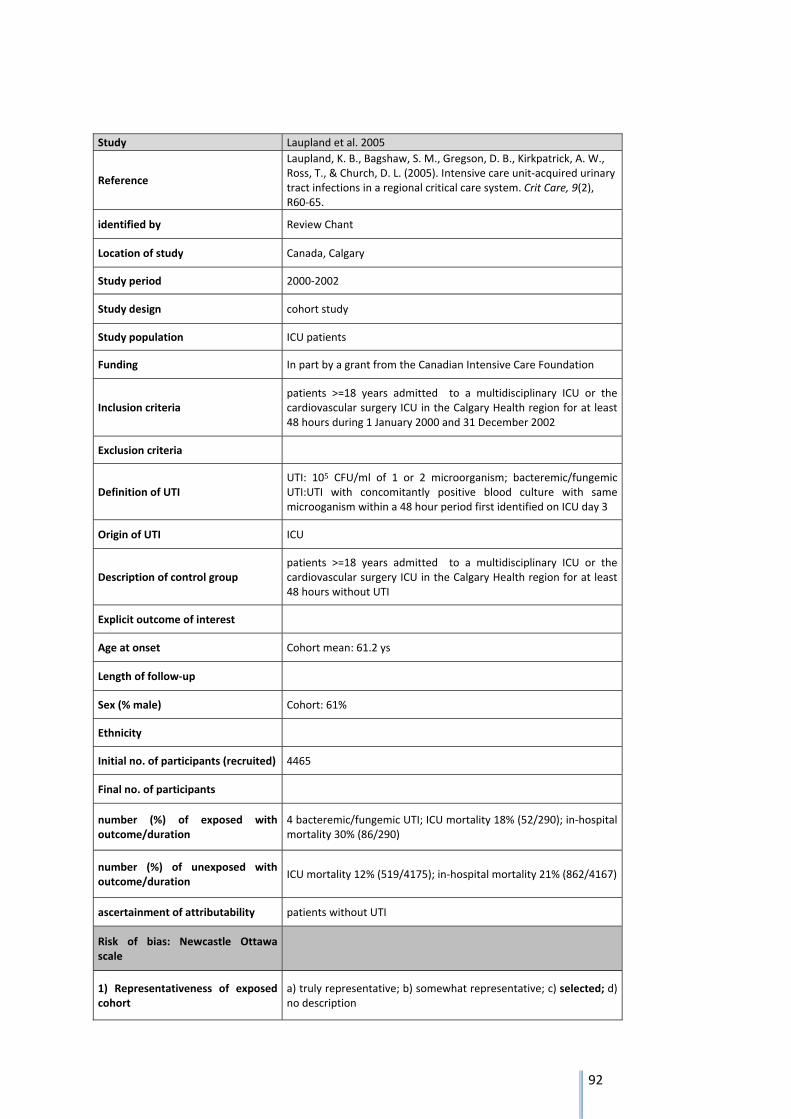
92
Study Laupland et al. 2005
Reference
Laupland, K. B., Bagshaw, S. M., Gregson, D. B., Kirkpatrick, A. W., Ross, T., & Church, D. L. (2005). Intensive care unit‐acquired urinary tract infections in a regional critical care system. Crit Care, 9(2), R60‐65.
identified by Review Chant
Location of study Canada, Calgary
Study period 2000‐2002
Study design cohort study
Study population ICU patients
Funding In part by a grant from the Canadian Intensive Care Foundation
Inclusion criteria patients >=18 years admitted to a multidisciplinary ICU or the cardiovascular surgery ICU in the Calgary Health region for at least 48 hours during 1 January 2000 and 31 December 2002
Exclusion criteria
Definition of UTI UTI: 105 CFU/ml of 1 or 2 microorganism; bacteremic/fungemic UTI:UTI with concomitantly positive blood culture with same microoganism within a 48 hour period first identified on ICU day 3
Origin of UTI ICU
Description of control group patients >=18 years admitted to a multidisciplinary ICU or the cardiovascular surgery ICU in the Calgary Health region for at least 48 hours without UTI
Explicit outcome of interest
Age at onset Cohort mean: 61.2 ys
Length of follow‐up
Sex (% male) Cohort: 61%
Ethnicity
Initial no. of participants (recruited) 4465
Final no. of participants
number (%) of exposed with outcome/duration
4 bacteremic/fungemic UTI; ICU mortality 18% (52/290); in‐hospital mortality 30% (86/290)
number (%) of unexposed with outcome/duration
ICU mortality 12% (519/4175); in‐hospital mortality 21% (862/4167)
ascertainment of attributability patients without UTI
Risk of bias: Newcastle Ottawa scale
1) Representativeness of exposed cohort
a) truly representative; b) somewhat representative; c) selected; d) no description
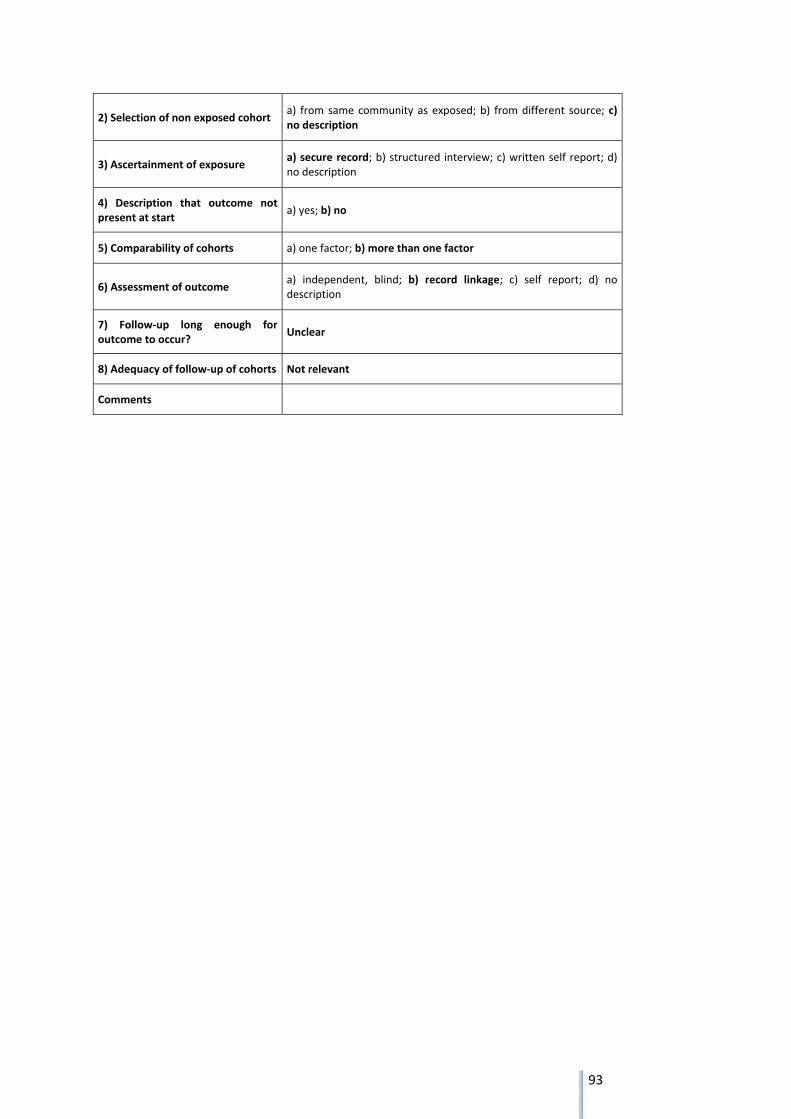
93
2) Selection of non exposed cohort a) from same community as exposed; b) from different source; c) no description
3) Ascertainment of exposure a) secure record; b) structured interview; c) written self report; d) no description
4) Description that outcome not present at start
a) yes; b) no
5) Comparability of cohorts a) one factor; b) more than one factor
6) Assessment of outcome a) independent, blind; b) record linkage; c) self report; d) no description
7) Follow‐up long enough for outcome to occur?
Unclear
8) Adequacy of follow‐up of cohorts Not relevant
Comments
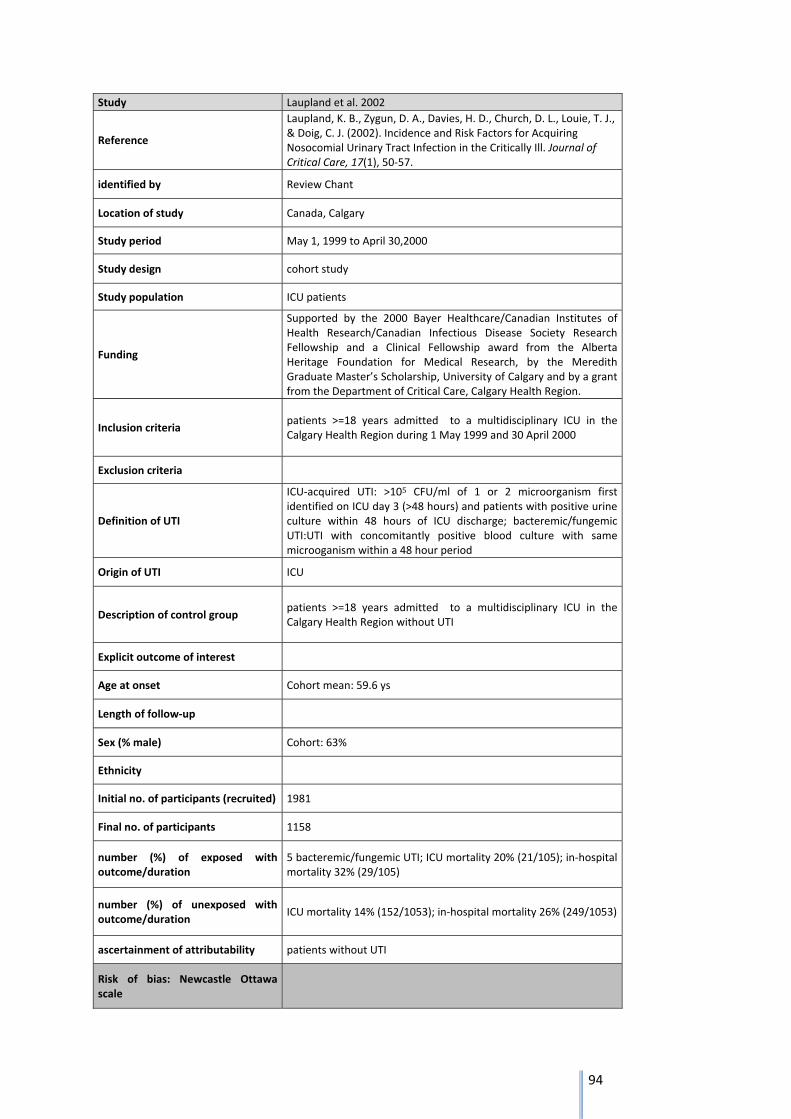
94
Study Laupland et al. 2002
Reference
Laupland, K. B., Zygun, D. A., Davies, H. D., Church, D. L., Louie, T. J., & Doig, C. J. (2002). Incidence and Risk Factors for Acquiring Nosocomial Urinary Tract Infection in the Critically Ill. Journal of Critical Care, 17(1), 50‐57.
identified by Review Chant
Location of study Canada, Calgary
Study period May 1, 1999 to April 30,2000
Study design cohort study
Study population ICU patients
Funding
Supported by the 2000 Bayer Healthcare/Canadian Institutes of Health Research/Canadian Infectious Disease Society Research Fellowship and a Clinical Fellowship award from the Alberta Heritage Foundation for Medical Research, by the Meredith Graduate Master’s Scholarship, University of Calgary and by a grant from the Department of Critical Care, Calgary Health Region.
Inclusion criteria patients >=18 years admitted to a multidisciplinary ICU in the Calgary Health Region during 1 May 1999 and 30 April 2000
Exclusion criteria
Definition of UTI
ICU‐acquired UTI: >105 CFU/ml of 1 or 2 microorganism first identified on ICU day 3 (>48 hours) and patients with positive urine culture within 48 hours of ICU discharge; bacteremic/fungemic UTI:UTI with concomitantly positive blood culture with same microoganism within a 48 hour period
Origin of UTI ICU
Description of control group patients >=18 years admitted to a multidisciplinary ICU in the Calgary Health Region without UTI
Explicit outcome of interest
Age at onset Cohort mean: 59.6 ys
Length of follow‐up
Sex (% male) Cohort: 63%
Ethnicity
Initial no. of participants (recruited) 1981
Final no. of participants 1158
number (%) of exposed with outcome/duration
5 bacteremic/fungemic UTI; ICU mortality 20% (21/105); in‐hospital mortality 32% (29/105)
number (%) of unexposed with outcome/duration
ICU mortality 14% (152/1053); in‐hospital mortality 26% (249/1053)
ascertainment of attributability patients without UTI
Risk of bias: Newcastle Ottawa scale
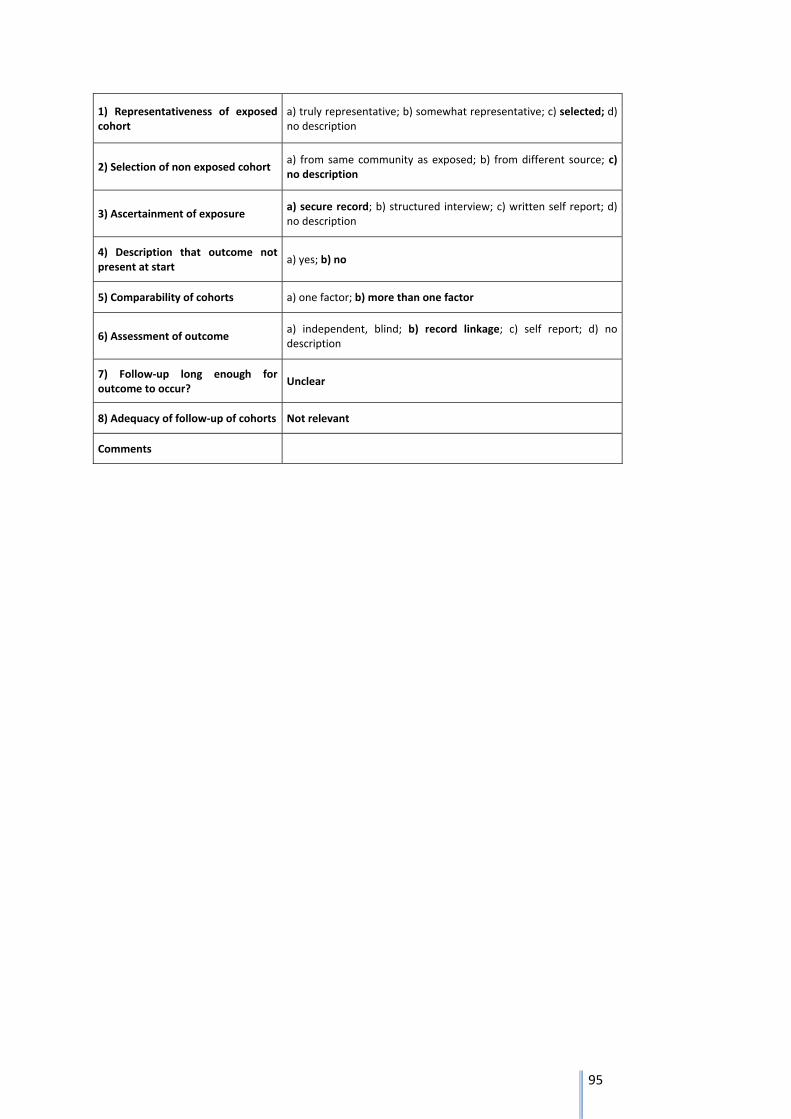
95
1) Representativeness of exposed cohort
a) truly representative; b) somewhat representative; c) selected; d) no description
2) Selection of non exposed cohort a) from same community as exposed; b) from different source; c) no description
3) Ascertainment of exposure a) secure record; b) structured interview; c) written self report; d) no description
4) Description that outcome not present at start
a) yes; b) no
5) Comparability of cohorts a) one factor; b) more than one factor
6) Assessment of outcome a) independent, blind; b) record linkage; c) self report; d) no description
7) Follow‐up long enough for outcome to occur?
Unclear
8) Adequacy of follow‐up of cohorts Not relevant
Comments
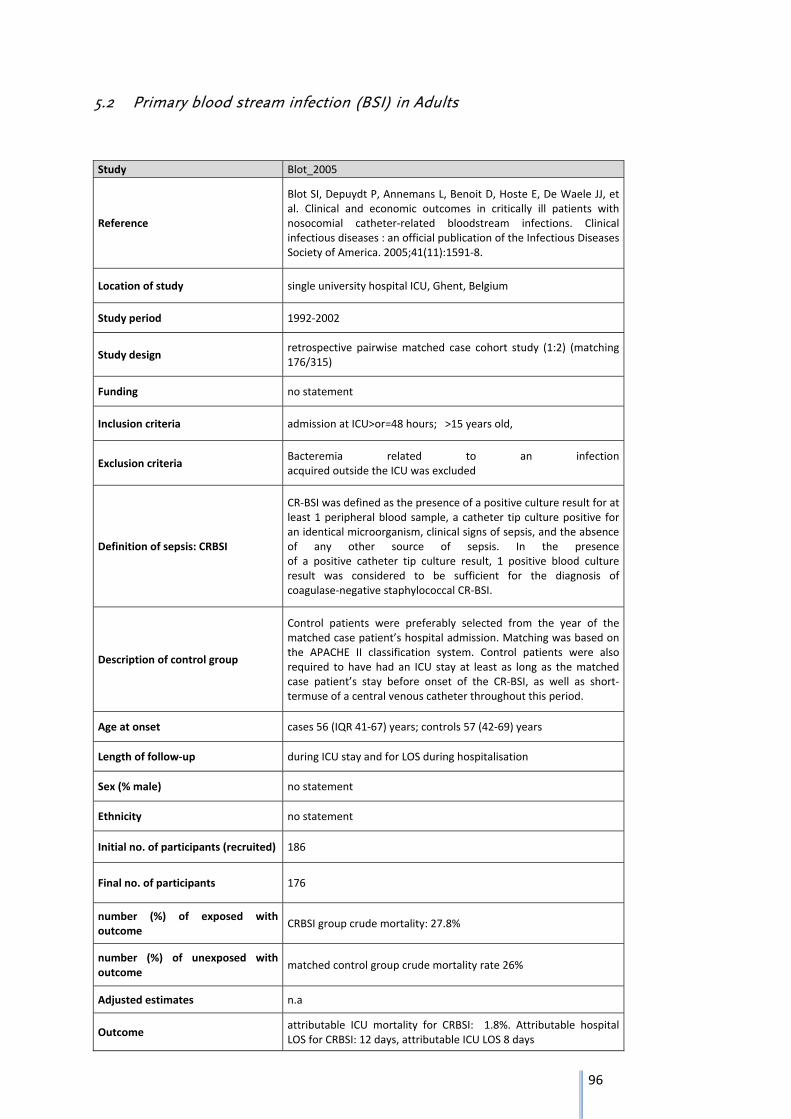
96
5.2 Primary blood stream infection (BSI) in Adults
Study Blot_2005
Reference
Blot SI, Depuydt P, Annemans L, Benoit D, Hoste E, De Waele JJ, et al. Clinical and economic outcomes in critically ill patients with nosocomial catheter‐related bloodstream infections. Clinical infectious diseases : an official publication of the Infectious Diseases Society of America. 2005;41(11):1591‐8.
Location of study single university hospital ICU, Ghent, Belgium
Study period 1992‐2002
Study design retrospective pairwise matched case cohort study (1:2) (matching 176/315)
Funding no statement
Inclusion criteria admission at ICU>or=48 hours; >15 years old,
Exclusion criteria Bacteremia related to an infection acquired outside the ICU was excluded
Definition of sepsis: CRBSI
CR‐BSI was defined as the presence of a positive culture result for at least 1 peripheral blood sample, a catheter tip culture positive for an identical microorganism, clinical signs of sepsis, and the absence of any other source of sepsis. In the presence of a positive catheter tip culture result, 1 positive blood culture result was considered to be sufficient for the diagnosis of coagulase‐negative staphylococcal CR‐BSI.
Description of control group
Control patients were preferably selected from the year of the matched case patient’s hospital admission. Matching was based on the APACHE II classification system. Control patients were also required to have had an ICU stay at least as long as the matched case patient’s stay before onset of the CR‐BSI, as well as short‐termuse of a central venous catheter throughout this period.
Age at onset cases 56 (IQR 41‐67) years; controls 57 (42‐69) years
Length of follow‐up during ICU stay and for LOS during hospitalisation
Sex (% male) no statement
Ethnicity no statement
Initial no. of participants (recruited) 186
Final no. of participants 176
number (%) of exposed with outcome
CRBSI group crude mortality: 27.8%
number (%) of unexposed with outcome
matched control group crude mortality rate 26%
Adjusted estimates n.a
Outcome attributable ICU mortality for CRBSI: 1.8%. Attributable hospital LOS for CRBSI: 12 days, attributable ICU LOS 8 days
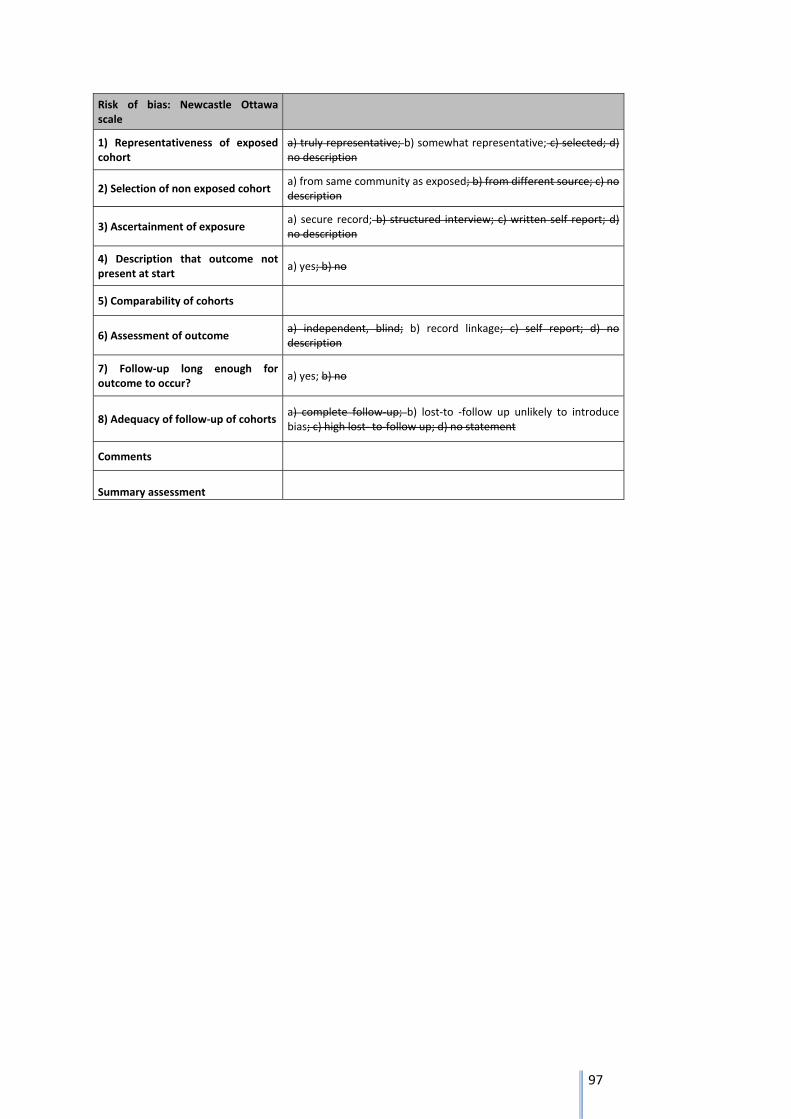
97
Risk of bias: Newcastle Ottawa scale
1) Representativeness of exposed cohort
a) truly representative; b) somewhat representative; c) selected; d) no description
2) Selection of non exposed cohort a) from same community as exposed; b) from different source; c) no description
3) Ascertainment of exposure a) secure record; b) structured interview; c) written self report; d) no description
4) Description that outcome not present at start
a) yes; b) no
5) Comparability of cohorts
6) Assessment of outcome a) independent, blind; b) record linkage; c) self report; d) no description
7) Follow‐up long enough for outcome to occur?
a) yes; b) no
8) Adequacy of follow‐up of cohorts a) complete follow‐up; b) lost‐to ‐follow up unlikely to introduce bias; c) high lost‐ to‐follow up; d) no statement
Comments
Summary assessment
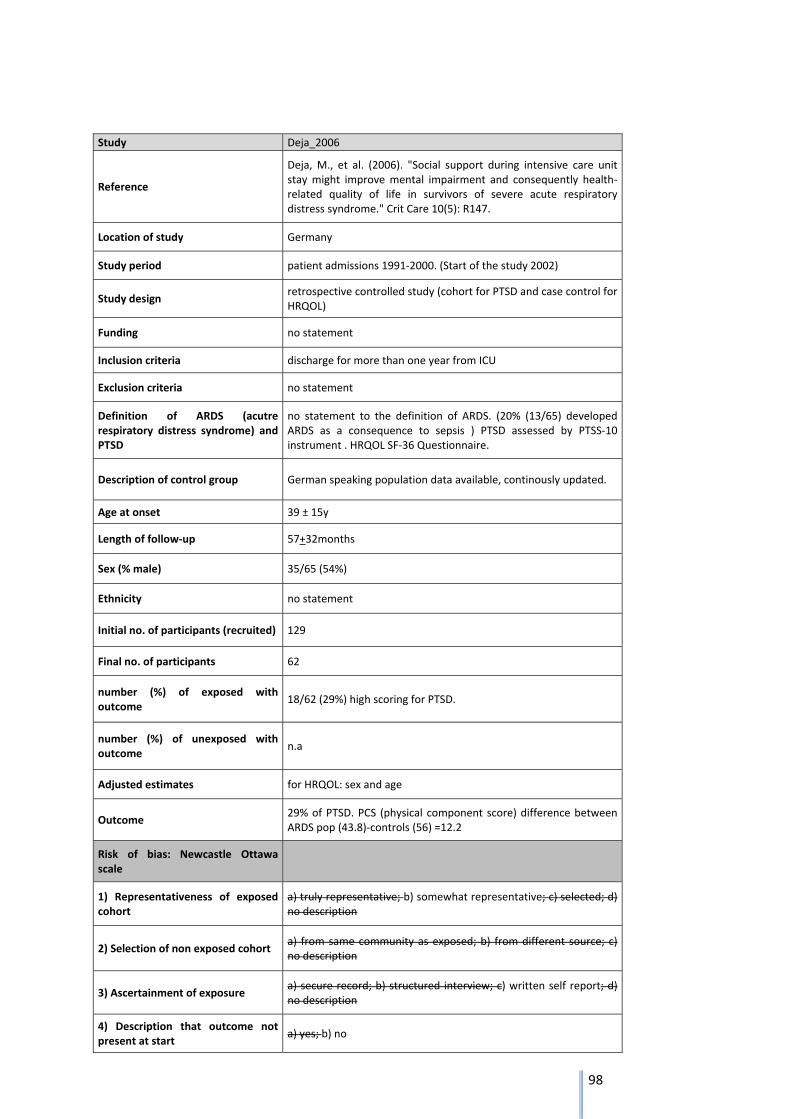
98
Study Deja_2006
Reference
Deja, M., et al. (2006). "Social support during intensive care unit stay might improve mental impairment and consequently health‐related quality of life in survivors of severe acute respiratory distress syndrome." Crit Care 10(5): R147.
Location of study Germany
Study period patient admissions 1991‐2000. (Start of the study 2002)
Study design retrospective controlled study (cohort for PTSD and case control for HRQOL)
Funding no statement
Inclusion criteria discharge for more than one year from ICU
Exclusion criteria no statement
Definition of ARDS (acutre respiratory distress syndrome) and PTSD
no statement to the definition of ARDS. (20% (13/65) developed ARDS as a consequence to sepsis ) PTSD assessed by PTSS‐10 instrument . HRQOL SF‐36 Questionnaire.
Description of control group German speaking population data available, continously updated.
Age at onset 39 ± 15y
Length of follow‐up 57+32months
Sex (% male) 35/65 (54%)
Ethnicity no statement
Initial no. of participants (recruited) 129
Final no. of participants 62
number (%) of exposed with outcome
18/62 (29%) high scoring for PTSD.
number (%) of unexposed with outcome
n.a
Adjusted estimates for HRQOL: sex and age
Outcome 29% of PTSD. PCS (physical component score) difference between ARDS pop (43.8)‐controls (56) =12.2
Risk of bias: Newcastle Ottawa scale
1) Representativeness of exposed cohort
a) truly representative; b) somewhat representative; c) selected; d) no description
2) Selection of non exposed cohort a) from same community as exposed; b) from different source; c) no description
3) Ascertainment of exposure a) secure record; b) structured interview; c) written self report; d) no description
4) Description that outcome not present at start
a) yes; b) no

99
5) Comparability of cohorts a) one factor; b) more than one factor
6) Assessment of outcome a) independent, blind; b) record linkage; c) self report; d) no description
7) Follow‐up long enough for outcome to occur?
a) yes; b) no
8) Adequacy of follow‐up of cohorts a) complete follow‐up; b) lost‐to ‐follow up unlikely to introduce bias; c) high lost‐ to‐follow up; d) no statement
Comments selection bias,
Summary assessment
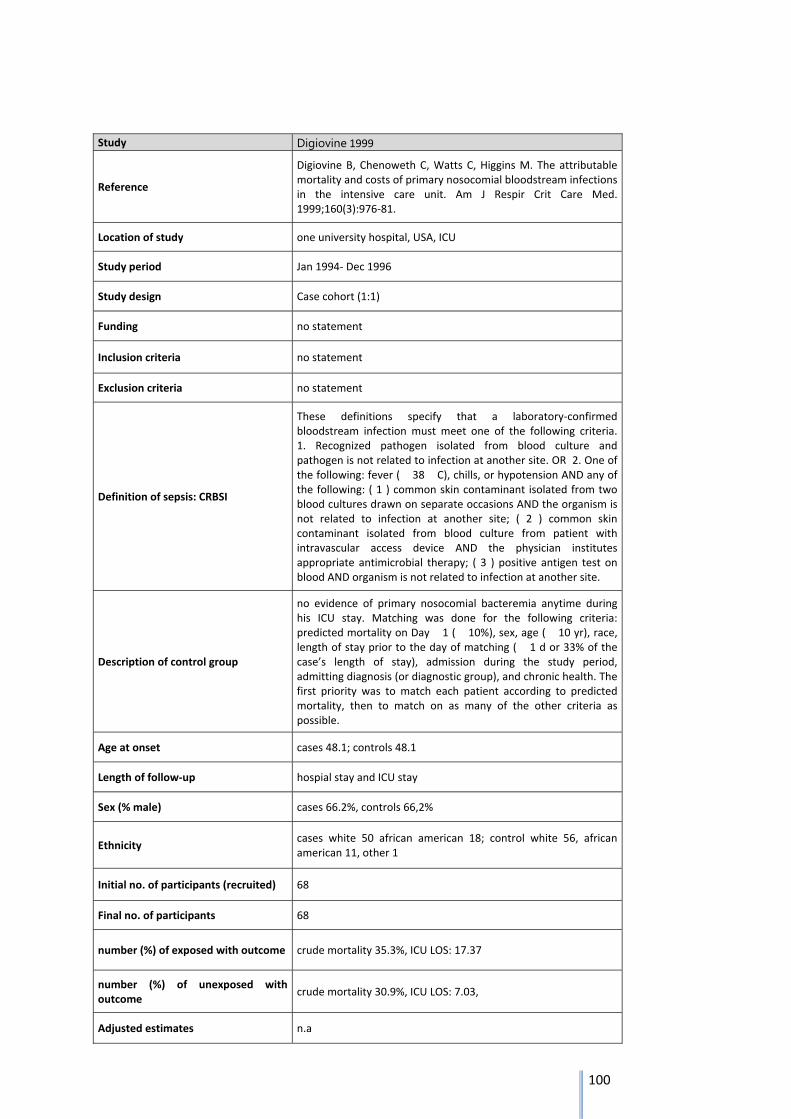
100
Study Digiovine 1999
Reference
Digiovine B, Chenoweth C, Watts C, Higgins M. The attributable mortality and costs of primary nosocomial bloodstream infections in the intensive care unit. Am J Respir Crit Care Med. 1999;160(3):976‐81.
Location of study one university hospital, USA, ICU
Study period Jan 1994‐ Dec 1996
Study design Case cohort (1:1)
Funding no statement
Inclusion criteria no statement
Exclusion criteria no statement
Definition of sepsis: CRBSI
These definitions specify that a laboratory‐confirmed bloodstream infection must meet one of the following criteria. 1. Recognized pathogen isolated from blood culture and pathogen is not related to infection at another site. OR 2. One of the following: fever ( � 38 � C), chills, or hypotension AND any of the following: ( 1 ) common skin contaminant isolated from two blood cultures drawn on separate occasions AND the organism is not related to infection at another site; ( 2 ) common skin contaminant isolated from blood culture from patient with intravascular access device AND the physician institutes appropriate antimicrobial therapy; ( 3 ) positive antigen test on blood AND organism is not related to infection at another site.
Description of control group
no evidence of primary nosocomial bacteremia anytime during his ICU stay. Matching was done for the following criteria: predicted mortality on Day � 1 ( � 10%), sex, age ( � 10 yr), race, length of stay prior to the day of matching ( � 1 d or 33% of the case’s length of stay), admission during the study period, admitting diagnosis (or diagnostic group), and chronic health. The first priority was to match each patient according to predicted mortality, then to match on as many of the other criteria as possible.
Age at onset cases 48.1; controls 48.1
Length of follow‐up hospial stay and ICU stay
Sex (% male) cases 66.2%, controls 66,2%
Ethnicity cases white 50 african american 18; control white 56, african american 11, other 1
Initial no. of participants (recruited) 68
Final no. of participants 68
number (%) of exposed with outcome crude mortality 35.3%, ICU LOS: 17.37
number (%) of unexposed with outcome
crude mortality 30.9%, ICU LOS: 7.03,
Adjusted estimates n.a
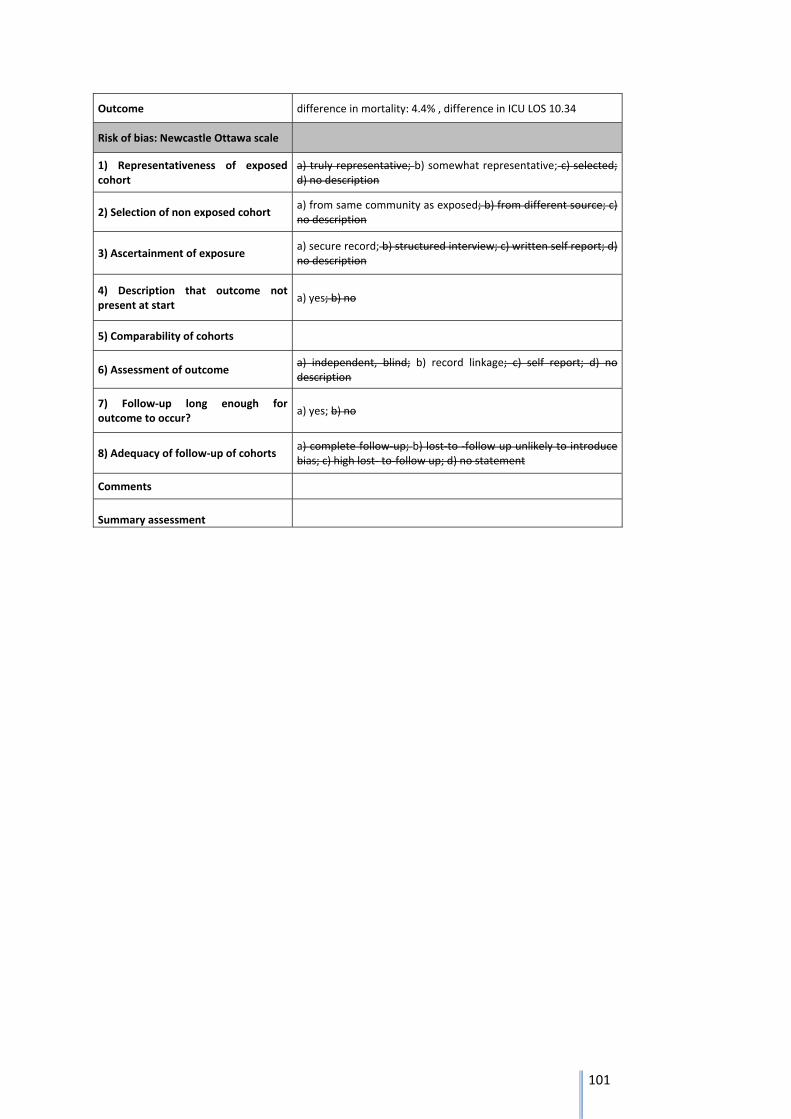
101
Outcome difference in mortality: 4.4% , difference in ICU LOS 10.34
Risk of bias: Newcastle Ottawa scale
1) Representativeness of exposed cohort
a) truly representative; b) somewhat representative; c) selected; d) no description
2) Selection of non exposed cohort a) from same community as exposed; b) from different source; c) no description
3) Ascertainment of exposure a) secure record; b) structured interview; c) written self report; d) no description
4) Description that outcome not present at start
a) yes; b) no
5) Comparability of cohorts
6) Assessment of outcome a) independent, blind; b) record linkage; c) self report; d) no description
7) Follow‐up long enough for outcome to occur?
a) yes; b) no
8) Adequacy of follow‐up of cohorts a) complete follow‐up; b) lost‐to ‐follow up unlikely to introduce bias; c) high lost‐ to‐follow up; d) no statement
Comments
Summary assessment
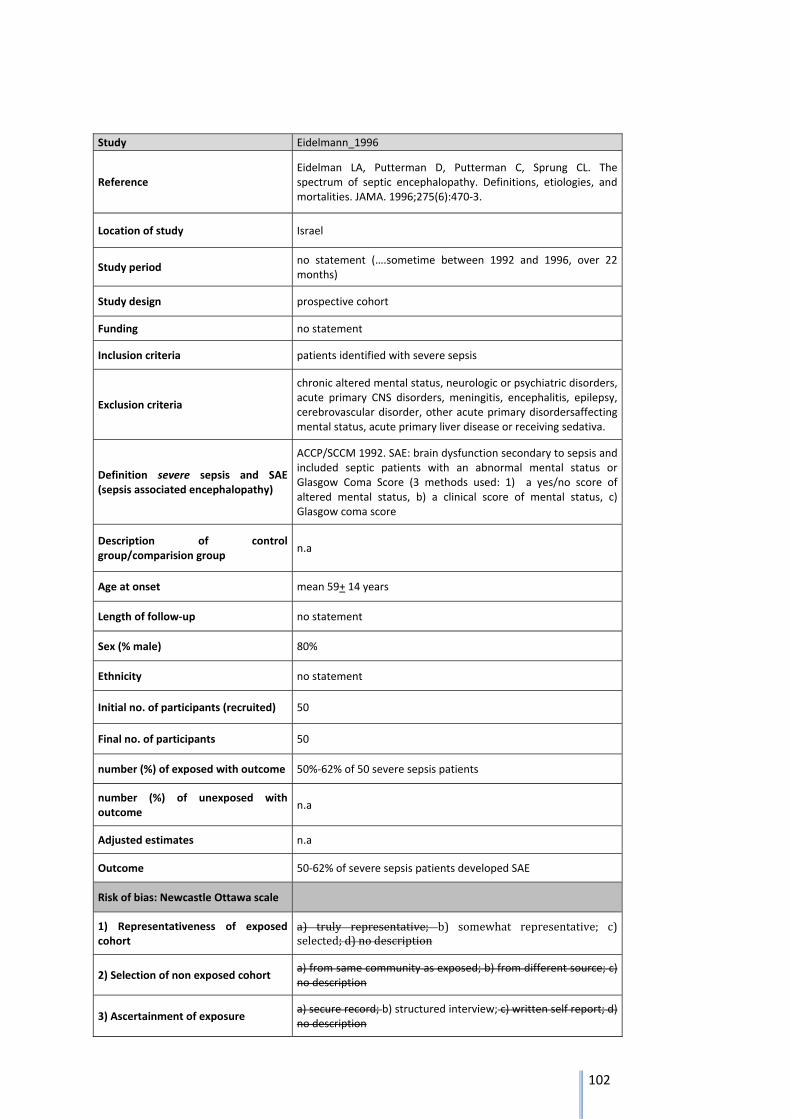
102
Study Eidelmann_1996
Reference Eidelman LA, Putterman D, Putterman C, Sprung CL. The spectrum of septic encephalopathy. Definitions, etiologies, and mortalities. JAMA. 1996;275(6):470‐3.
Location of study Israel
Study period no statement (….sometime between 1992 and 1996, over 22 months)
Study design prospective cohort
Funding no statement
Inclusion criteria patients identified with severe sepsis
Exclusion criteria
chronic altered mental status, neurologic or psychiatric disorders, acute primary CNS disorders, meningitis, encephalitis, epilepsy, cerebrovascular disorder, other acute primary disordersaffecting mental status, acute primary liver disease or receiving sedativa.
Definition severe sepsis and SAE (sepsis associated encephalopathy)
ACCP/SCCM 1992. SAE: brain dysfunction secondary to sepsis and included septic patients with an abnormal mental status or Glasgow Coma Score (3 methods used: 1) a yes/no score of altered mental status, b) a clinical score of mental status, c) Glasgow coma score
Description of control group/comparision group
n.a
Age at onset mean 59+ 14 years
Length of follow‐up no statement
Sex (% male) 80%
Ethnicity no statement
Initial no. of participants (recruited) 50
Final no. of participants 50
number (%) of exposed with outcome 50%‐62% of 50 severe sepsis patients
number (%) of unexposed with outcome
n.a
Adjusted estimates n.a
Outcome 50‐62% of severe sepsis patients developed SAE
Risk of bias: Newcastle Ottawa scale
1) Representativeness of exposed cohort
a) truly representative; b) somewhat representative; c)selected;d)nodescription
2) Selection of non exposed cohort a) from same community as exposed; b) from different source; c) no description
3) Ascertainment of exposure a) secure record; b) structured interview; c) written self report; d) no description
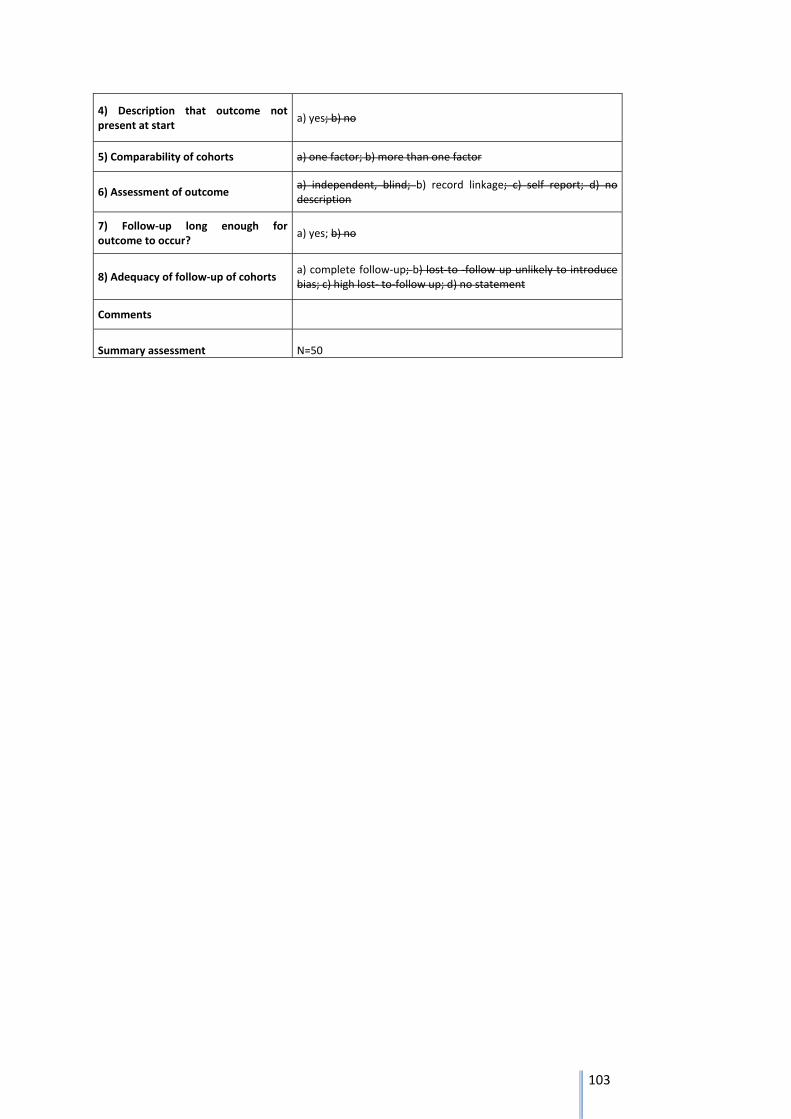
103
4) Description that outcome not present at start
a) yes; b) no
5) Comparability of cohorts a) one factor; b) more than one factor
6) Assessment of outcome a) independent, blind; b) record linkage; c) self report; d) no description
7) Follow‐up long enough for outcome to occur?
a) yes; b) no
8) Adequacy of follow‐up of cohorts a) complete follow‐up; b) lost‐to ‐follow up unlikely to introduce bias; c) high lost‐ to‐follow up; d) no statement
Comments
Summary assessment N=50
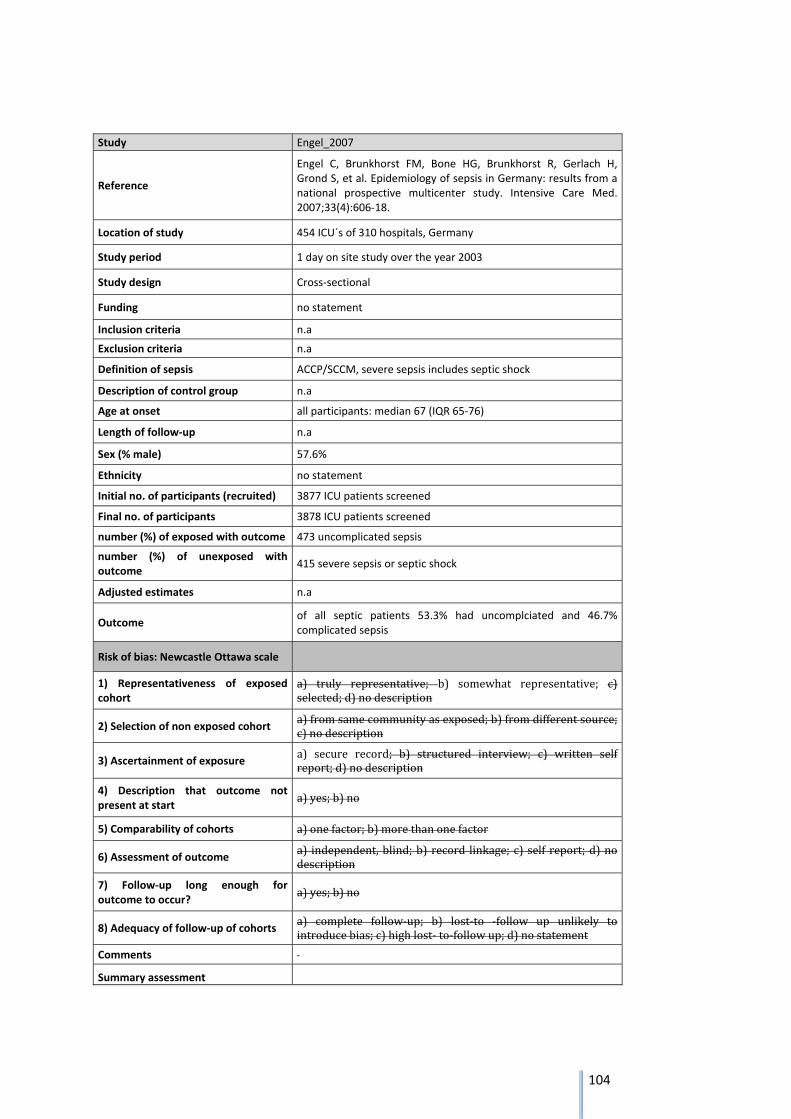
104
Study Engel_2007
Reference
Engel C, Brunkhorst FM, Bone HG, Brunkhorst R, Gerlach H, Grond S, et al. Epidemiology of sepsis in Germany: results from a national prospective multicenter study. Intensive Care Med. 2007;33(4):606‐18.
Location of study 454 ICU´s of 310 hospitals, Germany
Study period 1 day on site study over the year 2003
Study design Cross‐sectional
Funding no statement
Inclusion criteria n.a
Exclusion criteria n.a
Definition of sepsis ACCP/SCCM, severe sepsis includes septic shock
Description of control group n.a
Age at onset all participants: median 67 (IQR 65‐76)
Length of follow‐up n.a
Sex (% male) 57.6%
Ethnicity no statement
Initial no. of participants (recruited) 3877 ICU patients screened
Final no. of participants 3878 ICU patients screened
number (%) of exposed with outcome 473 uncomplicated sepsis
number (%) of unexposed with outcome
415 severe sepsis or septic shock
Adjusted estimates n.a
Outcome of all septic patients 53.3% had uncomplciated and 46.7% complicated sepsis
Risk of bias: Newcastle Ottawa scale
1) Representativeness of exposed cohort
a) truly representative; b) somewhat representative; c)selected;d)nodescription
2) Selection of non exposed cohort a)fromsamecommunityasexposed;b)fromdifferentsource;c)nodescription
3) Ascertainment of exposure a) secure record; b) structured interview; c) written selfreport;d)nodescription
4) Description that outcome not present at start
a)yes;b)no
5) Comparability of cohorts a)onefactor;b)morethanonefactor
6) Assessment of outcome a) independent,blind;b) record linkage; c) self report;d)nodescription
7) Follow‐up long enough for outcome to occur?
a)yes;b)no
8) Adequacy of follow‐up of cohorts a) complete follow‐up; b) lost‐to ‐follow up unlikely tointroducebias;c)highlost‐to‐followup;d)nostatement
Comments
Summary assessment
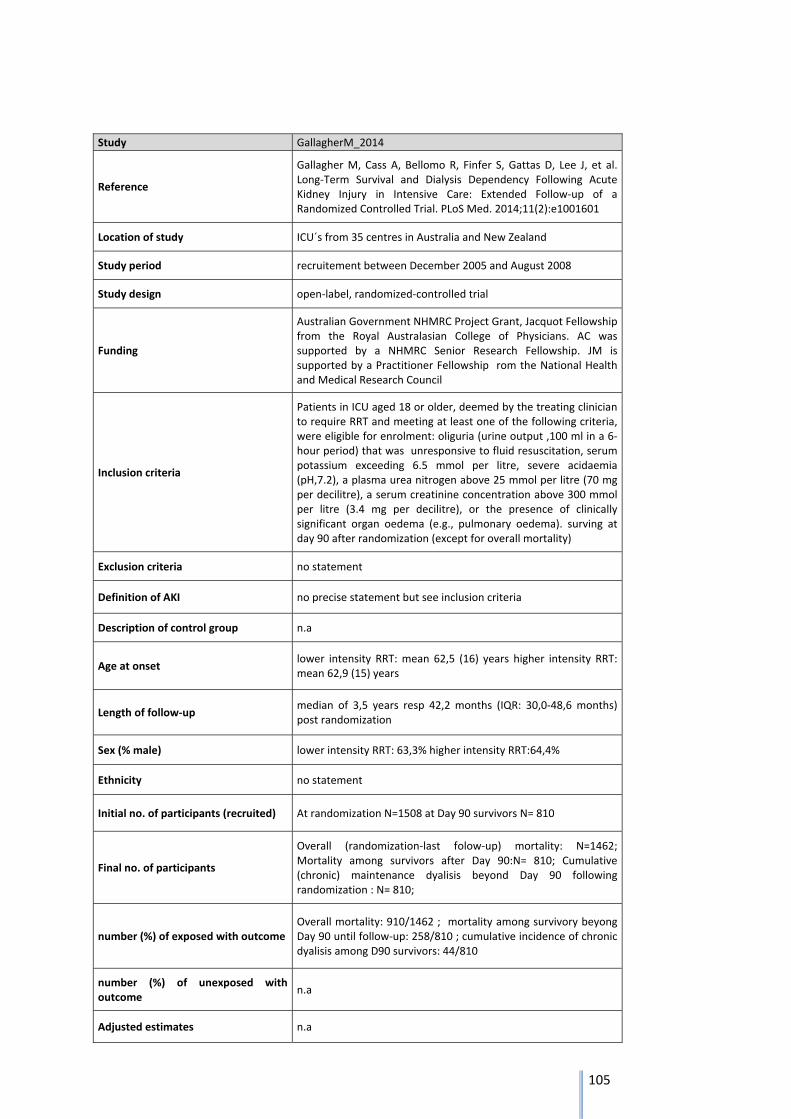
105
Study GallagherM_2014
Reference
Gallagher M, Cass A, Bellomo R, Finfer S, Gattas D, Lee J, et al. Long‐Term Survival and Dialysis Dependency Following Acute Kidney Injury in Intensive Care: Extended Follow‐up of a Randomized Controlled Trial. PLoS Med. 2014;11(2):e1001601
Location of study ICU´s from 35 centres in Australia and New Zealand
Study period recruitement between December 2005 and August 2008
Study design open‐label, randomized‐controlled trial
Funding
Australian Government NHMRC Project Grant, Jacquot Fellowship from the Royal Australasian College of Physicians. AC was supported by a NHMRC Senior Research Fellowship. JM is supported by a Practitioner Fellowship rom the National Health and Medical Research Council
Inclusion criteria
Patients in ICU aged 18 or older, deemed by the treating clinician to require RRT and meeting at least one of the following criteria, were eligible for enrolment: oliguria (urine output ,100 ml in a 6‐hour period) that was unresponsive to fluid resuscitation, serum potassium exceeding 6.5 mmol per litre, severe acidaemia (pH,7.2), a plasma urea nitrogen above 25 mmol per litre (70 mg per decilitre), a serum creatinine concentration above 300 mmol per litre (3.4 mg per decilitre), or the presence of clinically significant organ oedema (e.g., pulmonary oedema). surving at day 90 after randomization (except for overall mortality)
Exclusion criteria no statement
Definition of AKI no precise statement but see inclusion criteria
Description of control group n.a
Age at onset lower intensity RRT: mean 62,5 (16) years higher intensity RRT: mean 62,9 (15) years
Length of follow‐up median of 3,5 years resp 42,2 months (IQR: 30,0‐48,6 months) post randomization
Sex (% male) lower intensity RRT: 63,3% higher intensity RRT:64,4%
Ethnicity no statement
Initial no. of participants (recruited) At randomization N=1508 at Day 90 survivors N= 810
Final no. of participants
Overall (randomization‐last folow‐up) mortality: N=1462; Mortality among survivors after Day 90:N= 810; Cumulative (chronic) maintenance dyalisis beyond Day 90 following randomization : N= 810;
number (%) of exposed with outcome Overall mortality: 910/1462 ; mortality among survivory beyong Day 90 until follow‐up: 258/810 ; cumulative incidence of chronic dyalisis among D90 survivors: 44/810
number (%) of unexposed with outcome
n.a
Adjusted estimates n.a
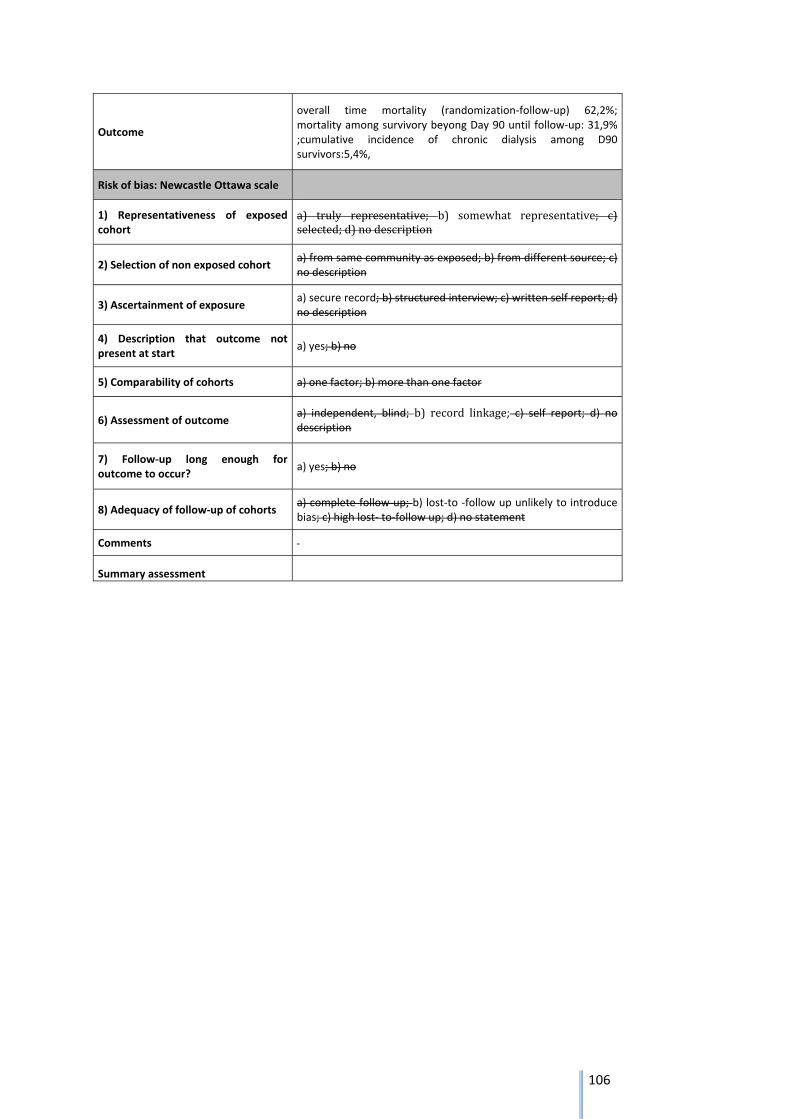
106
Outcome
overall time mortality (randomization‐follow‐up) 62,2%; mortality among survivory beyong Day 90 until follow‐up: 31,9% ;cumulative incidence of chronic dialysis among D90 survivors:5,4%,
Risk of bias: Newcastle Ottawa scale
1) Representativeness of exposed cohort
a) truly representative; b) somewhat representative; c)selected;d)nodescription
2) Selection of non exposed cohort a) from same community as exposed; b) from different source; c) no description
3) Ascertainment of exposure a) secure record; b) structured interview; c) written self report; d) no description
4) Description that outcome not present at start
a) yes; b) no
5) Comparability of cohorts a) one factor; b) more than one factor
6) Assessment of outcome a) independent, blind; b) record linkage; c) self report; d) no description
7) Follow‐up long enough for outcome to occur?
a) yes; b) no
8) Adequacy of follow‐up of cohorts a) complete follow‐up; b) lost‐to ‐follow up unlikely to introduce bias; c) high lost‐ to‐follow up; d) no statement
Comments
Summary assessment
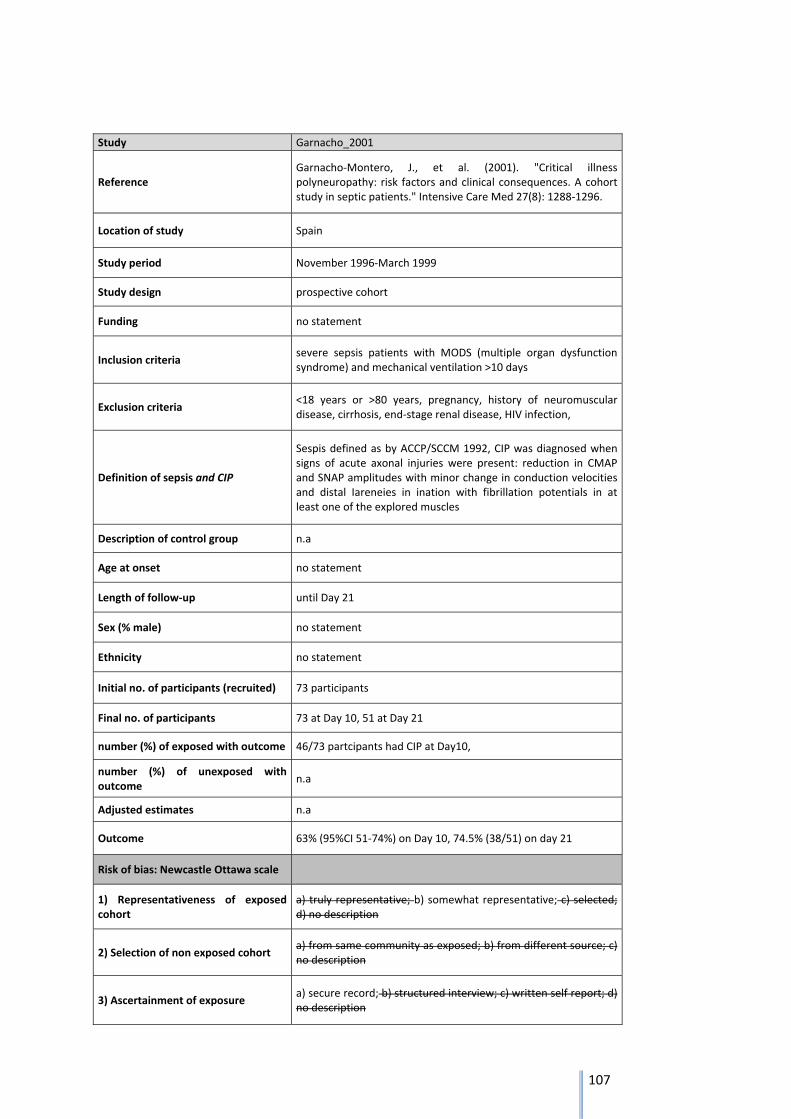
107
Study Garnacho_2001
Reference Garnacho‐Montero, J., et al. (2001). "Critical illness polyneuropathy: risk factors and clinical consequences. A cohort study in septic patients." Intensive Care Med 27(8): 1288‐1296.
Location of study Spain
Study period November 1996‐March 1999
Study design prospective cohort
Funding no statement
Inclusion criteria severe sepsis patients with MODS (multiple organ dysfunction syndrome) and mechanical ventilation >10 days
Exclusion criteria <18 years or >80 years, pregnancy, history of neuromuscular disease, cirrhosis, end‐stage renal disease, HIV infection,
Definition of sepsis and CIP
Sespis defined as by ACCP/SCCM 1992, CIP was diagnosed when signs of acute axonal injuries were present: reduction in CMAP and SNAP amplitudes with minor change in conduction velocities and distal Iareneies in ination with fibrillation potentials in at least one of the explored muscles
Description of control group n.a
Age at onset no statement
Length of follow‐up until Day 21
Sex (% male) no statement
Ethnicity no statement
Initial no. of participants (recruited) 73 participants
Final no. of participants 73 at Day 10, 51 at Day 21
number (%) of exposed with outcome 46/73 partcipants had CIP at Day10,
number (%) of unexposed with outcome
n.a
Adjusted estimates n.a
Outcome 63% (95%CI 51‐74%) on Day 10, 74.5% (38/51) on day 21
Risk of bias: Newcastle Ottawa scale
1) Representativeness of exposed cohort
a) truly representative; b) somewhat representative; c) selected; d) no description
2) Selection of non exposed cohort a) from same community as exposed; b) from different source; c) no description
3) Ascertainment of exposure a) secure record; b) structured interview; c) written self report; d) no description
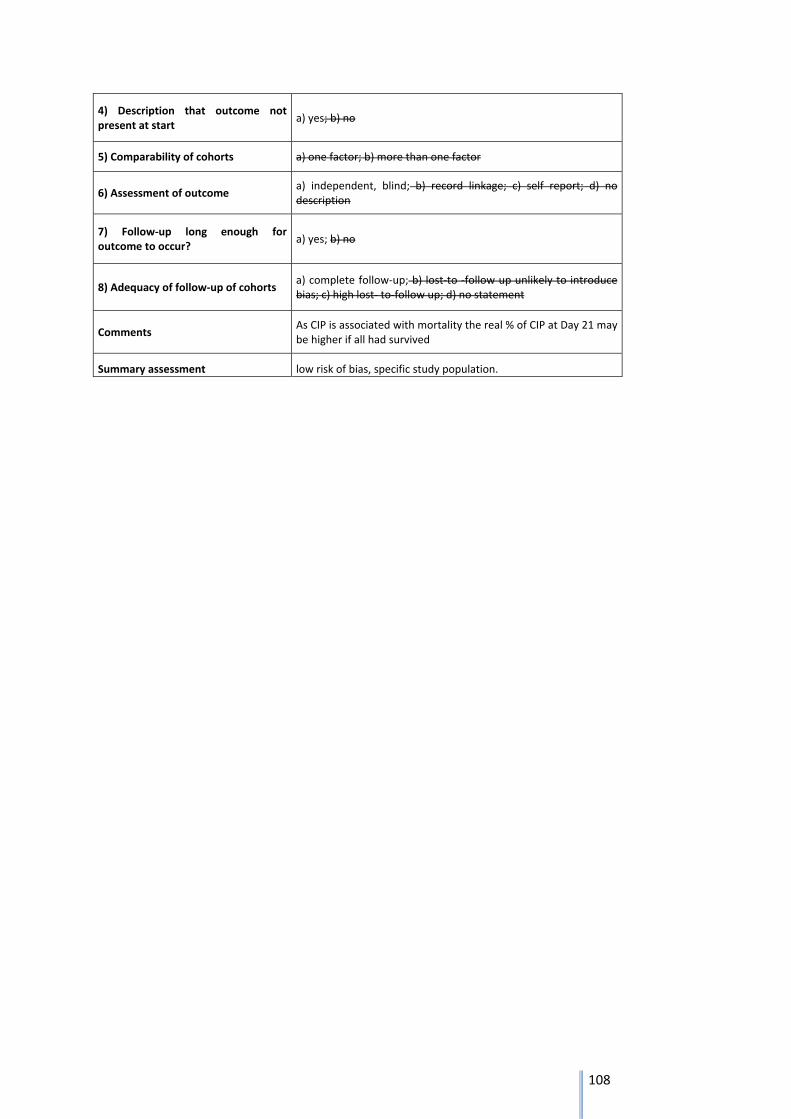
108
4) Description that outcome not present at start
a) yes; b) no
5) Comparability of cohorts a) one factor; b) more than one factor
6) Assessment of outcome a) independent, blind; b) record linkage; c) self report; d) no description
7) Follow‐up long enough for outcome to occur?
a) yes; b) no
8) Adequacy of follow‐up of cohorts a) complete follow‐up; b) lost‐to ‐follow up unlikely to introduce bias; c) high lost‐ to‐follow up; d) no statement
Comments As CIP is associated with mortality the real % of CIP at Day 21 may be higher if all had survived
Summary assessment low risk of bias, specific study population.
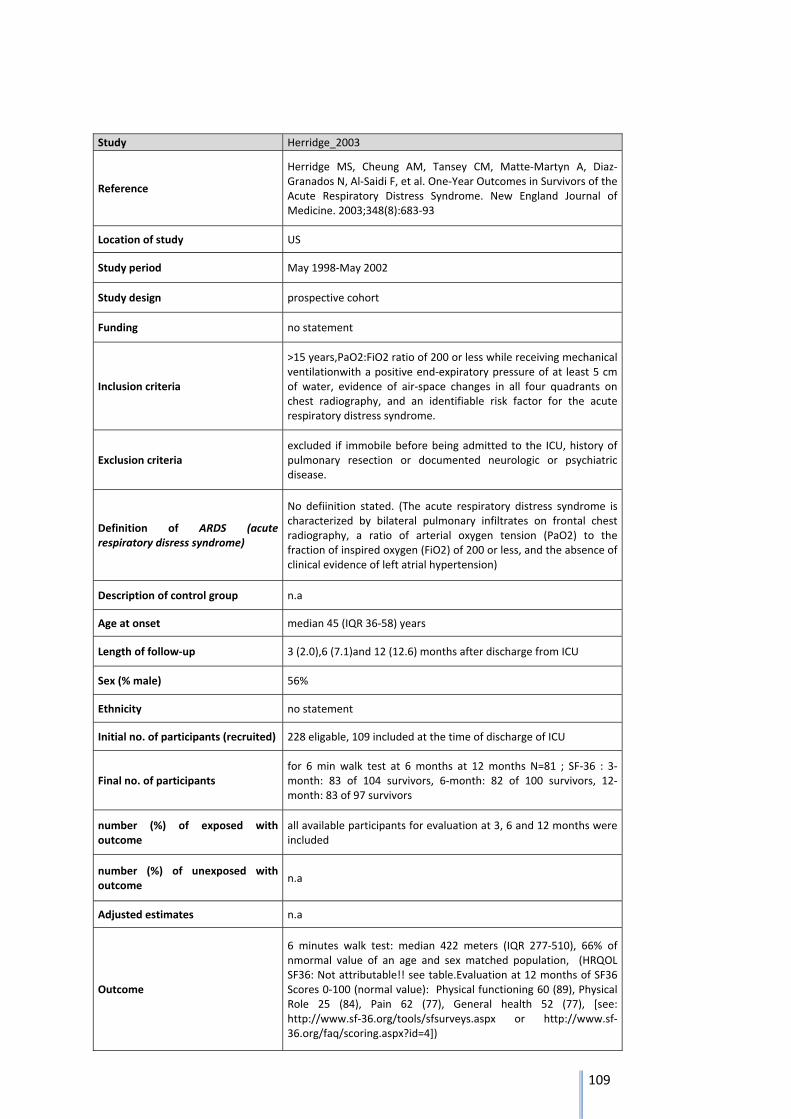
109
Study Herridge_2003
Reference
Herridge MS, Cheung AM, Tansey CM, Matte‐Martyn A, Diaz‐Granados N, Al‐Saidi F, et al. One‐Year Outcomes in Survivors of the Acute Respiratory Distress Syndrome. New England Journal of Medicine. 2003;348(8):683‐93
Location of study US
Study period May 1998‐May 2002
Study design prospective cohort
Funding no statement
Inclusion criteria
>15 years,PaO2:FiO2 ratio of 200 or less while receiving mechanical ventilationwith a positive end‐expiratory pressure of at least 5 cm of water, evidence of air‐space changes in all four quadrants on chest radiography, and an identifiable risk factor for the acute respiratory distress syndrome.
Exclusion criteria excluded if immobile before being admitted to the ICU, history of pulmonary resection or documented neurologic or psychiatric disease.
Definition of ARDS (acute respiratory disress syndrome)
No defiinition stated. (The acute respiratory distress syndrome is characterized by bilateral pulmonary infiltrates on frontal chest radiography, a ratio of arterial oxygen tension (PaO2) to the fraction of inspired oxygen (FiO2) of 200 or less, and the absence of clinical evidence of left atrial hypertension)
Description of control group n.a
Age at onset median 45 (IQR 36‐58) years
Length of follow‐up 3 (2.0),6 (7.1)and 12 (12.6) months after discharge from ICU
Sex (% male) 56%
Ethnicity no statement
Initial no. of participants (recruited) 228 eligable, 109 included at the time of discharge of ICU
Final no. of participants for 6 min walk test at 6 months at 12 months N=81 ; SF‐36 : 3‐month: 83 of 104 survivors, 6‐month: 82 of 100 survivors, 12‐month: 83 of 97 survivors
number (%) of exposed with outcome
all available participants for evaluation at 3, 6 and 12 months were included
number (%) of unexposed with outcome
n.a
Adjusted estimates n.a
Outcome
6 minutes walk test: median 422 meters (IQR 277‐510), 66% of nmormal value of an age and sex matched population, (HRQOL SF36: Not attributable!! see table.Evaluation at 12 months of SF36 Scores 0‐100 (normal value): Physical functioning 60 (89), Physical Role 25 (84), Pain 62 (77), General health 52 (77), [see: http://www.sf‐36.org/tools/sfsurveys.aspx or http://www.sf‐36.org/faq/scoring.aspx?id=4])
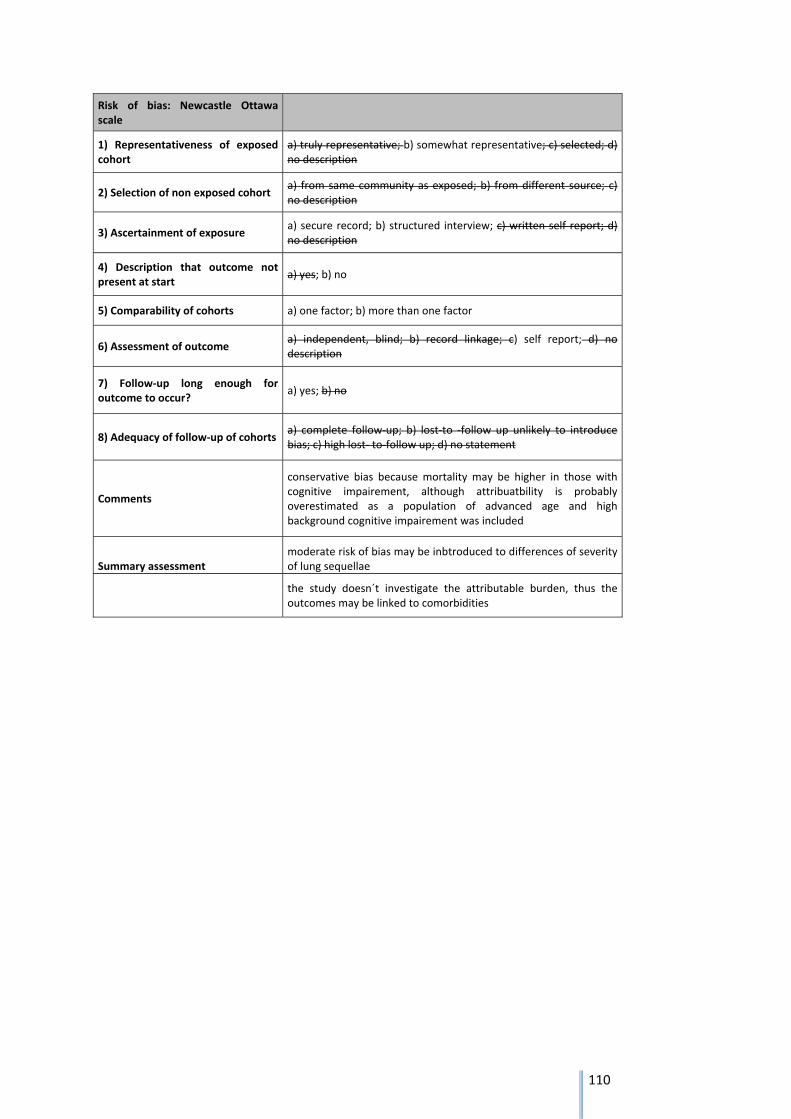
110
Risk of bias: Newcastle Ottawa scale
1) Representativeness of exposed cohort
a) truly representative; b) somewhat representative; c) selected; d) no description
2) Selection of non exposed cohort a) from same community as exposed; b) from different source; c) no description
3) Ascertainment of exposure a) secure record; b) structured interview; c) written self report; d) no description
4) Description that outcome not present at start
a) yes; b) no
5) Comparability of cohorts a) one factor; b) more than one factor
6) Assessment of outcome a) independent, blind; b) record linkage; c) self report; d) no description
7) Follow‐up long enough for outcome to occur?
a) yes; b) no
8) Adequacy of follow‐up of cohorts a) complete follow‐up; b) lost‐to ‐follow up unlikely to introduce bias; c) high lost‐ to‐follow up; d) no statement
Comments
conservative bias because mortality may be higher in those with cognitive impairement, although attribuatbility is probably overestimated as a population of advanced age and high background cognitive impairement was included
Summary assessment moderate risk of bias may be inbtroduced to differences of severity of lung sequellae
the study doesn´t investigate the attributable burden, thus the outcomes may be linked to comorbidities
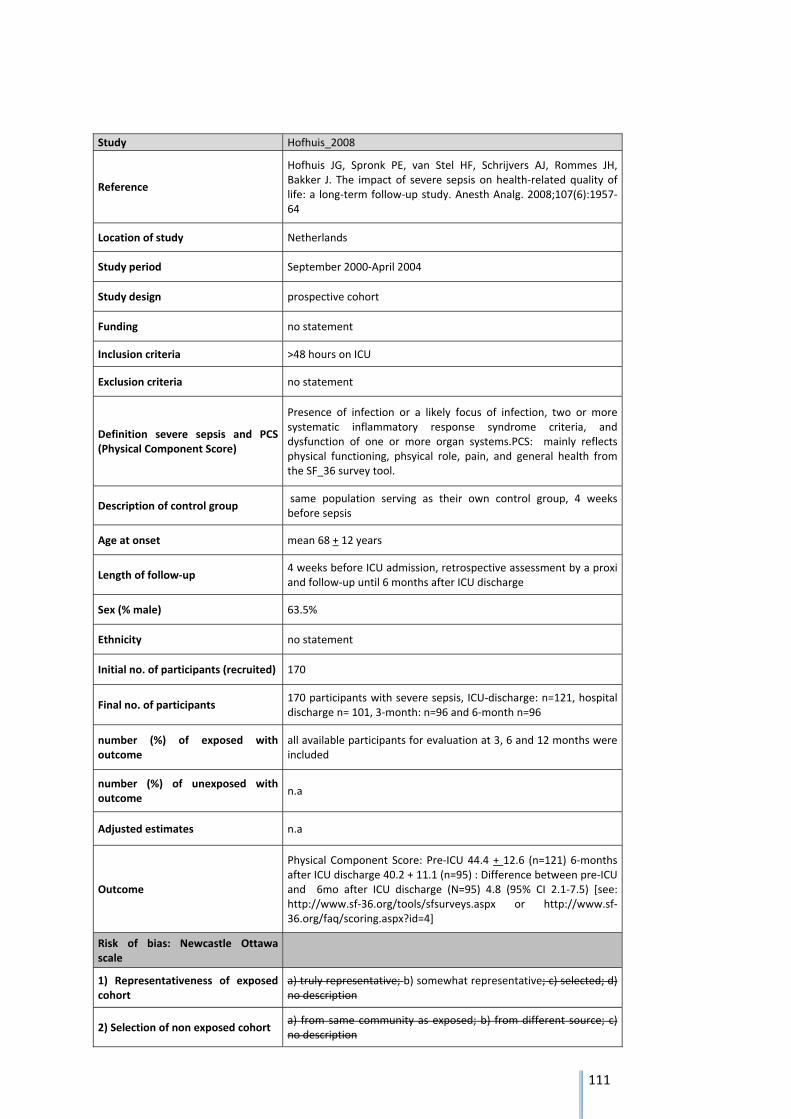
111
Study Hofhuis_2008
Reference
Hofhuis JG, Spronk PE, van Stel HF, Schrijvers AJ, Rommes JH, Bakker J. The impact of severe sepsis on health‐related quality of life: a long‐term follow‐up study. Anesth Analg. 2008;107(6):1957‐64
Location of study Netherlands
Study period September 2000‐April 2004
Study design prospective cohort
Funding no statement
Inclusion criteria >48 hours on ICU
Exclusion criteria no statement
Definition severe sepsis and PCS (Physical Component Score)
Presence of infection or a likely focus of infection, two or more systematic inflammatory response syndrome criteria, and dysfunction of one or more organ systems.PCS: mainly reflects physical functioning, phsyical role, pain, and general health from the SF_36 survey tool.
Description of control group same population serving as their own control group, 4 weeks before sepsis
Age at onset mean 68 + 12 years
Length of follow‐up 4 weeks before ICU admission, retrospective assessment by a proxi and follow‐up until 6 months after ICU discharge
Sex (% male) 63.5%
Ethnicity no statement
Initial no. of participants (recruited) 170
Final no. of participants 170 participants with severe sepsis, ICU‐discharge: n=121, hospital discharge n= 101, 3‐month: n=96 and 6‐month n=96
number (%) of exposed with outcome
all available participants for evaluation at 3, 6 and 12 months were included
number (%) of unexposed with outcome
n.a
Adjusted estimates n.a
Outcome
Physical Component Score: Pre‐ICU 44.4 + 12.6 (n=121) 6‐months after ICU discharge 40.2 + 11.1 (n=95) : Difference between pre‐ICU and 6mo after ICU discharge (N=95) 4.8 (95% CI 2.1‐7.5) [see: http://www.sf‐36.org/tools/sfsurveys.aspx or http://www.sf‐36.org/faq/scoring.aspx?id=4]
Risk of bias: Newcastle Ottawa scale
1) Representativeness of exposed cohort
a) truly representative; b) somewhat representative; c) selected; d) no description
2) Selection of non exposed cohort a) from same community as exposed; b) from different source; c) no description
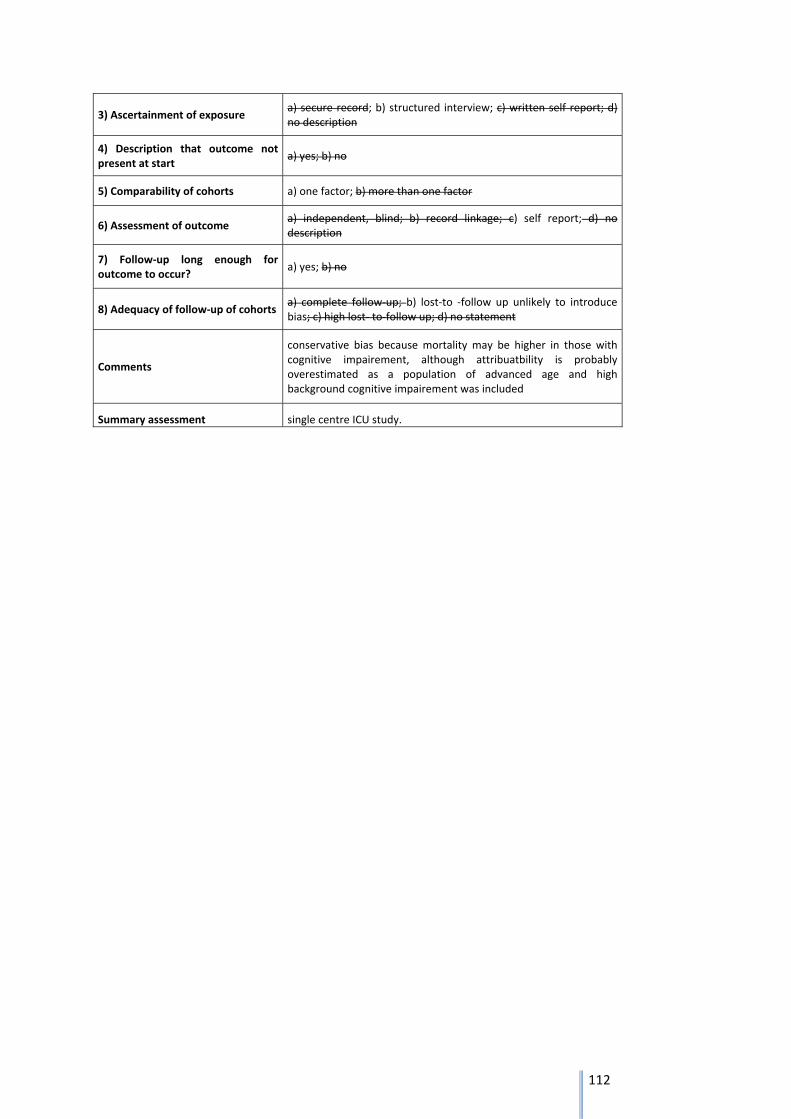
112
3) Ascertainment of exposure a) secure record; b) structured interview; c) written self report; d) no description
4) Description that outcome not present at start
a) yes; b) no
5) Comparability of cohorts a) one factor; b) more than one factor
6) Assessment of outcome a) independent, blind; b) record linkage; c) self report; d) no description
7) Follow‐up long enough for outcome to occur?
a) yes; b) no
8) Adequacy of follow‐up of cohorts a) complete follow‐up; b) lost‐to ‐follow up unlikely to introduce bias; c) high lost‐ to‐follow up; d) no statement
Comments
conservative bias because mortality may be higher in those with cognitive impairement, although attribuatbility is probably overestimated as a population of advanced age and high background cognitive impairement was included
Summary assessment single centre ICU study.
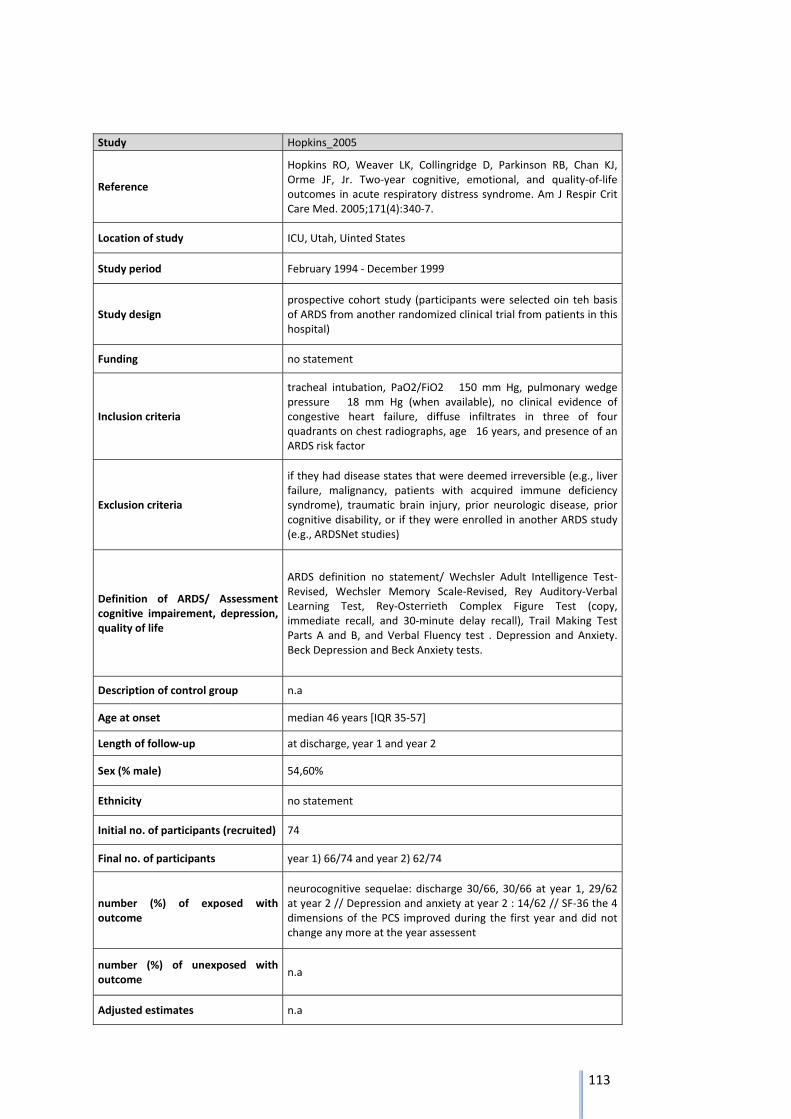
113
Study Hopkins_2005
Reference
Hopkins RO, Weaver LK, Collingridge D, Parkinson RB, Chan KJ, Orme JF, Jr. Two‐year cognitive, emotional, and quality‐of‐life outcomes in acute respiratory distress syndrome. Am J Respir Crit Care Med. 2005;171(4):340‐7.
Location of study ICU, Utah, Uinted States
Study period February 1994 ‐ December 1999
Study design prospective cohort study (participants were selected oin teh basis of ARDS from another randomized clinical trial from patients in this hospital)
Funding no statement
Inclusion criteria
tracheal intubation, PaO2/FiO2 150 mm Hg, pulmonary wedge pressure 18 mm Hg (when available), no clinical evidence of congestive heart failure, diffuse infiltrates in three of four quadrants on chest radiographs, age 16 years, and presence of an ARDS risk factor
Exclusion criteria
if they had disease states that were deemed irreversible (e.g., liver failure, malignancy, patients with acquired immune deficiency syndrome), traumatic brain injury, prior neurologic disease, prior cognitive disability, or if they were enrolled in another ARDS study (e.g., ARDSNet studies)
Definition of ARDS/ Assessment cognitive impairement, depression, quality of life
ARDS definition no statement/ Wechsler Adult Intelligence Test‐Revised, Wechsler Memory Scale‐Revised, Rey Auditory‐Verbal Learning Test, Rey‐Osterrieth Complex Figure Test (copy, immediate recall, and 30‐minute delay recall), Trail Making Test Parts A and B, and Verbal Fluency test . Depression and Anxiety. Beck Depression and Beck Anxiety tests.
Description of control group n.a
Age at onset median 46 years [IQR 35‐57]
Length of follow‐up at discharge, year 1 and year 2
Sex (% male) 54,60%
Ethnicity no statement
Initial no. of participants (recruited) 74
Final no. of participants year 1) 66/74 and year 2) 62/74
number (%) of exposed with outcome
neurocognitive sequelae: discharge 30/66, 30/66 at year 1, 29/62 at year 2 // Depression and anxiety at year 2 : 14/62 // SF‐36 the 4 dimensions of the PCS improved during the first year and did not change any more at the year assessent
number (%) of unexposed with outcome
n.a
Adjusted estimates n.a
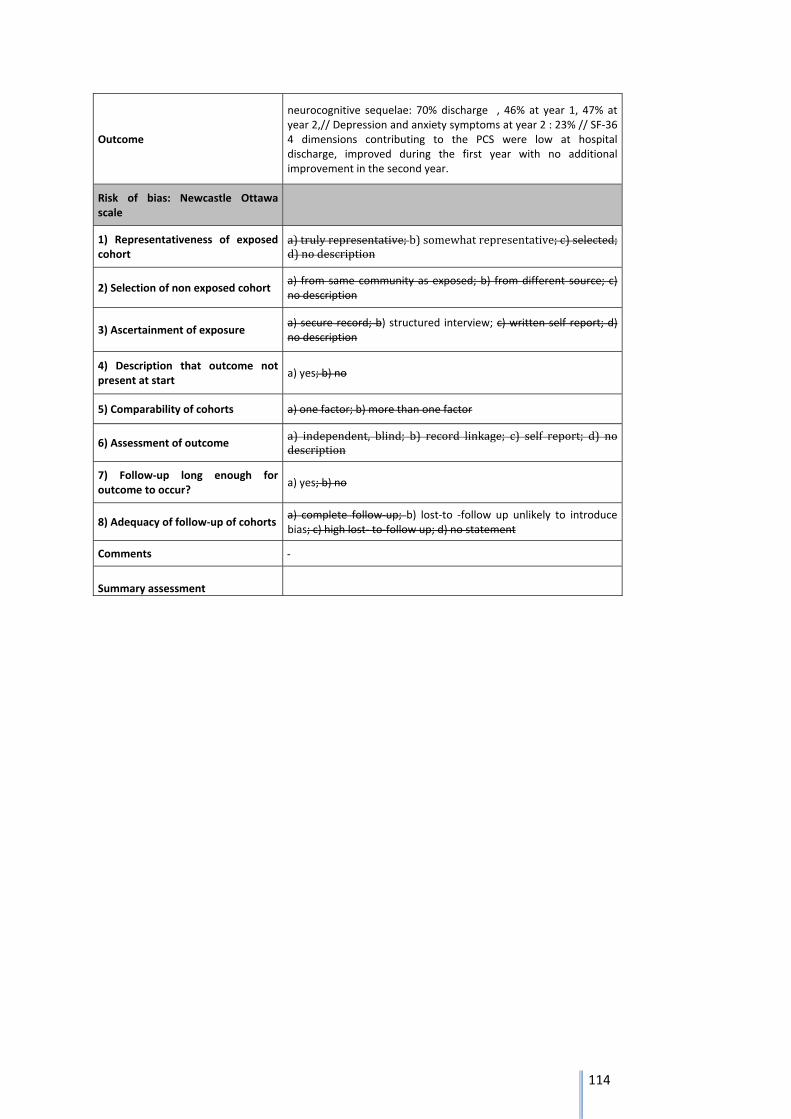
114
Outcome
neurocognitive sequelae: 70% discharge , 46% at year 1, 47% at year 2,// Depression and anxiety symptoms at year 2 : 23% // SF‐36 4 dimensions contributing to the PCS were low at hospital discharge, improved during the first year with no additional improvement in the second year.
Risk of bias: Newcastle Ottawa scale
1) Representativeness of exposed cohort
a)trulyrepresentative;b)somewhatrepresentative;c)selected;d)nodescription
2) Selection of non exposed cohort a) from same community as exposed; b) from different source; c) no description
3) Ascertainment of exposure a) secure record; b) structured interview; c) written self report; d) no description
4) Description that outcome not present at start
a) yes; b) no
5) Comparability of cohorts a) one factor; b) more than one factor
6) Assessment of outcome a) independent, blind; b) record linkage; c) self report; d) nodescription
7) Follow‐up long enough for outcome to occur?
a) yes; b) no
8) Adequacy of follow‐up of cohorts a) complete follow‐up; b) lost‐to ‐follow up unlikely to introduce bias; c) high lost‐ to‐follow up; d) no statement
Comments
Summary assessment
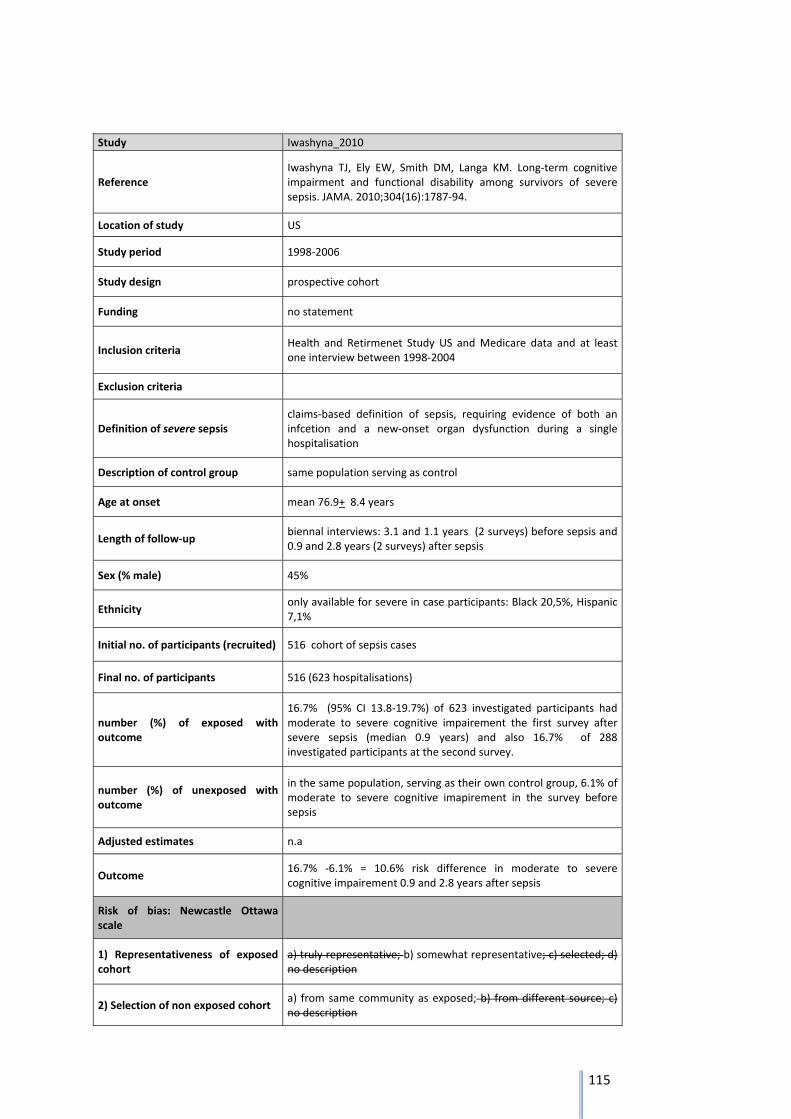
115
Study Iwashyna_2010
Reference Iwashyna TJ, Ely EW, Smith DM, Langa KM. Long‐term cognitive impairment and functional disability among survivors of severe sepsis. JAMA. 2010;304(16):1787‐94.
Location of study US
Study period 1998‐2006
Study design prospective cohort
Funding no statement
Inclusion criteria Health and Retirmenet Study US and Medicare data and at least one interview between 1998‐2004
Exclusion criteria
Definition of severe sepsis claims‐based definition of sepsis, requiring evidence of both an infcetion and a new‐onset organ dysfunction during a single hospitalisation
Description of control group same population serving as control
Age at onset mean 76.9+ 8.4 years
Length of follow‐up biennal interviews: 3.1 and 1.1 years (2 surveys) before sepsis and 0.9 and 2.8 years (2 surveys) after sepsis
Sex (% male) 45%
Ethnicity only available for severe in case participants: Black 20,5%, Hispanic 7,1%
Initial no. of participants (recruited) 516 cohort of sepsis cases
Final no. of participants 516 (623 hospitalisations)
number (%) of exposed with outcome
16.7% (95% CI 13.8‐19.7%) of 623 investigated participants had moderate to severe cognitive impairement the first survey after severe sepsis (median 0.9 years) and also 16.7% of 288 investigated participants at the second survey.
number (%) of unexposed with outcome
in the same population, serving as their own control group, 6.1% of moderate to severe cognitive imapirement in the survey before sepsis
Adjusted estimates n.a
Outcome 16.7% ‐6.1% = 10.6% risk difference in moderate to severe cognitive impairement 0.9 and 2.8 years after sepsis
Risk of bias: Newcastle Ottawa scale
1) Representativeness of exposed cohort
a) truly representative; b) somewhat representative; c) selected; d) no description
2) Selection of non exposed cohort a) from same community as exposed; b) from different source; c) no description
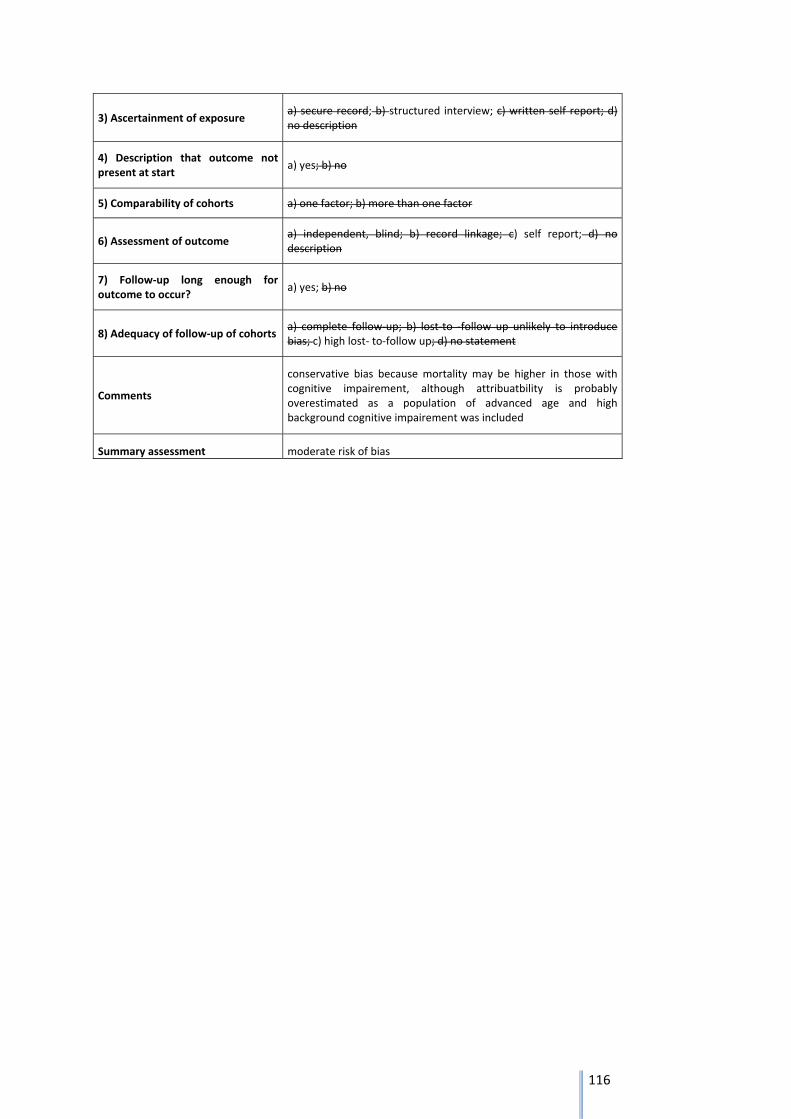
116
3) Ascertainment of exposure a) secure record; b) structured interview; c) written self report; d) no description
4) Description that outcome not present at start
a) yes; b) no
5) Comparability of cohorts a) one factor; b) more than one factor
6) Assessment of outcome a) independent, blind; b) record linkage; c) self report; d) no description
7) Follow‐up long enough for outcome to occur?
a) yes; b) no
8) Adequacy of follow‐up of cohorts a) complete follow‐up; b) lost‐to ‐follow up unlikely to introduce bias; c) high lost‐ to‐follow up; d) no statement
Comments
conservative bias because mortality may be higher in those with cognitive impairement, although attribuatbility is probably overestimated as a population of advanced age and high background cognitive impairement was included
Summary assessment moderate risk of bias
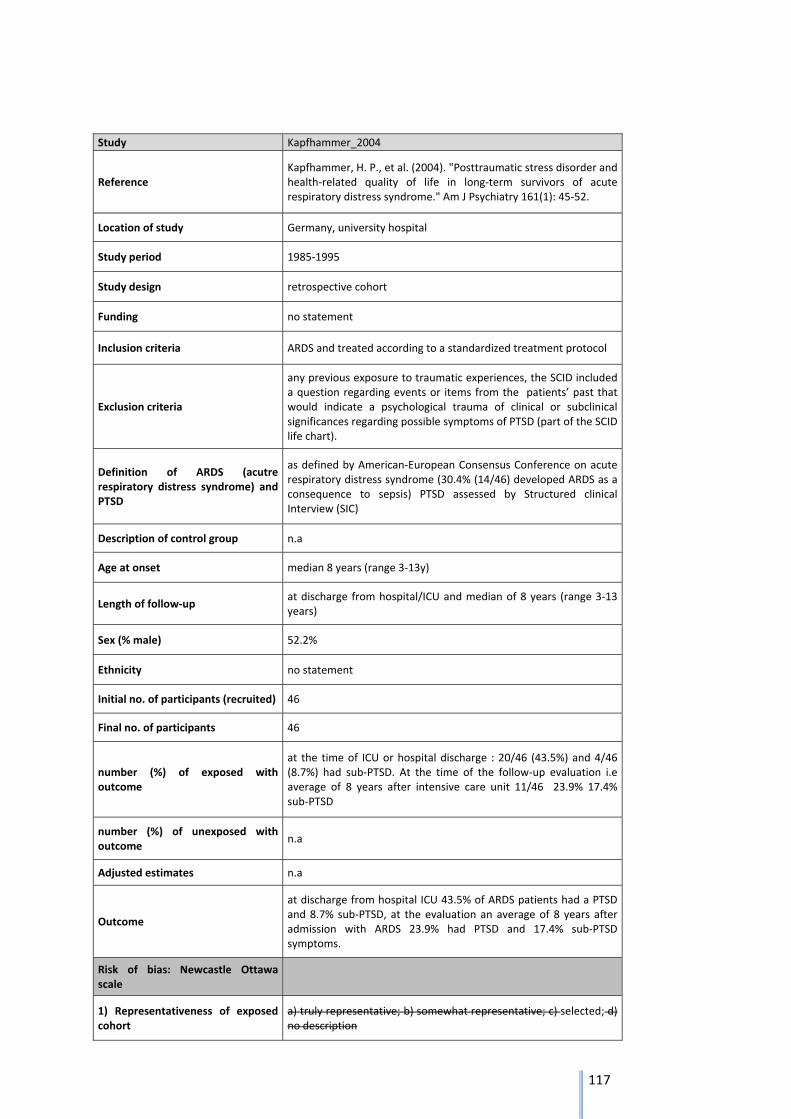
117
Study Kapfhammer_2004
Reference Kapfhammer, H. P., et al. (2004). "Posttraumatic stress disorder and health‐related quality of life in long‐term survivors of acute respiratory distress syndrome." Am J Psychiatry 161(1): 45‐52.
Location of study Germany, university hospital
Study period 1985‐1995
Study design retrospective cohort
Funding no statement
Inclusion criteria ARDS and treated according to a standardized treatment protocol
Exclusion criteria
any previous exposure to traumatic experiences, the SCID included a question regarding events or items from the patients’ past that would indicate a psychological trauma of clinical or subclinical significances regarding possible symptoms of PTSD (part of the SCID life chart).
Definition of ARDS (acutre respiratory distress syndrome) and PTSD
as defined by American‐European Consensus Conference on acute respiratory distress syndrome (30.4% (14/46) developed ARDS as a consequence to sepsis) PTSD assessed by Structured clinical Interview (SIC)
Description of control group n.a
Age at onset median 8 years (range 3‐13y)
Length of follow‐up at discharge from hospital/ICU and median of 8 years (range 3‐13 years)
Sex (% male) 52.2%
Ethnicity no statement
Initial no. of participants (recruited) 46
Final no. of participants 46
number (%) of exposed with outcome
at the time of ICU or hospital discharge : 20/46 (43.5%) and 4/46 (8.7%) had sub‐PTSD. At the time of the follow‐up evaluation i.e average of 8 years after intensive care unit 11/46 23.9% 17.4% sub‐PTSD
number (%) of unexposed with outcome
n.a
Adjusted estimates n.a
Outcome
at discharge from hospital ICU 43.5% of ARDS patients had a PTSD and 8.7% sub‐PTSD, at the evaluation an average of 8 years after admission with ARDS 23.9% had PTSD and 17.4% sub‐PTSD symptoms.
Risk of bias: Newcastle Ottawa scale
1) Representativeness of exposed cohort
a) truly representative; b) somewhat representative; c) selected; d) no description
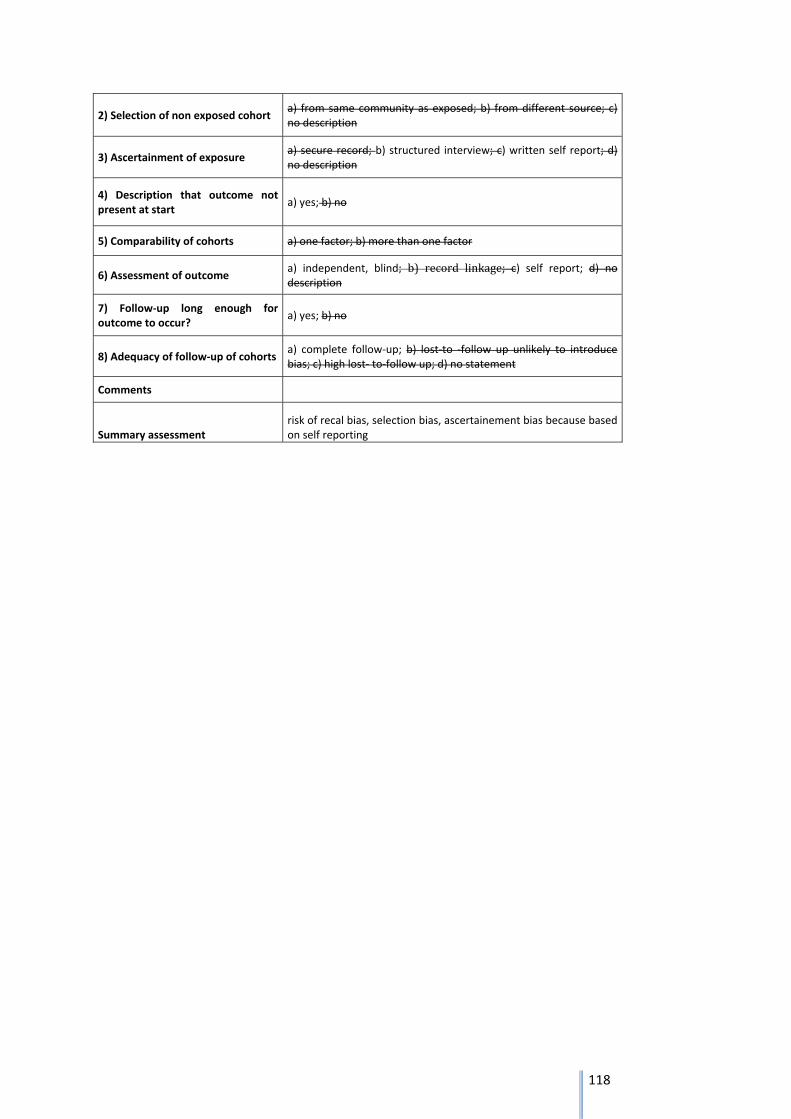
118
2) Selection of non exposed cohort a) from same community as exposed; b) from different source; c) no description
3) Ascertainment of exposure a) secure record; b) structured interview; c) written self report; d) no description
4) Description that outcome not present at start
a) yes; b) no
5) Comparability of cohorts a) one factor; b) more than one factor
6) Assessment of outcome a) independent, blind; b) record linkage; c) self report; d) no description
7) Follow‐up long enough for outcome to occur?
a) yes; b) no
8) Adequacy of follow‐up of cohorts a) complete follow‐up; b) lost‐to ‐follow up unlikely to introduce bias; c) high lost‐ to‐follow up; d) no statement
Comments
Summary assessment risk of recal bias, selection bias, ascertainement bias because based on self reporting
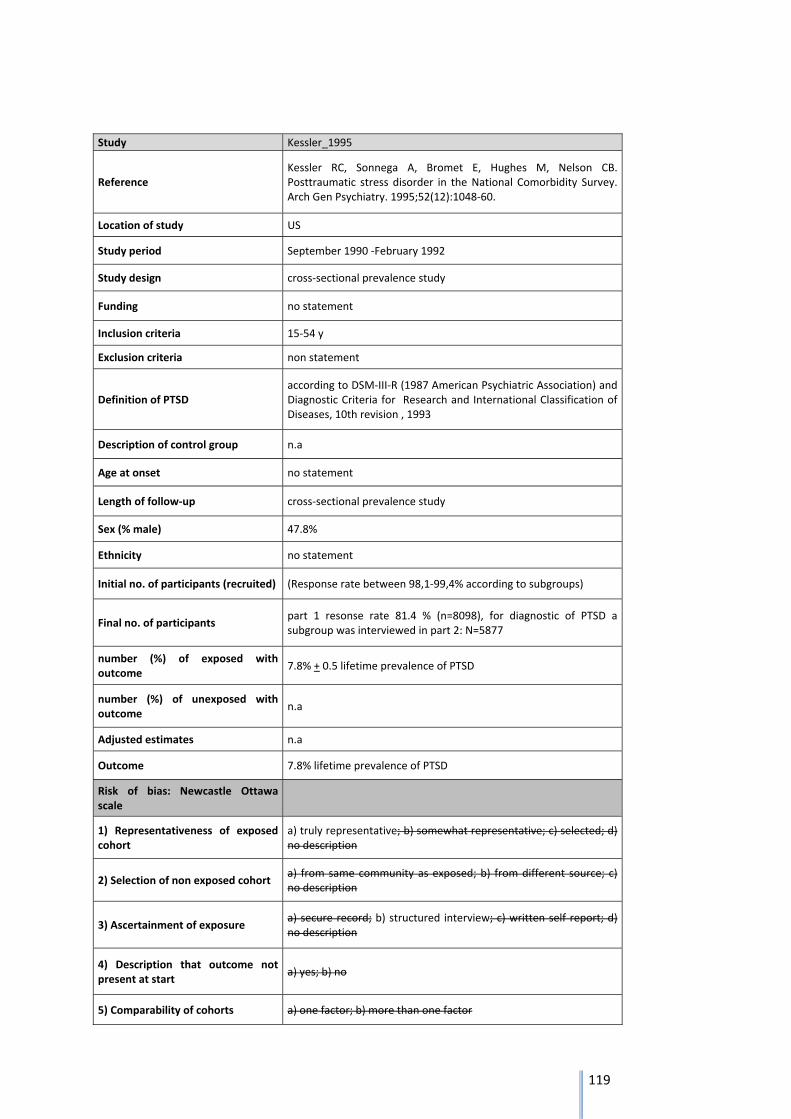
119
Study Kessler_1995
Reference Kessler RC, Sonnega A, Bromet E, Hughes M, Nelson CB. Posttraumatic stress disorder in the National Comorbidity Survey. Arch Gen Psychiatry. 1995;52(12):1048‐60.
Location of study US
Study period September 1990 ‐February 1992
Study design cross‐sectional prevalence study
Funding no statement
Inclusion criteria 15‐54 y
Exclusion criteria non statement
Definition of PTSD according to DSM‐III‐R (1987 American Psychiatric Association) and Diagnostic Criteria for Research and International Classification of Diseases, 10th revision , 1993
Description of control group n.a
Age at onset no statement
Length of follow‐up cross‐sectional prevalence study
Sex (% male) 47.8%
Ethnicity no statement
Initial no. of participants (recruited) (Response rate between 98,1‐99,4% according to subgroups)
Final no. of participants part 1 resonse rate 81.4 % (n=8098), for diagnostic of PTSD a subgroup was interviewed in part 2: N=5877
number (%) of exposed with outcome
7.8% + 0.5 lifetime prevalence of PTSD
number (%) of unexposed with outcome
n.a
Adjusted estimates n.a
Outcome 7.8% lifetime prevalence of PTSD
Risk of bias: Newcastle Ottawa scale
1) Representativeness of exposed cohort
a) truly representative; b) somewhat representative; c) selected; d) no description
2) Selection of non exposed cohort a) from same community as exposed; b) from different source; c) no description
3) Ascertainment of exposure a) secure record; b) structured interview; c) written self report; d) no description
4) Description that outcome not present at start
a) yes; b) no
5) Comparability of cohorts a) one factor; b) more than one factor

120
6) Assessment of outcome a) independent, blind; b) record linkage; c) self report; d) no description
7) Follow‐up long enough for outcome to occur?
a) yes; b) no
8) Adequacy of follow‐up of cohorts a) complete follow‐up; b) lost‐to ‐follow up unlikely to introduce bias; c) high lost‐ to‐follow up; d) no statement
Comments Diagnostic assessment is different as to the PTSS‐10 used in the studies of teh outbcome tree.
Summary assessment
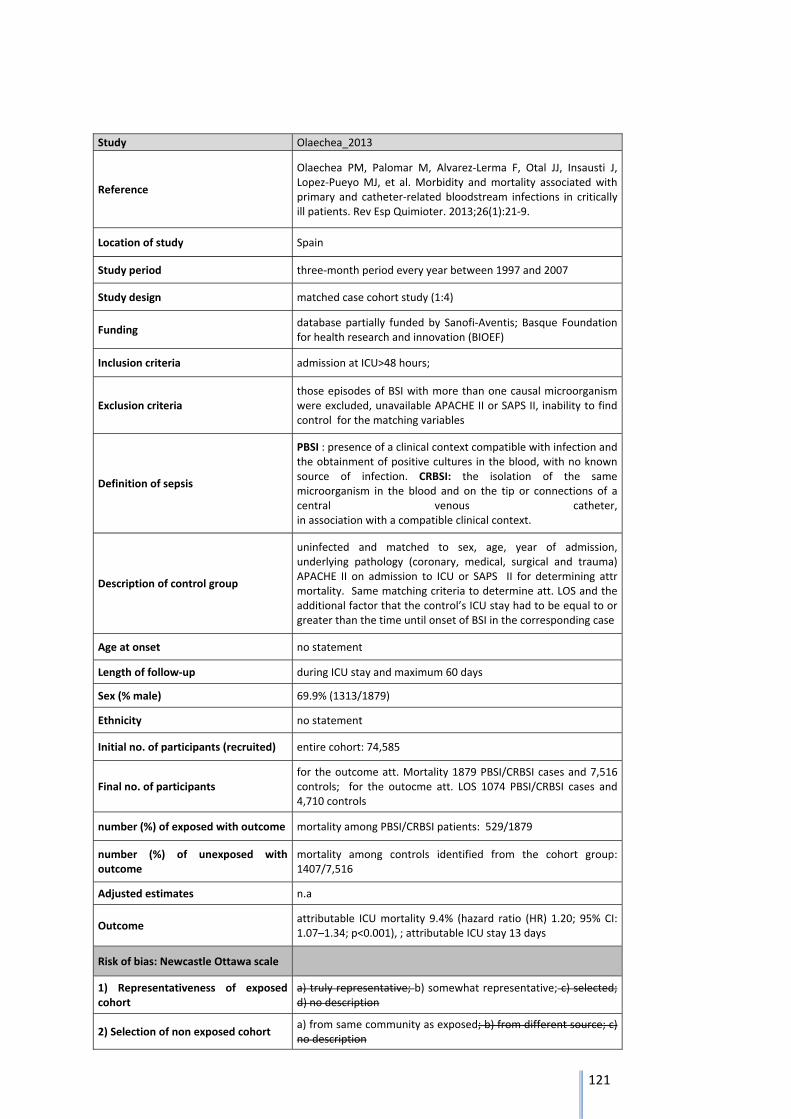
121
Study Olaechea_2013
Reference
Olaechea PM, Palomar M, Alvarez‐Lerma F, Otal JJ, Insausti J, Lopez‐Pueyo MJ, et al. Morbidity and mortality associated with primary and catheter‐related bloodstream infections in critically ill patients. Rev Esp Quimioter. 2013;26(1):21‐9.
Location of study Spain
Study period three‐month period every year between 1997 and 2007
Study design matched case cohort study (1:4)
Funding database partially funded by Sanofi‐Aventis; Basque Foundation for health research and innovation (BIOEF)
Inclusion criteria admission at ICU>48 hours;
Exclusion criteria those episodes of BSI with more than one causal microorganism were excluded, unavailable APACHE II or SAPS II, inability to find control for the matching variables
Definition of sepsis
PBSI : presence of a clinical context compatible with infection and the obtainment of positive cultures in the blood, with no known source of infection. CRBSI: the isolation of the same microorganism in the blood and on the tip or connections of a central venous catheter, in association with a compatible clinical context.
Description of control group
uninfected and matched to sex, age, year of admission, underlying pathology (coronary, medical, surgical and trauma) APACHE II on admission to ICU or SAPS II for determining attr mortality. Same matching criteria to determine att. LOS and the additional factor that the control’s ICU stay had to be equal to or greater than the time until onset of BSI in the corresponding case
Age at onset no statement
Length of follow‐up during ICU stay and maximum 60 days
Sex (% male) 69.9% (1313/1879)
Ethnicity no statement
Initial no. of participants (recruited) entire cohort: 74,585
Final no. of participants for the outcome att. Mortality 1879 PBSI/CRBSI cases and 7,516 controls; for the outocme att. LOS 1074 PBSI/CRBSI cases and 4,710 controls
number (%) of exposed with outcome mortality among PBSI/CRBSI patients: 529/1879
number (%) of unexposed with outcome
mortality among controls identified from the cohort group: 1407/7,516
Adjusted estimates n.a
Outcome attributable ICU mortality 9.4% (hazard ratio (HR) 1.20; 95% CI: 1.07–1.34; p<0.001), ; attributable ICU stay 13 days
Risk of bias: Newcastle Ottawa scale
1) Representativeness of exposed cohort
a) truly representative; b) somewhat representative; c) selected; d) no description
2) Selection of non exposed cohort a) from same community as exposed; b) from different source; c) no description
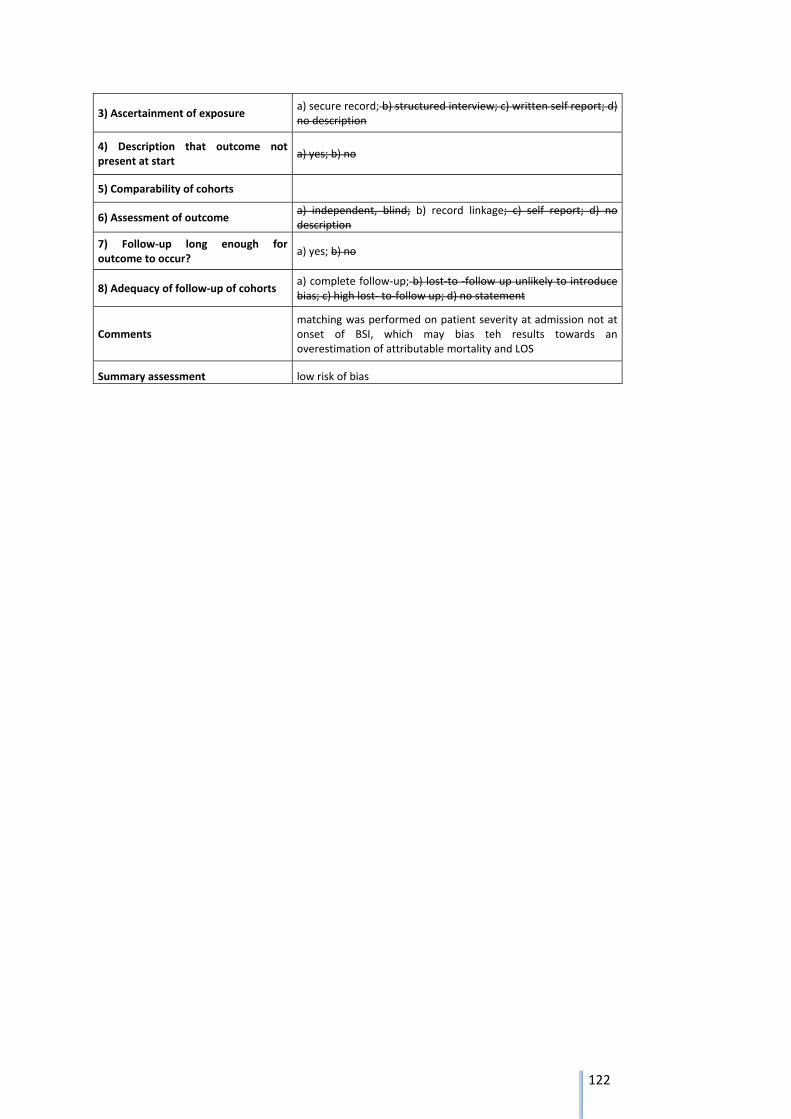
122
3) Ascertainment of exposure a) secure record; b) structured interview; c) written self report; d) no description
4) Description that outcome not present at start
a) yes; b) no
5) Comparability of cohorts
6) Assessment of outcome a) independent, blind; b) record linkage; c) self report; d) no description
7) Follow‐up long enough for outcome to occur?
a) yes; b) no
8) Adequacy of follow‐up of cohorts a) complete follow‐up; b) lost‐to ‐follow up unlikely to introduce bias; c) high lost‐ to‐follow up; d) no statement
Comments matching was performed on patient severity at admission not at onset of BSI, which may bias teh results towards an overestimation of attributable mortality and LOS
Summary assessment low risk of bias
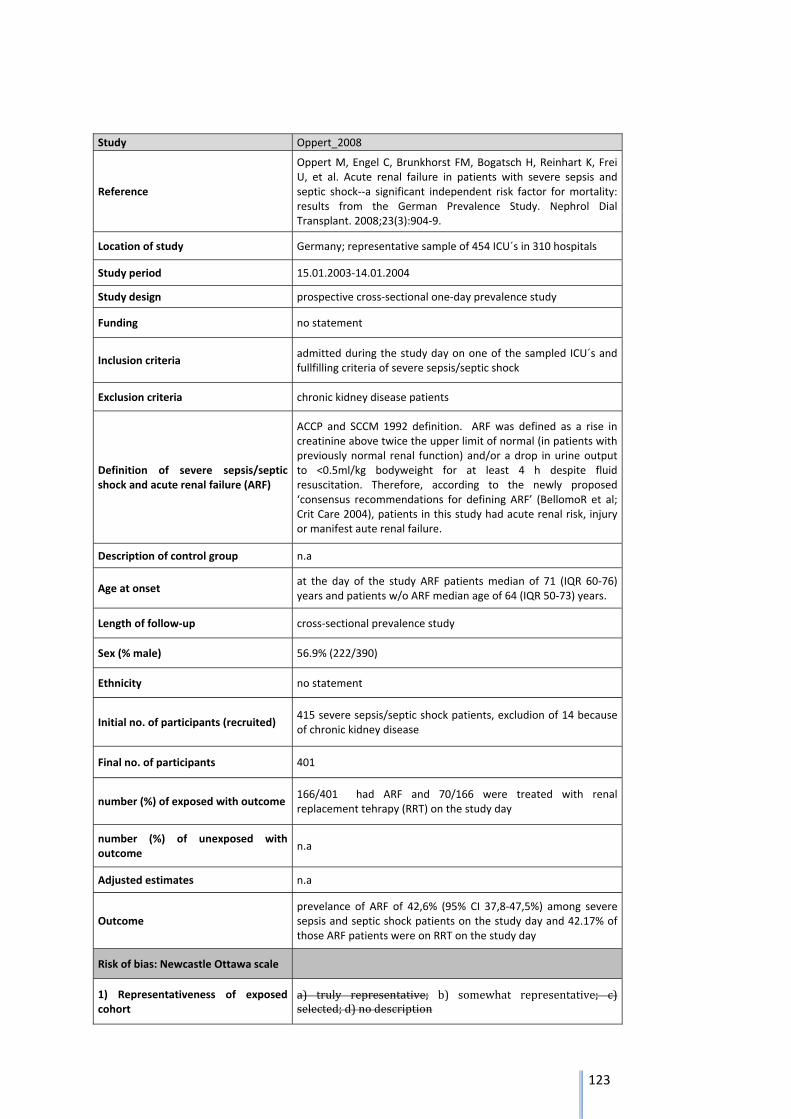
123
Study Oppert_2008
Reference
Oppert M, Engel C, Brunkhorst FM, Bogatsch H, Reinhart K, Frei U, et al. Acute renal failure in patients with severe sepsis and septic shock‐‐a significant independent risk factor for mortality: results from the German Prevalence Study. Nephrol Dial Transplant. 2008;23(3):904‐9.
Location of study Germany; representative sample of 454 ICU´s in 310 hospitals
Study period 15.01.2003‐14.01.2004
Study design prospective cross‐sectional one‐day prevalence study
Funding no statement
Inclusion criteria admitted during the study day on one of the sampled ICU´s and fullfilling criteria of severe sepsis/septic shock
Exclusion criteria chronic kidney disease patients
Definition of severe sepsis/septic shock and acute renal failure (ARF)
ACCP and SCCM 1992 definition. ARF was defined as a rise in creatinine above twice the upper limit of normal (in patients with previously normal renal function) and/or a drop in urine output to <0.5ml/kg bodyweight for at least 4 h despite fluid resuscitation. Therefore, according to the newly proposed ‘consensus recommendations for defining ARF’ (BellomoR et al; Crit Care 2004), patients in this study had acute renal risk, injury or manifest aute renal failure.
Description of control group n.a
Age at onset at the day of the study ARF patients median of 71 (IQR 60‐76) years and patients w/o ARF median age of 64 (IQR 50‐73) years.
Length of follow‐up cross‐sectional prevalence study
Sex (% male) 56.9% (222/390)
Ethnicity no statement
Initial no. of participants (recruited) 415 severe sepsis/septic shock patients, excludion of 14 because of chronic kidney disease
Final no. of participants 401
number (%) of exposed with outcome 166/401 had ARF and 70/166 were treated with renal replacement tehrapy (RRT) on the study day
number (%) of unexposed with outcome
n.a
Adjusted estimates n.a
Outcome prevelance of ARF of 42,6% (95% CI 37,8‐47,5%) among severe sepsis and septic shock patients on the study day and 42.17% of those ARF patients were on RRT on the study day
Risk of bias: Newcastle Ottawa scale
1) Representativeness of exposed cohort
a) truly representative; b) somewhat representative; c)selected;d)nodescription
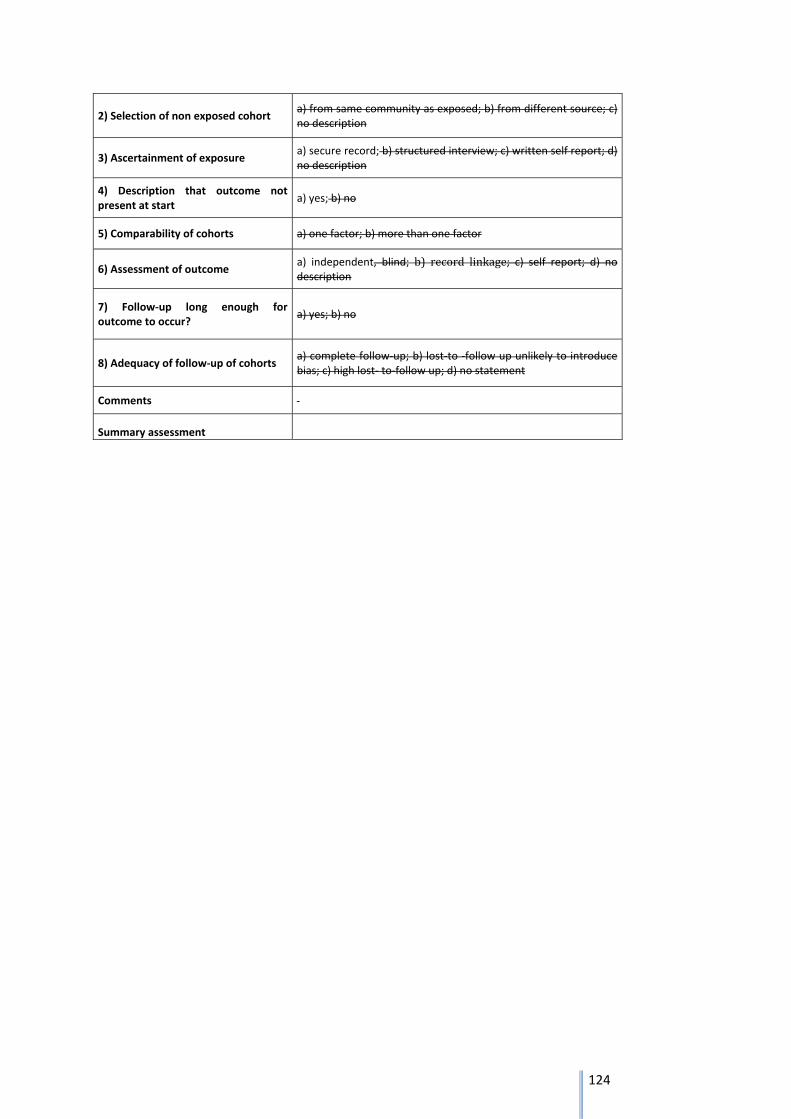
124
2) Selection of non exposed cohort a) from same community as exposed; b) from different source; c) no description
3) Ascertainment of exposure a) secure record; b) structured interview; c) written self report; d) no description
4) Description that outcome not present at start
a) yes; b) no
5) Comparability of cohorts a) one factor; b) more than one factor
6) Assessment of outcome a) independent, blind; b) record linkage; c) self report; d) no description
7) Follow‐up long enough for outcome to occur?
a) yes; b) no
8) Adequacy of follow‐up of cohorts a) complete follow‐up; b) lost‐to ‐follow up unlikely to introduce bias; c) high lost‐ to‐follow up; d) no statement
Comments
Summary assessment
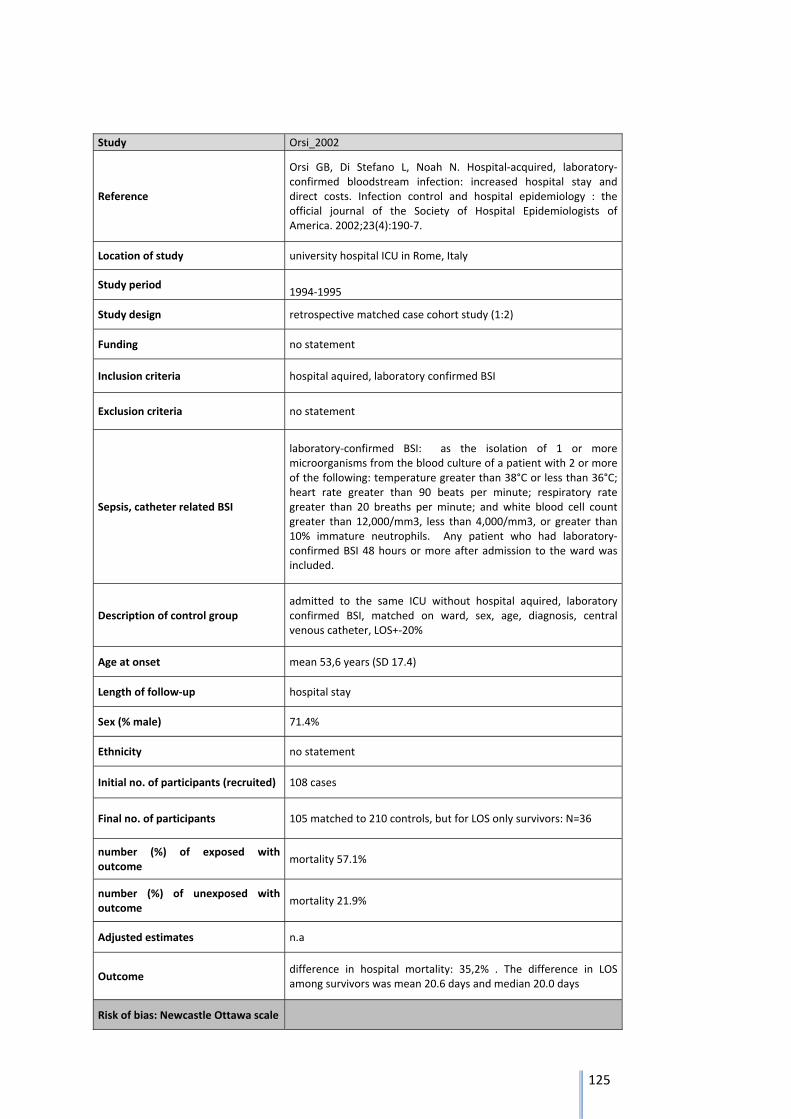
125
Study Orsi_2002
Reference
Orsi GB, Di Stefano L, Noah N. Hospital‐acquired, laboratory‐confirmed bloodstream infection: increased hospital stay and direct costs. Infection control and hospital epidemiology : the official journal of the Society of Hospital Epidemiologists of America. 2002;23(4):190‐7.
Location of study university hospital ICU in Rome, Italy
Study period 1994‐1995
Study design retrospective matched case cohort study (1:2)
Funding no statement
Inclusion criteria hospital aquired, laboratory confirmed BSI
Exclusion criteria no statement
Sepsis, catheter related BSI
laboratory‐confirmed BSI: as the isolation of 1 or more microorganisms from the blood culture of a patient with 2 or more of the following: temperature greater than 38°C or less than 36°C; heart rate greater than 90 beats per minute; respiratory rate greater than 20 breaths per minute; and white blood cell count greater than 12,000/mm3, less than 4,000/mm3, or greater than 10% immature neutrophils. Any patient who had laboratory‐confirmed BSI 48 hours or more after admission to the ward was included.
Description of control group admitted to the same ICU without hospital aquired, laboratory confirmed BSI, matched on ward, sex, age, diagnosis, central venous catheter, LOS+‐20%
Age at onset mean 53,6 years (SD 17.4)
Length of follow‐up hospital stay
Sex (% male) 71.4%
Ethnicity no statement
Initial no. of participants (recruited) 108 cases
Final no. of participants 105 matched to 210 controls, but for LOS only survivors: N=36
number (%) of exposed with outcome
mortality 57.1%
number (%) of unexposed with outcome
mortality 21.9%
Adjusted estimates n.a
Outcome difference in hospital mortality: 35,2% . The difference in LOS among survivors was mean 20.6 days and median 20.0 days
Risk of bias: Newcastle Ottawa scale
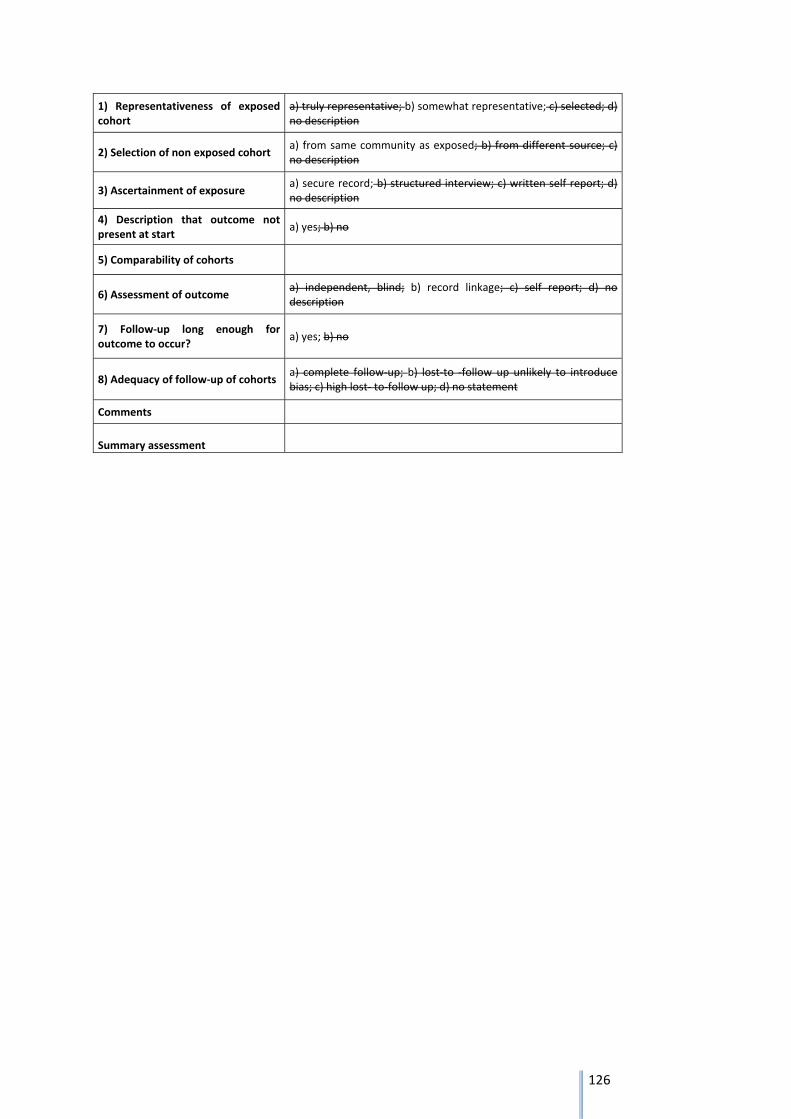
126
1) Representativeness of exposed cohort
a) truly representative; b) somewhat representative; c) selected; d) no description
2) Selection of non exposed cohort a) from same community as exposed; b) from different source; c) no description
3) Ascertainment of exposure a) secure record; b) structured interview; c) written self report; d) no description
4) Description that outcome not present at start
a) yes; b) no
5) Comparability of cohorts
6) Assessment of outcome a) independent, blind; b) record linkage; c) self report; d) no description
7) Follow‐up long enough for outcome to occur?
a) yes; b) no
8) Adequacy of follow‐up of cohorts a) complete follow‐up; b) lost‐to ‐follow up unlikely to introduce bias; c) high lost‐ to‐follow up; d) no statement
Comments
Summary assessment
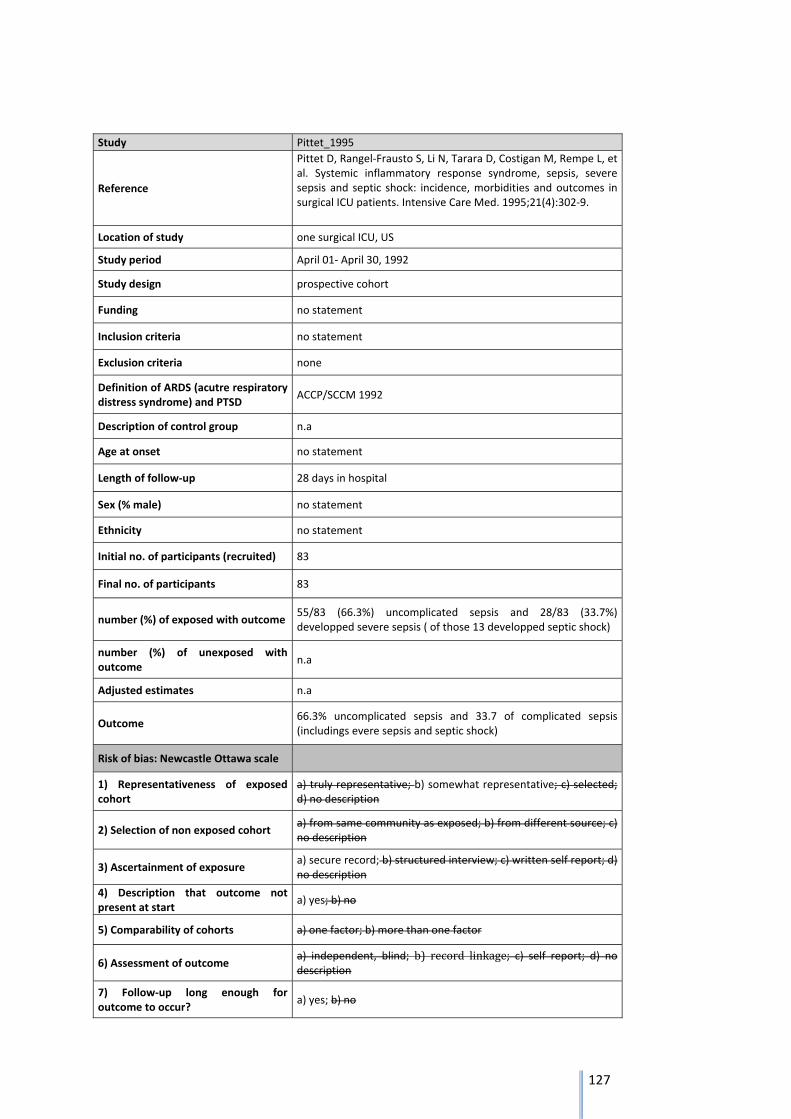
127
Study Pittet_1995
Reference
Pittet D, Rangel‐Frausto S, Li N, Tarara D, Costigan M, Rempe L, et al. Systemic inflammatory response syndrome, sepsis, severe sepsis and septic shock: incidence, morbidities and outcomes in surgical ICU patients. Intensive Care Med. 1995;21(4):302‐9.
Location of study one surgical ICU, US
Study period April 01‐ April 30, 1992
Study design prospective cohort
Funding no statement
Inclusion criteria no statement
Exclusion criteria none
Definition of ARDS (acutre respiratory distress syndrome) and PTSD
ACCP/SCCM 1992
Description of control group n.a
Age at onset no statement
Length of follow‐up 28 days in hospital
Sex (% male) no statement
Ethnicity no statement
Initial no. of participants (recruited) 83
Final no. of participants 83
number (%) of exposed with outcome 55/83 (66.3%) uncomplicated sepsis and 28/83 (33.7%) developped severe sepsis ( of those 13 developped septic shock)
number (%) of unexposed with outcome
n.a
Adjusted estimates n.a
Outcome 66.3% uncomplicated sepsis and 33.7 of complicated sepsis (includings evere sepsis and septic shock)
Risk of bias: Newcastle Ottawa scale
1) Representativeness of exposed cohort
a) truly representative; b) somewhat representative; c) selected; d) no description
2) Selection of non exposed cohort a) from same community as exposed; b) from different source; c) no description
3) Ascertainment of exposure a) secure record; b) structured interview; c) written self report; d) no description
4) Description that outcome not present at start
a) yes; b) no
5) Comparability of cohorts a) one factor; b) more than one factor
6) Assessment of outcome a) independent, blind; b) record linkage; c) self report; d) no description
7) Follow‐up long enough for outcome to occur?
a) yes; b) no

128
8) Adequacy of follow‐up of cohorts a) complete follow‐up; b) lost‐to ‐follow up unlikely to introduce bias; c) high lost‐ to‐follow up; d) no statement
Comments in line with results from 2004 of a prevalence study in Germany: [http://link.springer.com/article/10.1186%2Fcc3259/fulltext.html]
Summary assessment primary and secondary sepsis, inital cohort is a SIRS group from ICU
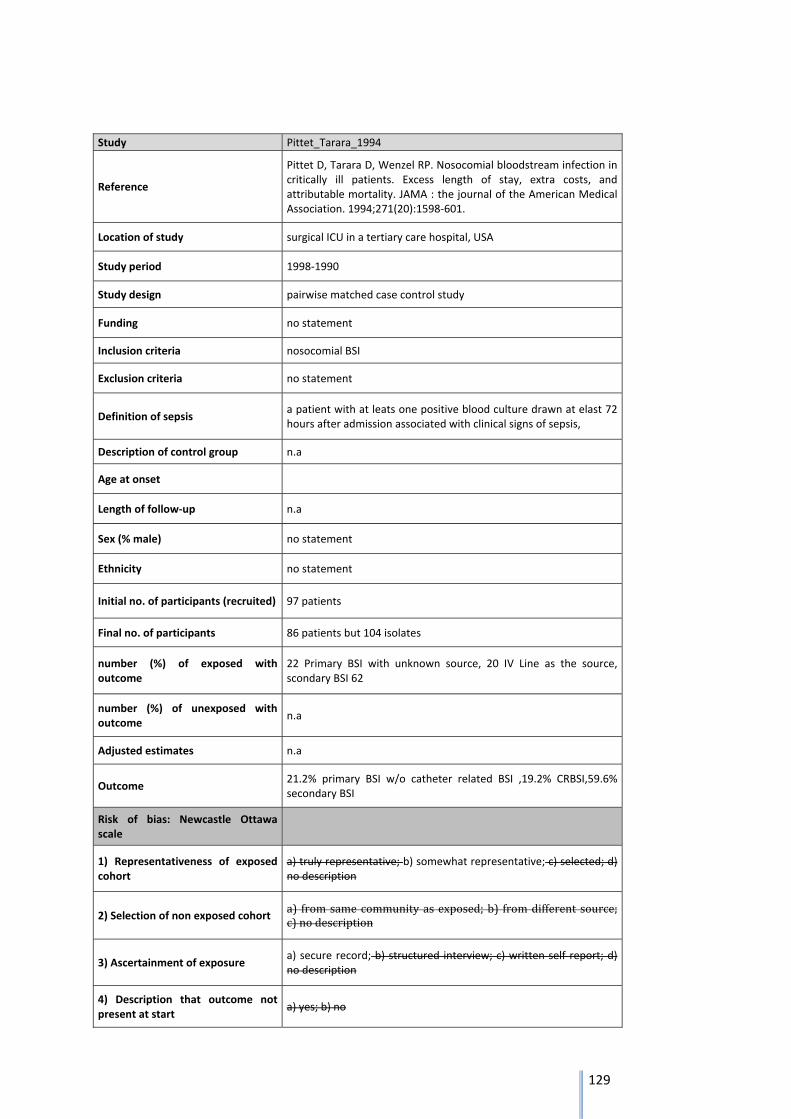
129
Study Pittet_Tarara_1994
Reference
Pittet D, Tarara D, Wenzel RP. Nosocomial bloodstream infection in critically ill patients. Excess length of stay, extra costs, and attributable mortality. JAMA : the journal of the American Medical Association. 1994;271(20):1598‐601.
Location of study surgical ICU in a tertiary care hospital, USA
Study period 1998‐1990
Study design pairwise matched case control study
Funding no statement
Inclusion criteria nosocomial BSI
Exclusion criteria no statement
Definition of sepsis a patient with at leats one positive blood culture drawn at elast 72 hours after admission associated with clinical signs of sepsis,
Description of control group n.a
Age at onset
Length of follow‐up n.a
Sex (% male) no statement
Ethnicity no statement
Initial no. of participants (recruited) 97 patients
Final no. of participants 86 patients but 104 isolates
number (%) of exposed with outcome
22 Primary BSI with unknown source, 20 IV Line as the source, scondary BSI 62
number (%) of unexposed with outcome
n.a
Adjusted estimates n.a
Outcome 21.2% primary BSI w/o catheter related BSI ,19.2% CRBSI,59.6% secondary BSI
Risk of bias: Newcastle Ottawa scale
1) Representativeness of exposed cohort
a) truly representative; b) somewhat representative; c) selected; d) no description
2) Selection of non exposed cohort a) fromsamecommunityasexposed;b) fromdifferent source;c)nodescription
3) Ascertainment of exposure a) secure record; b) structured interview; c) written self report; d) no description
4) Description that outcome not present at start
a) yes; b) no
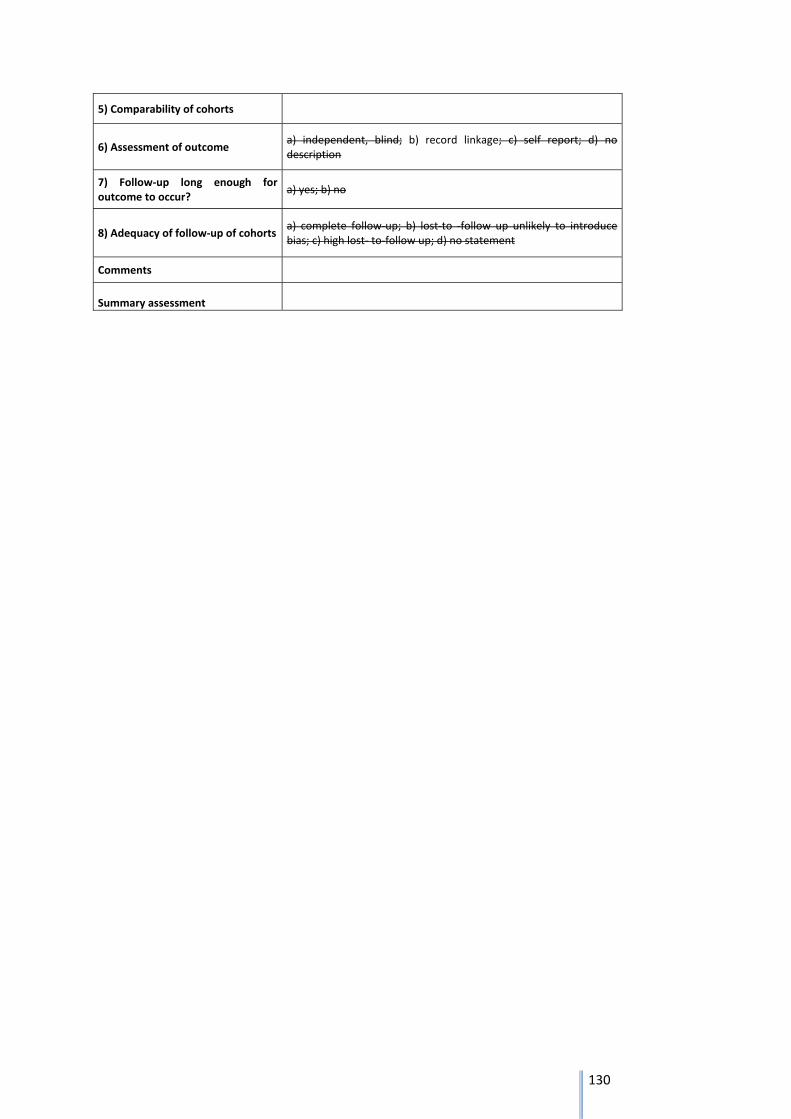
130
5) Comparability of cohorts
6) Assessment of outcome a) independent, blind; b) record linkage; c) self report; d) no description
7) Follow‐up long enough for outcome to occur?
a) yes; b) no
8) Adequacy of follow‐up of cohorts a) complete follow‐up; b) lost‐to ‐follow up unlikely to introduce bias; c) high lost‐ to‐follow up; d) no statement
Comments
Summary assessment
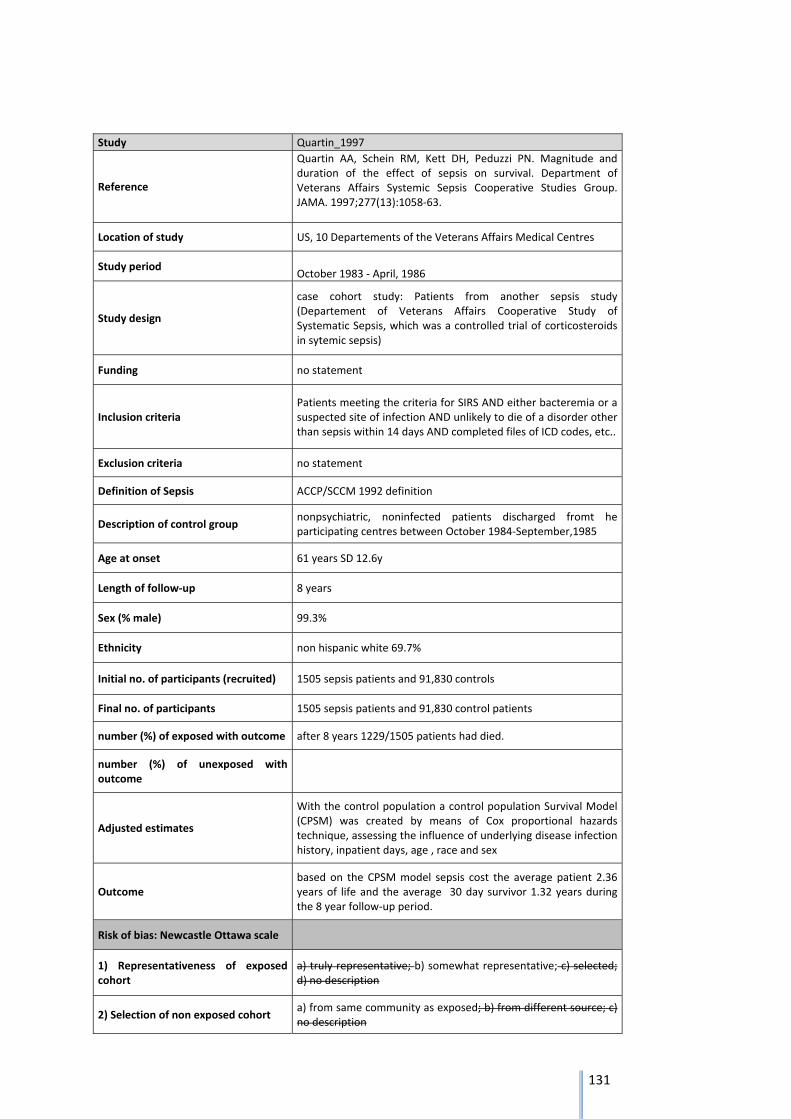
131
Study Quartin_1997
Reference
Quartin AA, Schein RM, Kett DH, Peduzzi PN. Magnitude and duration of the effect of sepsis on survival. Department of Veterans Affairs Systemic Sepsis Cooperative Studies Group. JAMA. 1997;277(13):1058‐63.
Location of study US, 10 Departements of the Veterans Affairs Medical Centres
Study period October 1983 ‐ April, 1986
Study design
case cohort study: Patients from another sepsis study (Departement of Veterans Affairs Cooperative Study of Systematic Sepsis, which was a controlled trial of corticosteroids in sytemic sepsis)
Funding no statement
Inclusion criteria Patients meeting the criteria for SIRS AND either bacteremia or a suspected site of infection AND unlikely to die of a disorder other than sepsis within 14 days AND completed files of ICD codes, etc..
Exclusion criteria no statement
Definition of Sepsis ACCP/SCCM 1992 definition
Description of control group nonpsychiatric, noninfected patients discharged fromt he participating centres between October 1984‐September,1985
Age at onset 61 years SD 12.6y
Length of follow‐up 8 years
Sex (% male) 99.3%
Ethnicity non hispanic white 69.7%
Initial no. of participants (recruited) 1505 sepsis patients and 91,830 controls
Final no. of participants 1505 sepsis patients and 91,830 control patients
number (%) of exposed with outcome after 8 years 1229/1505 patients had died.
number (%) of unexposed with outcome
Adjusted estimates
With the control population a control population Survival Model (CPSM) was created by means of Cox proportional hazards technique, assessing the influence of underlying disease infection history, inpatient days, age , race and sex
Outcome based on the CPSM model sepsis cost the average patient 2.36 years of life and the average 30 day survivor 1.32 years during the 8 year follow‐up period.
Risk of bias: Newcastle Ottawa scale
1) Representativeness of exposed cohort
a) truly representative; b) somewhat representative; c) selected; d) no description
2) Selection of non exposed cohort a) from same community as exposed; b) from different source; c) no description
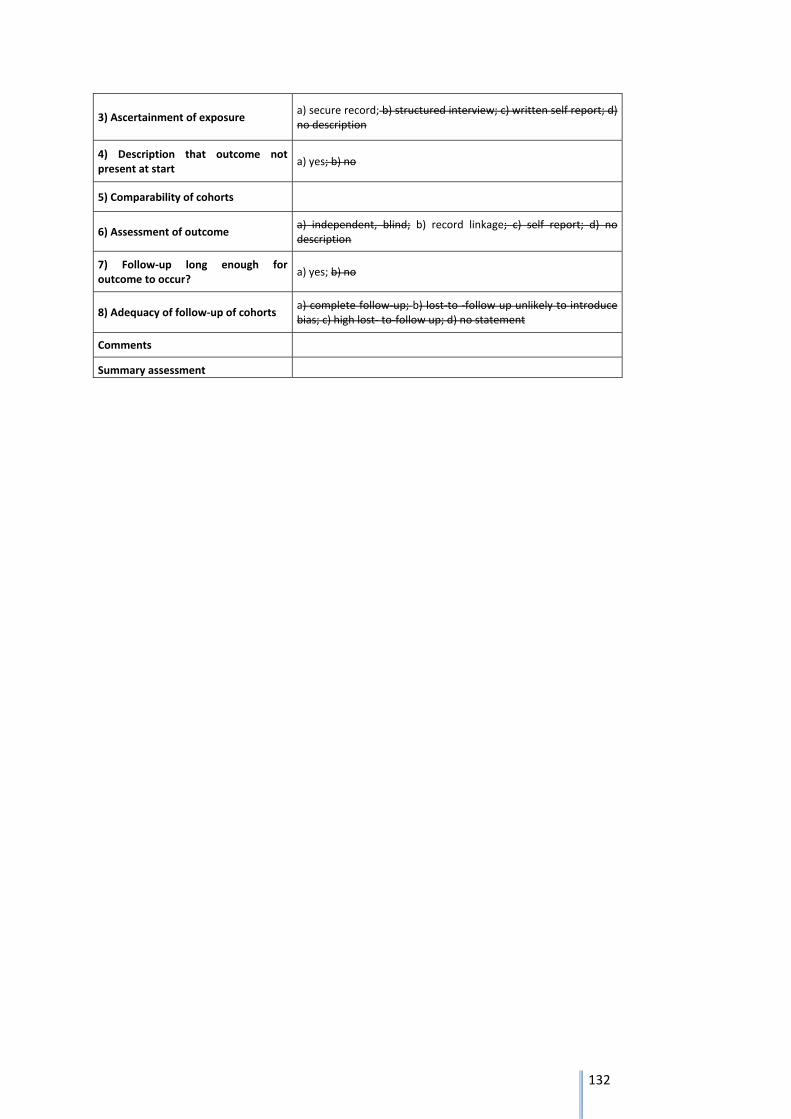
132
3) Ascertainment of exposure a) secure record; b) structured interview; c) written self report; d) no description
4) Description that outcome not present at start
a) yes; b) no
5) Comparability of cohorts
6) Assessment of outcome a) independent, blind; b) record linkage; c) self report; d) no description
7) Follow‐up long enough for outcome to occur?
a) yes; b) no
8) Adequacy of follow‐up of cohorts a) complete follow‐up; b) lost‐to ‐follow up unlikely to introduce bias; c) high lost‐ to‐follow up; d) no statement
Comments
Summary assessment
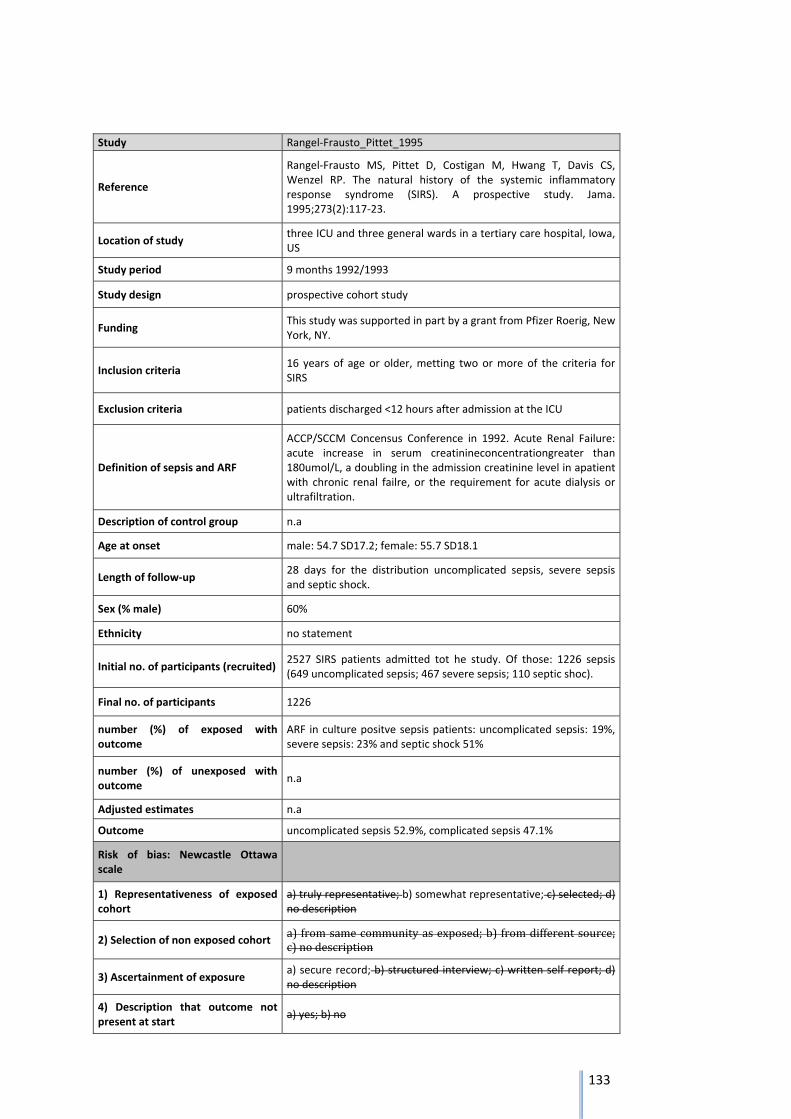
133
Study Rangel‐Frausto_Pittet_1995
Reference
Rangel‐Frausto MS, Pittet D, Costigan M, Hwang T, Davis CS, Wenzel RP. The natural history of the systemic inflammatory response syndrome (SIRS). A prospective study. Jama. 1995;273(2):117‐23.
Location of study three ICU and three general wards in a tertiary care hospital, Iowa, US
Study period 9 months 1992/1993
Study design prospective cohort study
Funding This study was supported in part by a grant from Pfizer Roerig, New York, NY.
Inclusion criteria 16 years of age or older, metting two or more of the criteria for SIRS
Exclusion criteria patients discharged <12 hours after admission at the ICU
Definition of sepsis and ARF
ACCP/SCCM Concensus Conference in 1992. Acute Renal Failure: acute increase in serum creatinineconcentrationgreater than 180umol/L, a doubling in the admission creatinine level in apatient with chronic renal failre, or the requirement for acute dialysis or ultrafiltration.
Description of control group n.a
Age at onset male: 54.7 SD17.2; female: 55.7 SD18.1
Length of follow‐up 28 days for the distribution uncomplicated sepsis, severe sepsis and septic shock.
Sex (% male) 60%
Ethnicity no statement
Initial no. of participants (recruited) 2527 SIRS patients admitted tot he study. Of those: 1226 sepsis (649 uncomplicated sepsis; 467 severe sepsis; 110 septic shoc).
Final no. of participants 1226
number (%) of exposed with outcome
ARF in culture positve sepsis patients: uncomplicated sepsis: 19%, severe sepsis: 23% and septic shock 51%
number (%) of unexposed with outcome
n.a
Adjusted estimates n.a
Outcome uncomplicated sepsis 52.9%, complicated sepsis 47.1%
Risk of bias: Newcastle Ottawa scale
1) Representativeness of exposed cohort
a) truly representative; b) somewhat representative; c) selected; d) no description
2) Selection of non exposed cohort a)fromsamecommunityasexposed;b) fromdifferentsource;c)nodescription
3) Ascertainment of exposure a) secure record; b) structured interview; c) written self report; d) no description
4) Description that outcome not present at start
a) yes; b) no
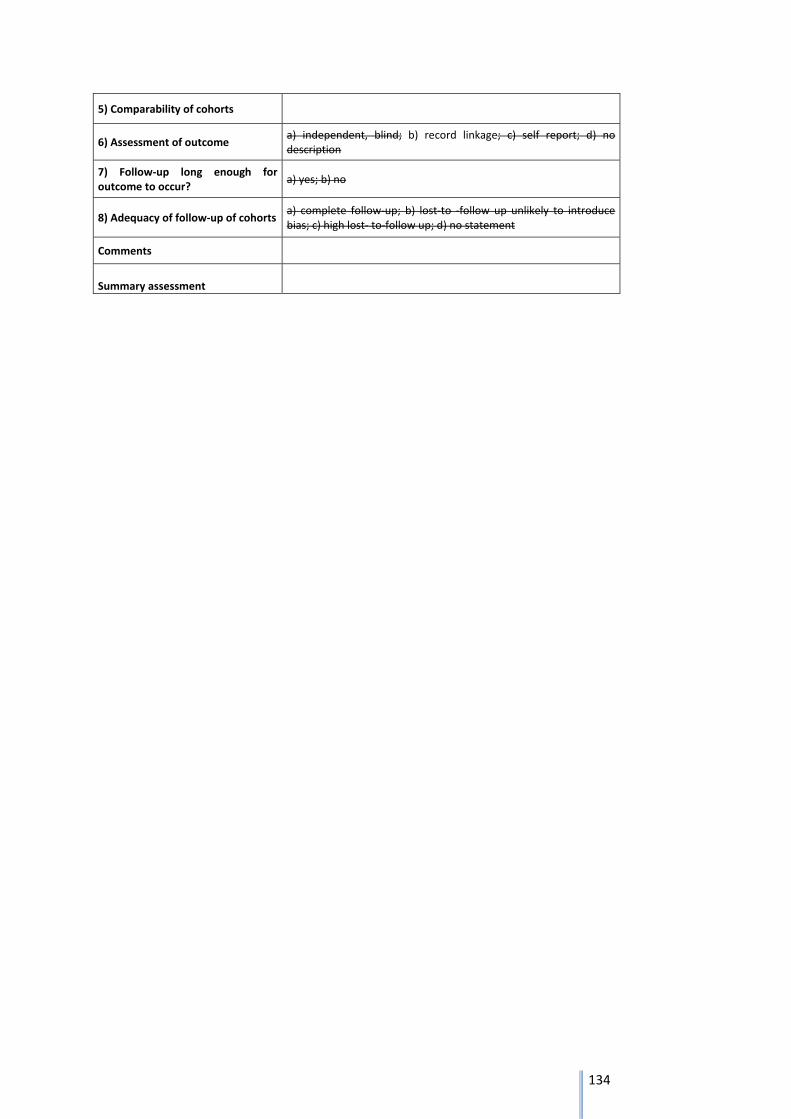
134
5) Comparability of cohorts
6) Assessment of outcome a) independent, blind; b) record linkage; c) self report; d) no description
7) Follow‐up long enough for outcome to occur?
a) yes; b) no
8) Adequacy of follow‐up of cohorts a) complete follow‐up; b) lost‐to ‐follow up unlikely to introduce bias; c) high lost‐ to‐follow up; d) no statement
Comments
Summary assessment
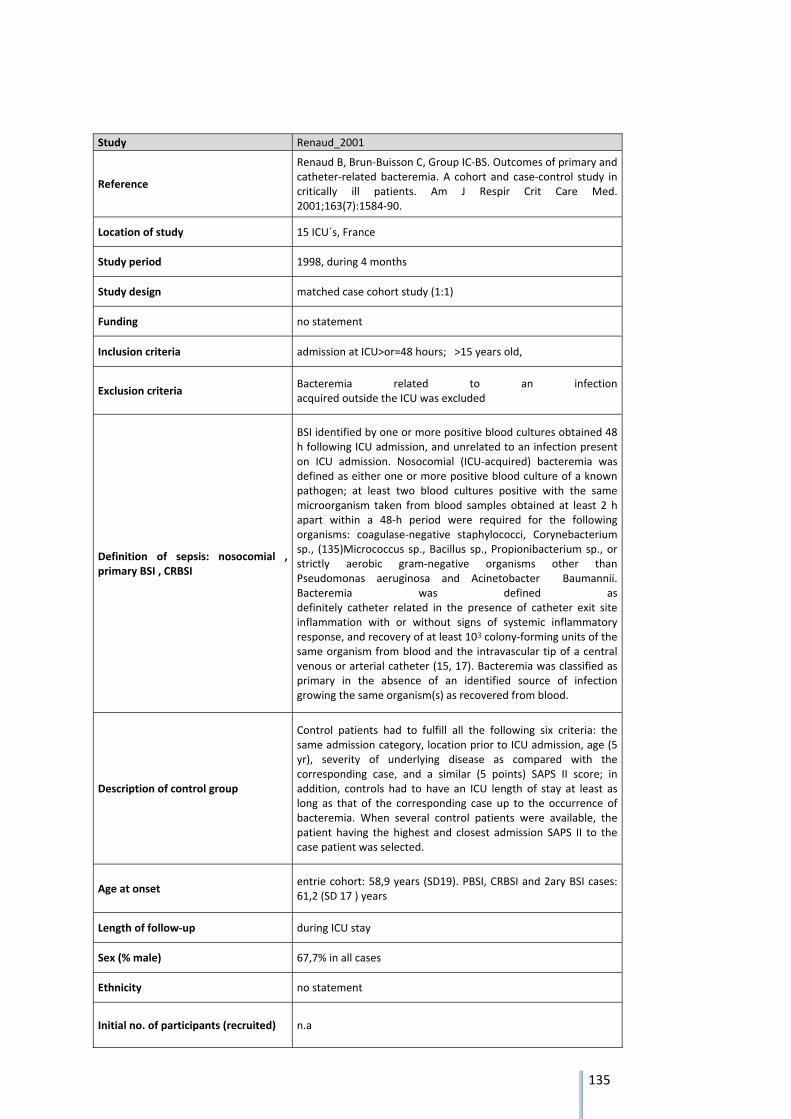
135
Study Renaud_2001
Reference
Renaud B, Brun‐Buisson C, Group IC‐BS. Outcomes of primary and catheter‐related bacteremia. A cohort and case‐control study in critically ill patients. Am J Respir Crit Care Med. 2001;163(7):1584‐90.
Location of study 15 ICU´s, France
Study period 1998, during 4 months
Study design matched case cohort study (1:1)
Funding no statement
Inclusion criteria admission at ICU>or=48 hours; >15 years old,
Exclusion criteria Bacteremia related to an infection acquired outside the ICU was excluded
Definition of sepsis: nosocomial , primary BSI , CRBSI
BSI identified by one or more positive blood cultures obtained 48 h following ICU admission, and unrelated to an infection present on ICU admission. Nosocomial (ICU‐acquired) bacteremia was defined as either one or more positive blood culture of a known pathogen; at least two blood cultures positive with the same microorganism taken from blood samples obtained at least 2 h apart within a 48‐h period were required for the following organisms: coagulase‐negative staphylococci, Corynebacterium sp., (135)Micrococcus sp., Bacillus sp., Propionibacterium sp., or strictly aerobic gram‐negative organisms other than Pseudomonas aeruginosa and Acinetobacter Baumannii. Bacteremia was defined as definitely catheter related in the presence of catheter exit site inflammation with or without signs of systemic inflammatory response, and recovery of at least 103 colony‐forming units of the same organism from blood and the intravascular tip of a central venous or arterial catheter (15, 17). Bacteremia was classified as primary in the absence of an identified source of infection growing the same organism(s) as recovered from blood.
Description of control group
Control patients had to fulfill all the following six criteria: the same admission category, location prior to ICU admission, age (5 yr), severity of underlying disease as compared with the corresponding case, and a similar (5 points) SAPS II score; in addition, controls had to have an ICU length of stay at least as long as that of the corresponding case up to the occurrence of bacteremia. When several control patients were available, the patient having the highest and closest admission SAPS II to the case patient was selected.
Age at onset entrie cohort: 58,9 years (SD19). PBSI, CRBSI and 2ary BSI cases: 61,2 (SD 17 ) years
Length of follow‐up during ICU stay
Sex (% male) 67,7% in all cases
Ethnicity no statement
Initial no. of participants (recruited) n.a
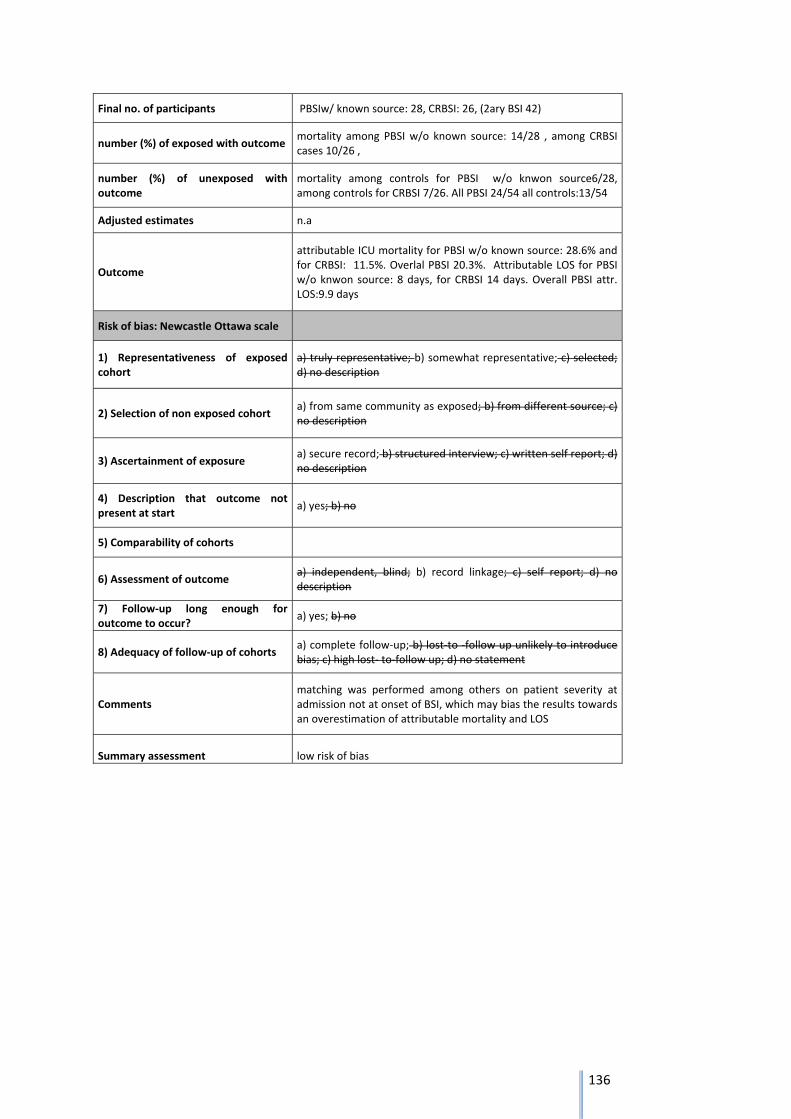
136
Final no. of participants PBSIw/ known source: 28, CRBSI: 26, (2ary BSI 42)
number (%) of exposed with outcome mortality among PBSI w/o known source: 14/28 , among CRBSI cases 10/26 ,
number (%) of unexposed with outcome
mortality among controls for PBSI w/o knwon source6/28, among controls for CRBSI 7/26. All PBSI 24/54 all controls:13/54
Adjusted estimates n.a
Outcome
attributable ICU mortality for PBSI w/o known source: 28.6% and for CRBSI: 11.5%. Overlal PBSI 20.3%. Attributable LOS for PBSI w/o knwon source: 8 days, for CRBSI 14 days. Overall PBSI attr. LOS:9.9 days
Risk of bias: Newcastle Ottawa scale
1) Representativeness of exposed cohort
a) truly representative; b) somewhat representative; c) selected; d) no description
2) Selection of non exposed cohort a) from same community as exposed; b) from different source; c) no description
3) Ascertainment of exposure a) secure record; b) structured interview; c) written self report; d) no description
4) Description that outcome not present at start
a) yes; b) no
5) Comparability of cohorts
6) Assessment of outcome a) independent, blind; b) record linkage; c) self report; d) no description
7) Follow‐up long enough for outcome to occur?
a) yes; b) no
8) Adequacy of follow‐up of cohorts a) complete follow‐up; b) lost‐to ‐follow up unlikely to introduce bias; c) high lost‐ to‐follow up; d) no statement
Comments matching was performed among others on patient severity at admission not at onset of BSI, which may bias the results towards an overestimation of attributable mortality and LOS
Summary assessment low risk of bias
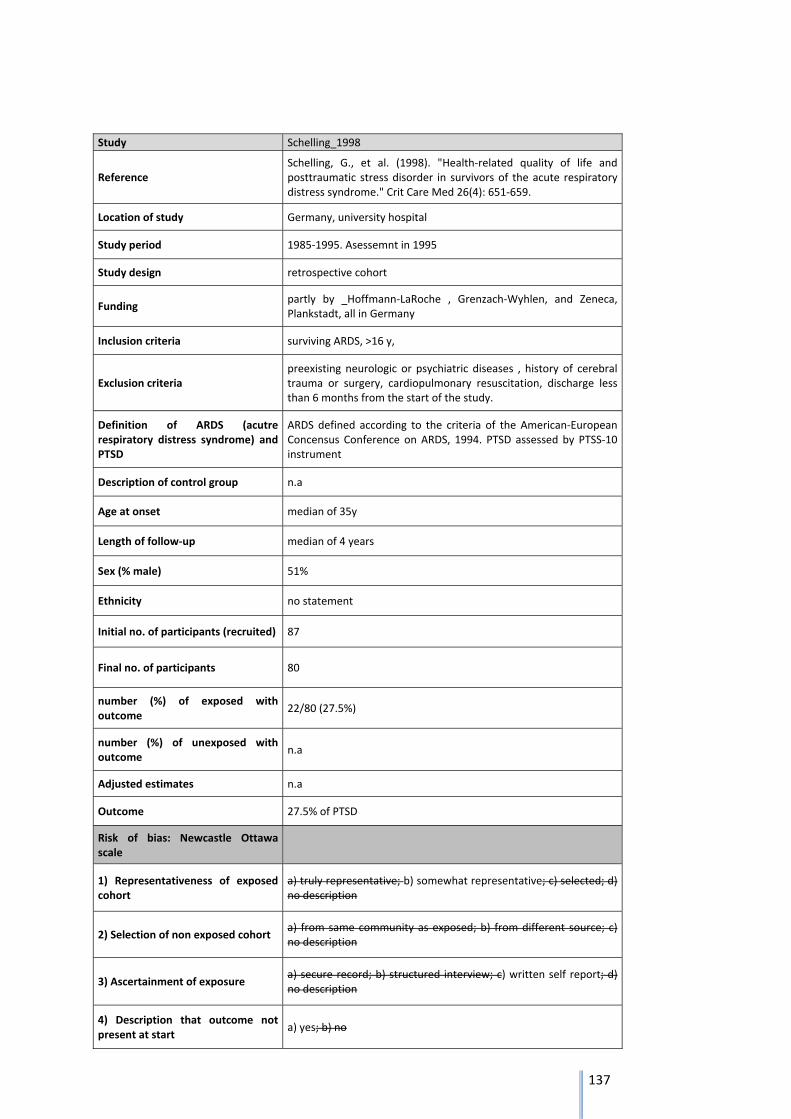
137
Study Schelling_1998
Reference Schelling, G., et al. (1998). "Health‐related quality of life and posttraumatic stress disorder in survivors of the acute respiratory distress syndrome." Crit Care Med 26(4): 651‐659.
Location of study Germany, university hospital
Study period 1985‐1995. Asessemnt in 1995
Study design retrospective cohort
Funding partly by _Hoffmann‐LaRoche , Grenzach‐Wyhlen, and Zeneca, Plankstadt, all in Germany
Inclusion criteria surviving ARDS, >16 y,
Exclusion criteria preexisting neurologic or psychiatric diseases , history of cerebral trauma or surgery, cardiopulmonary resuscitation, discharge less than 6 months from the start of the study.
Definition of ARDS (acutre respiratory distress syndrome) and PTSD
ARDS defined according to the criteria of the American‐European Concensus Conference on ARDS, 1994. PTSD assessed by PTSS‐10 instrument
Description of control group n.a
Age at onset median of 35y
Length of follow‐up median of 4 years
Sex (% male) 51%
Ethnicity no statement
Initial no. of participants (recruited) 87
Final no. of participants 80
number (%) of exposed with outcome
22/80 (27.5%)
number (%) of unexposed with outcome
n.a
Adjusted estimates n.a
Outcome 27.5% of PTSD
Risk of bias: Newcastle Ottawa scale
1) Representativeness of exposed cohort
a) truly representative; b) somewhat representative; c) selected; d) no description
2) Selection of non exposed cohort a) from same community as exposed; b) from different source; c) no description
3) Ascertainment of exposure a) secure record; b) structured interview; c) written self report; d) no description
4) Description that outcome not present at start
a) yes; b) no
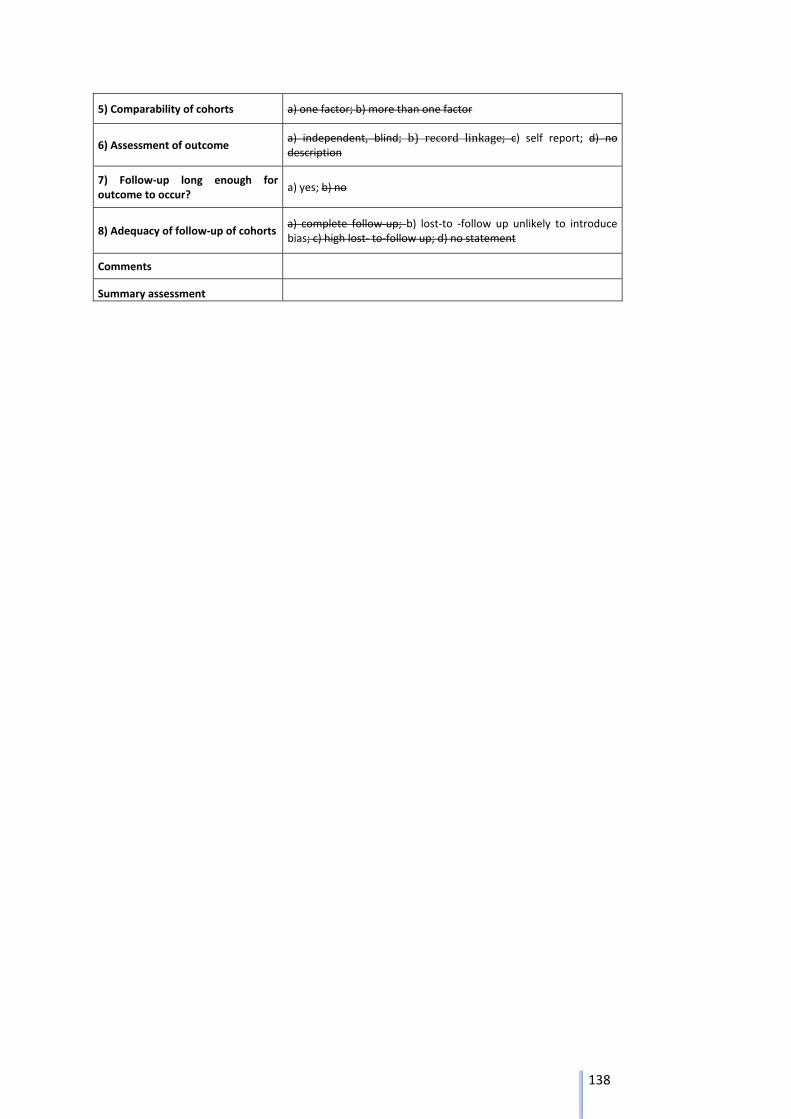
138
5) Comparability of cohorts a) one factor; b) more than one factor
6) Assessment of outcome a) independent, blind; b) record linkage; c) self report; d) no description
7) Follow‐up long enough for outcome to occur?
a) yes; b) no
8) Adequacy of follow‐up of cohorts a) complete follow‐up; b) lost‐to ‐follow up unlikely to introduce bias; c) high lost‐ to‐follow up; d) no statement
Comments
Summary assessment
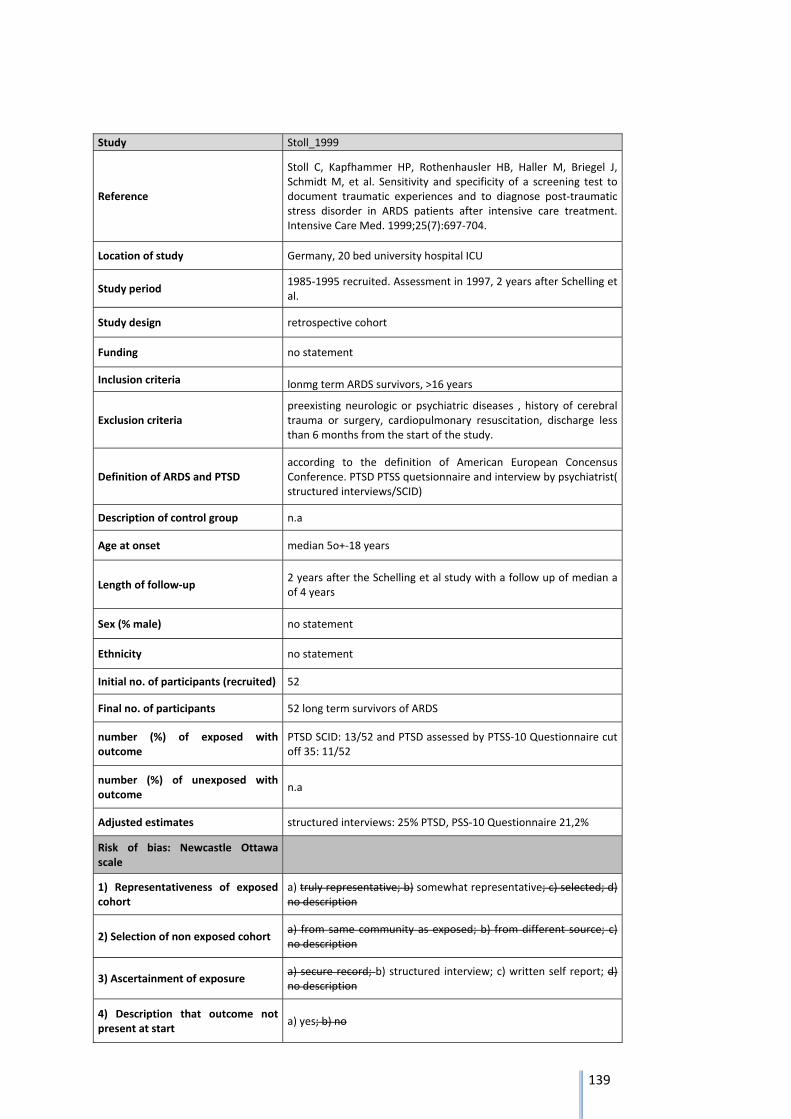
139
Study Stoll_1999
Reference
Stoll C, Kapfhammer HP, Rothenhausler HB, Haller M, Briegel J, Schmidt M, et al. Sensitivity and specificity of a screening test to document traumatic experiences and to diagnose post‐traumatic stress disorder in ARDS patients after intensive care treatment. Intensive Care Med. 1999;25(7):697‐704.
Location of study Germany, 20 bed university hospital ICU
Study period 1985‐1995 recruited. Assessment in 1997, 2 years after Schelling et al.
Study design retrospective cohort
Funding no statement
Inclusion criteria lonmg term ARDS survivors, >16 years
Exclusion criteria preexisting neurologic or psychiatric diseases , history of cerebral trauma or surgery, cardiopulmonary resuscitation, discharge less than 6 months from the start of the study.
Definition of ARDS and PTSD according to the definition of American European Concensus Conference. PTSD PTSS quetsionnaire and interview by psychiatrist( structured interviews/SCID)
Description of control group n.a
Age at onset median 5o+‐18 years
Length of follow‐up 2 years after the Schelling et al study with a follow up of median a of 4 years
Sex (% male) no statement
Ethnicity no statement
Initial no. of participants (recruited) 52
Final no. of participants 52 long term survivors of ARDS
number (%) of exposed with outcome
PTSD SCID: 13/52 and PTSD assessed by PTSS‐10 Questionnaire cut off 35: 11/52
number (%) of unexposed with outcome
n.a
Adjusted estimates structured interviews: 25% PTSD, PSS‐10 Questionnaire 21,2%
Risk of bias: Newcastle Ottawa scale
1) Representativeness of exposed cohort
a) truly representative; b) somewhat representative; c) selected; d) no description
2) Selection of non exposed cohort a) from same community as exposed; b) from different source; c) no description
3) Ascertainment of exposure a) secure record; b) structured interview; c) written self report; d) no description
4) Description that outcome not present at start
a) yes; b) no

140
5) Comparability of cohorts a) one factor; b) more than one factor
6) Assessment of outcome a) independent, blind; b) record linkage; c) self report; d) no description
7) Follow‐up long enough for outcome to occur?
a) yes; b) no
8) Adequacy of follow‐up of cohorts a) complete follow‐up; b) lost‐to ‐follow up unlikely to introduce bias; c) high lost‐ to‐follow up; d) no statement
Comments
Summary assessment
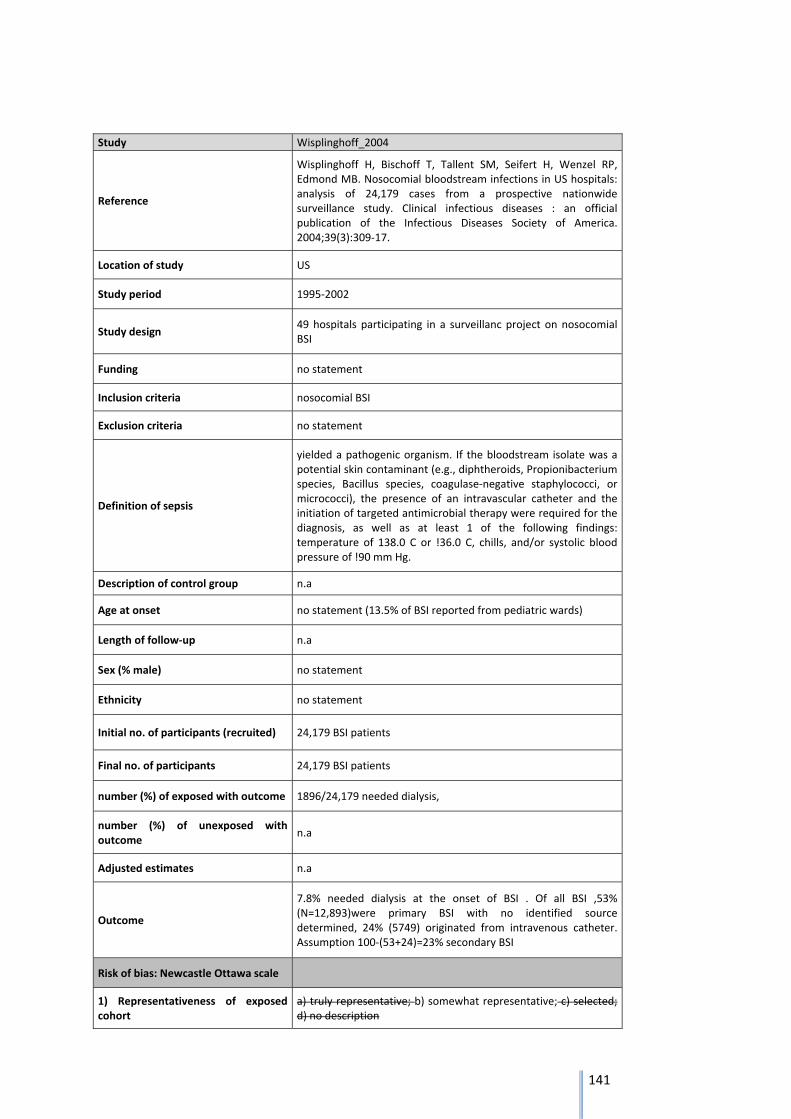
141
Study Wisplinghoff_2004
Reference
Wisplinghoff H, Bischoff T, Tallent SM, Seifert H, Wenzel RP, Edmond MB. Nosocomial bloodstream infections in US hospitals: analysis of 24,179 cases from a prospective nationwide surveillance study. Clinical infectious diseases : an official publication of the Infectious Diseases Society of America. 2004;39(3):309‐17.
Location of study US
Study period 1995‐2002
Study design 49 hospitals participating in a surveillanc project on nosocomial BSI
Funding no statement
Inclusion criteria nosocomial BSI
Exclusion criteria no statement
Definition of sepsis
yielded a pathogenic organism. If the bloodstream isolate was a potential skin contaminant (e.g., diphtheroids, Propionibacterium species, Bacillus species, coagulase‐negative staphylococci, or micrococci), the presence of an intravascular catheter and the initiation of targeted antimicrobial therapy were required for the diagnosis, as well as at least 1 of the following findings: temperature of 138.0 C or !36.0 C, chills, and/or systolic blood pressure of !90 mm Hg.
Description of control group n.a
Age at onset no statement (13.5% of BSI reported from pediatric wards)
Length of follow‐up n.a
Sex (% male) no statement
Ethnicity no statement
Initial no. of participants (recruited) 24,179 BSI patients
Final no. of participants 24,179 BSI patients
number (%) of exposed with outcome 1896/24,179 needed dialysis,
number (%) of unexposed with outcome
n.a
Adjusted estimates n.a
Outcome
7.8% needed dialysis at the onset of BSI . Of all BSI ,53% (N=12,893)were primary BSI with no identified source determined, 24% (5749) originated from intravenous catheter. Assumption 100‐(53+24)=23% secondary BSI
Risk of bias: Newcastle Ottawa scale
1) Representativeness of exposed cohort
a) truly representative; b) somewhat representative; c) selected; d) no description
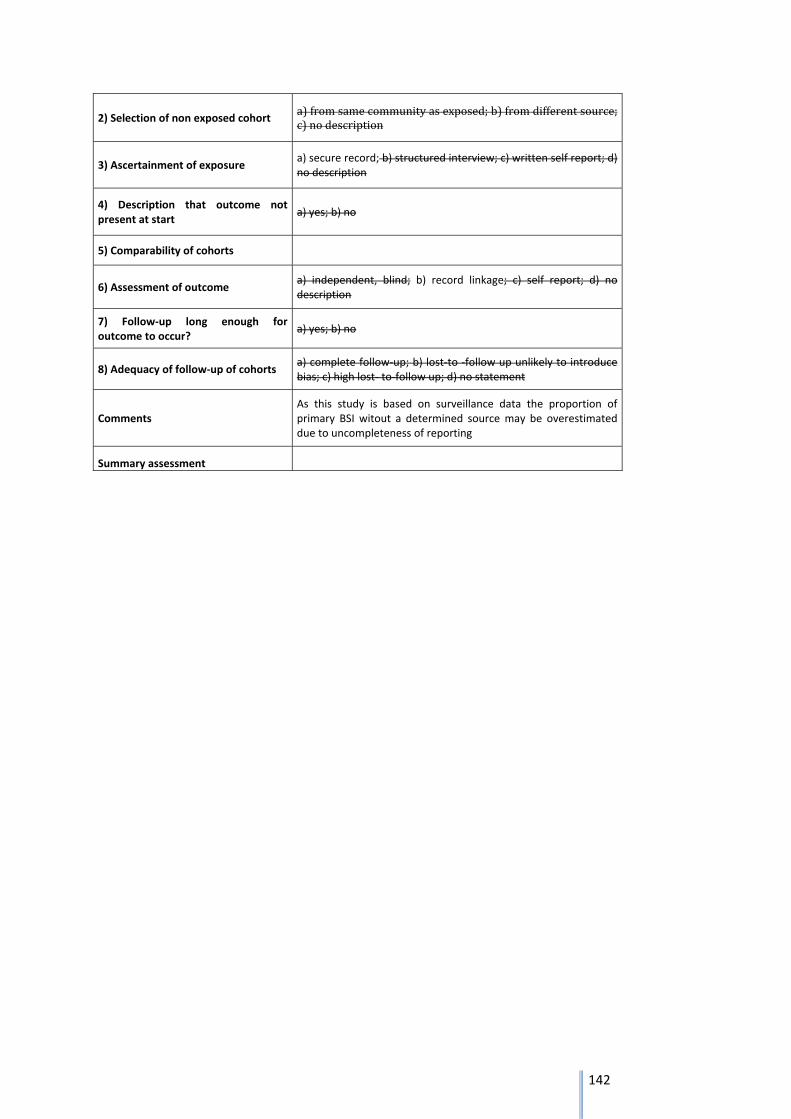
142
2) Selection of non exposed cohort a)fromsamecommunityasexposed;b)fromdifferentsource;c)nodescription
3) Ascertainment of exposure a) secure record; b) structured interview; c) written self report; d) no description
4) Description that outcome not present at start
a) yes; b) no
5) Comparability of cohorts
6) Assessment of outcome a) independent, blind; b) record linkage; c) self report; d) no description
7) Follow‐up long enough for outcome to occur?
a) yes; b) no
8) Adequacy of follow‐up of cohorts a) complete follow‐up; b) lost‐to ‐follow up unlikely to introduce bias; c) high lost‐ to‐follow up; d) no statement
Comments As this study is based on surveillance data the proportion of primary BSI witout a determined source may be overestimated due to uncompleteness of reporting
Summary assessment
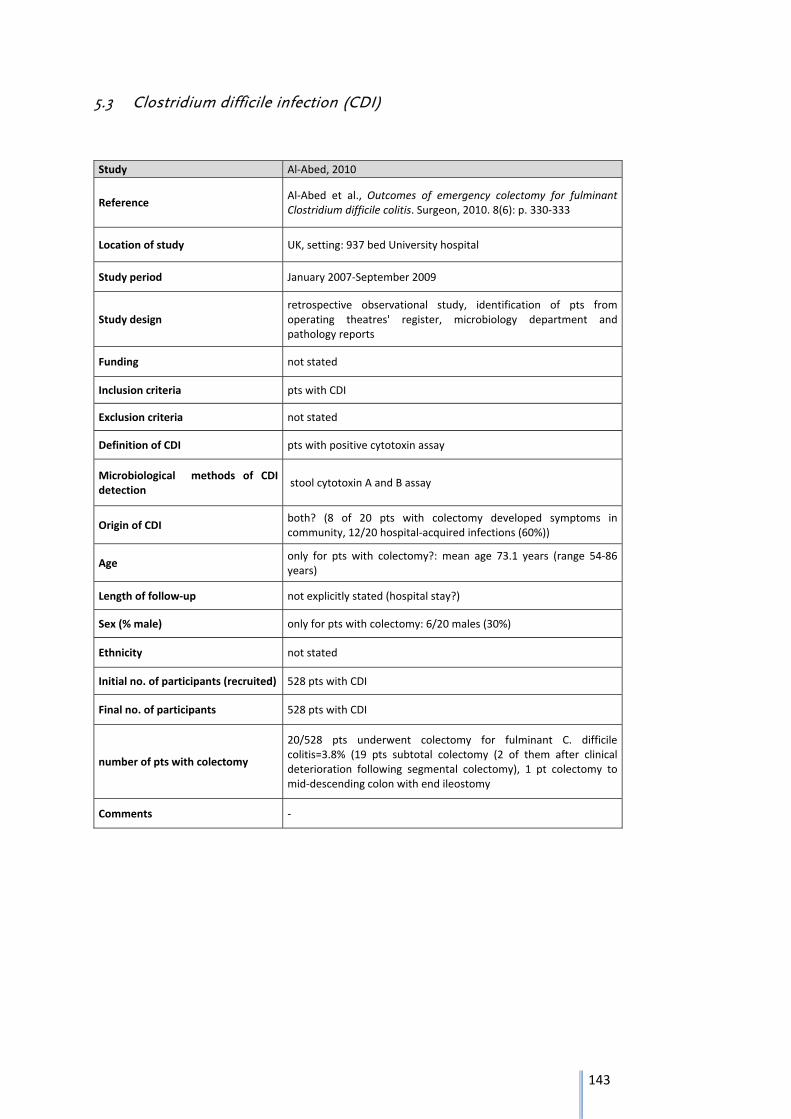
143
5.3 Clostridium difficile infection (CDI)
Study Al‐Abed, 2010
Reference Al‐Abed et al., Outcomes of emergency colectomy for fulminant Clostridium difficile colitis. Surgeon, 2010. 8(6): p. 330‐333
Location of study UK, setting: 937 bed University hospital
Study period January 2007‐September 2009
Study design retrospective observational study, identification of pts from operating theatres' register, microbiology department and pathology reports
Funding not stated
Inclusion criteria pts with CDI
Exclusion criteria not stated
Definition of CDI pts with positive cytotoxin assay
Microbiological methods of CDI detection
stool cytotoxin A and B assay
Origin of CDI both? (8 of 20 pts with colectomy developed symptoms in community, 12/20 hospital‐acquired infections (60%))
Age only for pts with colectomy?: mean age 73.1 years (range 54‐86 years)
Length of follow‐up not explicitly stated (hospital stay?)
Sex (% male) only for pts with colectomy: 6/20 males (30%)
Ethnicity not stated
Initial no. of participants (recruited) 528 pts with CDI
Final no. of participants 528 pts with CDI
number of pts with colectomy
20/528 pts underwent colectomy for fulminant C. difficile colitis=3.8% (19 pts subtotal colectomy (2 of them after clinical deterioration following segmental colectomy), 1 pt colectomy to mid‐descending colon with end ileostomy
Comments ‐
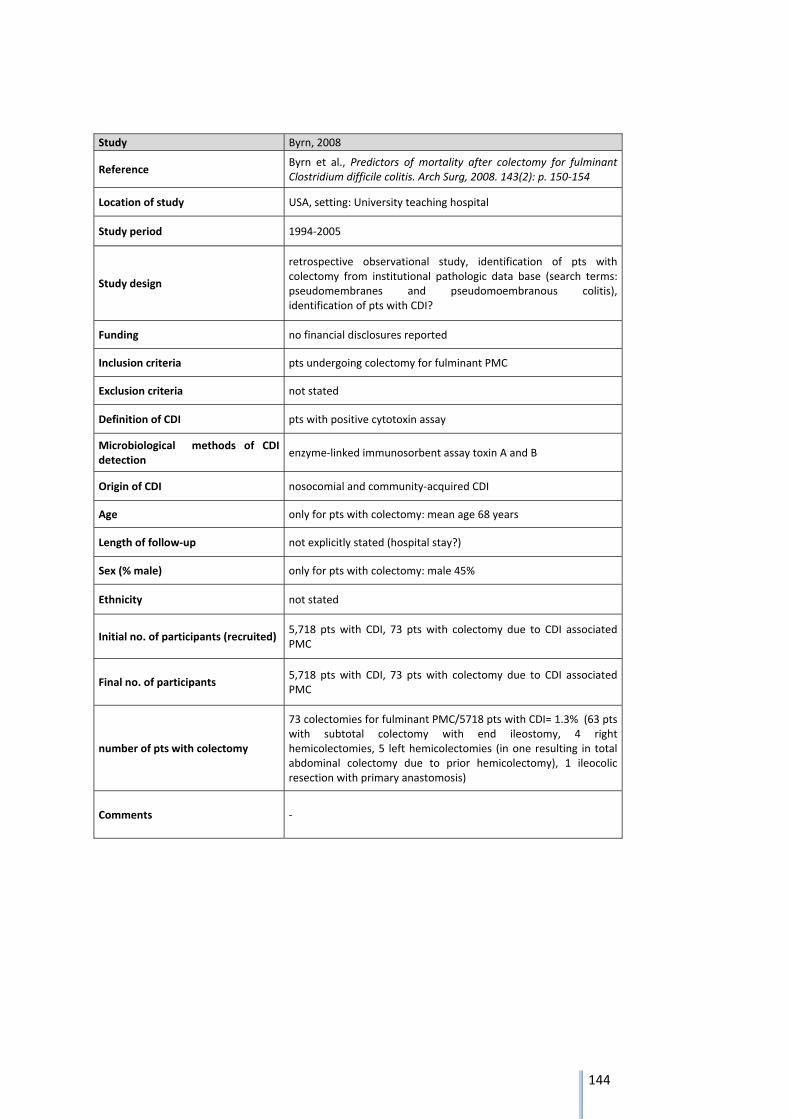
144
Study Byrn, 2008
Reference Byrn et al., Predictors of mortality after colectomy for fulminant Clostridium difficile colitis. Arch Surg, 2008. 143(2): p. 150‐154
Location of study USA, setting: University teaching hospital
Study period 1994‐2005
Study design
retrospective observational study, identification of pts with colectomy from institutional pathologic data base (search terms: pseudomembranes and pseudomoembranous colitis), identification of pts with CDI?
Funding no financial disclosures reported
Inclusion criteria pts undergoing colectomy for fulminant PMC
Exclusion criteria not stated
Definition of CDI pts with positive cytotoxin assay
Microbiological methods of CDI detection
enzyme‐linked immunosorbent assay toxin A and B
Origin of CDI nosocomial and community‐acquired CDI
Age only for pts with colectomy: mean age 68 years
Length of follow‐up not explicitly stated (hospital stay?)
Sex (% male) only for pts with colectomy: male 45%
Ethnicity not stated
Initial no. of participants (recruited) 5,718 pts with CDI, 73 pts with colectomy due to CDI associated PMC
Final no. of participants 5,718 pts with CDI, 73 pts with colectomy due to CDI associated PMC
number of pts with colectomy
73 colectomies for fulminant PMC/5718 pts with CDI= 1.3% (63 pts with subtotal colectomy with end ileostomy, 4 right hemicolectomies, 5 left hemicolectomies (in one resulting in total abdominal colectomy due to prior hemicolectomy), 1 ileocolic resection with primary anastomosis)
Comments ‐
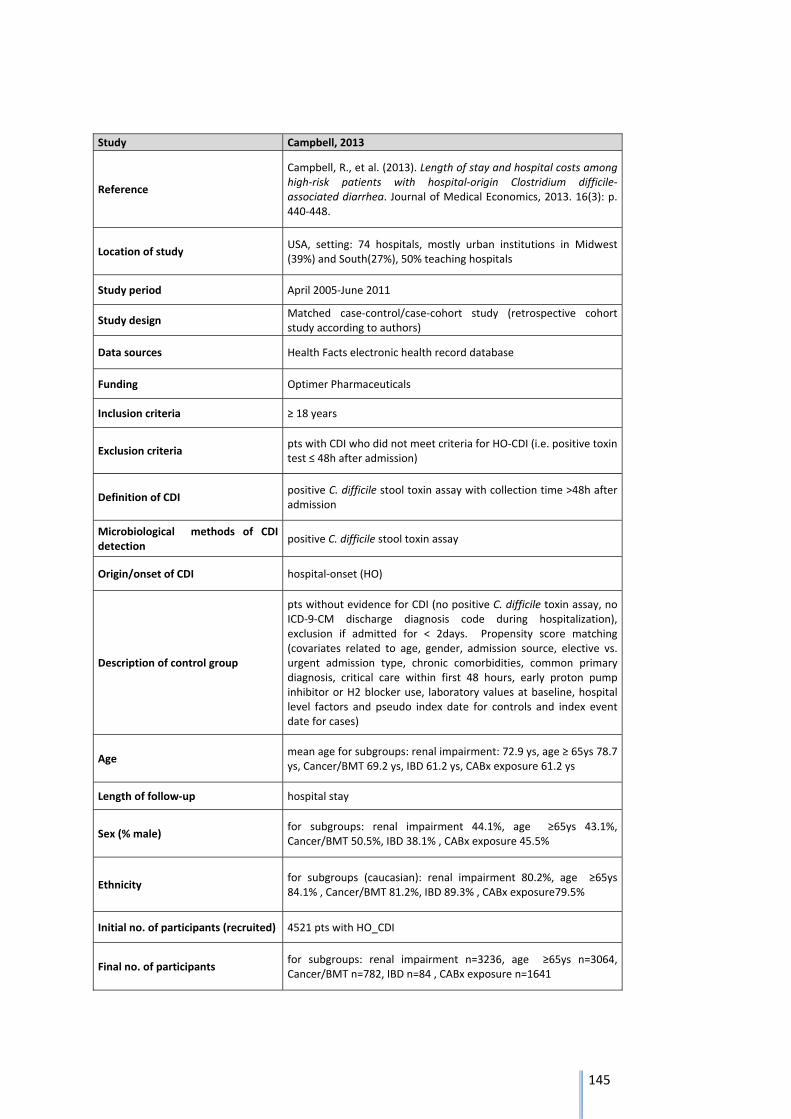
145
Study Campbell, 2013
Reference
Campbell, R., et al. (2013). Length of stay and hospital costs among high‐risk patients with hospital‐origin Clostridium difficile‐associated diarrhea. Journal of Medical Economics, 2013. 16(3): p. 440‐448.
Location of study USA, setting: 74 hospitals, mostly urban institutions in Midwest (39%) and South(27%), 50% teaching hospitals
Study period April 2005‐June 2011
Study design Matched case‐control/case‐cohort study (retrospective cohort study according to authors)
Data sources Health Facts electronic health record database
Funding Optimer Pharmaceuticals
Inclusion criteria ≥ 18 years
Exclusion criteria pts with CDI who did not meet criteria for HO‐CDI (i.e. positive toxin test ≤ 48h after admission)
Definition of CDI positive C. difficile stool toxin assay with collection time >48h after admission
Microbiological methods of CDI detection
positive C. difficile stool toxin assay
Origin/onset of CDI hospital‐onset (HO)
Description of control group
pts without evidence for CDI (no positive C. difficile toxin assay, no ICD‐9‐CM discharge diagnosis code during hospitalization), exclusion if admitted for < 2days. Propensity score matching (covariates related to age, gender, admission source, elective vs. urgent admission type, chronic comorbidities, common primary diagnosis, critical care within first 48 hours, early proton pump inhibitor or H2 blocker use, laboratory values at baseline, hospital level factors and pseudo index date for controls and index event date for cases)
Age mean age for subgroups: renal impairment: 72.9 ys, age ≥ 65ys 78.7 ys, Cancer/BMT 69.2 ys, IBD 61.2 ys, CABx exposure 61.2 ys
Length of follow‐up hospital stay
Sex (% male) for subgroups: renal impairment 44.1%, age ≥65ys 43.1%, Cancer/BMT 50.5%, IBD 38.1% , CABx exposure 45.5%
Ethnicity for subgroups (caucasian): renal impairment 80.2%, age ≥65ys 84.1% , Cancer/BMT 81.2%, IBD 89.3% , CABx exposure79.5%
Initial no. of participants (recruited) 4521 pts with HO_CDI
Final no. of participants for subgroups: renal impairment n=3236, age ≥65ys n=3064, Cancer/BMT n=782, IBD n=84 , CABx exposure n=1641
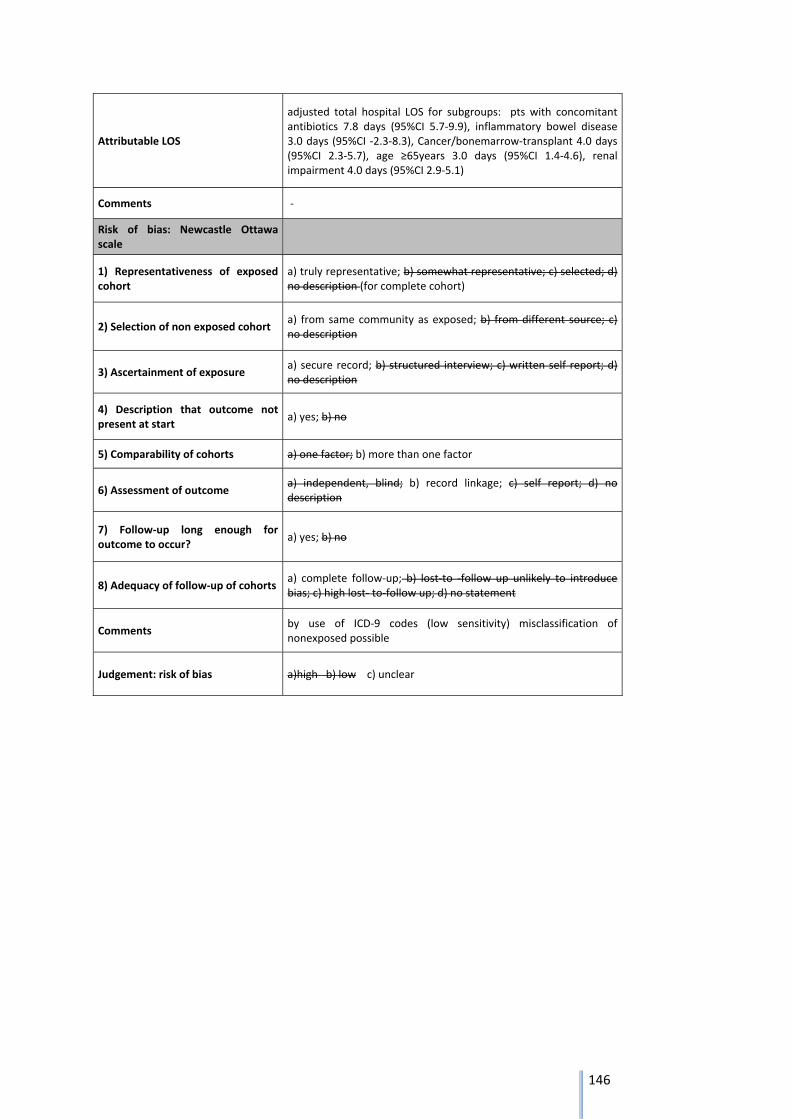
146
Attributable LOS
adjusted total hospital LOS for subgroups: pts with concomitant antibiotics 7.8 days (95%CI 5.7‐9.9), inflammatory bowel disease 3.0 days (95%CI ‐2.3‐8.3), Cancer/bonemarrow‐transplant 4.0 days (95%CI 2.3‐5.7), age ≥65years 3.0 days (95%CI 1.4‐4.6), renal impairment 4.0 days (95%CI 2.9‐5.1)
Comments ‐
Risk of bias: Newcastle Ottawa scale
1) Representativeness of exposed cohort
a) truly representative; b) somewhat representative; c) selected; d) no description (for complete cohort)
2) Selection of non exposed cohort a) from same community as exposed; b) from different source; c) no description
3) Ascertainment of exposure a) secure record; b) structured interview; c) written self report; d) no description
4) Description that outcome not present at start
a) yes; b) no
5) Comparability of cohorts a) one factor; b) more than one factor
6) Assessment of outcome a) independent, blind; b) record linkage; c) self report; d) no description
7) Follow‐up long enough for outcome to occur?
a) yes; b) no
8) Adequacy of follow‐up of cohorts a) complete follow‐up; b) lost‐to ‐follow up unlikely to introduce bias; c) high lost‐ to‐follow up; d) no statement
Comments by use of ICD‐9 codes (low sensitivity) misclassification of nonexposed possible
Judgement: risk of bias a)high b) low c) unclear
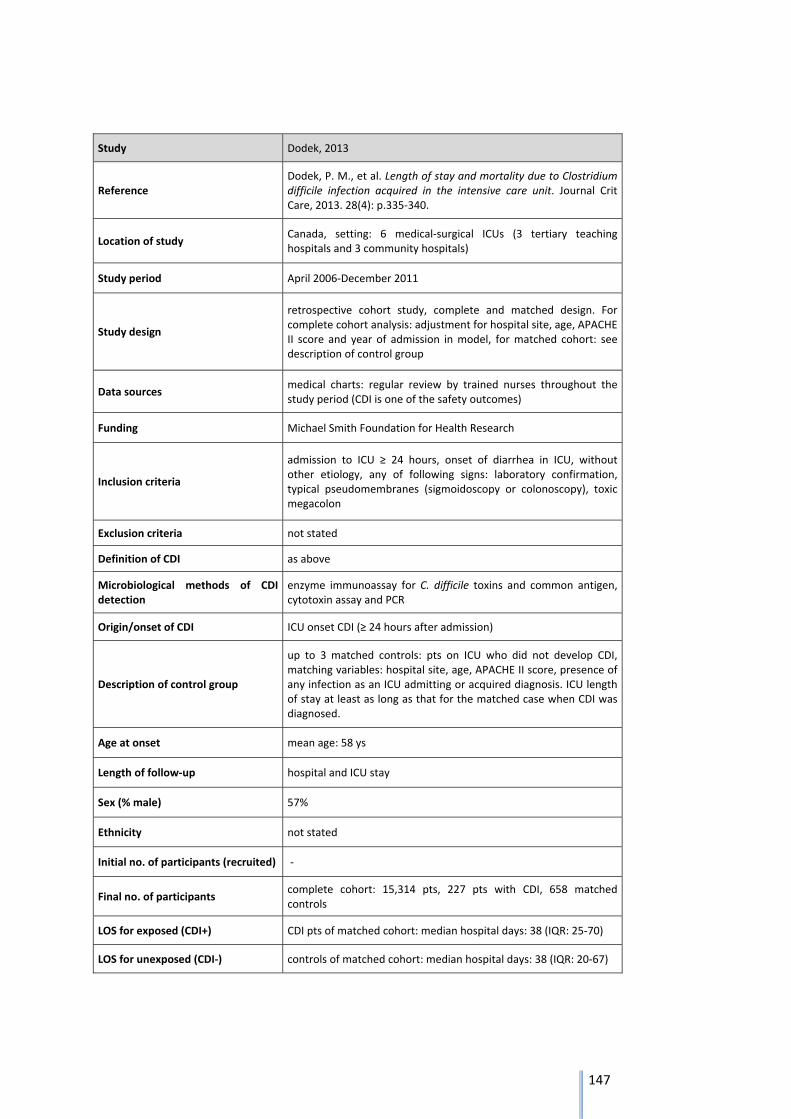
147
Study Dodek, 2013
Reference Dodek, P. M., et al. Length of stay and mortality due to Clostridium difficile infection acquired in the intensive care unit. Journal Crit Care, 2013. 28(4): p.335‐340.
Location of study Canada, setting: 6 medical‐surgical ICUs (3 tertiary teaching hospitals and 3 community hospitals)
Study period April 2006‐December 2011
Study design
retrospective cohort study, complete and matched design. For complete cohort analysis: adjustment for hospital site, age, APACHE II score and year of admission in model, for matched cohort: see description of control group
Data sources medical charts: regular review by trained nurses throughout the study period (CDI is one of the safety outcomes)
Funding Michael Smith Foundation for Health Research
Inclusion criteria
admission to ICU ≥ 24 hours, onset of diarrhea in ICU, without other etiology, any of following signs: laboratory confirmation, typical pseudomembranes (sigmoidoscopy or colonoscopy), toxic megacolon
Exclusion criteria not stated
Definition of CDI as above
Microbiological methods of CDI detection
enzyme immunoassay for C. difficile toxins and common antigen, cytotoxin assay and PCR
Origin/onset of CDI ICU onset CDI (≥ 24 hours after admission)
Description of control group
up to 3 matched controls: pts on ICU who did not develop CDI, matching variables: hospital site, age, APACHE II score, presence of any infection as an ICU admitting or acquired diagnosis. ICU length of stay at least as long as that for the matched case when CDI was diagnosed.
Age at onset mean age: 58 ys
Length of follow‐up hospital and ICU stay
Sex (% male) 57%
Ethnicity not stated
Initial no. of participants (recruited) ‐
Final no. of participants complete cohort: 15,314 pts, 227 pts with CDI, 658 matched controls
LOS for exposed (CDI+) CDI pts of matched cohort: median hospital days: 38 (IQR: 25‐70)
LOS for unexposed (CDI‐) controls of matched cohort: median hospital days: 38 (IQR: 20‐67)
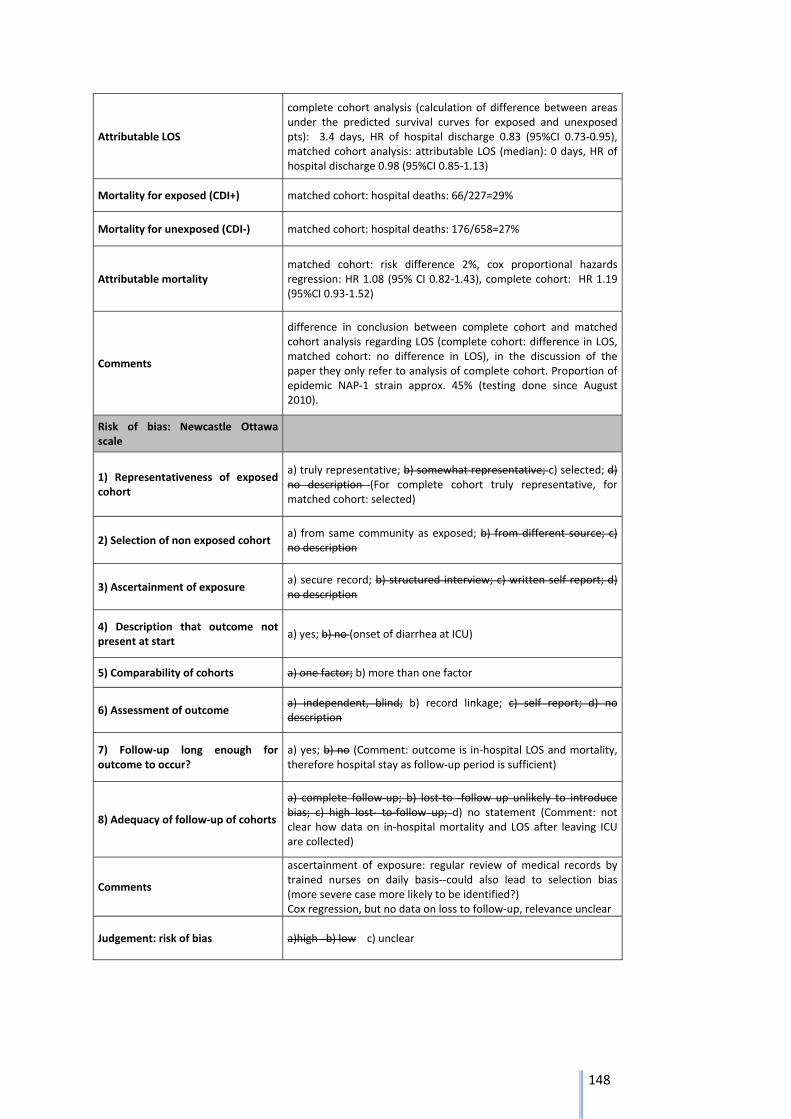
148
Attributable LOS
complete cohort analysis (calculation of difference between areas under the predicted survival curves for exposed and unexposed pts): 3.4 days, HR of hospital discharge 0.83 (95%CI 0.73‐0.95), matched cohort analysis: attributable LOS (median): 0 days, HR of hospital discharge 0.98 (95%CI 0.85‐1.13)
Mortality for exposed (CDI+) matched cohort: hospital deaths: 66/227=29%
Mortality for unexposed (CDI‐) matched cohort: hospital deaths: 176/658=27%
Attributable mortality matched cohort: risk difference 2%, cox proportional hazards regression: HR 1.08 (95% CI 0.82‐1.43), complete cohort: HR 1.19 (95%CI 0.93‐1.52)
Comments
difference in conclusion between complete cohort and matched cohort analysis regarding LOS (complete cohort: difference in LOS, matched cohort: no difference in LOS), in the discussion of the paper they only refer to analysis of complete cohort. Proportion of epidemic NAP‐1 strain approx. 45% (testing done since August 2010).
Risk of bias: Newcastle Ottawa scale
1) Representativeness of exposed cohort
a) truly representative; b) somewhat representative; c) selected; d) no description (For complete cohort truly representative, for matched cohort: selected)
2) Selection of non exposed cohort a) from same community as exposed; b) from different source; c) no description
3) Ascertainment of exposure a) secure record; b) structured interview; c) written self report; d) no description
4) Description that outcome not present at start
a) yes; b) no (onset of diarrhea at ICU)
5) Comparability of cohorts a) one factor; b) more than one factor
6) Assessment of outcome a) independent, blind; b) record linkage; c) self report; d) no description
7) Follow‐up long enough for outcome to occur?
a) yes; b) no (Comment: outcome is in‐hospital LOS and mortality, therefore hospital stay as follow‐up period is sufficient)
8) Adequacy of follow‐up of cohorts
a) complete follow‐up; b) lost‐to ‐follow up unlikely to introduce bias; c) high lost‐ to‐follow up; d) no statement (Comment: not clear how data on in‐hospital mortality and LOS after leaving ICU are collected)
Comments
ascertainment of exposure: regular review of medical records by trained nurses on daily basis‐‐could also lead to selection bias (more severe case more likely to be identified?) Cox regression, but no data on loss to follow‐up, relevance unclear
Judgement: risk of bias a)high b) low c) unclear
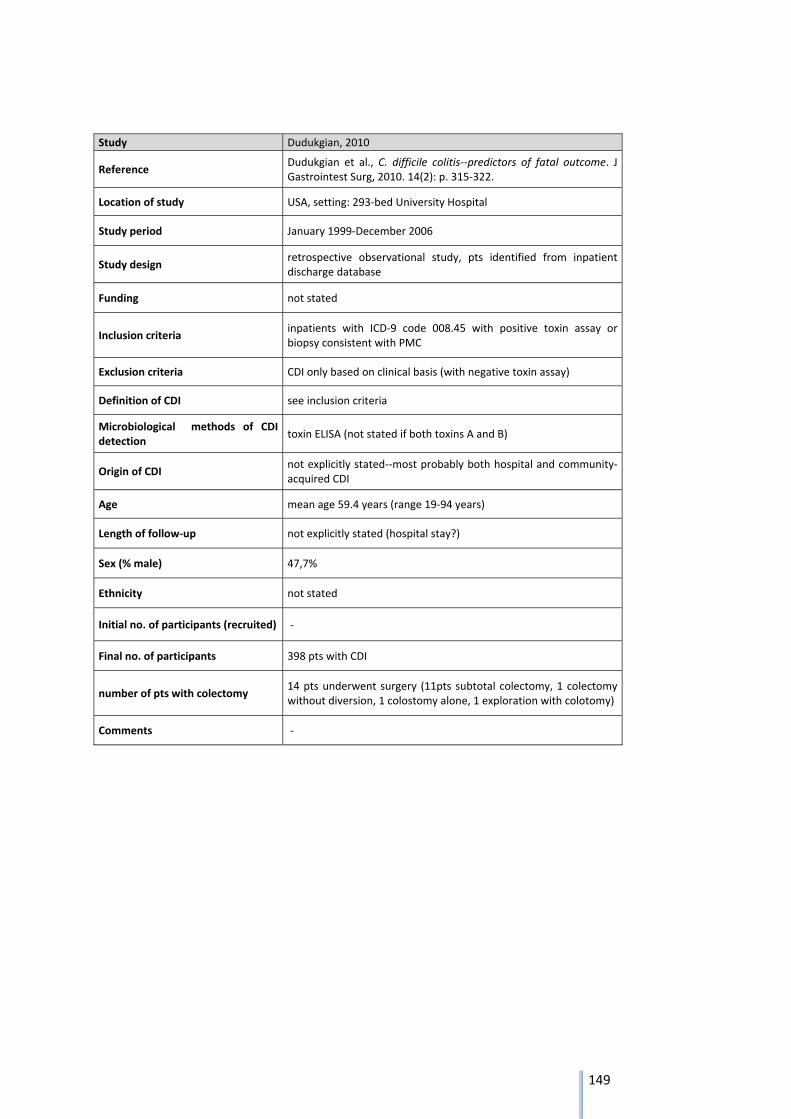
149
Study Dudukgian, 2010
Reference Dudukgian et al., C. difficile colitis‐‐predictors of fatal outcome. J Gastrointest Surg, 2010. 14(2): p. 315‐322.
Location of study USA, setting: 293‐bed University Hospital
Study period January 1999‐December 2006
Study design retrospective observational study, pts identified from inpatient discharge database
Funding not stated
Inclusion criteria inpatients with ICD‐9 code 008.45 with positive toxin assay or biopsy consistent with PMC
Exclusion criteria CDI only based on clinical basis (with negative toxin assay)
Definition of CDI see inclusion criteria
Microbiological methods of CDI detection
toxin ELISA (not stated if both toxins A and B)
Origin of CDI not explicitly stated‐‐most probably both hospital and community‐acquired CDI
Age mean age 59.4 years (range 19‐94 years)
Length of follow‐up not explicitly stated (hospital stay?)
Sex (% male) 47,7%
Ethnicity not stated
Initial no. of participants (recruited) ‐
Final no. of participants 398 pts with CDI
number of pts with colectomy 14 pts underwent surgery (11pts subtotal colectomy, 1 colectomy without diversion, 1 colostomy alone, 1 exploration with colotomy)
Comments ‐
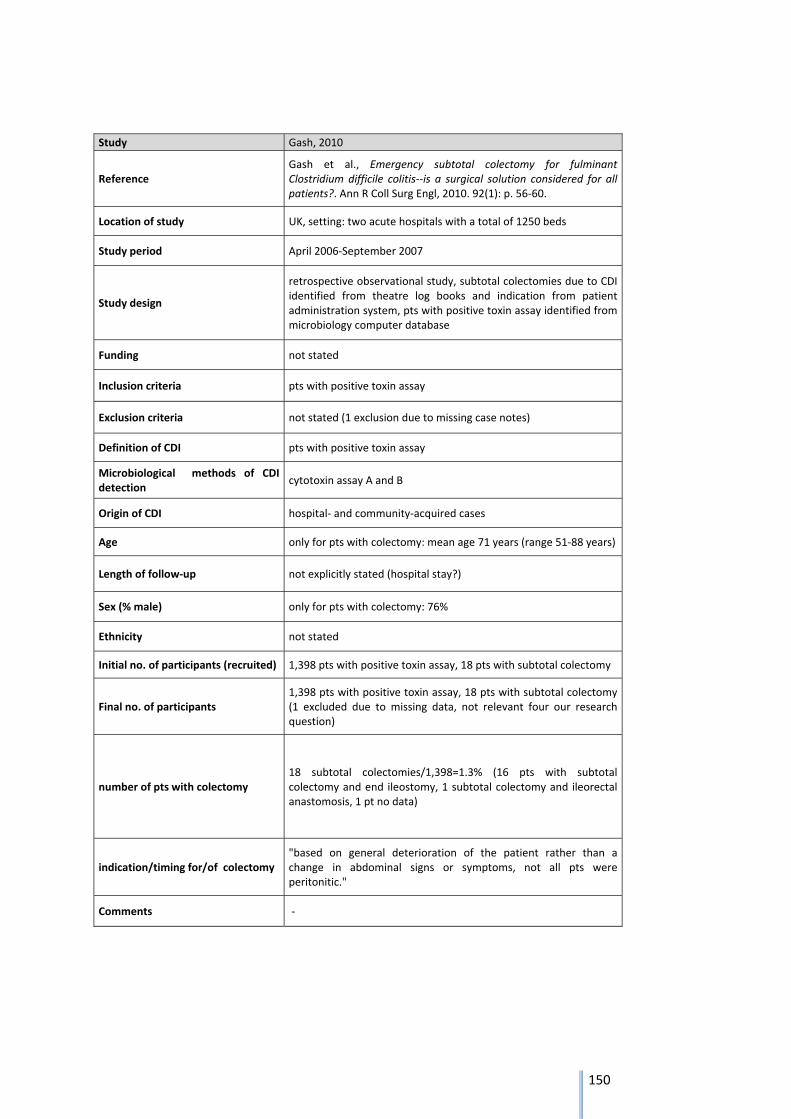
150
Study Gash, 2010
Reference Gash et al., Emergency subtotal colectomy for fulminant Clostridium difficile colitis‐‐is a surgical solution considered for all patients?. Ann R Coll Surg Engl, 2010. 92(1): p. 56‐60.
Location of study UK, setting: two acute hospitals with a total of 1250 beds
Study period April 2006‐September 2007
Study design
retrospective observational study, subtotal colectomies due to CDI identified from theatre log books and indication from patient administration system, pts with positive toxin assay identified from microbiology computer database
Funding not stated
Inclusion criteria pts with positive toxin assay
Exclusion criteria not stated (1 exclusion due to missing case notes)
Definition of CDI pts with positive toxin assay
Microbiological methods of CDI detection
cytotoxin assay A and B
Origin of CDI hospital‐ and community‐acquired cases
Age only for pts with colectomy: mean age 71 years (range 51‐88 years)
Length of follow‐up not explicitly stated (hospital stay?)
Sex (% male) only for pts with colectomy: 76%
Ethnicity not stated
Initial no. of participants (recruited) 1,398 pts with positive toxin assay, 18 pts with subtotal colectomy
Final no. of participants 1,398 pts with positive toxin assay, 18 pts with subtotal colectomy (1 excluded due to missing data, not relevant four our research question)
number of pts with colectomy 18 subtotal colectomies/1,398=1.3% (16 pts with subtotal colectomy and end ileostomy, 1 subtotal colectomy and ileorectal anastomosis, 1 pt no data)
indication/timing for/of colectomy "based on general deterioration of the patient rather than a change in abdominal signs or symptoms, not all pts were peritonitic."
Comments ‐
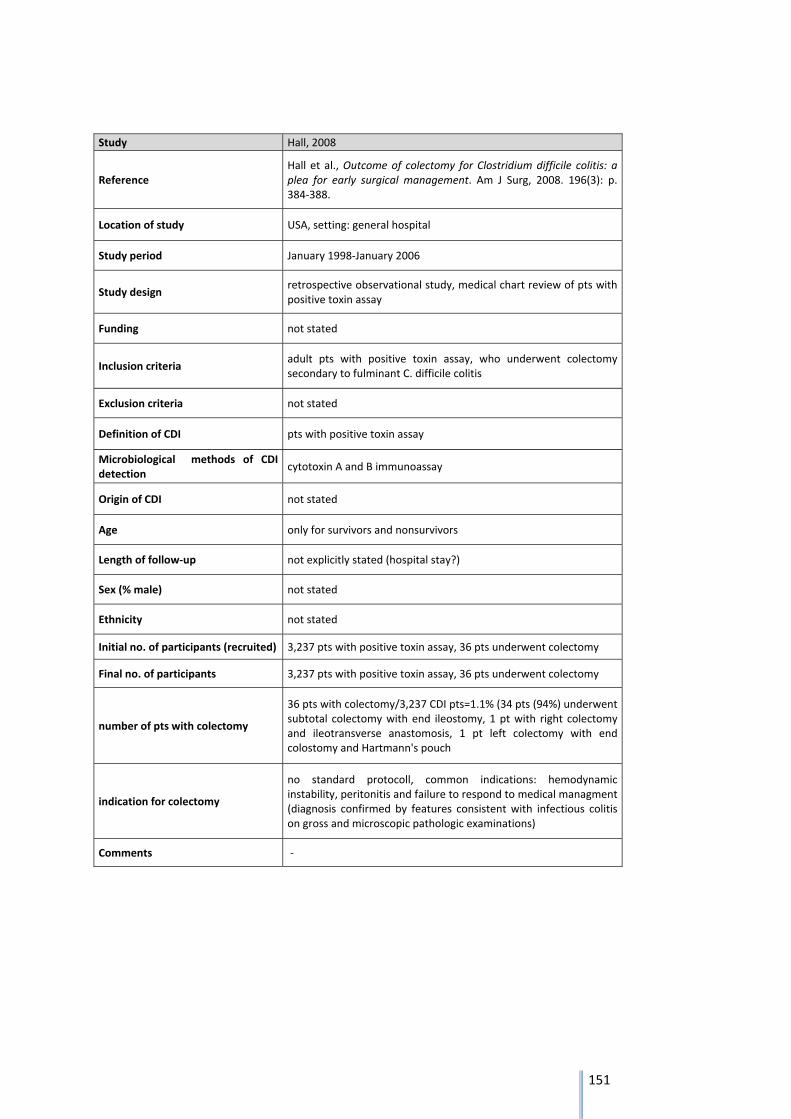
151
Study Hall, 2008
Reference Hall et al., Outcome of colectomy for Clostridium difficile colitis: a plea for early surgical management. Am J Surg, 2008. 196(3): p. 384‐388.
Location of study USA, setting: general hospital
Study period January 1998‐January 2006
Study design retrospective observational study, medical chart review of pts with positive toxin assay
Funding not stated
Inclusion criteria adult pts with positive toxin assay, who underwent colectomy secondary to fulminant C. difficile colitis
Exclusion criteria not stated
Definition of CDI pts with positive toxin assay
Microbiological methods of CDI detection
cytotoxin A and B immunoassay
Origin of CDI not stated
Age only for survivors and nonsurvivors
Length of follow‐up not explicitly stated (hospital stay?)
Sex (% male) not stated
Ethnicity not stated
Initial no. of participants (recruited) 3,237 pts with positive toxin assay, 36 pts underwent colectomy
Final no. of participants 3,237 pts with positive toxin assay, 36 pts underwent colectomy
number of pts with colectomy
36 pts with colectomy/3,237 CDI pts=1.1% (34 pts (94%) underwent subtotal colectomy with end ileostomy, 1 pt with right colectomy and ileotransverse anastomosis, 1 pt left colectomy with end colostomy and Hartmann's pouch
indication for colectomy
no standard protocoll, common indications: hemodynamic instability, peritonitis and failure to respond to medical managment (diagnosis confirmed by features consistent with infectious colitis on gross and microscopic pathologic examinations)
Comments ‐
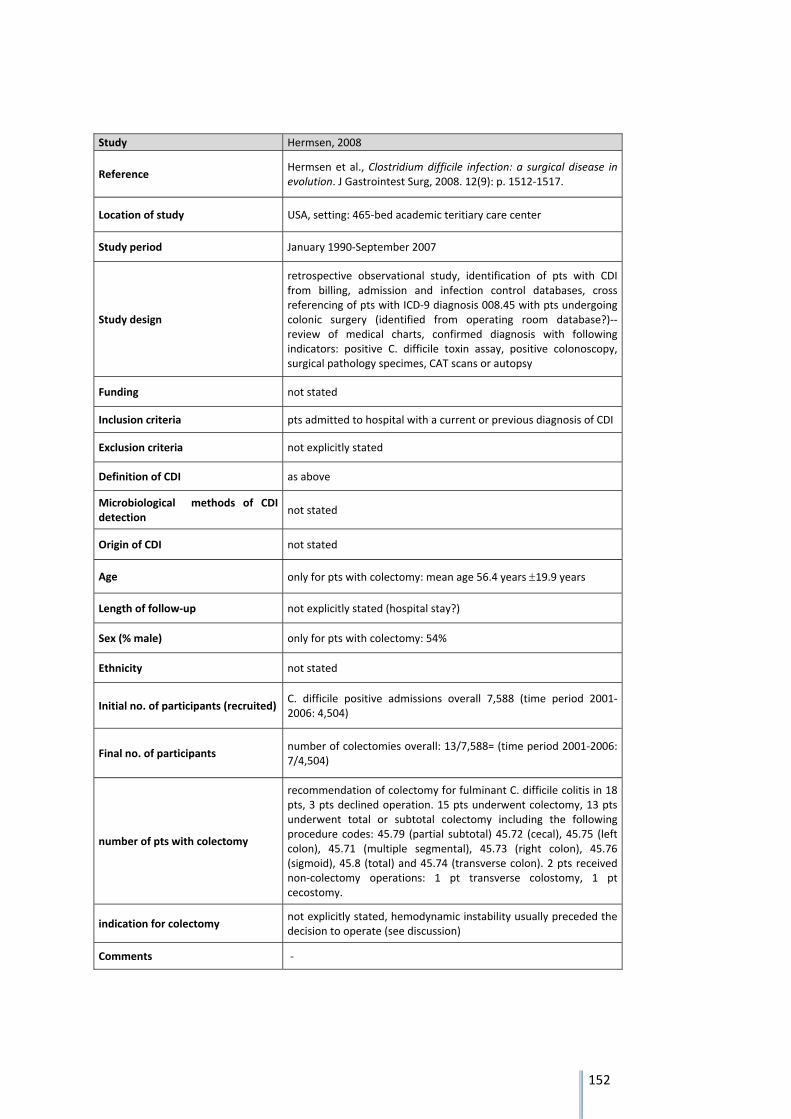
152
Study Hermsen, 2008
Reference Hermsen et al., Clostridium difficile infection: a surgical disease in evolution. J Gastrointest Surg, 2008. 12(9): p. 1512‐1517.
Location of study USA, setting: 465‐bed academic teritiary care center
Study period January 1990‐September 2007
Study design
retrospective observational study, identification of pts with CDI from billing, admission and infection control databases, cross referencing of pts with ICD‐9 diagnosis 008.45 with pts undergoing colonic surgery (identified from operating room database?)‐‐ review of medical charts, confirmed diagnosis with following indicators: positive C. difficile toxin assay, positive colonoscopy, surgical pathology specimes, CAT scans or autopsy
Funding not stated
Inclusion criteria pts admitted to hospital with a current or previous diagnosis of CDI
Exclusion criteria not explicitly stated
Definition of CDI as above
Microbiological methods of CDI detection
not stated
Origin of CDI not stated
Age only for pts with colectomy: mean age 56.4 years 19.9 years
Length of follow‐up not explicitly stated (hospital stay?)
Sex (% male) only for pts with colectomy: 54%
Ethnicity not stated
Initial no. of participants (recruited) C. difficile positive admissions overall 7,588 (time period 2001‐2006: 4,504)
Final no. of participants number of colectomies overall: 13/7,588= (time period 2001‐2006: 7/4,504)
number of pts with colectomy
recommendation of colectomy for fulminant C. difficile colitis in 18 pts, 3 pts declined operation. 15 pts underwent colectomy, 13 pts underwent total or subtotal colectomy including the following procedure codes: 45.79 (partial subtotal) 45.72 (cecal), 45.75 (left colon), 45.71 (multiple segmental), 45.73 (right colon), 45.76 (sigmoid), 45.8 (total) and 45.74 (transverse colon). 2 pts received non‐colectomy operations: 1 pt transverse colostomy, 1 pt cecostomy.
indication for colectomy not explicitly stated, hemodynamic instability usually preceded the decision to operate (see discussion)
Comments ‐
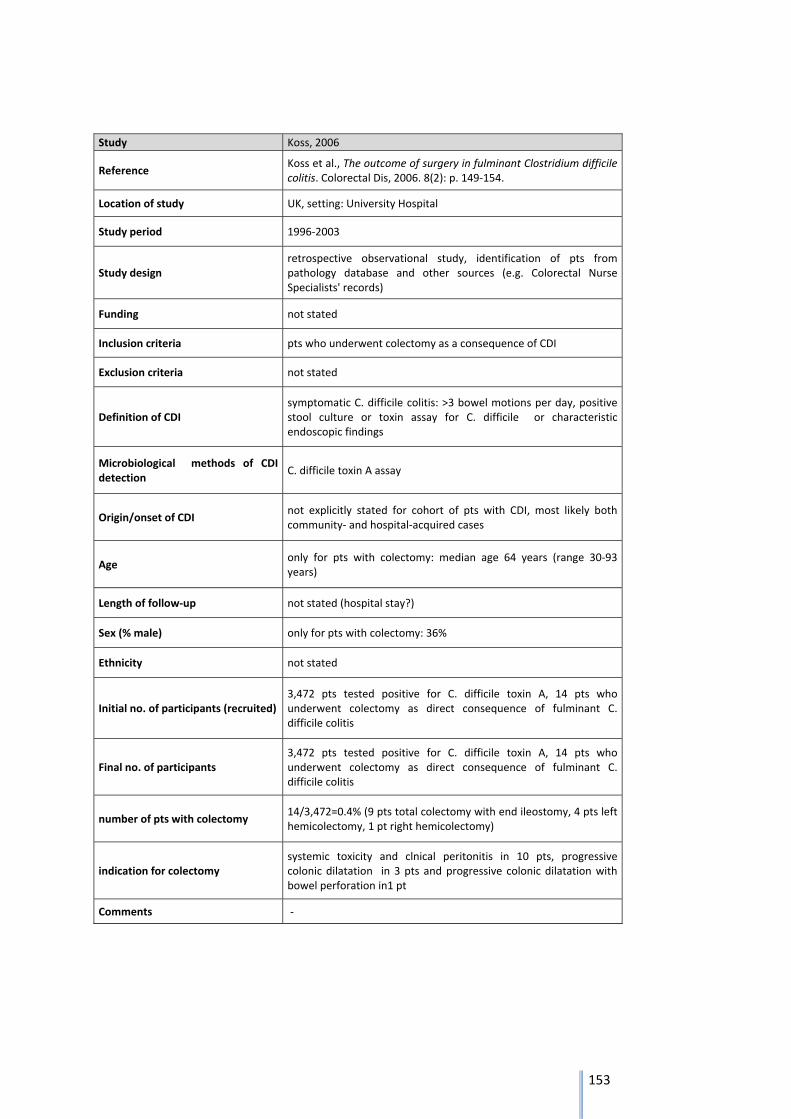
153
Study Koss, 2006
Reference Koss et al., The outcome of surgery in fulminant Clostridium difficile colitis. Colorectal Dis, 2006. 8(2): p. 149‐154.
Location of study UK, setting: University Hospital
Study period 1996‐2003
Study design retrospective observational study, identification of pts from pathology database and other sources (e.g. Colorectal Nurse Specialists' records)
Funding not stated
Inclusion criteria pts who underwent colectomy as a consequence of CDI
Exclusion criteria not stated
Definition of CDI symptomatic C. difficile colitis: >3 bowel motions per day, positive stool culture or toxin assay for C. difficile or characteristic endoscopic findings
Microbiological methods of CDI detection
C. difficile toxin A assay
Origin/onset of CDI not explicitly stated for cohort of pts with CDI, most likely both community‐ and hospital‐acquired cases
Age only for pts with colectomy: median age 64 years (range 30‐93 years)
Length of follow‐up not stated (hospital stay?)
Sex (% male) only for pts with colectomy: 36%
Ethnicity not stated
Initial no. of participants (recruited) 3,472 pts tested positive for C. difficile toxin A, 14 pts who underwent colectomy as direct consequence of fulminant C. difficile colitis
Final no. of participants 3,472 pts tested positive for C. difficile toxin A, 14 pts who underwent colectomy as direct consequence of fulminant C. difficile colitis
number of pts with colectomy 14/3,472=0.4% (9 pts total colectomy with end ileostomy, 4 pts left hemicolectomy, 1 pt right hemicolectomy)
indication for colectomy systemic toxicity and clnical peritonitis in 10 pts, progressive colonic dilatation in 3 pts and progressive colonic dilatation with bowel perforation in1 pt
Comments ‐
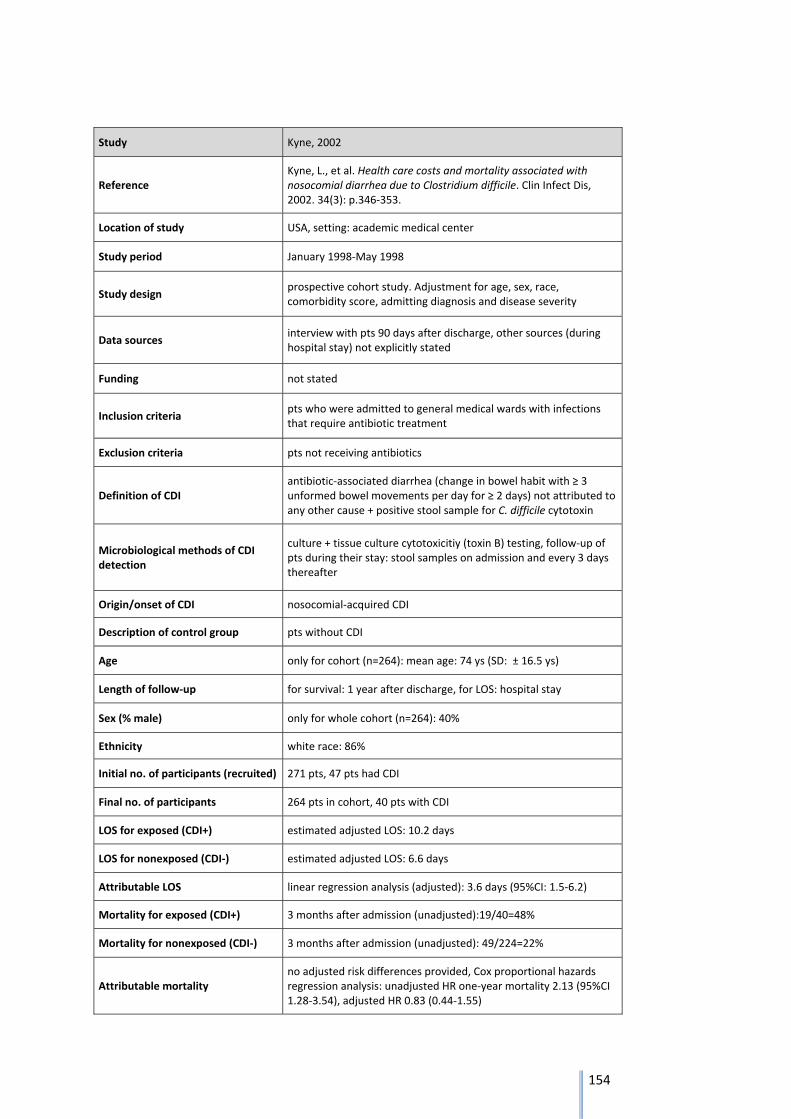
154
Study Kyne, 2002
Reference Kyne, L., et al. Health care costs and mortality associated with nosocomial diarrhea due to Clostridium difficile. Clin Infect Dis, 2002. 34(3): p.346‐353.
Location of study USA, setting: academic medical center
Study period January 1998‐May 1998
Study design prospective cohort study. Adjustment for age, sex, race, comorbidity score, admitting diagnosis and disease severity
Data sources interview with pts 90 days after discharge, other sources (during hospital stay) not explicitly stated
Funding not stated
Inclusion criteria pts who were admitted to general medical wards with infections that require antibiotic treatment
Exclusion criteria pts not receiving antibiotics
Definition of CDI antibiotic‐associated diarrhea (change in bowel habit with ≥ 3 unformed bowel movements per day for ≥ 2 days) not attributed to any other cause + positive stool sample for C. difficile cytotoxin
Microbiological methods of CDI detection
culture + tissue culture cytotoxicitiy (toxin B) testing, follow‐up of pts during their stay: stool samples on admission and every 3 days thereafter
Origin/onset of CDI nosocomial‐acquired CDI
Description of control group pts without CDI
Age only for cohort (n=264): mean age: 74 ys (SD: ± 16.5 ys)
Length of follow‐up for survival: 1 year after discharge, for LOS: hospital stay
Sex (% male) only for whole cohort (n=264): 40%
Ethnicity white race: 86%
Initial no. of participants (recruited) 271 pts, 47 pts had CDI
Final no. of participants 264 pts in cohort, 40 pts with CDI
LOS for exposed (CDI+) estimated adjusted LOS: 10.2 days
LOS for nonexposed (CDI‐) estimated adjusted LOS: 6.6 days
Attributable LOS linear regression analysis (adjusted): 3.6 days (95%CI: 1.5‐6.2)
Mortality for exposed (CDI+) 3 months after admission (unadjusted):19/40=48%
Mortality for nonexposed (CDI‐) 3 months after admission (unadjusted): 49/224=22%
Attributable mortality no adjusted risk differences provided, Cox proportional hazards regression analysis: unadjusted HR one‐year mortality 2.13 (95%CI 1.28‐3.54), adjusted HR 0.83 (0.44‐1.55)
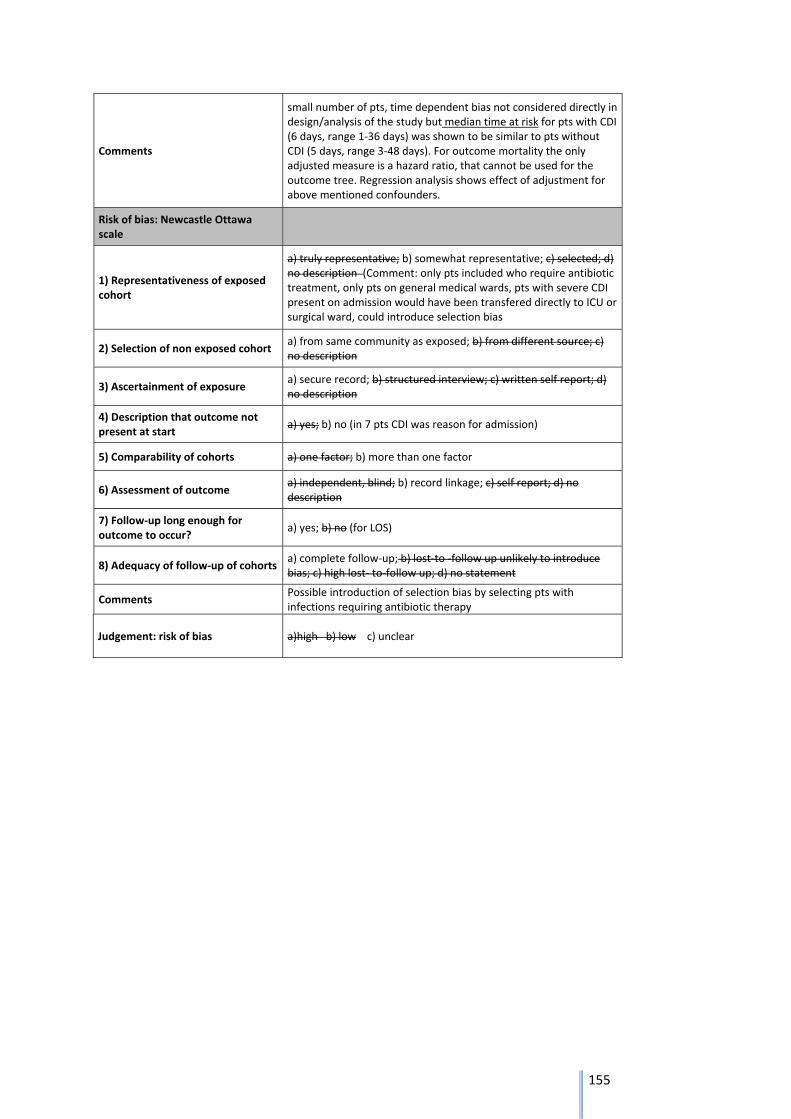
155
Comments
small number of pts, time dependent bias not considered directly in design/analysis of the study but median time at risk for pts with CDI (6 days, range 1‐36 days) was shown to be similar to pts without CDI (5 days, range 3‐48 days). For outcome mortality the only adjusted measure is a hazard ratio, that cannot be used for the outcome tree. Regression analysis shows effect of adjustment for above mentioned confounders.
Risk of bias: Newcastle Ottawa scale
1) Representativeness of exposed cohort
a) truly representative; b) somewhat representative; c) selected; d) no description (Comment: only pts included who require antibiotic treatment, only pts on general medical wards, pts with severe CDI present on admission would have been transfered directly to ICU or surgical ward, could introduce selection bias
2) Selection of non exposed cohort a) from same community as exposed; b) from different source; c) no description
3) Ascertainment of exposure a) secure record; b) structured interview; c) written self report; d) no description
4) Description that outcome not present at start
a) yes; b) no (in 7 pts CDI was reason for admission)
5) Comparability of cohorts a) one factor; b) more than one factor
6) Assessment of outcome a) independent, blind; b) record linkage; c) self report; d) no description
7) Follow‐up long enough for outcome to occur?
a) yes; b) no (for LOS)
8) Adequacy of follow‐up of cohorts a) complete follow‐up; b) lost‐to ‐follow up unlikely to introduce bias; c) high lost‐ to‐follow up; d) no statement
Comments Possible introduction of selection bias by selecting pts with infections requiring antibiotic therapy
Judgement: risk of bias a)high b) low c) unclear
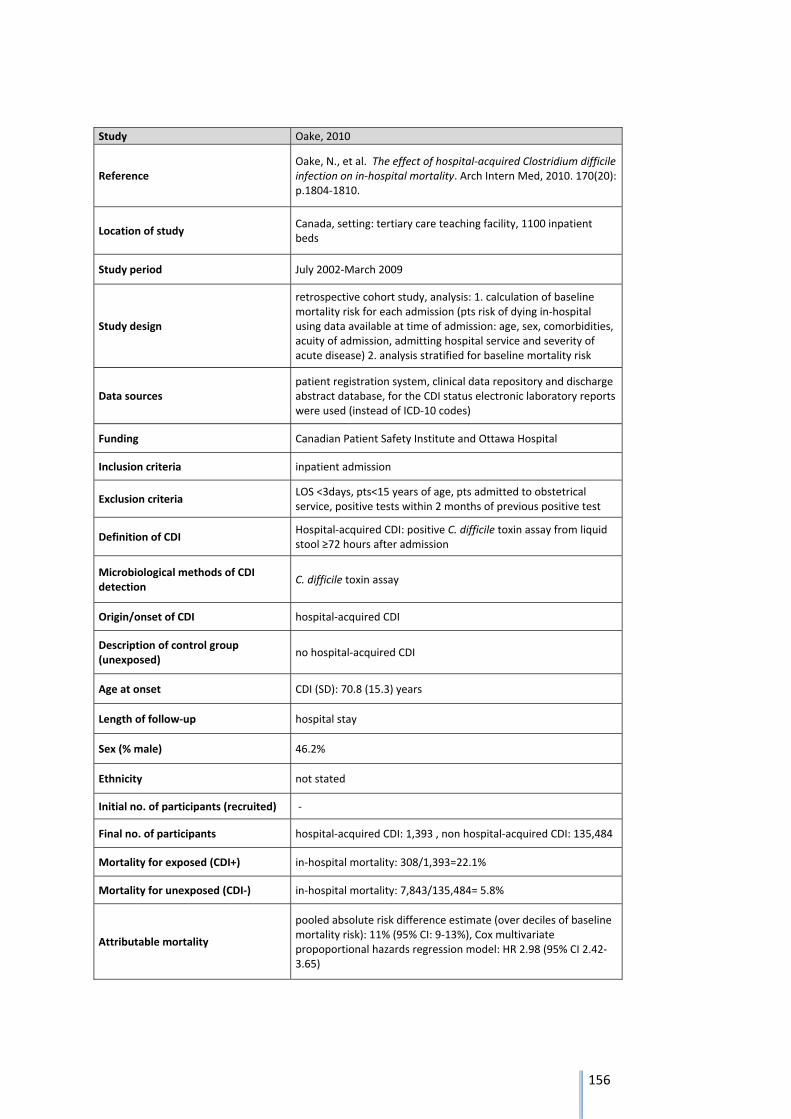
156
Study Oake, 2010
Reference Oake, N., et al. The effect of hospital‐acquired Clostridium difficile infection on in‐hospital mortality. Arch Intern Med, 2010. 170(20): p.1804‐1810.
Location of study Canada, setting: tertiary care teaching facility, 1100 inpatient beds
Study period July 2002‐March 2009
Study design
retrospective cohort study, analysis: 1. calculation of baseline mortality risk for each admission (pts risk of dying in‐hospital using data available at time of admission: age, sex, comorbidities, acuity of admission, admitting hospital service and severity of acute disease) 2. analysis stratified for baseline mortality risk
Data sources patient registration system, clinical data repository and discharge abstract database, for the CDI status electronic laboratory reports were used (instead of ICD‐10 codes)
Funding Canadian Patient Safety Institute and Ottawa Hospital
Inclusion criteria inpatient admission
Exclusion criteria LOS <3days, pts<15 years of age, pts admitted to obstetrical service, positive tests within 2 months of previous positive test
Definition of CDI Hospital‐acquired CDI: positive C. difficile toxin assay from liquid stool ≥72 hours after admission
Microbiological methods of CDI detection
C. difficile toxin assay
Origin/onset of CDI hospital‐acquired CDI
Description of control group (unexposed)
no hospital‐acquired CDI
Age at onset CDI (SD): 70.8 (15.3) years
Length of follow‐up hospital stay
Sex (% male) 46.2%
Ethnicity not stated
Initial no. of participants (recruited) ‐
Final no. of participants hospital‐acquired CDI: 1,393 , non hospital‐acquired CDI: 135,484
Mortality for exposed (CDI+) in‐hospital mortality: 308/1,393=22.1%
Mortality for unexposed (CDI‐) in‐hospital mortality: 7,843/135,484= 5.8%
Attributable mortality
pooled absolute risk difference estimate (over deciles of baseline mortality risk): 11% (95% CI: 9‐13%), Cox multivariate propoportional hazards regression model: HR 2.98 (95% CI 2.42‐3.65)
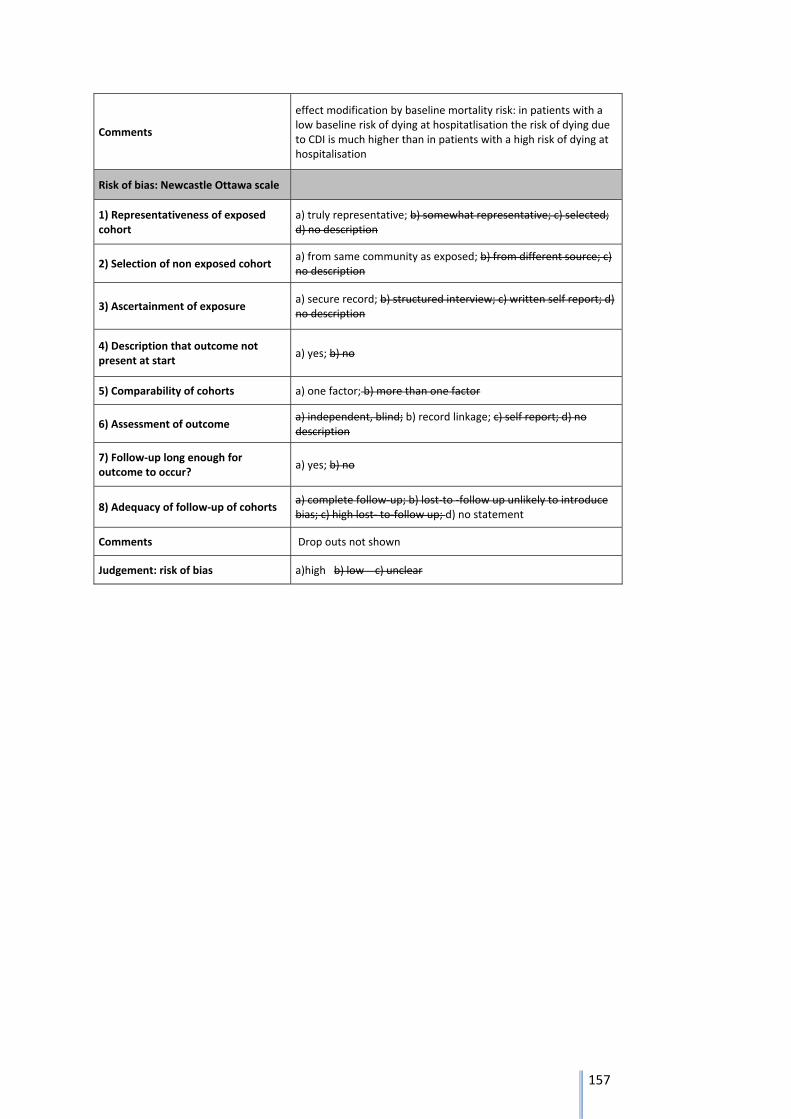
157
Comments
effect modification by baseline mortality risk: in patients with a low baseline risk of dying at hospitatlisation the risk of dying due to CDI is much higher than in patients with a high risk of dying at hospitalisation
Risk of bias: Newcastle Ottawa scale
1) Representativeness of exposed cohort
a) truly representative; b) somewhat representative; c) selected; d) no description
2) Selection of non exposed cohort a) from same community as exposed; b) from different source; c) no description
3) Ascertainment of exposure a) secure record; b) structured interview; c) written self report; d) no description
4) Description that outcome not present at start
a) yes; b) no
5) Comparability of cohorts a) one factor; b) more than one factor
6) Assessment of outcome a) independent, blind; b) record linkage; c) self report; d) no description
7) Follow‐up long enough for outcome to occur?
a) yes; b) no
8) Adequacy of follow‐up of cohorts a) complete follow‐up; b) lost‐to ‐follow up unlikely to introduce bias; c) high lost‐ to‐follow up; d) no statement
Comments Drop outs not shown
Judgement: risk of bias a)high b) low c) unclear
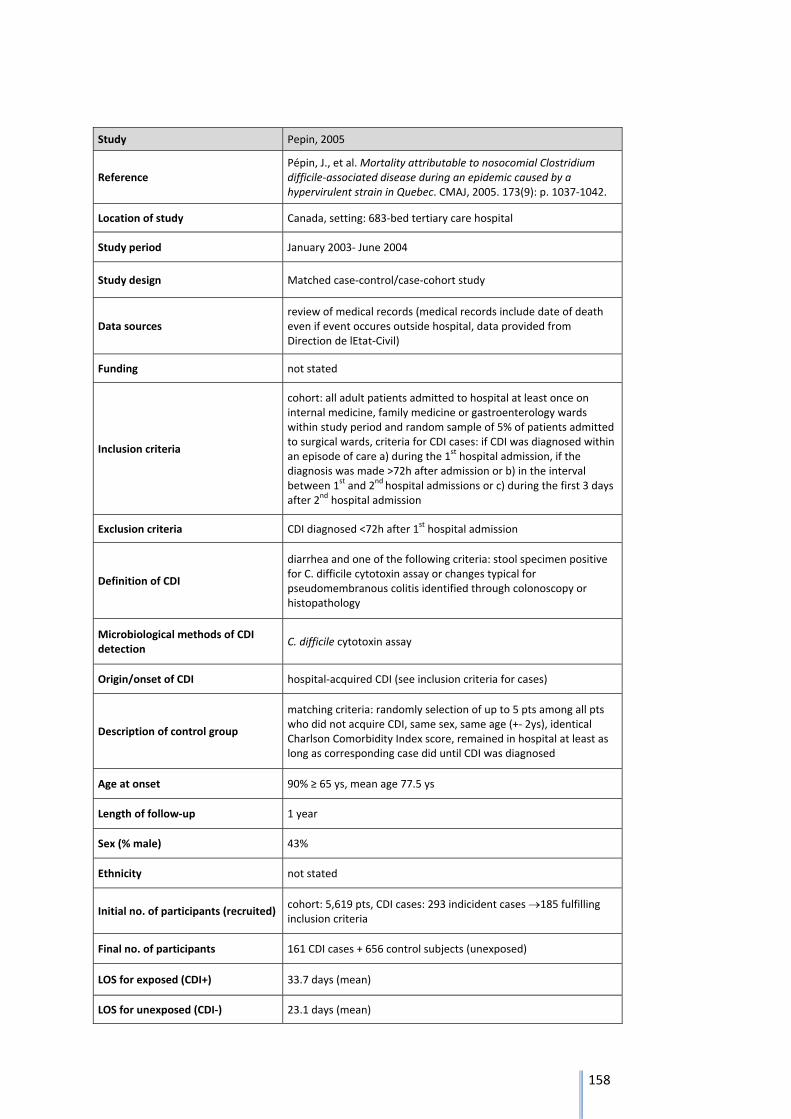
158
Study Pepin, 2005
Reference Pépin, J., et al. Mortality attributable to nosocomial Clostridium difficile‐associated disease during an epidemic caused by a hypervirulent strain in Quebec. CMAJ, 2005. 173(9): p. 1037‐1042.
Location of study Canada, setting: 683‐bed tertiary care hospital
Study period January 2003‐ June 2004
Study design Matched case‐control/case‐cohort study
Data sources review of medical records (medical records include date of death even if event occures outside hospital, data provided from Direction de lEtat‐Civil)
Funding not stated
Inclusion criteria
cohort: all adult patients admitted to hospital at least once on internal medicine, family medicine or gastroenterology wards within study period and random sample of 5% of patients admitted to surgical wards, criteria for CDI cases: if CDI was diagnosed within an episode of care a) during the 1
st hospital admission, if the diagnosis was made >72h after admission or b) in the interval between 1
st and 2nd hospital admissions or c) during the first 3 days after 2
nd hospital admission
Exclusion criteria CDI diagnosed <72h after 1st hospital admission
Definition of CDI
diarrhea and one of the following criteria: stool specimen positive for C. difficile cytotoxin assay or changes typical for pseudomembranous colitis identified through colonoscopy or histopathology
Microbiological methods of CDI detection
C. difficile cytotoxin assay
Origin/onset of CDI hospital‐acquired CDI (see inclusion criteria for cases)
Description of control group
matching criteria: randomly selection of up to 5 pts among all pts who did not acquire CDI, same sex, same age (+‐ 2ys), identical Charlson Comorbidity Index score, remained in hospital at least as long as corresponding case did until CDI was diagnosed
Age at onset 90% ≥ 65 ys, mean age 77.5 ys
Length of follow‐up 1 year
Sex (% male) 43%
Ethnicity not stated
Initial no. of participants (recruited) cohort: 5,619 pts, CDI cases: 293 indicident cases 185 fulfilling inclusion criteria
Final no. of participants 161 CDI cases + 656 control subjects (unexposed)
LOS for exposed (CDI+) 33.7 days (mean)
LOS for unexposed (CDI‐) 23.1 days (mean)
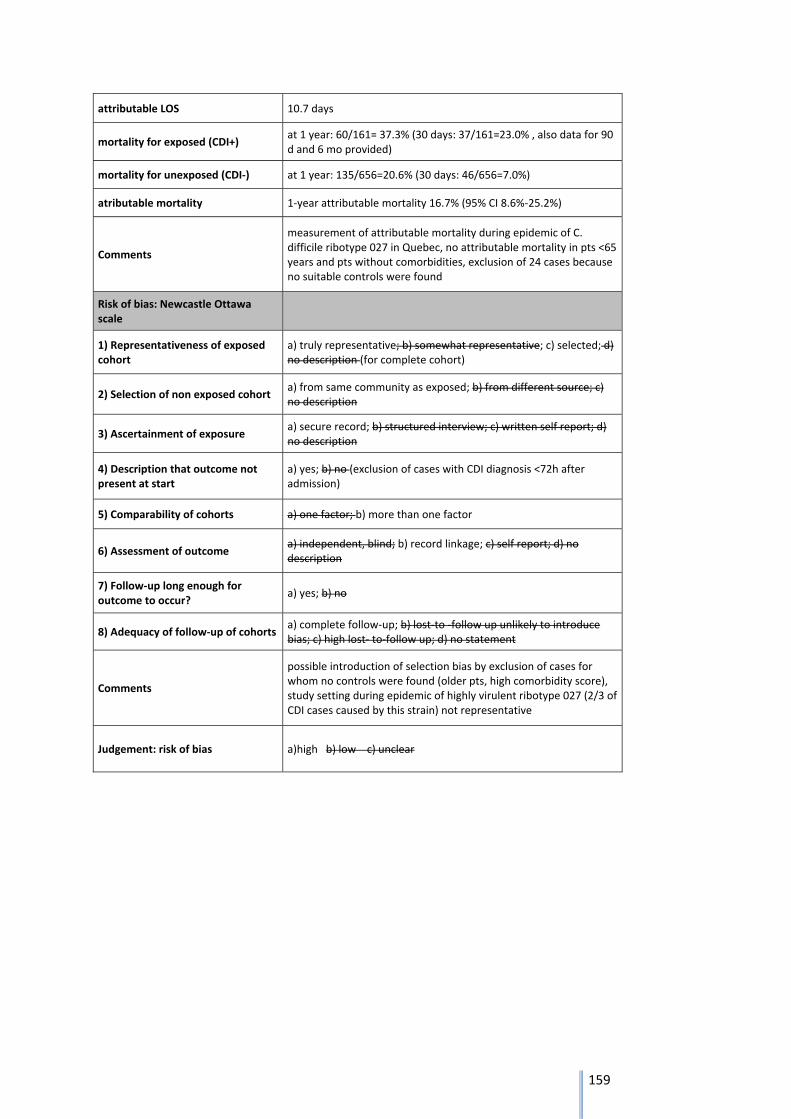
159
attributable LOS 10.7 days
mortality for exposed (CDI+) at 1 year: 60/161= 37.3% (30 days: 37/161=23.0% , also data for 90 d and 6 mo provided)
mortality for unexposed (CDI‐) at 1 year: 135/656=20.6% (30 days: 46/656=7.0%)
atributable mortality 1‐year attributable mortality 16.7% (95% CI 8.6%‐25.2%)
Comments
measurement of attributable mortality during epidemic of C. difficile ribotype 027 in Quebec, no attributable mortality in pts <65 years and pts without comorbidities, exclusion of 24 cases because no suitable controls were found
Risk of bias: Newcastle Ottawa scale
1) Representativeness of exposed cohort
a) truly representative; b) somewhat representative; c) selected; d) no description (for complete cohort)
2) Selection of non exposed cohort a) from same community as exposed; b) from different source; c) no description
3) Ascertainment of exposure a) secure record; b) structured interview; c) written self report; d) no description
4) Description that outcome not present at start
a) yes; b) no (exclusion of cases with CDI diagnosis <72h after admission)
5) Comparability of cohorts a) one factor; b) more than one factor
6) Assessment of outcome a) independent, blind; b) record linkage; c) self report; d) no description
7) Follow‐up long enough for outcome to occur?
a) yes; b) no
8) Adequacy of follow‐up of cohorts a) complete follow‐up; b) lost‐to ‐follow up unlikely to introduce bias; c) high lost‐ to‐follow up; d) no statement
Comments
possible introduction of selection bias by exclusion of cases for whom no controls were found (older pts, high comorbidity score), study setting during epidemic of highly virulent ribotype 027 (2/3 of CDI cases caused by this strain) not representative
Judgement: risk of bias a)high b) low c) unclear
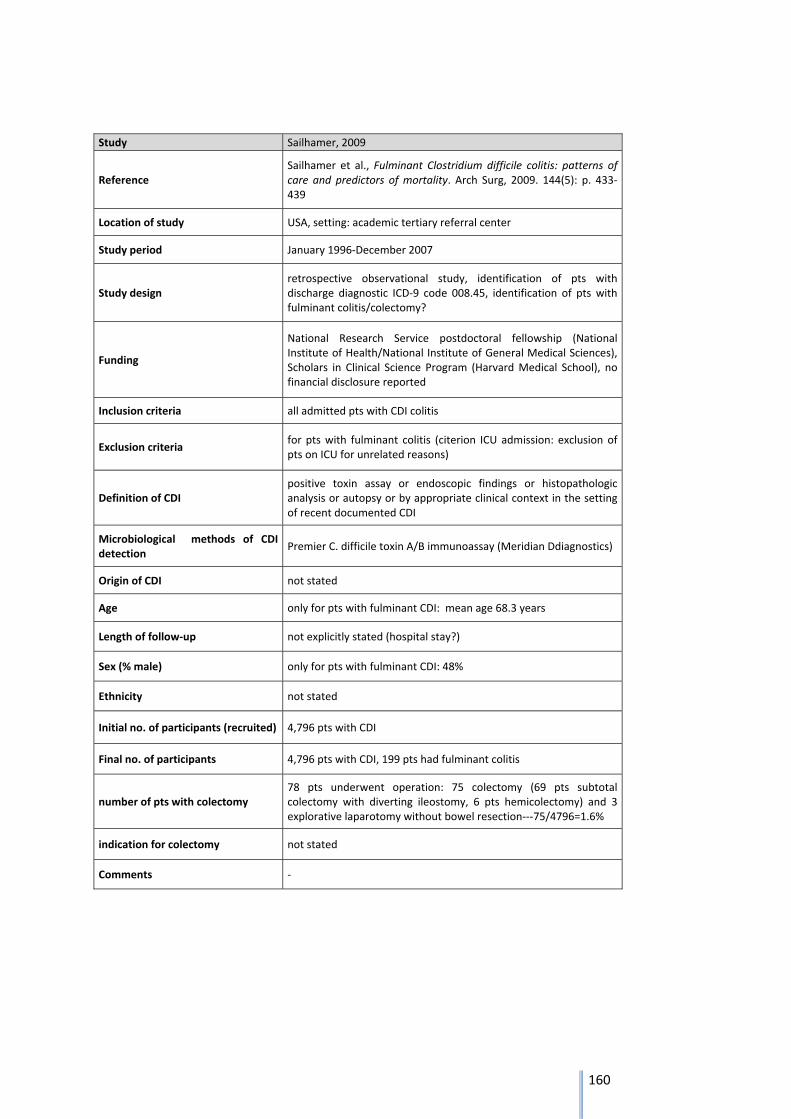
160
Study Sailhamer, 2009
Reference Sailhamer et al., Fulminant Clostridium difficile colitis: patterns of care and predictors of mortality. Arch Surg, 2009. 144(5): p. 433‐439
Location of study USA, setting: academic tertiary referral center
Study period January 1996‐December 2007
Study design retrospective observational study, identification of pts with discharge diagnostic ICD‐9 code 008.45, identification of pts with fulminant colitis/colectomy?
Funding
National Research Service postdoctoral fellowship (National Institute of Health/National Institute of General Medical Sciences), Scholars in Clinical Science Program (Harvard Medical School), no financial disclosure reported
Inclusion criteria all admitted pts with CDI colitis
Exclusion criteria for pts with fulminant colitis (citerion ICU admission: exclusion of pts on ICU for unrelated reasons)
Definition of CDI positive toxin assay or endoscopic findings or histopathologic analysis or autopsy or by appropriate clinical context in the setting of recent documented CDI
Microbiological methods of CDI detection
Premier C. difficile toxin A/B immunoassay (Meridian Ddiagnostics)
Origin of CDI not stated
Age only for pts with fulminant CDI: mean age 68.3 years
Length of follow‐up not explicitly stated (hospital stay?)
Sex (% male) only for pts with fulminant CDI: 48%
Ethnicity not stated
Initial no. of participants (recruited) 4,796 pts with CDI
Final no. of participants 4,796 pts with CDI, 199 pts had fulminant colitis
number of pts with colectomy 78 pts underwent operation: 75 colectomy (69 pts subtotal colectomy with diverting ileostomy, 6 pts hemicolectomy) and 3 explorative laparotomy without bowel resection‐‐‐75/4796=1.6%
indication for colectomy not stated
Comments ‐
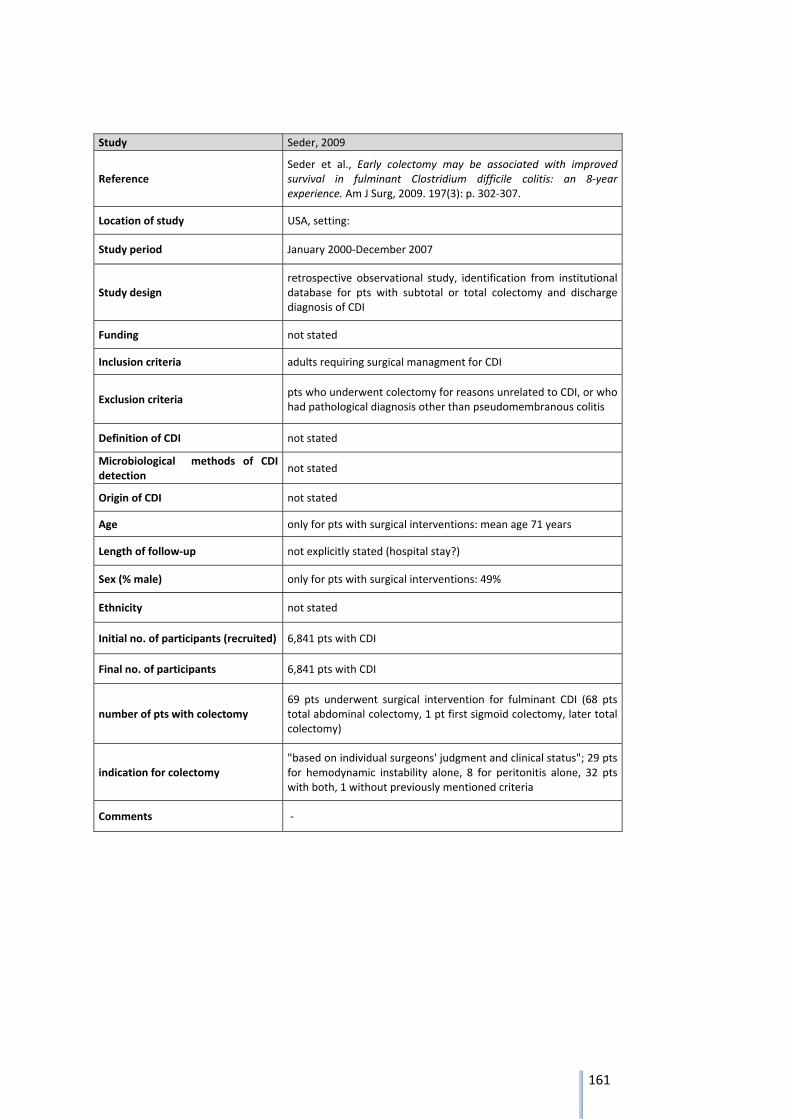
161
Study Seder, 2009
Reference Seder et al., Early colectomy may be associated with improved survival in fulminant Clostridium difficile colitis: an 8‐year experience. Am J Surg, 2009. 197(3): p. 302‐307.
Location of study USA, setting:
Study period January 2000‐December 2007
Study design retrospective observational study, identification from institutional database for pts with subtotal or total colectomy and discharge diagnosis of CDI
Funding not stated
Inclusion criteria adults requiring surgical managment for CDI
Exclusion criteria pts who underwent colectomy for reasons unrelated to CDI, or who had pathological diagnosis other than pseudomembranous colitis
Definition of CDI not stated
Microbiological methods of CDI detection
not stated
Origin of CDI not stated
Age only for pts with surgical interventions: mean age 71 years
Length of follow‐up not explicitly stated (hospital stay?)
Sex (% male) only for pts with surgical interventions: 49%
Ethnicity not stated
Initial no. of participants (recruited) 6,841 pts with CDI
Final no. of participants 6,841 pts with CDI
number of pts with colectomy 69 pts underwent surgical intervention for fulminant CDI (68 pts total abdominal colectomy, 1 pt first sigmoid colectomy, later total colectomy)
indication for colectomy "based on individual surgeons' judgment and clinical status"; 29 pts for hemodynamic instability alone, 8 for peritonitis alone, 32 pts with both, 1 without previously mentioned criteria
Comments ‐
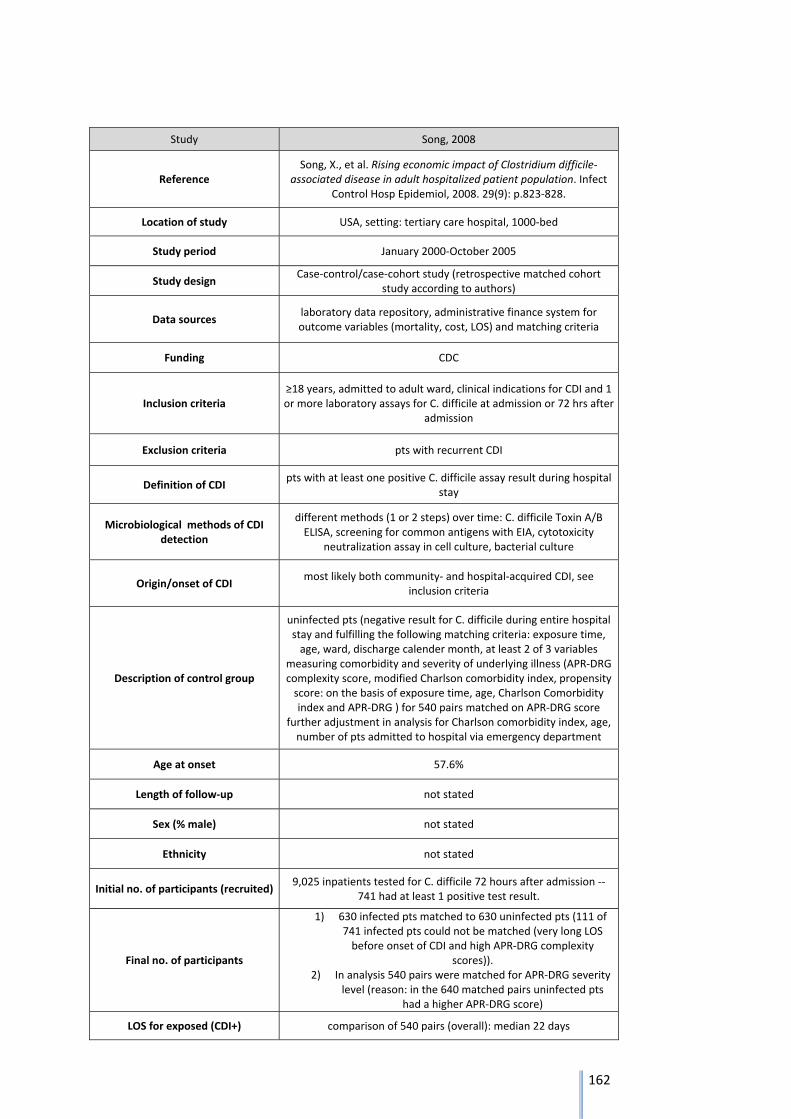
162
Study Song, 2008
Reference Song, X., et al. Rising economic impact of Clostridium difficile‐
associated disease in adult hospitalized patient population. Infect Control Hosp Epidemiol, 2008. 29(9): p.823‐828.
Location of study USA, setting: tertiary care hospital, 1000‐bed
Study period January 2000‐October 2005
Study design Case‐control/case‐cohort study (retrospective matched cohort
study according to authors)
Data sources laboratory data repository, administrative finance system for outcome variables (mortality, cost, LOS) and matching criteria
Funding CDC
Inclusion criteria ≥18 years, admitted to adult ward, clinical indications for CDI and 1 or more laboratory assays for C. difficile at admission or 72 hrs after
admission
Exclusion criteria pts with recurrent CDI
Definition of CDI pts with at least one positive C. difficile assay result during hospital
stay
Microbiological methods of CDI detection
different methods (1 or 2 steps) over time: C. difficile Toxin A/B ELISA, screening for common antigens with EIA, cytotoxicity
neutralization assay in cell culture, bacterial culture
Origin/onset of CDI most likely both community‐ and hospital‐acquired CDI, see
inclusion criteria
Description of control group
uninfected pts (negative result for C. difficile during entire hospital stay and fulfilling the following matching criteria: exposure time, age, ward, discharge calender month, at least 2 of 3 variables
measuring comorbidity and severity of underlying illness (APR‐DRG complexity score, modified Charlson comorbidity index, propensity score: on the basis of exposure time, age, Charlson Comorbidity index and APR‐DRG ) for 540 pairs matched on APR‐DRG score
further adjustment in analysis for Charlson comorbidity index, age, number of pts admitted to hospital via emergency department
Age at onset 57.6%
Length of follow‐up not stated
Sex (% male) not stated
Ethnicity not stated
Initial no. of participants (recruited) 9,025 inpatients tested for C. difficile 72 hours after admission ‐‐
741 had at least 1 positive test result.
Final no. of participants
1) 630 infected pts matched to 630 uninfected pts (111 of 741 infected pts could not be matched (very long LOS before onset of CDI and high APR‐DRG complexity
scores)). 2) In analysis 540 pairs were matched for APR‐DRG severity
level (reason: in the 640 matched pairs uninfected pts had a higher APR‐DRG score)
LOS for exposed (CDI+) comparison of 540 pairs (overall): median 22 days
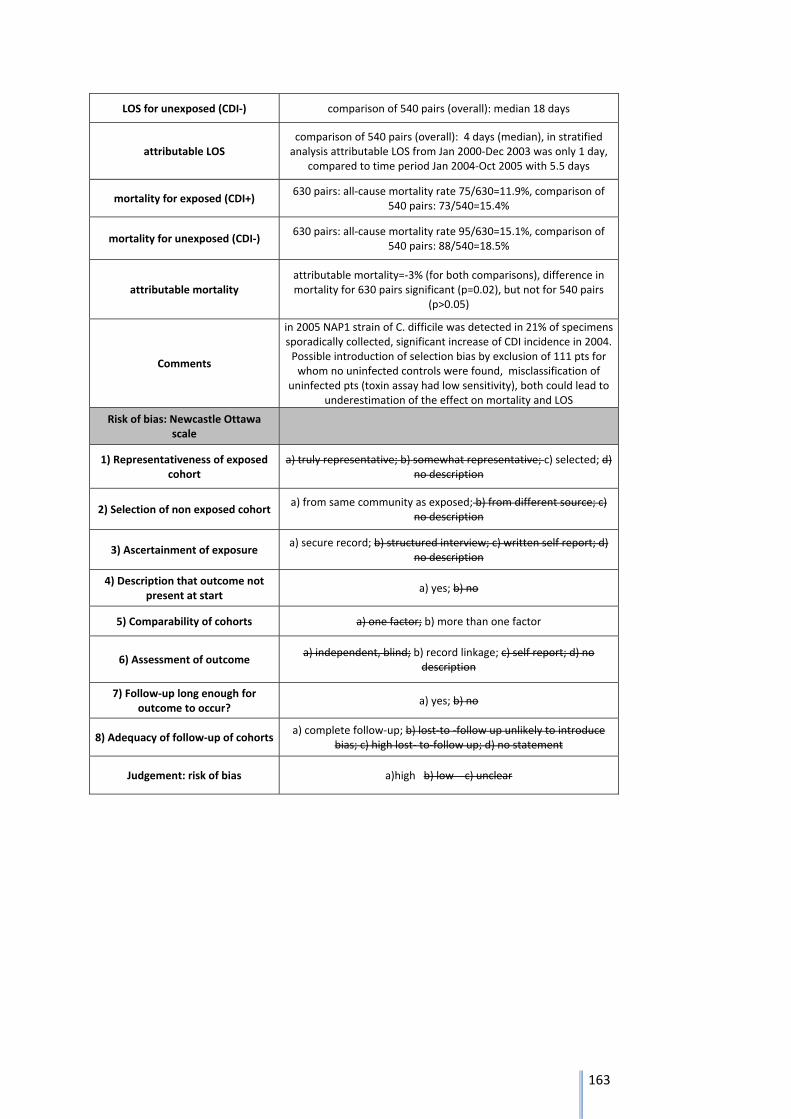
163
LOS for unexposed (CDI‐) comparison of 540 pairs (overall): median 18 days
attributable LOS comparison of 540 pairs (overall): 4 days (median), in stratified analysis attributable LOS from Jan 2000‐Dec 2003 was only 1 day,
compared to time period Jan 2004‐Oct 2005 with 5.5 days
mortality for exposed (CDI+) 630 pairs: all‐cause mortality rate 75/630=11.9%, comparison of
540 pairs: 73/540=15.4%
mortality for unexposed (CDI‐) 630 pairs: all‐cause mortality rate 95/630=15.1%, comparison of
540 pairs: 88/540=18.5%
attributable mortality attributable mortality=‐3% (for both comparisons), difference in mortality for 630 pairs significant (p=0.02), but not for 540 pairs
(p>0.05)
Comments
in 2005 NAP1 strain of C. difficile was detected in 21% of specimens sporadically collected, significant increase of CDI incidence in 2004. Possible introduction of selection bias by exclusion of 111 pts for whom no uninfected controls were found, misclassification of
uninfected pts (toxin assay had low sensitivity), both could lead to underestimation of the effect on mortality and LOS
Risk of bias: Newcastle Ottawa scale
1) Representativeness of exposed cohort
a) truly representative; b) somewhat representative; c) selected; d) no description
2) Selection of non exposed cohort a) from same community as exposed; b) from different source; c)
no description
3) Ascertainment of exposure a) secure record; b) structured interview; c) written self report; d)
no description
4) Description that outcome not present at start
a) yes; b) no
5) Comparability of cohorts a) one factor; b) more than one factor
6) Assessment of outcome a) independent, blind; b) record linkage; c) self report; d) no
description
7) Follow‐up long enough for outcome to occur?
a) yes; b) no
8) Adequacy of follow‐up of cohorts a) complete follow‐up; b) lost‐to ‐follow up unlikely to introduce
bias; c) high lost‐ to‐follow up; d) no statement
Judgement: risk of bias a)high b) low c) unclear
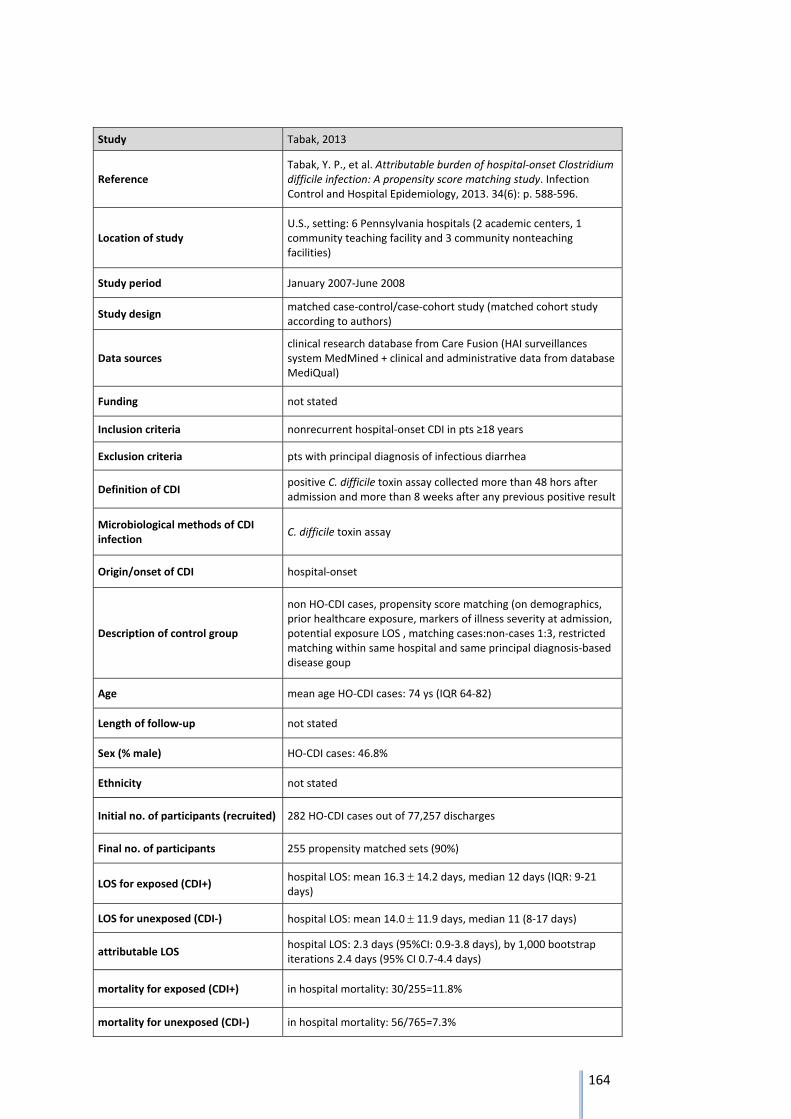
164
Study Tabak, 2013
Reference Tabak, Y. P., et al. Attributable burden of hospital‐onset Clostridium difficile infection: A propensity score matching study. Infection Control and Hospital Epidemiology, 2013. 34(6): p. 588‐596.
Location of study U.S., setting: 6 Pennsylvania hospitals (2 academic centers, 1 community teaching facility and 3 community nonteaching facilities)
Study period January 2007‐June 2008
Study design matched case‐control/case‐cohort study (matched cohort study according to authors)
Data sources clinical research database from Care Fusion (HAI surveillances system MedMined + clinical and administrative data from database MediQual)
Funding not stated
Inclusion criteria nonrecurrent hospital‐onset CDI in pts ≥18 years
Exclusion criteria pts with principal diagnosis of infectious diarrhea
Definition of CDI positive C. difficile toxin assay collected more than 48 hors after admission and more than 8 weeks after any previous positive result
Microbiological methods of CDI infection
C. difficile toxin assay
Origin/onset of CDI hospital‐onset
Description of control group
non HO‐CDI cases, propensity score matching (on demographics, prior healthcare exposure, markers of illness severity at admission, potential exposure LOS , matching cases:non‐cases 1:3, restricted matching within same hospital and same principal diagnosis‐based disease goup
Age mean age HO‐CDI cases: 74 ys (IQR 64‐82)
Length of follow‐up not stated
Sex (% male) HO‐CDI cases: 46.8%
Ethnicity not stated
Initial no. of participants (recruited) 282 HO‐CDI cases out of 77,257 discharges
Final no. of participants 255 propensity matched sets (90%)
LOS for exposed (CDI+) hospital LOS: mean 16.3 14.2 days, median 12 days (IQR: 9‐21 days)
LOS for unexposed (CDI‐) hospital LOS: mean 14.0 11.9 days, median 11 (8‐17 days)
attributable LOS hospital LOS: 2.3 days (95%CI: 0.9‐3.8 days), by 1,000 bootstrap iterations 2.4 days (95% CI 0.7‐4.4 days)
mortality for exposed (CDI+) in hospital mortality: 30/255=11.8%
mortality for unexposed (CDI‐) in hospital mortality: 56/765=7.3%
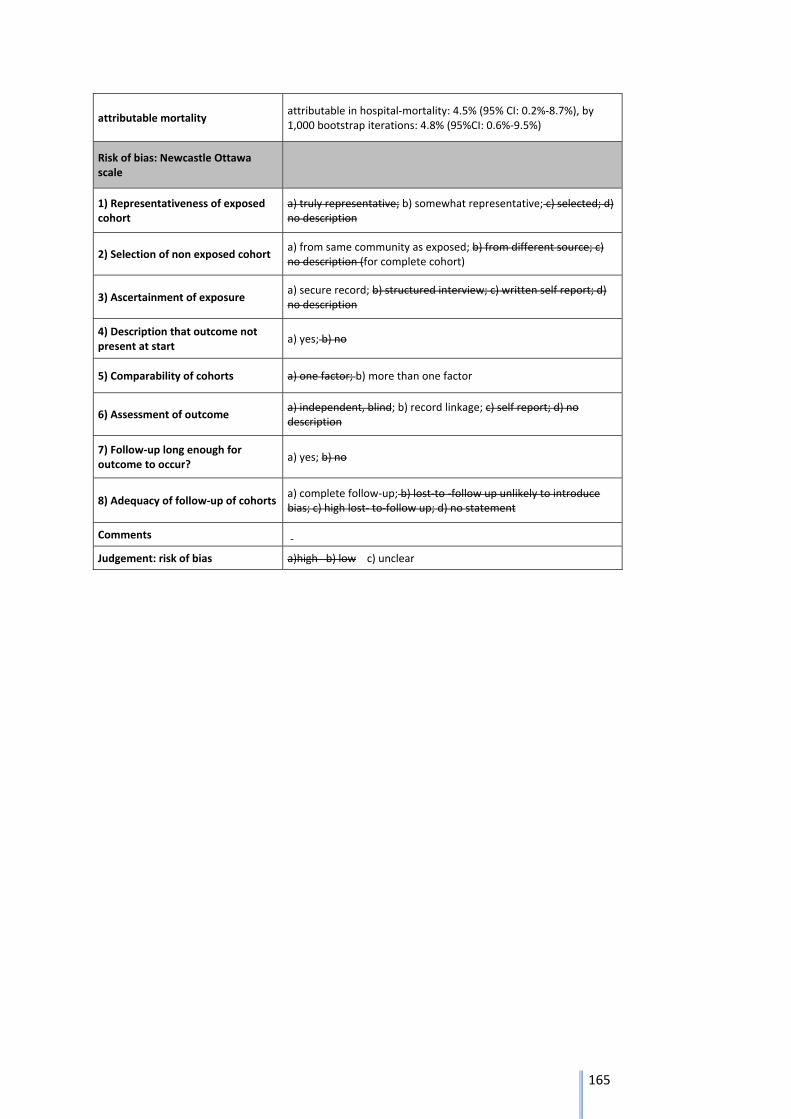
165
attributable mortality attributable in hospital‐mortality: 4.5% (95% CI: 0.2%‐8.7%), by 1,000 bootstrap iterations: 4.8% (95%CI: 0.6%‐9.5%)
Risk of bias: Newcastle Ottawa scale
1) Representativeness of exposed cohort
a) truly representative; b) somewhat representative; c) selected; d) no description
2) Selection of non exposed cohort a) from same community as exposed; b) from different source; c) no description (for complete cohort)
3) Ascertainment of exposure a) secure record; b) structured interview; c) written self report; d) no description
4) Description that outcome not present at start
a) yes; b) no
5) Comparability of cohorts a) one factor; b) more than one factor
6) Assessment of outcome a) independent, blind; b) record linkage; c) self report; d) no description
7) Follow‐up long enough for outcome to occur?
a) yes; b) no
8) Adequacy of follow‐up of cohorts a) complete follow‐up; b) lost‐to ‐follow up unlikely to introduce bias; c) high lost‐ to‐follow up; d) no statement
Comments ‐
Judgement: risk of bias a)high b) low c) unclear
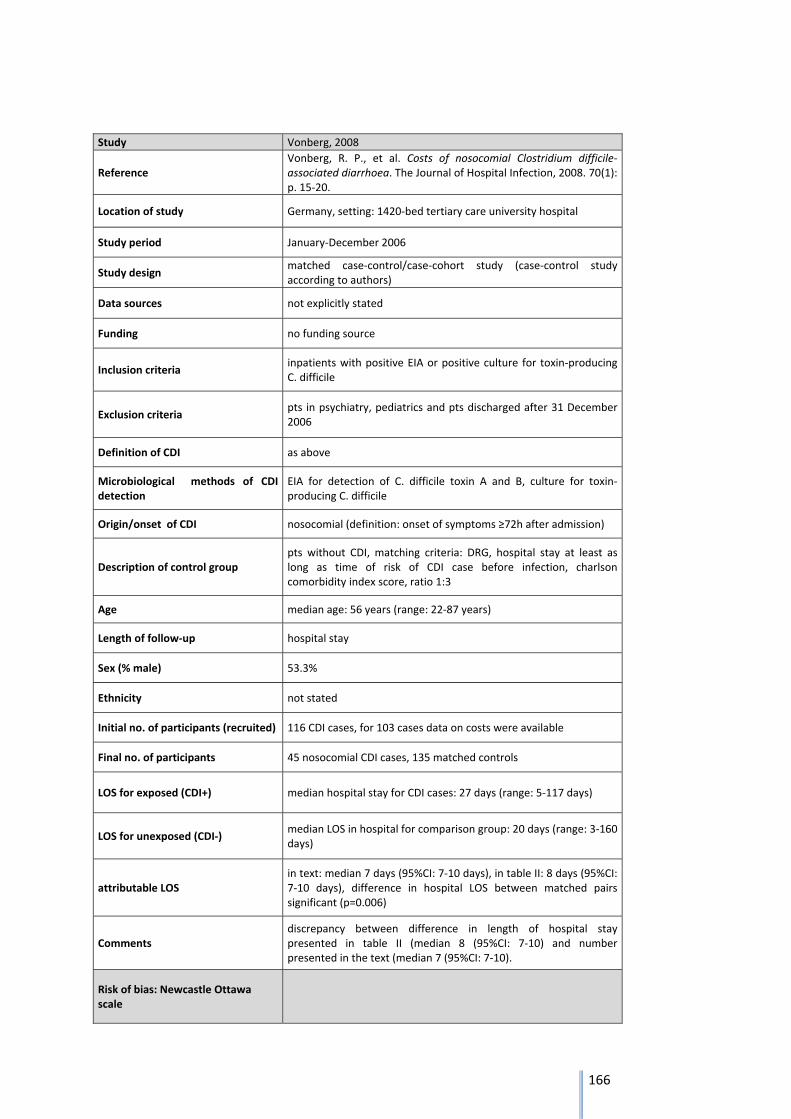
166
Study Vonberg, 2008
Reference Vonberg, R. P., et al. Costs of nosocomial Clostridium difficile‐associated diarrhoea. The Journal of Hospital Infection, 2008. 70(1): p. 15‐20.
Location of study Germany, setting: 1420‐bed tertiary care university hospital
Study period January‐December 2006
Study design matched case‐control/case‐cohort study (case‐control study according to authors)
Data sources not explicitly stated
Funding no funding source
Inclusion criteria inpatients with positive EIA or positive culture for toxin‐producing C. difficile
Exclusion criteria pts in psychiatry, pediatrics and pts discharged after 31 December 2006
Definition of CDI as above
Microbiological methods of CDI detection
EIA for detection of C. difficile toxin A and B, culture for toxin‐producing C. difficile
Origin/onset of CDI nosocomial (definition: onset of symptoms ≥72h after admission)
Description of control group pts without CDI, matching criteria: DRG, hospital stay at least as long as time of risk of CDI case before infection, charlson comorbidity index score, ratio 1:3
Age median age: 56 years (range: 22‐87 years)
Length of follow‐up hospital stay
Sex (% male) 53.3%
Ethnicity not stated
Initial no. of participants (recruited) 116 CDI cases, for 103 cases data on costs were available
Final no. of participants 45 nosocomial CDI cases, 135 matched controls
LOS for exposed (CDI+) median hospital stay for CDI cases: 27 days (range: 5‐117 days)
LOS for unexposed (CDI‐) median LOS in hospital for comparison group: 20 days (range: 3‐160 days)
attributable LOS in text: median 7 days (95%CI: 7‐10 days), in table II: 8 days (95%CI: 7‐10 days), difference in hospital LOS between matched pairs significant (p=0.006)
Comments discrepancy between difference in length of hospital stay presented in table II (median 8 (95%CI: 7‐10) and number presented in the text (median 7 (95%CI: 7‐10).
Risk of bias: Newcastle Ottawa scale
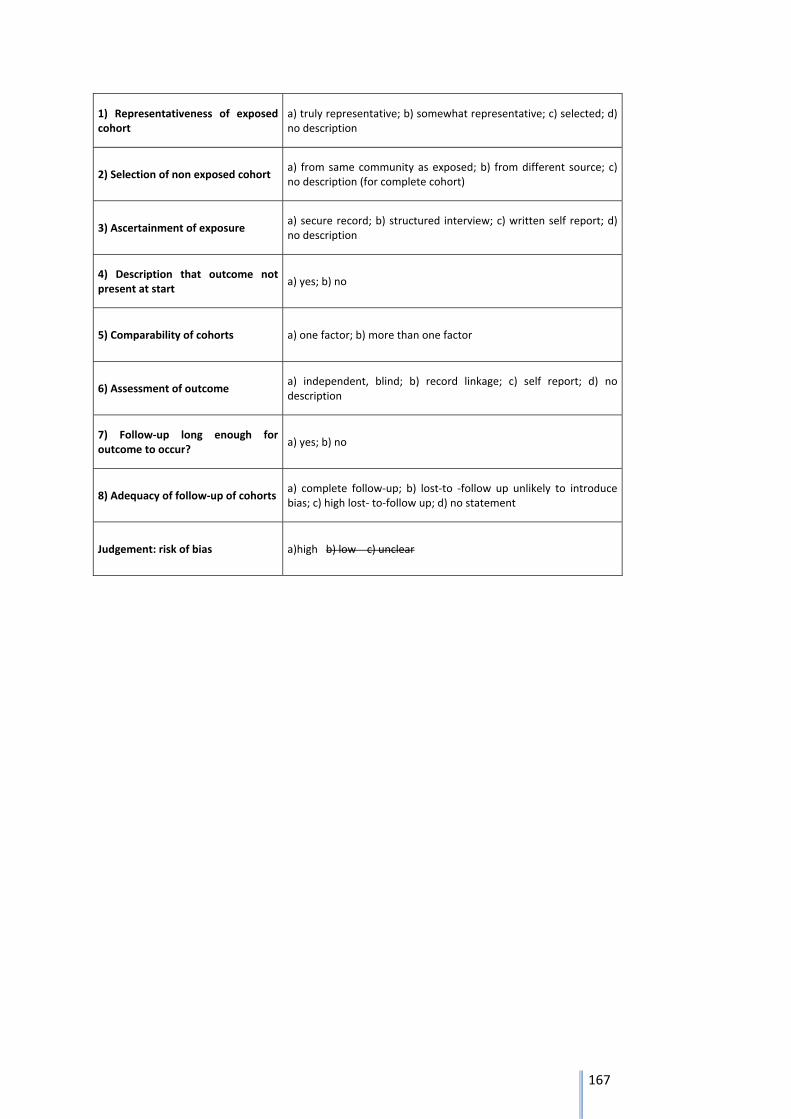
167
1) Representativeness of exposed cohort
a) truly representative; b) somewhat representative; c) selected; d) no description
2) Selection of non exposed cohort a) from same community as exposed; b) from different source; c) no description (for complete cohort)
3) Ascertainment of exposure a) secure record; b) structured interview; c) written self report; d) no description
4) Description that outcome not present at start
a) yes; b) no
5) Comparability of cohorts a) one factor; b) more than one factor
6) Assessment of outcome a) independent, blind; b) record linkage; c) self report; d) no description
7) Follow‐up long enough for outcome to occur?
a) yes; b) no
8) Adequacy of follow‐up of cohorts a) complete follow‐up; b) lost‐to ‐follow up unlikely to introduce bias; c) high lost‐ to‐follow up; d) no statement
Judgement: risk of bias a)high b) low c) unclear
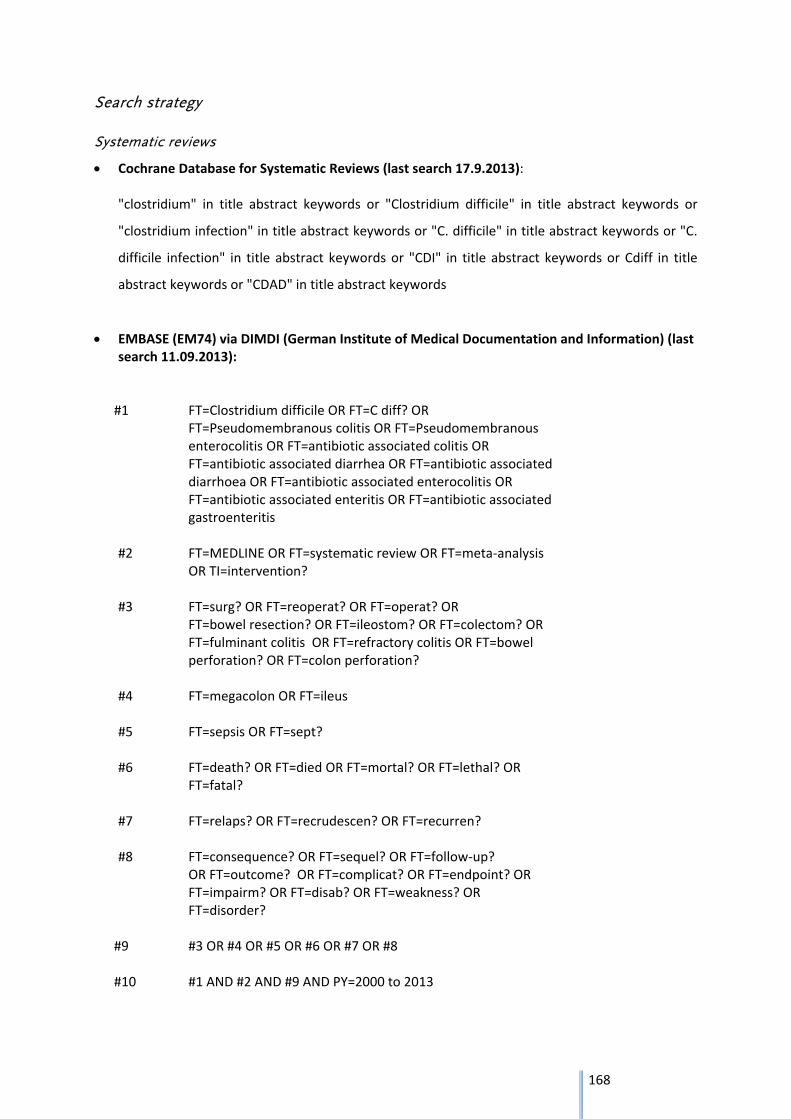
168
Search strategy
Systematic reviews
Cochrane Database for Systematic Reviews (last search 17.9.2013): "clostridium" in title abstract keywords or "Clostridium difficile" in title abstract keywords or
"clostridium infection" in title abstract keywords or "C. difficile" in title abstract keywords or "C.
difficile infection" in title abstract keywords or "CDI" in title abstract keywords or Cdiff in title
abstract keywords or "CDAD" in title abstract keywords
EMBASE (EM74) via DIMDI (German Institute of Medical Documentation and Information) (last search 11.09.2013):
#1 FT=Clostridium difficile OR FT=C diff? OR
FT=Pseudomembranous colitis OR FT=Pseudomembranous enterocolitis OR FT=antibiotic associated colitis OR FT=antibiotic associated diarrhea OR FT=antibiotic associated diarrhoea OR FT=antibiotic associated enterocolitis OR FT=antibiotic associated enteritis OR FT=antibiotic associated gastroenteritis
#2 FT=MEDLINE OR FT=systematic review OR FT=meta‐analysis
OR TI=intervention? #3 FT=surg? OR FT=reoperat? OR FT=operat? OR
FT=bowel resection? OR FT=ileostom? OR FT=colectom? OR FT=fulminant colitis OR FT=refractory colitis OR FT=bowel perforation? OR FT=colon perforation?
#4 FT=megacolon OR FT=ileus #5 FT=sepsis OR FT=sept? #6 FT=death? OR FT=died OR FT=mortal? OR FT=lethal? OR
FT=fatal?
#7 FT=relaps? OR FT=recrudescen? OR FT=recurren? #8 FT=consequence? OR FT=sequel? OR FT=follow‐up?
OR FT=outcome? OR FT=complicat? OR FT=endpoint? OR FT=impairm? OR FT=disab? OR FT=weakness? OR FT=disorder?
#9 #3 OR #4 OR #5 OR #6 OR #7 OR #8 #10 #1 AND #2 AND #9 AND PY=2000 to 2013
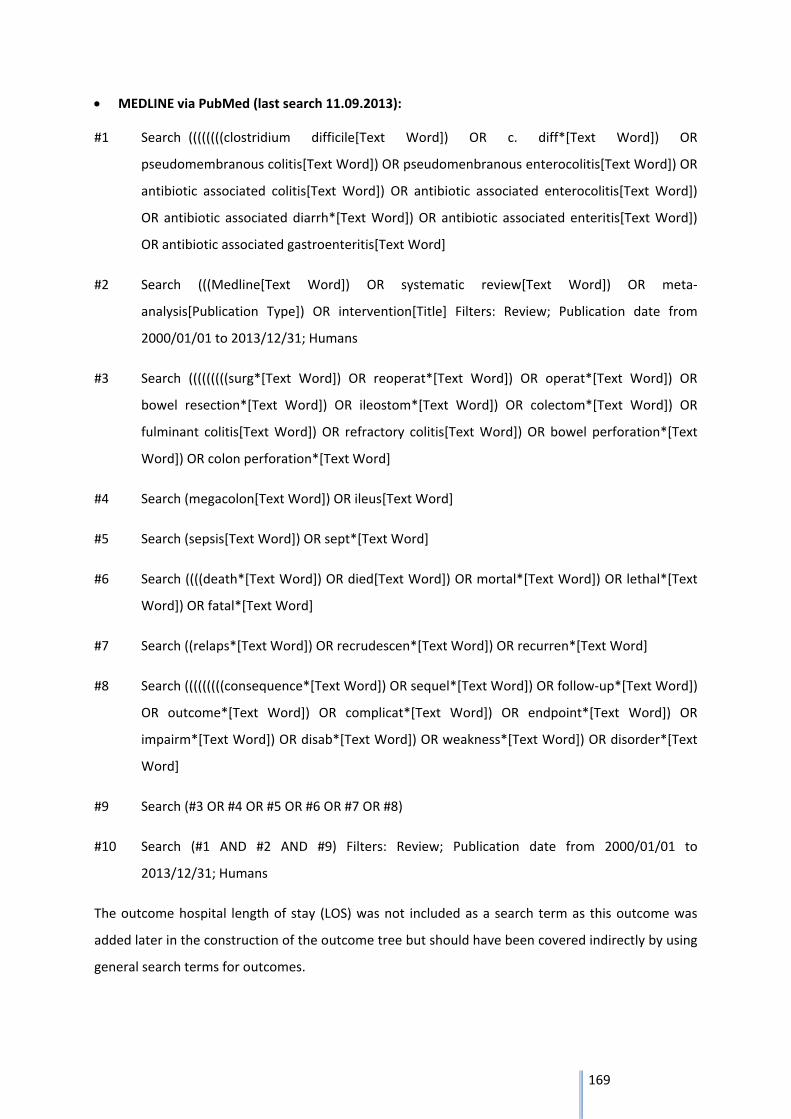
169
MEDLINE via PubMed (last search 11.09.2013):
#1 Search ((((((((clostridium difficile[Text Word]) OR c. diff*[Text Word]) OR
pseudomembranous colitis[Text Word]) OR pseudomenbranous enterocolitis[Text Word]) OR
antibiotic associated colitis[Text Word]) OR antibiotic associated enterocolitis[Text Word])
OR antibiotic associated diarrh*[Text Word]) OR antibiotic associated enteritis[Text Word])
OR antibiotic associated gastroenteritis[Text Word]
#2 Search (((Medline[Text Word]) OR systematic review[Text Word]) OR meta‐
analysis[Publication Type]) OR intervention[Title] Filters: Review; Publication date from
2000/01/01 to 2013/12/31; Humans
#3 Search (((((((((surg*[Text Word]) OR reoperat*[Text Word]) OR operat*[Text Word]) OR
bowel resection*[Text Word]) OR ileostom*[Text Word]) OR colectom*[Text Word]) OR
fulminant colitis[Text Word]) OR refractory colitis[Text Word]) OR bowel perforation*[Text
Word]) OR colon perforation*[Text Word]
#4 Search (megacolon[Text Word]) OR ileus[Text Word]
#5 Search (sepsis[Text Word]) OR sept*[Text Word]
#6 Search ((((death*[Text Word]) OR died[Text Word]) OR mortal*[Text Word]) OR lethal*[Text
Word]) OR fatal*[Text Word]
#7 Search ((relaps*[Text Word]) OR recrudescen*[Text Word]) OR recurren*[Text Word]
#8 Search (((((((((consequence*[Text Word]) OR sequel*[Text Word]) OR follow‐up*[Text Word])
OR outcome*[Text Word]) OR complicat*[Text Word]) OR endpoint*[Text Word]) OR
impairm*[Text Word]) OR disab*[Text Word]) OR weakness*[Text Word]) OR disorder*[Text
Word]
#9 Search (#3 OR #4 OR #5 OR #6 OR #7 OR #8)
#10 Search (#1 AND #2 AND #9) Filters: Review; Publication date from 2000/01/01 to
2013/12/31; Humans
The outcome hospital length of stay (LOS) was not included as a search term as this outcome was
added later in the construction of the outcome tree but should have been covered indirectly by using
general search terms for outcomes.
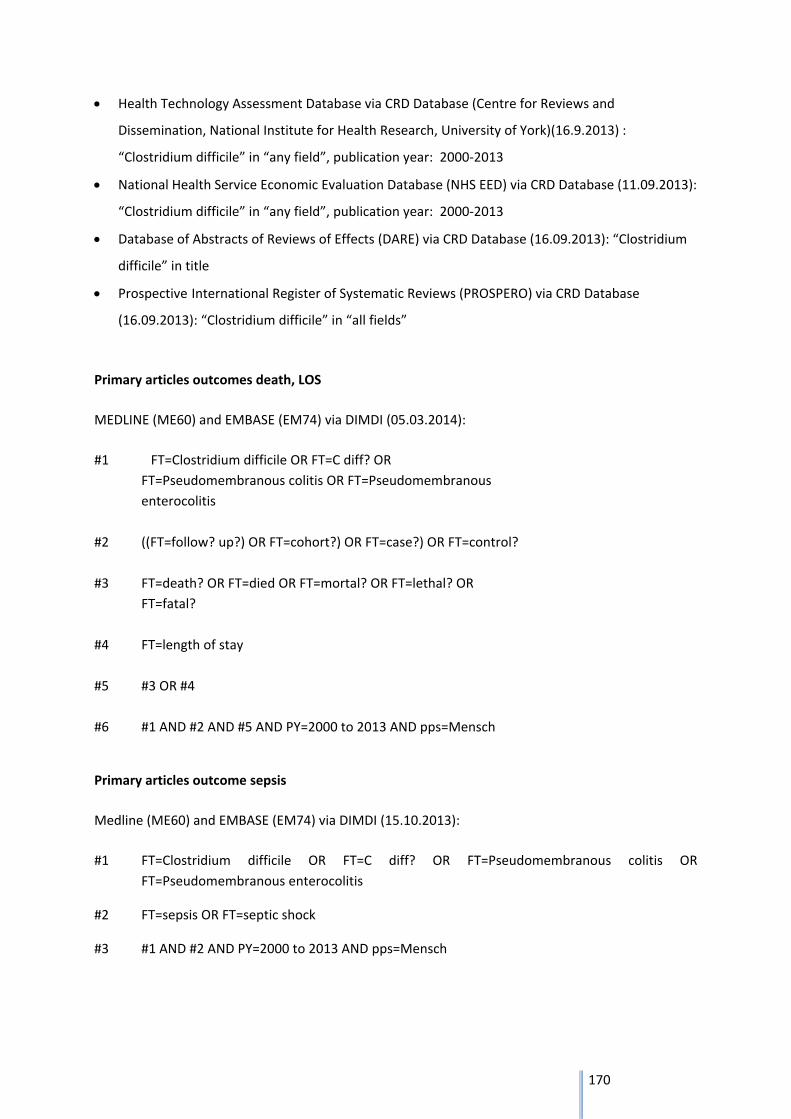
170
Health Technology Assessment Database via CRD Database (Centre for Reviews and
Dissemination, National Institute for Health Research, University of York)(16.9.2013) :
“Clostridium difficile” in “any field”, publication year: 2000‐2013
National Health Service Economic Evaluation Database (NHS EED) via CRD Database (11.09.2013):
“Clostridium difficile” in “any field”, publication year: 2000‐2013
Database of Abstracts of Reviews of Effects (DARE) via CRD Database (16.09.2013): “Clostridium
difficile” in title
Prospective International Register of Systematic Reviews (PROSPERO) via CRD Database
(16.09.2013): “Clostridium difficile” in “all fields”
Primary articles outcomes death, LOS
MEDLINE (ME60) and EMBASE (EM74) via DIMDI (05.03.2014):
#1 FT=Clostridium difficile OR FT=C diff? OR
FT=Pseudomembranous colitis OR FT=Pseudomembranous
enterocolitis
#2 ((FT=follow? up?) OR FT=cohort?) OR FT=case?) OR FT=control?
#3 FT=death? OR FT=died OR FT=mortal? OR FT=lethal? OR
FT=fatal?
#4 FT=length of stay
#5 #3 OR #4
#6 #1 AND #2 AND #5 AND PY=2000 to 2013 AND pps=Mensch
Primary articles outcome sepsis
Medline (ME60) and EMBASE (EM74) via DIMDI (15.10.2013):
#1 FT=Clostridium difficile OR FT=C diff? OR FT=Pseudomembranous colitis OR
FT=Pseudomembranous enterocolitis
#2 FT=sepsis OR FT=septic shock
#3 #1 AND #2 AND PY=2000 to 2013 AND pps=Mensch
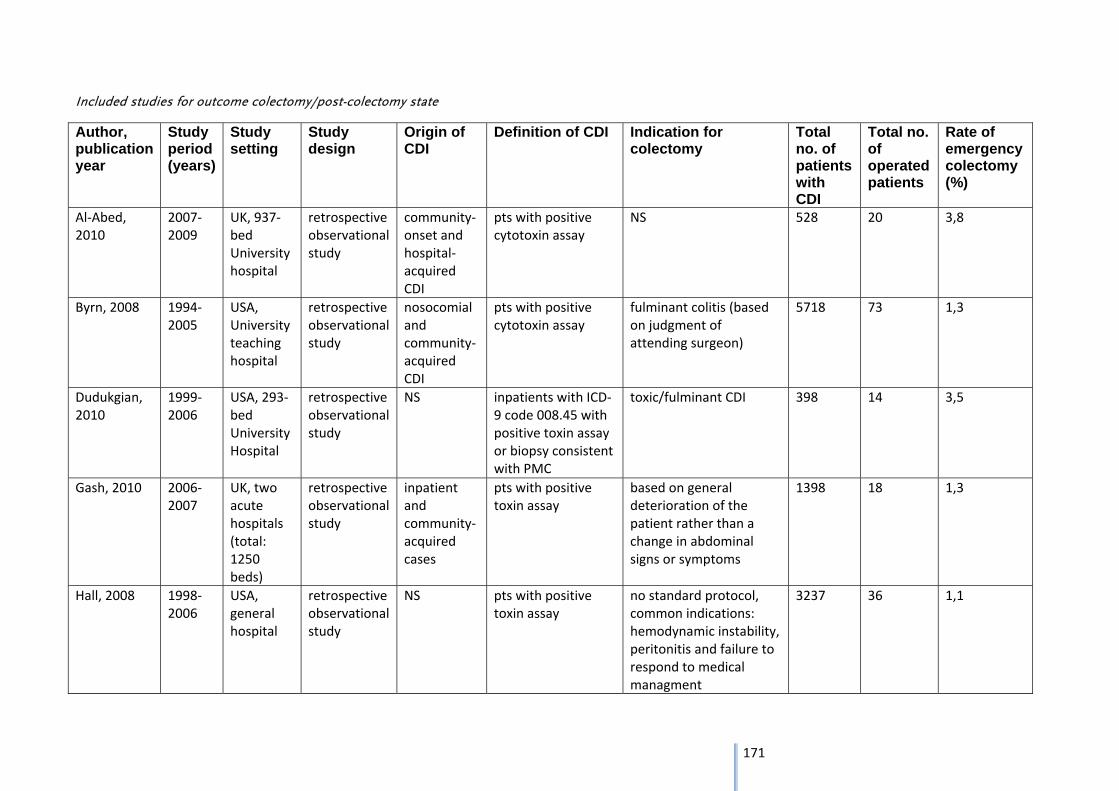
171
Included studies for outcome colectomy/post-colectomy state
Author, publication year
Study period (years)
Study setting
Study design
Origin of CDI
Definition of CDI Indication for colectomy
Total no. of patients with CDI
Total no. of operated patients
Rate of emergency colectomy (%)
Al‐Abed, 2010
2007‐2009
UK, 937‐bed University hospital
retrospective observational study
community‐onset and hospital‐acquired CDI
pts with positive cytotoxin assay
NS 528 20 3,8
Byrn, 2008 1994‐2005
USA, University teaching hospital
retrospective observational study
nosocomial and community‐acquired CDI
pts with positive cytotoxin assay
fulminant colitis (based on judgment of attending surgeon)
5718 73 1,3
Dudukgian, 2010
1999‐2006
USA, 293‐bed University Hospital
retrospective observational study
NS inpatients with ICD‐9 code 008.45 with positive toxin assay or biopsy consistent with PMC
toxic/fulminant CDI 398 14 3,5
Gash, 2010 2006‐2007
UK, two acute hospitals (total: 1250 beds)
retrospective observational study
inpatient and community‐acquired cases
pts with positive toxin assay
based on general deterioration of the patient rather than a change in abdominal signs or symptoms
1398 18 1,3
Hall, 2008 1998‐2006
USA, general hospital
retrospective observational study
NS pts with positive toxin assay
no standard protocol, common indications: hemodynamic instability, peritonitis and failure to respond to medical managment
3237 36 1,1
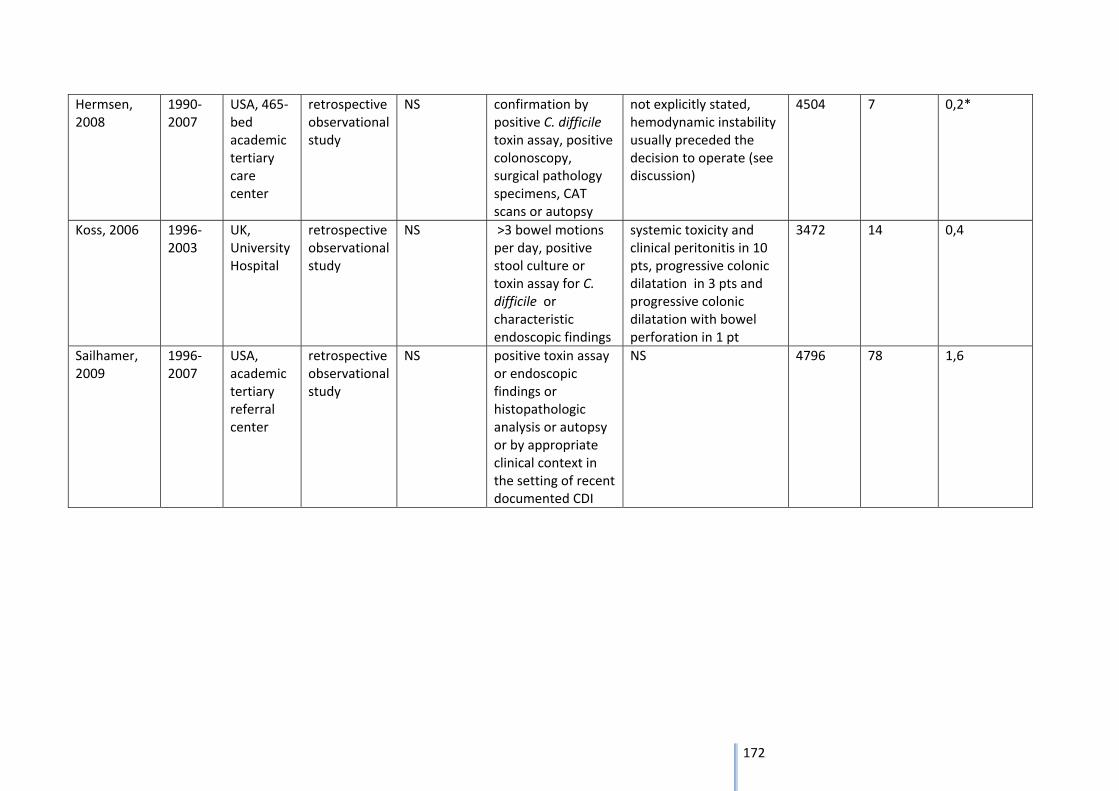
172
Hermsen, 2008
1990‐2007
USA, 465‐bed academic tertiary care center
retrospective observational study
NS confirmation by positive C. difficile toxin assay, positive colonoscopy, surgical pathology specimens, CAT scans or autopsy
not explicitly stated, hemodynamic instability usually preceded the decision to operate (see discussion)
4504 7 0,2*
Koss, 2006 1996‐2003
UK, University Hospital
retrospective observational study
NS >3 bowel motions per day, positive stool culture or toxin assay for C. difficile or characteristic endoscopic findings
systemic toxicity and clinical peritonitis in 10 pts, progressive colonic dilatation in 3 pts and progressive colonic dilatation with bowel perforation in 1 pt
3472 14 0,4
Sailhamer, 2009
1996‐2007
USA, academic tertiary referral center
retrospective observational study
NS positive toxin assay or endoscopic findings or histopathologic analysis or autopsy or by appropriate clinical context in the setting of recent documented CDI
NS 4796 78 1,6
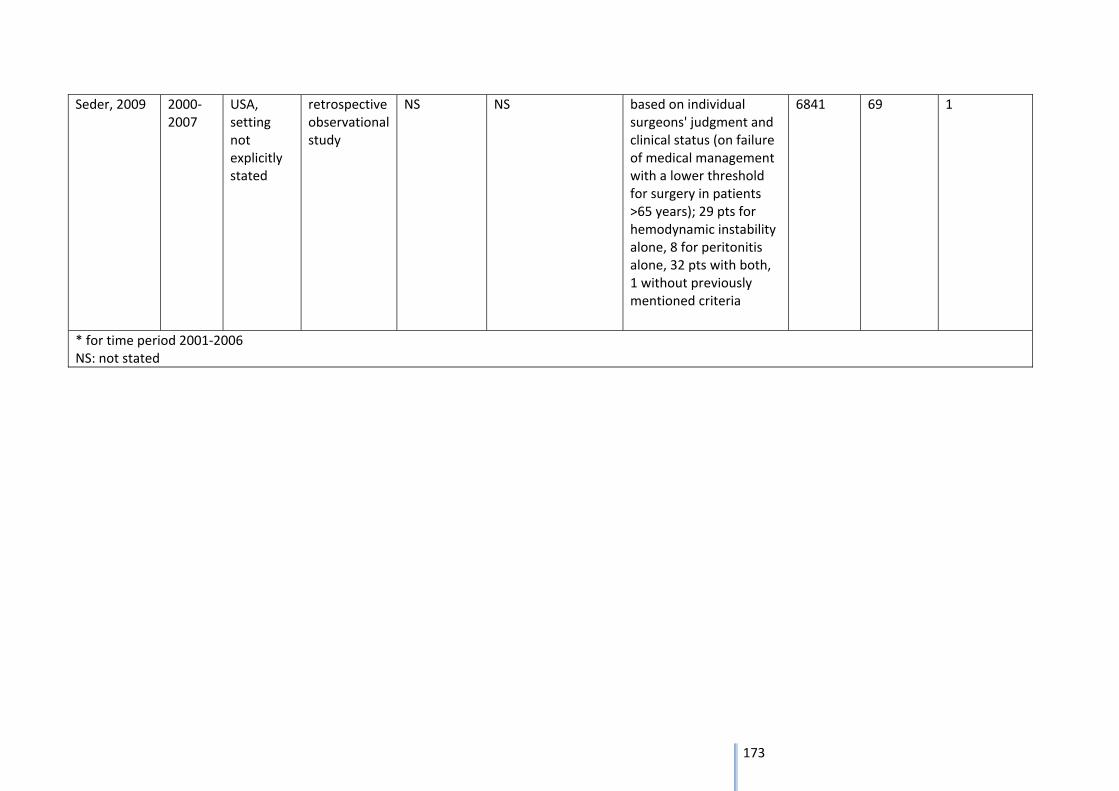
173
Seder, 2009 2000‐2007
USA, setting not explicitly stated
retrospective observational study
NS NS based on individual surgeons' judgment and clinical status (on failure of medical management with a lower threshold for surgery in patients >65 years); 29 pts for hemodynamic instability alone, 8 for peritonitis alone, 32 pts with both, 1 without previously mentioned criteria
6841 69 1
* for time period 2001‐2006 NS: not stated
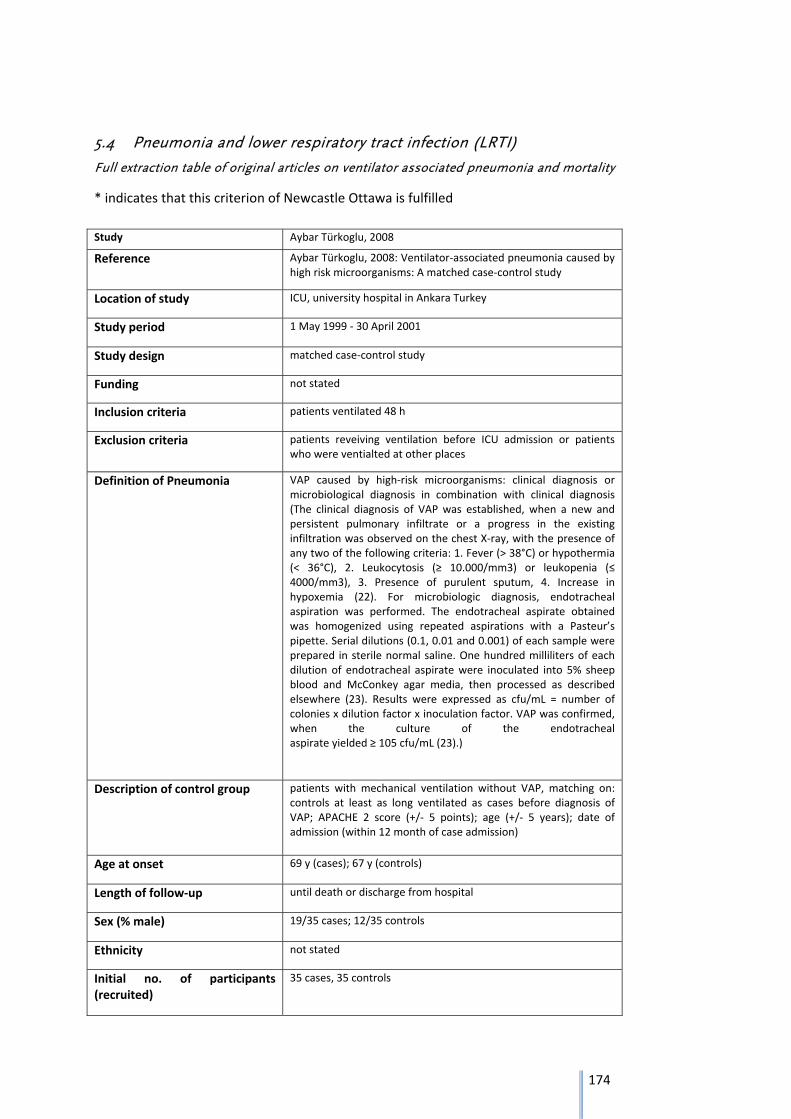
174
5.4 Pneumonia and lower respiratory tract infection (LRTI)
Full extraction table of original articles on ventilator associated pneumonia and mortality
* indicates that this criterion of Newcastle Ottawa is fulfilled
Study Aybar Türkoglu, 2008
Reference Aybar Türkoglu, 2008: Ventilator‐associated pneumonia caused by high risk microorganisms: A matched case‐control study
Location of study ICU, university hospital in Ankara Turkey
Study period 1 May 1999 ‐ 30 April 2001
Study design matched case‐control study
Funding not stated
Inclusion criteria patients ventilated 48 h
Exclusion criteria patients reveiving ventilation before ICU admission or patients who were ventialted at other places
Definition of Pneumonia VAP caused by high‐risk microorganisms: clinical diagnosis or microbiological diagnosis in combination with clinical diagnosis (The clinical diagnosis of VAP was established, when a new and persistent pulmonary infiltrate or a progress in the existing infiltration was observed on the chest X‐ray, with the presence of any two of the following criteria: 1. Fever (> 38°C) or hypothermia (< 36°C), 2. Leukocytosis (≥ 10.000/mm3) or leukopenia (≤ 4000/mm3), 3. Presence of purulent sputum, 4. Increase in hypoxemia (22). For microbiologic diagnosis, endotracheal aspiration was performed. The endotracheal aspirate obtained was homogenized using repeated aspirations with a Pasteur’s pipette. Serial dilutions (0.1, 0.01 and 0.001) of each sample were prepared in sterile normal saline. One hundred milliliters of each dilution of endotracheal aspirate were inoculated into 5% sheep blood and McConkey agar media, then processed as described elsewhere (23). Results were expressed as cfu/mL = number of colonies x dilution factor x inoculation factor. VAP was confirmed, when the culture of the endotracheal aspirate yielded ≥ 105 cfu/mL (23).)
Description of control group patients with mechanical ventilation without VAP, matching on: controls at least as long ventilated as cases before diagnosis of VAP; APACHE 2 score (+/‐ 5 points); age (+/‐ 5 years); date of admission (within 12 month of case admission)
Age at onset 69 y (cases); 67 y (controls)
Length of follow‐up until death or discharge from hospital
Sex (% male) 19/35 cases; 12/35 controls
Ethnicity not stated
Initial no. of participants (recruited)
35 cases, 35 controls
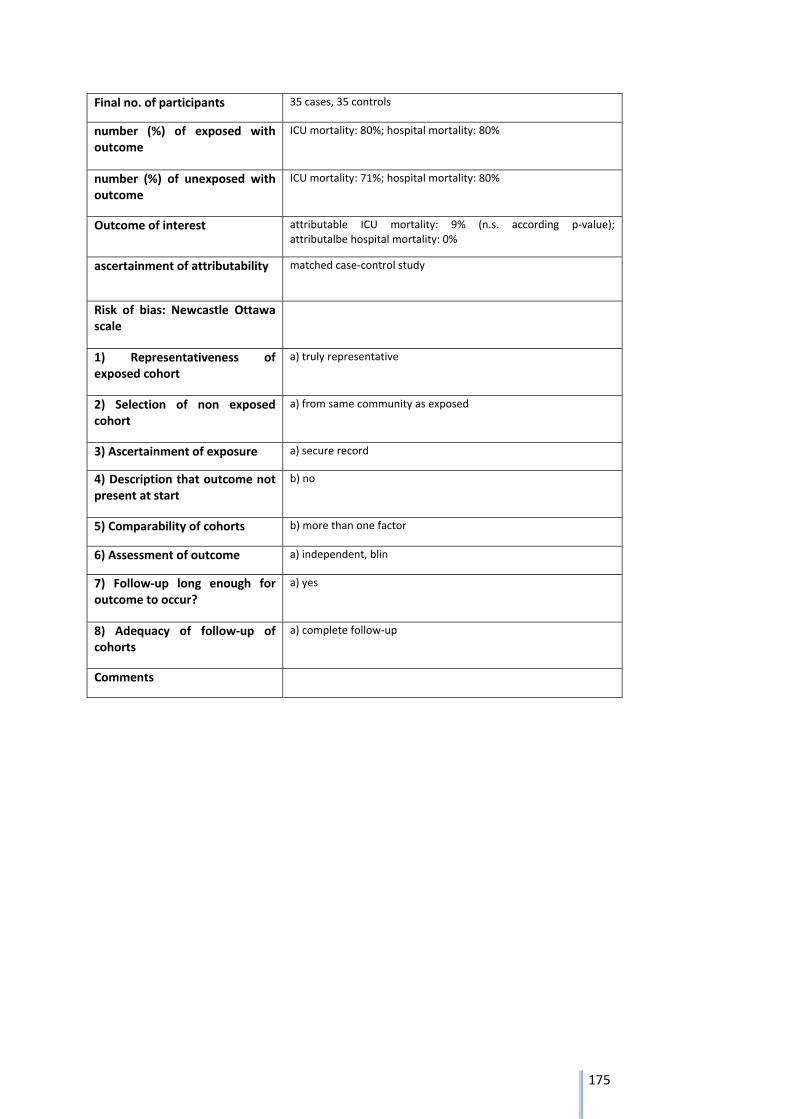
175
Final no. of participants 35 cases, 35 controls
number (%) of exposed with outcome
ICU mortality: 80%; hospital mortality: 80%
number (%) of unexposed with outcome
ICU mortality: 71%; hospital mortality: 80%
Outcome of interest attributable ICU mortality: 9% (n.s. according p‐value); attributalbe hospital mortality: 0%
ascertainment of attributability matched case‐control study
Risk of bias: Newcastle Ottawa scale
1) Representativeness of exposed cohort
a) truly representative
2) Selection of non exposed cohort
a) from same community as exposed
3) Ascertainment of exposure a) secure record
4) Description that outcome not present at start
b) no
5) Comparability of cohorts b) more than one factor
6) Assessment of outcome a) independent, blin
7) Follow‐up long enough for outcome to occur?
a) yes
8) Adequacy of follow‐up of cohorts
a) complete follow‐up
Comments
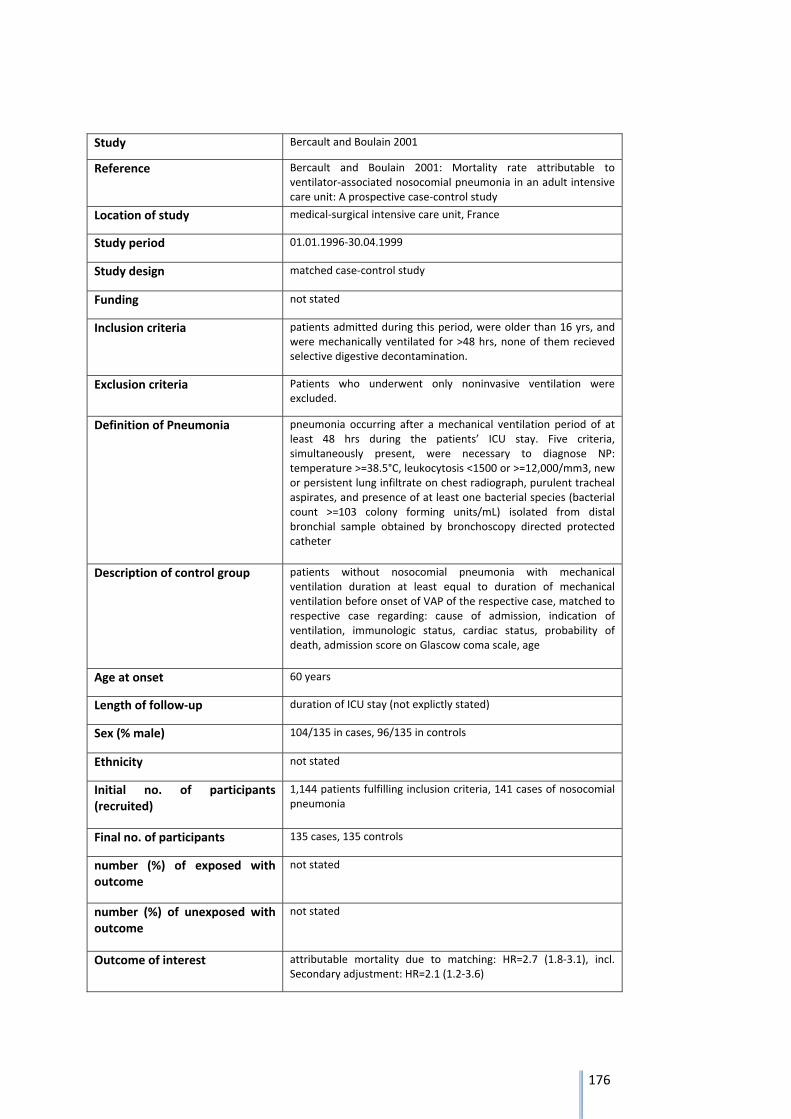
176
Study Bercault and Boulain 2001
Reference Bercault and Boulain 2001: Mortality rate attributable to ventilator‐associated nosocomial pneumonia in an adult intensive care unit: A prospective case‐control study
Location of study medical‐surgical intensive care unit, France
Study period 01.01.1996‐30.04.1999
Study design matched case‐control study
Funding not stated
Inclusion criteria patients admitted during this period, were older than 16 yrs, and were mechanically ventilated for >48 hrs, none of them recieved selective digestive decontamination.
Exclusion criteria Patients who underwent only noninvasive ventilation were excluded.
Definition of Pneumonia pneumonia occurring after a mechanical ventilation period of at least 48 hrs during the patients’ ICU stay. Five criteria, simultaneously present, were necessary to diagnose NP: temperature >=38.5°C, leukocytosis <1500 or >=12,000/mm3, new or persistent lung infiltrate on chest radiograph, purulent tracheal aspirates, and presence of at least one bacterial species (bacterial count >=103 colony forming units/mL) isolated from distal bronchial sample obtained by bronchoscopy directed protected catheter
Description of control group patients without nosocomial pneumonia with mechanical ventilation duration at least equal to duration of mechanical ventilation before onset of VAP of the respective case, matched to respective case regarding: cause of admission, indication of ventilation, immunologic status, cardiac status, probability of death, admission score on Glascow coma scale, age
Age at onset 60 years
Length of follow‐up duration of ICU stay (not explictly stated)
Sex (% male) 104/135 in cases, 96/135 in controls
Ethnicity not stated
Initial no. of participants (recruited)
1,144 patients fulfilling inclusion criteria, 141 cases of nosocomial pneumonia
Final no. of participants 135 cases, 135 controls
number (%) of exposed with outcome
not stated
number (%) of unexposed with outcome
not stated
Outcome of interest attributable mortality due to matching: HR=2.7 (1.8‐3.1), incl. Secondary adjustment: HR=2.1 (1.2‐3.6)
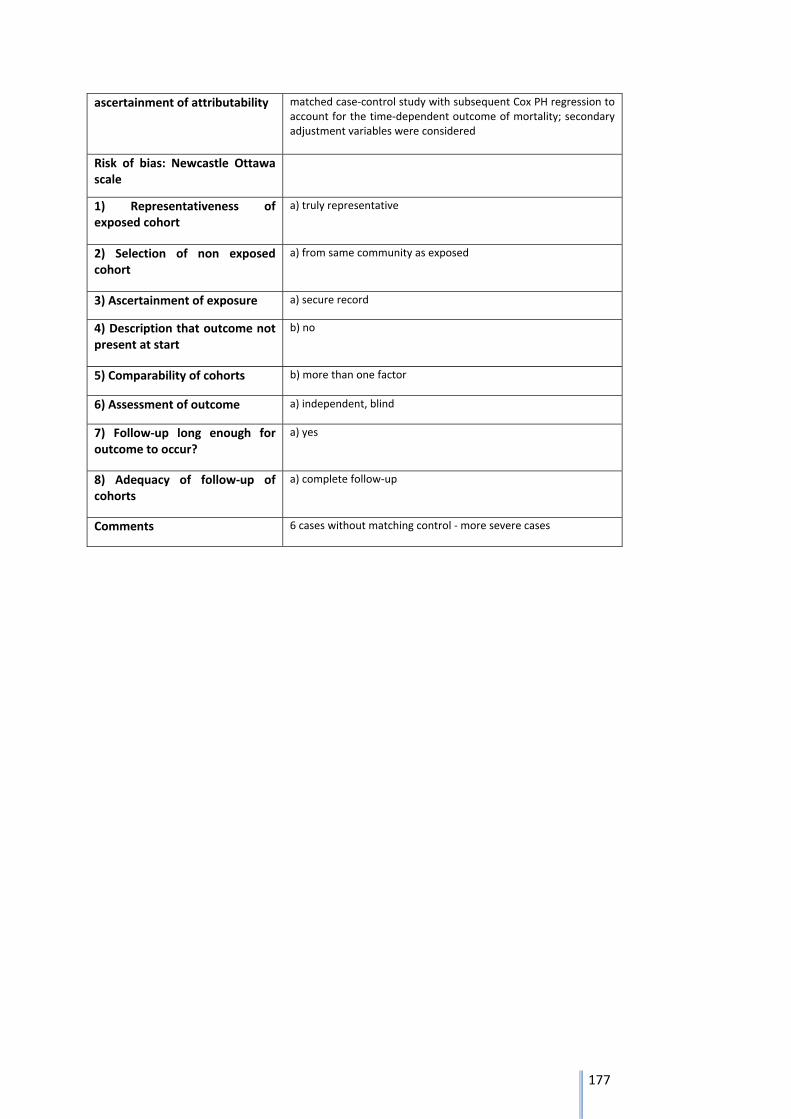
177
ascertainment of attributability matched case‐control study with subsequent Cox PH regression to account for the time‐dependent outcome of mortality; secondary adjustment variables were considered
Risk of bias: Newcastle Ottawa scale
1) Representativeness of exposed cohort
a) truly representative
2) Selection of non exposed cohort
a) from same community as exposed
3) Ascertainment of exposure a) secure record
4) Description that outcome not present at start
b) no
5) Comparability of cohorts b) more than one factor
6) Assessment of outcome a) independent, blind
7) Follow‐up long enough for outcome to occur?
a) yes
8) Adequacy of follow‐up of cohorts
a) complete follow‐up
Comments 6 cases without matching control ‐ more severe cases
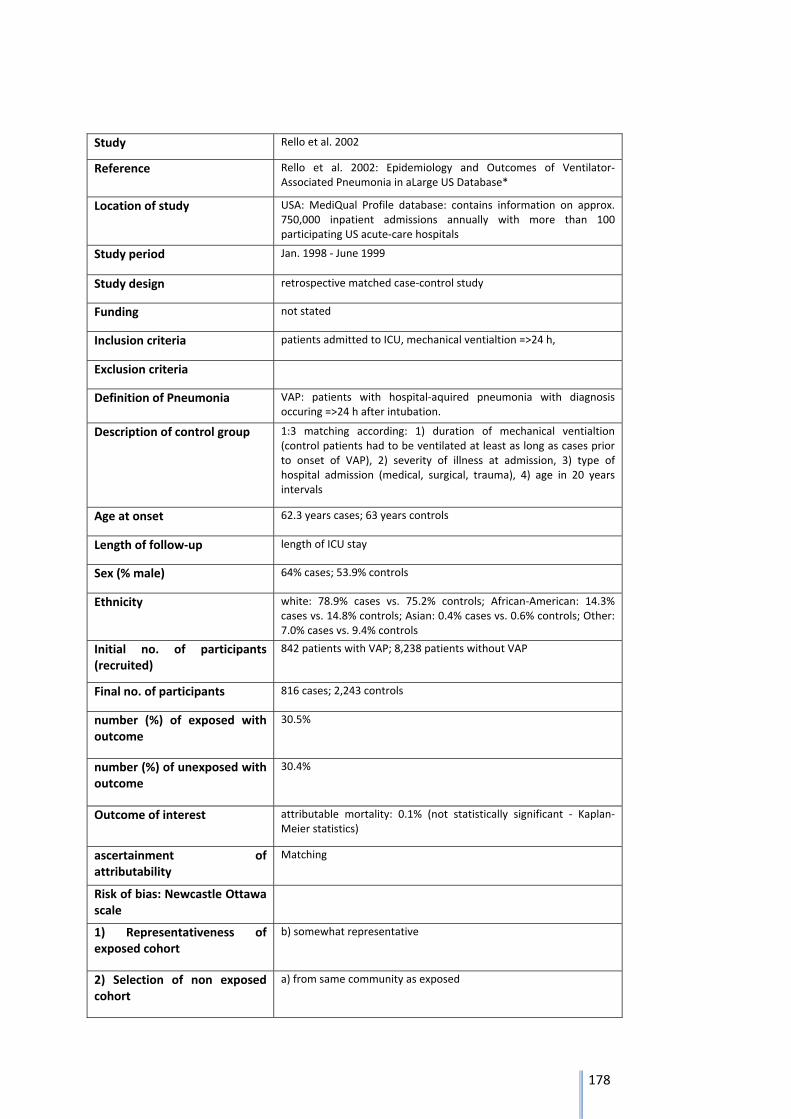
178
Study Rello et al. 2002
Reference Rello et al. 2002: Epidemiology and Outcomes of Ventilator‐Associated Pneumonia in aLarge US Database*
Location of study USA: MediQual Profile database: contains information on approx. 750,000 inpatient admissions annually with more than 100 participating US acute‐care hospitals
Study period Jan. 1998 ‐ June 1999
Study design retrospective matched case‐control study
Funding not stated
Inclusion criteria patients admitted to ICU, mechanical ventialtion =>24 h,
Exclusion criteria
Definition of Pneumonia VAP: patients with hospital‐aquired pneumonia with diagnosis occuring =>24 h after intubation.
Description of control group 1:3 matching according: 1) duration of mechanical ventialtion (control patients had to be ventilated at least as long as cases prior to onset of VAP), 2) severity of illness at admission, 3) type of hospital admission (medical, surgical, trauma), 4) age in 20 years intervals
Age at onset 62.3 years cases; 63 years controls
Length of follow‐up length of ICU stay
Sex (% male) 64% cases; 53.9% controls
Ethnicity white: 78.9% cases vs. 75.2% controls; African‐American: 14.3% cases vs. 14.8% controls; Asian: 0.4% cases vs. 0.6% controls; Other: 7.0% cases vs. 9.4% controls
Initial no. of participants (recruited)
842 patients with VAP; 8,238 patients without VAP
Final no. of participants 816 cases; 2,243 controls
number (%) of exposed with outcome
30.5%
number (%) of unexposed with outcome
30.4%
Outcome of interest attributable mortality: 0.1% (not statistically significant ‐ Kaplan‐Meier statistics)
ascertainment of attributability
Matching
Risk of bias: Newcastle Ottawa scale
1) Representativeness of exposed cohort
b) somewhat representative
2) Selection of non exposed cohort
a) from same community as exposed
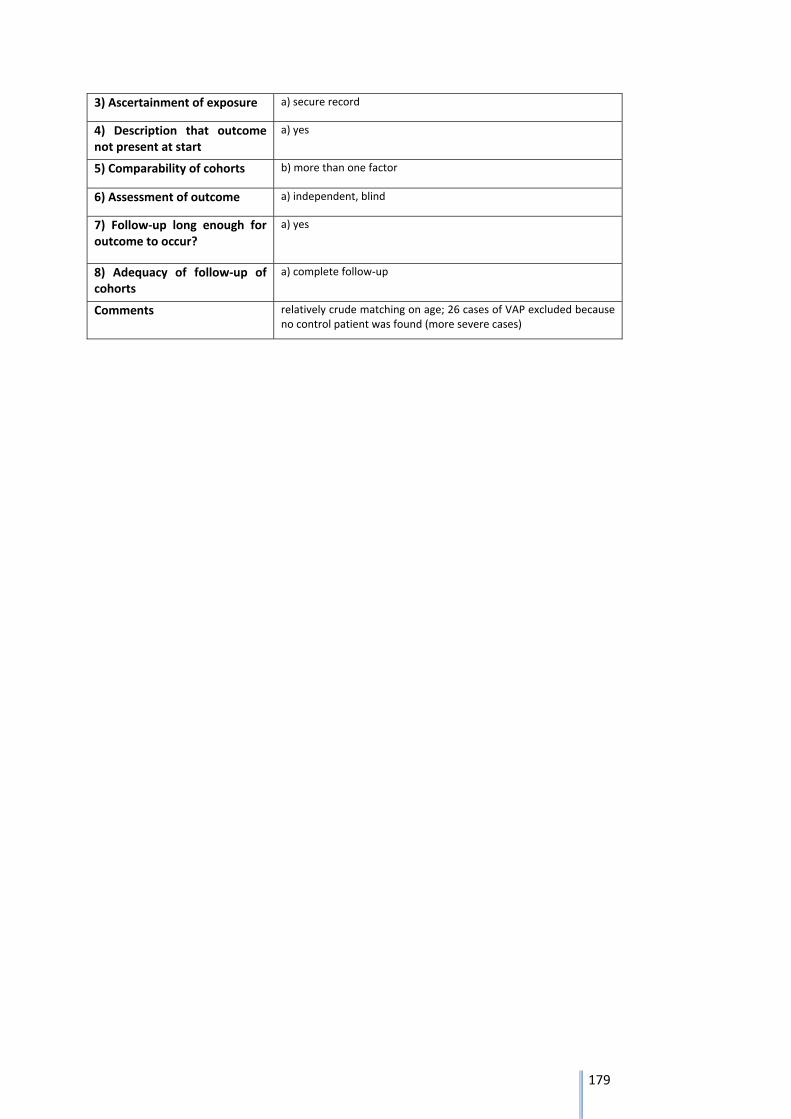
179
3) Ascertainment of exposure a) secure record
4) Description that outcome not present at start
a) yes
5) Comparability of cohorts b) more than one factor
6) Assessment of outcome a) independent, blind
7) Follow‐up long enough for outcome to occur?
a) yes
8) Adequacy of follow‐up of cohorts
a) complete follow‐up
Comments relatively crude matching on age; 26 cases of VAP excluded because no control patient was found (more severe cases)
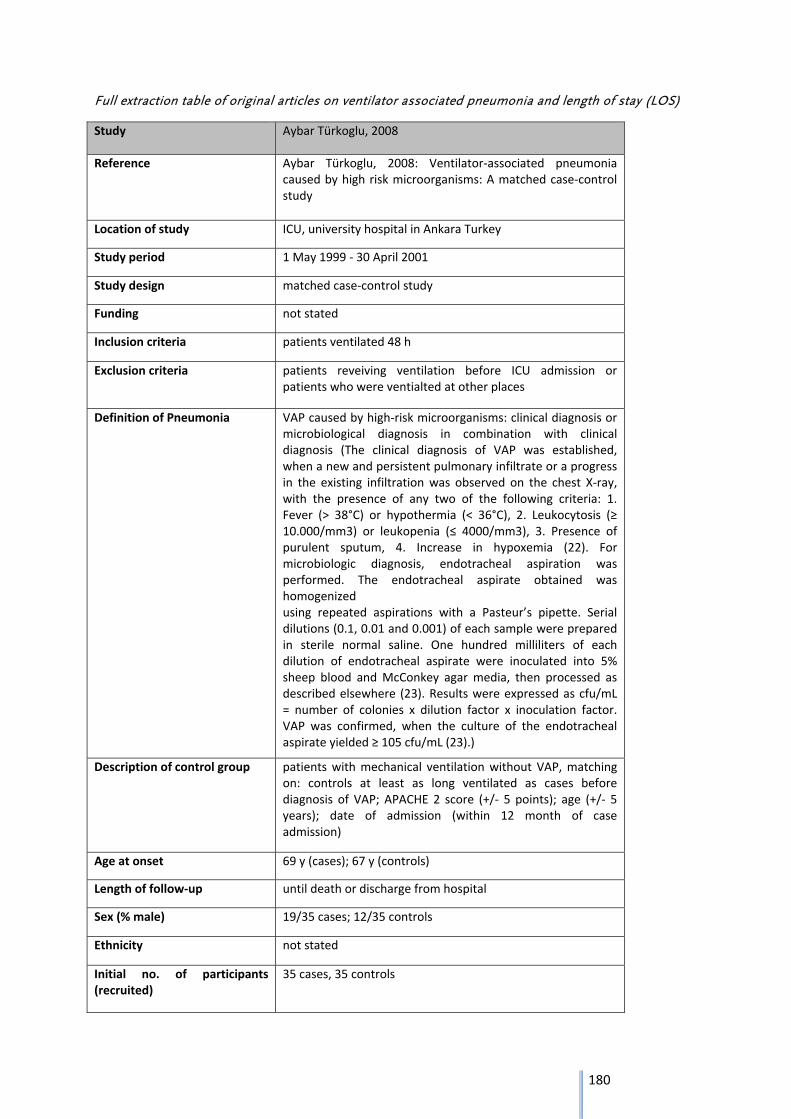
180
Full extraction table of original articles on ventilator associated pneumonia and length of stay (LOS)
Study Aybar Türkoglu, 2008
Reference Aybar Türkoglu, 2008: Ventilator‐associated pneumonia caused by high risk microorganisms: A matched case‐control study
Location of study ICU, university hospital in Ankara Turkey
Study period 1 May 1999 ‐ 30 April 2001
Study design matched case‐control study
Funding not stated
Inclusion criteria patients ventilated 48 h
Exclusion criteria patients reveiving ventilation before ICU admission or patients who were ventialted at other places
Definition of Pneumonia VAP caused by high‐risk microorganisms: clinical diagnosis or microbiological diagnosis in combination with clinical diagnosis (The clinical diagnosis of VAP was established, when a new and persistent pulmonary infiltrate or a progress in the existing infiltration was observed on the chest X‐ray, with the presence of any two of the following criteria: 1. Fever (> 38°C) or hypothermia (< 36°C), 2. Leukocytosis (≥ 10.000/mm3) or leukopenia (≤ 4000/mm3), 3. Presence of purulent sputum, 4. Increase in hypoxemia (22). For microbiologic diagnosis, endotracheal aspiration was performed. The endotracheal aspirate obtained was homogenized using repeated aspirations with a Pasteur’s pipette. Serial dilutions (0.1, 0.01 and 0.001) of each sample were prepared in sterile normal saline. One hundred milliliters of each dilution of endotracheal aspirate were inoculated into 5% sheep blood and McConkey agar media, then processed as described elsewhere (23). Results were expressed as cfu/mL = number of colonies x dilution factor x inoculation factor. VAP was confirmed, when the culture of the endotracheal aspirate yielded ≥ 105 cfu/mL (23).)
Description of control group patients with mechanical ventilation without VAP, matching on: controls at least as long ventilated as cases before diagnosis of VAP; APACHE 2 score (+/‐ 5 points); age (+/‐ 5 years); date of admission (within 12 month of case admission)
Age at onset 69 y (cases); 67 y (controls)
Length of follow‐up until death or discharge from hospital
Sex (% male) 19/35 cases; 12/35 controls
Ethnicity not stated
Initial no. of participants (recruited)
35 cases, 35 controls
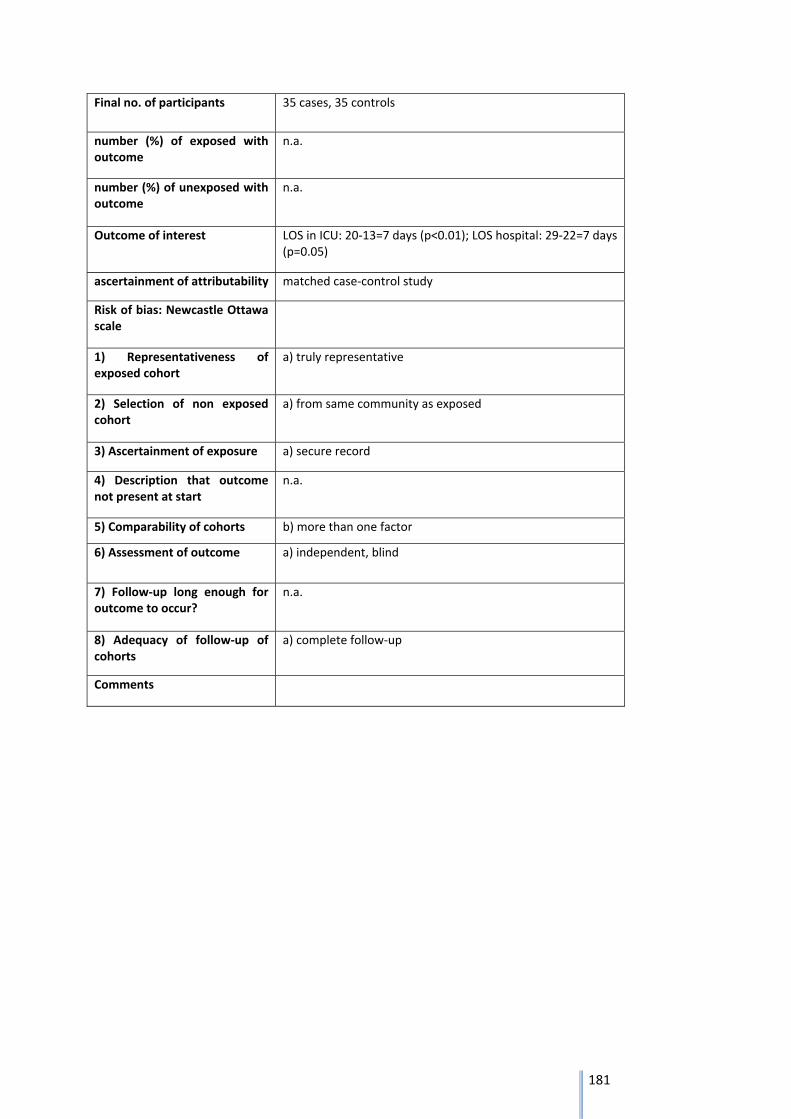
181
Final no. of participants 35 cases, 35 controls
number (%) of exposed with outcome
n.a.
number (%) of unexposed with outcome
n.a.
Outcome of interest LOS in ICU: 20‐13=7 days (p<0.01); LOS hospital: 29‐22=7 days (p=0.05)
ascertainment of attributability matched case‐control study
Risk of bias: Newcastle Ottawa scale
1) Representativeness of exposed cohort
a) truly representative
2) Selection of non exposed cohort
a) from same community as exposed
3) Ascertainment of exposure a) secure record
4) Description that outcome not present at start
n.a.
5) Comparability of cohorts b) more than one factor
6) Assessment of outcome a) independent, blind
7) Follow‐up long enough for outcome to occur?
n.a.
8) Adequacy of follow‐up of cohorts
a) complete follow‐up
Comments
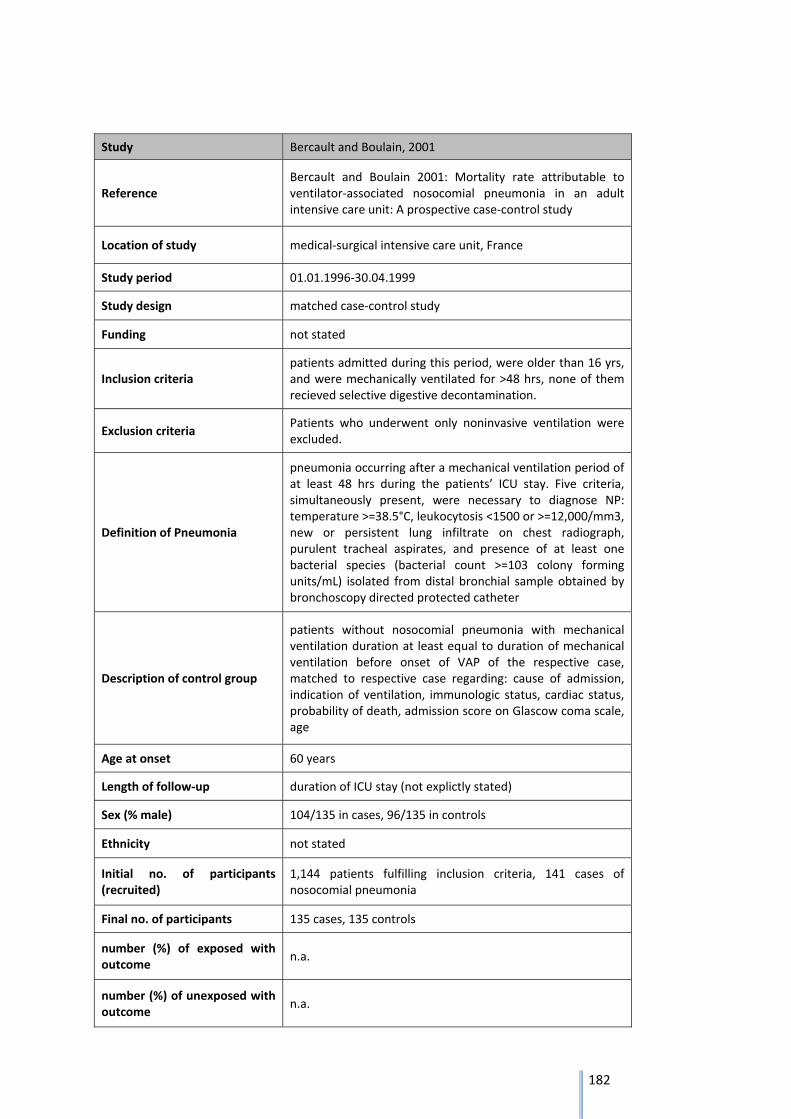
182
Study Bercault and Boulain, 2001
Reference Bercault and Boulain 2001: Mortality rate attributable to ventilator‐associated nosocomial pneumonia in an adult intensive care unit: A prospective case‐control study
Location of study medical‐surgical intensive care unit, France
Study period 01.01.1996‐30.04.1999
Study design matched case‐control study
Funding not stated
Inclusion criteria patients admitted during this period, were older than 16 yrs, and were mechanically ventilated for >48 hrs, none of them recieved selective digestive decontamination.
Exclusion criteria Patients who underwent only noninvasive ventilation were excluded.
Definition of Pneumonia
pneumonia occurring after a mechanical ventilation period of at least 48 hrs during the patients’ ICU stay. Five criteria, simultaneously present, were necessary to diagnose NP: temperature >=38.5°C, leukocytosis <1500 or >=12,000/mm3, new or persistent lung infiltrate on chest radiograph, purulent tracheal aspirates, and presence of at least one bacterial species (bacterial count >=103 colony forming units/mL) isolated from distal bronchial sample obtained by bronchoscopy directed protected catheter
Description of control group
patients without nosocomial pneumonia with mechanical ventilation duration at least equal to duration of mechanical ventilation before onset of VAP of the respective case, matched to respective case regarding: cause of admission, indication of ventilation, immunologic status, cardiac status, probability of death, admission score on Glascow coma scale, age
Age at onset 60 years
Length of follow‐up duration of ICU stay (not explictly stated)
Sex (% male) 104/135 in cases, 96/135 in controls
Ethnicity not stated
Initial no. of participants (recruited)
1,144 patients fulfilling inclusion criteria, 141 cases of nosocomial pneumonia
Final no. of participants 135 cases, 135 controls
number (%) of exposed with outcome
n.a.
number (%) of unexposed with outcome
n.a.
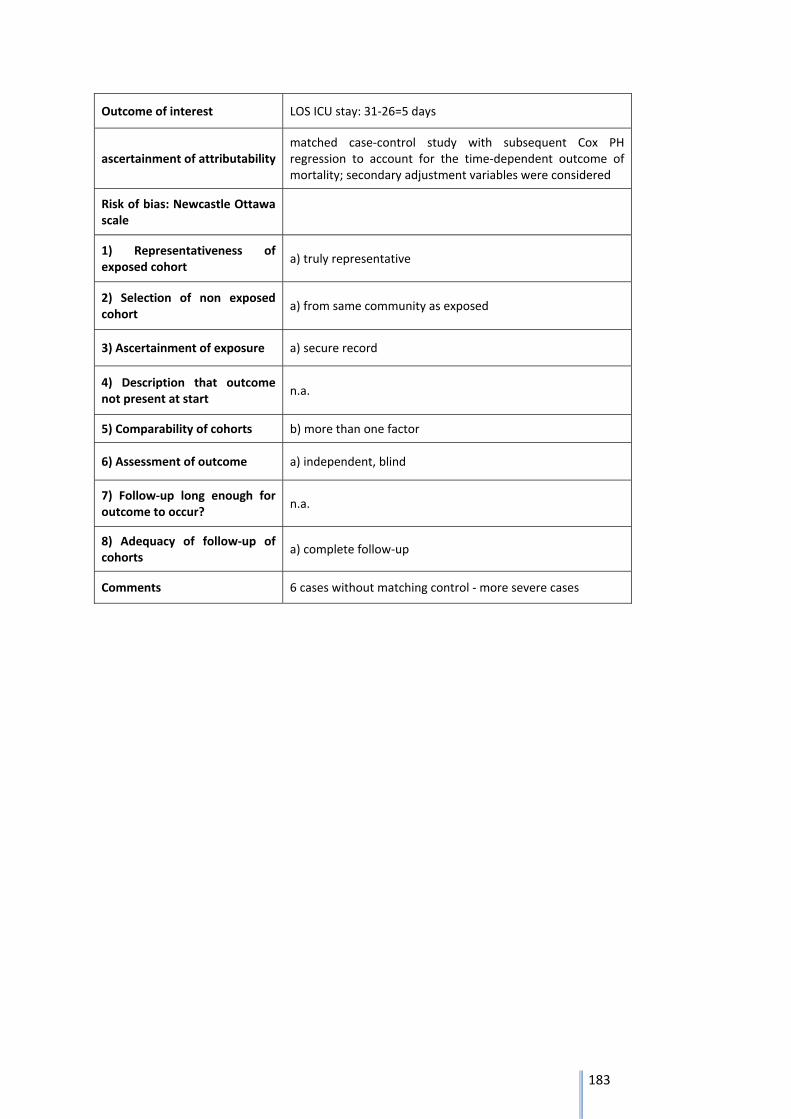
183
Outcome of interest LOS ICU stay: 31‐26=5 days
ascertainment of attributability matched case‐control study with subsequent Cox PH regression to account for the time‐dependent outcome of mortality; secondary adjustment variables were considered
Risk of bias: Newcastle Ottawa scale
1) Representativeness of exposed cohort
a) truly representative
2) Selection of non exposed cohort
a) from same community as exposed
3) Ascertainment of exposure a) secure record
4) Description that outcome not present at start
n.a.
5) Comparability of cohorts b) more than one factor
6) Assessment of outcome a) independent, blind
7) Follow‐up long enough for outcome to occur?
n.a.
8) Adequacy of follow‐up of cohorts
a) complete follow‐up
Comments 6 cases without matching control ‐ more severe cases
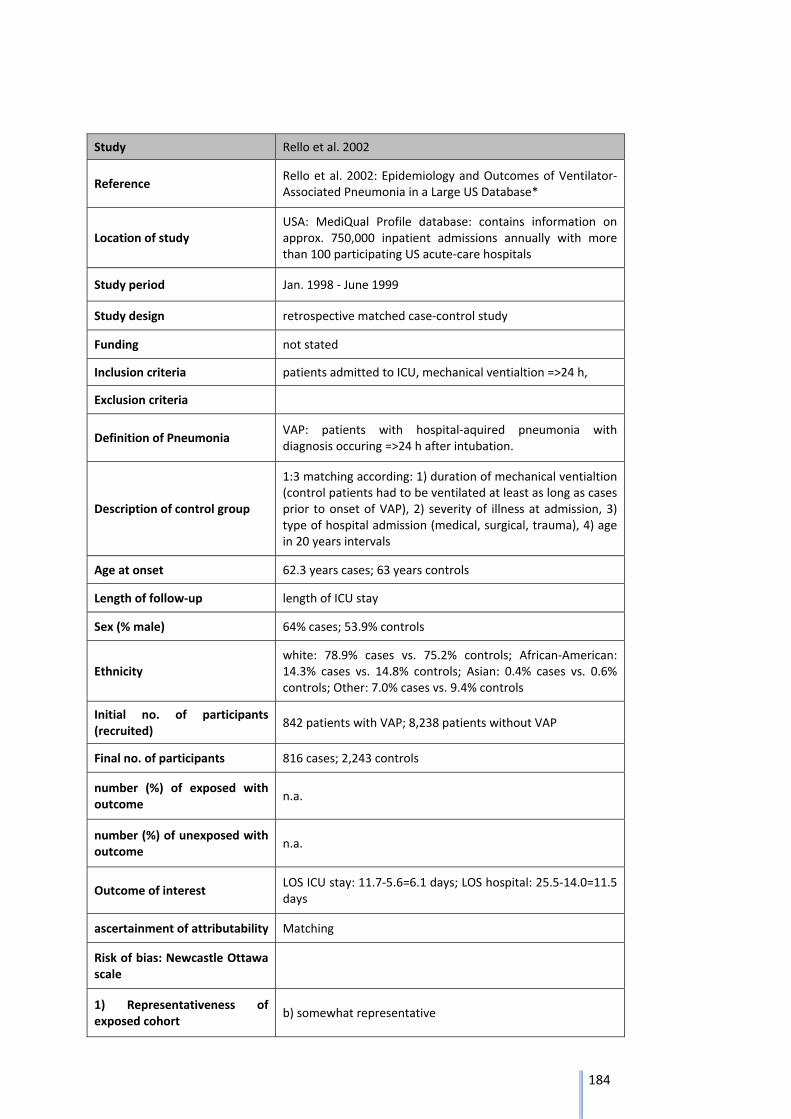
184
Study Rello et al. 2002
Reference Rello et al. 2002: Epidemiology and Outcomes of Ventilator‐Associated Pneumonia in a Large US Database*
Location of study USA: MediQual Profile database: contains information on approx. 750,000 inpatient admissions annually with more than 100 participating US acute‐care hospitals
Study period Jan. 1998 ‐ June 1999
Study design retrospective matched case‐control study
Funding not stated
Inclusion criteria patients admitted to ICU, mechanical ventialtion =>24 h,
Exclusion criteria
Definition of Pneumonia VAP: patients with hospital‐aquired pneumonia with diagnosis occuring =>24 h after intubation.
Description of control group
1:3 matching according: 1) duration of mechanical ventialtion (control patients had to be ventilated at least as long as cases prior to onset of VAP), 2) severity of illness at admission, 3) type of hospital admission (medical, surgical, trauma), 4) age in 20 years intervals
Age at onset 62.3 years cases; 63 years controls
Length of follow‐up length of ICU stay
Sex (% male) 64% cases; 53.9% controls
Ethnicity white: 78.9% cases vs. 75.2% controls; African‐American: 14.3% cases vs. 14.8% controls; Asian: 0.4% cases vs. 0.6% controls; Other: 7.0% cases vs. 9.4% controls
Initial no. of participants (recruited)
842 patients with VAP; 8,238 patients without VAP
Final no. of participants 816 cases; 2,243 controls
number (%) of exposed with outcome
n.a.
number (%) of unexposed with outcome
n.a.
Outcome of interest LOS ICU stay: 11.7‐5.6=6.1 days; LOS hospital: 25.5‐14.0=11.5 days
ascertainment of attributability Matching
Risk of bias: Newcastle Ottawa scale
1) Representativeness of exposed cohort
b) somewhat representative
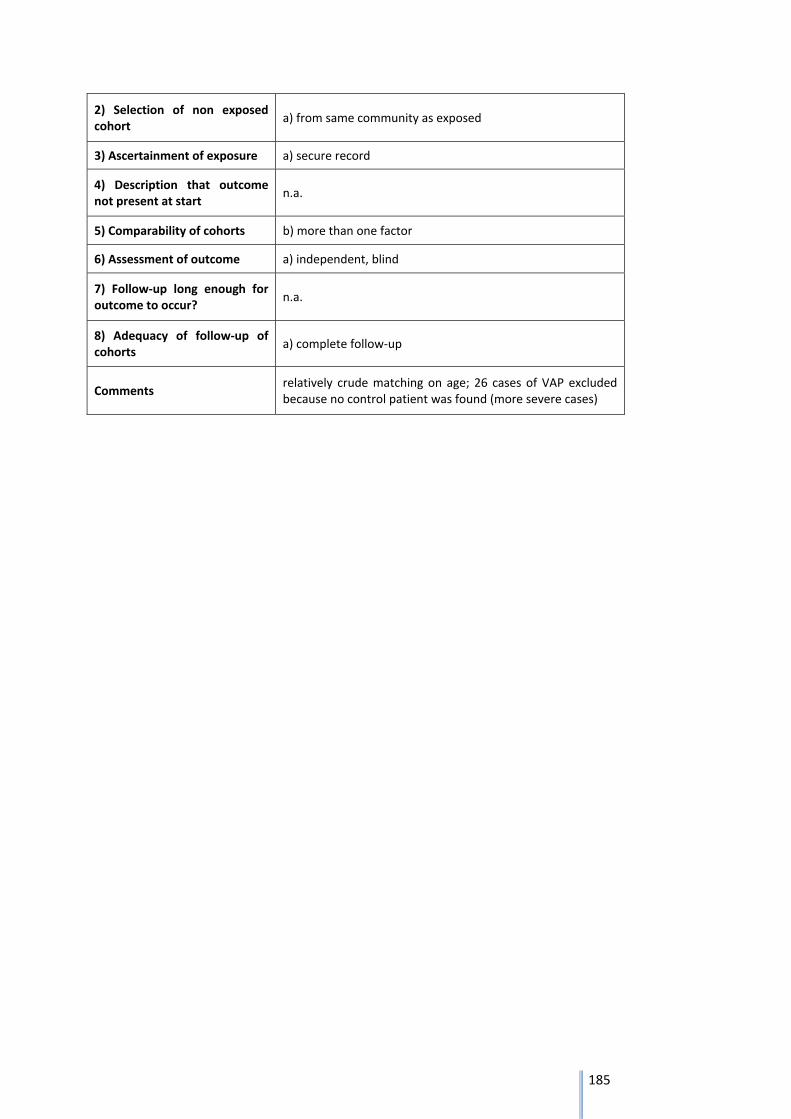
185
2) Selection of non exposed cohort
a) from same community as exposed
3) Ascertainment of exposure a) secure record
4) Description that outcome not present at start
n.a.
5) Comparability of cohorts b) more than one factor
6) Assessment of outcome a) independent, blind
7) Follow‐up long enough for outcome to occur?
n.a.
8) Adequacy of follow‐up of cohorts
a) complete follow‐up
Comments relatively crude matching on age; 26 cases of VAP excluded because no control patient was found (more severe cases)
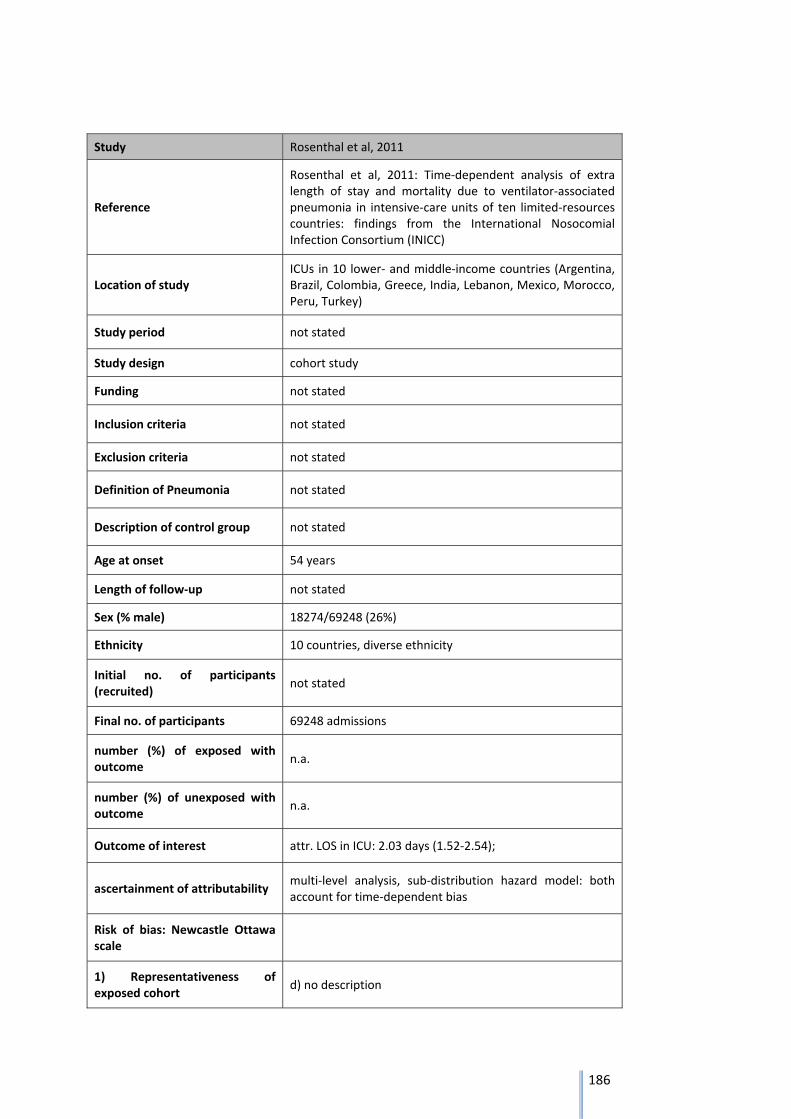
186
Study Rosenthal et al, 2011
Reference
Rosenthal et al, 2011: Time‐dependent analysis of extra length of stay and mortality due to ventilator‐associated pneumonia in intensive‐care units of ten limited‐resources countries: findings from the International Nosocomial Infection Consortium (INICC)
Location of study ICUs in 10 lower‐ and middle‐income countries (Argentina, Brazil, Colombia, Greece, India, Lebanon, Mexico, Morocco, Peru, Turkey)
Study period not stated
Study design cohort study
Funding not stated
Inclusion criteria not stated
Exclusion criteria not stated
Definition of Pneumonia not stated
Description of control group not stated
Age at onset 54 years
Length of follow‐up not stated
Sex (% male) 18274/69248 (26%)
Ethnicity 10 countries, diverse ethnicity
Initial no. of participants (recruited)
not stated
Final no. of participants 69248 admissions
number (%) of exposed with outcome
n.a.
number (%) of unexposed with outcome
n.a.
Outcome of interest attr. LOS in ICU: 2.03 days (1.52‐2.54);
ascertainment of attributability multi‐level analysis, sub‐distribution hazard model: both account for time‐dependent bias
Risk of bias: Newcastle Ottawa scale
1) Representativeness of exposed cohort
d) no description
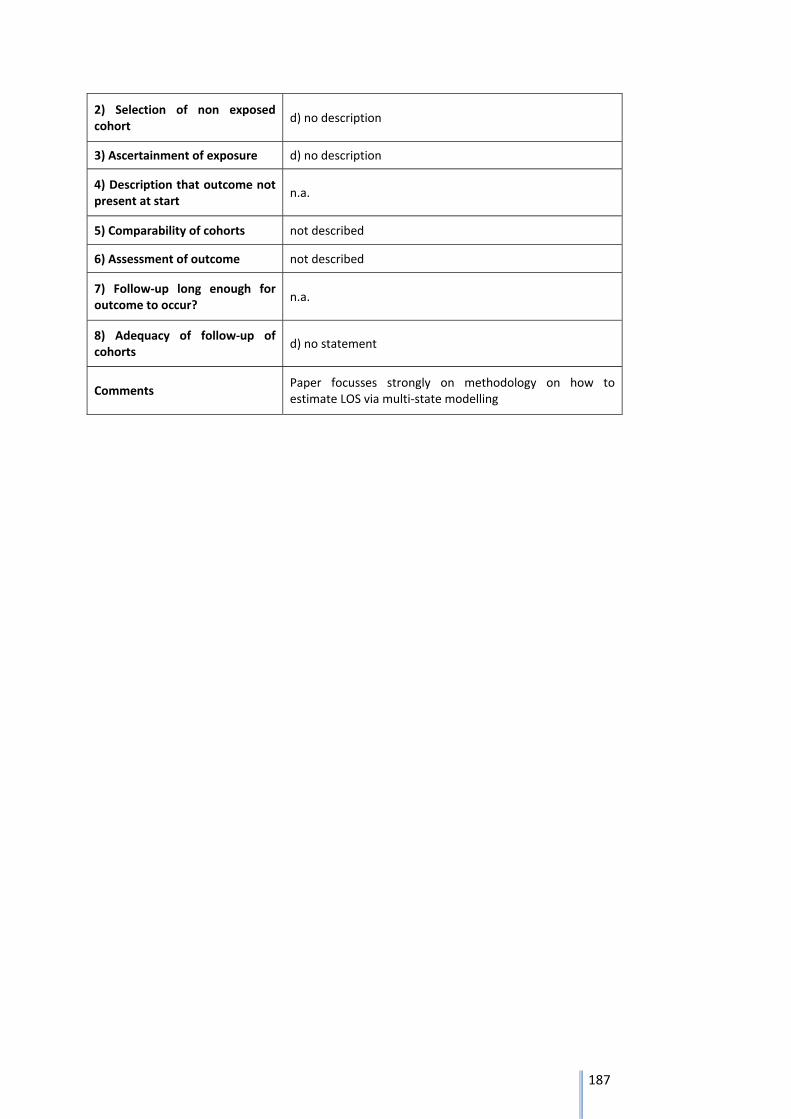
187
2) Selection of non exposed cohort
d) no description
3) Ascertainment of exposure d) no description
4) Description that outcome not present at start
n.a.
5) Comparability of cohorts not described
6) Assessment of outcome not described
7) Follow‐up long enough for outcome to occur?
n.a.
8) Adequacy of follow‐up of cohorts
d) no statement
Comments Paper focusses strongly on methodology on how to estimate LOS via multi‐state modelling
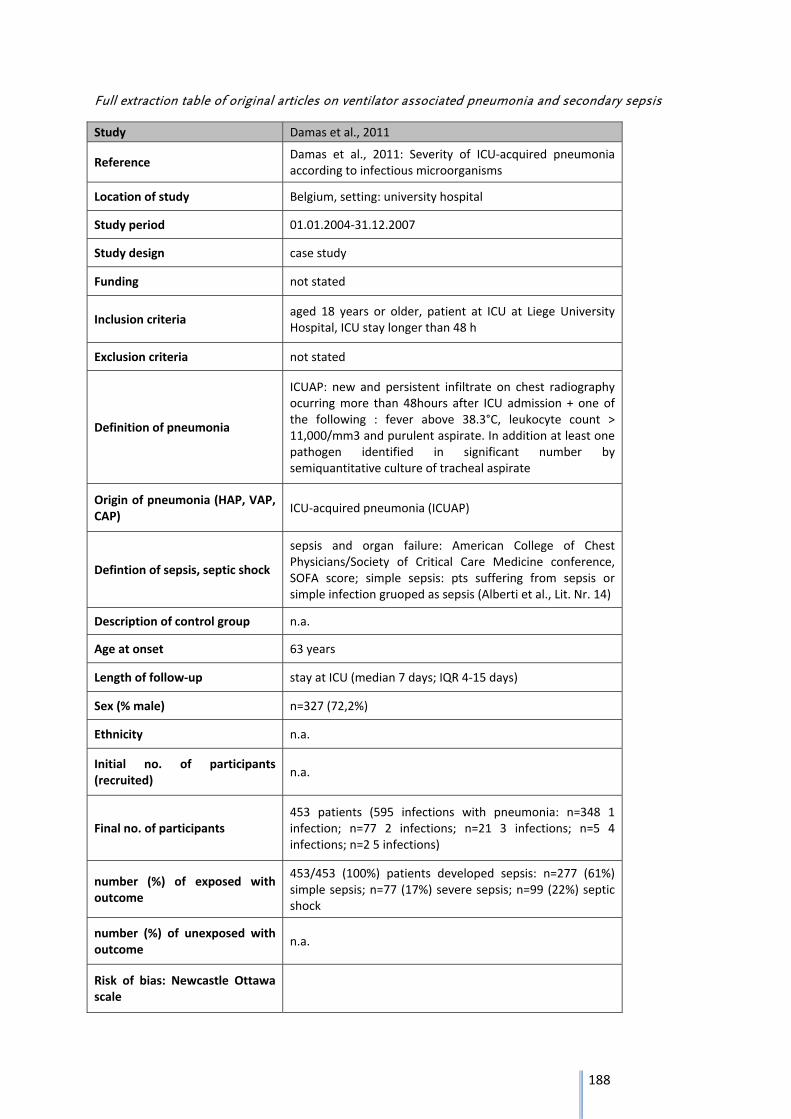
188
Full extraction table of original articles on ventilator associated pneumonia and secondary sepsis
Study Damas et al., 2011
Reference Damas et al., 2011: Severity of ICU‐acquired pneumonia according to infectious microorganisms
Location of study Belgium, setting: university hospital
Study period 01.01.2004‐31.12.2007
Study design case study
Funding not stated
Inclusion criteria aged 18 years or older, patient at ICU at Liege University Hospital, ICU stay longer than 48 h
Exclusion criteria not stated
Definition of pneumonia
ICUAP: new and persistent infiltrate on chest radiography ocurring more than 48hours after ICU admission + one of the following : fever above 38.3°C, leukocyte count > 11,000/mm3 and purulent aspirate. In addition at least one pathogen identified in significant number by semiquantitative culture of tracheal aspirate
Origin of pneumonia (HAP, VAP, CAP)
ICU‐acquired pneumonia (ICUAP)
Defintion of sepsis, septic shock
sepsis and organ failure: American College of Chest Physicians/Society of Critical Care Medicine conference, SOFA score; simple sepsis: pts suffering from sepsis or simple infection gruoped as sepsis (Alberti et al., Lit. Nr. 14)
Description of control group n.a.
Age at onset 63 years
Length of follow‐up stay at ICU (median 7 days; IQR 4‐15 days)
Sex (% male) n=327 (72,2%)
Ethnicity n.a.
Initial no. of participants (recruited)
n.a.
Final no. of participants 453 patients (595 infections with pneumonia: n=348 1 infection; n=77 2 infections; n=21 3 infections; n=5 4 infections; n=2 5 infections)
number (%) of exposed with outcome
453/453 (100%) patients developed sepsis: n=277 (61%) simple sepsis; n=77 (17%) severe sepsis; n=99 (22%) septic shock
number (%) of unexposed with outcome
n.a.
Risk of bias: Newcastle Ottawa scale
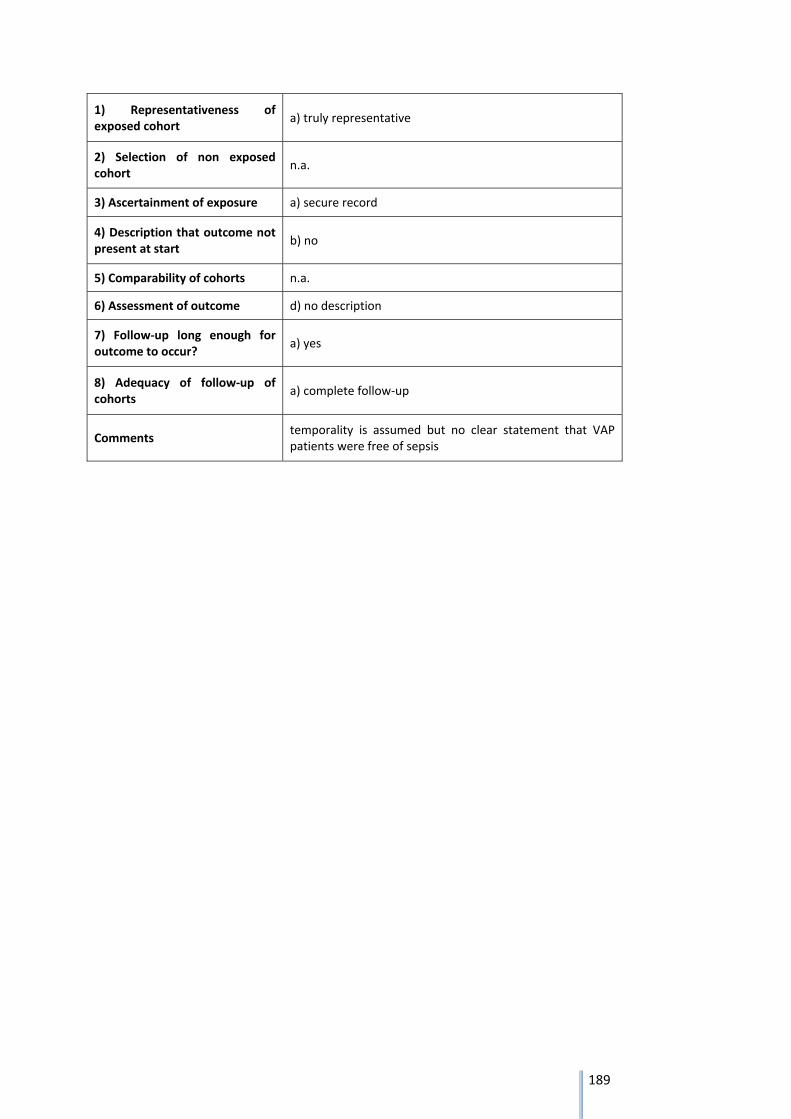
189
1) Representativeness of exposed cohort
a) truly representative
2) Selection of non exposed cohort
n.a.
3) Ascertainment of exposure a) secure record
4) Description that outcome not present at start
b) no
5) Comparability of cohorts n.a.
6) Assessment of outcome d) no description
7) Follow‐up long enough for outcome to occur?
a) yes
8) Adequacy of follow‐up of cohorts
a) complete follow‐up
Comments temporality is assumed but no clear statement that VAP patients were free of sepsis
190
6 Bibliography
1. Murray CJL LA, eds. The global burden of disease: a comprehensive assessment of mortality and disability from diseases, injuries and risk factors in 1990 and projected to 2020. Cambridge: Harvard School of Public Health on behalf of the World Health Organization and the World Bank; 1996. 2. World Health Organization, Geneva. The global burden of disease: 2004 update2008. Available from: http://www.who.int/healthinfo/global_burden_disease/publications/en/. 3. Murray CJ, Ezzati M, Flaxman AD, Lim S, Lozano R, Michaud C, et al. GBD 2010: design, definitions, and metrics. Lancet. 2012;380(9859):2063‐6. 4. Kretzschmar M, Mangen M‐JJ, Pinheiro P, Jahn B, Fèvre EM, Longhi S, et al. New Methodology for Estimating the Burden of Infectious Diseases in Europe. PLoS medicine. 2012;9(4):e1001205. 5. Mangen MJ, Plass D, Havelaar AH, Gibbons CL, Cassini A, Muhlberger N, et al. The pathogen‐ and incidence‐based DALY approach: an appropriate [corrected] methodology for estimating the burden of infectious diseases. PloS one. 2013;8(11):e79740. 6. ECDC. Methodology protocol for estimating burden of communicable diseases2010. Available from: http://www.ecdc.europa.eu/en/healthtopics/burden_of_communicable_diseases/pages/index.aspx. 7. Salomon JA, Vos T, Hogan DR, Gagnon M, Naghavi M, Mokdad A, et al. Common values in assessing health outcomes from disease and injury: disability weights measurement study for the Global Burden of Disease Study 2010. Lancet. 2012;380(9859):2129‐43. 8. ECDC. Point prevalence survey of healthcare‐associated infections and antimicrobial use in European acute care hospitals. Stockholm: ECDC; 2013. 9. Lee JC, Lee NY, Lee HC, Huang WH, Tsui KC, Chang CM, et al. Clinical characteristics of urosepsis caused by extended‐spectrum beta‐lactamase‐producing Escherichia coli or Klebsiella pneumonia and their emergence in the community. Journal of microbiology, immunology, and infection = Wei mian yu gan ran za zhi. 2012;45(2):127‐33. 10. Higgins J, Green S. Cochrane Handbook of Systematic Reviews of Interventions: Cochrane Collaboration 2011. Available from: http://handbook.cochrane.org/. 11. Guyatt GH, Oxman AD, Vist GE, Kunz R, Falck‐Ytter Y, Alonso‐Coello P, et al. GRADE: an emerging consensus on rating quality of evidence and strength of recommendations. BMJ (Clinical research ed). 2008;336(7650):924‐6. 12. Chant C, Smith OM, Marshall JC, Friedrich JO. Relationship of catheter‐associated urinary tract infection to mortality and length of stay in critically ill patients: a systematic review and meta‐analysis of observational studies. Critical care medicine. 2011;39(5):1167‐73. 13. Clec'h C, Schwebel C, Francais A, Toledano D, Fosse JP, Garrouste‐Orgeas M, et al. Does catheter‐associated urinary tract infection increase mortality in critically ill patients? Infection control and hospital epidemiology : the official journal of the Society of Hospital Epidemiologists of America. 2007;28(12):1367‐73. 14. Laupland KB, Zygun DA, Davies HD, Church DL, Louie TJ, Doig CJ. Incidence and risk factors for acquiring nosocomial urinary tract infection in the critically ill. Journal of critical care. 2002;17(1):50‐7. 15. Garcia‐Martin M, Lardelli‐Claret P, Jimenez‐Moleon JJ, Bueno‐Cavanillas A, Luna‐del‐Castillo JD, Galvez‐Vargas R. Proportion of hospital deaths potentially attributable to nosocomial infection. Infection control and hospital epidemiology : the official journal of the Society of Hospital Epidemiologists of America. 2001;22(11):708‐14. 16. Laupland KB, Bagshaw SM, Gregson DB, Kirkpatrick AW, Ross T, Church DL. Intensive care unit‐acquired urinary tract infections in a regional critical care system. Critical care (London, England). 2005;9(2):R60‐5.
191
17. Appelgren P, Hellstrom I, Weitzberg E, Soderlund V, Bindslev L, Ransjo U. Risk factors for nosocomial intensive care infection: a long‐term prospective analysis. Acta anaesthesiologica Scandinavica. 2001;45(6):710‐9. 18. van der Kooi TI, de Boer AS, Mannien J, Wille JC, Beaumont MT, Mooi BW, et al. Incidence and risk factors of device‐associated infections and associated mortality at the intensive care in the Dutch surveillance system. Intensive care medicine. 2007;33(2):271‐8. 19. Bochicchio GV, Joshi M, Shih D, Bochicchio K, Tracy K, Scalea TM. Reclassification of urinary tract infections in critically ill trauma patients: a time‐dependent analysis. Surgical infections. 2003;4(4):379‐85. 20. Krieger JN, Kaiser DL, Wenzel RP. Urinary tract etiology of bloodstream infections in hospitalized patients. The Journal of infectious diseases. 1983;148(1):57‐62. 21. Saint S. Clinical and economic consequences of nosocomial catheter‐related bacteriuria. Am J Infect Control. 2000;28(1):68‐75. 22. Pittet D, Rangel‐Frausto S, Li N, Tarara D, Costigan M, Rempe L, et al. Systemic inflammatory response syndrome, sepsis, severe sepsis and septic shock: incidence, morbidities and outcomes in surgical ICU patients. Intensive care medicine. 1995;21(4):302‐9. 23. Rangel‐Frausto MS, Pittet D, Costigan M, Hwang T, Davis CS, Wenzel RP. The natural history of the systemic inflammatory response syndrome (SIRS). A prospective study. Jama. 1995;273(2):117‐23. 24. Engel C, Brunkhorst FM, Bone HG, Brunkhorst R, Gerlach H, Grond S, et al. Epidemiology of sepsis in Germany: results from a national prospective multicenter study. Intensive care medicine. 2007;33(4):606‐18. 25. Renaud B, Brun‐Buisson C, Group IC‐BS. Outcomes of primary and catheter‐related bacteremia. A cohort and case‐control study in critically ill patients. American journal of respiratory and critical care medicine. 2001;163(7):1584‐90. 26. Blot SI, Depuydt P, Annemans L, Benoit D, Hoste E, De Waele JJ, et al. Clinical and economic outcomes in critically ill patients with nosocomial catheter‐related bloodstream infections. Clin Infect Dis. 2005;41(11):1591‐8. 27. Digiovine B, Chenoweth C, Watts C, Higgins M. The attributable mortality and costs of primary nosocomial bloodstream infections in the intensive care unit. American journal of respiratory and critical care medicine. 1999;160(3):976‐81. 28. Orsi GB, Di Stefano L, Noah N. Hospital‐acquired, laboratory‐confirmed bloodstream infection: increased hospital stay and direct costs. Infection control and hospital epidemiology : the official journal of the Society of Hospital Epidemiologists of America. 2002;23(4):190‐7. 29. Quartin AA, Schein RM, Kett DH, Peduzzi PN. Magnitude and duration of the effect of sepsis on survival. Department of Veterans Affairs Systemic Sepsis Cooperative Studies Group. JAMA. 1997;277(13):1058‐63. 30. Pittet D, Tarara D, Wenzel RP. Nosocomial bloodstream infection in critically ill patients. Excess length of stay, extra costs, and attributable mortality. JAMA. 1994;271(20):1598‐601. 31. Wisplinghoff H, Bischoff T, Tallent SM, Seifert H, Wenzel RP, Edmond MB. Nosocomial bloodstream infections in US hospitals: analysis of 24,179 cases from a prospective nationwide surveillance study. Clin Infect Dis. 2004;39(3):309‐17. 32. Oppert M, Engel C, Brunkhorst FM, Bogatsch H, Reinhart K, Frei U, et al. Acute renal failure in patients with severe sepsis and septic shock‐‐a significant independent risk factor for mortality: results from the German Prevalence Study. Nephrology, dialysis, transplantation : official publication of the European Dialysis and Transplant Association ‐ European Renal Association. 2008;23(3):904‐9. 33. Gallagher M, Cass A, Bellomo R, Finfer S, Gattas D, Lee J, et al. Long‐Term Survival and Dialysis Dependency Following Acute Kidney Injury in Intensive Care: Extended Follow‐up of a Randomized Controlled Trial. PLoS medicine. 2014;11(2):e1001601. 34. Khan J, Harrison TB, Rich MM, Moss M. Early development of critical illness myopathy and neuropathy in patients with severe sepsis. Neurology. 2006;67(8):1421‐5.
192
35. Garnacho‐Montero J, Madrazo‐Osuna J, Garcia‐Garmendia JL, Ortiz‐Leyba C, Jimenez‐Jimenez FJ, Barrero‐Almodovar A, et al. Critical illness polyneuropathy: risk factors and clinical consequences. A cohort study in septic patients. Intensive care medicine. 2001;27(8):1288‐96. 36. Eidelman LA, Putterman D, Putterman C, Sprung CL. The spectrum of septic encephalopathy. Definitions, etiologies, and mortalities. JAMA. 1996;275(6):470‐3. 37. Iwashyna TJ, Ely EW, Smith DM, Langa KM. Long‐term cognitive impairment and functional disability among survivors of severe sepsis. JAMA. 2010;304(16):1787‐94. 38. Hopkins RO, Weaver LK, Collingridge D, Parkinson RB, Chan KJ, Orme JF, Jr. Two‐year cognitive, emotional, and quality‐of‐life outcomes in acute respiratory distress syndrome. American journal of respiratory and critical care medicine. 2005;171(4):340‐7. 39. Deja M, Denke C, Weber‐Carstens S, Schroder J, Pille CE, Hokema F, et al. Social support during intensive care unit stay might improve mental impairment and consequently health‐related quality of life in survivors of severe acute respiratory distress syndrome. Critical care (London, England). 2006;10(5):R147. 40. Schelling G, Stoll C, Haller M, Briegel J, Manert W, Hummel T, et al. Health‐related quality of life and posttraumatic stress disorder in survivors of the acute respiratory distress syndrome. Crit Care Med. 1998;26(4):651‐9. 41. Stoll C, Kapfhammer HP, Rothenhausler HB, Haller M, Briegel J, Schmidt M, et al. Sensitivity and specificity of a screening test to document traumatic experiences and to diagnose post‐traumatic stress disorder in ARDS patients after intensive care treatment. Intensive care medicine. 1999;25(7):697‐704. 42. Kapfhammer HP, Rothenhausler HB, Krauseneck T, Stoll C, Schelling G. Posttraumatic stress disorder and health‐related quality of life in long‐term survivors of acute respiratory distress syndrome. The American journal of psychiatry. 2004;161(1):45‐52. 43. Kessler RC, Sonnega A, Bromet E, Hughes M, Nelson CB. Posttraumatic stress disorder in the National Comorbidity Survey. Archives of general psychiatry. 1995;52(12):1048‐60. 44. Hofhuis JG, Spronk PE, van Stel HF, Schrijvers AJ, Rommes JH, Bakker J. The impact of severe sepsis on health‐related quality of life: a long‐term follow‐up study. Anesthesia and analgesia. 2008;107(6):1957‐64. 45. Herridge MS, Cheung AM, Tansey CM, Matte‐Martyn A, Diaz‐Granados N, Al‐Saidi F, et al. One‐Year Outcomes in Survivors of the Acute Respiratory Distress Syndrome. New England Journal of Medicine. 2003;348(8):683‐93. 46. Olaechea PM, Palomar M, Alvarez‐Lerma F, Otal JJ, Insausti J, Lopez‐Pueyo MJ, et al. Morbidity and mortality associated with primary and catheter‐related bloodstream infections in critically ill patients. Revista espanola de quimioterapia : publicacion oficial de la Sociedad Espanola de Quimioterapia. 2013;26(1):21‐9. 47. Alshaikh B, Yusuf K, Sauve R. Neurodevelopmental outcomes of very low birth weight infants with neonatal sepsis: systematic review and meta‐analysis. Journal of perinatology : official journal of the California Perinatal Association. 2013;33(7):558‐64. 48. Faust KG, Wolfgang ; Herting, Egbert ; Härtel, Christoph. Sepsis bei Frühgeborenen mit einem sehr niedrigen Geburtsgewicht. Epidemiologie, Risikofaktoren und Präventionsstrategien Chemotherapie‐Journal. 2011;20(1). 49. Vergnano S, Menson E, Kennea N, Embleton N, Russell AB, Watts T, et al. Neonatal infections in England: the NeonIN surveillance network. Archives of disease in childhood Fetal and neonatal edition. 2011;96(1):F9‐f14. 50. Haller S DP, Cassini A, Suetens C, Zingg W, Abu Sin M, et al. Neurological sequelae of sepsis in very low birth weight infants: Umbrella review and evidence‐based outcome tree. Eurosurveillance. 2016;In Press. 51. Vardakas KZ, Polyzos KA, Patouni K, Rafailidis PI, Samonis G, Falagas ME, et al. Treatment failure and recurrence of Clostridium difficile infection following treatment with vancomycin or metronidazole: A systematic review of the evidence. Int J Antimicrob Agents. 2012;40(1):1‐8.
193
52. Bhangu A, Nepogodiev D, Gupta A, Torrance A, Singh P, West Midlands Research C. Systematic review and meta‐analysis of outcomes following emergency surgery for Clostridium difficile colitis. The British journal of surgery. 2012;99(11):1501‐13. 53. Ananthakrishnan AN, McGinley EL, Saeian K, Binion DG. Temporal trends in disease outcomes related to Clostridium difficile infection in patients with inflammatory bowel disease. Inflammatory bowel diseases. 2011;17(4):976‐83. 54. Issa M, Vijayapal A, Graham MB, Beaulieu DB, Otterson MF, Lundeen S, et al. Impact of Clostridium difficile on inflammatory bowel disease. Clinical gastroenterology and hepatology : the official clinical practice journal of the American Gastroenterological Association. 2007;5(3):345‐51. 55. Dallal RM, Harbrecht BG, Boujoukas AJ, Sirio CA, Farkas LM, Lee KK, et al. Fulminant Clostridium difficile: an underappreciated and increasing cause of death and complications. Annals of surgery. 2002;235(3):363‐72. 56. Jobe BA, Grasley A, Deveney KE, Deveney CW, Sheppard BC. Clostridium difficile colitis: an increasing hospital‐acquired illness. American journal of surgery. 1995;169(5):480‐3. 57. Klipfel AA, Schein M, Fahoum B, Wise L. Acute abdomen and Clostridium difficile colitis: still a lethal combination. Digestive surgery. 2000;17(2):160‐3. 58. Lipsett PA, Samantaray DK, Tam ML, Bartlett JG, Lillemoe KD. Pseudomembranous colitis: a surgical disease? Surgery. 1994;116(3):491‐6. 59. Morris AM, Jobe BA, Stoney M, Sheppard BC, Deveney CW, Deveney KE. Clostridium difficile colitis: an increasingly aggressive iatrogenic disease? Archives of surgery (Chicago, Ill : 1960). 2002;137(10):1096‐100. 60. Rubin MS, Bodenstein LE, Kent KC. Severe Clostridium difficile colitis. Diseases of the colon and rectum. 1995;38(4):350‐4. 61. Synnott K, Mealy K, Merry C, Kyne L, Keane C, Quill R. Timing of surgery for fulminating pseudomembranous colitis. The British journal of surgery. 1998;85(2):229‐31. 62. Trudel JL, Deschenes M, Mayrand S, Barkun AN. Toxic megacolon complicating pseudomembranous enterocolitis. Diseases of the colon and rectum. 1995;38(10):1033‐8. 63. Muto CA, Pokrywka M, Shutt K, Mendelsohn AB, Nouri K, Posey K, et al. A large outbreak of Clostridium difficile‐associated disease with an unexpected proportion of deaths and colectomies at a teaching hospital following increased fluoroquinolone use. Infection control and hospital epidemiology : the official journal of the Society of Hospital Epidemiologists of America. 2005;26(3):273‐80. 64. Al‐Abed YA, Gray EA, Rothnie ND. Outcomes of emergency colectomy for fulminant Clostridium difficile colitis. The surgeon : journal of the Royal Colleges of Surgeons of Edinburgh and Ireland. 2010;8(6):330‐3. 65. Byrn JC, Maun DC, Gingold DS, Baril DT, Ozao JJ, Divino CM. Predictors of mortality after colectomy for fulminant Clostridium difficile colitis. Archives of surgery (Chicago, Ill : 1960). 2008;143(2):150‐4; discussion 5. 66. Dudukgian H, Sie E, Gonzalez‐Ruiz C, Etzioni DA, Kaiser AM. C. difficile colitis‐‐predictors of fatal outcome. Journal of gastrointestinal surgery : official journal of the Society for Surgery of the Alimentary Tract. 2010;14(2):315‐22. 67. Gash K, Brown E, Pullyblank A. Emergency subtotal colectomy for fulminant Clostridium difficile colitis‐‐is a surgical solution considered for all patients? Annals of the Royal College of Surgeons of England. 2010;92(1):56‐60. 68. Hall JF, Berger D. Outcome of colectomy for Clostridium difficile colitis: a plea for early surgical management. American journal of surgery. 2008;196(3):384‐8. 69. Hermsen JL, Dobrescu C, Kudsk KA. Clostridium difficile infection: a surgical disease in evolution. Journal of gastrointestinal surgery : official journal of the Society for Surgery of the Alimentary Tract. 2008;12(9):1512‐7. 70. Koss K, Clark MA, Sanders DS, Morton D, Keighley MR, Goh J. The outcome of surgery in fulminant Clostridium difficile colitis. Colorectal disease : the official journal of the Association of Coloproctology of Great Britain and Ireland. 2006;8(2):149‐54.
194
71. Sailhamer EA, Carson K, Chang Y, Zacharias N, Spaniolas K, Tabbara M, et al. Fulminant Clostridium difficile colitis: patterns of care and predictors of mortality. Archives of surgery (Chicago, Ill : 1960). 2009;144(5):433‐9; discussion 9‐40. 72. Seder CW, Villalba MR, Jr., Robbins J, Ivascu FA, Carpenter CF, Dietrich M, et al. Early colectomy may be associated with improved survival in fulminant Clostridium difficile colitis: an 8‐year experience. American journal of surgery. 2009;197(3):302‐7. 73. Wiegand PN, Nathwani D, Wilcox MH, Stephens J, Shelbaya A, Haider S, et al. Clinical and economic burden of Clostridium difficile infection in Europe: A systematic review of healthcare‐facility‐acquired infection. Journal of Hospital Infection. 2012;81(1):1‐14. 74. Al‐Eidan FA, McElnay JC, Scott MG, Kearney MP. Clostridium difficile‐associated diarrhoea in hospitalised patients. Journal of clinical pharmacy and therapeutics. 2000;25(2):101‐9. 75. Arvand M, Hauri AM, Zaiss NH, Witte W, Bettge‐Weller G. Clostridium difficile ribotypes 001, 017, and 027 are associated with lethal C. difficile infection in Hesse, Germany. Euro surveillance : bulletin Europeen sur les maladies transmissibles = European communicable disease bulletin. 2009;14(45). 76. Bauer MP, Notermans DW, van Benthem BH, Brazier JS, Wilcox MH, Rupnik M, et al. Clostridium difficile infection in Europe: a hospital‐based survey. Lancet. 2011;377(9759):63‐73. 77. Coignard B, Barbut F, Blanckaert K, Thiolet JM, Poujol I, Carbonne A, et al. Emergence of Clostridium difficile toxinotype III, PCR‐ribotype 027‐associated disease, France, 2006. Euro surveillance : bulletin Europeen sur les maladies transmissibles = European communicable disease bulletin. 2006;11(9):E060914 1. 78. Debast SB, Vaessen N, Choudry A, Wiegers‐Ligtvoet EA, van den Berg RJ, Kuijper EJ. Successful combat of an outbreak due to Clostridium difficile PCR ribotype 027 and recognition of specific risk factors. Clinical microbiology and infection : the official publication of the European Society of Clinical Microbiology and Infectious Diseases. 2009;15(5):427‐34. 79. Goorhuis A, Bakker D, Corver J, Debast SB, Harmanus C, Notermans DW, et al. Emergence of Clostridium difficile infection due to a new hypervirulent strain, polymerase chain reaction ribotype 078. Clin Infect Dis. 2008;47(9):1162‐70. 80. Lambert ML, Mertens K, Ramboer I, Delmee M, Suetens C. Nation‐wide prospective surveillance of Clostridium difficile infections in hospitals in Belgium, July 2007‐June 2008. Euro surveillance : bulletin Europeen sur les maladies transmissibles = European communicable disease bulletin. 2009;14(14):2‐4. 81. Lyytikainen O, Turunen H, Sund R, Rasinpera M, Kononen E, Ruutu P, et al. Hospitalizations and deaths associated with Clostridium difficile infection, Finland, 1996‐2004. Emerging infectious diseases. 2009;15(5):761‐5. 82. Mitu‐Pretorian OM, Forgacs B, Qumruddin A, Tavakoli A, Augustine T, Pararajasingam R. Outcomes of patients who develop symptomatic Clostridium difficile infection after solid organ transplantation. Transplantation proceedings. 2010;42(7):2631‐3. 83. Schalk E, Bohr UR, Konig B, Scheinpflug K, Mohren M. Clostridium difficile‐associated diarrhoea, a frequent complication in patients with acute myeloid leukaemia. Annals of hematology. 2010;89(1):9‐14. 84. Shears P, Prtak L, Duckworth R. Hospital‐based epidemiology: a strategy for 'dealing with Clostridium difficile'. The Journal of hospital infection. 2010;74(4):319‐25. 85. Wilson V, Cheek L, Satta G, Walker‐Bone K, Cubbon M, Citron D, et al. Predictors of death after Clostridium difficile infection: a report on 128 strain‐typed cases from a teaching hospital in the United Kingdom. Clin Infect Dis. 2010;50(12):e77‐81. 86. Aksenoka KGSP, E.; Balode, A.; Miklasevics, E.; Dumpis U. Surveillance of Clostridium difficile infection in Latvian multidisciplinary teaching hospital. 18th European Congress of Clinical Microbiology and Infectious Diseases. 2008. 87. Bentohami AAN, C.C.M.; Verberg ,C.M.F.; Tensen, M.; IJzerman, E.F.P.; Heuff, G.; Kuijper, E.J. Succesful control of Clostridium difficile type 027 outbreak by cohort isolation of infected patients. 17th European Society of Clinical Microbiology and Infectious Diseases, Munich, Germany; 31 March‐3 April 2007; 2007.
195
88. Coignard BH, M; Eckert, C. Epidemiological and microbiological characteristics of Clostridium difficile infections, France, 2009: a national, multicentre, prospective survey. 20th European Congress of Clinical Microbiology and Infectious Diseases 2010. 89. Elumogo NH, T; Vautier, G. Is Clostridium difficile 027 more Virulent than other ribotypes? Report of the first outbreak of Clostridium difficile ribotype 027 in East of England: correlation of outbreak and non‐outbreak ribotypes with severity of disease. 19 th European Congress of Clinical Microbiology and Infectious Diseases, Helsinki, Finland; 16‐19 May 2009; 2009.
90. Gutierrez IL, M.L.; Kongs, A; Mazina, D.; van Oyen, H. Trends in mortality due to Clostridium difficile enterocolitis in Brussels and Flanders,. 19th European Congress of Clinical Microbiology and Infectious Diseases, Helsinki, Finland; 16‐19 May 2009; Subject: . 2009.
91. Kleinkauf NJ, A.; Weiss, B.; Neumann, M.; Eckmanns, T.; Michels, H. Detection of infections due to Clostridium difficile PCR ribotype 027 and implementation of a surveillance system for severe cases of Clostridium difficile‐associated diarrhoea in Rhineland‐Palatine, Germany, 2007. 18th European Congress of Clinical Microbiology and Infectious Diseases, Barcelona, Spain; 19‐22 April 2008; 2008.
92. Okoro C. ODJ, Smith A., Kirk A., Haworth E. The epidemiology of the second phase of a hospital outbreak of Clostridium difficile‐associated diarrhoea, Stoke Mandeville, UK. 18th European Congress of Clinical Microbiology and Infectious Diseases, Barcelona, Spain; 19‐22 April 2008. 2008. 93. Hota SS, Achonu C, Crowcroft NS, Harvey BJ, Lauwers A, Gardam MA. Determining mortality rates attributable to Clostridium difficile infection. Emerging infectious diseases. 2012;18(2):305‐7. 94. Agthe NM, E.; Anttila, V.J.; Kanerva, M. Resource use and costs associated with Clostridium difficile diarrhoea in a university hospital. 19th European Congress of Clinical Microbiology and Infectious Diseases 2009. 95. Rodrigues MA, Brady RR, Rodrigues J, Graham C, Gibb AP. Clostridium difficile infection in general surgery patients; identification of high‐risk populations. International journal of surgery (London, England). 2010;8(5):368‐72. 96. Sundram F, Guyot A, Carboo I, Green S, Lilaonitkul M, Scourfield A. Clostridium difficile ribotypes 027 and 106: clinical outcomes and risk factors. The Journal of hospital infection. 2009;72(2):111‐8. 97. Tangiisuran B, Davies JG, Cheek L, Rajkumar C, Llewelyn M. Diagnosis of Clostridium difficile infection is associated with a small increased risk of death in elderly inpatients. The Journal of hospital infection. 2010;74(4):401‐3. 98. Vonberg RP, Reichardt C, Behnke M, Schwab F, Zindler S, Gastmeier P. Costs of nosocomial Clostridium difficile‐associated diarrhoea. The Journal of hospital infection. 2008;70(1):15‐20. 99. Pépin J, Valiquette L, Cossette B. Mortality attributable to nosocomial Clostridium difficile‐associated disease during an epidemic caused by a hypervirulent strain in Quebec. CMAJ : Canadian Medical Association journal = journal de l'Association medicale canadienne. 2005;173(9):1037‐42. 100. Dodek PM, Norena M, Ayas NT, Romney M, Wong H. Length of stay and mortality due to Clostridium difficile infection acquired in the intensive care unit. Journal of critical care. 2013;28(4):335‐40. 101. Song X, Bartlett JG, Speck K, Naegeli A, Carroll K, Perl TM. Rising economic impact of clostridium difficile‐associated disease in adult hospitalized patient population. Infection control and hospital epidemiology : the official journal of the Society of Hospital Epidemiologists of America. 2008;29(9):823‐8. 102. Tabak YP, Zilberberg MD, Johannes RS, Sun X, McDonald LC, Tabak YP, et al. Attributable burden of hospital‐onset Clostridium difficile infection: A propensity score matching study. Infection Control and Hospital Epidemiology. 2013;34(6):588‐96. 103. Oake N, Taljaard M, van Walraven C, Wilson K, Roth V, Forster AJ. The effect of hospital‐acquired Clostridium difficile infection on in‐hospital mortality. Archives of internal medicine. 2010;170(20):1804‐10.
196
104. Campbell R, Dean B, Nathanson B, Haidar T, Strauss M, Thomas S, et al. Length of stay and hospital costs among high‐risk patients with hospital‐origin Clostridium difficile‐associated diarrhea. Journal of medical economics. 2013;16(3):440‐8. 105. Kyne L, Hamel MB, Polavaram R, Kelly CP. Health care costs and mortality associated with nosocomial diarrhea due to Clostridium difficile. Clinical infectious diseases : an official publication of the Infectious Diseases Society of America. 2002;34(3):346‐53. 106. German_National_Reference_Center_for_Surveillance_of_Nosocomial_Infections. KISS Krankenhaus‐Infektions‐Surveillance‐System. Module CDAD KISS. Reference data 2012; 2013. Available from: http://www.nrz‐hygiene.de/fileadmin/nrz/module/cdad/CDAD_reference2012_130416.pdf. 107. Health Protection Surveillance Centre (HPSC) AR. Health Protection Surveillance Centre (HPSC), Annual Report 20122012. Available from: http://www.hpsc.ie/A‐Z/Gastroenteric/Clostridiumdifficile/CdifficileSurveillance/AnnualReports/File,14557,en.pdf. 108. Kanerva M, Mentula S, Virolainen‐Julkunen A, Karki T, Mottonen T, Lyytikainen O. Reduction in Clostridium difficile infections in Finland, 2008‐2010. The Journal of hospital infection. 2013;83(2):127‐31. 109. Kwong JC, Ratnasingham S, Campitelli MA, Daneman N, Deeks SL, Manuel DG, et al. The impact of infection on population health: results of the Ontario burden of infectious diseases study. PloS one. 2012;7(9):e44103. 110. Louie TJ, Miller MA, Mullane KM, Weiss K, Lentnek A, Golan Y, et al. Fidaxomicin versus vancomycin for Clostridium difficile infection. The New England journal of medicine. 2011;364(5):422‐31. 111. Debast SB, Bauer MP, Kuijper EJ. European Society of Clinical Microbiology and Infectious Diseases: update of the treatment guidance document for Clostridium difficile infection. Clinical microbiology and infection : the official publication of the European Society of Clinical Microbiology and Infectious Diseases. 2014;20 Suppl 2:1‐26. 112. Gravel D, Miller M, Simor A, Taylor G, Gardam M, McGeer A, et al. Health care‐associated Clostridium difficile infection in adults admitted to acute care hospitals in Canada: a Canadian Nosocomial Infection Surveillance Program Study. Clin Infect Dis. 2009;48(5):568‐76. 113. Neal MD, Alverdy JC, Hall DE, Simmons RL, Zuckerbraun BS. Diverting loop ileostomy and colonic lavage: an alternative to total abdominal colectomy for the treatment of severe, complicated Clostridium difficile associated disease. Annals of surgery. 2011;254(3):423‐7; discussion 7‐9. 114. Zahiruddin A, Feuerstadt P, Das R, Rao P, Sandesara N, Brandt L, et al. C. difficile infection (CDI) with sepsis (Cd‐Sepsis) or systemic inflammatory response syndrome (Cd‐SIRS) has a poor prognosis and is associated most frequently with staphylococcal bacteremia. American Journal of Gastroenterology. 2011;106:149. 115. Lee NY, Huang YT, Hsueh PR, Ko WC. Clostridium difficile bacteremia, Taiwan. Emerging infectious diseases. 2010;16(8):1204‐10. 116. Sethi S, Garey KW, Arora V, Ghantoji S, Rowan P, Smolensky M, et al. Increased rate of irritable bowel syndrome and functional gastrointestinal disorders after Clostridium difficile infection. The Journal of hospital infection. 2011;77(2):172‐3. 117. Freeman J, Bauer MP, Baines SD, Corver J, Fawley WN, Goorhuis B, et al. The Changing Epidemiology of Clostridium difficile Infections. Clinical Microbiology Reviews. 2010;23(3):529‐49. 118. Walker AS, Eyre DW, Wyllie DH, Dingle KE, Griffiths D, Shine B, et al. Relationship between bacterial strain type, host biomarkers, and mortality in Clostridium difficile infection. Clin Infect Dis. 2013;56(11):1589‐600. 119. Walk ST, Micic D, Jain R, Lo ES, Trivedi I, Liu EW, et al. Clostridium difficile ribotype does not predict severe infection. Clin Infect Dis. 2012;55(12):1661‐8. 120. Davies K AH, Davis G.L., et al. Increased severity of C. difficile PCR‐ribotypes across European countries and disparity of 027 prevalence; results of a European prevalence study of clostridium difficile infection (EUCLID). 24th European Congress of Clinical Microbiology and Infectious Diseases; 10‐13 May 2014; Barcelona, Spain2014.
197
121. Gupta A, Khanna S. Community‐acquired infection: an increasing public health threat. Infection and drug resistance. 2014;7:63‐72. 122. Khanna S, Pardi DS, Aronson SL, Kammer PP, Orenstein R, St Sauver JL, et al. The epidemiology of community‐acquired Clostridium difficile infection: a population‐based study. The American journal of gastroenterology. 2012;107(1):89‐95. 123. Melsen WG, Rovers MM, Groenwold RH, Bergmans DC, Camus C, Bauer TT, et al. Attributable mortality of ventilator‐associated pneumonia: a meta‐analysis of individual patient data from randomised prevention studies. The Lancet infectious diseases. 2013;13(8):665‐71. 124. Aybar Türkoglu M, Topeli Iskit A. Ventilator‐associated pneumonia caused by high risk microorganisms: a matched case‐control study. Tüberküloz ve toraks. 2008;56(2):139‐49. 125. Bercault N, Boulain T. Mortality rate attributable to ventilator‐associated nosocomial pneumonia in an adult intensive care unit: a prospective case‐control study. Critical care medicine. 2001;29(12):2303‐9. 126. Rello J, Ollendorf DA, Oster G, Vera‐Llonch M, Bellm L, Redman R, et al. Epidemiology and outcomes of ventilator‐associated pneumonia in a large US database. Chest. 2002;122(6):2115‐21. 127. Rosenthal VD, Udwadia FE, Munoz HJ, Erben N, Higuera F, Abidi K, et al. Time‐dependent analysis of extra length of stay and mortality due to ventilator‐associated pneumonia in inte sive‐care units of ten limited‐resources countries: Findings of the International Nosocomial Infection Control Consortium (INICC). Epidemiology and infection. 2011;139(11):1757‐63. 128. Damas P, Layios N, Seidel L, Nys M, Melin P, Ledoux D. Severity of ICU‐acquired pneumonia according to infectious microorganisms. Intensive care medicine. 2011;37(7):1128‐35. 129. Esperatti M, Ferrer M, Theessen A, Liapikou A, Valencia M, Saucedo LM, et al. Nosocomial pneumonia in the intensive care unit acquired by mechanically ventilated versus nonventilated patients. American journal of respiratory and critical care medicine. 2010;182(12):1533‐9. 130. Karhu J, Ala‐Kokko TI, Ylipalosaari P, Ohtonen P, Laurila JJ, Syrjala H. Hospital and long‐term outcomes of ICU‐treated severe community‐ and hospital‐acquired, and ventilator‐associated pneumonia patients. Acta anaesthesiologica Scandinavica. 2011;55(10):1254‐60. 131. Werarak P, Kiratisin P, Thamlikitkul V. Hospital‐acquired pneumonia and ventilator‐associated pneumonia in adults at Siriraj Hospital: etiology, clinical outcomes, and impact of antimicrobial resistance. Journal of the Medical Association of Thailand = Chotmaihet thangphaet. 2010;93 Suppl 1:S126‐38. 132. Redelmeier DA, Singh SM. Survival in Academy Award‐winning actors and actresses. Annals of internal medicine. 2001;134(10):955‐62. 133. Sylvestre MP, Huszti E, Hanley JA. Do OSCAR winners live longer than less successful peers? A reanalysis of the evidence. Annals of internal medicine. 2006;145(5):361‐3; discussion 92. 134. Beyersmann J, Kneib T, Schumacher M, Gastmeier P. Nosocomial infection, length of stay, and time‐dependent bias. Infection control and hospital epidemiology : the official journal of the Society of Hospital Epidemiologists of America. 2009;30(3):273‐6. 135. Agudo A, Bonet C, Travier N, Gonzalez CA, Vineis P, Bueno‐de‐Mesquita HB, et al. Impact of cigarette smoking on cancer risk in the European prospective investigation into cancer and nutrition study. J Clin Oncol. 2012;30(36):4550‐7.