burden of selected risk factors to non...
TRANSCRIPT

FNRI FOOD AND
NUTRITION
RESEARCH
INSTITUTE
DEPARTMENT
OF
SCIENCE AND
TECHNOLOGY
BURDEN OF SELECTED RISK
FACTORS TO NON
COMMUNICABLE DISEASES
(NCDs) AMONG FILIPINO ADULTS

FNRI FOOD AND
NUTRITION
RESEARCH
INSTITUTE
DEPARTMENT
OF
SCIENCE AND
TECHNOLOGY
PRESENTATION OUTLINE
Burden of Noncommunicable Diseases (NCDs) Global
Western Pacific Region
Philippines
Overview of the 2013 8th National Nutrition Survey (NNS)
Obesity (Body Mass Index, Waist Circumference and Waist-Hip Ratio)
Hypertension
High fasting blood glucose
Dyslipidemia
Smoking Status
Alcohol Consumption Status
Physical Inactivity
Burden of selected risk factors of NCDs based on results
of the 8th NNS
Philippine baseline data for the WHO Global NCD
Targets of 2025

FNRI FOOD AND
NUTRITION
RESEARCH
INSTITUTE
DEPARTMENT
OF
SCIENCE AND
TECHNOLOGY
GLOBAL BURDEN of NCDs
http://www.who.int/mediacentre/factsheets/fs355/en/
are killed each year by
NCDs
more than
36 million people
or nearly 80% of NCD deaths
occur in low- and middle-income
countries.
29 million deaths
is considered "premature" deaths
that occur before the age of 60;
90% of these deaths occurred in
low- and middle-income countries.
More than nine
million of all
deaths

FNRI FOOD AND
NUTRITION
RESEARCH
INSTITUTE
DEPARTMENT
OF
SCIENCE AND
TECHNOLOGY
BURDEN of NCDs in the WESTERN
PACIFIC REGION (WPRO)
Noncommunicable diseases in the Western Pacific Region: A Profile
WHO, Western Pacific Region, 2012
Globally, NCD deaths are projected to
increase from 36 million in 2010 to 44
million 2020. In the Western Pacific
Region, the projected increase is from
10.2 million to 12.3 million.
NCDs are the leading causes of death
and disability in the Western Pacific
Region, responsible for 80% of all
deaths.
Japan
Australia
Singapore
New Zealand
Brunei
Darussalam
Cook Islands
Malaysia
Tonga
China
Viet Nam
Solomon Islands
Philippines Micronesia,
the Federated States of
Vanuatu
Samoa
Palau
Niue
Kiribati
Papua New Guinea
Lao People’s
Democratic Republic, the
Mongolia
Fiji
Cambodia
Tuvalu
Marshall Islands, the
Nauru
FNRI FOOD AND
NUTRITION
RESEARCH
INSTITUTE
DEPARTMENT
OF
SCIENCE AND
TECHNOLOGY
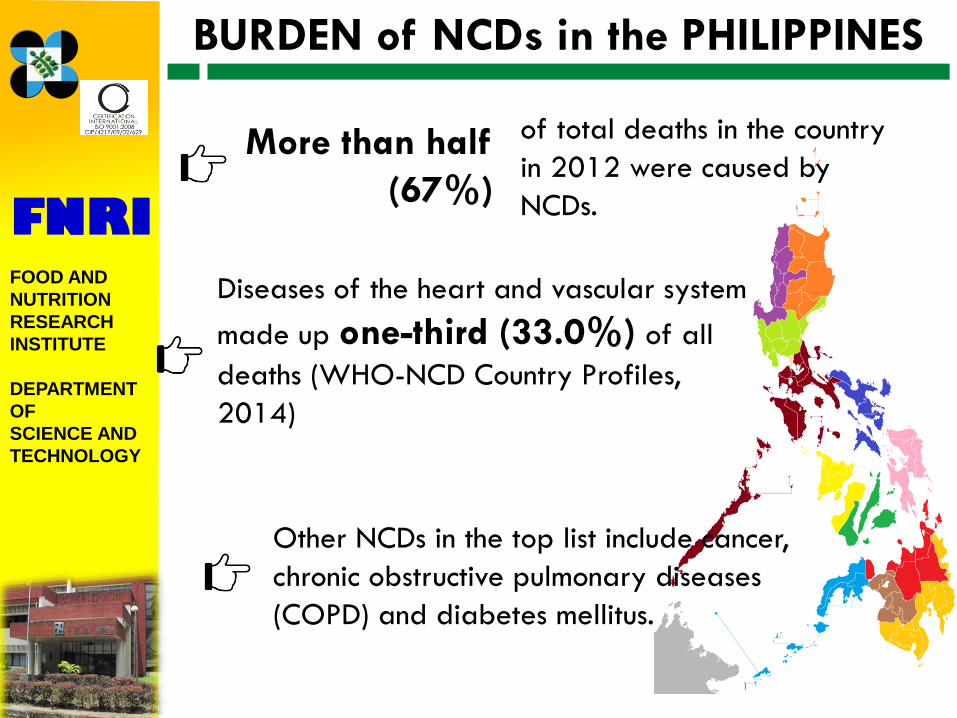
BURDEN of NCDs in the PHILIPPINES
of total deaths in the country
in 2012 were caused by
NCDs.
More than half
(67%)
Diseases of the heart and vascular system
made up one-third (33.0%) of all
deaths (WHO-NCD Country Profiles,
2014)
Other NCDs in the top list include cancer,
chronic obstructive pulmonary diseases
(COPD) and diabetes mellitus.

FNRI FOOD AND
NUTRITION
RESEARCH
INSTITUTE
DEPARTMENT
OF
SCIENCE AND
TECHNOLOGY
An Overview of the
8th NATIONAL NUTRITION SURVEY
(NNS), 2013
EO 128 Section 22
LEGAL BASIS
The FNRI is mandated to undertake research
that defines the citizenry’s nutritional status,
with reference in particular to malnutrition,
its causes and effects, and identify
alternative solutions for them;
EO 352
The national nutrition survey is a designated
statistical activity that will generate critical
data for decision-making of the government
and the private sector
FNRI FOOD AND
NUTRITION
RESEARCH
INSTITUTE
DEPARTMENT
OF
SCIENCE AND
TECHNOLOGY
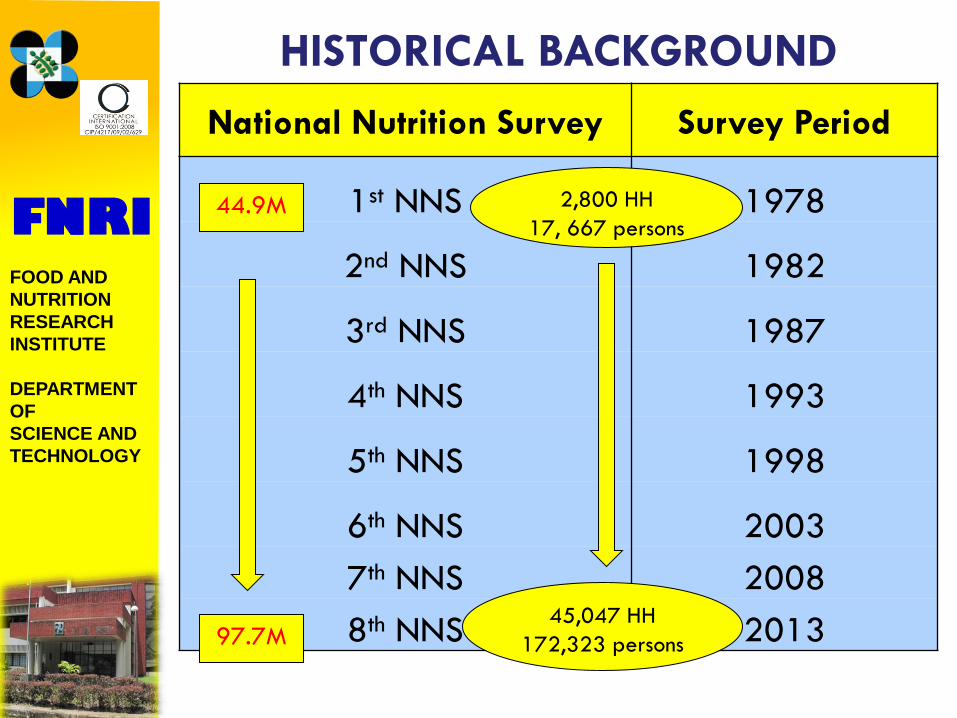
National Nutrition Survey Survey Period
1st NNS 1978
2nd NNS 1982
3rd NNS 1987
4th NNS 1993
5th NNS 1998
6th NNS 2003
7th NNS 2008
8th NNS 2013
HISTORICAL BACKGROUND
2,800 HH
17, 667 persons
45,047 HH
172,323 persons
44.9M
97.7M

FNRI FOOD AND
NUTRITION
RESEARCH
INSTITUTE
DEPARTMENT
OF
SCIENCE AND
TECHNOLOGY
GENERAL OBJECTIVE
To determine and evaluate the
food intake, nutrition and health
status of Filipinos and update
official statistics on food, nutrition
and health situation in the country

FNRI FOOD AND
NUTRITION
RESEARCH
INSTITUTE
DEPARTMENT
OF
SCIENCE AND
TECHNOLOGY
NNS SAMPLING DESIGN
1st Stage – Primary Sampling Unit One barangay or contiguous
barangays with at least 500 HHs
2nd Stage – Enumeration Area Contiguous area in a barangay
with 150-200 HHs
Multi-Stage Stratified Sampling Design
3rd Stage – Households
1 2 3 4
National Statistics Office (NSO) Master Sample
(PSA)
17 Regions/
80 Provinces
+ NCR
4 replicates from the
NSO Master Sample
which utilized 100% of
the 2009 Labor Force
Survey (LFS) Households

FNRI FOOD AND
NUTRITION
RESEARCH
INSTITUTE
DEPARTMENT
OF
SCIENCE AND
TECHNOLOGY
RISK FACTORS of NCDs
based on results of the
2013 National Nutrition Survey

Prevalence of obesity among adults 20 years and over by age
group using WHO BMI Classification: Philippines, 2013
All
6.8
BMI: > 30.0
FOOD AND NUTRITION RESEARCH INSTITUTE-
DEPARTMENT OF SCIENCE AND TECHNOLOGY
0
5
10
20.0-29.9y 30.0-39.9y 40.0-49.9y 50.0-59.9y 60.0-69.9y 70.0 y andup
4.8
7.9 8.5
7.8
5.7
3.3

Prevalence of obesity among adults 20 years and over by age
group and sex using WHO BMI Classification: Philippines,
2013
0
5
10
20.0-29.9y 30.0-39.9y 40.0-49.9y 50.0-59.9y 60.0-69.9y 70.0 y andup
4.4
5.9 6.5
5.5
3.8
1.5
Males
5.2
0
5
10
20.0-29.9y 30.0-39.9y 40.0-49.9y 50.0-59.9y 60.0-69.9y 70.0 y andup
5.3
9.8 10.2 9.9
7.3
4.5
Females
8.3
BMI: > 30.0
FOOD AND NUTRITION RESEARCH INSTITUTE-
DEPARTMENT OF SCIENCE AND TECHNOLOGY

Prevalence and 95% CI of obesity among adults 20 years and
over by region, Philippines: 2013
4.3
7.3
5.3
7.4
8.7
6.0
7.0
6.8
4.0
5.2
4.8
7.5
10.1
7.1
7.5
4.1
4.4
6.8
0 5 10
PREVALENCE
FOOD AND NUTRITION RESEARCH INSTITUTE-
DEPARTMENT OF SCIENCE AND TECHNOLOGY
REGION LOWER
LIMIT
UPPER
LIMIT
PHILIPPINES 6.6 7.1
Ilocos Region 3.8 5.0
Cagayan Valley 3.4 4.9
CAR 6.5 8.5
Central Luzon 6.4 7.8
NCR 9.2 11.0
CALABARZON 6.9 8.2
MIMAROPA 3.8 5.8
Bicol 4.4 6.0
Western Visayas 3.4 4.7
Central Visayas 6.0 7.5
Eastern Visayas 6.0 8.0
Zamboanga Peninsula 5.1 6.9
Northern Mindanao 7.6 9.7
Davao Region 6.4 8.5
SOCCSKSARGEN 4.3 6.2
CARAGA 6.3 8.2
ARMM 3.2 5.3

Prevalence of android obesity based on high WC among
adults 20 years and over by sex and age group: Philippines,
2013
0
10
20
30
20.0-29.9y 30.0-39.9y 40.0-49.9y 50.0-59.9y 60.0-69.9y 70.0 y and up
2.2 3.3 4.7 5.5 4.5 3.6
Males
3.8
0
10
20
30
20.0-29.9y 30.0-39.9y 40.0-49.9y 50.0-59.9y 60.0-69.9y 70.0 y and up
10.5
22.4 25.5
32.0 29.9
26.4
Females
23.1
WC: > 102 cm
WC: > 88 cm
FOOD AND NUTRITION RESEARCH INSTITUTE-
DEPARTMENT OF SCIENCE AND TECHNOLOGY

Prevalence of android obesity based on high WHR among
adults 20 years and over by sex and age group: Philippines,
2013
Males
8.0
0
10
20
30
40
50
60
70
20.0-29.9y 30.0-39.9y 40.0-49.9y 50.0-59.9y 60.0-69.9y 70.0 y andup
3.0 6.0 9.3
12.7 13.7 13.2
WHR: > 1.0
0
10
20
30
40
50
60
70
20.0-29.9y 30.0-39.9y 40.0-49.9y 50.0-59.9y 60.0-69.9y 70.0 y andup
45.5
64.6 68.3 71.9 69.9 66.9
Females
63.2
WHR: > 0.85
FOOD AND NUTRITION RESEARCH INSTITUTE-
DEPARTMENT OF SCIENCE AND TECHNOLOGY

19.4
25.7
19.8
22.0
23.7
20.2
26.2
20.8
15.0
21.7
18.8
25.6
28.5
27.0
21.3
15.0
18.0
23.1
0 10 20 30
Prevalence of android obesity among adults 20 years and over
based on high WC by region: Philippines, 2013
1.2
2.8
2.5
3.9
4.5
3.0
2.4
2.9
1.7
3.0
2.1
4.5
6.9
4.8
3.0
2.1
2.6
3.8
0 10 20 30
REGION
Philippines
Ilocos Region
Cagayan Valley
CAR
Central Luzon
NCR
CALABARZON
MIMAROPA
Bicol
Western Visayas
Central Visayas
Eastern Visayas
Zamboanga Peninsula
Northern Mindanao
Davao Region
SOCCSKSARGEN
CARAGA
ARMM
PREVALENCE (Males)
FOOD AND NUTRITION RESEARCH INSTITUTE-
DEPARTMENT OF SCIENCE AND TECHNOLOGY
PREVALENCE (Females)
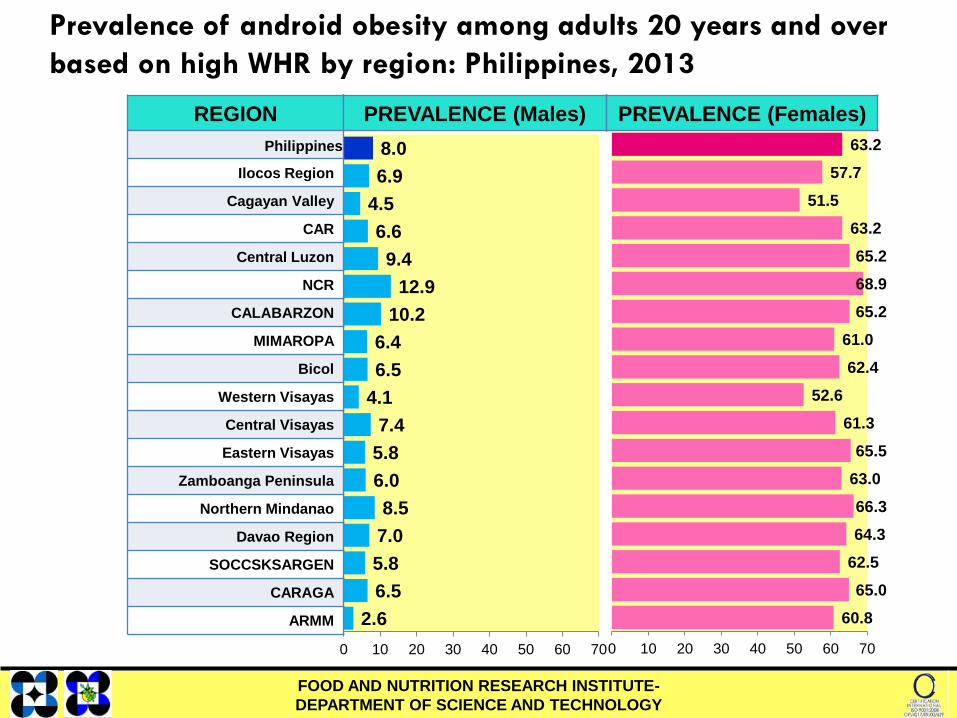
60.8
65.0
62.5
64.3
66.3
63.0
65.5
61.3
52.6
62.4
61.0
65.2
68.9
65.2
63.2
51.5
57.7
63.2
0 10 20 30 40 50 60 70
Prevalence of android obesity among adults 20 years and over
based on high WHR by region: Philippines, 2013
2.6
6.5
5.8
7.0
8.5
6.0
5.8
7.4
4.1
6.5
6.4
10.2
12.9
9.4
6.6
4.5
6.9
8.0
0 10 20 30 40 50 60 70
FOOD AND NUTRITION RESEARCH INSTITUTE-
DEPARTMENT OF SCIENCE AND TECHNOLOGY
REGION
Philippines
Ilocos Region
Cagayan Valley
CAR
Central Luzon
NCR
CALABARZON
MIMAROPA
Bicol
Western Visayas
Central Visayas
Eastern Visayas
Zamboanga Peninsula
Northern Mindanao
Davao Region
SOCCSKSARGEN
CARAGA
ARMM
PREVALENCE (Males) PREVALENCE (Females)

Prevalence of hypertension* among adults 20 years and over
based on a single blood pressure measurement visit by age:
Philippines, 2013
JNC VII
0
5
10
15
20
25
30
35
40
45
20 -29 30- 39 40-49 50-59 60-69 ≥ 70
7.2
15.2
24.8
35.1
40.9 43.4
All
22.3
FOOD AND NUTRITION RESEARCH INSTITUTE-
DEPARTMENT OF SCIENCE AND TECHNOLOGY
*SBP ≥140 or DBP ≥ 90

Prevalence of hypertension* among adults 20 years and over
based on a single blood pressure measurement visit, by sex and
age group: Philippines, 2013
Females
19.9
0
10
20
30
40
20 -29 30- 39 40-49 50-59 60-69 ≥ 70
3.7
11.6
22.7
33.8
40.3 43.3
Males
25.1
0
10
20
30
40
20 -29 30- 39 40-49 50-59 60-69 ≥ 70
11.4
19.8
27.2
36.7
41.6 43.5
FOOD AND NUTRITION RESEARCH INSTITUTE-
DEPARTMENT OF SCIENCE AND TECHNOLOGY
Modified JNC VIII (2013)
*SBP ≥140 or DBP ≥ 90
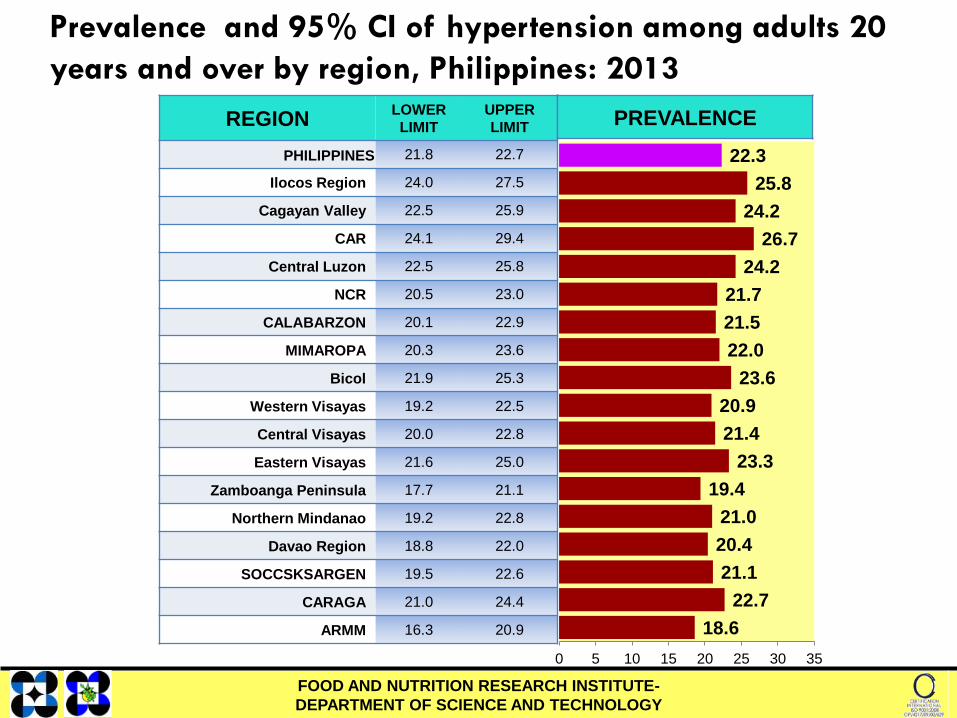
Prevalence and 95% CI of hypertension among adults 20
years and over by region, Philippines: 2013
18.6
22.7
21.1
20.4
21.0
19.4
23.3
21.4
20.9
23.6
22.0
21.5
21.7
24.2
26.7
24.2
25.8
22.3
0 5 10 15 20 25 30 35
REGION LOWER
LIMIT
UPPER
LIMIT
PHILIPPINES 21.8 22.7
Ilocos Region 24.0 27.5
Cagayan Valley 22.5 25.9
CAR 24.1 29.4
Central Luzon 22.5 25.8
NCR 20.5 23.0
CALABARZON 20.1 22.9
MIMAROPA 20.3 23.6
Bicol 21.9 25.3
Western Visayas 19.2 22.5
Central Visayas 20.0 22.8
Eastern Visayas 21.6 25.0
Zamboanga Peninsula 17.7 21.1
Northern Mindanao 19.2 22.8
Davao Region 18.8 22.0
SOCCSKSARGEN 19.5 22.6
CARAGA 21.0 24.4
ARMM 16.3 20.9
FOOD AND NUTRITION RESEARCH INSTITUTE-
DEPARTMENT OF SCIENCE AND TECHNOLOGY
PREVALENCE

0
5
10
15
20 -29 30- 39 40-49 50-59 60-69 ≥ 70
1.0
3.1
6.3
10.5
12.5
8.3
Prevalence of diabetes* among adults 20 years and over by
age: Philippines, 2013
* WHO and CPG criteria of high FBG >126 mg/dL
FOOD AND NUTRITION RESEARCH INSTITUTE-
DEPARTMENT OF SCIENCE AND TECHNOLOGY
All
5.4
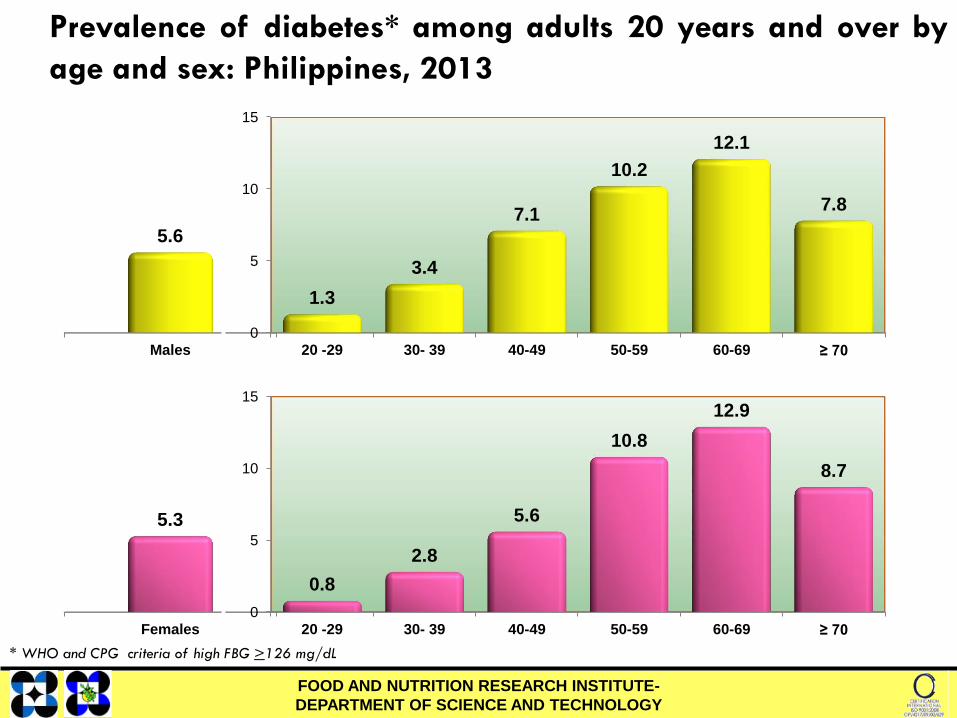
Females
5.3
0
5
10
15
20 -29 30- 39 40-49 50-59 60-69 ≥ 70
0.8
2.8
5.6
10.8
12.9
8.7
Males
5.6
0
5
10
15
20 -29 30- 39 40-49 50-59 60-69 ≥ 70
1.3
3.4
7.1
10.2
12.1
7.8
Prevalence of diabetes* among adults 20 years and over by
age and sex: Philippines, 2013
* WHO and CPG criteria of high FBG >126 mg/dL
FOOD AND NUTRITION RESEARCH INSTITUTE-
DEPARTMENT OF SCIENCE AND TECHNOLOGY

Prevalence and 95% CI of diabetes among adults 20 years
and over by region: Philippines, 2013
4.0
5.4
4.6
5.6
3.5
4.3
5.1
4.8
4.8
4.4
5.6
6.5
6.2
7.0
4.3
5.0
4.2
5.4
0 2 4 6 8 10
REGION LOWER
LIMIT
UPPER
LIMIT
PHILIPPINES 5.1 5.8
Ilocos Region 2.9 5.5
Cagayan Valley 3.8 6.1
CAR 3.0 5.6
Central Luzon 5.3 8.8
NCR 5.1 7.2
CALABARZON 5.4 7.7
MIMAROPA 3.5 7.6
Bicol 2.8 5.9
Western Visayas 3.8 5.8
Central Visayas 3.4 6.1
Eastern Visayas 3.8 6.5
Zamboanga Peninsula 2.5 6.0
Northern Mindanao 2.4 4.5
Davao Region 4.2 7.0
SOCCSKSARGEN 3.3 6.0
CARAGA 3.8 7.1
ARMM 2.0 6.1
FOOD AND NUTRITION RESEARCH INSTITUTE-
DEPARTMENT OF SCIENCE AND TECHNOLOGY
PREVALENCE

Prevalence of borderline to high total cholesterol level*
among adults 20 years and over by age: Philippines, 2013
All
46.9
0
10
20
30
40
50
60
70
20 -29 30- 39 40-49 50-59 60-69 ≥ 70
32.7
43.8
50.6
61.8 58.8
54.6
FOOD AND NUTRITION RESEARCH INSTITUTE-
DEPARTMENT OF SCIENCE AND TECHNOLOGY
*Adult Treatment Panel (ATP) III Cut-off, 2001: Borderline: 200-239 mg/dL; High > 240 mg/dL

Prevalence of borderline to high total cholesterol level* among
adults 20 years and over by sex and age group: Philippines, 2013
Females
51.4
0
10
20
30
40
50
60
70
80
20 -29 30- 39 40-49 50-59 60-69 ≥ 70
35.2 43.2
53.6
73.5 72.5
63.7
Males
41.5
0
10
20
30
40
50
60
70
80
20 -29 30- 39 40-49 50-59 60-69 ≥ 70
29.8
44.6 47.3 48.2 43.0 41.4
FOOD AND NUTRITION RESEARCH INSTITUTE-
DEPARTMENT OF SCIENCE AND TECHNOLOGY
*Adult Treatment Panel (ATP) III Cut-off, 2001: Borderline: 200-239 mg/dL; High > 240 mg/dL
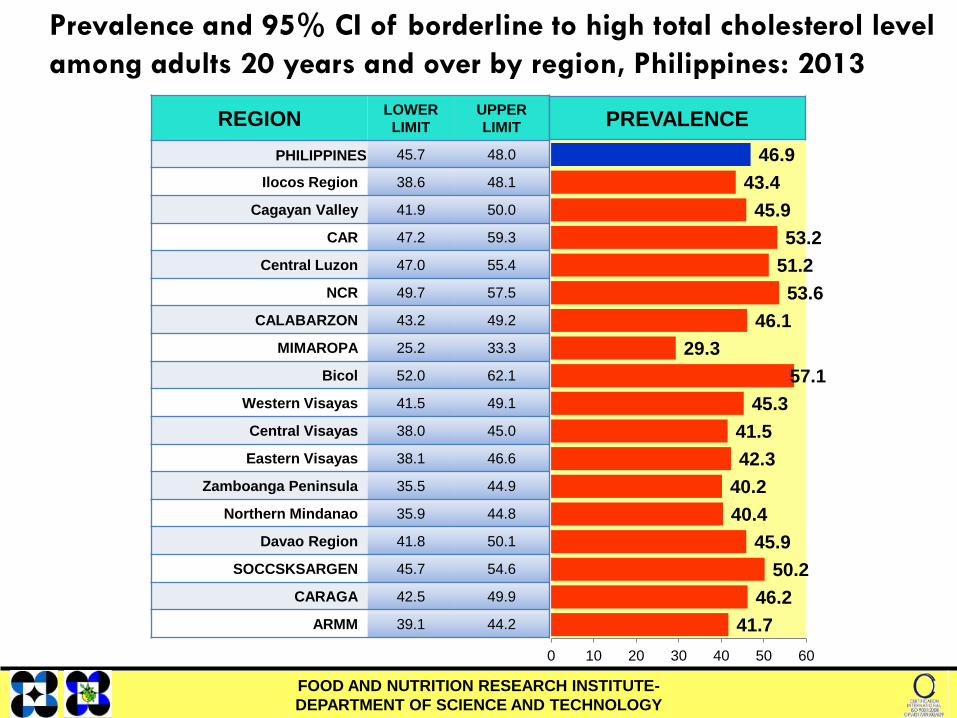
Prevalence and 95% CI of borderline to high total cholesterol level
among adults 20 years and over by region, Philippines: 2013
41.7
46.2
50.2
45.9
40.4
40.2
42.3
41.5
45.3
57.1
29.3
46.1
53.6
51.2
53.2
45.9
43.4
46.9
0 10 20 30 40 50 60
FOOD AND NUTRITION RESEARCH INSTITUTE-
DEPARTMENT OF SCIENCE AND TECHNOLOGY
REGION LOWER
LIMIT
UPPER
LIMIT
PHILIPPINES 45.7 48.0
Ilocos Region 38.6 48.1
Cagayan Valley 41.9 50.0
CAR 47.2 59.3
Central Luzon 47.0 55.4
NCR 49.7 57.5
CALABARZON 43.2 49.2
MIMAROPA 25.2 33.3
Bicol 52.0 62.1
Western Visayas 41.5 49.1
Central Visayas 38.0 45.0
Eastern Visayas 38.1 46.6
Zamboanga Peninsula 35.5 44.9
Northern Mindanao 35.9 44.8
Davao Region 41.8 50.1
SOCCSKSARGEN 45.7 54.6
CARAGA 42.5 49.9
ARMM 39.1 44.2
PREVALENCE

Prevalence of borderline to high LDL cholesterol level* among
adults 20 years and over by age: Philippines, 2013
All
47.2
FOOD AND NUTRITION RESEARCH INSTITUTE-
DEPARTMENT OF SCIENCE AND TECHNOLOGY
0
10
20
30
40
50
60
70
20 -29 30- 39 40-49 50-59 60-69 ≥ 70
32.4
44.1
51.5
61.9 59.8 57.5
*Adult Treatment Panel (ATP) III Cut-off, 2001: Borderline: 130-159 mg/dL; High > 160 mg/dL

Prevalence of borderline to high LDL cholesterol level* among
adults 20 years and over by sex and age group: Philippines,
2013
Females
53.6
0
10
20
30
40
50
60
70
80
20 -29 30- 39 40-49 50-59 60-69 ≥ 70
35.2
46.9
57.8
74.2 72.7 66.9
Males
40.0
0
10
20
30
40
50
60
70
80
20 -29 30- 39 40-49 50-59 60-69 ≥ 70
29.1
40.8 44.8 47.3 44.8 43.8
FOOD AND NUTRITION RESEARCH INSTITUTE-
DEPARTMENT OF SCIENCE AND TECHNOLOGY
*Adult Treatment Panel (ATP) III Cut-off, 2001: Borderline: 130-159 mg/dL; High > 160 mg/dL
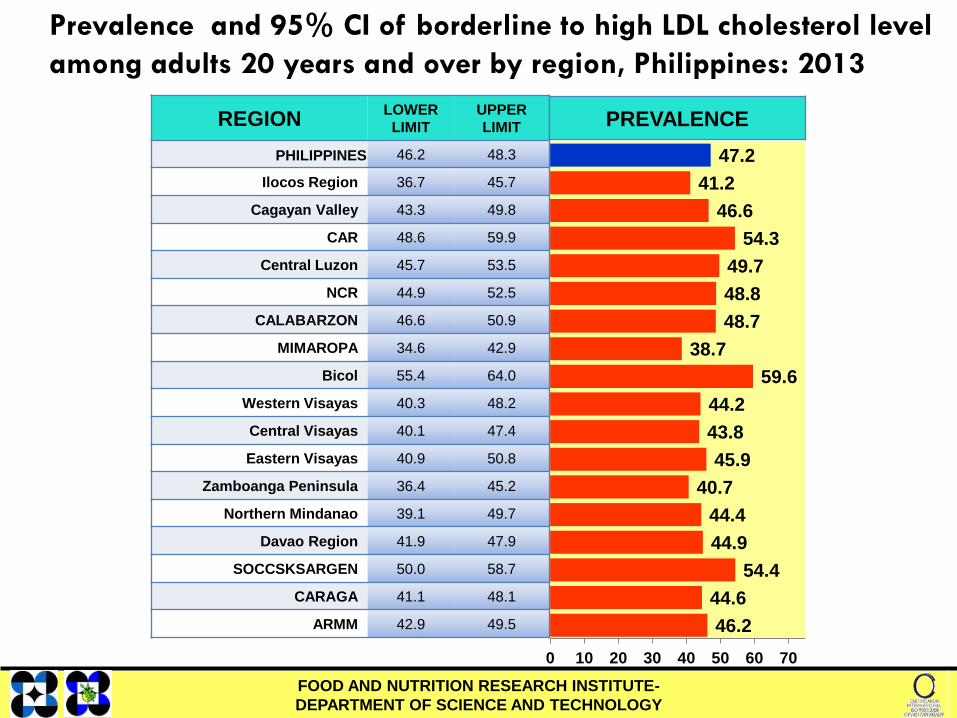
Prevalence and 95% CI of borderline to high LDL cholesterol level
among adults 20 years and over by region, Philippines: 2013
46.2
44.6
54.4
44.9
44.4
40.7
45.9
43.8
44.2
59.6
38.7
48.7
48.8
49.7
54.3
46.6
41.2
47.2
0 10 20 30 40 50 60 70
FOOD AND NUTRITION RESEARCH INSTITUTE-
DEPARTMENT OF SCIENCE AND TECHNOLOGY
REGION LOWER
LIMIT
UPPER
LIMIT
PHILIPPINES 46.2 48.3
Ilocos Region 36.7 45.7
Cagayan Valley 43.3 49.8
CAR 48.6 59.9
Central Luzon 45.7 53.5
NCR 44.9 52.5
CALABARZON 46.6 50.9
MIMAROPA 34.6 42.9
Bicol 55.4 64.0
Western Visayas 40.3 48.2
Central Visayas 40.1 47.4
Eastern Visayas 40.9 50.8
Zamboanga Peninsula 36.4 45.2
Northern Mindanao 39.1 49.7
Davao Region 41.9 47.9
SOCCSKSARGEN 50.0 58.7
CARAGA 41.1 48.1
ARMM 42.9 49.5
PREVALENCE

Prevalence of low HDL cholesterol level* among adults 20
years and over by age: Philippines, 2013
All
71.3
FOOD AND NUTRITION RESEARCH INSTITUTE-
DEPARTMENT OF SCIENCE AND TECHNOLOGY
0
10
20
30
40
50
60
70
80
20 -29 30- 39 40-49 50-59 60-69 ≥ 70
65.2 71.4 74.1 74.0 74.4 76.5
*Adult Treatment Panel (ATP) III Cut-off, 2001: Males: Low < 40 mg/dL; Females: Low <50 mg/dL
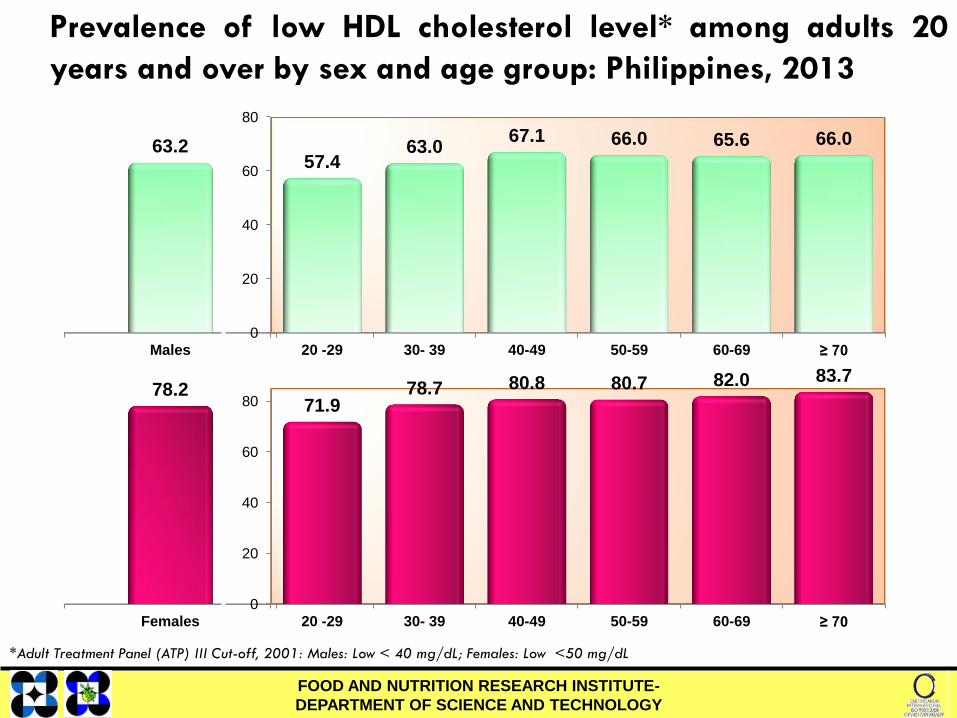
Prevalence of low HDL cholesterol level* among adults 20
years and over by sex and age group: Philippines, 2013
Females
78.2
0
20
40
60
80
20 -29 30- 39 40-49 50-59 60-69 ≥ 70
71.9 78.7 80.8 80.7 82.0 83.7
Males
63.2
0
20
40
60
80
20 -29 30- 39 40-49 50-59 60-69 ≥ 70
57.4 63.0
67.1 66.0 65.6 66.0
FOOD AND NUTRITION RESEARCH INSTITUTE-
DEPARTMENT OF SCIENCE AND TECHNOLOGY
*Adult Treatment Panel (ATP) III Cut-off, 2001: Males: Low < 40 mg/dL; Females: Low <50 mg/dL
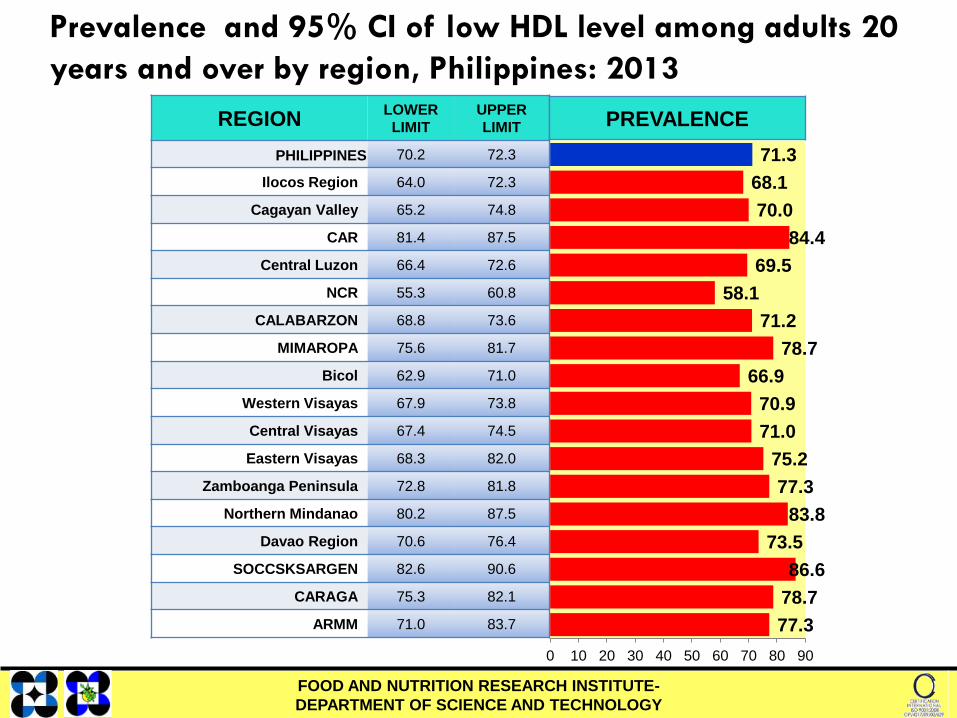
Prevalence and 95% CI of low HDL level among adults 20
years and over by region, Philippines: 2013
77.3
78.7
86.6
73.5
83.8
77.3
75.2
71.0
70.9
66.9
78.7
71.2
58.1
69.5
84.4
70.0
68.1
71.3
0 10 20 30 40 50 60 70 80 90
FOOD AND NUTRITION RESEARCH INSTITUTE-
DEPARTMENT OF SCIENCE AND TECHNOLOGY
REGION LOWER
LIMIT
UPPER
LIMIT
PHILIPPINES 70.2 72.3
Ilocos Region 64.0 72.3
Cagayan Valley 65.2 74.8
CAR 81.4 87.5
Central Luzon 66.4 72.6
NCR 55.3 60.8
CALABARZON 68.8 73.6
MIMAROPA 75.6 81.7
Bicol 62.9 71.0
Western Visayas 67.9 73.8
Central Visayas 67.4 74.5
Eastern Visayas 68.3 82.0
Zamboanga Peninsula 72.8 81.8
Northern Mindanao 80.2 87.5
Davao Region 70.6 76.4
SOCCSKSARGEN 82.6 90.6
CARAGA 75.3 82.1
ARMM 71.0 83.7
PREVALENCE
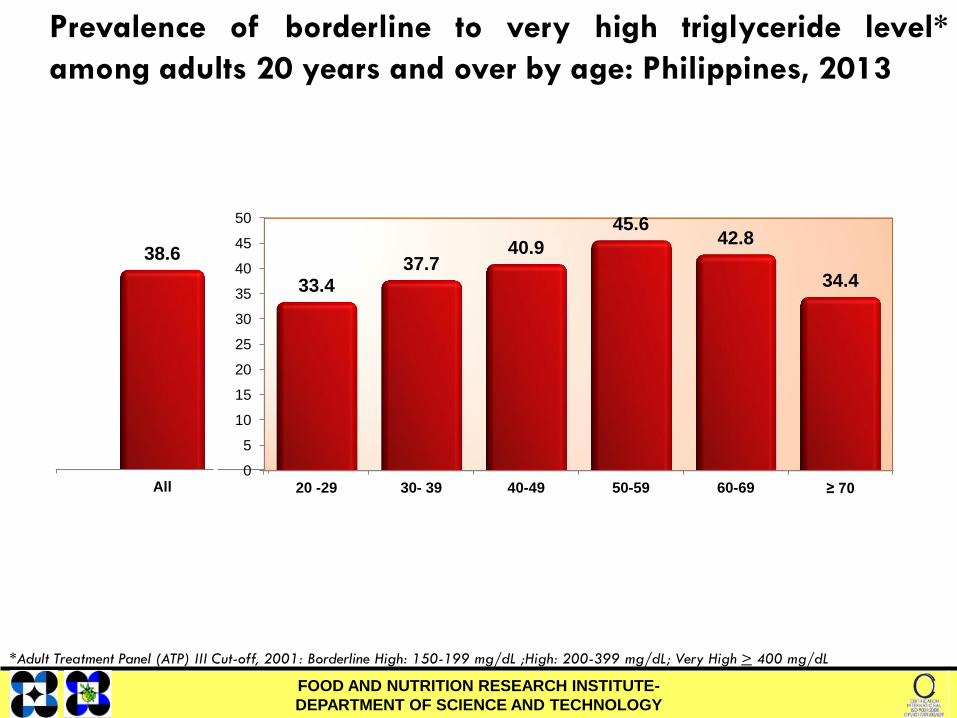
Prevalence of borderline to very high triglyceride level*
among adults 20 years and over by age: Philippines, 2013
All
38.6
FOOD AND NUTRITION RESEARCH INSTITUTE-
DEPARTMENT OF SCIENCE AND TECHNOLOGY
0
5
10
15
20
25
30
35
40
45
50
20 -29 30- 39 40-49 50-59 60-69 ≥ 70
33.4 37.7
40.9
45.6 42.8
34.4
*Adult Treatment Panel (ATP) III Cut-off, 2001: Borderline High: 150-199 mg/dL ;High: 200-399 mg/dL; Very High > 400 mg/dL
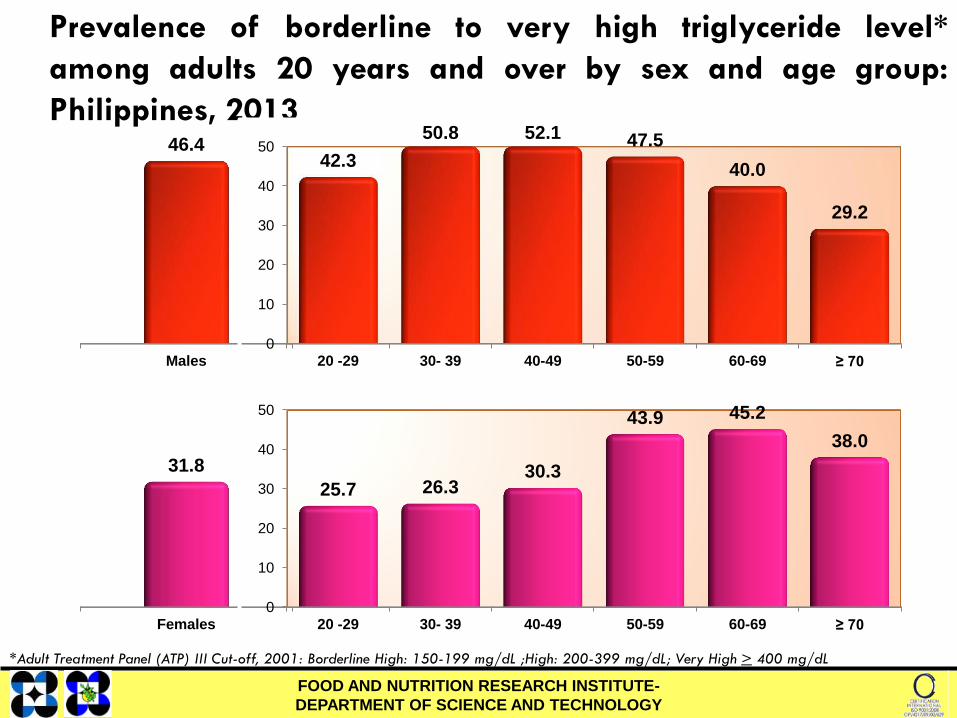
Prevalence of borderline to very high triglyceride level*
among adults 20 years and over by sex and age group:
Philippines, 2013
Females
31.8
0
10
20
30
40
50
20 -29 30- 39 40-49 50-59 60-69 ≥ 70
25.7 26.3 30.3
43.9 45.2
38.0
Males
46.4
0
10
20
30
40
50
20 -29 30- 39 40-49 50-59 60-69 ≥ 70
42.3
50.8 52.1 47.5
40.0
29.2
FOOD AND NUTRITION RESEARCH INSTITUTE-
DEPARTMENT OF SCIENCE AND TECHNOLOGY
*Adult Treatment Panel (ATP) III Cut-off, 2001: Borderline High: 150-199 mg/dL ;High: 200-399 mg/dL; Very High > 400 mg/dL

Prevalence and 95% CI of borderline to very high triglyceride
level among adults 20 years and over by region, Philippines:
2013
31.2
45.0
45.6
43.6
36.7
38.0
31.2
33.5
37.9
30.2
24.6
34.9
45.4
40.6
51.5
39.8
41.1
38.6
0 10 20 30 40 50
FOOD AND NUTRITION RESEARCH INSTITUTE-
DEPARTMENT OF SCIENCE AND TECHNOLOGY
REGION LOWER
LIMIT
UPPER
LIMIT
PHILIPPINES 37.6 39.7
Ilocos Region 37.8 44.4
Cagayan Valley 36.5 43.1
CAR 46.2 56.7
Central Luzon 37.1 44.0
NCR 42.3 48.4
CALABARZON 31.2 38.5
MIMAROPA 19.3 30.1
Bicol 27.0 33.5
Western Visayas 35.0 41.0
Central Visayas 30.8 36.4
Eastern Visayas 26.8 35.5
Zamboanga Peninsula 32.6 43.6
Northern Mindanao 32.5 40.9
Davao Region 40.3 46.9
SOCCSKSARGEN 42.5 48.6
CARAGA 41.8 48.2
ARMM 26.5 35.8
PREVALENCE

FNRI FOOD AND
NUTRITION
RESEARCH
INSTITUTE
DEPARTMENT
OF
SCIENCE AND
TECHNOLOGY
– those who smoked during the survey either on a
“daily” (at least one cigarette a day) or on a
regular/occasional basis; those who do not smoke daily
but who smoke at least weekly or those who smoke less
often than weekly.
OPERATIONAL
DEFINITION SMOKING
- those who have ever smoked in the past year prior to
survey whether on a daily basis or an aggregate lifetime
consumption of at least 100 cigarettes but not daily, and
are no longer smoking at the time of the survey
CURRENT SMOKERS
- those individuals who have never smoked at all
FORMER SMOKERS
NEVER SMOKERS
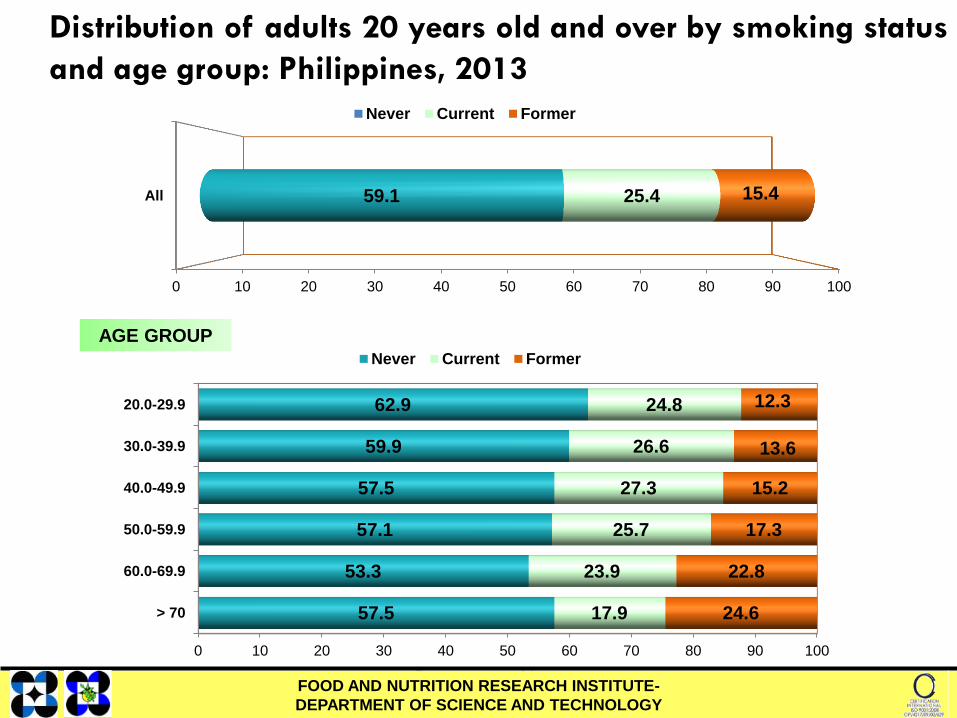
0 10 20 30 40 50 60 70 80 90 100
All 59.1 25.4 15.4
Never Current Former
0 10 20 30 40 50 60 70 80 90 100
20.0-29.9
30.0-39.9
40.0-49.9
50.0-59.9
60.0-69.9
> 70
62.9
59.9
57.5
57.1
53.3
57.5
24.8
26.6
27.3
25.7
23.9
17.9
12.3
13.6
15.2
17.3
22.8
24.6
Never Current Former
Percentage %
Distribution of adults 20 years old and over by smoking status
and age group: Philippines, 2013
AGE GROUP
FOOD AND NUTRITION RESEARCH INSTITUTE-
DEPARTMENT OF SCIENCE AND TECHNOLOGY

0 10 20 30 40 50 60 70 80 90 100
Males 34.0 44.7 21.3
Never Current Former
0 10 20 30 40 50 60 70 80 90 100
20.0-29.9
30.0-39.9
40.0-49.9
50.0-59.9
60.0-69.9
> 70
41.6
34.0
29.9
29.6
25.7
34.9
45.0
48.1
47.6
44.3
38.2
25.1
13.4
17.9
22.5
26.0
36.1
40.0
Never Current Former
Percentage %
Distribution of male adults 20 years old and over by smoking
status and age group: Philippines, 2013
AGE GROUP
FOOD AND NUTRITION RESEARCH INSTITUTE-
DEPARTMENT OF SCIENCE AND TECHNOLOGY

0 10 20 30 40 50 60 70 80 90 100
20.0-29.9
30.0-39.9
40.0-49.9
50.0-59.9
60.0-69.9
> 70
82.6
83.7
84.6
81.4
78.0
72.1
6.2
6.7
7.4
9.1
11.1
13.2
11.2
9.6
8.0
9.5
10.9
14.7
Never Current Former
Percentage%
0 10 20 30 40 50 60 70 80 90 100
Females 82.0 7.8 10.2
Never Current Former
Distribution of female adults 20 years old and over by
smoking status and age group: Philippines, 2013
AGE GROUP
FOOD AND NUTRITION RESEARCH INSTITUTE-
DEPARTMENT OF SCIENCE AND TECHNOLOGY

REGIONS LL UL
PHILIPPINES 24.5 26.3
NCR 20.4 26.1
Ilocos 24.5 28.5
Cagayan Valley 21.5 28.6
CAR 14.3 23.7
Central Luzon 28.1 34.1
CALABARZON 23.1 27.9
MIMAROPA 21.7 29.3
Bicol 23.2 28.6
Western Visayas 23.3 29.3
Central Visayas 16.9 22.1
Eastern Visayas 19.2 26.6
Zamboanga Peninsula 26.8 35.8
Northern Mindanao 20.9 26.0
Davao 20.1 26.3
SOCCSKSARGEN 24.3 32.1
ARMM 23.4 32.5
CARAGA 24.3 32.5
Prevalence and 95% CI of adult current smokers: Philippines,
2013
28.4
28.0
28.2
23.2
23.5
31.3
22.9
19.5
26.3
25.9
25.5
25.5
31.1
19.0
25.1
26.5
23.3
25.4
0 10 20 30
PREVALENCE
FOOD AND NUTRITION RESEARCH INSTITUTE-
DEPARTMENT OF SCIENCE AND TECHNOLOGY
FNRI FOOD AND
NUTRITION
RESEARCH
INSTITUTE
DEPARTMENT
OF
SCIENCE AND
TECHNOLOGY
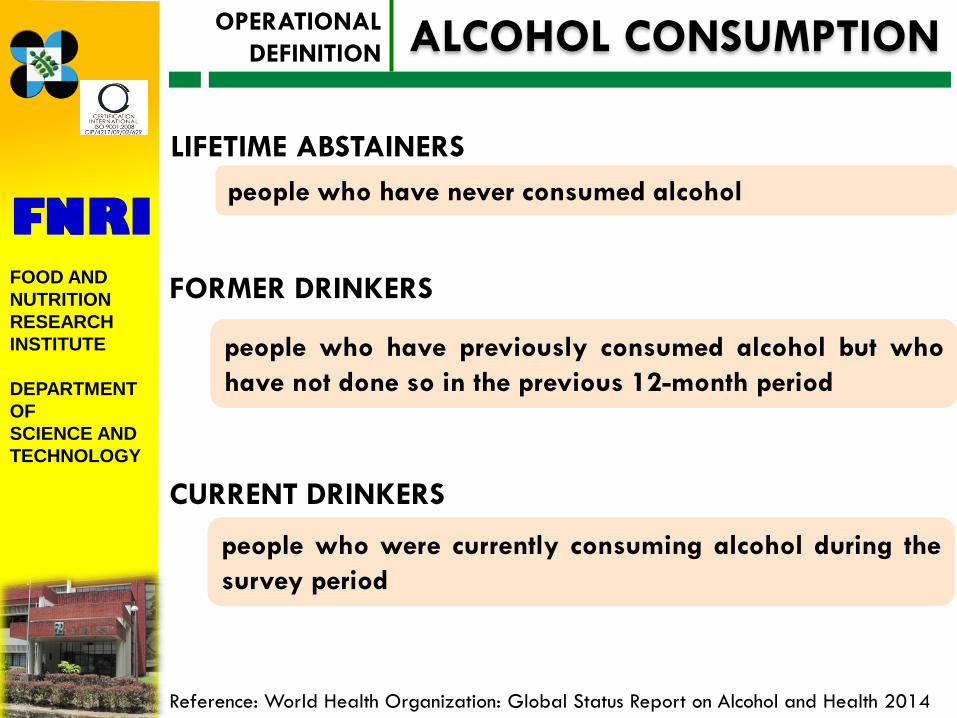
people who have never consumed alcohol
OPERATIONAL
DEFINITION ALCOHOL CONSUMPTION
people who have previously consumed alcohol but who
have not done so in the previous 12-month period
LIFETIME ABSTAINERS
people who were currently consuming alcohol during the
survey period
FORMER DRINKERS
CURRENT DRINKERS
Reference: World Health Organization: Global Status Report on Alcohol and Health 2014
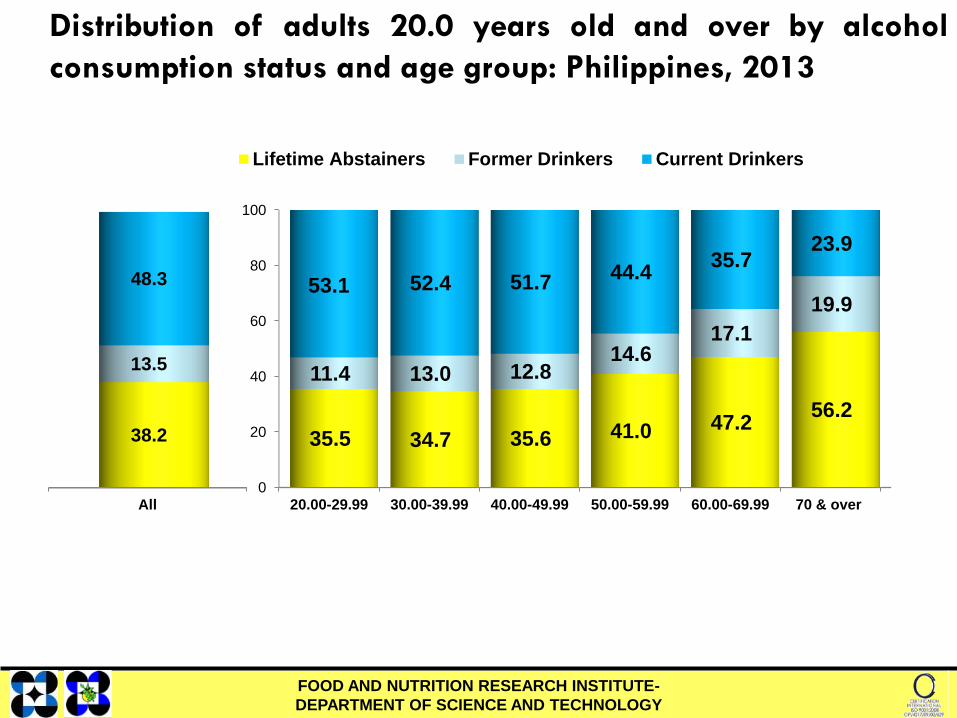
Distribution of adults 20.0 years old and over by alcohol
consumption status and age group: Philippines, 2013
All
38.2
13.5
48.3
0
20
40
60
80
100
20.00-29.99 30.00-39.99 40.00-49.99 50.00-59.99 60.00-69.99 70 & over
35.5 34.7 35.6 41.0 47.2 56.2
11.4 13.0 12.8 14.6
17.1
19.9 53.1 52.4 51.7
44.4 35.7
23.9
Lifetime Abstainers Former Drinkers Current Drinkers
FOOD AND NUTRITION RESEARCH INSTITUTE-
DEPARTMENT OF SCIENCE AND TECHNOLOGY
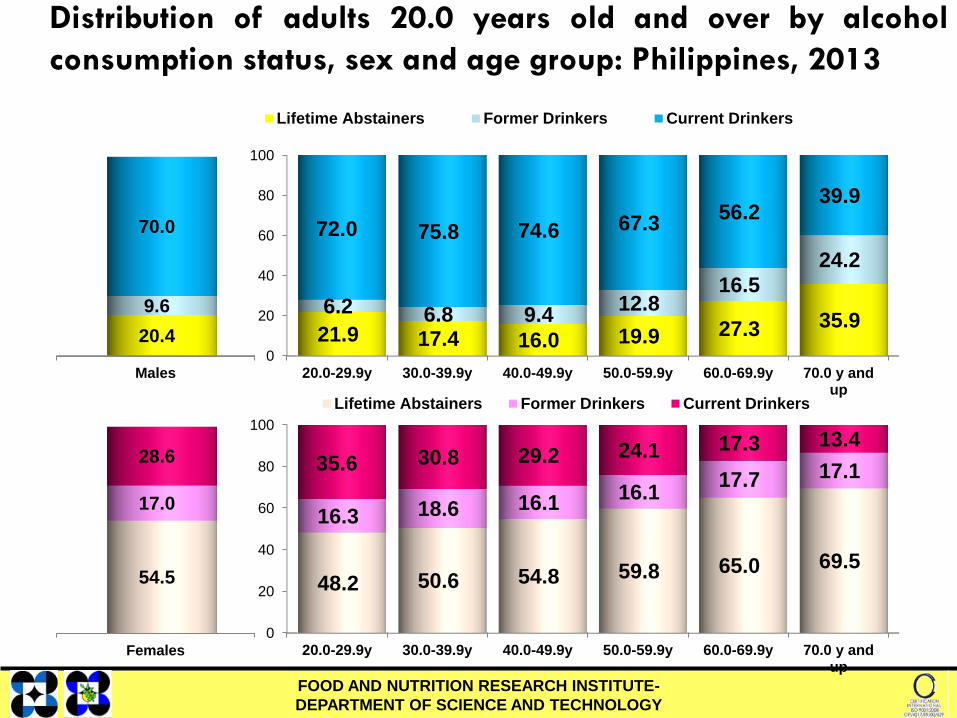
Distribution of adults 20.0 years old and over by alcohol
consumption status, sex and age group: Philippines, 2013
Females
54.5
17.0
28.6
FOOD AND NUTRITION RESEARCH INSTITUTE-
DEPARTMENT OF SCIENCE AND TECHNOLOGY
Males
20.4
9.6
70.0
0
20
40
60
80
100
20.0-29.9y 30.0-39.9y 40.0-49.9y 50.0-59.9y 60.0-69.9y 70.0 y andup
21.9 17.4 16.0 19.9 27.3 35.9 6.2 6.8 9.4
12.8 16.5
24.2
72.0 75.8 74.6 67.3 56.2
39.9
Lifetime Abstainers Former Drinkers Current Drinkers
0
20
40
60
80
100
20.0-29.9y 30.0-39.9y 40.0-49.9y 50.0-59.9y 60.0-69.9y 70.0 y andup
48.2 50.6 54.8 59.8 65.0 69.5
16.3 18.6 16.1 16.1
17.7 17.1 35.6 30.8 29.2 24.1 17.3 13.4
Lifetime Abstainers Former Drinkers Current Drinkers

REGIONS LL UL
PHILIPPINES 47.1 49.5
NCR 47.5 55.7
Ilocos 42.1 47.9
Cagayan Valley 41.2 49.5
CAR 42.0 53.3
Central Luzon 48.3 53.4
CALABARZON 50.1 55.3
MIMAROPA 47.5 56.1
Bicol 49.5 59.5
Western Visayas 39.2 46.1
Central Visayas 32.0 44.0
Eastern Visayas 64.0 74.6
Zamboanga Peninsula 40.4 52.1
Northern Mindanao 39.9 49.8
Davao 44.0 54.5
SOCCSKSARGEN 33.9 44.5
ARMM 11.3 23.7
CARAGA 47.3 58.3
Prevalence and 95% CI of adult current drinkers: Philippines,
2013
52.8
17.7
39.2
49.3
44.8
46.3
69.3
38.0
42.6
54.5
51.8
52.7
50.8
47.7
45.3
45.0
51.6
48.3
0 20 40 60
PREVALENCE
FOOD AND NUTRITION RESEARCH INSTITUTE-
DEPARTMENT OF SCIENCE AND TECHNOLOGY

FNRI FOOD AND
NUTRITION
RESEARCH
INSTITUTE
DEPARTMENT
OF
SCIENCE AND
TECHNOLOGY
drinking of 5 or more standard drinks in a row for men
OPERATIONAL
DEFINITION BINGE DRINKING
BINGE DRINKING
Reference: World Health Organization STEPS Surveillance
drinking of 4 or more standard drinks in a row for women

Proportion of binge drinkers, 20.0 years old and over by age:
Philippines, 2013
All
56.2
0
20
40
60
20.0-29.9y 30.0-39.9y 40.0-49.9y 50.0-59.9y 60.0-69.9y 70.0 y andup
62.9 56.9 55.6 50.5
47.4
29.6
FOOD AND NUTRITION RESEARCH INSTITUTE-
DEPARTMENT OF SCIENCE AND TECHNOLOGY

0
20
40
60
20.0-29.9y 30.0-39.9y 40.0-49.9y 50.0-59.9y 60.0-69.9y 70.0 y andup
66.0 63.0 60.1 55.9
51.0
35.1
Males
60.8
Females
37.8
0
20
40
60
20.0-29.9y 30.0-39.9y 40.0-49.9y 50.0-59.9y 60.0-69.9y 70.0 y andup
52.3
30.2 35.5
27.8 29.2
17.7
FOOD AND NUTRITION RESEARCH INSTITUTE-
DEPARTMENT OF SCIENCE AND TECHNOLOGY
Proportion of binge drinkers, 20.0 years old and over by sex
and age: Philippines, 2013

REGIONS LL UL
PHILIPPINES 54.4 58.0
NCR 46.6 57.6
Ilocos 61.9 71.9
Cagayan Valley 46.5 59.4
CAR 51.4 61.2
Central Luzon 54.4 67.2
CALABARZON 62.4 71.9
MIMAROPA 55.7 72.4
Bicol 66.3 79.7
Western Visayas 46.7 57.6
Central Visayas 40.9 52.4
Eastern Visayas 33.1 47.5
Zamboanga Peninsula 37.7 50.0
Northern Mindanao 43.4 55.7
Davao 39.4 51.5
SOCCSKSARGEN 48.6 67.1
ARMM 62.8 87.2
CARAGA 54.9 68.1
Proportion and 95% CI of adult current binge drinkers:
Philippines, 2013
PREVALENCE
61.5
75.0
57.8
45.4
49.6
43.8
40.3
46.7
52.2
73.0
64.0
67.1
60.8
56.3
53.0
66.9
52.1
56.2
0 20 40 60 80
FOOD AND NUTRITION RESEARCH INSTITUTE-
DEPARTMENT OF SCIENCE AND TECHNOLOGY

FNRI FOOD AND
NUTRITION
RESEARCH
INSTITUTE
DEPARTMENT
OF
SCIENCE AND
TECHNOLOGY
OPERATIONAL
DEFINITION PHYSICAL ACTIVITY
A person not meeting any of the following
criteria is considered being physically inactive
or insufficiently physically active and therefore
at risk of chronic disease:
- 3 or more days of vigorous-intensity activity
of at least 20 minutes per day; OR
- 5 or more days of moderate-intensity activity
or walking of at least 30 minutes per day
Insufficiently Physically Active
Reference: World Health Organization STEPS Surveillance
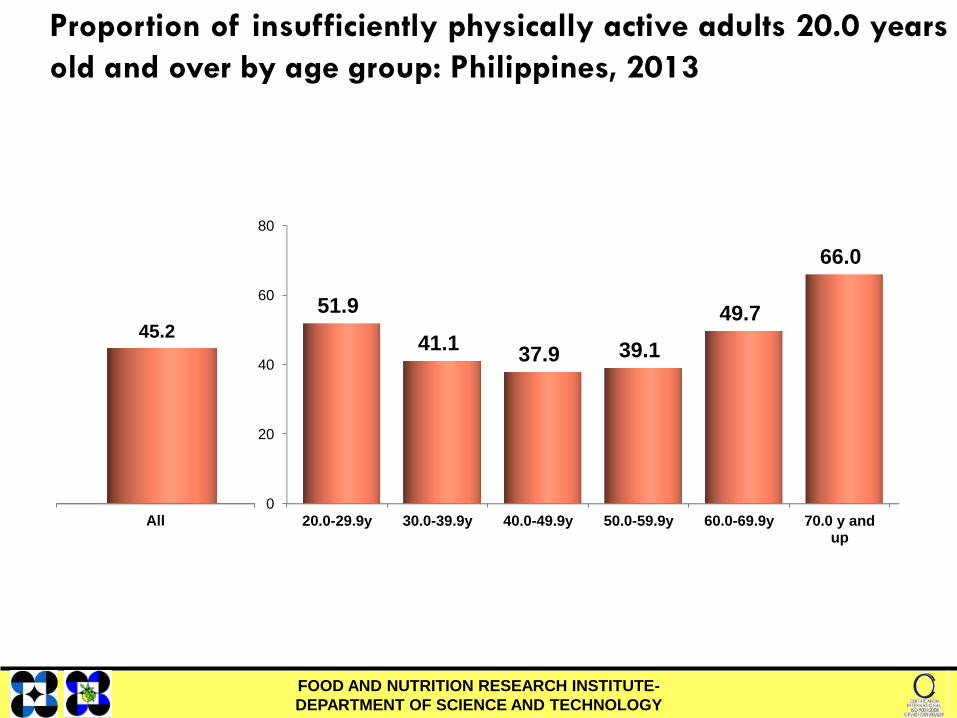
Proportion of insufficiently physically active adults 20.0 years
old and over by age group: Philippines, 2013
All
45.2
0
20
40
60
80
20.0-29.9y 30.0-39.9y 40.0-49.9y 50.0-59.9y 60.0-69.9y 70.0 y andup
51.9
41.1 37.9 39.1
49.7
66.0
FOOD AND NUTRITION RESEARCH INSTITUTE-
DEPARTMENT OF SCIENCE AND TECHNOLOGY

Proportion of insufficiently physically active adults 20.0 years
old and over, sex and age group: Philippines, 2013
Males
36.7
0
20
40
60
80
20.0-29.9y 30.0-39.9y 40.0-49.9y 50.0-59.9y 60.0-69.9y 70.0 y andup
42.5
32.4 30.4 32.0
42.7
58.0
Females
52.7
0
20
40
60
80
20.0-29.9y 30.0-39.9y 40.0-49.9y 50.0-59.9y 60.0-69.9y 70.0 y andup
60.4
49.1 45.2 45.3
56.0
71.2
FOOD AND NUTRITION RESEARCH INSTITUTE-
DEPARTMENT OF SCIENCE AND TECHNOLOGY
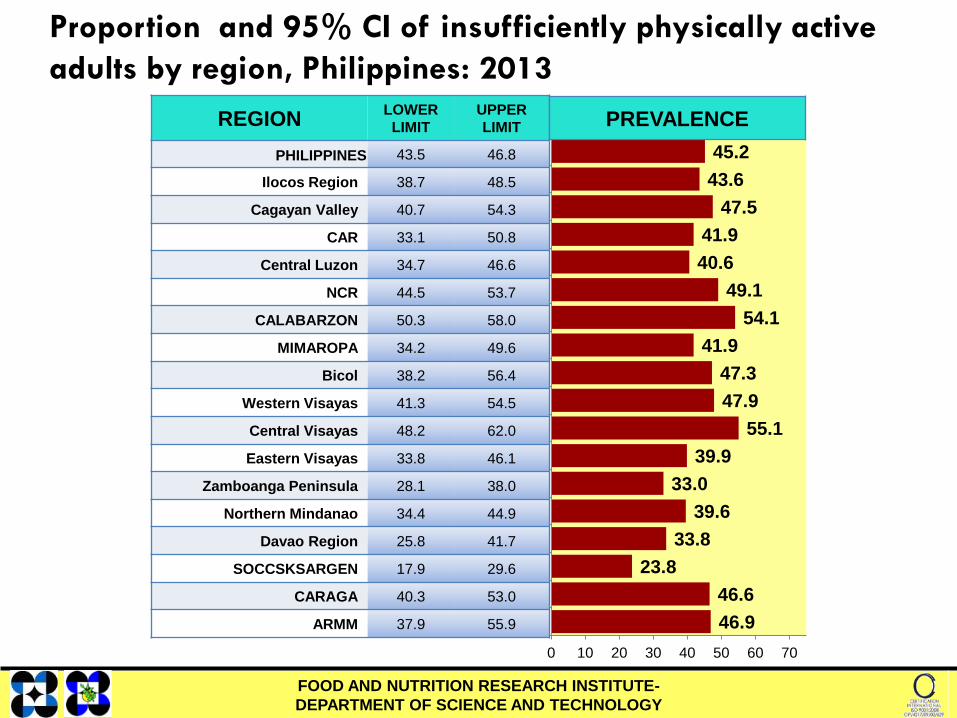
Proportion and 95% CI of insufficiently physically active
adults by region, Philippines: 2013
46.9
46.6
23.8
33.8
39.6
33.0
39.9
55.1
47.9
47.3
41.9
54.1
49.1
40.6
41.9
47.5
43.6
45.2
0 10 20 30 40 50 60 70
FOOD AND NUTRITION RESEARCH INSTITUTE-
DEPARTMENT OF SCIENCE AND TECHNOLOGY
REGION LOWER
LIMIT
UPPER
LIMIT
PHILIPPINES 43.5 46.8
Ilocos Region 38.7 48.5
Cagayan Valley 40.7 54.3
CAR 33.1 50.8
Central Luzon 34.7 46.6
NCR 44.5 53.7
CALABARZON 50.3 58.0
MIMAROPA 34.2 49.6
Bicol 38.2 56.4
Western Visayas 41.3 54.5
Central Visayas 48.2 62.0
Eastern Visayas 33.8 46.1
Zamboanga Peninsula 28.1 38.0
Northern Mindanao 34.4 44.9
Davao Region 25.8 41.7
SOCCSKSARGEN 17.9 29.6
CARAGA 40.3 53.0
ARMM 37.9 55.9
PREVALENCE
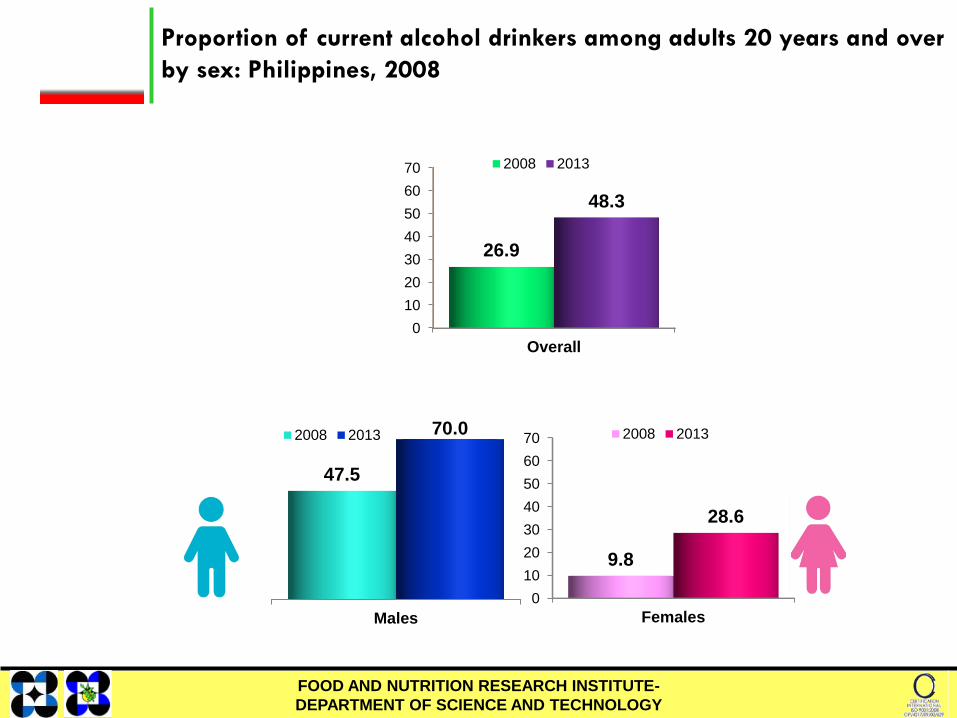
Proportion of current alcohol drinkers among adults 20 years and over
by sex: Philippines, 2008
0
10
20
30
40
50
60
70
Overall
26.9
48.3
2008 2013
FOOD AND NUTRITION RESEARCH INSTITUTE-
DEPARTMENT OF SCIENCE AND TECHNOLOGY
Males
47.5
70.0 2008 2013
0
10
20
30
40
50
60
70
Females
9.8
28.6
2008 2013