bureau of the census · summary for 1917. . ... cennial censuses of 1880 and 1890. the...
TRANSCRIPT

DEPARTMENT OF COMMERCE BUREAU OF THE CENSUS
SAM. L. ROGERS, DIRECTOR
CENSUS OF ELECTRICAL INDUSTRIES: 1917
TELEPHONES
WASHINGTON GOVERNMENT PRINTING OFFICE
1920
.1 I

(2)
CENSUS OF ELECTRICAL INDUSTRIES: 1917.
ELECTRIC RAIT.JWAYS.
ELECTRIC LIGHT AND POWER STATIONS.
TELEGRAPHS AND MUNICIPAL ELECTRIC FIRE-ALARM AND POLICE-PATROL SIGNALIN(l SYSTEMS ..
TELEPHONES.
I
J

CONTENTS.
CHAPTER I.-INTRODUCTION G I d Page.
enera escription of census of telephones .....................•.•.•.•.... ~ . . . . . . . . . . . . • . . • . . . . • . . . • • • • • • • . . . . • . . • • . . • . . . . . . . . . 7
i:~=:;1i~oi~~~~:.:.:.:: : ::.:: :.:. ~:.:. : :.:.:.:::::: ::::::::::. : : : :: : : : : : : : : : :: : : : : : : :~ : : : : : : : ::::::::::::::::::::: :: : : :::: :: :: : CHAPTER n.-DEVELOPMENT OF THE INDUSTRY.
Summary for 1917. . .....•................................................................................................... 10 Comparison with previous censuses ................................................. , ......•... " .....•.•..•. " . . • • . . . . • . . . . . 11 Telephone and telegraph systems. . . . . . . . . . . . . . . . . . . . . . . . . . . . . . . . .. . . . . . . . . . . . . . . . . . . . . . . . . . . . . . . . . . . . . . . . . . . . . . . . . . . . . . . . . . . . . 12 States and geographic divisions .............. , ......... ~ ..... , .. " ........... " ..... , .................... " ......... , ..... , . . . . 13
CHAPTER III.-EQUIPMENT AND TRAFFIC. Nature of equipment. . . . . . . . . . . . . . . . . . . . . . . . . . . . . . . . . . . . . . . . . . . . . . . . . . . . . . . . . . . . . . . . . . . . . . . . . . . . . . . . . . . . . . . . . . • . .. . . . . . . . . . . . . . 20 Miles of wire ......................................................................... _ ......... " .............. " ......... _ .,. 20 Number of telephones ..................... _ .... _ .................... _'" _ ................. _ ......... _ ........... _ •.... _....... 21 Rural telephones ..... _ ................... _ .................. _ ......................................................... _ . _ . . . . 22 Public and private branch exchanges. __ .. _ ....... _ ..... _ ............. _ ................................. _ ........ '" .... __ . . . . . 23 Messages or talks .......................................................................... _ ................. _ • __ . __ . . . . . . . . . . 24 Traffic and population ........ __ ..... _ . _ .. __ .. _ . _ .... __ .. __ ...... _ ... _ . ____ .. ____ . ___ . _ . ___ ................. __ •. _ .. ___ . _ . . . . . 29
CHAPTER IV.-COMPARISON OF BELL AND OTHER SYSTEMS.
Companies for which the statistics are compared ........................... _ ................ _ ........................ __ .... . . . . . 30 Telephones connected with the Bell Syst~m .............................. ___ .... __ .......... __________ . ____ . __ . _ ..... _ . . . . . . . . 32 Miles of wire ..... _ ..................................... _. _. _. ___ .. ___ . ______ . _. _. ____ ., _. __ ....... _ ......... __ .. , _ .. " ... _..... 32 Exchange and toll circuits ............ _. _. _ ...... _ .. __ .. _'" ___ . _ ............................ _ ........................ o........ 34 Messages or talks ............ , ........................................... ___ . _ .... " . _ .. _ .... __ ..... _ ........ " ... " ., .... . .. . . . 34 Public exchanges..... . . . . . . . . . . . . . . . . . . . . . . . . . . . . . . . . . . . . . . . . . . . . . . . . . . . . . . . . . . . . . . . . . . . . . . . . . . . . . . . . . . . . . . . . . . . . . . . . . . . . . . . . 36 Private-branch exchanges ........................... _ .................................................... ~ ......... a". ~........ 37
CHAPTER V.-FINANCIAL STATISTICS. Character of the statistics ................ " .................................... _ .... -...... ~ ..................... '" . .... .. .. .. . 39 Comparison with prior censuses ..................... _ ....... _ .......... __ . _. _. __ . __ ..... __ .... _ ........................ ~...... 39
~~:~:~:;:~!:!::~~t. ~~~~~~~~' ........ : ~ ~ ~ ~ ~ ~ ~ ~ ~ ~ ~ ~ ~ ~ ~ ~ ~ ~ ~ ~ ~ ~ ~ ~ ~ ~ ~ ~ ~ ~ ~ ~'~ ~ ~ ~ ~ ~ ~ ~ ~ ~ ~ ~ ~ ~ ~ ~ ~ ~ ~ ~ ~ ~ ~ ~ ~ ~ ~ ~ ~ ~ ~ ~ ~ ~ ~ ~ ~ ~ ~ ~ ~ ~ : ~ ~ ~ ~ ~ ~ ~ ~ ~ ~ ~ ~ ~ !~ Relation of traffic to income and expenses ..... __ .............................................................. a • •• • • • • • • • • • • • • • 43 -Balance sheet~ ................. _ ............. _ .................. _ ........ -.......... _......................................... 44 Incorporated and unincorporated companies .. _ ....... _ ..... _ . __ . _ .............. __ . _ . __ .... _ .. ___ . _ . . . . . . . . . . . . . . . . . . . . . . . . . . . . 44 Employees, salaries, and wages. .............................................................................................. 45
APPENDIX.
Schedule used in securing statistics for telephone systems having an income of $5,000 and over in 1917 .......•........... " .... 49 Schedule used in securing statistics for telephone systems whose income was less than $5,000 in 1917. . . . . . . . . . . . . . .. . . . ... . . . . . . . 50 Supplementary inquiry concerning weekly rates of pay of employees .......... _ ............. _ . . . . . . . . . . . . . . . . . . . . .. . . . . . . . . . . . . 50 Instructions to special agents................................................................................................. 51
, 00

, ,
I
SIR:
LETTER OF TRANSMITTAL.
D:mPARTMENT OF COMMEROE,
BUREAU OF THE CENSUS,
Washington, D.O., Septe:mber 10, 1919.
I transmit herewith the report on the census of telephones for 1917. This report is a part of that on Electrical Industries which in its entirety covers telegraphs, municipal eleotric fire-alarm and police-patrol signaling systems, electrio light and power stations and street and electric railways, and the report presented herewith.
This is the-third report on these industries that has been taken in conformity with the requirements of the act of Congress of June 7, 1906. The work of obtaining the data for the report was done by clerks detailed from the permanent force" of the bureau and by correspondence, and the statistics were secured during the year 1918 and relate in general to the year ending December 31, 1917 .
. The statistics were collected and the report prepared under the supervision of Eugene F. Hartley, chief statistician for manufactures. Acknowledgment is also made of the services of C. A. Freeman, who assisted in the preparation of the text and analytical tables.
Respectfully,
Hon. WILLIAM C. REDFIELD,
(4) Secretary of Oommerce.
SAM. L. ROGERS,
Director of the Oens'U8.

TELEPHONES
(5)

TELEPHONES.
CHAPTER I.-INTRODUCTION.
General description oj censU8 ojteleplwnes.-The census of telephones is taken every fifth year. Thus far four such enumerations have been made covering the years 1902, 1907, 1912, and 1917. Statistics of telephones were also gathered in connection with the decennial censuses of 1880 and 1890. The development· of the industry can thus be traced from its very beginning, though the statistics for the two earlier censuses are not fully comparable with those of recent censuses.
This report presents the detailed figures for ~ 917 and comparative statistics for the earlier years. Each census has covered the public telephone lines or systems operated during all or any part of the census year. Reports were not required, however, from certain private lines-e. g., those used exclusive~y by railroads for the dispatching and operating of trains; those connecting different branches or departments of manufacturing or mercantile establis4ments, hotels, mines, lumber camps, etc.; those operated by the ·Government, whether Federal, state, or municipal, exclusively for communication between different bureaus and offices, etc. The statistics for telephonic fire-alarm and police-patrol signaling systems are included in the report for these industries, and with that for telegraphs form parts of the census of electrical industries for 1917. Data regarding train dispatching by telephone and such statistics as were collected in regard to Government telephones are shown in the report on telegraphs.
The census of telephones is confined to continental United States. It does not, therefore, include Alaska, Hawaii, Porto Rico, the Philippine Islands, the Virgin Islands, or the Panama Canal Zone.
A distinctive feature of the telephone business in many parts of the country during the past two decades has been the construction of a large number of farmer or rural lines. Although these lines are practically always connected with an exchange, they frequently are not owned by the company operating the exchange. Usually each such line is jointly owned by the farmers who have their telephones connected with it. Experience has demonstrated that very little accurate information regarding these lines can be obtained, the only statistics published for them at the three preceding censuses being the number of such lines, the number of miles of wire which comprised them, and the number of telephones on them. Furthermore, it was found
equally difficult in 1902 and 1907 to obtain dependable information regarding the small telephone exchanges. Statistics obtained for these small systems in 1902 were so incomplete that, in 1907, all mutual or combined cOllmerCial and mutual telephone systems having an income of less than $1,000 and all small systems owned by individuals or firms and apparently operating for revenue but having an income of less than $500, were included with 'the independent farmer or rural lines.
The distinction between the systems having exchanges and the independent farmer or rural telephone lines, which had been unsatisfactorily maintained in 1902 and partially abandoned in 1907, was definitely discarded in 1912. Detailed statistics were required at the censuses of 1912 and 1917 only from companies having an annual gross income of $5,000 or more. Any company, line, or system having an alIDual income of less than that amount is now required to make only a very brief report.
The telephone business of the United States is peculiar in that a single organization, the American Telephone & Telegraph Co. which together with its constituent organizations is commonly known as the Bell Telephone System, controls a very large proportion of the telephone equipment of the country. This company collected the reports from its 145 subsidiary companies and compiled them into a consolidated report for the USe of the Bureau of the Census. This consolidated report furnished the totals for the United States, and separate figures for each state for the number of miles of wire, number of telephones, number of messages or talks, and number of public and privatebranch exchanges.
Most of the telephone companies that had incomes of $5,000 or more are well enough known so that their names and addresses can easily be ascertained. The smaller systems, however, and especially the farmer or rural lines, often have no definite names. It is rather difficult, in many cases, even to learn of the existence of such lines. In order to obtain as complete a list as possible of all telephone organizations for the census of 1917 every available souroe of information was utilized. The basis for the convass was the list of systems which reported in 1912. Postmasters in all except the larger cities were requested to secure a list of the names of all telephone lines in their vicinity and to forward this to the Census Bureau. Lists of com-
(7)
f"J"-' bI "~J9

ELECTRICAL INDUSTRIES: 1917.
panies and lines were also obtained from telephone associations and from directories. Reports of state burt3aus that collect information regarding telephone 'companies were utilized whenever such existed. Lists were prepared from all these various sources and schedules were then mailed to each name on the list. One of the questions on the schedule mailed called for the names and addresses of farmer or rural lines or systems in the vicinity. The answers to this inquiry added many new names of rural telephone lines to the census list. Offioe representatives were then assigned to distriots for the purpose of securing reports from all companies, systems, or lines named on the list which had not already made reports to the Bureau of the Census by mail. Eaoh agent was held responsible for a thorough oanvass of his district; he was instructed to make careful inquiry in each locality and to be constantly on thl3 alert to discover any existing systems or lines not named on the list, and if any such were found, to secure reports for them. I t is believed that exceedingly few, if any, companies, systems, or lines were overlooked.
Period covered~-The statistics for 1917 for all telephone companies are for the year ending December 31, or for the business year of each company most nearly oonforming thereto. In praotically every case, :as a matter of fact, the figures are for the calendar year, since the Interstate Commerce Commission and the various state commissions require that the reports annually submitted shall relate to the calendar year. There were a few cases in which the reports did not represent a full year's operation, but covered that part of the year 1917 during which the company was in operation. In 1912 the reports for the companies having annual incomes of $5,000 or more were for the year ending December 31, but those for systems or lines reporting annual inoomes of less than $5,000 were for the year ending December 1.
Statistics of the number of messages or talks, as well as those of income and expenses, are for the calendar vear. The number of telephones for the census of 1917 was reported both for Dece:r;nber 31, 1916, and for December 31, 1917; so that an average nvmber for the year 1917 could he obtained for use in calculating It per telephone " figures of traffic and financial results. The miles of pole line, miles of wire, etc., as well as the figures on the balance sheet, relate to the last day of the business year covered by the report of each company.
Unit of enumeration.-The terms "company," llline," and "system," are used to designate the unit for which a s~parate census report was secured. They are frequ«?ntly used as synonymous terms. They represent a statistical unit, the significance of which varies slightly to meet the requirements of the different methods of bookkeeping of the companies and the practice of the Bureau of the Census in the compila-
tion of the data. As a rule a distinct ownership marks the separation of the statistical units and all exchanges and lines operated under the same ownership are counted as one system. Where several lines are combined under one ownership or several properties have been brought under one management by purchase or stock control they are usually counted as one system. The associated companies comprising the Bell Telephone System and also other large companies which furnished separate reports were counted as separate units. The number of systems in the report, therefore, represents only the number of separate ownerships reporting without regard to the character of the ownership.
"Company" or" system" is generally applied to the larger units. The term "line" denotes a farmer or rural line which may consist of one or more lines of wire but which is under independent ownership. It, therefore, represents one of the small statistical units.
Each independent farmer or rural line, however small, was counted as a separate unit provided it was under independent ownership. Doubtless, in some instances a single report was made for a number of independent farmer lines that connected at a common exchange. It is believed, however, that the number. of such instances is small and that the 51,034 systems and lines reported as having annual incomes of less than $5,000 may be accepted as a very close approximation of the actual number. The apparent large increase in farmer and rural lines from the 30,317 reported in 1912 to the 51,034 reported in 1917 is not due so much to an actual increase in the number of lines as to the fact that the number was understated to some extent at the census of 1912.
Since the usage of the terms "systems" and "lines" is not always the same, the number is no indication of the magnitude of the interests, nor is it in any way a guide as to the number of exchanges. The processes of consolidation may have resulted in an actual'de .. crease in the number of companies but at the same time the number of exchanges, miles of wire, number of telephones, and amount of business transacted may have increased.
Limitations of the statistics.-Dats, for 1917 for all systems and lines, large and small combined, are confined to a comparatively small number of items. It was found impossible at previous censuses to secure accurate information concerning the s:rnaller lines and systems. In fact, at earlier censuses the only really accurate information obtained was confined to the miles of wire and the number of-telephones in use. At the present census in addition to these data, the number of systems operating switchboards, the number of messages or talks, the number of em.ployees, the total gross receipts, the amount of wages paid, and the amount of the total investment were secured for telephone lines and systems reporting annual incomes of

TELEPHONES. 9
less than $5,000. In some cases companies did not have books from which exact data regarding all the jtems on the schedule could be obtained and it was necessary to secure estimates.
At the censuses of 1902 and 1907 the financial statistics, employees, wages, etc., were shown for the separate states. This presentation required estimates for the segregation of the state figures for companies that operated in different states. The extent of these estimates was not so great for 1902 as it was for 1907. By 1912, however, such a large proportion of the companies and systems operated in more than one state that it was decided to abandon the state presentation, except for the miles of wire, the number of telephones and exchanges, and the estimated number of messages or talks. The number of messages includes local or exchange and long-distance or toll messages, and these
latter are necessarily credited to the state in which the exchange through which the original call was made is located.
The uniform system of accounts provided for telephone companies by the Interstate Commerce Commission, which has been in use since January 1, 1913, has aided the Bureau of the Census considerably in obtaining accurate and uniform statistics of the telephone business. This system of accounts, however, is compulsory only fO:r companies having an annual income of $10,000 or more. Consequently, many of the smaller companies as well as all of the larger systems which have no interstate business are not required by law to keep their records in a uniform manner. However, the statistics presented for 1917 are undoubtedly much more accurate than those for any previous census.

CHAPTER II.-DEVELOPMENT OF THE INDUSTRY. Summaryjo'!' 1917.-The first presentation of statis
tics in this report is a summary of the telephone industry as a whole for 1917. Data, which were collected only for those companies having an annual income of $5,000 or more, are shown separately in later tables of the report, as well as the data which were reported by ~he systems having an income of less than $5,000.
Table 1
Table 1 summarizes the more important statistics of the telephone industry for 1917 and distinguishes the data for the Bell Telephone System, which includes all lines operated by the American Telephone & Telegraph Co. and its associated companies; the systems and lines other than Bell, having an income of $5,000 or more; and those ~stems and lines having an income of less than $5,000.
All systems and lines.
ALL OTHER SYSTE~rs.
Bell Telephone System. Reporting an- Reporting an.
nualincomesof nualincomesof $5,000 or more. less than $5,000.
=~!~1i:::~~~~~:::::::::: :::::::::::::::::::::::::::::::::::::::::::::::::::::::: ::: :::::::: 1 ~:~~j:ru Estimated numl;>er of messages or talks ...................... : ................... , ............. , . . . . . . .. 21,845,722,335
145 2,055 51,034 23,133,718 4,164,308 IJ .529,162 7,326,858 2,626,852 1;762,810
14,597,567,869
:!~:f~::7u:·:n~LLLELEE.++·:··~:~·::::·:LLH:. "'5,~~ii Revenue, operating and nonoperating 3 ••••••••••••••••••••••••.•••••••.••••••.••••••••••••••••••••• _ • • • $391,499,631
5,211,493,216 2,035,661,250 6,288 4~'~ . 28,881
198,700 18,139 69,457 15:782 6271
129,243 30,008 11;868 $144,914,867 $24,740,199 $6 015383 $311, 91R, 260 $18; 997; 831
Value of plant and equipment ............ _ ......... '" ......... , ... , ..................... , .... ,... ..... $1,492,329,015 $1,140,639,666 S60583,540
$295; 272,476 556,416,873
Per cent of total:
~u:~~r:~~~~t_~~_~~ ~.~:~:: :::::::::: ::::::::::::::::::::::::::::::::::::::::::::::::::::::::::::: 100.0 100.0 100.0 100.0 100.0 100.0 100.0 100.0 100.0
0.3 80.2
3.9 95.9 14.4 5.3
1~~~!I~;~i~g.;;;;H;;H;U/;;H>!H~!;UH;;;;;;U!: 62.5 22.4 15.0 66.8 23.9 9.3 29.7 28.4 41.9 75.7 17.4 6.9 82.5 14.1 3.4 79.7 15.5 4.8 76.4 19.8 3.8
1 Exclusive of 2,835 miles in Canada. 'Number of systems reporting exchanges, actual number of exchanges not reported.
3 Including assessments of mutual companies.
A.s previously explained, the statistics do not include data for telephone lines of steam or electric railways operated in connectic:m with the conduct of the roads, for private lines in hotels and manuia<?turing and other establishments, or for lines operated by Federal, state, or municipal offices. The inclusion of these figures, however, would make very little difference in the totals. Th~ census figures for the Bell System do not agree exactly with those contained in the annual report of the directors of the company, because the former include certain affiliated and con.;. trolled companies not included in the annual report.
The Bell Telephone System is the dominating factor in the industry, reporting more than four-fifths of the total mUes of wire and more than three-fifths of the total number of telephones. The Bell Telephone System reported more than 3 miles of wire to each telephone in 1917, while all other systems having annual incomes of $5,000 or more reported a little more than I! miles of wire per telephone, and the small systems ~nd lines (those having annual incomes of less than $5,000) reported less than one mile of wire to each telephone.
The total revenue as shown in this table involves a certain amount of duplication. A large proportion of
(10)
the lines having annual incomes of less than $5,000 do not own an exchange, but are connected with an independently owned exchange through which the messages originating on these lines are " switched." The t( switching charge" for payment to the organization owning the exchange is -the chief revenue of these independent farmer or rural lines, and it is, of course, also a part of the revenue of the larger system which owns the exchange. This involves a duplication within the group of systems and lines reporting annual incomes of less than $5,000 and also considerable duplication between this group and the Bell and large non-Bell systems.
The number of messages or talks per telephone per year was almost 2,000 for the Bell and larger nonBell systems, but less than 1,200 for the smaller lines and systems. The Bell System and the larger nonBell systems ordinarily make an actual count of the messages or talks at least as often as one day in each month; their estimates, therefore, may be considered to be quite accurate. For the smaHer lines or systems, no such basis for securing a careful estimate of the messages or talks lexists; nevertheless, it is belie'Ved that the estimated number, which was given in most cases by the manager or chief opera tor of each local

TELEPHONES .. 11 exchange, is sufficiently accurate for all practical purposes.
All of the companies, systems, or lines having incomes of less than $5,000, reported whether or not they operated publi~' exchanges. These small systems, however, except in a very few cases, did not rep~rt how many exchanges they operated. Consequently, the number of exchanges shown in the accompanying table is, to a slight degree, understated. It is believed, however, that this fact makes little difference in the significance of the figures shown.
Oomparison with previous censuses.-Table 2 presents statistics for number of systems and lines, miles of wire, and number of telephones for each census from 1902 to 1917 and for 1890 and 1880, and also shows separately statistics for the Bell System and all other systems for each census from 1902 to 1917.
Table 2 1iTum-Census ber of Miles Number
systems of of year. and wire.! telephones. lines.
All systems and lines •••••••••••••• 1917 53,234 28,827,188 11,716,520 1912 32,233 20,248]326 8,729,592 1907 22,971 12,999,364 6.118,578 1902 9,1~ 4,900,451 2]371,044
111890 240,412 233,678 21880 148 34,305 54,319
Bell Telephone System •••••••••••••••••• 1917 145 23,133,718 7,326,858 1912 176 15,133,186 5,087,027 1907 175 8,947,266 3,132,063
/ 1902 44 3,387,924 1,317,178
All other systems •••••••••••••••••••••••• 1917 53,089 5,693,470 4,389,662 1912 32,057 5,115,140 3,642,565 1907 22,796 4,052,098 2,986,515 1902" 9,092 1,512,527 1,053,866
1 Exclusive of2,835miles in Canada in 1917, 1,565 miles in 1912, ~d 5 miles in 1907. II Partial enumeration only; figures not strictly comparable WIth later censuses.
Almost two years elapsed after the issue of the original patent to Alexander Graham Bell on March 7, 1876, before the first public telephone exchange was opened for business at New Haven, Conn., on January 25, 1878. The first census of the industry (in 1880) covered a period of such unprecedented development that it was very difficult to secure accurate reports from the telephone organizations. Many, if not the most, of the 148 telephone systems reporting had begun their operations during the year and their reports to the Bureau of the Census were correspondingly fragmentary and incomplete. Very little interest was exhibited in the new industry at the beginning of the census year, but at the close it was obvious that the telephone was destined to be one of the great interests of the country.
The use of the telephone showed a rapid advance during the 10 years that elapsed between 1880 and 1890. The conditions of the industry in 1890, as well as the census methods employed at that time, however were such that the statistics are not strictly , .
comparable with those for subsequent censuses. During the first half of th~ term of th~ Bell p~tents,
a number of rival systems were brought Into eXIstence
by competitors, that of the American Speaking Telephone Co., a subsidiary of the Western Union Telegraph Co., being the most formidable and extensive. Patent litigation between these rivals began in September 1878; but very soon thereafter an agreement between them was effected by which the Western Union conceded the priority of the Bell patents and turned over to the Bell System all its inventions, apparatus, and exchanges. In return for this the Bell Co. agreed to 'pay to the Western Union Co. 20 per cent of its income during the life of the contract, 17 years. This combination not only unified the commercial telephone systems of the country but it also harmonized and standardized the. apparatus; while this promoted industrial and scientific development, it resulted in almost completely discouraging competition, the telephone industry being a virtual monopoly for the succeeding decade and a half.
As the term of the fundamental Bell patents drew " to a close, competition again developed and independent exchanges were started in various parts of the country. At first these were started only in places which, under exclusive Bell regime, had not enjoyed the benefit of telephone service; and, although independent exchanges were established and in some cases still exist in a few of the larger cities, the" independent" movement, part~cularly fostered and pushed in the rural districts, still maintains its best patronage outside of the large urban centers.
The Bell Sys~em has not only reported a much greater wire mileage and number' of telephones. at each of the last four census periods than all the other systems combined, but its relative importance in these respects is becoming greater from census to census. The Bell System reported 62.5 per cent of the total number of telephones in the country in 1917, 58.3 per cent in 1912, 51.2 per cent in 1907, and 55.6 per cent in 1902. Ther~ were, in addition, 3,164,902 telephones in 1917, and 2,369,047 in 1912, not owned by the Bell System but which were connected with the Bell lines and exchanges for the interchange of local and long-distance service. Although these telephones were neither Bell-owned nor Bellcontrolled, they should be reckoned ,as a part of the Bell System when considering the scope of the service afforded by it. Thus, in 1917, 10,491,760 telephones, or 89.5 per cent of the total telephones in the country and, in 1912, 7,456,074 or 85.4 per cent of the total telephones, were connected with the Bell System. The number of telephones reported by the Bell System increased 456.3 per cent from 1902 to 1917, while the number reported by the other systems increased 316.5 per cent during this 15-year period.
The miles of wire reported by the Bell System constituted 80.2 per cent of the total for the entire country in 1917, 74.7 per cent in 1912, 68.8 per cent in 1907, and 69.1 per cent in 1902. The miles of wire
I II : I iEII
12 ELECTRICAL INDUSTRIES: 1917.
reported by the Bell System increased 58~.8 per cent from 1902 to 1917, while the wire mileage reported by the non-Bell telephone systems increased only 276.4 per cent during the 15-year period.
A. comparison of the increase of the Bell System with those of the other telephone systems may easily be misleading. The Bell System has gro~ both by the building of new lines and installation of new equipment and also by the acquisition of lines and systems formerly independent of it. The normal growth of non-Bell systems, on the other hand, has been considerably counterbalanced by the change of
some companies from "independents" to subsidiaries or integral parts of the Bell System.
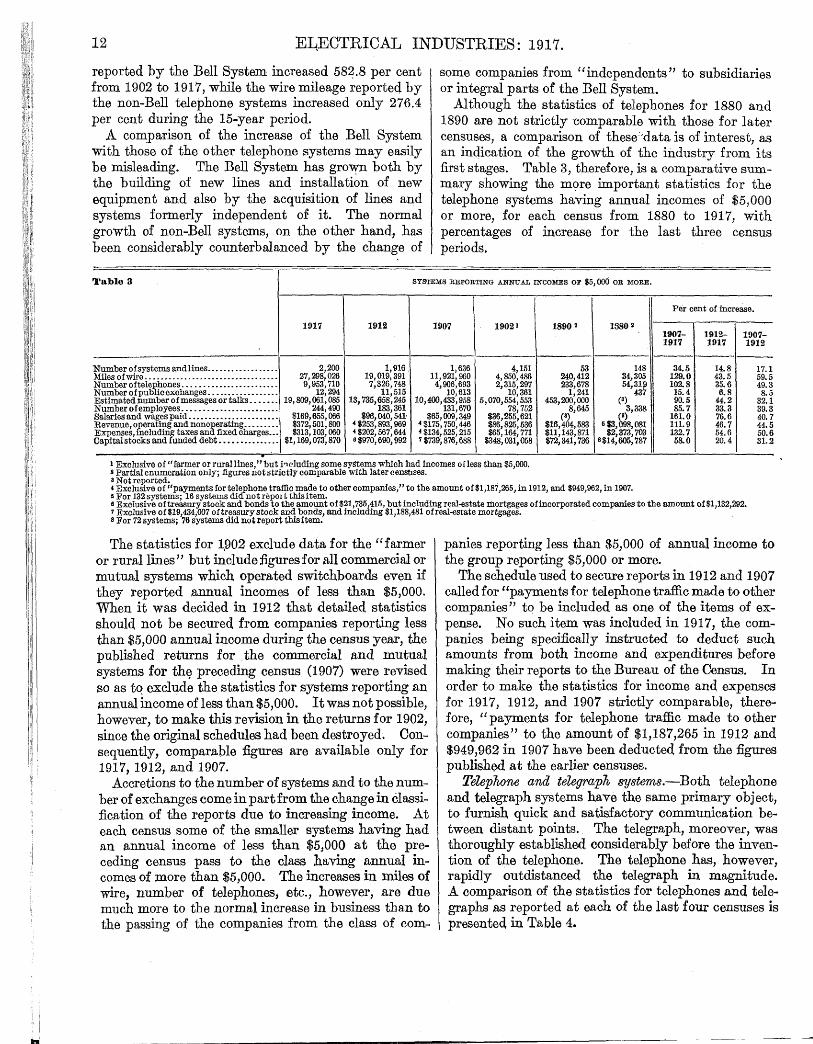
Although the statistics of telephones for 1880 and 1890 are not strictly 'comparable with those for later censuses, a comparison of these:'data is of interest, as an indication of the growth of the industry from its first stages. Table 3, therefore, is a comparative summary showing the m<?re important statistics for the telephone systems having annual incomes of $5,000 or more, for each census from 1880 to 1917, with percentages of increase for the last three census periods.
Table 3 SYSTEMS REPORTING ANNUAL INCOMES OF S5,ooO OR MORE.
Per cent of increase.
1917 1912 1907 1902 1 1890 2 1380 2
1907- 1912- 1907-1917 1917 1912
Number of systems andlines .................. 2,200 1,916. 1,636 4,151 53 148 34.5 14.8 17.1 Miles of wire ...................•.....•........ 27,298,026 19,019,391 11,921,960 4,850,486 240,412 34,305 129.0 43.5 59.5 Number oftele~hones ........................ 9,953,710 7,326,748 4,905,693 2,315,297 233,678 54,31p 102.8 35.6 49.3
12,294 437 15.4 6.8 8.5 Number ofpuo icexchanges ...........•...... 11,515 10,613 10,361 1,241 Estimated number of messages or talks .•..•.. 19,809,061,085 13,735,658,245 10,400,433,958 5,070,554,553 453,200,000 (3) 90.5 44.2 32.1
244,490 183,361 131,670 85.7 33.3 39.3 Number of employees .......•.............•.. 78,71i2 8,645 3,338 Salaries and wages paid .............. " ....... $169,655,066 $96,040, 541, $65,009,349 $36,255,621 (8) (8) 161.0 76.6 40.7 Revenue, operating and nonogerating ......... $372,501, 800 !~~~,:~,:: 4 $175, 750,446 $86,825,536 $16,404, 583 5 $3.098, (]I81 111.9 46.7 44.5 Expenses, including taxes an fixed charges .•. $313, 103, 060 4 $134,525,215 132.7 54.6 50.6 Capital stocks and funded debt ••.•..•.• '" ... $1,169,073,870 6 $970: 690: 992 1 $739, 876, 688
$65,164,771 $348,031,058
$11,143, 871 $72,341,736
$2,373,703 8$14,605,787 58.0 20.4 31.2
II
1 Exclusive of "farmer or rurallines," but i"cluding some sys'tems which had incomes ofless than $5,000. l! Partial enumeration only; figures not strictly comparable with later censuses. 3 Not reported. 4 Exclusive of "payments for telephone traffic made to other companies," to the amount of$l,187,265 J in 1912, and $949,962, in 1907. 6 For 132 systems; 16 systems did notrepOl t this item. 6 Exclusive of treasury stock and bonds to the amount of$21, 735 ,415 J but including real-estate Iilortgages ofincorporated companies to the amount of $1,132,292. 7 Exclusive of 819,434,007 of treasury stock and bonds, and including $1,188,481 of real -estate mortgages. 8 For 72 systems; 76 systems did not report this item.
The statistics for ~902 exclude data for the" farmer or rural1ines" but include figures for all commercial or mutual systems which operated switchboards even if they reported annual incomes of less than $5,000. When it was decided in 1912 that detailed statistics should not be secured from companies reportjng less than $5,000 annual inoome during the census year, the published returns for . the commercial and mutual systems for thv preceding census (1907) were revised so as tq exclude the statistics for systems reporting an annual income of less than $5,000. It was not possible, however, to make this revision in the returns for 1902, since the original schedules had been destroyed. Consequently, comparable figures are available only for 1917, 1912, and 1907.
Accretions to the number of systems and to the number of exchanges come in part from the change in Classification of the reports due to increasing income. At each census some of the smaller systems having had an annual income of less than $5,000 at the preceding census pass to the class ha-ving annual incomes of more than $5,000. The increases in miles of wire, number of telephones, etc., however, are due much more to the normal increase in business than to the passing of the companies from the class of com-
panies reporting less than $5,000 of annual income to the group reporting $5,000 or more.
The schedule used to secure reports in 1912 and 1907 called for "payments for telepho~e traffic made to other companies" to be included as one of the items of expense. No such item was included in 1917, the companies being specifically instructed to deduct such amounts from both income and expenditures before making their reports to the Bureau of the Census. In order to make the statistics for income and expenses for 1917, 1912, and 1907 strictly comparable, therefore, "payments for telephone traffic made to other companies" to the amount of $1,187,265 in 1912 and $949,962 in 1907 have been deducted from the figures publish~d at the earlier censuses.
Telephone and telegroaph systems.-Both telephone and telegraph systems have the same primary object, to furnish quick and satisfactory communication between distant points. The telegraph, moreover, was thoroughly established considerably before the invention of the telephone. The telephone has, however, rapidly outdistanced the telegraph in magnitude. A comparison of the statistics for telephones and telegraphs as reported at each of the last four censuses is presented in Table 4.
------ ----

TELEPHONES. 13
Table 4 TELEPHONE AND TELEGRAPlI SYSTEMS.
Census Per cent of total. year. Total. TelephoL.es. 1 Telegraphs. 2
Tele- Tele-phones. graphs.
Number of systems and lines .................................................. 1917 53,261 53,234 27 99.9 0.1 1912 32,260 32,233 27 99.9 0.1 1907 22,997 22,971 26 99.9 0.1 1902 9,161 9,136 25 99.7 0.3
Miles of single wire ........ _- .......................................................................... 1917 30,717,433 28,827,188 81,890,245 93.8 6.2 1912 22,062,522 20,248,326 81,814,196 91. 8 8.2 1907 14,577,325 12,999,364 1,577,961 89.2 10.8 1902 6,218,801 4,900,451 1,318,350 78.8 21.2
Ocean cable, nautical Iniles ..................................... " ............ , 1917 71,251 ................ - ........... I 71,251 .. ............... 100.0 1912 67,676 ................................ 67,676 .. .............. 100.0 1907 46,301 .............................. 46,301 .. ............... 100.0
Em~~:~~:~~ ~~~~~s. ~~ .":~~.~:., .......•...•.••..••.••..•.•••••••.••••••.•
1902 16,677 .. ............................ 16,677 ..- ............. ................ .. 1917 296,064 244,490 51,574 82.6 17.4 1912 220,656 183,361 37,295 83.1 16.9 1907 172,203 144,16G 28,034 83.7 16.3 1902 106,379 78,752 27,627 74.0 26.0
Salaries and wages ...................................................... ' 1917 $209,298,977 $169,655,066 $39,643,911 81.1 18.9 1912 $121,005,535 $96,040,541 $24,964,994 79.4 20.6 1907 $86, 087,376 $68,279,127 $17,808,249 79.3 20.7 1902 $51,295,294 $36,255,621 $15, 039, 673 70.7 29.3
Capital st9ck and funded debt, including real-estate mortgages of incorporated 1917 $1,398,161,656 $1,169,073,870 $229,087,786 83.6 16.4 companIes. 1912 $1,197,077,802 $970,690,992 $226,386,810 81.1 18.9
1907 $960,170,263 $739,876,688 $220,293,575 77.0 23.0 1902 $510,977,583 $348,031,058 $162,946,525 68.1 31.9
Revenue, operating and nonoperating ......................................... 1917 $482,205,228 $372, 501,800 $109,703,428 77.2 22.8 1912 $318,656,812 $253,893,969 $64,762,843 79.7 20.3 1907 $227,334,314 $175,750,446 $51,583, 868 773 22.7 1902 $127,755,574 $86,825,536 $40,930,038 68.0 32.0
Expenses, including taxes and fixed charges •.•••••.•••.•••••...•.••.•...... , 1917 $404,974,219 $313,103,060 $91,871,159 77.3 22.7 1912 $260,946,596 $202,567,644 $58,378,952 77.6 22.4 1907 $176,404,828 $134,525,215 $41,879,613 76.3 23.7 1902 $96,112,805 $65,164,771 $30,948,034 67.8 32.2
1 For number of systems and lines and for miles of wire all systems and lines are included; for the other items the figures for 1902 are exclusive of farmer lines and systems, and the figures for 1917,1912, and 1907 are exclusive oflines and systems having annualincomes ofless than $5,000.
2 Does not include wireless telegraph systems. 3 Exclusive 01344,110 miles of wire in 1917 and 314,329 Iniles in 1912 owned and operated by railway conipanies.
The census of 1880 showed telegraph companies to be operating 291,213 miles of wire, as compared with 34,305 miles for the telephone companies. Twenty-two years later the amount of wire operated by telegraph systems was more than four and one-half times as great, while the amount operated by telephone systems was more than one hundred and forty times as great. The amount of telephone wire has increased from 7,000,000 to 8,000,000 miles for each fiveyear period since 1902, a total increase for the fifteen years, 1902-1917, of 488.3 per cent. The total increase in the amount of telegraph wire during this fifteen-year period was only 571,895 miles, or 43.4 per cent.
States and geographic divisions.-The extent of the telephone business in the different states is determined very largely by the tlensity of the population. Thus almost one-half of the telephones and more than one-half of the miles of wire are found in the Middle Atlantic and East North Central states. The extent of the i:q.dustry in the different geographic divisions and states is shown by Tables 5, 6, and 7. Of these, Table 5 shows the number of systems and lines for 1917, 1912, and 1907, giving separately those systems reporting annual incomes of $5,000 or more, arid those reporting incomes of less than $5,000, by geographic divisions and states.

14 ELECTRICAL INDUSTRIES: 1917.
Table 5 NUMBER OF SYSTEMS AND LINES.
ReportIng DIVISION AND STATE. Total. Rereortingincomes incomes of of ess than $5,000. $5 ,000 or more.
1917 1912 1907 1917 1912 1907 1917 1912 1907
-UNITED STATES ••••• 53,234 32,233 22,971 2,200 1,916 1,636 51,034 30,317 21,335
GEOGRAPHIC nmSIONS: --._-._- - - - ----=
New England ..•...••. 384 377 366 54 49 47 330 328 319 Middle Atlantic ....•.• 2,809 2,319 1,572 233 201 172 2,576 2,118 1,400 East North CentraL .. 7 705 4,960 4,922 739 664 547 6,966 4,296 4,375 West North Central •.• 17:483 10,679 9,641 656 551 465 16,827 10,128 9,176 South Atlantic •..•.•.• 4,189 2,717 1,373 137 110 94 4,Oq2 2,607 1,279 East South Central. ••. 4,900 3,006 1,211 72 78 73 4,828 2,928 1,138 West South Central •.. 10,244 5,851 2,329 155 134 142 10,089 5,717 2,187 Mountain ....•••.•••.. 1,560 972 471 50 35 46 1,510 937 425 Pacific .•...•••.•••.••• 3,960 1,352 1,086 104 94 50 3,856 1,258 1,036 ------ - -
NEW ENGLAND: Maine ..•.•.•.•.••••••. 204 173 153 18 16 15 186 157 138 New Hampshire •••••.• 60 70 58 9 8 4 51 62 54 Vermont .•.••••••••••• 91 95 100 16 14 15 75 81 85 Massachusetts ..••••••. 19 30 38 6 5 8 13 25 30 Rhode Island ...••••••. 1 2 2 1 2 ••••• ...... ........ 2 Connecticut ••••••••••• 9 7 15 4 4 5 5 3 10
MIDDLE ATLANTIC: New York ..••••••••••• 1,091 879 942 111 101 111 980 778 831 New Jersey ••••••••.•.. 104 104 33 13 14 13 91 90 20 Pennsylvania •• , • " .... 1,614 1,336 597 109 86 48 1,505 1,250 549
EAST NORTH CENTRAL: Ohio .•..••••••••••.••• 944 775 984 195 203 181 749 572 803 Indiana ..•.••••.•••..• 1,675 1,098 883 163 151 129 1,512 947 754 Illinois ..••••••••••••.• 2,637 1,256 1,817 198 165 145 2,439 1,091 1,672 Michigan •••.•..••••... 1,358 1,028 534 60 53 36 1,~~~ 975 . 498 Wisconsin •••••••••.•.• 1,091 803 704 123 92 56 711 648
WEST NORTH CENTRAL: Minnesota •••..•....••. 2,089 1,372 825 102 77 55 1,987 1,295 770
~~iirr::::::~:::::: : 5,223 3,444 3,445 152 146 129 5,071 3,298 3,31"6 4,746 2,301 2,ggg 113 89 71 4,~g~ 2,~~~ 2,577
North Dakota •••••.••• 746 372 41 29 21 238 South Dakota ••••••••• 661 467 330 41 31 24 620 436 306 Nebraska •.••••.••• ; ••• 1,402 876 891 81 79 79 1,321 797 812 Kansas •••••••••••••••• 2,616 1,847 1,243 126 100 86 2,490 1,747 1,157
Telephone systems reporting annual income.s of $5,000 or more numbered 2,200 in 1917; of these, 145 were different systems affiliated with the American Telephone and Telegraph Co. (the Bell System). The business conducted by many of these Bell companies extended over several states and was assigned in Table 5, however, to the state in which the main office was located.
Considerably more than half of the larger telephone systems (reporting annual incomes of $5,000 or more in 1917) are located in the Middle Wes t. The two groups of states which c~mprise this region (the East North Central and the West North Central states) reported 63.4 per cent of the total number of the larger systems. If the states were ranked according to the number of these large telephone systems reported, the first seven-Illinois, Ohio, Ind,iana, Iowa, Kansas, Wisconsin, and Missouri~would all be in the Middle West. In fact, these seven states alone reported 1,070 systems, or slightly less than one.hitlf (48.6 per cent) of the total for the entire United States.
I NUMBER OF SYSTEMS AND LINES.
-Reporting
ReEorting incomes DIVISION AND STATE. TotaI. incomes of $5,000 or more. of ess than $5,000.
1917 1912 1907 191'1 1912 1907 1917 1912 1907 - - ------
SOUTH ATLANTIC: Delaware •••••••••••••. 48 51 1 1 1 ••••• 47 50 1 Maryland •••••.•••••••. 169 153 25 1 4 8 168 149 17 Virginia ••••••••••••••. 683 337 290 26 19 17 657 318 273 West Virginia .••••• '" 383 298 195 10 13 18 373 285 177 North Carolina ..••••.. 1,039 625 400 30 22 12 1,009 603 388 South Carolina •••••••• 538 393 143 10 9 7 528 384 136
~fg:fJ:~:::::::::::::: : 1,207 776 224 38 25 24 1,169 751 200 122 84 95 21 17 8 101 67 87
EAST SOUTH CENTRAL: Kentucky ...••••••.••. 1,600 993 429 42 47 42 1,558 946 387 Tennessee ••••••••••••• 1,416 1,076 214 13 15 15 1,403 1,061 199 Alabama ..••••.•.•.•.. 945 484 297 12 8 8 933 476 289 Mississippi. ... _ .•• , ••. 939 453 271 5 8 8 934 445 263
WEST SOUTH CENTRAL: Arkansas ••••••••••••.. 1,965 1,042 547 24 19 31 1,941 1,023 516 Louisiana ... _ ••••..•••• 445 183 69 5 3 5 440 180 64 Oklahoma .••••...••..• 2,617 1,363 715 38 27 22 2,579 1,336 693 Texas •••••••••..•••••• 5,217 3,263 998 88 85 84 5,129 3,178 914
MOUNTAIN: Montana ••••••••.••••• 283 155 97 7 11 8 276 i~ 89 Idaho ..••.•••••••••••• 337 202 82 7 5 8 330 79
~Io~~~~::::::.:::::: : 172 125 64 3 ••••• ...... 169 125 64 503 320 104 6 5 1~ 497 315 97
NewMexico ••••••••••• 114 65 47 6 2 108 63 37 Arizona ..••••.•••••••• 49 35 37 5 2 i 44 33 31 Utah .•••••••.•••.••••• 62 45 19 7 ; 55 42 13 Nevada ...•••.•.••.•.• 40 25 21 9 :U 18 15
PACIFIC: Washington •••..•••••• 1,094 363 480 26 29 13 1,~ 334 467
g~g~.::::::::::::: 958 323 295 27 20 8 303 287 1,908 666 311 51 45 29 1,857 621 282
Systems and lines reporting annual incomes of less than $5,000 in 1917 are found in the largest numbers in the West North Central states, ahnost OI~e-third (33 per cent) of the total for the United States being reported for this region. Five of the New England states and Ohio were the only states which showed a decrease for the decade 1907-1917 in the number of smaller telephone lines and systems reported.
Table 6 shows the total miles of wire for 1917, 1912, 1907, and 1902, giving separately that for systems reporting annual incomes of $5,000 or more and for those reporting incomes of less than $5,000 for 1917, 1912, and 1907. Table 7 presents statistics for number of telephones similar to those presented in Table 6 for wn-e mileage.
Tables 8 and 9 show the per cent of increase and the per cent distribution, respectively, based on the figures in Tables 6 and 7.

TELEPHONES. 15
Table 6 MILES OF WIRE.
DIVISION AND STATE. Total. Systems reporting annual incomes Systems reporting annual incomes of $5,000 or more. of less than $5,000.
1917 1912 1907 1902 1917 1912 1907 1917 1912 1907
UNITED STATES ....................... 28,827,188 20,248,326 12,999,364 4,900,451 27,298,026 19,019,391 11,921,960 1,529,162 1,228,935 1,077,404 GEOGRAP:Hrc DIVISIONS:
New England ........................... 2,383,580 1,545,252 997,865 408,337 2,365,292 1,523,273 973,915 18,288 21,979 23,950 Middle Atlantic ......................... 7,338,055 5,035,019 3,0.j6,193 1,261,8013 7,246,573 4,949,078 2,985,774 91,482 85,941 70,419 East North Central. ..................... 7,137,419 4,645,218 3,308,021 1,466,145 6,801,515 4,353,416 3,011,164 335,904 291,802 296,857 West North Central. .................... 3,934,372 2,932,578 2,043,383 588,290 3,450,826 2,530,833 1,661,769 483,546 401 745 378,614 South Atlantic .......................... 1,731>,286 1,121,458 875,173 328.022 1,608,351 1,016,144 790,932 126,935 105;314 84,241 East South Central ...... ' ............... 1,107,025 977,694 714,871 305:089 982,613 896,912 661,470 124,412 80782 53 401 West South Central. .................... 1,912,756 1,312,553 799,606 236,884 1,686,562 1,152,823 692,602 226,194 159;730 107;004 Mountain ............................... 725,512 558,450 364,605 88.846 68.3.950 525,976 342,413 41,562 32.474 22,192 Pacific •••.•..• : ......................... 2,553,183 2,120,104 839,647 216;995 2,472;344 2,070,936 798,921 80,839 49;168 40,726 NEW ENGLAND:
Maine ................................... 176,983 141,687 94,073 25,451 168,633 132,127 86,258 8,350 9,560 7,815 New Hampshire ......................... 110,691 ~,~~ 49,448 18,390 107,588 72,350 44 370 3,103 3,567 5,078 Vermont ................................ 67,355 36,419 16,379 61,510 48,387 29;275 5,~g 6,369 7,144 Massachusetts ........................... 1,353,251 863:426 534,220 257,461 1,352,395 861,107 531 834 2,319 2,~gg Rhode Island ............................ 161,075 102,906 71,346 } 90,656 { 161,075 102 906 70;943 ········ia4" ·· .. ····i64· Connecticut ............................. 514,225 306,560 212,359 514,091 306;396 211,235 1,124 MIDDLE ATLANTIC:
4,154,657 NewYork ............................... 2,790,060 1,630,076 623,625 4,118,929 2,758,352 1,597,855 35,728 31,708 32,221 New Jersey .............................. 1,002,075 644,984 338,608 136,617 999,262 642,190 335,721 2,813 2,794 2,887 Pennsylvania ........................... 2,181,323 1,599,975 1,087,509 501,601 2,128,382 1,548,536 1,052,198 52,941 51,439 35,311 EAST N ORTR CENTRAL:
Ohio .................................... 1,906,635 1,161,032 986,053 515,892 1,849,165 1,109,216 931,850 57,470 51,816 54,203 Indiana ................................. 933,261 667,839 530,044 213,157 857,579 602,740 454,636 ~,~~ 65,099 75,408 Illinois .................................. 2,564,910 1,689,074 986,949 428,301 2,478,371 1,608,428 890,838 80,646 96; 111 ~~~iii;:::: :::::::::::::::::::::::::: 1,072,651 728,184 494,612 197,863 1,025,710 689,671 467,527 46;941 38,513 27,085 659,962 399,089 310,363 110,929 590,690 343,361 266,313 69,272 55,728 44,050
WEST NORTII CENTRAL: Minnesota ............................... 1,058,989 653,479 387,758 137,274 985,128 597,883 343,168 73,861 55,596 44,590 Iowa .................................... 650,513 504,101 360,884 147,586 550,957 419,672 268,432 99,556 84,429 92,452 Missouri ....•.•.•.••....•...•...••....... 1,119,048 874,334 640,560 177,072 1,005,139 779,712 547,643 113,909 94,622 92,917 North Dakota. " . " ..................... 105,820 76,174 61 728 9,532 76,865 58,512 50,079 28,955 17,662 11,649 South Dakota ........................... 104,208 73,921 66; 946 10,877 78,184 51,164 50,556 25,024 22,757 16,380 Nebraska ................................ 448,807 393,319 257.812 53,285 398,685 349,646 211 464 50,122 43,673 46,348 Kansas .................................. 446,987 357,250 267;695 52,664 355,868 274,244 193~417 91,119 83,005 74,278
SOUTII ATLANTIC: Delaware ................................ 75,196 48,632 35,585 } { 74,483 48,037 35,575 713 595 10 Maryland ............................... 354,588 228,744 187,135 107,827 352,077 225,476 184,599 2,511 3k 268 2,536 District 0 fColumbia •••......•........... 162,032 126,279 89,562 162,032 126,279 89,562 ····-23;ii7" ··· .. i9;iis· "-'-'-iti;s7i Virginia ................................. 271,549 161,136 108,588 46,678 248,422 142,023 91,717 W~~hV6~~~~~· ..... : ..........•... : ...• : :'. '.:'.: '.:::'. 179,387 112,954 99,844 56,812 155,685 94,397 85 696 23,702 18,557 14,148 148,348 109,110 83,251 26,120 115,622 82537 59: 695 32,726 26,573 23,556 South CarOlina .......................... 97,916 73,712 50,226 19,445 85,952 62;781 39981 11,964 10,931 10,245 Georgia .................................. 314,273 206,591 187.904 54,301 288,273 185,737 177;322 26000 20,854 10,582 Florida .................... : ............. 131,997 54,300 33~078 16,839 125,805 48,877 26,785 6;192 5,423 6,293
EAST SOUTIl CENTRAL: Kentucky ............................... 386,107 352,544 262,691 155,482 348,946 324212 242 337 37,161 :~'~J 20,354 Tennessee ............................... 368,678 287,685 202,505 86,640 320,598 256;959 189;930 48,080 12,525 Alabama ................................ 205,585 152,849 134,337 32,966 185,089 140 123 125,129 21496 12;726 9,208 Mississippi. _ •• '" ....................... 145,655 184,616 1l?,338 30,001 127,980 175;618 104,024 17;675 8,998 11,314
WEST SOUTI[ CENTRAL: 141,014 98,932 24,273 119,765 80,939 2~,~~ 21'~~ 17,993 Arkansas ................................ 170,105 142 508
Louisiana ............................... 196,917 138,905 101,325 49,588 189;708 135,248 98,313 3,012 Oklahoma ............................... 334,533 211,175 104,780 21,498 281,753 17.0,055 81,798 52' 780 41;120 22,982 Texas ................................... 1,211,201 821,459 494,569 141,525 1,072,593 727,755 431,552 138;608 93,704 63,017 MOUNTAIN:
Montana ................................ 94,666 ~'~g~ 28,386 8,609 85 745 47,172 23,547 8,921 7,087 4,839 Idaho ................................... ~5'~g 37,364 6,366 74;011 52,394 33,977 7,734 5,811 3,387 1~·ta'h~: ::.' .. ::::: ...... : ..... ':. ': .. : ............. '::. 20' 368 11,743 } 13,106 { 1~'= 15634 8,750 ~,~~ 4,734 2,993 120;938 112;726 80 653 109;678 79,704 ~,g~ 949 Colorado ................................ 312,326 261,987 173;633 52,115 301;756 254 588 168,224 10;570 5,409 NewMexico ............................. 31 963 22,492 12,506 3,366 27,874 20:418 10,208 4,089 2:074 2,298 Arizona ................................. 39;455 18,621 10,277 3,890 38,299 17,193 9,008 l,~!g l,g 1,269 Nevada ................................. 13,984 9,792 10;043 1,394 13,039 8,899 8,995 1,048
PACIFIC; 487079 208,810 43,027 l?~,g~~ 26,304 i~'~~ 13,743 Washington ............................. 429,718 403,414 470,350 Oregon .................................. 275,191 272;481 87,723 29,531 251,523 257,718 23,668 13,077 California ................................ 1,848,274 1,360,544 643,114 144,487 1, 817,407 1,342,858 529;208 30,867 17;676 13,906

16 ELECTRICAL INDUSTRIES: 1917.
Ta.ble 7 NUMBER OJ!' TELEPHONES.
DIVISION AND STATE. Total. Systems reporting annual incomes of $5,000 or more.
1917 1912 1907 1902 1917 1912 1907
UNITED STATES •••....•.•••••••.••.•... 11,716,520 8,729,592 6,118,578 2,371,044 9,953,710 7,326,748 4,906,693 GEOGRAPIDC DIVISIONS:
IDdd~~t~~i~::::::::::::::::::::::::: : 878,354 625,488 410,269 166,167 856,658 600,207 384,413 2,444,205 1,782,145 1,252,903 483,054 2,332,774 1,675,681 1,167,667 East North Central. ..................... 3,158,989 2,378,257 ll,712,390 740,059 2,745,921 2,020,802 1,360,544 West North Central. . " ... '" .. , ........ 2,119,735 1,621,523 ll,251,555 399,855 1,500,091 1,109,359 767,050 South Atlantic 739,631 531,402 365,764 146,765 604,704 428,311 296,271 East South Centrai::::: ::: ::::: ::::::::: 436,853 337,292 243,234 112,851 309,636 261,294 197,291 West South Central. ..................... 740,004 543,102 342,255 114,939 504,929 387,022 239,746 Mountain ................................ 307,627 226,652 154,061 48,067 277,893 204,508 141,339 Pacific ....................•.............. 891,122 683,731 386,147 159,287 821~ 104 639,564 352,372 NEW ENGLAND:
Marne ................................... 88,226 68,914 53,134 14,070 78,111 57,988 43,846 New Hampshire .........•............... 52,534 40,017 28,920 9,949 49,536 g~,~g~ 24,345 Vermont ................................ 47,968 40 142 30,833 12,151 40,611 22,117 Massachusetts ............................ 475,231 329; 992 209,383 96,512 474,427 328;503 207,201 Rhode Island .................... '" . '" . 64,726 41 664 24,099 } 33,485 { 64,726 41,664 23,929 Connecticut .••.......•.••........•.•.•.. 149,669 104:759 63,900 149,247 104,502 62,975 MIDDLE ATLANTIC:
NewYork.: .........•...•••..•••••••••.. 1,335,055 970,449 685 512 347,340 1,283,802 923,136 637,881 New Jersey .•.................•..•..•.... 254,444 185,632 U6:988 48 980 251,519 182,419 114,528 Pennsylvania .•. " .....•...••.•...•••... , 854,706 626,064 450,403 186;734 797,453 570,126 415,258 EAST NORTH CENTRAL:
Ohio ..................••••••••.••..••••.. 845,649 631,206 495,636 224,083 ~~~,~~ 567,573 431,851 Indiana .................•....••.....•.... 458,992 354,550 289,452 136,561 274,291 202,492 Illinois .............•....•.•.......•.•.... 1,070,997 807,253 558,585 221,008 952;964 704,230 434,518
~i~~~~e:ill:::::::::::::::;::::::::::::::: : 434,128 335,074 209,842 95,415 380,200 288,154 179,263 349,223 250,174 158;875 62,992 271,707 186,554 112,420
WEST NORTH CENTRAL: Minnesota ..............•.••.•••.••••.... 408,222 272,359 171,479 63,192 325,977 208,340 125,884 Iowa ........................••........... 489,432 380,294 332,545 138,400 320,757 242,963 187,938 Missouri. ..... , ........•................. 511,246 404,150 312,527 103,155 365,463 285,472 192,943 North Dakota ...•...•..•................ 75,349 51,241 34,087 6,762 :~, g~~ 32,915 20,835 South Dakota ....• "'" ......•.......•.. 88,946 65,858 48,405 10,387 39 299 27,801 Nebraska ................................. 248,267 201 689 152,279 36,766 195;942 156:619 107,518 Kansas •••••••.•....••.•.. , •........•.... 298,273 245;932 200,233 41,193 186,102 143,751 104,131
SOUTH ATLANTIC: Delaware ........•...••.••............... 22,222 15,842 12,627 } { 21 626 15,210 12,586 Maryland ..............•................. 118,397 84,801 66,323 36,383 115;154 81,686 63 635 District of Columbia ...........•......... 70,751 46,603 31,332 70,751 46,603 31;332
~~~ribiia ~:::::::::::::::::::::::::: 119,597 76,652 55,541 25,762 93,704 56,968 38,963 99,530 80,251 62,144 22,801 66,021 55,033 46,709
North Carolina .•.•..•.....•............. 91,928 65 152 37,104 17,036 61,551 41,177 22,379 South Carolina ..•..•.•...•.•............ 43,716 33;239 20,911 10,753 31,835 24,871 15,393
~fgrl~:~:::::::::::::::::::::::::::::::: : 124,479 96,436 62,200 25,761 99,654 78,864 52,568 49,011 32,426 17,522 8,269 44,408 27,8,99 12,706
EAST SOUTH CENTRAL: Kentucky. '" '" " ..••.••...•...•....... 162,843 130,751 93,996 46,949 121,324 100,174 ~'R~~ Tennessee ..........•.•••••...••......... 140,669 104,353 71,130 36,392 96,357 78,717 Alabama ...........••••••.............•. 76,693 56,292 40,481 14,170 53,000 44,144 32;473 Mississippi ••.•......••.••••••........•... 56,648 45,896 37,627 15,340 38,955 38,259 29,091
WEST SOUTH CENTRAL: Arkansas .•......•.•.••••••..•••.•...•... 87,872 ~~,~g~ 49,576 16,928 ~~,g~~ 45,743 32,288 Louisiana ..••.•••..••..•••.........•..•. 63,890 35,692 17,543 43,906 33,448 Oklahoma ...•.........•...•........•.... 176,835 116:217 68 125 15,732 105:072 65,215 36,758 Texas ..•.•••.••.•• ~ •.•••..•.•.•.•....... 411,407 311,980 188;862 64,736 285,916 232,158 137,252
MOUNTAIN: 14.699 Montana .•••••••••••....•.............•. 51,409 35,537 17,168 5,451 45,067 31,188
Idaho ....•.••••..•..•.•.•.•.•.......•.•. 37,204 29,454 16,394 3,$86 30,126 23,475 13; 743 Wyoming .•••••.•.••.•............••.•.. !g, ~~i 9 946 6 699 } 7,258 { !~, g~j 7,471 5 331 Utah.: ...•....•..•......•........•.•..•. 34;064 30:435 32,018 29;825 Colorado .•.••••..•.....••.••......•.••.. 114:364 90,397 65,908 24,533 107:160 8S,g~~ 62,861 New Mexico ..•.••.•.....•.....•.•...••.. 15,314 10,346 6,653 2,510 13,124 5,496 Arizona ...•.•..•.•.•.•...•...•....•..•..• 18,225 11,224 6,203 3,264 17,394 10;128 5,285 Nevada .• : .•••.••.....•...•.....•.....•.. 8,716 5,684 4,601 1,165 8,311 5,295 4,099
PACIFIC: 162,754 86,439 Washington .•••••••••.•••.....•...•...•. t~'~gb 199'~ig ~g,~~g ~i'i~b 134,040
Oregon ......•...•. : ......•••..•...•.•••. 103,623 84,923 37,171 California .......•.••.•.•••.•......••...•. 577;055 434:002 237:672 106;650 554,727 420,601 228,762
I
Systems reporting annual incomes of less than $5,000.
1917 1912
1,762,810 1,2102,844
21,696 25,281 111,431 106,464 413,068 357,455 619,644 512,16-1 134,927 103,091 127,217 75,998 235,075 156,080 29,734 22,144 70,018 44,167
10,115 10,926 2,998 3,965
7'~g~ 8,644 1,489
········422· ········257"
51,253 47,313 2,925 3,213
57,:253, 55,938
71,527 68,633 92,064 80,259
118,033 103,023 53,928 46,920 77,516 63,620
82,245 64,019 168,675 137,331 145,783 118,678
iZ,~~g 18,326 26,559
52;325 45,070 112,171 102,181
596 632 3,243 3,115
····-25;893· ·····i9; 684' 33,509 25,218 30,377 23,975 11,887. 8,368 24,825 17,572 4,603 4,527
41,519 30,577 44,312 25,636 23,693 12,148 17,693 7,637
31,800 22,560 6,021 2,696
71,763 51,002 125,491 79,822
6,342 4,349 7,078 5,979 3,150 2,475 2,534 2,046 7,204 4,511
2,~~~ 1299 1:096
405 389
25,653 15,976 22,037 14,790 22,328 13,401
1907
1,211,885
25,856 85,236
351,846 484,505 69,493 45,943
102,509 12,722 33,775
9,288 4,575 8,716 2,182
170 925
47,631 2,460
35,145
63,785 86,960
124,067 30,579 46,455
45,595 144,607 119,584 13,252 20,604 44,761 96,102
41 2,688
.. ····i6;S78 15,435 14,725 5,518 9,692 4,816
18,626 10,773 8,008 8,536
17,288 2,244
31,367 51,610
2,469 2,651 1,~~g 3,047 1,15 7
2 918 50
12,40 12,45
7 8
8,91 °

4 I
TELEPHONES. 17
Table 8 ALL SYSTEMS AND LINES-PER CENT OF INCREASE 1 I:-r-
Miles of wire. Number of telephones.
DIVISION AND STATE. On systems report- On systems report- On systems report- On systems report-Total. inf annual incomes ing annual incomes Total. ing annual incomes ing annual incomes o $5,000 or more. oHess than $5,000. of $5,000 or more. ofless than $5,000.
19()7- 1912- 19()7- 1907- 1912- 1907- 1907- 1912- 1907- 1907- 1912- 1907- 1907- 1912- 1907- 1907- 1912- 1907-1917 1917 1912 1917 1917 1912 1917 1917 1912 1917 1917 1912 1911 1917 1912 1917 1917 1912 -----------------,--------------
UNITED STATES .••••.•...... 121. 8 42.4 55.8 129.0 43.5 59.5 41.9 24.4 14.1 91.5 34.2 42.7 103.1 36.0 49.3 45.5 25.6 15.8 '----- = --= --= =1= = = :---------GEOGRAPHIC DIVISIONS:
New England .••.•••••........ 138.9 54.2 54.8 142.9 55.3 56.4 -23.6 -16.8 -82 1141 40.4 52.4 122.8 427 56.1 -161 -14.2 -2.2 Middle Atlantic • ..••.••...... 140.1 45.7 64.7 142.7 46.4 65.8 299 6.4 220 95 1 37.1 42.2 998 39.2 43.5 307 4.7 24.9 East North CentraL •... '" ... 115.8 53.6 40.4 125.9 56.2 44.6 13.2 15.1 -1.7 84.5 328 38.9 101.8 35.9 485 17.4 15 6 1.6 West North Central •••••••. " . 92.5 34.2 43.5 107.3 36.4 52.0 27.7 20.4 6.1 69.4 307 . 29.6 95 6 352 446 27.9 21. 0 5.7 South Atlantic ....••.....•.... 983 54.7 28.1 1033 58.3 28.5 50.7 20.5 25.0 102.2 39.2 453 104.1 41. 2 44 6 942 30.9 48.3 East South Central. . "" .•... 54 8 13.2 36.8 48.5 9.6 35.6 133 0 54.0 51.3 79.6 29.5 38.7 56.9 18.5 32 4 1769 67.4 65.4 West South CentraL .....• " ... 139.2 45.7 64.2 143.5 46.3 66.4 111.4 41. 6 49.3 1162 36.2 58.7 110.6 30.5 61.4 1293 50.6 52.2 Mountain ..................... 99.0 29.9 53.2 I 99.7 30.0 53.6 87.3 28.0 46.3 9971 35.7 47.1 I 96.6 35 91 44 7 1337134.3 74.1 Pacific ........................ 204.1 20.4 1525 ,~ 19.4 159.2 98.5 64.4 20.7 130.8 ~ 77.1 133.0 ~~ 107.3 ~!... 30.8
NEW ENGLAND: Maine ......................... 88 1 24.9 50.6 95.5 27.6 53.2 6.8 -127 22.3 G6.0 28.0 29.7 78.1 34.7 32.2 8.9 -7.4 17.6 New Hampshire ....•.••.•. ' .•• 123.8 45.8 53.5 1425 48.7 631 -38.9 -130 -29.8 81. 6 31.3 384 103 5 37.4 48.1 -345 -24.4 -13.3 Vermont ...................... 84.9 23.0 50.4 110.1 27.1 65.3 -18.2 -8.2 -10.8 556 19.5 30.2 836 289 42.4 -15.6 -14.9 -0.8 Massachusetts ••• __ ........•.. 153 3 56.7 61.6 154.3 57.0 61.9 -64.1 -61.3 -2.8 127.0 44.0 57.6 129.0 44.4 58.5 -63.2 -46.0 -31.8 Rhode Island ...... " ......... 125.8 56.5 44.2 127.0 56.5 45.0 ::88: i' ::is: 3' ::85:4' 168.6 55.4 729 170.5 554 74.1 ::54:4' --64:2' ':':72:2 Connecticut ........ r •••••••• " 142.1 67.7 44.4 143.4 67.8 45.0 134.2 42.9 63.9 137.0 42.8 65.9
MIDDLE ATLANTIC: NewYork .................... 154.9 48.9 71.2 157.8 49.3 72.6 10.9 12.7 -1.6 94.8 37.6 41.6 101.3 39.1 44.7 7.6 8.3 -0.7 New Jersey ................... 195.9 55.4 90.5 197.6 55.6 91.3 -2.6 0.7 -3.2 117.5 37.1 58.7 119.6 37.9 59.3 18.9 -90 30.6 Pennsylvania ..••.•••.••.. ~ '" 100.6 36.3 47.1 102.3 37.4 47.2 49.9 2.9 45.7 89.8 36.5 39.0 92.0 39.9 37.3 62.9 2.4 59.2
EAST NORTIt CENTRAL: Ohio .......................... 93.4 64.2 17.7 98.4 66.7 19.0 6.0 10.9 -4.4 70.6 34.0 27.4 79.2 35.4 31.4 12.1 12.4 -0.2 Indiana ........................ 76.1 39.7 26.0 88.6 42.3 32.6 0.4 16.2· -13.7 586 29.4 22.5 81.2 33.8 35.' 5.9 14.7 -7.7 Illinois ........................ 159.9 51.8 71.1 178.2 54.1 80.6 -10.0 7.3 -16.1 98.8 32.7 44.5 119.3 35.3 621 -49 14.6 -17.0
~~~~~:::::::::::::::::::: 116.9 47.3 47.2 119.4 48.7 47.5 73.3 21.9 42.2 106.9 29.6 59.7 112.1 31.9 00.7 76.4 14.9 53.4 112.6 65.4 28.6 121.8 72.0 28.9 57.2 24.3 26.5 119.8 39.6 57.5 141. 7 45.6 65.'9 66.9 21.8 36.9
WEST NORTIt CENTRAL: Minnesota. ____ ............... 173.1 62.0 685 187.1 64.8 74.2 65.6 32.8 24.7 138.0 49.9 58.8 159.0 56.5 65.5 80.4 28.5 40.4 Iowa ..... _ .................... 80.2 29.0 39.7 105.2 31. 3 56.3 7.7 17.9 -8.7 47.2 28.7 14.4 70.7 32.0 293 16.6 22.8 -5.0 MissourL ..................... 74.7 28.0 36.5 83.5 28.9 42.4 22.6 20.4 l.8 63 6 26.5 29.3 89.4 28.0 48.0 21 9 22.8 -0.8 North Dakota ................ 71.4 38.9 23.4 53 5 31. 4 16.8 148.6 63.9 51. 6 121. 0 47.0 50.3 128.5 44.6 58.0 109 3 51.3 38.3 South Dakota ••••..•..••.•.••• 55.6 41. 0 10.4 54.6 52.8 1.2 58.9 14.4 38.9 83.8 35.0 360 109.5 48.2 41.4 49.0 15.6 28.9 Nebraska ............... ; ..... 74.1 14.1 52.6 88.5 14.0 65.3 8.1 14.8 -5.8 63.0 23.1 32.4 82.2 25.1 45.7 16.9 16.1 0.7 Kansas ....................... 67.0 25.1 33.4 84.0 29.8 4l.8 22.7 9.8 11.8 49.0 21.3 22.8 78.7 29.5- 38.0 16.7 9.8 6.3
SOUTIt ATLANTIC: Delaware ................ " ... 111.3 54.6 36.7 109.4 55.0 35.0 ':':i:o' 19.8 "28:9' 76.0 40.3 25.5 71.8 42.2 20.S
"20:6' -5.7 '''is:9 Maryland ....... , ., ........... 89.5 55.0 22.2 90.7 56.1 22.1 -23.2 78.5 39.6 27.9 81.0 41.0 28.4 4.1
D!-st!i<:t of Columbia •...••.... 809 28.3 41.0 80.9 28.3 41. 0 "2i:o' "ia:a" 125.8 51.8 48.7 1258 51.8 48.'/ "56:Z- -'3i:s' '''is:7 Vll'gl1!l.3 ...................... 150.1 68.5 48.4 170.8 74.9 54.8 37.1 115.3 56.0 38.0 140.5 64.5 46.2
West Virginia ......•.••.•..••. 79.7 58.8 13 1 81. 7 64.9 10.2 67.5 27.7 31. 2 60.2 24.0 29.1 41.3 200 178 117.1 329 63.4 North Carolina ................ 78.2 36.0 31.1 93.7 40.1 383 38.9 23.2 12.8 147.8 41.1 756 1750 495 84.0 103.3 26.7 62.8, South Carolina .••.•..•••.••.•. 95.0 32.8 46.8 115.0 36.9 57.0 16.8 9.4 6.7 109.0 31.5 59.0 106.8 28.0 61.6 115.3 42.0 51.6
~rg~t:::::::::: ::::::::::::: 67.2 52.1 9.9 62.6 55.2 4.7 145.7 247 97.1 99.9 29.1 54.9 89.6 264 500 156.1 41. 3 81.3 299.0 143.1 64.2 369.7 157.4 82.5 -1.6 14.2 -13.8 179.7 51.1 85.0 249.5 59.2 119.6 -4.4 1.7 -6.0
EA.ST SOUTIt CENTRAL:
f:~:~:::::: ::::::::::::::: 47.0 9.5 34.2 44.0 7.6 33.8 82.6 31.2 39.2 73.2 24.5 39.1 161.0 21.1 32.9 122.9 35.8 64.2 82.0 28.2 42.1 68.8 24.8 352 283.9 56.5 145.3 97.8 34.8 46.7 59.6 22.4 30.4 311 3 72.8 138.0
Alabama ...................... 53.8 35.2 13.8 47.9 32.1 12.0 133.4 68.9 38.2 89.4 36.2 39.0 632 20.1 35.9 195.9 95.0 51.7 Mississippi .................... 26.3 -21.1 60.1 23.0 -27.1 68.8 56.2 96.4 -20.5 50.6 23.4 22.0 33.9 1.8 31.5 107.3 131. 7 -10.5
WEST SOUTIt CENTRAL: Arkansas ..................... 71.9 20.6 42.5 76.1 19.0 48.0 53.4 29.9 18.1 77.2 28.6 37.8 73.7 22.6 41.7 83.9 41. 0 30.5 Louisiana ............. " ..•• '" 94.3 41.8 37.1 93.0 40.3 37.6 139.3 ll7.1 21.4 79.0 37.1 30.6 73.0 31. 8 31. 3 168.3 123.3 20.1 Oklahoma ••.••••••••••..••••• 219.3 58.4 101.5 244.4 65.7 107.9 129.6 28.4 78.9 159.6 52.2 706 185.8 61.1 77.4 128.8 40.7 62.6 Texas ......................... 144.9 47.4 66.1 148.5 47.4 68.6 120.0 47.9 48.7 117.8 31.9 65.2 108.3 23.2 69.1 143.2 57.2 54.7
MOUNTAIN: Montana ...................... 233.5 74.5 91.1 264.1 81. 8 100.3 84.4 25.9 46.4 199.4 44.7 107.0 206.6 44.5 12.2 156.9 45.8 76.1 Idaho ......................... 118.8 40.4 558 117.8 41.2 54.2 1283 33.1 71.6 126.9 26.3 79.7 119.2 28.3 70.8 167.0 18.4 125.5
~r~~~~'::::::'::::::::::::: : 159.2 49.4 73.4 185.0 59.5 78.7 83.7 16.1 58.2 135.5 58.6 48.5 136.8 69.0 40.1 130.3 27.3 SO. 9 79.9 19.2 50.9 79.4 18.5 51.3 ll5,4 42.8 36.8 73.5 26.5 37.2 70.5 24.8 36.6 1364 59.7 48.0
New Mexico .................. 155.6 42.1 79.8 173.1 36.5 100.0 77.9 97.2 -9.8 130.2 48.0 55.5 138.8 45.1 64.6 89.3 68.6 12.3 Arizona ....................... 283.9 111.9 81.2 325.2 122.8 90.9 -8.9 -19.0 12.5 193.8 62.4 80.9 229.1 71.7 91.6 -9.5 -24.2 19.4 Utah ......................... 49.9 7.3 39.8 484 7.8 37.6 179.2 -13.1 221.2 53.2 369 11. 9 47.8 37.7 7.4 315.4 23.8 235.4 Nevada ....................... 39.2 42.8 -2.5 45.0 46.5 -1.1 -9.8 5.8 -14.8 89.4 53.3 23.5 102.8 57.0 29.2 -19.3 4.1 -22.5
PA.CIFIC: ,
gi~:~~::·:·:·:::::::::::::: 105.8 -11.8 133.3 106.8 -14.2 141.1 91.4 57.2 21.7 90.6 25.6 51. 8 88.3 21.4 55.1 106.8 60.6 288 213.7 1.0 210.6 237.0 -2.4 245.2 81 0 60.3 12 9 153.2 26.0 100.9 178.8 22.0 128.5 76.9 49.0 18.7 240.3 35.8 150.5 243.4 35.3 153.8 122.0 74.6 27.1 142.8 33.0 82.6 142.5 31.9 83.8 150.6 00.6 50.4
1 A minus sign ( -) denotes decrease. Percentages are omitted where base is less than 100. 1397040-19--2

18 ELECTRICAL INDUSTRIES: 1917.
Table 9 ALL SYSTEMS AND LINES-PER CENT DISTRIBUTION FOR-
Miles of wire. Number of telephones.
DIVISION .AND STATE.
I ~~;~~~::J>~~t~f Systems reporting
I Systems reportinf TDtaI. annual incomes of Total. annual incomes 0 $5,000 or more. less than $5,000. 35,000 or more.
1917 1912 I 1907 1917 1912 1907 1917 191211907 1917 1912 1907 1917 1912 1907
100.0 1100.0 ~11~.0 ------------
UNITED STATES ......•. _. _. 100.0 100.0 100.0 1000 100.0 100 0 100.0 100.0 1000 1000 1000 = -'---= ----' ---= == --'-----' =.== GEOGRAPHIC DmsIONS: New England_._ ..•..••• _._._ 83 7.6 7.7 8.7 8.0 8.2 1 2 1.8 2.2 7.5 7.2 6.7 8.6 8.2 7.8 Middle Atlantic ..... _ •••. _ .. _ 25.5 24.9 23.5 26.5 26.0 25.0 6.0 7.0 6.5 20.9 20.4 205 23 4 22.9 23 8 East North CentraL ...••...•. 24.8 22 ... 9 25.4 24.9 22.9 2.5.3 22.0 23.7 27.6 27.0 27.2 28.0 27.6 27.5 27.7 West North Central ......... _ 13.6 14.5 15.7 12.6 13.3 14.0 31.6 32.7 35.1 18.1 18.6 20.4 15.1 15.1 15.6 South Atlantic ........ " ..... 6.0 5.5 6.7 5.9 53 6.6 8.3 86 7.8 6.3 6.1 6.0 6.1 58 6.0 East South Central ..••••.•••. 3.8 4.8 5.5 3.6 4.7 5.5 8.1 6.6 5.0 3.7 3.9 4.0 3.1 3.6 4.0 West South Central. __ ....... 6.6 6.5 6.2 6.2 6.1 5.8 148 130 9.9 6.3 6.2 5.6 5.1 5.3 4.9 Mountain .................... 2.5 28 2.8 2.5 2.8 2.9 27 2.6 2.1 2.6 2.6 2.5 2.8 2.8 29 Pacific ....................... 8.9 10.5 65 9 1 10.9 6.7 5.3 4.0 38 7.6 7.8 6.3 8.2 8.7 7.2 ------ -------------------------NEW ENGLAND: Maine ........................ 0.6 07 0.7 06 0.7 0.7 0.5 0.8 0.7 08 08 09 08 0.8 0.9 New Hampshire .••..•..•.••.. 0.4 0.4 0.4 0.4 0.4 0.4 02 0.3 0.5 0.4 04 05 0.5 0.5 0.5 Vermont ............. _ ....... 0.2 0.3 0.3 0.2 0.3 0.2 0.4 0.5 0.7 0.4 05 05 0.4 0.4 0.4 Massachusetts .............. _. 4.7 4.3 4 1 5.0 4.5 4.5 0.1 0.2 0.2 4.0 38 3 4 4 8 4.5 4.2 Rhode Island .. ___ ........... 06 0.5 0.5 0.6 0.5 0.6
"(i)" -'(i)" (1) 0.6 05 0.4 0.6 0.6 0.5 Connecticut ................. _ 1.8 1.5 1.7 1.9 1.6 1.8 0.1 1.3 1.2 1.0 1.5 1.4 1.3 MIDDLE ATLANTIC:
NewYork ........ _ ........... 14.4 13.8 12.5 15 1 14.5 13.4 2.3 2.6 30 11.4 11.1 11. 2 12.9 12.(j 13.0 New Jersey._ .. _ .. _ ......... _. 3.5 3.2 2.6 3.6 3.4 2.8 0.2 0.2 03 2.2 2.1 1.9 2.5 2.5 23 Pennsylvania ................ 7.6 7.9 8.4 7.8 '8.1 8.8 3.5 4.2 3.3 7.3 7.2 7.4 8.0 7.8 8.5 EAST NORTH CENTRAL:
Ohio_ ........ _ ............... 6.6 57 7.6 6.8 5.8 7.8 3.8 4.2 50 7.2 7.2 8.1 7.8 7.7 8.8 Indiana ...................... 3.2 3.3 4.1 3.1 3.2 3.8 4.9 5.3 7.0 39 4 1 4.7 3.7 3 '7 4.1 Illinois ....................... 89 8.3 7.6 9.1 8.5 7.5 5.7 6.6 8.9 9.2 9 2 9.1 9.6 9.6 8.9 W~~'h~ui:::::::::::::::::::: 3.7 3.6 3.8 3.8 3.6 3.9 3.1 3.1 2.5 37 3.8 34 3.8 3.9 3.6 2.3 2.0 2.4 2.2 1.8 2.2 4.5 4.5 4.1 3.0 2.9 2.6 2.7 2.5 2.3
WEST NORTH CENTRAL: Minnesota ...... _ ...... _ •.•.•. 3.7 3.2 3.0 36 3.1 2.9 4.8 4.5 4.1 3 5 3 1 2.8 3.3 2.8 2.6 ~'::oUiC::::~ ::::: ::: ::::::: 22 25 2.8 2.0 2.2 2.2 6.5 69 8.6 42 4.4 5.4 3.2 33 38 3.9 4.3 4.9 3.7 4 1 46 7.4 7.7 86 4.4 4.6 5.1 3 7 39 3.9 North Dakota .. _ ..•••.•••••.. 0.4 0.4 0.5 0.3 0.3 04 1.9 1.4 1.1 0.6 o G 0.6 0.5 0.4 0.4 South Dakota ................ 0.4 0.4 05 03 0.3 0.4 1.7 1.8 1.5 0.8 0.8 0.8 0.6 0.5 0.6 Nebraska ........... _ ......... _ .. 1.5 1.9 2.0 1.5 1.8 1.8 3.3 36 4.3 21 23 25 2.0 2.1 2.2 Kansas ................ _ ..•... _ 1.5 1.8 2.0 1.3 1.4 1.6 6.0 6.8 6.9 2.5 2.8 3.3 1.9 2.0 2.1
SOUTH ATLANTIC: Delaware ..................... 0.3 0.2 0.3 0.3 0.2 0.3 (1) (1) (1) 0.2 02 0.2 0.2 0.2 0.3 Maryland .................... 1.2 1.1 1.4 1.3 1.2 1.5 0.2 0.3 0.2 1.0 1.0 1.1 1.2 1.1 1.3 D;st~~t of Columbia •..••.•.• _ 0.6 0.6 0.7 0.6 0.7 0.8
··-i~i>· ·--i:i>· 0.6 0.5 0.5 0.7 0.6 06 VlTgmla._ .................... 0.9 0.8 0.8 0.9 0.7 0.8 1.5 1.0 0.9 0.9 0.9 0.8 0.8 West Virginia ............... _ 06 0.6 0.8 0.6 0.5 0.7 1.5 1.5 1.3 08 0.9 1.0 07 0.8 1.0 North Carolina ............... 0.5 0.5 0.6 0.4 0.4 0.5 2.1 2.2 2.2 0.8 a 7 0.6 0.6 0.6 0.4 South Carolina ............... 0.3 0.4 0.4 0.3 0.3 03 0.8 0.9 1.0 0.4 0.4 03 0.3 0.3 0.3 Georgia .......... _ ........... 1 1 1.0 1.4 1.0 1.0 1.5 1.7 1.7 1.0 1.1 1.1 1.0 1 0 1.1 1.1 Florida ..................... _. 0.5 0.3 0.3 0.5 0.3 0.2 0.4 0.4 0.6 0.4 0.4 0.3 0.4 0.41 0.2 EAST SOUTH CENTRAL:
Kentucky .................... 1.3 1.7 20 1.3 1 7 2.0 2.4 2.3 1.9 1.4 1.5 1 5 1.2 1.4 1.5 Tennessee ......... _ .... _ ... :. 1.3 1 4 1.6 1.2 1 4 1.6 3 1 2.5 12 1.2 1.2 1.2 1.0 1.1 1.2 Alabama .. _ .............. ___ . 07 0.8 1.0 0.7 0.7 1.0 1 4 1.0 1.8 0.6 0.6 07 0.5 06 0.7 Mississippi.; •..••.••••...•. _. 0.5 0.9 0.9 0.4 0.9 0.9 1.2 0.7 1.1 0.5 0.5 0.6 0.4 '0.5 0.6 WEST SOUTH CENTRAL:
~~~a''-'-::::::::::::::::: : 0.6 0.7 0.8 0.5 0.6 0.7 1.8 1.7 1 7 0.7 0.8 0.8 0.6 0.6 0.7 07 0.7 0.8 0.7 0.7 0.8 0.5 0.3 03 0.5 0.5 0.6 0.6 0.6 0.7 Oklahoma .................... 1.2 1.0 0.8 1.0 09 07 3 4 3.3 2.1 1.5 1.3 1.1 1.0 0.9 0.7 Texas ................. _ ..... _ 4.2 4.1 3.8 3.9 3.8 3.5 9.1 7.6 5.8 3.5 3.6 3.1 2.9 3.2 2.8
MOUNTAIN: Montana ..................... 0.3 0.3 0.2 0.3 02 0.2 06 0.6 0.4 0.4 0.4 0.3 0.5 0.4 0.3 Idaho_ ....................... 0.3 0.3 0.3 0.3 0.3 0.3 0.5 0.5 0.3 0.3 0.3 0.3 0.3 0.4 0.3
~lo~~~::::::::::::::::::: : 0.1 0.1 0.1 0.1 0.1 0.1 0.3 0.4 0.3 0.1 0.1 01 0.1 0.1 0.1 1.1 1.3 1.3 1.1 1.3 1.4 0.7 0.6 0.5 1.0 1.0 1.1 1.1 1.2 1.3 New Mexico ...... _ ... _ •.•.•. _ 0.1 0.1 0.1 0.1 0.1 0.1 0.3 0.2 0.2 0.1 0.1 0.1 0.1 0.1 0.1 Arizona._ .................... 0.1 0.1 0.1 0.1 0.1 0.1 0.1 0.1 0.1 0.2 0.1 0.1 0.2 0.1 0.1 Utah._ ....................... 0.4 0.6 0.6 0.4 0.6 0.6 0.2 02 0.1 0.4 0.4 0.5 0.4 0.4 0.6 Nevada .................... _. (1) (1) 0.1 (1) (1) 0.1 0.1 0.1 0.1 0.1 0.1 0.1 0.1 0.1 0.1
PACIFIC:
I 1.8 Washington ................. _ 1.5 2.4 1.6 1.5 2.5 1.6 1.7 1.4 1.3 1.6 1.7 1.6 1.6 1.8
g~g~.::::::~:::::::::::: : 1.0 1.3 0.7 09 1 4 0.6 1.5 1.2 1.2 1.1 1.1 08 1.0 1.2 0.7 6.4 6.7 4.2 6.7 71 4.4 2.0 1.4 1.3, 4.9 5.0 3.9 5.6 5.7' 4.7
1 Less than one-tenth of 1 per cent.
--
....
Systems reporting annual incomes of
leSs than $5,000. -
1917 1912 1907
------1000 100.0 1000
= --1.2 1.8 2.1 6.3 7.6 7.0
234 25.5 29.0 352 36.5 40.0 7.7 7.3 5.7 7.2 5.4 3.8
13.3 11.1 8.5 1.7 1.6 1.0 4.0 3.1 2.8 ------0.6 0.8 0.8 0.2 0.3 04 0.4 0.6 07
(1) 0.1 0.2
"(i)" "(i)" (1) (1)
2.9 3 4 3 9 0.2 0.2 0.2 3.2 4.0 2.9
4.0 4.5 5.3 5.2 5.7 7.2 6.7 7.3 10.2 3.1 33 2.5 4.~ 4.5 3.8
4.7 4.6 3 8 9.6 9.8 119 8.3 8.4 9.9 1.5 1.3 1.1 1.7 1.9 1.7 3.0 3.2 3.7 6.4 7.3 7.9
(1) (1) (1) 0.2 0.2 0.2
"'i:s' ···i:4' ····i:4 1.9 1 8 1.3 1,7 1.7 1.2 0.7 0.6 04 1.4 1.3 0.8 0.3 0.3 0.4
2.4 2.2 1 5 2.5 1.8 0.9 1.3 0.9 0.7 1.0 0.5 0.1
1.8 1.6 1.4 0.3 0.2 0.2 4 1 3.6 2.6 7.1 5.7 4.3
0.4 0.3 0.2 0.4 0.4 0.1 0.2 0.2 0.1 0.4 0.3 0.3 0.1 0.1 0.1
(1) 0.1 0.1 0.1 0.1 g~ (1) (1)
1.5 1.1 1.0 1.2 1.0 1.0 1.3 1.0 0.1
I I I
------_________ J

jj
11
i I I I f
I
TELEPHONES. 19
The American Telephone & Telegraph Co. (Bell Telephone System) reported to the Bureau of the Census the exact amount of telephone wire mileage which it had in each state in 1917, 1912, 1907, and 1902. The non-Bell companies reported their wire mileage in 1917 as if it were all within the boundaries of the state in which the principal business was located. Very few independent companies conducted business in more than one state and it was found that the very slight difference in accuracy attained by securing . exact information from those independent systems regarding the amount of their equipment located in each state did not justify the expense involved.
It was impossible to obtain the segregated figures for 1902 for Connecticut and Rhode Island, for Delaware, Maryland, and the District of Columbia, and for Utah and Wyoming. Consequently, the combined figures are presented for each of these groups of states, as was done at prior censuses.
As shown by Table 6, New York reported the largest wire mileage of all of the states, 14.4 per cent of the total miles of wire in the country being located in this state alone in 1917. illinois, Pennsylvania, Ohio, and California, in order named, constitute the other leading states in this respect. More than onequarter of the total wire mileage of the country in 1917 was reported by the three Middle Atlantic sta tes and practically the same proportion was reported by the five East North Central states. Less than one-third (31. 7 per cent) was reported by the states west of the Mississippi.
The systems and lines having annual incomes of less than $5,000 are relatively much more important in the West than in the East. This is shoWn nqt only by the number of such systems and lines (as already noted in connection with Table 5) but even more by their wire mileage. More than one-half (54.4 per cent) of the miles of wire reported by these small systems for the United States is located west of the Mississippi. The four leading states in this respect,
Texas, Missouri, Iowa, and Kansas, are all in this region.
The largest per cent of increase in wire mileage shown for the decade 1907-1917 was for Florida, there being almost four times as many miles of telephone wire in that state in 1917 as there were 10 years previous. Arizona, California, Montana, Oklahoma, and Oregon also reported increases for the decade of more than 200 per cent each. In no state did either the total wire mileage or the wire mileage of the systems reporting annual incomes of $5,000 or more show a decrease for the decade. In 10 states, however, the miles of wire reported by the small systems and lines decreased dur-
. ing the decade while in 12 states the percentage of increase in the wire mileage reported by the small systems was larger than the percentage shown by the systems having annual incomes of $5,000 or more.
The number of telephones, like the mileage of telephone wire, bears a close relation to the dehsi ty of population. The 4 states having the largest number of telephones, New York, illinois, Pennsylvania, and Ohio, are also the 4 states tha1i have the largest population, although in the latter respect Pennsylvania ranks ahead of lliinois. Table 8 shows that the greatest percentage of increase in the number of telephones for any state for the decade 1907-1917 was shown for Montana, 199.4 per cent, while Arizona was a close second, showing an increase of 193.8 per cent. Florida, Rhode Island, Oklahoma, and Oregon, also show increases for the decade of more than 150 per cent. In each of these states, as well as in all but the District of Columbia and 11 other states, the percentage of increase for the :first half of the decade exceeded that reported for the latter hiili. The largest percentages of increases for the period from 1912 to 1917 and from 1907 to 1'912 both in miles of wire and in number of telephones are shown for the statea having small population. The percentages of increase on the whole were larger during the earlier than during the later half of the period.

- CHAPTER III.-EQUIPMENT AND TRAFFIC. Ncdure of equipment.-The miles of wire, of pole
line, and of phantom circuits, the number of public and private-branch exchanges, and the number of telephone instruments are the only features of telephone equipment for which statistics were collected at the census of 1917. The same statistics were collected in 1912 with the exception of the I:niles of phantom circuits. Statistics as to other classes of equipment, such as the number and capacity of switchboards, the number of drops or jacks, the number and capacity of engines and dynamos, batteries, miles of duct, number and cost of poles purchased, etc., were collected at the censuses of 1902 and 1907. . In order to simplify the schedule, however, these features were abandoned at the census of 1912.
Table 10 presents for 1917,1912, and 1907 the data regarding equipment for which comparative figures are obtainable, showing such data separately for systenis reporting annual incomes of $5,000 or mo:re and those reporting incomes of less than $5,000.
Table 10 1917 1912 1907
All systems and lines: 28,827,188 20,248,326 12,999,364 Miles of wire .............................
Number of telephones .................... 11,716,520 8,729,592 6,118,578 Systems reporting annual incomes of $5,000
andover: 553,752 Miles of pole line ......................... 780,200 671,686
;Miles ofwire ............................. 27,298,026 19,019,391 11,921,960 Miles of phantom circuit ................. 315,037 (1) (1) Number of public exchanges .•••.•..•. ~ .. 12294 11,515 10,613 Number of Erivate-branch exchanges .•... 80;914 52,651 28,276 Number of elephones .............. ~ .•. ,. 9,953,710 7,326,748 4,906,693
Systems reporting annual incomes of less than $5000:
Miles of wire ............................. 1,529,162 1,228,935 1,077,404 Number of telephones .................... 1,762,810 1,402,844 1,211,885
1 Not reported.
The statistics in the above table, for miles of wire and number of telephones, ar~ the only data regarding equipment which can be shown both for the large systems (those reporting annual incomes of $5,000 or more) and for the small systems. The latter were not required to make a report regarding other items of equipment, with the exception that each of the companies, lines, or systems reporting an annual income of less than $5,000 was asked whether or not it operated a telephone exchange; affirmative answers were received from 8,881 of these in 1917. Some of these small systems, moreover, operated more than one exchange, so that the number shown is slightly less than the actual number of telephone exchanges operated by these small telephone systems. It is unlikely that these small systems have any private .. branch exchanges, so that the figures given in Table 10, as reported by the larger systems, represent practically all, if not all, of the private-branch exchanges in the United States.
(20)
Miles of wire.-In the early development of the wire plant, telephone companies, following the practice established by telegraph companies, used iron wire supported by wooden poles. The number of wires and poles required by the rapid development of telephony, however, soon became a menace and a nuisance, especially in cities, and the old system is being rapidly abandoned. The wires are now in many cases inclosed in cables, which to a large extent are laid in underground conduits. In fact, practically all of the wire underground, as well as a large proportion of that overhead, is now carried in cables. This method of carrying a number of wires to some central or convenient point for distribution is very general in the urban districts. No data fol" 1912 or 1917 were secured as to the length of cables, underground subways, or conduits, although the number of miles of single wire therein was reported.
The schedule of 1917 and 1912 called for the miles of single wire on exchange and toll circuits, overhead and underground, respectively. The statistics are' summarized in Table' 11.
Table 11 ALL SYSTEMS AND Ul!lES-MILEB OF W~E.
1917 1912
Tot~;;~~h~: ~:=::: :::: ::: .::::::::::::::::::::::: ~:Ws;M~ ~:~~~:~~~ Underground ....... _ ..................... _ ._ ••• 14,849,180 9,164,988
1======1===== On exchange circuits ............ , ........................ 25,252,276 17,565,110
g~~~~~~und::::::::::::::::::: :::::::::::::::::::::: IM;~~;~ 1 ~;~~:~i~ On toll circuits........................................... 3,574,912 2,683,216
Overhead. ........................................... 2,ii84,830 2,206,744 Underground......................................... 990,082 476,472
1 Includes 1,529,162 miles of'Y1rein 1917 and 1,228,935 mi1esof~rein 1912opera~ed by systems reporting annual mcomes o(less than $5,000, for which no segregatlOn as to overhead and underground was made.
The 28,827,188 miles of wj.re reported for 1917 was the quantity of single wire in operation or ready for operation at the end of the census year. If several wires were on one line of poles or in one conduit or cable, th~ length of each wire was included in the total as a separate item. A number of organizations, especially among the small systems or lines, reported that they had no record of the miles of wire. In such cases it was necessary to secure estimates. These estimates were checked with the actual miles of wire per telephone reported by other companies in the same region, and when it appeared necessary the reports were returned for revision.
Of the total miles of wire reported 12.4 per cent in 1917 and 13.2 per cent in 1912 was on the long-distance or toll circuits, the remainder being considered as being entirely on the local or exchange circuits. All of the
I I
J :J

TELEPHONES. 21 wire reported by the lines or systems having annual incomes of less than $5,000 was classed as wire on exchange circuits. These systems were not required to report how much of their wire was on exchange circuits and how much was on toll circuits, but it is thought that comparatively little of the wire reported by these small systems was used for long-distance purposes. .
The mcrease in the percentage of wire underground and the corresponding decrease in the proportion of overhead construction are shown in Table 12, which gives for all systems and lines the number of miles of wire classed as overhead or underground, with the per cent of total for each class;
Table 12 ALL SYSTEMS AND LINES-MILES OF WffiE.
Percent of CENSUS YEAR. total.
Total. Overhead) Under· ground.
Over- Under. head. ground.
--1917 ........................ 28~827,188 13,978,008 14,849,180 48.5 51.5 1912 ........................ 20,248,326 11,083,338 9,164,988 54.7 45.3 1907 ................. ~ ...... 12,999,364 8,009,332 4,990,032 61. 6 38.4 1902 ..................... , .. 4,900,451 3,200,409 1,700,042 65.3 34; 7
1 Includes total miles of wire reported by systems having annual inromes of less than $5,000 in 1917 and 1912, no segregation having been made, and also all wire reported by farmer or rural lines in 1907 and 1902; exclusive of 2,835 miles in Canada in 1917,1,565 miles in 1912, and 5 miles in 1907.
In 1902 overhead wire represented almost twothirds of the total wire mileage reported. Although the mileage of overhead wire has shown a substantial actual mcrease from census to census since 1902, this increase has been at a so much less rapid rate than the increase in underground wire that the proportion which the overhead wire constituted of the total has declined with each succeeding census until in 1917 it represented less than one-half of the total wire reported.
Companies operating in two or more states considered that it would work a hardship if they were required to furnish a segregation of the miles of overhead and underground wire, the miles of pole line, or the miles of wire on exchange or toll circuits for each state, therefore, no statistics on these subjects are given for separate states or cities.
Number of teZephones.-The term "telephone" as used in this report refers to the complete instrument or set consisting of a transmitter and a receiver. The report c<Jvers all telephones wired for service December 31, 1917, that were connected through exchanges or sWitchboards and those on farmer or rural lines, whether they were or were not connected with switch ..
boards. It does not cover those telephones used exclusively within hotels, mercantile or other commercial or private buildings, unless they were connected with outside or public exchanges. The nuniber of telephones is generally accepted as the most satisfactory unit of measurement to determine the importance of the industry. The number wired for service is almost invariably a matter of record or is so well known that it can be readily furnished. In few cases did the Bureau of the Census find it necessary to secure an estimate of the number of telephones on any system or line.
There were 54,319 telephones reported at the census of 1880. This had increased to 11,716,520 on December 31, 1917. There are, in addition, a considerable number of telephones on the wires of railway companies and in mercantile, manufacturing, and other establishments that are not included in the census. The total shown, therefore, is slightly less than the. actual number wired for Use. (For number of telephones see Table 7.)
Table 13 gives, for 1917, 1912, 1907, and 1902, by geographic divisions and states, the number of telephones per 1,000 population. These figures are based on the population as estimated by the Census Bureau, as shown in the table, and on the number of telephones shoWn in Table 7.
While the actual number of telephones has shown a rapid absolute increase during the I5-year period 1902-1917, the inGrease in their density-in the ratio between population and telephones-has also been very pronounced., There were, in 1902, only 30 telephones to each 1,000 of the population; in 191Z there were 113 telephones to each 1,000 population. Iowa has shown the largest number of telephones per 1,000 population at each of the last two censuses; in 1907 Washington was the leading state in this respect, and in 1902, California. .
The greatest density of telephones is, on the whole, found in the Middle West, two agricultural states, Iowa and Nebraska, ranking first and second in this respect in 1917. Excluding California and the District of Columbia, the eight leading states, on the basis of number of telephones per 1,000 population, are either in the East North Central or West North Central states. The Southern states, with their large proportion of colored population, are far lbehind the rest of the country in density of telephones, and all of the Mountain states except Colorado show fewer telephones, per 1,000 population, in 1917, than does the United States as a whole.

22 ELECTRICAL INDUSTRIES: 1917.
Table 13 ALL SYSTEMS AND LINES-RELATION OF TELEPHOl\'ES TO POPULATION.
DIVISION AND STATE. Estimated population. Telephones per 1,000 populatIon.l
1917 1912 1907 1902 1917 ---------------------'----------:1-----1·----1----1----·11----
UNITED STATES •••••••••••••••.••••••••••••••••••••••••••••••••••••••••• :103,635,306 .95,545,336 85,532,761 78,576,436
GEOGRAPHIC DIVISIONS:
~rddrenli~~i~'-'-:. ~ ~ : : :::: ::: : : : : : :: ::: : :: : : :: :: : : :: :::: ::: ::: : : :: ::: : ::: ta::l~f~rt~ '6~~f:~C : : :::: : : : : : : ::: : : : :::::::: : : :: : : :: :::: :: ::: :::::: : :: :
~~~~:~:.:.:.:i:.:.:.:lll::::lEEE:~HELL~:E NEW ENGLAND:
~~¥:f~~~~:: :::: :::::::::: :::: :::: ::::::::::: :::: ::::::::::::::::::: Massachusetts •.....................................•.............•...•...
~~~~~f~~~.-.-: : : .-: : : : .- .- .- .- .- .-: .-: : : : ~ : : : : : : : : : : : : : : : : : : : : : : : : : : : : : : : : : : : : ': : MIDDLE ATLANTIC:
NewYork ................................................................ . NewJersey •.................................. : .......................... . Pennsylvania ••.. " ., ................................ ',' ...............•...
EAST NORTH CENTRAL:
?n11Jfana::.-:.-: ::: :::.-:::.-:.'.::::: ::: :::::::::::: ::: ::::::::: ::::::::::::::: Illinois .••................•...•..................................•....•....
~\~~~ti:: ::::: ::: :::::::::: :::: ~::::: ::::::::: ::::::::: ::: ::::::::: :::: WEST NORTH CENTRAL:
Minnesota .•.............................................................. Iowa .•••...........................•...................................... MIssourL ................................................................. . North Dakota ........................................................... . South Dakota ...••............................ " .................... , .... . Nebraska •........................... ; ..........................•....•.... Kansas ...•............•..................................................
SOUTH ATLANTIC: Maryland •.•. " ..•.................•........................... " ...•.•... Delaware ........ " .......... " ................................ " ........ . District of Columbia ................................................•...•.
~!I:f~~~~~::::::::::::::: ::::::::: :::::::: :::::: :::::: ::::::::::::::: South Carolina ...••.....................•.............................•... Georgia .....................................•............................. Florida ...........................................................•.•.. " .
EAST SOUTH CENTRAL: Kentucky ........ ' ................................................•....... Tennessee ............................................................... .
~~:~;Pi:.::::::::::::::: :::: :::::::::::: ::::::::::::::::: ::: ::::::::::: WEST SOUTH CENTRAL:
Arkansas ............................................................ "'" Louisiana ........................................................ : ....... . Oklahoma ..........•..................................................... Texas ................................................ : .................. .
MOUNTAIN: Montana .•.•.............................................................. Idaho .............. ~ ..................................................... . Colorado ....................................•............................. New Mexico ... : ................................................ : ........ . Arizona ................................................................. . Utah ...•.................................................................
:lv~dJ::~':::::::::::::::::::::::::: :::: ::::::::::: ::::: ::::::::::::: ::::: PACIFIC:
Washington. .......... , .................................................. . Oregon ................................................. ~ ................ . California •................................................................
7,253,926 22,134,418 19,904,005 12,579,931 13,473,354 9,039,231
10,428,575 3,333,442 5,488,424
777,340 444,429 364,946
3,775,973 625,865
1,265,373
10,460,182 3,014,194 8,660,042
5,212,085 2,835,492 6,234,995 3,094,266 2,527,167
2,312,445 2.219,604 3,429,595
765,319 716,972
1,284,126 1,851,870
1,373,673 215,160 369,282
2,213,025 1,412,602 2,434,381 1,643,205 2,895,841
916,185
2,394,093 2,304,629 2,363,939 1,976,570
1,766,343 1,856,954 2,289,855 4,515,423
472,935 445,176 988,320 423,649 263,788 443,866 184,970 110,738
1,597,400 861,992
3,029,032
6,767,513 20,179,371 18,757,149 11,926,513 12,586,562 8,602,701 9,288,200 2,847,946 4,589,381
753,085 434,818 358,710
3,491,888 568,114
1,160,898
9,526,146 2,683,309 7,969,916
4,903,439 2,742,117 5;821,305 2,897,207 2,393,081
2,148,235 2,223,189 3,335,080
634,731 624)658
1,220,371 1,740,249
1,319,343 206,255 342,776
2,107,998 1,279,781 2,276,165 1,554,554 2,696,961
802,729
2,321,823 2,221,503 2,207,283 1,852,092
1,633,238 1,717,834 1,850,987 4,086,141
405,734 362,229 857,016 356,819 222,563
6,111,093 17,667,920 17,663,394 11,363,251 11,574,988 8,33.0,783 8,0371,775 1,992,696 2,790,861
717,832 436,128 351,495
3,083,013
} 1,522,625
8,386,673 2,248,332 7,032,915
4,497,198 2,743,305 5,518,190 2,611,790 2,292,911
2,071,318 2,201,331 3,405,901
487,890 476,631
1,068,849 1,651,331
} 1,798,652
1,992,925 1,096,006 2,086,912 1,472,734 2,481,617
646,142
2,349,152 2,197,785 2,049,407 1,734,439
1,439,910 1,565,752 1,414,177 3,617,936
313,615 213,028 628,216 219,830 147,214
394,953 } 428,458 157,914 '90,718 42,335
1,281,508 630,712 i30,736 484,938
2,577,137 1,675,211
1 ~omputed from basic figures shown in Table 7.
5,769,477 16,008,719 16,462,313 10,624,893 10,770,414 7,768,517 6,883,018 1,763,813 2,525,272
700,072 418,602 345,885
2,917,796
1,387,122
7,533,011 1,969,821 6,505,887
4,252,372 2,581,575 5,019,628 2,480,764 2,127,974
1,822,106 2,301,427 3,187,031
344,778 429,808
1,087,526 1,452,217
1,693,019
1,899,440 998,004
1,948,984 1,378,150 2,298,713
554,104
2,202,804 2,070,354 1,891,755 1,603,604
1,347,934 1,434,033
897,748 3,203,303
266,120 176,416 559,715 202,316 129,869
388,046
41,331
51l8,055 429,380
1,537,837
113
121 110 159 168 55 48 71 92
162
113 118 131 126 103 118
.{
128 84 99
162 162 172 140 138
1'76 220 149
98 124 193 161
86 103 192 :{
54 70 38 27 43 53
68 61 32 29
50 34 'i7 91
109 84
116 36 69
105 85 79
:{
118 146 190
1912 1907 1902 -------,
91 72 30
92 67 29 88 71 30
127 97 45 136 110 38 42 32 14 39 29 15 58 43 17 80 77 27
149 138 f3 ---92 74 20 92 1:6 24
112 88 35 94 68 33 73 } 58 24 90
102 82 33 69 52 25 79 64 29
129 110 53 129 106 53 139 101 44 116 80 38 105 69 30
127 83 35 171 151 60 121 92 32
81 70 20 105 101 24 lG5 142 34 141 121 28
64 } 77 61 21 136 36 28 14 03 57 23 29 18 9 21 14 8 36 25 11 40 27 15
56 40 21 47 32 18 26 20 7 25 22 10
42 34 13 27 23 12 63 48 18 76 52 20
88 55 20 81 77 22
105 105 44 29 30 12 50 42 25 86 } 87 19 63 62 110 28
117 157 56 136 102 49 168 142 69
Rural telephones.-There is no clear line of demarcation between urban and rural telephone systems. The statistics for the systems which had their principal offices in places with a population of ,4,000 or more were given for the censuses of 1902 and 1907 as representing the, urban districts, all other systems and lines being classed as rural. This classification, however, was unsatisfactory because many of the systems that had their principal offices in places of 4,000 inhabitants or more extended their lines into the sur-
rounding rural districts. By 1912 these extensions into the rural districts had become so great that it was believed the classification, if adopted, would be misleading. It was also found impracticable to endeavor to obtain separate statistics for different cities from companies that operated in two or more places of 4,000 population or over.
The larger telephone companies reported separately the number of telephones on their rural lines at the censuses of 1902 and 1907. This was combined with

TELEPHONES. 23 the number reported by mutual systems and farmer or rural lines, the total being accepted as representing the rural telephones. This classification was abandoned as unsatisfactory at the census of 1912.
The only practicable segregation apparent was based on the size of the companies or systems. Of the 53,234 telephone systems and lines for which statistics are included in the present report, there were 51,034 that reported an annual income of less than $5,000. The
statistics of wire mileage and of number of telep~ones for the two clas~es of companies, (a) those with an annual income of $5,000 or more, and (b) those with an income of less than that anlount, for 1917, 1912, and 1907, are given for each geographic division and state in Tables 6 and 7, respectivoly.
The statistics that were collected for 1917 for systems and lines having annual in90mes of less than $5,000 are presented, by states, in Table 14.
Table 14 SYSTEMS AND LINES HAVING ANNUAL INCOMES OF LESS THAN $5,000: 1917.
STATE. Number Number of
of Miles of systems Number . of systems wire. reporting
or lines. switch- telephones. boards.
United States ................... 51,034 1,529,162 8,881 1,762,810
Alabama ............................. 933 21,496 176 23':i Arizona ................... , ... '" ..... 44 1,156 8
Arkansas ............................. 1,941 27,597 218 31,800 California ............................. 1,857 30,867 75 22,328 Colorado ............................ , . 497 10,570 42 7,.204
Connecticut ................. " •...•.. 5 134 3 422 Delaware .............. ~ __ ............ 47 713 ·• .. ···52· 596
¥~Z~~::::::::.::::;:::·::::::::::::::: 101 6,192 4,603
1,169 26,000 202 24,825 330 7,734 41 7,078
nllnois ............................... 2,439 86,539 566 118,033 Indiana ............................... 1,512 75,682 482 92,064 Iowa ................................. 5,071 99,556 654 168,675 Kansas ................ ~ .............. 2,490 91,119 488 112,171 Kentucky ............................ 1,558 37,161 276 41,519
LouiSiana ............................. 440 7,209 47 6,021 Maine ................................ 186 8,350 69 10,115
~~~~~tts::::: ::::::::::::::: :::: 168 2,511 10 3,243 13 856 9 804
Miohigan ............................. 1,298 46,941 216 53,928
~!;!.i:::::::::::::::::::::::::::: 1,987 73,861 321 82,245
934 17,675 160 17,693 4,633 113,909 625 145,783
Montana .............. __ .. , ........... 276 8,921 42 6,342 Nebraska ............................. 1,321 50,122 185 52,325
Nevada ............................... 31 945 5 405 New Hampshire ...................... 51 3,103 22 2,998
~:: ~!~Io:::::::: :::::::::::::::::: 91 2,813 10 2,925 108 4,089 25 2,190
New York ............................ 980 35,728 249 51,253
North Carolina ..................... : . 1,~g~ 32,726 204 30,377 North Dakota. " ...... " ........ " ... 28,955 159 27,736 Ohio .................................. 749 57,470 356 71,527 Oklahoma ............................ 2,579 52,780 368 71,763 Oregon ............................... 931 23,668 120 22,037
Pennsylvania .............. " ......... l,gg~ 52,941 254 57,253 South Carolina ....................... 11,964 104 11,881 South Dakota •• ~ ......... , ........... 620 26,024 126 30,709 Tennessee ............................ 1,403 48,080 293 44,312
Texas ................................ 5,1~~ 138,608 750 125,491 Utah ................................. 2,650 17 2,534 Vermont ............. __ .............. 75 5,845 37 7,357 Virginia .............................. 657 23,127 193 25,893
Washington .......................... 1,068 26,304 118 25,653 West Virginia ............ , ........... 373 23,702 186 33,509 Wisconsin .......... '" ............... 968 69,272 288 77,516 Wyoming ............................ 169 5,497 30 3,150
The,systems and lines with annual incomes of less than $5,000 are largely small farmer or rural lines, while the lines of the systems reporting annual incomes of $5,000 or more are predominantly urban lines. N~ exact division between the two groups, however, can be made on this basis; some of the smaller systems are located in the smaller cities and towns, not infrequently operating in the same community as the large systems; on the other hand, many of the larger systems have extensive farmer or rural lines which
~
Gross Employees. Estimated receipts Assess- Total number of exclusive of ments of Salaries invest-messages assessments mutual and wages ment Dec. or talks. of mutual companies. Male. Female. paid.
31,1917. companies.
'" 2,036,661,250 $11,647,551 $7,350,280 6,271 11,868 $6,015,383 556,416,873
23,434,775 144,664 68,g~ 108 154 79,624 713,643 891,800 4451 5 9 10,791 134,029
40,249,300 18S;985 114,491 84 232 98,418 704,616 24,402,950 128,276 138,018 61 84 56,833 1,298,226
9,235,200 42,088 48,015 23 32 21,638 352,483
483,600 5,150 24 5 4: 3,699 9,257 394,875 1,971 3,900 1 ·· .. ···64· 150 31,28<1:
6,329,375 86,721 10,248 63 44,880 246,28<1: 33,577,050 253,565 94,302 155 228 120,644 874,940
7,087,925 49,105 38,954 31 49 34,185 413,308
120, 'tifl,825 588,352 391,931 419 874 383,119 2,963,188 103,361,375 632,011 167,716 332 690 230,389 2,585,752 174,285,475 807,564 635,436 408 794 502,624 4,468,166 147,106,700 700,091 356,628 432 771 453,115 3,230,411
42,201,250 179,464 90,595 125 258 103,770 884,141
6,887,075 54,893 15,557 24 47 24-,561 199,593 7,694,050 107,255 10.466 52 96 .45,918 453.060 3,580,200 19,345 13~470 14 14 7,493 145;528
771,875 12,561 852 8 14 5.463 31,823 57,840,250 277,744 262,491 166 329 170~318 1,511,373
98,869,:225 566,555 210,335 209 437 255,909 3,467,423 23,181,600 107,610 ' 46,755 62 112 48,148 454,147
160,445,025 592,024 356,131 436 899 398,487 3,769,139 6,683,950 87,306 23,987 37 56 38,072 532,094
65,728,325 369,650 186,230 180 264 185,972 1,922,137
501,800 14,411 858 7 4 5,049 50,083 4,316.650 46,347 1,385 26 41 20,336 104 228 4,667,325 25,357 12,813 13 26 13,826 174;094 3,351,400 40,299 7,550 13 31 17,516 173,099
52,407,225 430,389 84,040 202 354 189,581 1,633,469
44,302,375 282,712 43,594 159 268 124,558 1,066,937 27,690,650 272,452 85,917 109 172 121,620 1,629,590 83,012 800 499,364 143,722 280 640 283,622 2,199,320 97,375;525 582,135 244,417 240 456 271,619 1,865,706 28,940,275 131,306 96,671 68 148 72,019 838,501
62,235 875 418,008 2,288,862 228 439 178,087 2,416,192 16,740; 100 134,476 24,342 83 117 62,953 441,100 34,460,725 331,090 55,756 130 153 122,960 1,197,496 57,743,725 214,140 120,480 223 338 137,835 1,227,015
159,333, 850 865,650 392,791 345 834 400,060 3,740,808 3,659,825 35,021 2,107 16 32 15,132 192,431
10,461,100 68,074 13,239 35 63 34,633 257,626 32,521,125 167,222 66,001 121 223 90,023 868,273
25,563 200 205,671 90,771 88 156 101,743 1,226,5~7 25,662:975 103,700 89,927 60 272 87,444 833,940 93,120,300 730,772 181,606 366 550 317,923 2,622,814 3,131,375 41,554 17,231 19 40 22,624 261,549
they own and operate and which form integral parts of their systems.
Public and private-branch excoonges.-The telephone com.panies and systems that had an annual income of $5,000 or more at the censuses of 1912 .and 1917 reported the number of public-exchange offices and private-branch exchanges. As previously explained, a retabulation was made in 1912 of the repo.rts for 1907 in order to show these statistics for the same class of companies for that census, but it was

~ ---
24 ELECTRICAL .INDUSTRIES: 1917.
impossible to make a retabulation of the reports for 1902, therefore, comparable statistics are confined to the last three censuses.
For census purposes the "exchange," or tc central office," is defined as the place or office in which lines for the use of the general public are interconnected by means of a switchboard. The word "exchange," when used by itself in this report, refers to the public exchange and not to the private-branch exchange, which consists of a switchboard located within a business building, apartment house, hotel, or private establishment, and serves as a means of connection for wires between, buildings, departments, offices, or rooms as well as with the central office or exchange.
The combination of the statistics for the two classes of exchanges would have but little, if any, significance. In fact, a total of all exchanges would be misleading. The following statement shows the amount of this class of equipment:
CENSUS YEAR.
1917 •................................................... 1912 ................................................... . 1907 •................................................ , ..
Public t~~~:~-exchanges) exchanges.1
12,294 11,515 10,613
80,914 52,651 28,276
• 1 Only systems reporting annual incomes of $5,000 or more.
During the period from 1907 to 1917, while there was an appreciable increase in the number of public exchanges, there was a very large increase in the private-branch exchanges. The installation of private-branch exchanges in hotels and manufacturing and mercantile establishments has become quite general. They insure quick and satisfactory communication between different rooms and departments, and are now considered a necessity in every institution of any magnitude ..
The statistics for companies with an annual income of $5,000 or more, cover a majority of all public exchanges. Of the 51,034 smaller systems or lines in 1917, 8,881 reported that they operated at least one exchange. Since these small systems were not required to state how many exchanges they operated the' actual number of exchanges in 1917 was doubtless slightly more than the number of these small systems operating telephone exchanges. The number of exchanges operated by system..') reporting annual incomes of less than $5,000 was not reported in 1912, but the number of such exchanges in 1907 was 4,914.
The private-branch exchange is an almost exclusive characteristic of the large companies, and it is probable that the total of 80,914 shown in the foregoing statement represents approximately the actual number wired for use by all telephone systems, large and small, in 1917.
The number of public exchanges is shown in Table 26 and the number of private-branch exchanges in Table 27.
Messages 01' talks.-The word" traffic" is generally used to indicate the amount of business, or, in other words, the number of messages passing over the wires. A message may be either a few words or a long conversation, and may be transmitted over a long or a short distance. Renee, the number of calls does not fully represent the extent to which the equipment is used. All systems reporting ,an annual income of $5,000, or more in 1912 and 1917 were required to report the number of messages originating on their lines during the year. The inquiry was limited to the originating calls in order to avoid the duplication which would have resulted if incoming calls were also reported. Therefore, companies were requested to report the" estimated total number of telephone connections or cans, including both completed and Uncompieted, during the year originating from telephones owned and operated bY,the cOIupany reporting."
In 1917 the smaller systems and independent farmer lines were also required to report the number of messages, although it had been found a.t previous censuses that the statistics furnished by these latter organizations were not very reliable. No doubt a considerable' number of messages passing over lines of the smaller systems were also reported by the larger systems performing switching service for them, even though the larger companies received the instructions quoted above. It was of course impossible to obtain information as to messages passing through private-branch exchanges and over party lines when calls on such lines did not require interconnection at a public exchange. Local exchange messages were reported separately from long-distance and toll messages. Messages originating and terminating within the same public exchange district were counted as exchange messages, as they do not involve any interchange of business between separate companies or separate exchanges. Long-distance and toll messages are those between different localities.
In considering traffic statistics it must be remembered that the quantity of traffic is very largely estimated. Many of the larger companies make an actual count of the messages handled during a certain period of each month, and this is used by them as a basis for computing the amount of yea,rly business. Other companies, however, keep no records on which reliable estima tes can be based. In this connection, however, it should be stated that the figures for 1917 are probably more accurate than those for' any prior census] because a larger proportion of the companies kept records in 1917 than in previous years.

TELEPHONES.
Table 15 shows the number of exchange and of long-distance or toll messages reported for 1917, 1912, 1907, and 1902, together with the percentage which each class formed of the total number of messages reported at each census. The statistics for 1917, 1912, and 1907 represent the companies rep'orting annual incomes of $5,000 and over, while those for 1902 are for all companies that had exchanges. The table shows that there has been little variation in the proportion of exchange and long-distance messages from census to census.-·
Table 15 SYSTEMS REPORTING .ANNUAL INCOMES OF $5,000 OR MORE.
CENSUS Estimated number of messages. Per cent of total. YEAR.
Total. Exchange. Long.
Ex· Long. distance
change. distance or toll. or toll.
---1917 •••••••••• 19,809,061,085 19,366,111,091 442,949,994 97.8 2.2 1912 •.•••••••• 13,735,658,245 13,394,885,4.42 340, 772, 803 97.5 2.5 1907 .......... 10,400,4.33,958 10,160,630,944 239,803,014 97.7 2.3 19021 ......... 5,070,554, 553 4,949,849,7011 120,704,844 97.6 2.4 -
1 Number reported by all systems which had exchanges.
Table 16 presents for each geographic division and state, for the systems reporting annual incomes of $5,000 or more, the number of local and long-distance messages recorded in 1~17, together with th~ per cent whlch each constitutes of the total messages.
Toll messages constituted a much larger pToportion of the total messages in the New England and Middle Atlantic states than in the other sections of the country. All 9 of these states ar~ included in the 12 states leading in this respect, the other 3 being Maryland, Delaware, and Arizona. New Jersey had a very much larger proportion of toll calls than any other state in the country due to the fact that all,the calls across the Hudson to New York, and across the Delaware to Philadelphia were classed as toll calls. Maryland, Rhode Island, New 'York, and Connecticut ranked next, in order named. In general, it may be said that the states having the larger number of telephones per 1,000 population reported a smaller proportion of toll messages. In the Middle West (the East North Central and West North Central states) which as shown in Table 13 have the greatest density of telephones, the proportion that toll messages constituted of the total number of messages was less than for the country as a whole. The only two states in this region which had approximately the same proportion of toll messages, as was reported for the entire country, were North Dakota and South Dakota, and . these two states were the ones which had the smallest number of telephones per 1, 000 popUlation of any of the middlewestern states.
Table 16
DIVISION AND STATE.
UNITED STATES.
GEOGRAPIDO DM· SIONS:
New En~land ...• Middle Atlantic .. East North Cen·
tral. ........... West North Cen-
tra!. ........... South Atlantic ... East South Cen·
tral. _ .......... West South Cen-
tral. ........... Mountain .•...•.. Pacific ...........
NEW ENGLAND: Maine ........... New Hampshire. Vermont ........ Massachusetts ... Rhode Island .... Connecticut •.•..•
MIDDLE A'l'LANTIC: New York ....... New Jersey ...... Pennsylvania •...
EAST NORTH CEN· TRAL:
Ohio ...•••....•.. Indiana ...•...... TIlinois ........... Michigan ........ Wisconsin ...••..
WEST NORTH CEN' TRAL:
Minnesota ....... Iowa ....••..•.•.• Missouri. ........ North Dakota ... South Dakota •.• Nebraska •....... Kansas ..........
SOUTH ATLANTIC: Delaware ........ Maryland ........ District of Co-
lumbia ........ Virginia~ ........ West Virginia .... North Carolina .• South Carolina ... Georgia .......... Florida ..........
EAST SOUTH CEN· TRAL:
Kentucky .....•. Tennessee •.....• Alabama ........ Mississippi. ••..••
WEST SOUTH CEN· TRAL:
Arkansas ...•...• Louisiana ........ Oklahoma ....... Texas ............
MOUNTAIN: Montana ....•.•.• Idaho ............ Wyoming •.....• Colorado ......•.• New Mexico ..... Arizona .......... Utah ............ Nevada ..........
PACIFIC: Washington ..... Oregon .......... California ........
25
SYSTEMS REPORTING ANNUAL INCOMES OF $5,000 OR MORE: 1917.
Number of messages. Per cent of total.
Long Long
Ex- dis· Total. Exchange. distance change. tance ortoll. or
toll.
----19,809,061,085 19,366,111,091 442,949,994 97.8 2.2
1,491,798,705 1,439, 128,709 52,669,996 96.5 3.5 3,759, 253,241 3, 588, 462, 792 170, 790, 449 95.5 4.5
5,459,843,329 5, 386,779, 986 73,063,343 98.7 1.3
3.080,583,974 3,038,023,671 42,560,303 98.6 1.4 1,409,721,700 1,384,294,850 25,426,850 98.2 1.8
962,576,140 951,305,941 11,270,199 98.8 1.2
1,515,971,215 1,491,928,599 24,042,616 98.4 1.6 500,269,587 489,079,797 11,189,790 97.8 2.2
1,629,043,194 1,597,106,746 31,936,448 98.0 2.0
1447
507, 158 139, ~41, 709 4,565,449 96.8 3.2 8 ,351,473 84,464,149 2,887,324 96.7 3.3 98,614,464 96,000,158 2,614,306 97.3 2.7
800,057,085 772,077,713 27,979,372 96.5 3.5 105, ~94, 600 101,031,463 4,563,137 95.7' 4.3 255,673,925 245, 613, 517 10,,060,408 96.1 3.9
2,101,225,651 2,016,661,163 84,564,488 96.0 4.0 335, 130, 108 290,109,986 45,020,122 86.6 13.4
1,322,897,482 1,281,691,643 41,205,839 96.9 3.1
1,662,588,046 1,644,619,774 17,,968,272 98.9 1.1 784,487, 523 774,457,608 10,029,915 98.7 1.3
1,682,589,280 1, 65~, 705,534 26,883,746 98.4 1.6 841,989,847 832,496,685 9,,493,162 98.9 1.1 488, 188,633 479,500,385 8,688,248 98.2 1.8
630,210,504 620, 796,m 9,,413,511 98.5 1.5 634,311,700 624,930,747 9,380,953 98.5 1.5 842,595, 853 833,659,523 8,936,330 98.9 1.1 81,705,350 79,696,029 2,009,321 97.5 2.5 92,113,268 90,103,731 2,009,537 97.8 2.2
425, 428, 689 420,161,669 5,267,020 98.8 1.2 374, 218, 610 368,674,985 5,543,625 98.5 1.5
36,604,568 35,555,312 1,049,256 97.1 2.9 182, 654, 086 173,476,750 9,177,336 95.0 5.0
111,132,636 109,892,280 1,240,356 98.9 1.1 219,957,057 218,042, 124 1,914,933 99.1 0.9 126,701,314 124.,203,024 2,498,290 98.0 2.0 173,012977 170,039, 868 2,973,109 98.3 1.7 94,142,343 92,788,840 1,353,503 98.6 1.4
324,047,185 320,083,978 3,963,207 98.8 1.2 141,469,534 140,212,674 1,256,860 99.1 0.9
339,414,688 336,282,482 3,132,206 99.1 0.9 321,450, 567 318,633,742 2,816,825 99.1 0.9 175,658,670 173,330,766 2,327,904 98.7 1.3 126,052,215 123,058,951 2,993,264 97.6 2.4
167,274,716 164,864,633 2,4JO,01l3 98.6 1.4 192,731,445 189,779.974 2,951,471 98.5 1.5 3(16,691,645 300,047,646 6,643,999 97.8 2.2 849,273,409 837,236,346 12,037,063 98.6 1.4
78,355,645 76,616,862 1,738,783 97.8 2.2 52,878,610 51,481,44.0 1,397,170 97.4 2.6 28,912,599 28,381,760 530,839 98.2 1.8
182, 030, 107 177,531,139 4,498,968 97.5 2.5 25,462,623 25,007,179 455,444 98.2 1.8 21,031,654 20,399,958 631,696 97.0 3.0 99,01.4,412 97,375,864 1,638,548 98.3 1.7 12,583,937 12,285,595 298,3~ 97.6 :.t.4
328,583,795 324,511,985 4,071,810 98.8 1.2 202,998, 735 ZOO, 286, 404 2,712,331 98.7 1.3
1,097,460,664 I, 072, 308, 357 25,152,307 97.7 2.3

26 ELECTRICAL .INDUSTRIES: 1917.
It should be noted that Table 16 presents only messages reported by systems having annual incomes of $5,000 or more. The small systems were not required to segregate the number of messages wbich they reported so as to show the number of exchange messages separately from the toll calls. The messages reported by systems or lines having annual incomes of less than $5,000 in most states constituted such a very small proportion of the total messages that, they can be omitted from the tabulated statistics without making any important difference in the total, The reports of these small organizations are, moreov--ei', much less reliable in this respect than are the reports of the larger systems. Consequently, it is deemed inadvisable to use the estimated number of messages or talks reported by the small lines or systems in 1917 for making any important deductions regarding the traffic conditions of the telephone industry. .
Table 17 presents for systems having annual incomes of $5,000 or more, by geographic divisions and states, the statistics of the number of telephones, the estimated number of messages or talks, and the number of messages per telephone per day, for 1917, 1912 and 1907.
The number of telephones shown in this table for the year 1917 is the average number. This average was obtained from the reports made by each of the larg~ companies showing the number of telephones wired for use on December 31, 1916; and the corresponding number on December 31, 1917. The statistics thus obtained, together with the derived average, are presented for both the Bell Telephone System and the large non-Bell telephone systems (those reporting annual incomes of $5,000 or more), by geographic divisions and states, in Table 18. The
number of telephones reported for th~ larger systems for 1912 and 1907 is in each case the number in operation on December 31 of the census year, so that the number of messages or talks per telephone per day as reported for these two earlier census years may be sl~ghtly less than would have been the case if the average number of ,telephones had been reported at these censuses. Except in this and in the following table, the number of telephones shown for the year 1917 is not the average number but the number in operation on December 31 of that year.
The Southern states, in which the number of telephones per 1,000 population is comparatively small, show the largest number of telephone messages per day. Louisiana, Tennessee, Alabama, Georgia, Mississippi and Florida all reported 10 or more telephone calls per telephone per day. The 12 leading states in this respect are all Southern states.
The number of calls per telephone per day reported for the United States by the larger systems has averaged approximate~y six at each of the last three censuses. The number of days used to secure this average is 325, this being the number of days determined upon by traffic experts as most nearly representing the average conditions, allowing for the decreased business which takes place, on Sundays and holidays. .
Table 18 presents separately for the Bell System and the larger independent telephone systems, "by geographic divisions and states, the number of telephones reported on December 31;11917 and the number reported on December 31, 1916, together with the average number for 1917 computed from these data. This table is used as the basis for the number of telephones shown for 1917 in the preceding table.

TELEPHONES. 27 -
Table 17 SYSTEMS REPORTING ANNUAL INCOMES OF $5,000 OR MORE .
Number of telephones.1 . \
Estimated number of messages or tolks. DIViSION AND STATE.
1917 1912 1907 1917 Pei: telephone per day.2
1912 1907
1917 1912 1907
--------UNITED STATES ............................. 9,697,110 7,326,748 4,906,6P3 19,809,061,085 13,735,658, 245 10,400,433, g58 6.3 5.8 6.5 GEOGRAPmC DIVTSONS:
New England ................................. 834,412 600,207 384,413 1,491,798,705 810,524,037 572, 523, 863 5.5 4.2 4.6 Middle Atlantic ....................•.......... 2,272,496 1,675,681 1,167,667 3,759,253,241 2, 422, 868, 241 1,947,571,139 5.1 4.4 5.1 East North Central. .......•.......... : .......... 2,674,315 2,020,802 1,360,544 5,459,843,329 4,025,906,387 3, 067,416, 613 6.3 6.1 7.6 West North Central ........... '" ..... '" ..... 1,461,808 1,109,359 767,050 3,080,583,974 2,238,770,606 1,664,198,498 6.5 6.2 6.7 South Atlantic ................................ 579,448 428,311 296,271 1,409,721,700 869,439, 943 749,939,984 7.5 6.2 7.8 East South Central ............................ 304,770 261,294 197,291 962,576,140 662,046,512 731,000,908 9.7 7.8 11.4 West South CentraL. .. "'''' '"'''' ........... 492,420 387,022 239,746 1,515,971,215 1,079,517,948 646,501,299 9.5 8.6 8.3 Mountain ...................................... 268,493 204 508 141,339 500, 269, 587 435,366,129 299,270,686 5.7 6.6 6.5 Pacific ......................................... 808,948 639:564 352,'372 1,629,043,194 1,191,218,442 722,010,968 6.2 5.7 6.3 NEW ENGLAND:
Maine ......................................... 76,657 57,988 43;846 144,507,158 84,033,152 73,197,982 5.8 4.5 5.1 ~:~!~r~~~~:::::::::::::::::::::::::::::: : 48,581 36,052 24,345 87,351,473 49,984,600 36537513 5.5 4.3 4.6 39,847 31,498 22,117 98,614,464 48,306,101 35:666: 768 7.6 4.7 5.0 Massachusetts ................................. 462~326 328,503 207,201 ~g,gg~,g~ 401,817,540 298,824,440 5.3 3.8 4.4 Rhode Island .................................. 62,287 41,664 } 86,904 { 48,211,556 } 128,297, 160 { 5.2 3.6 } 4.5 Connecticut .......................... '" ...... 144,714 104,502 255: 673: 925 178,171,088 5.4 5.2 :MIDDLE ATLANTIC:
New York ............ '" ...... '" ........... ,. 1,250,751 923,136 637,881 2,101.225,651 1,297,849,047 1,034,651,594 5.2 4.3 5.0 ~:~;1~~iS::::::::::::::::::::::::::::::::: : 245,296 182,419 114,528 335,130, 108 192,311,511 138,914,642 4.2 3.2 3.7 776,449 570,126 415,258 1,322, 897, 482 932,707,683 774,004,903 5.2 5.0 5.7
E.ABT NORTH CENTRAL: Ohio .... __ .................. __ "'" __ ... __ .. '_. 749,607 567,573 431,851 1,662,588,046 1,301,503,565 1, 044, 222, 376 6.8 7.1 7.2 Indiana ................ __ ... __ ... __ ........... 356,970 244,291 202,492 784,487,523 583, 621, 519 498,560,085 6.7 6.5 7.6 Illinois ... __ ...... ~ ....... __ .. ____ .. __ . __ .. __ .. 929,308 704,230 434,518 1,682,589,280 1,105,751,431 833,749,155 5.6 4.8 5.9 ~~~~~~~:::::::::::::::::::::::::::::::::::: : 372,650 288,154 179,263 841,989, 847 694,363,258 413, 557, 846 7.0 7.4 7.1 265,780 186,554 112,420 488, 188, 633 340,666,614 307,327,151 5.6 5.6 8.4
WEST NORTH CENTRAL: Minnesota ............ __ ....................... 317,770 208,340 125,884 630,210, 504 418, 720, 464 274,434 452 6.1 6.2 6.7 Iowa ... ' ............................. __ ....... 309,105 242,963 187,938 634,311, 700 471,126,059 366,184,981 6.3 6.0 5.5 Missouri. .............................. '" __ ... 356,048 285,472 192,943 842,595 853 655, 616, 330 468,138,352 7.3 7.1 7.5 North Dakota. __ ........ __ ..... __ . __ .......... .46,578 32,915 20,835 81,705;350 49861 643 39,874,764 .. 5.4 4.7 4.6 South Dakota ................................. 56,692 39,299 27,801 92,113,268 41,881:574 60,~,810 5.0 3.7 6.7 Nebraska .. __ ... __ ............. __ ..... __ ....... 190,978 156,619 107,518 425,428, 689 291,615,175 246,047, 837 6.8 5.7 7.0 Kansas ..... __ ... __ ...................... __ .... 184,637 143,751 104,131 374,218,610 303,949,361 238,969,302 6.2 6.5 7.1
SOUTH ATLANTIC:
~cl~~~~::::::::::::::: ::::::::::::::::::: :::: 112,133 81,686 } { 182, 654, 086 104, 008, 361 } { 5.0 3.9 } 4.7 21,040 15,210 107,553 36,604,568 26,810,915 165,995,216 5.4 5.4 District of Columbia ........ , .................. 65,050 46,603 111, 132, 636 46,936,446 5.2 3.1
~~t~J~i~~::: ~::::::::::: ~:::::::::::::::: 91,163 56,968 38,963 219,957,057 164,421,931 115,354, 885 7.4 8.9 9.1 57,264 55,033 46,709 126,701,314 103, 255, 136 109, 065, 223 6.8 5.8 7.2 60,084 '41,177 22,379 173,012,977 90,831,013 80,667,891 8.9 6.8 11.1 South Ca.rolina ................................ 31,201 24,871 15,393 94,142,343 68,170,380 51,558,785 9.3 8.4 10.3
~r~i~::::::::: :::::::::::::::::::::::::::::::: 98,218 78,864 52,568 324, 047, 185 206,631,042 187,647,940 10.2 8.1 11.0 43,295 27,899 12,706 141,469, 534 58,374,719 39,650,044 10.0 6.4 9.6
EAST Soum CENTRAL: Kentucky ..................................... 118,432 100,174 75,370 339,414,688 287,807,892 276,476,058 8.8 8.8 11.3 Tennessee ................ __ ................... 95,147 78,717 60,357 321,450,567 188,865,474 231,218,675 10.4 7.4 11.8
~~~~:pL::::::::::::::::::::: :::::::::::: ::: 52,314 44,144 32,473 175, 658, 670 100, 983, 408 102, 736, 572 10.3 7.0 9.7 38,877 38,259 29,091 126,052,215 84,389,738 120,569,603 10.0 6.8 12.8
WEST Soum CENTRAL: Arkansas ............... __ . __ ....... __ ..... __ ., 54,380 45,743 32,288 167,274,716 124 445,991 71,950,886 9.5 8.4 6.9 Louisiana ........... __ .... __ ................... 52,122 43,906 33,448 192,731,445 101: 597, 617 120,647,366 11.4 7.1 11.1 Oklahoma ............. __ .................. __ .. 101,088 65,215 36,758 306,691,645 163,999,696 108, 725, 669 9.3 7.7 9.1 Texas .................. ____ ....... , ... __ ... __ . 284,830 232,158 137,252 849,273,409 689,474,644 345,177,378 9.2 9.1 7.7
MOUNTAIN: Montana .............. __ ...... ____ .... ________ . 42,682 31,188 14,699 78,355 645 74,199,460 18,869,410 5.6 7.3 3.9. Idaho ....... __ '''' __ .. ,.,. ____ '.'. __ .. __ ....... 28,883 23,475 13,743 52,878;610 45,634,703 24,883,595 5.6 6.0 5.6 Colorado ... __ ......... ______ .... __ .. __ .. __ . __ .. 104,964 85,886 62,861 182,030, 107 165,041,709 138, 203, 561 5.3 5.9 6.8 New Mexico ........... , __ ...... ; ....... __ .. __ . 12,656 9,047 5,496 25,462,623 20,174,437 12,548,942 6.2 7.9 7.0 Arizona ... ~ .................................... 16,510 10,128 5,285 21,031,654 11,573,427 10,379,750 3.9 3.5 6.0
*~~~~~.~.: ~:::::::::::::::::::::::::::::::::: 43,019 32,018 } 35,156 { 99,014412 93,122,868 } 87,596,483 { 7.1 8.9 } 7.7 11,791 7,471 28,912:599 17,121,932 7.5 7.1 7,988 5,295 4,099 12,583,937 8,497,593 6,788,945 4.8 4.9 5.1
PACIFIC: Washington ... : ....... __ ................ __ .... 159,481 134,040 86,439 328,583,795 295,273,362 200, 184,465 6.3 6.8 7.1 gifBg~n:~::::: :::::: ::::::::::::::::::::::: :::: 101,751 84,923 37,171 202,998,735 170,065,267 83,833,537 6.1 6.2 6.9
547,716 420,601 228,762 1,097,460,664 755,879,813 437,992,966 6.2 5.3 5.9
1 For 1917 this is the average number; for 1912 and 19Q7 it is the number on Dec. 31. 2 Computed on the basis of 325 days to the year. (See note 1.)
i ~
I I

28 ELECTRICAL INDUSTRIES: 1917.
Table 18 SYSTEMS REPORTING ANNUAL INCOMES OF $5,000 OR MORE-NUMBER OF TELEPHONES.
DIVISION AND STATE. Total. Bell Telephone System. All other systems.
Average On Dec. 31, On Dec. 31, Average
On Dec. 31, On Dec. 31, Average onRii: 31, On Dec. 31, number for number for number for 1917. 1917. 1916. 1917. 1917. 1916.1
1917. 1916.1
UNITED STATES .................................... 9,697,110 9,953,712 9,440,511 7,122,249
GEOGRAPHIC DIVISIONS:
7,326,858 6,917,641 2,574,861 2,626,852 2,522,870
~;d~nl~~~~ic~~ ~~ ~: ~:~:~: :::::::::: :::::::::::::::: 834,412 856,658 812,165 805,494 827,407 783,581 28918 29,251 28,584 2,272,496 2,332,774 2,212,217 1,896,798 1,952,601 1,840,996 375;698 380,173 371,221 East North Central. ................................. 2,674,316 2,745,921 2,602,710 1,665,749 1,714,650 1,616,847 1,008,567 1,031,271 985,863 West North Central ...........................•...... 1,461,807 1,500,091 1,423,524 758,777 781,254 736,300 703,030 718,837 687,224 South Atlantic •................. , .................... 579,448 ~g§'~~ 554;192 478,224 500,697 455,752 101,224 104,007 98,440 East South Central.. ................................. 304,770 299,905 219,289 222,109 216,468 85,481 87,527 83,437 West South Central •..•...........•...........•.•.... 492,420 504;929 479,912 366,290 376,900 ~g,~~~ 126,130 128,029 124,232 Mountain ........ , .............. , .................... 268,493 277,893 259,093 249,156 257,653 19,337 20,240 18,434 Pacific ............................................... 808,948 821,104 796,793 682,472 693,587 671;358 126,476 127,517 125,435 ------------_. NEW ENGLAND:
Maine ................................................ 76,657 78,111 75,203 68,121 69,471 66,771 ' 8,536 8,640 8,432 New Hampshire ..................... '" .............. 48,581 49,536 47,626 ~,~~~ 45,913 44,026 3612 3,6~3 3,600 Vermont ............................................. 39847 40,611 39,083 29,105 28051 11;269 11,506 11,032 Massachusetts .................. : ..................... 462;326 4~!'j~~ 450,225 458;028 470,174 445;882 4,298 4,253 4,343 Rhode Island ........................................ 62,287 59,848 62287 64,726 59,848 .. · .. ·i;203· ...... i;229· .. · .... i;iii Connecticut .......................................... 144,714 149;247 140,180 143;511 148,018 139,003
MIDDLE ATLANTIC: NewYork ........................................... 1,250,751 1,283,802 1,217,699 1,125,230 1,159,659 1,090,801 125,521 124,143 126,898 New Jersey .......................................... 245,296 251,519 239,072 232,325 238,172 226,478 12,971 13,347 12,594 Pennsylvania ....................... " ...... " ..•.... 776,449 797,453 755,446 539,243 554,770 523,717 237,206 242,683 231,729,
EAST NORTH CENTRAL: Ohio ................................................. 749,606 774,122 725,091 367,642 381,677 353,607 381,964 392,445 371,484 Indiana ••....................................•....... 356,971 366 928 347;013 170 600 176,769 164,430 i~'~ 190,159 182,583 Illinois ................................................ 929,309 952;961 905,653 706;105 725,767 686,443 2'%1,197 219,210 ~~~~~ .. ::::::::::::::::::::::::::::::::::::::::::: 372,650 380,200 365,100 255,286 260,711 249,861 117:364 119,489 115,239 265,780 271,707 259,853 166,116 169,726 162,506 99,664 101,981 97,347
WEST NORTH CENTRAL: Minnesota ..•••......•...•............•..•............ 317,769 325,977 3~9,562 168,404 173,696 163,113 149,365 152,281 146,449 Iowa ................................................. 309,105 320,757 297,453 185 449 195,295 175,603 123,656 125,462 121,850 Missouri ............................................. 356,048 365,463 346,633 171;555 176,124 1~986 1~~,~~ 1~,:: 179,647 North Dakota ........................................ g~,gZg t~,~~ 45,542 ig,~~ 28,647 ,434 18,108 South Dakota. '" .................................... 55,147 13,059 12,794 43'765 45;178 42,353 Nebraska ............................................ 190:978 195;942 186,015 82;000 83,992 80,009 108;978 111,950 106,006 Kansas ..... : ......................................... 184,637 186,102 183,172 110,401 110,441 110,361 74,236 75,661 72,811
SOUTH ATLANTIC:
~:f!~~~.:::::::: :::::::::::::: ::::: :::: :::::::::: ::: 1~~, 5:3 115,154 109,112 111,756 114,769 108,743 377 385 369 21,626 20,452 18588 19231 17944 2,452 2,395 2,508 District of Columbia ..• '" ....•. , .•... , .... '" .•.. , .. 65:050 70,751 59,348 65;050 70;751 59;348 . ·· .. ·is; 058' .. ··-i8;859- .... ··ii;258 We~i-ghti~::::: :.:::::::::::::::::::::::::::::::::: ~?,~~ 93,704 88,623 73,105 74,845 71,365 66,021 48,508 45,188 53,631 36,746 ~'m 12,390 11,762 North Carolina ....................................... 60;084 61,551 58,618 39,581 40,374 38,789 21,177 19,829 South Carolina ................................. , ..... 31,201 31,835 30,566 26,689 27,126 26,252 4'512 4,709 4,314
~f~itt::: ::::: ::: :::: :::::: :::: ::::::::::: :::: ::: :::: 98,218 99,654 96,783 77,914 79,016 76,813 20;304 20,638 19,970 43,295 44,408 42,182 20,353 20,954 19,752 22,942 23,454 22,430
EAST SOUTH CENTRAL: Kentucky ............................................ 118,432 121,324 .115,540 ~~~~g ~}g~ 58,728 58,292 59,773 56,812 Tennessee ............................................ 95,147 96,357 93,937 76,528 17,891 1:,~~ 17,409
~~~~~::pC:::::::: :::::::::::::::::::: :::::::: ::::: 52,314 53,000 51,629 46;804 47;440 46,1C9 5,510 5;460 38,877 38,955 38,799 35,089 35,134 35,043 3,788 3;821 3,756
WEST SOUTH CENTRAL:
12,900 Arkansas ............................................. ~,~~g g~,g~~ 52,689 40,887 41,986 39,789 13,493 li,ggg Louisiana ............................................ 46,375 48,254 ~,g!i 42,493 3868 3,882 Oklahoma ........................................... 101;088 105;072 97104 85,726 82,404 15;362 16'025 14,700 Texas ................................................ 284,830 285,916 283;744 191,423 191;853 190,994 93,407 94;063 92,750
MOUNTAIN: 3,950 Montana ............................................. 42,682 45,067 40,297 39,008 41,117 36,899 3,674 3,398
Idaho ................................................ 28,883 30,126 27,641 25,332 26,455 24,209 3,~~ 3'n~ 3,432
~r~~~::::::::::::::::::~::::::::::: :::: ::::: ::::: 11,791 12,624 10958 11 146 11 879 10,413 545 104,964 107,160 102;768 103;356 105;539 101,174 1,608 . 1,621 1,594
NewMeJd,co .......................................... 12,656 13,124 12,187 10,899 11,310 10,487' 1,757 1,814 1,700 Arizona .............................................. 16,510 17,394 15,626 15,020 15,825 14,216 1,490 1,569 1,410 Utah ................................................. 43,019 44,087 41,951 40,823 41,814 39,832 2,196 2,273 2,119 Nevada .............................................. 7,988 8,311 7,665 3,572 3,714 3,429 4,416 4,597 4,236
PACIFIC: 32,446 32,519 32,373 Washington ........ '" ............................... 159,481 162,754 156,208 1~1'~~~ l~g,~~~ 123,835
8!Mg:hla-:::::::::::::::::::::::::::::::::::::::::: :: 101,751 103,623 99,879 73,325 27,273 27,992 26,554 547,716 554,727 540,706 480;959 487;721 474,198 66,757 67,006 66,508
1 The number of telephones for Dec. 31, 1916, is shown on the basis of the ownership as of Dec. 31, 1917.

TELEPHONES. 29
The Bell Telephone System shows a larger number of telephones at the end of 1 9 1 7 than at the· end of 1916 in every state in the Union. This condition is due to the normal increase in business which took place during the year, the numb~r of telephones for December 31, 1916, being reported on the basis of the ownership as of December 31, 1917. The non..;.Bell telephone system showed a fair increase during the year for the United States as a whole and reported decreases in only four states, Massachusetts, New York, Delaware, and Louisiana. The combined figures for the Bell and other telephone systems show no decreases for the year.
Traffic and population.-Tables 19 and 20 show the number of messages per capita for the four census years, 1917, 1912,1907, and 1902. In computing the number of messages per capita in these tables only the number of messages reported by systems having annual incomes of $5,000 or more wa.s used for the years 1917, 1912, and 1907. In 1902 this information was reported by all commercial telephone systems. Table 19 shows the number of messages per capita for each of the geographic divisions. Table 20 presents this information by states, the states being arranged according to their rank in 1917 in this respect.
Table 19
DIVISION.
SYSTEMS REPORTING ANNUAL INCOMES OF $5,000 OR MORE-NUMBER OF MESSAGES PER CAPITA.
1917 11912 ~~ ----------~------------I------I------
United States .................... .
~rJenl~=ic:::::::::::::::::::::::: : East North Central ...................•. West North Central. ................... . South Atlantic .....•................ , .. . East South Central. .•.............•..... West South Central ••.•......•.•...••... Mountain .............................. . Pacific ................................. .
191
206 170 274 245 105 106 145 150 297
144
120 120 215 188 69 77
116 153 260
122
94 110 174 146 65 88 80
150 259
65
52 57
105 67 33 49 44 58
110
The largest number of messages per capita is reported from the ~1iddl~ West and Pacific Coast states, most of the states leading in this respect being
found in these regions. The Southern states, on the other hand, are largely those reporting the smallest number of messages per cap~ta.
The large increase in the use of the telephone is indicated not only by the increase in the number of telephones but also by the increase in the number of messages per capita as presented in ·these tables. The largest relative increases in this respect for the
'15-year period 1902 to 1917 are shown for Maine, Kansas, Nebraska, Vermont, 'and New IIampshire.
Table 20
STAT:E.
California .............................. . Nebraska .............................. . Ohio ................................... . District of Columbia .... , ............... . Iowa ........................ ; ......... .. Indiana ................................ .
=:s~~a:::: :::: :::::::::::: :::: :::: ::: Vermont ............................... .
m~~~C:::::: ::::::::::::::::::::::::: g~~.~:::::::::::::::::::::::::::::::::: Massachusetts .......................... . vVashingtoI), ............................ . Kansas ................................. . Connecticut •......... : ................. . NewYork ............................. .
~~:co~:~.s~.r~:::. ~: ::::::::::::::::::: Texas •••.....................•.. · .. ····· Maine ............................. : .... . Colorado ..••............................ Delaware .............................. . Rhode Island •.......................... Montana .••••...........................
~K~~~:::: :':::::::::::: ::::::::: :::': ~~~~f;~~::.:::::::::::::::::::::: ::: Tennessee .............................. . Oklahoma ............................. .
~7~~~koia:::::::::::::::::::::::: ::: Idaho .................................. . Nevada ................................ .
!~af~HHm~::~:H~~~~: Arkansas •....••......................... West Virginia .......................... . Arizona ................................ . Alabama ............................. ..
~:s\~sfp~¥~~:::::::::::: ::: :::: ::::::: New Mexico ............................ . South Carolina ........ , ................ .
SYSTEMS REPORTING ANNUAL INCOMES OF $5,000 OR MORE-NUMBER' OF MESSAGES PER CAPITA.
1917
362 331 319 301 286 277 272 272 270 270 246 235 223 212 206 202 202 201 196 193 188 186 184 170 169 166 156 154 153 142 139 134 133 , 128 119 114 112 111 107 104 99 95
'90 80 74 71 64 60 57
liln2 1907 1902
282 261 116 239 230 67 265 226 131
~1~ ······i53· .. ······84 213 182 114 240 158 96 195 132 62 135 101 55 190 151 108 197 137 76 233 173 83 236 ................... . 115 97 63 230 317 116 175 145 40 153 ................... . 136 123 48 115 84 41 142 134 48 169 95 52 112 102 31 193 220 108 130 ................... . 84 .•••••••..•• .: ...... .
183 60 43 108 •••••••• , ......... ..
'13 61 34 117 110 76 124 118 65 85 105 62 89 77 35 79 ••••••••.• '" •••••.. 79 127 42
126 117 37 94 160 34 77 76 42 72 62 29 79 82 41 59 77 47 78 67 34 76 50 27 81 100 42 62 71 39 46 50 24 40 39 19 46 70 38 57 57 21 44 35 17

CHAPTER IV.-COMPARISON OF BELL AND OTHER, SYSTEMS. Oompanies for which the statistics are compared.
There were 2,200 telephone systems reported at the census of 1917, which had annual incomes of $5,000 or more. Of this number, 145 constituted what is commonly known as the Bell Telephone System. The prinGipal offices of these 145 companies are located in 27 different states. 'J\1any of them operated in more than one state and the Bell System's local and long-distance service extends into all states. The miles of wire and the number of telephones are the only features for which satisfactory comparison can be made between the Bell System and all other systems because the other features have not been reported for the companies or systems
Table 21
that had annual incomes of less than $5,000 at the different censuses. The comparison for the last four census years between the JBell Telephone System and all other systems is presented in Table 2.
The tables i~ this chapter present a comparison between the Bell Telephone System and all other systems reporting annual incomes of $5,000 or more, except that the tables giving miles of wire and number. of telephones show the statis'Bics for all the independent_ systems and lines.
Table 21 presents this comparison for the years. 1917 and 1912 for all the important items for which comparable figures for the two years can be shown.
SYSTEMS REPORTING ANNUAL INCOMES OF $5,000, o.R MORE.
Total. Bell Telephone System. All other systems.
1917 1912 1917 1912 1917 1912
Number of systems .................................... , ............... 2,200 1,916 145 176 2,055 1,740 Number of public exchanges .................................... '" .... 12,294 11,515 7g,~gg 5,853 6,006 5;662 Number of private-branch exchanges ................................... 80,914 52,651 45,387 8661 7,264
~:~ ~~ ~~~~:::::::::::::::::::::::: ::::::::::::::::::::::::::::::: 780,200 671,686 400;895 353,422 379;305 318,264 27,298,026 19,019,391 23,133,718 15,133,186 4,164,308 3,886,205
~bo:r~~ret~~g::-e"s~~~:::: :::::::::::::::::: ::::::::::::::::::: ::::: 315,037 . •· .. ··7;326;748· 287,049 ······5;087; Oi7' 27,988 · ...... i;239;7ii 9,953,710 7,326,858 2,626,852 Estimated number of messages or talks ................................ 19,809,061,085 13,735,658,245 14,597,567,869 ' 9, 133, 226, 836 5,211,493,216 4,602,431,409
Local exchange .................................................... 19,366,111,091 13,394,885,442 14,236,304,195 8,886,838, 093 5,129,806,896 4,508,047,349 Long-distance or toll. .............................................. 442,949,994 340, 772, 803 361,263,674 246,388,743 81,686,320 94,384,060
Average messages or talks per telephone ............. '" ................ 1,990 1,875 1,992 1,795 1 983 2,055
t~~~~~~~~~~~r' toil.::: : : :: : : :: : : :: : : :: :: : : : : : :: : : : :: : : :::: :: :: :: : 1,9~ 1,828 1,9!~ 1,747 1;952 2,013 47 48 31 42
Revenue, operating and nonoperating .................................. 3372 501,800 3253,893,969 3311,918,260 3206,095,172 360, 583, 540 $47,798,797 Expenses, including taxes an.d fixed charges, total ..... , ............... 3313; 103,060 3202,567,644 $260,783,288 3162,988,447 $52,319,772 339,579,197 Netincome ............................................................ 359,398,740 $51,326,325 $51,134,972 $43,10(1,725 $8,263,768 38,219,600 Dividends ............................................................. $42, 266, 589 $34,120,809 $37,020,809 $29,709,841 $5,245,780 $4410,968 Assets, total. .......................................................... 31,665,120,922 $1,295,670,101 ff'~~5,g~,~~g $934,805,563 $333,521,874 $360: 864, 538
Value of plant and e~uipment ............... , ..................... Sl, 435,912,142 $1, 081,433,227 $780,017,745 3295,272,476 $301,415,482 Stocks and bonds an other permanent investments ............... 397, 287, 729 $104, 554, 667 ' 387; 997; 104 372,629, 170 $9,290,625 $31925,497 Cash and current assets ............................................ $82,026,232 $96,618,255 $67,358,132 $82,158,648 $14,668,100 $14, 459, 607 Sundries, including materials and sur~s, stock and bond dis-
count! and sinking and other specia ds ...................... $49,894,819 $1.1,063,952 $35,604,146 '" S934; S05; 563 . $14,290,673 $13063,952
LiabJ~~i~~ls~~~::.::::::: ::::: :::::::::: ::::: ::::::::::::: :::::::::::: $1,665,120,922 $1,295,670,101 $1,331,599,048 $333,521,874 $360: 864, 538 $665,944,471 $586,763,879 $509,409,055 $397,885,433 $156,535, 416 $188,878,446
Funded debt, including real·estate mortgages of incorporated $503,129,399 $405,662,528 $410,357,279 $295,972,603 $92,772, 120 3109,689,925 systems ..... : .....................................................
Floating debt and accounts payable, etc ........................... 346,817,996 370,610,342 321,803,277 $49,718,370 325,014,719 $20,891,972 Cash investments ........... , ....... ~ .............................. 34,946,599 $3,287,138 .. 'si6i; 95S; 540' ... si5i; so;;; 096' $4,946,599 $3,287,138 Sundries ........................................ '" ........ ~ ....... $295,322,309 $168,574,593 333,363,769 S15, 767, 497 Net surplus .................................................... , .... $148,960,148 $60, 771, 621 $128,070,897 $38,422,061 $20, 889, 251 $22,349,560
Salaried employees: 44,705 38,753 37,299 31,435 7,406 7,318 Number ...........................................................
Salaries .................... -........................................ $46, 566, 869 332,681,482 $39,940,809 327,004,837 $6,626,060 $5,676,645
Wa~~b:~~: ......................................................... , 199,785 144,608 161,401 110,468 38,384 34,140 Wages ............................................................. $123, 088, 197 $63,359,059 3104,974,058 $49,896,524 $18,114,139 313,462, 535
1 Number for 1917 is that employed on Sept. 29, for 1912 on Sept. 16.
The overwhelming predominance of the Bell T~lephone System in all branches of the industry is clearly shown in the abo ve table. AI though the number of Bell exchanges only slightly exceeded that reported by the larger non-Bell organizations, the number of private-branch exchanges connected with the Bell System represented almost nine-tenths of the total for the country, the miles of wire constituted more than four-fifths of the total, and the number of telephones represented more than seven-tenths of the total. The annual revenue of the Bell System 'was
(30)
more than five times as much in 1917 as that reported by all of the larger non-Bell telephone systems combined. The assets were almost four times as ml1c-h and the total dividends paid more than seven times as much as that reported by the' (, independent" organizations.
Table 22 shows, by geographic divisions and states, the number of telephones for 1917, 1912, and 1907, distinguishing the Bell System and all other systems, with the per cent each class formed of the total for each year.

TELEPHONES. 31
Table 22 ALL SYSTEMS AND LINES-NUMBER OF TELEPHONES.
Total. Bell Telephone System. All other systems. Per cent of total. DIVISION AND STATE.
'1 1917 1912 1907 1917 1912
UNITED STATES .... 11,716,520 8,729,592 6,118,578 7,326,858 5,087,027 GEOGRAPIDC DIVISIONS:
-
New England ........ 878,354 625;488 410,269 827,407 580,097 Middle Atlantic .. " .. 2,444,205 1,782,145 1,252,903 1,952,601 1,355,352 East North CentraL .• 3,158,989 2,378,257 1,712,390 1,714,650 1,159,303 West North Central. . 2,119,735 1,621,523 1,251,555 781,254 519,069 South Atlantic .. ' .... 739,631 531,402 365,764 500,697 340,227 East South Central ... 436,853 337,292 243,234 222,109 184,355 West South Central. . 740,004 543,102 342,255 376,900 283,681 Mountain ............. 307,627 226,652 154,061 257,653 177,617 Pacific ................ 891,122 683,731 386,147 ~93,587 487,326 NEW ENGLAND:
Maine ................ 88,226 68,914 53,134 69,471 52,564 New Hampshire .•.... 52,534 40,017 28,920 45,913 33,387 Vermont ............. 47,968 40,142 30,833 29,105 23,818 Massachusetts ..•.. , .. 475,231 329,992 209,383 470,174 325,186 Rhode Island .. " ..... 64,726 41,664 24,099 64,726 41,664 Connecticut ..... '" ... 149,669 104,759 63,900 148,018 103,478
MIDDLE. ATLANTIC: New York .. , ........ 1,335,055 970,449 685,512 1,159,659 809,635 New Jersey .......... 254,444 185,632 116,988 238,172 161,037 Pennsylvania .•.•..... 854,706 626,064 450,403 554,770 384,680
EAST NORTH CENTRAL: Ohio ................... !l45,649 631,206 495,636 381,677 251,116 Indiana ............... 458,992 354,550 289,452. 176,769 117,897 Illinois ............... 1,070,997 807,253 558,585 725,767 473,799 Michigan ..••......... 434,128 335,074 209,842 260,711 193,599 Wisconsin ............ 349,223 250,174 158,875 169,726 122,892
WEST NORTH CENTRAL: Minnesota ............ 408,222 272,359 171,479 173,696 99,093 Iowa ................. 489,432 380,294 332,545 195,295 116,813 Missouri. ............. 511,246 404,150 312,527 176,124. 140,239 North Dakota ...... ,. 75,349 51,241 34,087 28647 17,328 South DaJrota ... ' •... 88,946 65,858 48,405 13:059 7,836 Nebraska ....... """ 248,267 201,689 152,279 83,992 62,246 Kansas ............... 298,273 245,932 200,233 110,441 75,514
SOUTH ATLANTIC: Delaware ........ " ... 22,222 15,842 12,621 19,231 12,648 Maryland ......... , .. 118,397 84,801 66,323 114,769 79,410 District of Columbia .. 70,751 46,603 31,332 70,751 46,603 Virginia .............. 119,597 76,652 55,541 74,845 47,497 West Virginia ...•.... 99,530 80,251 62,144 53,631 27,593 North Carolina. , ..... 91,928 65,152 37,104 40,374 27,951 South Carolina .•..... 43,716 33,239 20,911 27,126 20,926
~rgii~::::::::::::::: : 124,479 96,43'6 62,260 79,016 64,052 49,011 32,426 17,522 20,954 13,547
EAST SOUTH CENTRAL: Kentucky ............ 162,843 130,751 93,996 61,551 51,185 Tennessee ............ 140,669 104,353 71,130 77,984 62,194 Alabama ............. 76,693 56,292 40,481 47,440 39,233 Mississippi. .......••.. 56,648 45,896 37,627 35,134 31,743
WEST SOUTH CENTRAL: Arkansas ............ _ 87,872 68,303 49,576 41,986 37,658 Louisiana .••.••....... 63,890 46,602 35,692 54,014 41,803 Oklahoma ............. 176,835 116,217 68,125 89,047 55,339 Texas ................. 411,407 311,980 188,862 191,853 148,881
MOUNT.A.IN: Montana ............. 51,409 35,537 17,168 41,117 16,180 Idaho ................. 37,204 29,454 16,394 26 455 17,560 Wyoming ............ 15,774 9946 6,699 11;879 7,471 Colorado .............. 114,364 90;397 65,908 105,539 84,626 New Mexico .. """" 15,314 10,346 6,653 a,~~ 8,482 Arizona ............... 18,225 11,224 6,203 9,802 Utah .•.•......•...•.• 46,621 34,064 30,435 41;814 30,971 Nevada ............... 8,716 5,684 4,601 3,714 2,525
PACIFIC: Washington ..... " ... 188,407 150,016 98,846 130,235 106,151 Oregon ............... 125,660 99,713 49629 75,631 58,030 California ............. 577,055 434,002 237:672 487,721 323,145
The Bell System represented in 1917 more than 4alf the telephones in all the states except 16, 7 of these being the states which oomprise the West North Central division. No non-Bell systems were reported for Rhode Island or for the District of Columbia. Of the other states, the Bell System reported more than 90 per cent of the telephones in Colorado, Con-
Bell All other 1907 1917 1912 1907
1917 '912!'90' 1917 191211907
3,132,063 4,389,662 3,642,565 2,986,515 62.5 58.3 51.2 37.5 41. 71 48.8 -366,531 50,947 45,391 43,738 94.2 92.7 89.3 58 7.3 10.7 878,428 491,604 : 426,793 374,475 79.9 76.1 70.1 20.1 23.9 29.9 702,746 1,444,339 1,218,954 1,009,644 54.3 48.7 41. ° 45.7 51. 3 59.0 297,432 1,338,481 1,102,454 954,123 36.9 32.0 23.8 63.1 68.0 76.2 209,308 238,934 191,175 156,456 67.7 64.0 57.2 32.3 36.0 42.8 137,128 214,744 152,937 106,106 50.8 54.7 56.4 49.2 45.3 43.6 157,080 363,104 259,421 185,175 50.9 52.2 45.9 49.1 47.8 54.1 115,115 49,974 49,035 38,946 83.8 78.4 74.7 16.2 21.6 25.3 268,295 197,535 196,405 117,852 77.8 713 69.5 22.2 28.7 30.5
07,110 1.8,755 16,350 16,024 78.7 76.3 69.8 21.3 23.7 30.2 22,432 6,621 6,630 6,488 87.4 83.4 77.6 12.6 16.6 22.4 16,916 18,863 16,324 13,917 60.7 59.3 54.9 39.3 40.7 45.1
204,059 5,057 4,806 5,324 98.9 98.5 97.5 1.1 1.5 2.5 23,929' 170 100.0 100.0 99.3 0.7 62,085 ·····i;6Si· · .... i;zsi· 1,815 98.9 98.8 97.2 "i:i' "i:r 2.8
504,753 175,396 160,814 180,759 86.9 83.4 73.6 13.1 16.6 26.4 97,854 16,272 24,595 19,134 93.6 86.8 83.6 6.4 13.2 16.4
275,821 299,936 241,384 174,582 64.9 61.4 61.2 iI5.1 38.6 37.8
183,358 463,972 380,090 312,278 45.1 39.8 37.0 54.9 60.2 63.0 72,462 282,223 236,653 216,990 38.5 33.3 25.0 61.5 66.7 75.0
273,263 345,230 333;454 285 322 67.8 58.7 48.9 32.2 41.3 51.1 103,793 173,417 141,475 106:049 60.1 57.8 49.5 39.9 42.2 50.5 69,870 179,497 127,282 89,005 48.6 49.1 44.0 51.4 50.9 56.0
56,861 234,526 173,266 114,618 42.5 36.4 33.2 57.5 63.6 66.8 52,772 294,137 263,481 279,773 39.9 30.7 15.9 60.1 69.3 84.1 91,704 .' 335,122 263,911 220,823 34.4 34.7 29.3 65.6 65.3 70.7 7,452 46,702 33,913 26,635 38.0 33.8 21.9 62.0 66 .. 2 78.1 3,654 75,srn 58022 44,751 14.7 11.9 7.5 85.3 88.1 92.5
46 669 164,275 139;443 105,610 33.8 30.9 30'.6 66.2 69.1 69.4 38;320 187,832 '170,418 161,913 37.0 30.7 19.1 63.0 69.3 80.9
10,209 2,991 3,194 2,418 88.5 79.8 80.9 13.3 20.2 19.1 48845 3,628 5,391 17,478 96.9 93.6 73.6 3.1 6.4 26.4 31;332 .................. ............... -................. 100.0 100.0 100.0
'37~4' '37~7' "43:4 31,423 44,752 29,155 24,118 62.6 62.3 56.6 15,535 45,899 52,658 46,609 53.9 34.4 25.0 46.1 65.6 75.0 16,507 51,554 37,201 20,597 43.9 42.9 44.5 56.1 57.1 55.5 13,039 16,590 i~'~M 7,872 62.1 63.0 62.4 37.9 37.0 37.6 36,056 45,463 26,204 63.5 66.4 57.9 36.5 33.6 42.1 6,362 28,057 18;879 11,160 42.8 41.8 36.3 51.2 58.2 63.7
42,200 101,292 ~'fgg 51,796 37.8 39.1 44.9 62.2 60.9 55.1 45,372 62,685 25,758 55.4 59.6 63.8 44.6 40.4 36.2 25,496 29,253 17;059 14985 61.9 69.7 63.0 38.1 30.3 37.0 24,060 21,514 14,153 13;567 62.0 69.2 63.9 38.0 30.8 36.1
17,426 45,886 3~,~~ 32,150 47.8 55.1 35.2 52.2 44.9 64.8 29,508 9,876 6,184 84.5 89.1 82.7 15.5 10.3 17.3 30,116 87,788 60;878 38,009 50.4 47.6 44.2 49.6 52.4 55.8 80,030 219,554 163,099 108,832 46.6 47.7 42.4 53.4 52.3 57.6
47.3 9,050 10,292 19,357 8,118 so. 0 45.5 52.7 20.0 54.5 10,640 10,749 11,894 5,754 71.1 59.6 64.9 28.9 40.4 35.1 5331 3,895 2,475 1,368 75.3 75.1 79.6 24.1 24.9 20.4
61;435 8,825 5,771 4,473 92.3 93.6 93.2 7.7 6.4 6.8 3,177 4,004 1,864 3,476 73.9 82.0 47.8 26.1 18.0 52.2 3055 2,400 1,422 3 148 86.8 82.0 49.3 13.2 18.0 50.7
19;907 4,807 3,093 10;528 89.7 90.9 65.4 10.3 9.1 34.6 2,520 5,002 3,159 2,081 42.6 '4.4 54.8 57.4 55.6 45.2
63,194 58,172 43,865 35,652 69.1 70.8 63.9 30.9 29.2 36.1 33,406 50,029 41 683 16,223 60.2 58.2 67.3 39.8 41.8 32.7
171,695 89,334 110:857 65,977\ 84.5 74.5 72.2 15.5 25.5 27.8
necticut, Maryland, Massachusetts, and New Jersey; and 80 per cent or more of the telephones in Arizona, California, Delaware, Louisiana, Montana, New Hampshire, New York, and Utah. The Bell System has reported a larger percentage of the total number of telephones for the 'country as a whole and for a majority of the separate

" ji
82 ELECTRICAL INDUSTRIES: 1917.
states at each successive census period. Only 16 of the states disclosed a smaller peroentage of telephones under the control of the Bell System in 1917 than in 1912, and in only 10 of the states was the percentage of telephones controlled by the Bell System smaller in 1917 than in 1907. Practioally every one of the important manufacturing and agricultural states of the East and Middle West shows a steady increase in the proportion which the telephones oontrolled by the Bell System constitute of the total for the state and a corresponding decrease in the proportion of telephones controlled by all other systems. In a few states the increase in the proportion of the telephones controlled by the Bell System was particularly marked. In Montana, for example, the Bell Telephone System controlled less than half the telephones reported.in 1912, while in 1917 it controlled four-fifths of them. In California, Idaho, Illinois, Iowa, and West Virginia the proportion of telephones oontrolled by the Bell System was much greater in 1917 than in 1912. In some cases these increases were due to the consolidation with the Bell System of companies formerly under other ownership. In other cases the advance was due to the much more rapid expansion of the Bell System than that of the other systems.
No decreases in the number of telepnones reported by the Bell System are recorded ~n any state for the decade 1907 to 1917 or for either of the five-year periods comprising it. A number of the states, however, show decreases for the d~cade in the number of telephone,s reported by the other systems, some of these decreases being particularly noticeable, as for example, those in Arizona, Maryland, and Utah.
Telephone8 connected with the Ben System.-.-:..The census schedule used in 1912 contained an inquiry ·designed to determine the number of telephones on. the wires of non-Bell companies that were connected with the Bell, Telephone System for the ~xchange of traffic. So many telephones secured Bell service indirectly, however, that it was found practioally
impossible to obtain an aocurate answer to this inquiry from the non:-Bell companies, the data secured from them being at considerable variance with the number of such telephones which were reported by the Bell Telephone System as connected with its exchanges for telephone service. As the Bell System has better facilities for securing accurate data of this character, the inquiry regarding this information was omitted from the schedule for 1917 and the figures furnished by the Bell Company for 1912 and 1917 are used in in this discussion. The Bell Telephone System reported in 1917 that in addition to the 7,326,858 Bellowned telephones there were 3,164,902 telephones of all other: systems which were connected with Bell lines and exchanges for the interchange of local and long-distance service, making a total of 10,491,760 telephones. Although the 3,164,902 connected telephones were neither Bell owned nor Bell controlled they should be reckoned as a part of the Bell System when considering the soope of the service afforded by the American Telephone & Telegraph Co. and its associated companies. In 1912, in addition to the 5,087,027 Bell-owned telephones, there were 2,369,047 independently owned telephones which either directly or indirectly secured Bell service connections. In other words, there were only 1,224,760 telephones, or 10.5 per cent of the total telepho~es ~ the country, in 1917, and 1,273,518 telephones, or 14.6 per cent of the total, in 1912, which had no opportunity to secure the benefits afforded by physical connection with the Bell Telephone System.
Mile8 of wire.-Table 23 s40ws, by geographic divisions and states, the numbHr of miles of wire reported by the Bell Telephone System and by all other systems at the censuses of 1917 and 1912. The table also shows the per cent which the number of miles of wire reported by the Bell System and that reported by the other systems constituted of the total for each state at each census year, and also the per cent of increase for the five-year period, 1912 to 1917 for the Bell and for all other systems.

TELEPHONES. 33
Table 23 .ALL SYSTEMS .A.ND LINES-MILES OF WIRE.
I Per cent of total.
DIVISION .A.ND ST.A.TE~ Total. Bell Telephone System. All other systems. Per cent of increase: 1
Bell. Another. 1912-1917.
1917 1912 1917 1912 1917 1912 1917 1912 1917 1912 Bell. All other.
------ ------UNITED ST.A.TES ......•.•.•........... 28,827,188 20,248,326 23,133,718 15,183,186 5,693,470 5,115,140 80.2 74.7 19.8 25.3 52.9 11. 3 GEOGR.A.pmc DMSIONS: ------
New England .......................... 2,3M,580 1,545,252 2,333,679 1,498,417 49,901 46,835 97.9 97.0 2.1 3.0 55.7 6.5 Middle Atlantic ........................ 7,338,055 5,035,019 6,588,839 4,227,908 749,216 807,111 89.8 84.0 10.2 16.0 55.8 -7.2 ast North CentraL .................. 7,137,419 4,645,218 5,317,369 3,006,320 1,820,050 1,638,898 74.5 64.7 25.5 35.3 76.9 11.0 West North CentraL .................. ~outh Atlantic .........................
3,934,372 2,932,578 2,291,458 1,636,056 1,642,914 1,296,522 58.2 55.8 41. 8 44.2 40.0 26. 7 1,735,286 1,121,458 1,438,272 886 897 297,014 234,561 82.9 79.1 17.1 20.9 62.2 26.6 ast South Central ••...• , •.....•...... 1,107,025 977,694 808,030 662;218 298,995 315,476 73.0 67.7 27.0 32.3 22.0 -5.2 West South CentraL .................. 1,912,756 1,312,553 1,471,474 971,439 441,282 341,114 76.9 74.0 23.1 26.0 51.5 29.4 ~~~~~~:::::::::::::: :,::::::::::::::: 725,512 558,450 660,211 498,564 65,301 59,886 91.0 89.3 9.0 10.7 32.4 9.0 2,553,183 2,1:;10,104 2,224,386 1,745,367 328,797 374,737 87.1 82.3 12.9 17.7 27.4 -12.3 NEW ENGLAND: ------
Naine .................................. 176,983 141,687 159,658 124,749 17,325 16,938 90.2 88.0 9.8 12.0 28.0 2.3 ¥ ew HampShire ....................... 110,691 75,917 102,702 69,686 7,989 6,231 92.8 91. 8 7.2 8.2 47.4 28.2 ermont ............................... 67,355 54,756 52,078 41,503 15,277 13,253 77.3 75.8 22.1 24.2 25.5 15.3 Massachusetts .• " •..•.•....• ; ......... 1,353,251 863,426 1,346,082 854,894 7,169 8,532 99.5 99.0 0.5 1.0 57.4 -16.0 ~~:ctf~~~::::::::::::::::: ::::::::: 161,075 lO2,906 161,075 102,906 ······2;i4i' · .... ·i;ssr 100.0 100.0 .... 0:4· .. · .. 0:6· 56.5 · .. ·ia:8 514,225. 306,560 512,084 304,679 99.6 99.4 6&1
MIDDLE ATLANTIC:
~:i;;I~~i~::::::::::::::::::::::::: : 4,154,657 2,790,060 3,893,741 2,565,015 260,916 225,045 93.7 91.9 6.3 8.1 51.8 15.9 1,002,075 644,984 974,525 579,281 27,550 65,703 97.2 89.8 2. " 10.2 68.2 -58.1 2,181,323 1,599,975 1,720,573 1,083,612 460,750 516,363 78.9 67.7 21.1 32.3 58.8 -10.S
EAS6Ii'f0RTH CENTR.A.L: 1,906,635 1,161,032 1,200,538 623,307 706,097 537,725 63.0 53.7 37.0 46.3 92.6 31.3
i~LEE/Ej.:EY 933,261 667,839 608,998 378,492 324,263 289,347 65.3 56.7 34.7 43.3 60.9 12.1 2,564,910 1,689,074 2,205,636 1,204,666 359,274 484,408 86.0 71. 3 14.0 28. 7 83.1 -25.8 1,072,651 728,184 810,646 524,172 262,005 204,012 75~ 6 72. ° 24.4 28.0 54.6 28.4
659,962 399,089 491,551 275,683 168,411 123,406 74.5 69.1 25.5 30.9 78.3 36.5 WEST NORTH CENTRAL:
Minnesota ••..••...•.•....•...•....•••. 1,058,989 653,479 634;589 ~~~,~~ 424,400 279,746 59.9 57.2 40.1 42.8 69.8 51.7
~~i~i~H:::HEEH: 650,513 504,101 455,309 195,204 207,317 70.0 58. 9 30.0 41.1 53.4 -5.8
1,119,048 874,334 597,286 491, 739 521,762 381,595 53.4 56.4 46.6 43.6 21.2 36.7 105,820 76,174 59,499 43180 46,321 32,994 56.2 56.7 43.8 43.3 37.8 40.4 104,208 73,921 26,097 11, 177 78111 56,744 25.0 23.2 75.0 76.8 51. 9 37.6 448,807 393,319 229,041 195,615 219:766 197,704 51.0 49.7 49.0 50.3 17.1 11. 2 Kansas ................................ 446,987 357,250 289,637 216,828 157,350 140,422 64.8 60.7 35.2 39.3 33.6 12.0
SOUTH ATL.A.NTIC: Delaware .............................. 75,196 48,632 67,615 40838 7,581 7,794 89.9 84.0 10.1 16.0 65.6 -2.7 Maryland .............................. 354,588 228,744 351,682 223: 170 2,906 5,574 99.2 97.6 0.8 2.4 57.6 -47.9 District of Columbia ..... , ..... '" ...•. 162,032 126,279 162,032 126,279 · .... «;947· .... ·28;300· 100.0 100.0 "'i6:6' 28.3 .... 58:8 *!!;~~~~~~i:~::::::::::::::: :::::::: 271,549 161,136 226,602 132,827 83.4 82.4 17.6 70.6
179,387 112,954 142,580 64,255 36,807 48,699 79.5 56.9 20.5 43.1 121.9 -24.4 148,348 109,110 90,150 65,356 58,198 43,754 60.8 59.9 39.2 40.1 37.9 33.0
South Carolina .. '" .................... 97,916 73,712 81,718 58,848 ~'i~ 14,864 83.4 79.8 16.5 20.2 38.9 9.0
~r~:i~:::::::::::::::::::::::::::::::: : 314,273 206,591 249,850 149,889 56,702 79.5 72.6 20.5 27.4 66.7 13.6 131,997 54,300 66,043 25,435 65: 954 28,865 50.0 46.8 50.0 53.2 159.6 128. 5
EAST SOUTH CENTRAL:
¥:~~~~: :::::::::::::::::::::::::::: 386,107 352,544 211,603 199,151 174,504 153,393 54.8 56.5 45.2 43.5 6.2 13.8 368,678 287,685 299,697 232,979 68,981 54,706 81.3 81. 0 18.7 19.0 28.6 26.1
Alabama. ...•....•........••...•.••.•.. 206,585 152,849 175,096 130,168 31,489 22,681 84.8 85.2 15.2 14.8 34.5 38.8 Mississippi .............................. 145,655 184,616 121,634 99,920 24,021 84,696 83.5 54.1 16.5 I 45.9 21. 7 -71.6
WEST SOUTH CENTR.A.L:
t~~~~~~a.:::: ::~:::::::::::::::::::::: 170,105 141,014 132,498 111,623 37,607 29,391 77.9 79.2 22.1 20.8 18.7 28.0 196,917 138,905 184,637 1~,434 12,280 5,471 93.8 96.1 6.2 . 3.9 38.4 124.4
Oklahoma ............................. 334,533 211,175 269,750 160,576 64,783 50,599 80.6 76.0 19.4 24.0 68.0 28.0 Texas .................................. 1,211,201 821,459 884,589 565,806 326,612 255,653 73.0 68.9 27.0 31.1 56.3 27.8
MOUNTAIN: Montana ...••.•.....•...••............. 94,666 54,259 82,218 80,652 f2448 23,607 86.9 56.5 13.1 43.5 168.2 -47.3 Idaho ............. : .................... 81,745 58,205 70,037 50,191 11;708 8,014 85.7 86.2 14.3 13.8 39.5 46.1
~lg~~~~~::·.:·.:::::::::::: ::::::::::: 30,435 20,368 24,320 15,634 6,115 4,734 79.9 76.8 ZO.1 23.2 55.6 29.2 312,326 261. 987 299,655 253,518 12,671 8,-469 95.9 96.8 4.1 3.2 18.2 49.6
New Mexico ........................... 31,963 22,492 25,762 19,648 6,201 2,844 80.6 87.4 19.4 12.6 31.1 118.0 Arizona ................................ 39,455 18,·621 36,38S 16,669 3,067 1,952 92.2 89.5 7.8 10.5 118.3 57.1 Utah .................................. 120,938 112,726 115,555 108,316 5,383 4,410 95.5 96.1 4.5 3.9 6.7 22.1 Nevada ................................ 13,984 9,792 6,276 . 3,936 7,708 5,856 44.9 40.2 55.1 59.8 59.4 31. 6
PACIFIC: Washington. '" ................ " ..... 429,718 487,Q79 358,883 429,025 70,835 58,054 83.5 88.1 16.5 11.9 -16.4 22.0 Oregon ................................ 275,191 272,481 189,083 186,103 86,108 _ 86,378 68. 7 68.3 31.3 31. i 1.6 -0.3 California .............................. 1,848,274 1,360,544 1,676,420 1,130,239 171,854 230,305 90.7 83.1 9.3 16.9 48.3 -25.4
1 A minus sign (-) denotes decrease.
The states in which the Bell Telephone System predominated most largely in number of telephones are in practically all cases the states in which it was most important in wire mileage. IIi Rhode Island and the District of Columbia the Bell Syste~ owned all the wire and telephones reported and in every other state in the Union the proportion
139074°~19----3
which the Bell wire mileage represented of the total wire mileage exceeded the proportion which the Bell telephones constituted of the total number of tele-. phones. There were 12 states in which the Bell System reported more than nine-tenths of the "total wire mileage and 12 other states in which the Bell wire constituted more than four-fifths of the total.

34 ELECTRICAL INDUSTRIES: 1917.
Exchange and tol~ circuits.-Table 24 shows the miles of wire for 1917 and 1912, classified as to overhead and underground and as to exchange and toll circuits, and distinguishes the Bell System and all other systems.
Percentages are also given showing the part of the total each class of wire constituted in each year and the' per cent of increase from 1912 to 1917. .
TabJe24 ALL SYSTEMS AND LINES-MILES OF WIRE ON EXCHANGE AND TOLL cmCUITS.
Total. Overhead. Underground. Per cent oHotal. Per cent of increase : 1 lIU2-1917.
Overhead. Underground. 1917 1912 1917 1912 1917 1912 Total. Over- Under-
1917 1912 1917 1912 head. ground.
- ._-------All circuits ..•...... " ...... 28,827,188 20,248,326 13,978,008 11,083,338 14,849,180 9,164,988 48.5 54.7 51.5 45.3 42.4 261 62.0
Bell Telephone System. 23,133,718 15,133,186 9,503,860 7,163,108 13,629,858 7,970,078 41.1 47.3 58.9 52.7 52.9 329 71.0 All other systems. _ ..... 5,693,470 . 5,115,140 4,474,148 3,920,230 1,219,322 1,194,91.0 78.6 76.6 21.4 23.4 11. 2 14.1 2.0
Exchange circuits ................ 25,252,276 17,565,110 11,393,178 8,876,594 13 859,098 8,688,516 45.1 50.5 54.9 49.5 43.8 28.3 59.5 Bell Telephone System.; ..... 19,962,997 12,882,826 7,321,319 5,385,826 12:641,678 7,497,000 36.7 41. 8 633 582 55.0 35.9 68.6 All other systems _ •. ~ .•. , _ •.. 5,28~,279 4,682,284 24,.071,859 23,400,768 1,217,420 1,191,516 77..0 74.6 23 . .0 25.4 12.9 16.6 2.2
Toll circuits ..................... , 3,574,912 2,683,216 2,584,830 2,206,744 '900,.082 476,472 72.3 82.2 27.7 17.8 33.2 17.1 107.8 Bell Telephone System ....... 3,170,721 2,250,360 2,182,541 1,777,282 988,180 473,078 68.8 79.0 31.2 21.0 4.0.9 22.8 108.9 All other systems ......... " : 404,191 432,856 402,289 429,462 1,902 3,394 99.5 99.2 .05 0.8 -6.6 -6.3 -44 • .0
1 A minus sign (-) denotes decrease. . 2 Includes 1,529,162 miles of wire in 1917, and 1,228,935 miles of wire in 1912, operated by systems reporting annual incomes of less than $5,000, .for which no segregation
into "overhead" and "underground" was made.
The tendency to adopt underground circuits is becoming very general. The census of 1917 showed for the first time a greater proportion ~f the telephone wire underground than overhead. In 1912 more than half the wire reported by the Bell Telephone System was underground, but the proportion of underground wire reported by the other systems was so small that the total of tho undergound wire was reduced to considerably less than half of the total of all wire. The amount of underground wire reported by the nonBell systems in 1917 was only slightly greater than that reported by these systems in 1912, and its proportion of the total of all wire reported by the nonBell systems was actually less than in 1912. This is due in part to the fact that several large non-Bell systems in 1912 appear in the Bell totals in 1917. The large increase in underground wire reported by the Bell System more than made up the difference, so that underground wire in 1917 represented 51.5 per cent of the total telephone wire for the entire country.
As might naturally be expected, most of the underground wire is' on the exchange circuits. The underground wire on toll circuits, however, is increasing both actually and relatively. The amount of underground wire on toll circuits was more than twice as great in 1917 as in 1912, and represented 27.7 per cent of the total wire on toll circuits in 1917, as compared
with 17.8 per cent five years earlier. Practically all of the underground wire on toll circuits was reported by the Bell Telephone System.
All of the wire reported by systems or lines having' annual incomes of less than $5,000 was classed as overhead wire on exchange circuits. Small amounts of this wire may have been underground or may have been overhead toll wire. No report was required from these small systems regarding the use of the wire (whether on exchange or toll circuits) or the location of the wire (whether overhead or underground). To the extent that these small lines or systems possessed any underground wire or u~ed any of their wire for toll purposes, the statisti9s for overhead wire on exchange circuits as shown in Table 24 are overstated and those for toll wire and for underground wire on exchange circuits are understated. It is believed, however, that very little of the 1,529,162 miles of wire reported by these organizations in 1917 is other than overhead wire used for exchange purposes.
Messages 01' talks.-Table 25 presents the estimated number of local exchange and long-distance or toll messages for the Bell System and for all other systems, by geographic divisions and states, for 1917. The table also shows the percentage which each class of messages forms of the total for each group and the number of messages per telephone per day. "

TELEPHONES. 35
Table 25 ALL SYSTEMS AND LINES-ESTIMATED NUMBER OF MESSAGES OR TALKS: 1917.
Bell Telephone System. All other systems. Total per telephone per day.l
DIVISION AND STATE. I Percent of Per cent of
total. total.
Total. Local Long-distance Local Long-distance exchange. or toll. Total. Bell. All
Lo- Long- exchange. orton. Long- other. dJs- Lo- dis-cal. tance. cal. tance,
17,166,468,146 ----
UNITED STATES .............. 14,597,567,869 14,236,304,195 361,263,674 97.5 2.5 7,248,154,466 81,686,320 98.9 1.1 6.1 5.1 GEOGRAPIDC DIVISIONS:
._---New England .................. 1,422,096,019 1,370,949,746 51,146,273 96.4 3.6 93,429,961 91,906,238 1,523,723 98.4 1.6 5.3 5.6 Middle Atlantic ...•.•••........ 3,048,376,143 2,891,274,327 157,101,816 94.8 5.2 830,187,523 816,498,890 13,688,633 98.4 1.6 4.8 5.2 East North Central .•...••••.•.. 3,446,429,322 3,405,211,267 41,218,055 98.8 1.2 2,471,486,557 2,439,641,269 31,845,288 98.7 1.3 6.2 5.3 West North Central. •••••.•...• 1,769,059,036 1,744,700,720 24,358,316 98.6 1.4 2,020,111,063 2,001;909,076 18,201,987 99.1 0.9 7.0 4.6 South Atlantic ....•.•..•..•..•• 1,162,389,682 1,140,222,035 22,167,647 98.1 1.9 410,440,093 407,180,890 3,259,203 99.2 0.8 7.1 5.3 East South Central.. ..•. '" .•.• 712,419,551 703,526,224 8,893,327 98.8 1.2 396,717,939 394,341,067 2,376,872 99.4 06 9.9 5.7 West South Central ..••.•.. " .. 1,215,128,814 1,196,817,446 18.311,368 98.5 1.5 604,688,151 598,956,903 5,731,248 99.1 0.9 9.9 5.1 Mountain ...................... 470,358,992 460,077,634 10,281,358 97.8 2.2 64,453,870 63,545,438 908,432 98.6 1.4 5.6 4.0 Pacific ......................... 1,351,310,310 1, 323, 524, 796 27,785,514 97.9 2.1 356,639,309 352,488,375 4,150,934 98.8 1.2 6.0 5.6 --NEW ENGLAND: Maine .......................... 132,875,368 128,720,588 4,154,780 96.9 3.1 19,325,840 18,911;,171 410,669 97.9 2.1 5.9 3.2 New Hampshire ......•••.•.•.. 76,609,860 73,788,576 2,821,284 96.3 3.7 15,058,263 14,992,223 66,040 99.6 0.4 5.1 7.0 Vermont ....................... 62,538,789 60,778,970 1,759,819 97.2 2.8 46,536,775 45,682,288 854,487 98.2 1.8 6.6 7.6 Massachusetts ................ ;. 790,769,936 762,902,223 27,867,713 96.5 3.5 10,059,024 9,947,365 111,659 98.9 1.1 5.2 6.1 Rhode Island .................. 105,594,600 101,031,463 4,563,137 95.7 4.3 •• .. ·2;450;059· .. ···2;369;i9i' ·•·• .. ··80;868· '96:7' "3:3' 5.0 ""4:6 Connecticut •••••••••••••••••••• 253,707,466 ~,727,926 9,979,540 96.1 3.9 0.3
MIDDLE ATLANTIC:
~~: le~~~y::: ::::::: :::::::::: 1,874,569,218 1,794,536,908 80,032,310 95.7 4.3 279,063,658 274,531,480 4,532,178 98.4 1.6 5.6 4.9 321,069,284 277,107,368 43,961,916 86.3 13.7 18,728,149 17,669,943 1,058,206 94.3 5.7 4.1 3.5
Pennsylvania .................. 852,737,641 819,630,051 33,107,590 96.1 3.9 532,395,716 524,297,467 8,098,249 98.5 1.5 4.7 5.5
EAST NORTH CENTRAL:
~~~:n~:::::::::::::::::::::::: 811,133,362 803,645,994 7,487,368 99.1 0.9 934,467,484 923,986,580 10,480,904 98.9 1.1 6.5 6.2 414,489,826 409,972,583 4,517,243 98.9 1.1 473,359,072 467,846,400 5,512.672 98.8 1.2· 7.2 5.2
i~~~.::::::::::::::::::::: 1,284,045,272 1,265,650,880 18,394,392 98,6 1.4 519,281,833 510,792,479 8,489,354 98.4 1.6 5.4 4.6
603,254,645 597,075,320 6,179,325 99.0 1.0 296,575 452 293,261,615 3,313,837 98.9 1.1 7.1 5.3 333, 506,217 328,866,490 4,639,727 98.6 L4 247,802: 716 243,754,195 4,048,521 98..4 1.6 6.0 4.2
WE~T NORTH CENTRAL:
5r:r:~~::::::::::::: ::::::::: 400,759,906 395,007,670 5,752,236 98.6 1.4 328,319,823 324, 658, 542 3,661,281 98.9 1.1 7.1 4.3 446,150709 440, 134,886 6,015,823 98.7 1.3 362,446,46/1 359,081,336 3,365,130 99.1 0.9 7.0 3.8 414,275; 775 409,351,435 4,924,340 98.8 1.2 588,765, 103 584,753,113 4,011,990 99.3 0.1 7.2 5.4
North Dakota .................. 49,267,738 48,052.682 1,215,056 97.5 2.5 00,128,262 59,333,997 794265 98..7 1.3 5.3 4.0 South Dakota ... ; .• , ........... 23,726,233 23,194,510 531,723 97.8 2.2 102,847,760 101,369,946 1,47'1.814 98.6 1.4 5.6 4.2
if=~~·.::::::::::::::: :::::: 193,880,250 191,742,044 2,138,206 98.9 1.1 297,276,764 294,147,950 3,128,814 98.9 1.1 7.1 5.6 240,998,425 237,217,493 3,780,932 98.4 1.6 280,326, 885 278,564,192 l,762,693 99.4 0.6 6.7 4.6
SOUTH ATLANTIC:
~r~'f:~t:: ::::::::::::::::::: 32,413,368 31,387,812 1,025,556 96.8 3.2 4,586,075 4,562,375 23,700 99.5 0.5 5.2 4.7 182,336,086 173,176',750 9,159,336 95.0 5.0 3,898,200 3,880,200 18,000 99.5 0.5 4..9 3.3
D~~i~t of Columbia ..•.....•.. 111,132,636 109,892,280 1,240,356 98.9 1.1 ····67;864;002· ····67;400;Mi· ··· .. ··m;4if '00:4" ··0:6' 4.8 "'4:7 VlfgIIlla ........................ 184,614,180 183,072,708 1,541,4.72 99.2 0.8 7.6 West Virginia ..•.••.•.•.....••• 99,424,260 97,418,832 2,005,428 98.0 2.0 52,940,029 52,447.167 492,862 ·99.1 0.9 5.7 3.5 North Carolina •••....•.••..••.• 121,161,791 119,279,594 1,882,197 98.4 1.6 96,153,561 95,062,649 1,000,912 98.9 1.1 9.2 5.7 South Carolina ........ '" ...... 85,M2,188 84,282,015 1,270,173 98.5 1.5 25,330,255 25,246,925 83,330 99.7 0.3 9.7 4.7
~igti~~:.:: :::::::::::::::: ::::: 270,448,693 267,049, 826 3,398,867 98.7 1.3 87,175,542 86,611,202 564,340 99.4 0.6 10.5 5.9 75,306,480 74,662,218 644,262 99.1 0.9 72,492,429 71,879,831 612,598 99.2 0.8 11.1 8.0
EAST SOUTH CENTRAL: 7.0 ~:::~:~::: ::::::::::::::::: 150,585,760 148,953,931 1,631,829 98.9 1.1 231,030,178 229,529,801 1,500,377 99.4 0.6 7.5
282,396,639 279,986,742 2,409,897 99.1 0.9 96,797,653 96,390,725 406,928 99.6 0.4 11.1 4.8 Alabama ....................... 162,491,571 160,580,375 1,911,196 98.8 1.2 36,601,874 36,185,166 416,708 98.9 1.1 10.5 3.8 Mississippi. .................... 116, 945, 581 114,005,176 2,940,405 97.5 2.5 32,288,234 32,235,375 52,859 99.8 0.2 10.2 4.6
WEST Soum CENTRAL: 4.5 Arkansas ....................... 140,232,812 138,512,994 1,719,818 98.8 1.2 67,291,204 66,600,939 690,265 99.0 1.0 10.3
Louisiana .................... ~. 188, 164,883 185,409,794 2,755,089 98.5 . 1.5 11,453,637 11,257,255 196,382 98.3 1.7 10.7 3.6 Oklahoma ...................... 278,700,444 273,125,760 5,574,684 98.0 2.0 125, 366, 726 124,297,411 1,069,315 99.1 0.9 9.6 4.4 Texas ••••••...••.....•.•..•.•.• 608,030,675 1199,768,898 8,261,777 98.6 1.4 400,576,584 396,801,298 3,775,286 99.1 0.9 9.8 5.6
MOUNTAIN: 5.2 4.5 Montan.a ....................... 70,017,426 68,364,402 1,653,024 97.6 2.4 15,022,169 14,936,410 85,759 99.4 0.6
Idaho .......................... 50,415,840 49,117,920 1,297,920 97.4 2.6 9,550,695 9,451,445 99,250 99.0 1.0 5.9 2.7 Wyoming .................•.... 27,339,564 26,836,800 502,764 98.2 1.8 4,704,410 4,676,335 28,075 99.4 0.6 7.1 3.7 Colorado ....................... 179,741,462 175,409,824 4,331,638 97.6 2.4 11,523,845 11,356,515 167,330 98.5 1.5 5.2 4.0 New Mexico .................... 22,766,208 22,364,004 402,204 98.2 1.8 6,047,815 5,994,575 53,240 99.1 0.9 6.2 4.6 Arizona ........................ 18,393,972 17,891,208 502,764 97.3 2.7 3,529,482 3,400,550 128,932 96.3 3.7 3.6 4.5 Utah ........................... 95,437,104 93,928,812 1,508,292 98.4 1.6 7,237,133 7,106,877 130,256 98. 2 1.8 7.0 4.6 Nevada., ...................... 6,247,416 6,164,664 82,752 98.7 1.3 6,838,321 6,622,731 215,590 96.8 3.2 5.2 4.2
PACIFIC: 4.5
~~~~~~::::::::::::: ::::::: 269,790,654 266,727,999 3,062,655 98.9 1.1 84,356,341 83,347,186 1,009,155 98.8 1.2 6.4 152,788,795 151,076,115 1,712,680 98.9 1.1 79,150 215 78,150,564 999,651 98.7 1.3 6.2 4.9
California ...................... 928.730,861 905,720,682 23,010,179 97.5 2.5 193,132: 753 190,990,625 2,142,128 98.9 1.1 5.9 6.7
1 Computed on the basis of 325 days to the year.
Although the number of toll messages in 1917 represented only 2.2 per cent of the total number of calls for systems reporting annual incomes of $5,000 or more (see Table 16), the toll calls reported by the Bell System represented 2.5 per cent of the total for the
Bell System, while the toll calls reported by the other systems represented only 1.1 per cent of the total calls
'reported by these systems. In considering these figures reference should be made to the defect inherent
, in the statistics of messages, described on page 24.

86 ELECTRICAL INDUSTRIES: 1917.
Public exchanges.-In addition t<? the number of telephones and the miles of wire, the number of public exchanges or central offices is a significant index of the importance of the telephone industry.· Table 26 presents, by geographic divisions and states, for 1917, 1912, 1907, and 1902, the numbers of public exchanges
distinguishing the nell System and all other syst"ems and further showing separately for all other systems those reporting annual incomes of $5,000 or more and less than $5,000, for each year for which this segregation can be made.
Table 26 ALL SYSTEMS AND LINES-NUMBER OF PUBLIC EXCHANGES.
I Total. Bell Telephone System.
'--;----.----.--11---;---;----.---1----.------.....,-_ All other systems.
DIVISION AND STATE.
Total. Reporting annual Reporting an
incomes of $5,000 nual incomes 191'7 1912 1 1907 1902 191'7 1912 1907 1902 or more. ofless than
$5,000.
1917 1912 1 1907 19021'1911f 1912 1907 1917 2 1907
UNITED STATES •••••••••••••••••••• 21,175 11,515 15,527 10,361 6,28815,853 5,418 3,753 14,887 5,662 10,109 6,6081 6,006 5,662 5,195 8,881 4,914
= == ==- =====--===--GEOGRAl'IDC DIVISIONS: New England ..•.•.•••.....•.• ~ ••••.. Middle Atlantic ................... , .. East North Central .................. . West North Central ••••..........•... South Atlantic ••••••••. ; ...........•. East South Central •••......•.•...•... West South Central ••• ~ " ........... . Mountain .......................... .. p8C1f\.c .............................. .
NEW EliGLA.ND: Maine .............................. .. New Hampshire ..................... . Vermont ............................. . Massachusetts .................. '" .. . Rhode Island ............... " ..... .. Connecticut ....... " ................ .
MIDDLE ATLANTIC: '.
910 2,410 4,846 5,007 1,886 1,673 2,425
772 1,246
244 133 147 275 28 83
New york.... ........................ 970 New Jersey .......... "................. 193 Pennsylvania ........................ 1,247
EAST NORTH CENTRAL: Ohio ................................. 1,173 Indiana. • • • .. ..• . .. ... . ..•. . . . . . . . .. 958 Illinois............................... 1,362 Michigan .. '. . . . . . . .. .. .. . ... . .. ..... 710 Wisconsin... . .. . . . . . . . . . . . . . .•.••... 643
WEST NORTH CENTRAL: Minnesota ...•....................... Iowa ................................ . Missouri ............................ . North Dakota .......... ~ ........... . South Dakota .. ' ........ ' ........•.. Nebraska •.............. , .........•.. Kansas ............................. .
SOUTH ATLANTIC: Delaware ..••.. , ......•.....•........ Maryland ................ _ ......... . District of Columbia .•...............
Woe!~~~:~: :::: ::::::::::::::::: South Carolina ..•................... Georgia ...•.•..... , .................. . Florida ............................. .
EAST SOUTH CENTRAL:
729 1,129 1,g~
339 561 849
23 134
7 337 314 345 175 421 130
731 1,862 2,858 2,~~
746 948 504 874
912 2,137 4,014 3,408 1,241
915 1,389
513 998
599 1,731 3,143 2,069
791 525 619 250 634
633 1,011
942 838 586 569 619 428 662
167 98
107 257 29 73
243 139 167 274
112 128 87 94
103 49 233 257
~} 64 { 28 77
705 896 186 222 971 1,019
802 1,039 484 796 772 1,137 501 604 299 438
363 442 379 171 186 363 305
453 751 650 212 255 507 580
713 246 772
757 621 912 511 342
246 710 482 49
103 220 259
19 109
7 1G8 139 115 #
18 } { 15~ 114
2e9 139
65 169 52
284 180 198 125 107 82 198 113 67 38
459 144 408
220 144 268 209 101
123 214 113 110 41
104 133
22 122
7 76 81 71 58
125 24
625 1,001
967 640 464 553 600 397 606
126 87 61
253 29 69
476 137 388
234 160 237 232 104
112 i28 119 59 29 97 96
18 88 7
54 55 65 52
115 10
643 938 971 460 406 509 409 318 764
473 946 699 245 138 286 186 184 596
277 1,.399 3,904 4,169 1,300 1,104 1,~
584
106 861
1,891 1,569
319 193 348 107 268
269 1,199 3,043 2,948
835 406 980 195 234
158 80 116 41 85 101 75 39 11 38 53 39 98 46 114
250 221 18 4 24
126 785
2,444 1,824
653 239 433 66 38
137 886
1,996 1,611
349 199 423 134 271
106 89 861 749
1,891 1,744 1,569' 1,461
319 293 193 193 348 407 107 117 268 142
140 513
1,908 2,558
951 90S
1,383 210 313
180 450
1,299 1,487
542 213 573
78 92
32 4'7 41 M 69 51 12 11 11 5 22 33 64 61 46' 38 37 76
~g} 58 {'''-S- 4 .. • .. s·} 12 9 4 9 9 15
6 {-"'a- 4 3 .... "3" ·····-5
414 144 380
259 163 242 217
90
91 73 91 22 10 f8 75
18 } 98 6
43 48 50 54 81 8
408 175 363
511 49
839
158 953 91 814
177 1,094 185 501 88 542
23 68 41
4 9
77 23
606 915 902 275 298 457 716
229 49
583
568 324 535 269 195
251 314 260 112 157 266 209
482 78
639
780 633 895 387 348
362 678 559 190 245 409 505
34 t.'.:~ ..... ~~.} 56 14 261 54 166 27 233 84 236 7 274 50 148
15 117 13 53 33 296 54 117 8 106 42 59
305 71
409
599 530 735 326 254
223 642 441 45 94
143 236
262 229 39 49
585 583
59'1 332 528 2815 25<1
281) 261 27~7 116 172 272 228
568 324 535 269 195
251 314 260 112 157 266 ~09
271 51
427
546 300 511 255 132
185 367 222
91 157 256 183
249 10
254
356 482 566 216 288
321 654 625 159 126 185 488
211 27
212
234 333 384 132 216
177 311 337 99 88
153 322
80 { i 2i 3i ····io·} 21
125 '''68' .... 54" 34 . "ilia' 132 153 41 84 1:23 186 113 118 70 50 20 204 128 67 13 13 12 104 41 80 94 54 48 202 69 30 54 42 21 52 38
Kentucky ......................... .. Tennessee .......................... .
572 278 342 203 508 221 261 158
181 175 166 96 391 103 176 . '107 115 103 89 276 87 53 33 40
Alabama ........................... . MissiSSippi. ..••..••.................
WES'l' SOUTH CENTRAL: Arkansas ........................... . Louisiana •..•................•...... Oklahoma .......................... . Texas ••••.••............ : ........•..
MOUNTAIN: Montana ............................ . Idaho .............................. .
~~~~.~::::::::::::::::::::~::::::: Colorado .••.......................... New Mexico ......................... . .,Arizona ............................. . Nevada ............................. .
PACIFIC:
283 91 135 69 167 163 144 86 81 83
310 156 177 95 135 134 116
368 170 594
1,293
132 139
61 75
208 65 55 37
138 113 175 522
92 84 25 49
164 31 32 27
241 105 294 749
123 60
102 334
99 104 149 267
54 32 77 100 33 64
!~} 36{ ~~ 158 96 158
41 12 28 38 30 32 26 11 7
100 106 115 279
47 68 2ti 40
158 27 27 5
42 63
111 193
32 51 19 } 46
130 15 14 11
95 341 58 117 63 48 58 64 293 31 197 10 52 38 21 10 19 176 64 175 22 61 31 15 22 21 160
19 269 45 66 4 445
118 1,026
19 55 28 75 35 { 37
37 80 50
2 37 12 23 8 30
38 7
60 243
199 42
183 556
45 22 16 49
..... g.} 31
6 28 4 26 5 24
22 15
104 15 98
216
51 19 77
276
13 13 5 34 1 { 7 20
16 8 10 12 18 15 3 25
38 7
60 243
87 22 46
252
45 13 16 38
9' ····is· 6 14 4 11 5 14
22 12
218 47
368 750
42 41 30 } 17 42 25 8 5
Washington.......................... 308 211 247 Oregon. .............................. 269 122 206
140 118 376
112 89
461
119 173 135 196 92 74 51
109
78 60
133
92 45
131
50 20 72
118 120 75 California ........................ _ . . . 669 541 545
77 155 99 410 436 362
180 45 208 131
1 Not reported for systems having incomes ofless t'J.an 55,000. 2 Number of systems reporting exchanges, actual number of exchanges not reported.
112 20
137 304
9 11 16 14 15 10 3
24 31 37

TELEPHONES. 37
The total number of public exchanges reported at each of the last three census periods has been about the same for the Bell Telephone System and the independent systems reporting annual incomes of $5,000 or more. A larger number of telephone exchanges, however, than reported by either the Bell or the larger non-Bell systems was operated by the small systems (those having annual incomes of less than $5,000); 8,881 of these systems reported that they operated exchanges in 1917. As explained elsewhere, these small systems were not required to report the number of exchanges that they operated; consequently, the actual number of exchanges operated by such systems is undoubtedly somewhat larger than 8,881. No statistics regarding the number of exchanges operated by the small telephone systems were obtained in 1912, but in 1907 the number of such exchanges was smaller than that reported either by the Bell Telephone System or by the larger non-Bell systems. In other words, the increase in the number of telephone exchanges in the country has been considerably more rapid during the decade 1907 to 1917 for the small systems than for either the Bell Telephone System or the large non-Bell systems.
A comparison, by geographic divisions, of the number of exchanges reported by the Bell System in 1917 with the number reported by all other systems shows that the number of Bell exchanges exceeded the number of all other exchanges in New England and in the Mountain and Pacific divisions. Only one of the New England states, Vermont, showed a larger number of non-Bell exchanges than of Bell exchanges, and in this state the number of Bell exchanges considerably decreased during the five-year period 1912 to 1917. In only nine of the remaining states was the number of Bell exchanges in excess of th~ number of exchanges
operated by non-Bell organizations. The states outside New England in which this condition prevails were: Arizona, California, Colorado, Delaware, Louisiana, Maryland, Montana, New Jersey, and Utah. No non-Bell exchanges existed either in the District of Columbia or in Rhode Island.
A public exchange or central office may contain a small switchboard where only a few lines connect or may be an extensive office affording communication between thousands of subscribers; therefore, the number if not accompanied by information in regard to the size of the exchanges has little significance, but the relative importance of the exchanges in the different states can be approximated by comparing their number with the number of telephones.
Private-branch- exchanges.-While the number of private-branch exchanges depends upon local conditions and is determined by factors entirely different from those governing the establishInent of public exchanges the numbers of private-branch exchanges reported by the Bell and other systems at the different censuses are of interest. Data of this nature are shown in Table 27. The Bell System reported by far the greater number of private-br,anch exchangesnine-tenths of the total in 1917, more than four-fifths in 1912, and more than five-sixths in 1907. As this system operates in the larger cities where many privatebranch exchanges are necessary and the non-Bell systems more largely in the smaller cities and towns where few are required, the reason for this preponderance is apparent. The Bell System had private-branch ex-changes in every state at each of the last three censuses. but no non-Bell exchanges of tills eharacter were reported for a number of the -states or for the District of Columbia at these censuses.

....
Table 27
DIVIBION AND STATE.
1917
UNITED STATES •••....... 80,914 ---
GEOGRAPmC DIVISIONS: New England .••...••••.•.. 6,887 Middle Atlantic .•....••.... 39,325 East North Central.. •.. " •. li'~ West North Central. •••.... South Atlantic .........••.• 3;395 East South Central •........ 926 West South Central. •.•.... 1,341 Mountain ••...•.........•.. 1,276 Pacific ..................... 5,627
---NEW ENGLAND:
Maine ...................... 277 New Hampshire ..•••..•..• 123 Vermont ............... : ... 75 Massachusetts .............. Rhode Island •.•....•.••.•. 4'lM Connecticut .••••....••.•... 1,111
MIDDLE ATLANTIC:
ELECTRICAL INDUSTRIES: 1917.
SYSTEMS REPORTING ANNUAL INCOMES OF 35,000 OR MORE-NUMBER OF PRIVATE-BRANCH EXClIANGES~
Per cent of increase.l
Total. Bell Telephone System.
All other systems.
1912 1907 1902 1917 1912 1907 1917
------------52,651 28,276 7,883 72,253 45,387 24,702 8,661 --- ------ ---= ------4,855 2,361 506 6,880 4,824 2,357 7
26,301 15,215 4,532 35,383 22,966 14,207 3,942 8,014 4,108 1,~ 13,157 6,560 3,323 1,690 4,532 2,245 5,153 3,190 1,456 2,137 2,~~ 1,129 415 3,331 1,997 975 64
537 111 495 393 325 431 776 316 36 1,208 721 288 133 862 341 33 1,267 832 284 9
4,605 2,024 355 5,379 3,904 1,487 248 --------- ------------199 67 1 275 171 66 2 65 19 1 123 65 19 .. ·· .. ii· 49 22 1 70 47 19
3,451 1,793 408 4,714 3,450 1,793 338 153 } 95 { 587 338 153 -........... 753 307 . 1,111 753 307 ... "' ........
1912 1907
------7,264 3,574
---31 4
3,335 1,008 1,454 785 1,3i~ 789
154 240 212 55 28 30 57
701 537 ------
28 · .... ·2· ...... 3·
1 -........... .......... .............. ........... -.. ... .......... -
Total. Bell
Telephone Systems.
'All other
systems.
1912 - 1907- 1902- 1912- 1907- 1~12- 1907-1917 1912 1907 1917 1912 1917 1912
--------------53.7 86.2 258.7 59.2 83.7 19.2 103.2 ---- ------41.8 105.6 366.6 42.6 104.7 49.5 72.9 235.7 54.1 61. 6 "i8."2" "230:8 85.3 .95.1 175.9 100.6 97.4 16.2 85.2 60.8 101. 9 453.0 61.5 119.1 59.2 70.1 63.8 83.6 172.0 66.8 104.8
"79."6' -50.6
46.3 17.9 383.8 26.0 20.9 13.2 72.8 145.6 67.5 150.3 .............. ............ 48.0 152.8
·470.T 52.3 193.0 .............. 22.2 127.5 37.8 162.5 ':":64:6' 30.5 --------------39.2 .. " ........ ........... 60.8 .. ......... .............. .........
............ ............. ........ -.... .............. - .......... .. .... _ ..... .. ......... "36:6' ··92."5· '339:5' "3/S:6" "92:4' .... -....... ...........
............ ............ 73.7 120.9 73.7 120.9 ............. ... -...... 47.5 145.3 47.5 145.3 .............. ..... -.....
New York ................. 28,868 19,311 11,193 New Jersey ................ 2,823 1,906 610
3,807 141 584
26,847 17,152 10,865 2,021 68
1,853
2,1~~ 328 42
638
49.5 72.5 194. ° 48. 1 212. 4 332. 6 50. 2 49. 0 484. 2
56.5 57.9 - 6. 4 558.2 Pennsylvania.............. 7,634 5,084 3,412
2,755 1,834 568 5,781 3, ~80 2,774 ~:i Zfa:: "67:8' '''i3:0 1,10i
EAST NORTH CENTRAL: Ohio ....................... 3,894 Indiana.... .... .... .. .... .. 1,070 illinois........... .......... 6,531
~i~~~i.iJ.·.::::::::::::::::: r:g~ WEST NORTH CENTRAL:
Minnesota ................. .
~rs~w:C.::·::::::::::::::~: North Dakota ........... .. South Dakota •..••.•...•.• , Nebraska ••••....••••.•••.. Kansas .................... .
SOUTH ATLANTIC: Del~ware ................. .. Maryland ............... , .. District of Columbia ••••.•. Virginia ................... . West Virginia ............. . N otth Carolina ..... " ..... . South. Carolina ...•• ' ..... " GeorgIa .................. .. Florida ...... : ............. .
EAST SOUTH CENTRAL: Kentucky .. " .. " .......•....
~i~;;i:::::::::::::::::' WEST SOUTH CENTRAL:
t~~~:~:::::::::::::::::: . Oklahoma .................. 1 Texas ..................... .
MOUNTAIN: Montana ................. .. Idaho ..................... . Wyoming ................ .. Utah ...................... . Colorado .................. . New Mexico ............... . Arizona .................. .. Nevada ................... .
PACIFIC:
1,934 928
3'tb~ 70
601 176
203 1,270 l,gM
205 90 46
275 66
577 218 110
21
108 225 267 741
170 92 35
287 563 29 79 21
Washington................ 1,116 Oregon..................... 637 California ................. , 3,874
2,099 536
4,008 1,009
362
1,133 613
2,012 57 20
437 260
82 783 710 118 109 37 14
188 32
357 164 87 25
60 141 140 435
66 43 10
191 508 18 13 13
1,063 605
2,937
1,338 277
1,753 517 223
447 84
771 115
72
853 208 151 6 943 174 30
1~ · .... ii· 84 1
4~~} 373 368
74 8 63 17 f~ ...... /S. 74 11 19
329 154
46 8
12
92 16 3
124 22
1~ .... ·i4·
26 6 16 ........
2,968. 781
6,381 1,812 1,185
1,446 904
1,993 108 68
466 168
{ 1,Wo 1,g~t
195 80 46
263 42
173 191 110
21
104 224 267 613
9g} 2 { 180 24
167 92 35
287 563
28 4 1 7 6
634 153
1,237
51 19
285
78 17
1,090 534
3,755
1,445 307
3,~~g 329
531 550
1,4~~ 20
351 248
82 783 710 H7 62 34 13
167 29
136 153
81 23
60 139 139 383
41 39 10
191 508 18 13 12
1,029 509
2,366
868 170
1,673 425 187
438 92
686 23 1
165 51
66 340 368
71 32 16 13 65 4
148 130 39 8
926 289 150 220 105
488 24
1, 47i 2
135 8
654 229 428 110 33
602 63
577 2
470 85.5 56.9 199.3 105.4 66.5 41.6 39.1
19b ~~J 1~~: ~ . i2'7: 4' 1~~: ~ 1~: Z _~~: g 114. ° 92 101. 4 95.2 349.6 104.9 111. 5 100.0 36 256.4 62.3 260.2 75.9 ............. .
415 59
257 7
70. 7 32. 8 310. 1
~~J r~:~ '442.'0' 172.3 21.2 -18.9 45.1
~~: ~ . i09:2' . i56:a' . 'i24: 5
· .... S6· .. · .. is· "a7:5' ·ia8.T ::::::: "32:8' 'iii'i' ::::::: ::::::: '2 . 33 -32.3 .............. -32.3 .................... .
: : : : : : :: :::::::: ..... 93' .. 6i 2" .. 86: 8" ::::::: .. 6i 2' . iao: 3' ::::::: ::::::: ...... s· ...... i· .. ·· .. 3·
10 47 31 10 3 1
·····i2· 24
1 2 21 9 3 15
42. 4 92. 9 ........ 42. 4 92.9 ............. . 94.1 ....... ....... 88.9 .................... . 88.1 ......................................... .
"46:a' ::::::: ::::::: ""57:5' ::::::: ::::::: :::::::
401 27
221 11 6 2
181 61. 6 8. 5 ..... .. 27.2 -8.1 24.8 17.7
82.8 22.1 21 32.9 6.5 ...... . 7 ................... ..
1~~ t ...... 2' ..... T "59:6' .. ii' 7' ::::::: .. 6i: 2' .. ii o· ::::::: ::::::: g~ .... i2S· 5~ • .... 27· ~:~ '253.'6' ::::::: ~~:} ::::::: ::::::: :::::::
20 13 6
51 180
4 6 4
418 153 916
3 25 4
6 ................... .. 3
: : : : : : :: :::::::: ..... 45' .. 50: 3' ::::::: ::::::: .. 50: 3· ::::::: ::::::: ::::::: 10.8 182.2 ....... 10.8 182.2 ............. . .. .... i· ............................................................... ..
1 .............. i· ............................................... .. 4 ...... i· 2 ................................................ .
26 103 119 I
34 96
571
216
321
5. ° 67.7 5. 9 146. 2 ....... -84.3
3t g i~~:! . 334: 0 . 5~:~ ~~:i :..:79:2 .... 77:9
1 A minus sign ( -) denotes decrease; percentages are omitted where base is less than 100 •
CHAPTER V.-FINANCIAL STATISTICS. Oharacter oj the statistics.-Detailed statistics con
cerning the financial transactions of telephone companies for the census of 1917 were confined to the systems having annual incomes of $5,000 or more. Systems having incomes of less than $5,000 ~ year reported only three financial items to the census, the gross receipts (or, in. the case of mutual companies, the total assessments) for the year, the wages paid during the year, aD:d the total investment in telephone property. The :fi.llancial data secured from the systems having annual incomes 6f $5,000 or more were twofold in nature; an income statement showing in detail the revenue and expenditures for the year, and a balance sheet showing the financial condition at the end of the year. The amounts paid as salaries and wages to the various classes of employees were also reported separately.
All telephone companies having annual incomes of $10,000 have been required since January 1, 1913 to adopt the uniform accounting 'system prescribed by the Interstate Commerce Commission. This system is the basis for annual reports to the Interstate Commerce Commission, two forms of reports being required-, a long form for telephone companies having annual incomes of $50,000 or more (Class A companies and Class B companies), and a shorter form for companies having annual incomes of from $10,000 to $50,000 (Class C companies). In addition, a circular is mailed to Class D companies, those having annual incomes of from $5,000 to $10,000, but the adoption by these companies of a uniform accounting system or their submission of a detailed annual report is not required.
The schedule adopted by the Bureau of the Census for the 1917 Census of Telephones was modeled after the annual reports required by the Interstate Commerce Commission, especially as regards the financial data. The Interstate Commerce Commission account numbering was used on the census schedule, so that the reporting companies need experience no difficulty in knowing which of the more detailed accounts required by the In tersta te Commerce Commission should be used in preparing their answers to the classifications indicated in the reports which were required by the Bureau of the Census. Since a single form was used by the Bureau of the Census for the reports of all companies having annual incomes of $5,000 or more, and since the Interstate Commerce Commission'does not require comp~nies having less than $10,000 of annual income to adopt a uniform accounting system, some companies found it rather difficult to furnish the information required by the census inquiries. As a rule, however,
the reports were prepared in a satisfactory manner, there being few cases where the exact amounts could not be obtained from the records and where, consequently, the company submitted estimated figures.
Many of the larger telephone systems operate in more than one state. This made it impossible to present separate statistics for the financial transactions in each state, only the totals for the United States being shown for the systems having annual incomes of more than $5,000. Statistics of the gross receipts for 1917 and of the total investment on- December 31, 1917, for the companies, lines, or systems having annual incomes of less than $5,000 are shown, by states, in Table 14.
Oomparison with prior censuses.-In several of the tables of this chapter no comparative figures for prior censuses can be presented. The adoption in i913 of the uniform system of accounts pro:U(lulgated by' the Interstate Commerce Commission as the basis for the inquiries of the Bureau of the Census renders impossible any detailed comparison of the 1917 statistics with those of prior censuses. Furthermore, even in the comparatively few items for which a valid comparison with prior censuses can he made these comparative figures can be presented only for the censuses of 1912 and 1907, since the statistics for 1902 include many reports from systems having annual incomes of less than $5,000.
Table 3 presents the general totals of income, expenses and capitalization, for those systems having annual incomes of $5,000 or more at the censuses of 1917,1912, and 1907. Thefigure8forrevenuearid expenses for 1912 and 1907 in Table 3 are not th~ same as those published in the report for 1912. This is due to the subtraction both from income and expenses of "payments for telephone traffic made to other companies." ,The" telephone operating revenue" in 1917 in~luded only revenue derived from messages transmitted wholly over the reporting company's lines, and the reporting company's proportion of tolls for messages transmitted by' the joint use of its own and other lines. The amounts deducted from the total income and expense to eliminate" payments for telephone traffic made to other companies" were $1,187,265 in 1912 and $949,-962 in 1907. With this revision, the totals of revenue and expenses shown for each of the last three census years are thought to be strictly comparable. The statistics in Table 3 show that while the revenue of telephone companies has more than doubled during the decade 1907-1917, the expenses have increased at an even more rapid rate. Much of the increase in expenses was due to. the increase in salaries and wages
(39)

40 ELECTRICAL INDUSTRIES: 1917.
paid. Salaries and wages c'onstituted 47.4 per cent of the total expense in 1912, but had advanced to 54.2 per cent of the total expense in 1917.
Table 28 presents the capitalization statistics for all telephone systems reporting annual incomes of $5,000 or more, distinguishing the Bell System and all other systems for 1917,1912, and 1907.
Table 28 SYSTEMS REPORTING ANNUAL INCOMES OF $5,000 OR MORE-ANALYSIS OF CAPITALI-ZATION.
Census year.
Bell All other Total. Telephone System. systems.
Capital stock, funded debt, 1917 SI, 785,337, 790 $1,536,030,254 $249, 307,536 and real-est,ate mortgages 1912 1,451,438,242 1,174,605,286 276, 832, 956 of incorporated companies. 1907 998,066, 677 750,181,335 247,885,342
Cash investment and real- 1917 5,376,171 ................ 5,376,171 estate mortgages of unin- 1912 3,413,493 ................... 3,413,493 corporated companies) 1907 2,583,833 .................... 2,583,833
Total capitalization .•. 1917 1,790, n3, 961 1,536,030,254 254,683,707 1912 1,454,851,735 1,174,605,286 280,246,449 1907 1,000,650,510 750,181,335 250,469,175
Deduct intercompa:!lY hold- 1917 639,673,186 2 633,670,438 6,002,748 1ngs. 1912 501,476,067 2492,181,436 9,294,631
1907 274,231,121 258,189,989 16,041,132
Net capitalization .... _ 1917 1,151,040,775 902,359,816 248, 6RO, 959 1912 953,375,668 682, 423, 850 270,951, 818 1907 726,419,389 491,991,346 234,428, 043
Deduct value ofinvestments 1917 73,878,464 70,590,587 3,287,877 outside of telephone indus- 1912 62,090,435 61,194,984 895,451 try of the United States. 1907 25,255,951 25,090,795 165,156
Net capitalization in- 1917 1,077, 162,311 831,769,229 245,393, 082 vested in telephone 1912 891,285,233 ' 621,228,866 270,056,367 i n d u s try of the 1907 701,163,438 466, 900, 551 234,262,887 United States.
1 Includes mortgage indebtedness of unincorporated telephone systems to the amount of $429,572 in 1917, and $126,355 in 1912.
2 Includes $616 263,920 of intercompany holdings within the Bell System, and $17,406,518' of stocks and bonds of other telephone companies in 1917, and $480,747,250 of intercompany holdings Within the Bell System, and $11,434,186 of stocks and bonds of otlier telephone companies in 1912.
The ncapital stock, funded debt, and real-estate mortgages of incorporated companies" is the gross amount of capitalization; this includes the intercompany holdings of the Bell Syst~ and of the non-Bell systems in other telephone companies and presents the capitalization of incorporated companies. The second item, "cash investment and real-estate mortgages of unincorporated companies" represents what may be called the "capitalization" of those systems owned by individuals, partnerships, associations, or otherwise, which have never gone through the form of securing a certificate of incorporation.
The capital stock and funded debt, as shown in Table 3, is exclusive of the $616,263,920 in 1917, $480,747,250 in 1912" and $258,189,989 in 1907 of intercompany holdings within the Bell System. The statistics of "capital stock, Junded debt, and realestate mortgages of incorporated companies," shown as the first item of Table 28, include these intercompany holdings.
The real-estate mortgages are in their essential characteristics very little different from funded debt. This was recognized by the Interstate Commerce Commission in the uniform system of accounts which it
prescribed for telephone companies, In whieh (Call bonds, notes, and other evidences of indebtedness (except open accounts for adv,ances) which, by the terms of the creation of the debt, do not mature until more than one year after the date of such oreation" are classed as funded debt. The census schedule for 1917, following the practice of the Interstate Commerce Commission in this respect, grouped funded debt and real-estate mortgages together. At prior censuses mortgages Were reported as a separate item. A retabulation Qf the 1912 reports showed that of the total of $1,258,647 of real-estate mortgages, $126,355 was reported by unincorporated systems and $1,132,292 by incorporated systems. In the present report the l!1tter amount was classed with funded debt, making the total for long-term interestbearing capital comparable for the last two censuses . Such a retabulation for 1907 was not possible, since the original tabulation sheets and schedules have been destroyed. TherefQre, all of the real-estate mortgages reported at that census ($1,188,481) Were grouped with funded debt, and to this extent the statistics shown for this Hem in Table 3 for 1907 are larger than they properly should be. This lack of comparability is in reality of small moment, however, as the total amount of real-estate mortgages of unincorporated companies thus included with funded debt probably amounted to not more than $100,000. Both the capital stock and funded debt as reported in 1907 and 1912 included the amount of such securities held in the treasury, the issue of which was authorized by the stockholders and directors but which were not yet outstanding in the hands of the public. The uniform system of accounts prescribed by the Interstate CODlmerce Commission specifically provides that such securities shall be deducted by the companies from the balance sheet which they have submitted each year. The companies also made this deduction in the reports which they submitted to the Bureau of the Census in 1917. In order, therefore, to present comparable statistics for the last three censuses these treasury securities, which amounted to $21,735,415 in 1912 and $19,4'34,007 in 1907, are excluded from figures for capital for these years as presented in the present report.
To 'ascertain the net capital, the intercompany holdings of the Bell System in ,its own subsidiaries as well as in other telephone companies and the investnients of non-Bell companies in the stocks and bonds of other telephone companies hav'B been deducted. If these amounts were allowed to remain in the statistics of capitalization, a duplication would exist to this extent. The statistics of net capital as presented in Table 28, however, are actually correct only in the total.' The Bell System in 1917 owned stocks and bonds of other telephone systems to the amount of

TELEPHONES. 41
$17,406,518. This amount h~s been deducted from the net capital of the Bell System ($902,359,816) as shown in this table, although a greater amount than the net capital of the Bell System in 1917, as shown in Table 28, was actually outstanding in the hands of the public. (See Table 21.) The converse is true of the intercompany holdings deducted from the total capital of the non-Bell companies to show their net capital. The actual capital of these ~ompa:nies outstanding in the hands of the public is less than the net capital shown in the tahle, by the amount of the securities of "independent" telephone companies owned by the Bell System. The total column, however, represents the actual capitalization outstanding in the hands of the· public.
In addition to the telephone securities reported, a number of companies reported interests in stocks ~nd bonds of concerns other than telephone comp'anies, and many other investments of a permanent nature outside the telephone industry. The amount of such investments must be deducted from the gross capital to ascertain the "net capital chargeable directiy to the telephone industry."
It is noticeable that in 1917 the intercompany holdings represented more than one-third of the total stock and bonds issued. The bulk of such holdings was reported by the BeH System. The amount of inter·· company holdings of this one system was more than two-fifths of its gross capitalization in 1917, and 1912, and one-third in 1907. A very small per cent of the gross capitalization of all other systems was invested in the stocks and bonds of other telephone companies.
Although it is possible to caleulate. the net capitalization based on the telephone business of the United States,it is not possible to distribute that net capitalization precisely among the different classes of securities. The total amount of intercompany holdings is available, but not the amount distributed according to classes of securities. Furthermore, while the investments of telephone companies in stocks or properties outside of the telephone business of the United States may properly be deducted from the total capitalization in order to ascertain the capitalization based on the telephone business of the United States, the amount of this deduction can not, of course, be taken out of anyone class of securities, and although it would be possible to apportion this deduction among the classes 9f securities pro rata, the results would have little significance. Consequently,
no statistics are presented in which a segregation is made of the net capitalization into capital stock and funded debt.
D·ividends and interest payments.-It is obvious that in considering the relation between dividends and interest payments and capitalization, it is necess·ary to show the entire amount of capitalization in the hands of the public and the entire amount of dividends or interest paid thereon, regardless of the question whether such capitalization represents the telephone business only or includes investments in other industries, or whether the dividends or interest are derived wholly from income from the telephone business or include revenue from other sources. The interest payments reported for 1912 include the amounts paid on notes, loans, and mortgages as well as on the funded debt. It is necessary, therefore, to combine these classes of securities and compare the interest payments with the total. Such a comparison is made in the following statement for 1917, 1912, and 1907. Comparable figures are not available for 1902.
1917 1912 1907
Amount of funded and floating debt $352,785,364 and mortgages 1 •••••••••••••••••••••• $fi26,372,755 $456,900,126
Annual interest payment .............. $26,868,861 $20,163,960 $15.935,395 Average rate of interest .....•............ 5.10 4.41 4.52
1 At end of year.
Since the am.ount of interest-hearing indebtedness shown in this statement is the amount in existence at the end of the year, while the amount of interest payments shown is for the entire year, it is obvious that the computation of the average rate of interest might easily lead .to erroneous conclusions. Shortterm obligations may b~ incurred and discharged during the year without affecting the balance she·et, although the transaction leaves its reeord in the income statement. War conditions, undoubtedly, affected the rate of interest during 1917. It is impossible, however, to determine to what extent the rather large increase in the averaget rate of interest for 1917 as compared with that shown for 1912 is due to an actual raise in the rate and to what extent it may be more apparent than real due to the discharge of a considerable amount of short-term obligations prior to the e~d of the year.
Table 29 shows, for 1917 and 1912 for incorporated companies having annual incomes of. $5,000 or more, the data regarding capital stock and dividends.

42 ELECTRICAL INDUSTRIES: 1917.
Table 29
Common stock: N~~;}3~~mEa~e~ ~~~or:ing ...•............•...•.......•.......•......... ~.
:::iE~~H~H~~E~~LH~H:::~~:HE~EL~ Netamount ••..•...........................•............................•. A veragerate per cent on dividend-paying stock_ ...... " . " ............. '"
P· 4 A veragerate per cent on net amount of stock outstanding ...............•.. re~erred stock: .
:~~JY.ii:··i.ii:~:':.ii·.i:i::Y· .. y::·:·:::::·. Dividends-
Netamount ••.•...........•............................................... Averagerate per cent on dividend-paying stock ......... '" ........ " ....•. Average rate per cent on net amount of stock outstanding .•.... '" ....... .
The figures for total dividends represent for the Bell Telephone System the gross payments less' duplications due to intercompany payrilents but without any deductions of income derived from outside sources. Table 29 shows the two classes of stock and of dividend payments, but for reasons already mentioned it is impossible, in the case of the non-Bell companies, to exclude duplications due to intercompany holdings or payments from the figures for the several classes of securities and payments.
A notable feature of the telephone industry is that a large number of the small systems pay no dividends and have no outstanding funded debt upon which interest is paid. In Table 29 companies paying dividends are distinguished from those which do not. In thi~ table it is impossible to exclude duplications due to intercompany holdings in the case of non-Bell companies, but such duplications are excluded for the Bell companies.
This table shows that inability to pay dividends as well as in the rate of dividends paid, measured[ according to the rate paid either on dividend-paying stock or on the net amount of all outstanding stock, the non-Bell telephone systems were in a much more favorable situation in 1917 than in 1912. This improvement is more manifest in the case of the common stock than in the case of the preferred stock. The Bell System shows a slight decrease in the ~verage rate of dividends on its common stock; though the amount of its nondividend-:-paying coIIimon stock decreased and the amount of dividends paid increased.
Income and expenses.-Table 30 presents, for 1917, the income statement of telephone systems and lines reporting annual incomes of $5,000 or more, and distinguishes the Bell System and all other systems.
INCORPORATED SYSTEMS REPORTING ANNUAL INCOMES OF 85,000 OR MORE-BTOCK AND DIVIDENDS.
Total. Dell Telephone System. All other systems.
1917 1912 1917 1911! 1917 1912
1,896 1,708 145 176 1,751 1,532 997 808 64 71 933 737 899 900 81 105 818 795
$622,433,912 8541,681,477 8497,246,964 $384,308,933 8125, 186, 948 S157, 372, 544 $545,014,895 8426,453,971 $490,412,135 8372, 595, 815 $54,602,760 $53,858, 156 817,419,017 $115,227,506 86,834,829 Sl1, 713, 118 870,584,188 8103,514,388
$40,2567~~~ S32,2557~~ 836,2927~~ 828,905.001 $3J~~ $3,350,124 '1.76 6.22
6.47 5.95 7.30 ~7.52 3.17 2.13
210 231 19 37 191 194 152 161 12 21 140 140 58 70 7 16 51 54
843,510, 559 $45,082,402 812,162,091 S13, 576, 500 $31,348,468 831,505,902 $33,087,308 834,751,619 $11,801,805 813
S 440,150 $21,285,503 821,311,469
$10,423,251 $10,330,783 8360,286 136,350 810,062,965 $10, 194, 433
82,0096?b~ ~h,865,684 8728,240 8804,840 81,281,536 $1,060,844 5.37 6.17 5.99 6.02 4.98
4.6~ 4.14 5.99 5.93 4.10 3.37
Table 30 SYSTEMS REPORTING ANNUAL INCOMES OF 85,000 OR MORE-INCOME STATE-MENT: 1917.
ACCOUNT. Bell All other Total. Telephone
System) systems.
t. Operating income.
Telephone operating revenue •••... "" .. $363, 83l, 921 $.103,863,847 859, 96R, 074 Telephone operating expense ••..•..•.... 253,429,704 211,074,788 42,354,916
Net telephone operating revenue .•... 110,402,217 92,789,059 17,613,158 Net revenue from other operations ... 13,401 193 13,208
Total net operating revenue. _ .. _. 110,415,618 92,789,252 17,626,366
Uncollectible operatingreyenue ......... _ Taxes ....................................
1,648,597 24,149,087
1,284,869 21,154,052
363,728 2,995,035
Deductions from net operating reve-nue .............................. 25,797,684 22,438,921 3,358,763
Operating income ..•.•.....•..•. 84,617,934 70,350,331 14,267,603
S. Nonoperating income.
Rent revenues ____ . " ................ '" .. 805 .. 286 676,710 128,576 Dividends from telephone company
stocks .......... , ........ _ ............ 456,037 353,051 102,986 Dividends from other stocks .. _ ...•...... 3,207,860 3,202,560 5,300 Interest from obligat~ons of telephon e
companies ........................... 672,0l9 585,572 86,447 Interest from other sources ............... 3,192,032 3,015,907 176,125 Miscellaneous nonoperating revenue .•••• 323,244 220,420 102,&24
Total nonoperating revenues .•...... Nonol!eratingexpenses ..................
8,656,478 892,602
8,054,220 832,380
602,258 60,222
Nonoperating income ....•.•.......... 7,763,876 7,221,840 542,036
Gross income ........ '" •..... , .. 92,381,810 77,572,171 14,809,639
3. Deductions/rom gross income.
Interest on funded debt •................. 24,294,072 19,592,805 4,701,267 Other interest ........................... 2,574,789 1,672,841 901,948 Rent deductions ...... -.................. 4,284,628 3,538,400 696,228 Miscellaneous income ded uctdons ...••••.. 1,~29,581 1,583,153 246,428
TotaJ deductions from gross income .. 32,983,070 26,437,199 6,545,871
Netincome ................. ' ..... 59,398,740 51,134,972 8,263,768
4. Disposition o/net inco'me. Dividends:
On common stock ................... 40,256,813 36,292,569 3,964,244 On preferred stoek ................... 2,009,776 728,240 1,281,536
Other appropriations of net income ...... 3,004,940 2,566,140 438,800
Total appropriations of net mcome ., 45,271,529 39,586,949' 5,684,580
Balance carried to surplus ....... 14,127,211 11,548,023\ 2,579,188
L Excludes u:tercompany duplications within the Bell Systems.

TELEPHONES. 43
Each ·company with an annual income of $5,000 or more furnished the detailed statistics in regard to income and expenses given in Table 30. The Bell System, however, furnished a combined statement covering the operations of all its subsidiary companies as well as its long-distance service. This arrangement enabled the company to eliminate all duplication due to intercompany receipts and expenditures. The reports of the non-Bell telephone companies include small amounts of interest and dividends received by certain companies from other independent telephone companies. The combination of these receipts· and expenses necessarily results in a duplication which can not be eliminated, but the amount is not sufficient to have any appreciable effect.
The adoption of the Interstate Commerce Commission's form of income statement made it impossible to present a detailed comparison of income and expenses for 1917 with prior censuses. The terminology used by the Bureau of the Census in securing the statement of income and of expenses for 19171s that of the Interstate Commerce Commission, and each of the terms is explained fully in the Interstate Conmterce Commission's instructions for preparing the reports made to it.
Table 31 presents the principal items of operating revenue and expense for telephone systems and lines having annual incomes of $5,000 or more, distinguishing the Bell System and all other systems, and showing the per cent each forms of the total.
Table 31 SYSTEMS REPORTING .ANNUAL INCOMES OF $5,000 OR MORE-oPERATING REVENUES AND EXPENSES: 1917.
ACCOUNT. Percent of
total. Bell All other Total. Telephone systems. System. All Bell. other.
Operating revenues. $363,831,921 $303,863,847 $59,968,074 100.0 100.0
Exchange revenues •• " •. 262,698,775 214,119,479 48,579,296 70.5 81.0 Toll revenues •........•.. 97,25Q,496 86,814,336 10,436,160 28.6 17.4 Miscellaneous revenues ... 3,681,346 2,930,032 751,314 1.0 1.3 Assessments (for mutual
companies only) •••••.• 201,304 .............. 201,304 ........ O.S
Operating expenses. 253,429,704 211,074,788 42,354,916 100.0 100.0
Repairs and other main-54,746,253 42,789,342 11,956,911 20.3 28.2 tenance ...... · •.••••....
Traffic e:wenses •••••...• 82,201,988 70,056,681 12,145,307 33.2 28.7 Depreciatlon of plant and
8,642,841 25.9 20.4 equipment ••....•...... 63,312,657 54,669,816 General and miscellane-
ous .................... 53,168,806 43,558,949 9,609,857 20.6 22.7
Relation 01 traffic to income and expense.-Table 32 shows, for telephone systems reporting annual incomes of $5,000 or more, the averages per telephone and per message, for the various items of income and expense.
The census statistics were not collected with a view to making exact computations concerning the income and . expenses per telephone or per message. The statistics necessarily include data for all systems,
irrespective of the conditions under which these systems were operated, and the methods of bookkeeping are not uniform for all companies. A. considerable proportion of the companies, especially the smaller ones, had very imperfect systems of accounting, and the data reported by them were not complete.
Table 32
I SYSTEMS REPORTING ANNUAL INCOMES OF $5,000 O~ MORE.
1917 1912 1907
A veragenumber of messages per telephone 1 per year. 2,043 1,875 2,190 Average total revenue:
Per telephone .............................. $38.41 $34.82 $36.01 Per message (cents) ........................ 1.881 1.857 1.699
Average revenue from telephone operations-Per telephone .............................. $37.52 $33.25 $34.07 Per message (cents) ........................ 1.837 1.773 1.607
Average revenue from other sources-$0.89 Per telephone .............................. $1.57 $1. 95
Per message (cents) .••.....•.... _ .......... 0.044 0.084 0.092
A veF!ret~fe~~~~!. ~~~~~~~: •...................... $26.14 $23.36 $23.10 Per message (cents) ............................ 1.2'79 1.246 1.090
Average deductions from income (taxes, rent, fixed charges, etc.):
Per telephone ............. , .................... . $6.06 $4.45 $4.51 Per message (cents) ............................ 0.296 0.237 0.213
Average net income: $6.13 $7.01 $8.40 Per telephone ..................................
Per message (cents) ............................ 0.299 0.374 0.396
A ve~~et:fe~~g:e~~~~~~ !:~~_ ~.e.t. ~~~~~: ...•...••. $4.67 $4.66 $4.78 Per message (cents) ............................ 0.228 0.249 0.225
Average surplus: . $1.46 $2.35 $3.62 Per telephone ................ _ .................
Per message (cents) ............ , ............... 0.072 0.125 0.171
1 Numher of telephones used for 1917 is the average number (see Table 18); number for 1912 and 1907 is number reported on Dec. 3~.
In considering the income and expenses per unit proper allowance should be made for the difference in the methods of charging for t61ephone service. In census statistics in which the reports for many companies are combined, adjustments due to these differences are impossible. Furthennore, the "per telephone" deductions are based' on the number of telephones installed at the end of the year for .1907 and 1912, but for 1917 the average number for the year was used; this results in somewhat higher averages for 1917 than if computed on the sa~m.e basis as the 1912 and 1907 figures. For all these rea.sons the computation of earnings and expenses per telephone and per message, given in Table 32, should be accepted only as indicating, or approximating, the actual conditions.
It is, in one sense, improper to calculate the average gross revenue per telephone-that is, to divide the total revenue of companies from all sources. by the nUmber of telephones--since the gross revenue ineludes revehue from outside investm.ents having nothing to do with the telephone traffic. Inasmuch,
. however, as the deductions from the net income (the dividends and the surplus) are derived from the gross revenue from other sources as well as from the revenue from telephone· operations, it is necessary, if any calculation of the amounts of these various items per telephone or per message is to be made, to com.pute

44 ELECTRICAL INDUSTRIES: 1917.
similarly per telephone' or per message the total revenue from which these items are derived. Since the difference between the total revenue and the telephone operating revenue is comparatively small, this distribution does show, with approximate accuracy, what part of the amount paid by the public for the use of a telephone per year and what part of the amount paid per message are used for the different purposes indica ted.
The average number of messages per telephone per year showed a considerable decrease from 1907· to 1912 and an increase from ~912 to 1917. The average per telephone for gross revenue and for revenue from telephone operations showed the same trend; the average revenue per message, however, increased during each of the five-year periods. The average for operating expenses also increased during each of these fi ve-year periods whether measured by the telophone unit or by the message unit. While for the reasons already stated the averages in the table should not· be accepted as exact, the tendencies noted are in harmony with the generally accepted understanding of actual conditions.
The income and operating expenses per unit vary greatly for different states, being, in general, high for the states containing the large cities and districts of high telephone density.
Balance sheet.-Table 33 presents the balance sheet for December 31, 1917, for telephone systems reporting annual incomes of $5,000 or more, distinguishing the Bell System and all other systems.
The balance sheets are supposed to show the financial conditiqn of the companies at the end of the year or other periods covered by.the reports. Undoubtedly differences in methods of bookkeeping are reflected in the balance sheets, and it is probable that part of the assets recorded for some companies are of questionable value. It is seldom, however, that a company underestimates the value of its assets, and therefore the combination of the balance sheets for the different companies doubtless results in larger totals than would be obtained from a conservative valuation of the properties.
The balance sheet shown includes the duplication in assets and liabilities referred to in connection with Table 28 which can be eliminated by deducting the value of stocks and bonds of other telephone companies.
The asset and liability items presented in this table follow· very closely the terminology adopted by the Interstate Commerce Commission. Any question as to just what subitems are included in- any of the items of the table may be answered by reference to the In tersta te Commerce Commission's "Classification of AccouiJ.ts." .
Table 33 SYSTEMS REPORTING ANNUAL INCOMES OF $5,000 OR J,WRE-BALANCE SHEET, DEC. 31,lY17.
ACCOUNT.
Total. Telephone System.
All other systems.
i
Bell
---1-1-1--Total assets or liabilities •..... 1 81,665,120,922 1 2 $1,331,599,048 \ !333,521,874
ASSETS. I Plant and equipment •.•. " ...••••. 1,435,912,142 1,140,639,666 Other property (nontelephone) ... ,. 5,441,207 4,233,495
2\15,272,47.6-1,207,712: 4,661,863-1, 340, 8R&
Stocks of telephone compauies ... , . 12,982,417 8,320,554 Funded debt of telephone companies 10,426,849 9,085,964 Miscellaneous stocks......... ....... 53,771,4£8 53,442,400 Miscellaneous funded debt.... .. . . .. 8,454,582 8,360,397
329,068
Advances to system telephone com-94,185.
~anies ..... ; ..................... . arketable securities •...•.•........
Notes receivable ................... .
2,197,015 6,211,206 2,949,293
.... "4;554;294' 2,197,0 ... 5 1,656,912: 1,045,019 7,477,291 6,145,784 5,598,928-1,542,753-4,951,977
Accounts receivable ••••............ Cash and deposits ................. . Materials and supplies ............. . Sinking and other special funds ... . Sundries .......................... .
LIABILITIES.
Common stock .................... . Preferred stock .................... . Cash investment (of unincorpo·
36,017547 43,059;392 23,954,088 2,494,001
21,249,715
622,433,912 43,510,559
1,904,274 28,540,250 36,913,608 18,355,160
951,248 16,297,738
497,246,964 12,162,091
125, 186, 948 31,348,468-
rated lines) •.......... : .......... . 4,946,599 ..................... _ ......... 4,946,599 Funded debt (including real·estate
mortgages) ••.•................... Advances from system corpora-
503,558,971 410, 357, 279 93,201,692
tions ............................ . Notes payable ..................... . Accounts payable •.•...............
5,369,981 ..... ·s; 000;370' 5,369,981 17,443,803 12,443,433 23,574,940
Reserves for depreciation .......... . Other reserves •••••• _ ............. .
16,802,901 6,771,733 234,378,582 206,862,884 27,515,698 10,926,942 10,177,909
Sundries .......................... . Surplus ..................... ' ..•....
749,033 50,016,785 44,917,747 5,099,038
1 148,960,148 128, 070, 897 120,889,251
1 Exclusive of $4,757,783 delcit reported by the companies showing a deficit. 2 Excludes intercompany duplications within the Bell System.
Incorporated and unincorporated companies.--Separate statistics are presented in T2~ble 34 for the "all other" (non-Bell) incorporated and unincorporated systems.
Table 34
ACCOUNT.
NON-BEL"L SYSTEMS REPORTING ANNUAL INCOMES OF $5,000 OR MORE-BALANCE SHEET, DEC. 31, 1917.
Total. Incorpo- Unincor-rated. porated .
Total assets or liabilities .•........•. 1 $333,521,874 1 $326,039,485 1 $7,482,389
ASSETS.
Plant and equipment .................... . Other property (nontelephone) •..... , ... . Stocks of telephone companies ........... . Funded debt of telephone companies .... , Miscellaneous stocks ..................... . Miscellaneous funded debt ............... . Advances to system telephone companies. Marketable securities .. ' ........... " .... . Notes receivable ..... _ ................... . Accounts receivable .•...........•. ' ... " . Cash and deposits ....................... . Material a.nd supplies .................... . Sinking and other speCial funds .......... . Sundries ................................ .
LIABILITIEs.
Common stock ............ " ............ . Preferred stock ..................•...•.•.. Cash investment (of unincorporated lines). Funded debt (including real-estate mort-
A~~~~Jes from system ci)rporations: :: :: : Notes payable ............. , ............. . Accounts payable •................ ' ..... . Reserves for depreciation •..••.•......•... Other reserves ........................... . Sundries .......... , .................. ,.,. Surplus .......... _. ~ .................... .
295,272,476 1,207,712 4,661,863 1,310,885
329,0(;8 94,185
2,197,015 1,656,912 1,045,019 7,477,297 6,145,784 Ij, 598, 928 1,542,753 4,951,977
288,448,158 6,824,318 1,197,810 9,902 4,661,419 444 1,340,720 165
316,529 12,539 94,185 .......... .
2,197,015 .......... . 1,631,683 25,229 1,019,460 25,559 7,212,018 265,279 5,961,809 183,975 5,485,420 113,508 1,535,276 7,477 4,937,983 13,994
125,186,948 125,186,948 ..•... , ...• 31,348,468 31,348,468 .......... . 4,946,599 ••...•••.••... 4,946,599
93,201,692 5,369,9Rl
12,443,433 6,771,733
27,515,698 749,033
5,099,038 120,889,251
92,772,120 5,369,981
11,792,068 6,698,277
27,160,170 731,897
5,067,441 119,912,109
429,572
.... 65i;S65 73,456
355,528 17,136 31,591
1977,142
1 Exclusive of deficit reported by companies having a. deficit to the a.mount of $4,757,783; of this amonnt,S4,710,591 was reported by incorporated and $47,lY2 by unincorporated systems.

TELEPHONES. 45
EM:PLOYEES, SALARIES, AND WAGES.
AU telephone companies and systems having annual incomes of $5,000 o~ more were required to report thG numbers of the several classes of employees which were on their rolls on September 29, 1917, together with the amount of salaries and wages paid each class during the year. If the data for September 29 were not available, they were required to report the number for the nearest representative date. All regular
Ta.ble 35
officers and employees, whether engaged in operation, maintenance, canvassing, or collecting, or otherwise employed, were included. If any persons were emp~oyed only a portion of the time :in the telephone serVICe, th~ report was to include only the wages paid in connection with that service.
Table 35 shows, for telephone systems reporting annual incomes of $5,000 or more, the number of employees, classified according to work performed with salaries and wages paid,for'19i7, 1912, and 1907.
SYSTEMS REPORTING ANNUAL INCOMES OF $5,000 OR MORE-EMPLOYEES, SALARIES, AND WAGES.
Per cent of increase.1
1917 1912 1907 I
1907-1917 1912-1917 1907·1912
------Em!~er:~l~:ges:::::::::::::::::::::::::::::::::::::::::::::::::::::::::::: : 244,490 183,361 131,670 85.7 33.3 39.3
$169,655,066 $96,040,541 $65,009,349 161.0 76.6 47.7 Salaried employees: 1======1=====1======11===1;===',===
Number ...•..................................................................... Salaries •...•...................................................................... 15.4 \ 44,705 38,753 22,819 95.9 69.8
$46, 566, 869 $32,681,482 $18, 542, 619 151.1 42.5 76.2
Salaried officers- I--------~--------Number ........................................................................ . Salaries ......................................................................... .
4,118 1,753 ~~ 134.9 .... _ ............. $~,213,516 $3,086,242 - 198.5 .................
Superintendents and managers-Number ....................................................................... .. 6,406 5,673 (8)
I .... ··· .. · 12.9 ...........
Salaries .......................................................... '" ............ . 87,355,268 $7,391,975 (3) -0.5 ............. Clerks, stenographers, and other salaried employees-
Number .......................................................... , ............. . 34,181 31,327 ~3) 9.1 ............. Salaries .......................................... ; ........................... '" . $29, 998, 085 $22, 203, 265 3) 35.1 ..............
Wage earners: Number ...................................................................... . 199,785 144,608 108,851 83.5 38.2 32.8 Salades ....................................................................... . 8123,088,197 563,359,059 $46,466,730 164.9 94.3 36.4
Operators- 1-----\------Number .............................. · ......................................... ..
--------------72,518 91.6 44.3 32.8
Male ........................................................................ . 138,971
1,679 96,332 1,972 2,457 -31.7 -14.9 -19.7
Female ........................................ · ............................. . 137,292 94,360 70,061 96.0 45.5 34.7 Wages ............... ~ .......................................................... .
All other employees-$66,137,070 832,474,093 $22, 636, 671 1.92.2 103.7 43.5
Number ......................................................................... . 60,814 48,276 36,333 67.4 26.0 32.9 Wages .......................................................................... . $56,951,127 $30,884, 966 $23,830,059 139.0 84.4 29.6
1 A minus sign (- ) denotes decrease. 2 In addition, systems reporting annual incomes of less than $5,000 in 1917 reported 18,139 employees and paid $6,015,383 in wages. The number of employees
shown for 1917 is as of Sept. 21:l, the number for 1912 as of Sept. 16, and the number for 1907 is the average number. 8 Separate statistics not available. .
This table presents statistics for employees, salaries, and wages only for systems reporting annual incomes of $5,000 or more. At the census of 1917, the tot~ number of the employees of systems reporting annual incomes of less than $5,000, and the total amount of salaries and wages paid them was reported to the Bureau of the Census, but no attempt was made to secure a segregation of these employees into the different classes presented in Table 35.' In fact, such a segregation would be practically impossible, and if it could be made would be of little value, since in these small systems and lines there is much overlapping of work, a single employee in many cases performing most, if not all, of the work for the entire system. The number of the employees of the systems repor.ting annual incomes' of less than $5,000 in 1917 and the wages paid them are shown, by states, in Table 14.
The number of employees shown in Table 35 for the year 1917 is as of September 29; the number for 1912 is as of September 16th; while that for 1907 is the average number reported for that year. The figures, shown for 1917 for the different classes of employees furthermore
are not strictly comparable with those for 1917 and 1912 due to the different basis of classification used in 1917. This was because the regroupllJ.g of the standard classifications required by the Interstate Commerce Commission did not fit exactly the classifications shown on the census schedule for 1912 and 1907. This is particularly true in the case of salaried employees, which results in showing a relatively small increase in the number of superintendents and managers from 1912 to 1917 and a decrease in their salaries. Under the regrouping of the Interstate Commerce Commission classifications some employees classed as superintendents and managers in 1912 were thrown in with the class of "salaried officers of corporation" in 1917.
The' Bureau of the Census also secured information regarding the weekly rates of pay of telephone employees. 'The summary of this information is pres~nted in Table 36.
A. possible element of misunderstanding in this table consists in the number of part-time employees reported. In order to properly interpret the number

46 ELECTRICAL INDUSTRIES: 1917.
of employees shown fot' the various classes of employees in the different wage-rate groups, it must be stated that the large number of employees appearing in the lower wage groups is due largely to the inclusion of part-time employees; for example, of the 979 male employees shown for the Bell System in the "Under $5.00" group, 645, or 65.9 per cent, are part-time employees. Similarly, of the 4,586 female employees in this wage group, 1)843, or 40 per cent, are parttime employees.
This table also presents statistics for a considerable number of "officers and operating heads" at nominal rates of pay. In some cases, the officers and operating
heads of small telephone companies actually devote only a small portion of their time to the telephone business and receive only a small saJlary. In other cases, especially in the reports for the Bell Telephone System, it was found necessary in order to make the reports to the Census Bureau consistent with the reports to the Interstate .Commerce Commission to class all officers serving more than one company under the distribution
·by wage groups in accordance with their salary as prorated between different companies. This resulted in showing a large number of officers and operating heads in the lower wage groups.
Table 36 SYSTEMS REPORTING ANNUAL INCOMES OF $5,000 OR MORE-NUMBER OF EMPLOYEES CLASSIFIED ACCORDING TO CHARACTER OF S~RVICE AND COMPENSATI?N PER WEEK.
OffiCers· and Att9meys, Local man-Clerical agersand Total. °lherating engmeers,
COMPENSATION PER WEEK. eads •. and employees. commercial
accountants. agents.
Total. Male. Fe- Male. Fe-Male. Fe- Male. Fe- Male. Fe-
male. male. male. male. male.
--------------------An systems, total. .................... 244,490 85,239 159,251 4,078 130 4,185 83 11,612 18,103 6,126 388
Under $5.00 ••.•.•.•••.•••..•••.•.• 11,025 1,794 9231 374 11 10 3 185 183 63 9 $5.00 to $6.99 ......... , ............ 27,402 1,583 25~ 819 170 4 8 1 684 890 52 60 $7.00 to $8.99 ...................... 39,750 1,520 38,230 65 7 20 10 585 2,465 41 61 $9.00 to $11.99 ••..•.•.•.••••••..•.. 56,536 5,590 50,946 123 7 91 " 23 936 6,431 242 136 $12.00 toS14.99 .................... 32,752 10,019 22,733 111 12 170 24 1,096 4,090 404 61 $15.00 to $23.99. ~ .................. 53,985 42,178 11,807 434 57 1,237 22 5,482 3,864 3,190 49
18,662 18,201 461 954 26 1,459 2,235 173 1,~~~ 11 $24.00 to $35.99 .................... 4,378 4,354 24 1,847 6 1,190 409 7 1 536.00 and over .... , ...............
= = = = = = Bell System, total ........................... 198,700 6g,457 129,243 2,535 77 3,964 44 10,552 15,725 4,133 269
-Under $5.00 ....... ' ..................... 5,565 979 4586 59 1 132 70 12 8
17,520 1100 16~420 23 3 625 637 15 45 $5.00 to $6.99 ............................ 30,149 1;036 29,113 14 ····r 18 9 530 2,028 10 37 $7.00 to$8.99 ............................ 49,999 4,117 45,882 21 3 78 17 788 5,528 128 92 $9.00 to $11.99 .•..•.•...•••.•.•.•.•.•.•.• 29,293 7,727 21,566 15 5 152 10 903 3,694 211 48 $12.00 to $14.99 •••.•.•.• : •.•.•..•.• ~ •.•.• 45,946 34,707 l1'~r~ 208 48 1,161 8 5,047 3'1~g 2,343 32 $15.00 to $23.99 .......................... 16,463 16,045 686 17 1,394 -..... 2'Ag~ 1,216 7 $24.00 to $35.99 ........... _ ..............
3,765 3,746 19 1,509 3 1,157 . ..... 6 198 536.00 and over ..........................
Independent systems, tota!. ••..•.•.•. '" .•.• 45,790 15,782 30,008 1,543 53 221 39 1,060 2,378 1,993 119 ------------------------
5,460 815 4,645 315 11 9 3 53 113 51 1 Under $5.00 ............................. 9,882 483 9,399 147 4 5 1 59 253 37 15 85.00 to $6.99 ............................ 9,601 484 9,117 51 6 2 1 55 437 31 24 $7.00 to$8.99 .................. · ..... •• .. 6,537 1,473 5,064 102 4 13 6 148 903 114 44 $9.00 to $11.99 .......................... , 3,459 2,292 1,~~~ 96 7 18 14 193 396 193 13 $12.00 to $14.99 .......................... 8,039 7,471 226 9 76 14 435 264 847 17 $15.00 to $23.99 .......................... \
$24.00 to 535.99 ............. , ............ 2,199 2,156 43 268 9 65 .. .... -- 105 11 555 4 536.00 and over .......................... 613 608 5 338 3 33 ... ...... 12 1 165 1
-
Operators and service inspectors.
Male. Fe-male.
-----1,697 137,274
417 . 8,148 274 24,493 201 35,081 294 43,374 148 18,270 256 7,666 81 233 20 9
= 1,144 110,139
238 3,742 148 15,414 133 26,487 229 39,317 110 17,546 197 7,407
72 217 17 9
553 27,.135 ----
179 4,406 126 9,,079
74 8,594 65 4;~~~ 38 59 259 9 16 3 ••• 1' ••••
Plantz COnstructIon,
and maintenance
men.
Male. Fe-male.
----49,195 66
216 '''26' 156 395 11
3,022 19 6,493 8
27,285 1 11,157 1
471 .. .......
39,917 53
102 '''24' 90 194 7
2,159 15 5,005 5
21,843 1
lO,~~ 1 ......
9,278 13 ----114 '-"2' 66 201 4 863 4
1,488 3 5442 ....... 1;070
34
All other employees.
Male.
--8,346
529 239 207 882
1,597 4,~
54
7,212
435 196 137 714
1,331
3'~J 31
1,134 --94 43 70
168 266 386
84 23
Fe-male.
--3,207
877 345 595 956 268 14 8
7 1 1
2,93 6
66 00
7 3 544 91 o
8 43 4
25 1 1 1
2 71
1 5 1 6 ()
11 4 5 4 1
.......
5 3
I
.J

APPENDIX
(47)

SCHEDULE USED IN SECURING STATISTICS FOR TELEPHONE SYSTEMS HAVING AN INCOME OF $5,000 AND OVER. IN 1917.
DEPARTMENT OF COMMERCE BUREAU OF THE CENSUS
fAM. L. ROGERS. DIRECTOR
CENSUS OF' TELEPHONES, 1917 *"UGENE F. HARTLEY. OHIEF STAtisTiCIAN
[015-543]
(,..\1 'l:Ol:UlDlllfOlllJ lI.ud mutll&}, 0'1' nltlb.\ or f»Oper""'le 'telephone B]'&'UlmB. aha. lOllS.cua'taUM aDa. 'tQl1 lIDes boa-vln!: All Al1IlUal JJ100llle 01 U.OO~ and over. mU!lt be raportC!d on tbll!1l1ChoQula. All otbor 't:elepboneUnoa aDd lIystemsmust b. ",ported. on fIClIoa,Ulo DltJ.-.,lSU.lor thOM bAYlDa All alUI.'IUIollDcwzne or 1e511 than f8
JOOO ill J$t7.)
N.me of Company or Syatam _._._ •• _______________ . ___ ._..,......_. __ _
Slato __ •••• __ ••••••••••••••.• _ .• _ •. _ •••••••• _ ••• _ •• _ •• __ City _ •• ___ •••• _ ••••••.•.• _ .•••. _ ••.•• _ ..••••••••
Gone:rnl Office (give slnte, city, 8tr&8t, and number) ••• _ ••.•. _ •.•••• _ •• _ •••. _ ..••.•.••.••..•.. _ .•..... _ .•..•
AUTHOR1ZATIOr-:!.
'!'be act of COngr .... approved Juno 7, 1906, authorlz ... the Dir&ctor of the Celll!tlS to .conect every fifth year statistics relating to the oIectric ind1l.9lries, including te!&phones. The act approved July 2, 1909, direct. that it sholl b. the duty of every owner, president, treaaurer, Becretary, director, or other officer !,r agent of sny establishment or company covered by the cellSUll inquiry, to furnish the information indicated by ~ho schedules that have been prepared in conformity with these requirements. •
The la.1 census of telephon ... covered the Jlear 1912, and tJris schedule has been preparsd for the census of 1917. The st.tistics should rcl'ato to the calen~ar yen ending December 31, ~911. Except in the pase of number of employees, all question. that relat. to a single dato, such as thooeregarding cashonh.nd, wire mile.ge;telephones, etc., should be of the date of thelaat day of the yen cOvered by tho report.
Tho .nawers to inquiries in regard to fin.ncial matters will be held absolutely confidential; the .epal'llto reports will be .combined so as to show·totals for aU companiM in each "tate. The information will be used oniy for the statistical purposes for which it;' given, and will not be disclosed to any individual, state, or local authority, or other Bureau or Dep'rI)Ilent of the Federal Government.
o E: RT I F' I OA TE:.
Tnls IS TO CERTnT that the inform.tion contained in tJris schedule is complete and correct to
the best of my ~owledge ~nd belief, and it coVets the parlod from •.....•...•••.•••••••••• _ •• , 19, ••••••
to .•••..•.......••... _., 19 ••.•••
'Eaob Question 81101l1Cl be aU'I'I'erea, It not 8»pUooble, u'M wor4 ttKoni!l."
12. lNco)lll: STA.nll£~T: OperatiJlg Reven'Ue& and ExpenMl!!l.
l1ucir.atnumbtrso:n.lChtduIasl.fl:lbOj&ot'b'~~actOUl1 ... prtiCflbt4b7tUJnhlltat.Coo=u·e,CGmmlu!oDlUltut1,deftJledlnl.C.C. m~"'UnUQt1DSJ1tem.o(Aa:mlttlirotTdtpbontCompanl.s."m._~1I'Itb ... hIch,pum1Ul.ttolt."'.th"ccoUIlbQlaUooUlpaolub.,.J.o, t:.1IlIu.alr"'Ulu .. -u~,Uo.QXlanDO.".~dllCtld.
ComptnltllottHq.tlaste4toreporl&m01lll.tJeurled1o.rfd):"Id'ft&CCOl&Dt'PutlUlDiWf.C.c.DUUuaJorhutruttrobJ,lu'p]tctonl.:rl.osucllmIDor '1l:,odmlnbrDrCQlUJpulpo.raq"'.bt1'tllll~tad.
C'OJDparllu hrint: &llJl\W rnlDtlu or tram ..,,0::0 to '10..0;0, al1bo1:1p :DOt reql.llrtd. to "POrt tD lb. Tillers, ... , ComJI:IHn Co=mlsmn. ~boul4 • anJft"tflllCbottb,ln.quJrftslUlm • .flpIbbla.
Non:.-Arllhlrul:lt..ldtl!uc1kclttI'WZUllMhlWo .. .bJ4bItd.'otJlRlII"bklIba .... DCtI.C C.~UlDw.thtollOmpa.tlIIUTG11l.D.orJK ... totb. B11fUuj -'opUOD,
lrcc Num- ~llpp1bblt II.c.c. Num- AmaWlt~l/Q.bl. ~_c~_'~~ _____________ :I __ ~_t~_3~_'t_~_:~!_~_c~. _____________ r_~_~-_3~_~_ll~1 I l~nglllQm1'. 11._BVfIlJpITIl'n,llKl>m,-Conl'4.
1
3tO iOD ,[,dtpbon.opetatmlrncu.~ __ ••••••••••• --.. ----- 1»-23 :J.al JlO Trltpbouoptr .. t1a&~_._. _______ :. ___________ •
N"'eb:pun, Opthil:D;nnnu, __ ._ ••• _. __ • __ ., ••
(I) )lilcdW:a~lIO!1Opemln,~ ........ -•• -•• ------.
N~::::=~=~~~=I~~~~~~:~~~=~:~~~::~~· 1 1m I'"
\= !
O~1IH01l'locna:_ ••••••• _ •••• ______ ._._. __
i":~i 11.-N~lJlClmlr.
[HI ~I m Dldd.ads:
.~~~~~I" ~~~§ I I
:-:1 I - .
I DedLlc,.~lrmtt,.YC\1asanclreport;lIl1mNl~L I "OUS C"nmpa,tlJes npGrt"UIlCClllICUW." UlIduAClClOun1300. III mbOt\l:Ul.au, dl!'dutlk!aJrclII ~J.i51DCom.
INot.pplJcabl'to"Clu!C"C(I"III~ • 'l'ltpatthtruPJnllpdltJondorlilOllfUUcUaD, .,qufplliWCllt.amS btttamnll,loI .1Dlc.1aIandolhvrestndw:ub,aad lUtsr:.lIa1Ieoul1n.aota.blvf'6tmt:Db.
12b. Ol'l:ltATJ~O Ih:velf'O':U 120. O.EItA.TING EnBNAJr.8.
1. Does company do telegraph bu!lnea'l (Auwer Yes or No) ••••• __ ._. __ ._ •...• _ ...... _ •.••.• __ ... _____ •.••. _ •.•
"2. Chuac=£~l~;~itu!r~~;:::::a~~~~~:,=:tc'r~~:,~,r'~tl,'!~~i~u~~\h:r~tl:~~~~:~:
3. It il cOMOlidatt.'d comp:t.Il}', give names a.Qd location of cOMLiluenl eompanie.!l included iQ lhill report..;_ .................... _. __ _
4. If aeubaiaiuy or leued CODlPUY, ~ve Dame and addreae- of operating company or le&:leo. ___ ._. _____ ••• ___ .•• ________ • ___ _
._---_ ... _ .. _ .. -....•.........•....•.. - ..... -.. -.-.-.. _ .. -........ _ ........ __ ... _._ .. _ ..
.--..----~-------... ~.---.. -... -.-.-.-.. --.---.-.-.-.-... -.. -.-.. - .... --... -.... ~ .. -.. -.----.--_ 7. Miles ot 4fPha.ntom Ci.reuits" __ •• ___ • __ •.•• _. ___ ._"--.• _. __ • __ ._ ••• __ • __ • ___ • __ • __ •• __ ._ •• ___ • ________ ._. __ .
8~ Numbero[ miles or pole line operated (includLng that. wed jointly with other eompaniel) ••• _. _____ . ___ •.
Central offices (by IbtC!l) •• __ .• _ .• _. _____ •• _ ••. _ ••• _.~ .• __ ••• ~_. _______ . _____ . ____ • _________ •
Privato bnnt:h exchanges (by lltatcs). ____ . ______ ._ ••••••• _.~ •••• _ ••• ____ ••• ___ .. __ .. ___ .. __ ._._ ••.. _ ••. _. ______ •
--_._ .. -.. -_ ... -....... _ ...... __ ........ _ ....... ~ ..... -.-.-.. -.... -..•... --.-.-.... ~.--.... -.--... ---_ .. _._------_ ... _--_.-
11. Eelimtlted total number of telepbone eonuections or calls. incladiagbClheompletelJttl!d. ~ihriatg the year ~1t;:ating from telephone owned. and operated by the cc=.snny npatt.iug(4a. DO\mmde ~ pri'J1l.te bruch
18.D.lmc:ooh .. l.
6:ahrlllaadlnCti IOrfC':1l.
>W •• I Yo ......
BA~:~~p~~=-=~~:;;::==~==:==.==.[=:::::~=::=:::~:::==:::::::::::::~:::::::::' TOTAL._. __________ • __ • _____ ........ _____ ._._ -._ ••••••• _--••• _ .•• _. __ •• ---.-••••.
W",OE'EAaN'E!l:B: Operators _____________ . __ .•• _____ •••. __ •. _ ••• _____ . __ ._ •.. --_.-_ ..••.• -_ .••• --
All ~=fv:irP!~:rdl<£:n:~~~n:~~=>:2.~~_~: .. ~ .. _____ . __ .. __ .. _ ... _. ______ .... _ ... ___ _ TOTAL ___ • ___ ••• _._ ... ______ •• _ ••• ~ ••• _. _____ ••••• _ •• _ ••• _ ....... _ ......... _ •• _. __ ••• _ •• __ ••• _ •• __ ...-••• n •••• _.·~··· __
a'lXAlt1t5 _____ • __ •• _. ____ ..... __ ._ ....... __ .. _ •••• ___ • ___ • ___ •• ___ ... -•• ---.-----•• ---
----.-.-.-.. --.-.... -.. --.-.. --"":'--.. -•.. -.---.. -~ ..... ~-.-._ ... _--_ ....... _ .. __ ... _._ ... _--_ ... ---------_.--.. _ ..... _ ..... -._ ..... -....... _------._ .......... __ ... -.. _ .... _-_.-....... - ........... _ ........ -_ ...... -----_ ...... -................ _ .... _.-. -_.----.- -.. - ----- --_._--_._-_._.- -----_._--_._ ... _ ..... --' -----_ ....... __ .................... _ ... : ........... _ ..... __ ........... _ .. _ ...... _ .... __ ._--------_ .. --...... .
; -' ~----.-.. ----..... -.... -.--... ---.-.-.--.. --... --..... -----_. __ .... _ ...... ---------------._-_ .. _._._ ........ _-. __ ._----_._----_.

50 APPENDIX.
SCHEDULE USED IN SECURING STATISTICS FOR TELEPHONE SyS~ TEMS HAVING AN INCOME OF'LESS TII.A.N $5,000 IN 1917.
D~P~RTMENT OF COMMERCE BUREAU OF THE CENSUS
OENSUS OF TELEPHONES. 1917 .WALI. LIND AND evaUMI
(ntlllrhH,I.!CtIll."ulaaIPqnSS,OOOllfO,n
IU".IF,N,un.n.ejfl.IP'Sut,mCI ••
(016-544)
1. Hllmtt 01 cornp:IJJ)" tine, or tyal.em _ ••• _. __ • __ ....... ____ .... ___ • __ .... _. ____ .•• __ • ___ ._ ••• _ •• _., __ •
~~ POlIkflke tlddre~ 01 busiut'u oftico: 8~le ........... __ •••••.•••••• _._. City or kl1rD •• __ ...... _ .... ___ ._ .•. __ .••.• _ .... __ ._;
3. Chll'tlder or o~ni:zanOll (whe~er Ibdlvidual, firm. or p:t.rtnerahip, lnc-orpornted c:omp:\Dy, rnut~al companY,or coopt!'m.~i'fe :woo
<!h1lloa) ___ .... _ •. ___ .... ___ ••• ____ ._ •••• _. __ •• _ •• ______ •• _..: •••••• _ ••.••• ___ .... __ ~ __ ••
4.~ Number or linies in oper.uion December 31, 1917. incl~ded III ~ repo.rf •• _____ .•. _._._., .. ~_ .... ____ • __ • ____ ~
6. NumlK!r of Jnilea 01 whe in Y"OUf entire ~ltie or .,..tem DecelDbcr 31, 1917 ______ .. ~ __ - .... ~-._ •• -:-.-... -_-_
•• Do )'ou operate .. ceDtniloutrit.chboardof: yourown.? (Yee or ,DO)_ U not, doel your )in~ or ,yslem tonnectdil"'l~t1fwIUuny
other ceM",1 or switehboard' (Y. or no) • ___ If I'yea," who owult. and where " •• U.1OCJtcd? ....... ____ ._-'--..... _
7. Number ot telephoo08 on your lil1l!1 or D~llefQ December 31, 191! __ ... ...:.. .... _ .. ;_ ...... _._ ..... _ ....... __ •.•••••••• _ .... ;-. __ _
8. Ellimtod Dumber ofontgoiu; cal,. per telophoDe per d.y __ .. ___ .... _.~ .. u_ .... _-"',.,._. __ ... _ .... _ •• _ ... ____ ... _ .. _
9. TOl1l;1 grot, ncelpte (not includinB a&leMment.e or mutual oompaoie.) from operalioQ. or Une or S)'IIUra. during 1_011".- t ____ _
10. Tola1:u)lOUDL ot lIUP81Denr, Jevi'~ by mutu~ co.tn~tdCllor Ope .... UOD and IDIliDteDDllceol UDe cfr.ymm. dunng 1917._ t._..:. __ •• _
J.i. Numbcrol regular employeeain 1911 (exc:laalveol thoee engaged oxclusively OD. addl~or extenz:joDIJ): If"n.tM ___ _
PepWeJl __ • __ .t~ Total amount. expended lor their lILIa.rln -aluS ......... __ : __ ._
19. T(~~=l~~~~~:~~J~~~~~::I·ktbOM~~Upar.;~,.tr .. lIlalrlbQlt40r_q~b'lAd(.ta..a ... Jbfn.
13. Is the Una put. of another coinpny or .)'IItem" ___ .. _.__ It 10, gi:V4I lb. it.'\D;18 and Ddcm. of INch. eolllparl;y or .ratoaa.
;z-;:::;~~ off'lWDer ~r rumll{DeI o-r..,..c.em. In 7ourviclnll.y aot. included la. thIa.report CUll back oIaclleduJ" U
J18~) ______ .......-_______________ .JiJ.· ___ ··_-:-· ..... •• .. !_······ ....
SUPPLEMENTAL INQUIRY CONCERNING WEEKLY RATES OF PAY OF EMPWYEES.
DEPARTMENT OF COMMERCE BUREAU OF THE CENSUS .
SAM. L. ROOERS. D. RECTOR CENSUS OF TELEPHONES. 1917 EUGEHE F.1IAIt'J1.EY. CHIEr STAnstIC.,,"
8 .. 4873 \ \D;17-5631:
SUPPL.EMENTAL INQUIRY CONCERNING WEEKLY RATES OF PAY OF EMPLOYEES Rulu governing the c/assi/lCa/iQn of telephone employees, in acoordance with the Interstate C<mI1TUT~ Commi.sion, eif.dive as of July 1, 1917.-All companies-CIIlllSA, B, 0, or!!lllaUer-e1iaJl use thls condensed
·daeei1ication prescribed lor CI_ 0 compani.... In columns (e) to (t). inclusive, sh6.1t the cIaasiflca.tion of employees on the basi. of the normal rate of weekly compepeation. excltmiveof pay for overtime work and bonm .... or deductions on account of abaence, etc. Jofut employees should be included in that column which represents their normal rate of weekly compensation from 0.11 parties involved in th~ joint service arrangement. Part-time employe .... i. e .• thooe that were engaged lor IIll!B than normal weekly working periods, should be ~eparately reported in the columns representative oltaeir ac~ual weekly compensation, with a note il!dicating that they are "Part-time employees."
(1. C. C. fotIII for Class C.)
CUl!.S OF EMPLOYEES.
NUMBER OF EMPLOYEES CLASSIFIED ACCORDING TO RATE OF COMPENSATION PER WEEK. AS OF SEPTEMBlm~a.1JI17. NUMBER OF EMPLOYEES IN SERVICE AS OF I I SEPTEloI;BER 29,1911. Under$S. _.99 11-48.99. _11.99. $12414.99. '15423.99. _.99. mandovw.
brill.. Felllal.'1 Total. Male. Female. Malo. Female. Mal.. FeQlale. Male. Female. Male. Femole. bral.. 1 Femole. Molo. Femalo. Mol... Female.
------.-------�·-b-·�~-e-I-d--e--f--r;--h--I--j--k--I---:--n--o-\-p-I-q--;--s-~
o~~~.;~~~~~ __________ - _____ ~=========_j===:= .Attorneys, engineers, and accountants (in. I
c1udea Groups 3, 4, 6, anc! 6 for CIa .. A and B companies)' ._. __ ._._ ••• __ ••••.•...••• _ ••••.•• _ •.••..•.••••... _ •••....•••••••.••..•• _ ..................................................................................................................... : •••.• _ ....•• :.._"
i .
E~~~1=~:~~~:~~I==:-:=~=---~~=-=-=-~-~=~~=-~::==~=~~-I=-~-:-----=-~=-= ::~::~~~:=::=::=E:CIt=~:~--:E~E:::~:~=~=~---~~~
T= •• ___ , _____ I, ______ L __ l_J ____ LJ~--L ___ LJ---LL1-------JJ----RW----

APPENDIX. 51
INSTRUCTIONS TO SPECIAL AGENTS.
PREPARATION OF THE SCHEDULES.
Answers to inquiries to be taken from books of accounts and records.-The information secured must be accurate. In drafting the schedule every effort has been made to frame the inquiries in such a form that the answers to them can generally be taken directly from the bQoks of accounts and records. The agent may find a disposition on the part of persons furnishing the information to give general statements or estimates, claiming that they approximate very closely the exact figures. In no case should these general statements or estimates be accepted where it is possible to secure the answers directly from the books of accounts and records. If the accounts cover two or more of the items enumerated for any of the inquiries; the total should be equitably apportioned for the reply to each sUbinquiry. In all cases where the answers are estimated the amounts must be preceded by the word UEstimate." .
All answers must be made clearly and neatly in ink. Each question is to be answered. Hany question is found not applicable and no amounts are reported, write the word "None "
Some of the inquiries require no ex,planation, but the following instructions, in addition to those on the schedules, should be followed by the agents in preparing all reports:
The title-page.-Page 1 must contain the name and location of the company, the address of the general office, the signature, address, and official designation of the person furnishing the information, and the signature of the special agent. Place the office number oj the report in the upper right-hand corner. If the address of the general or business office is at a different place from that of the plant, care must be taken to give both.
The period covered, whereJ;>ossible, should be that of the year ending December 31, 1917. Where, however, the business year of the establishment does not correspond to the calendar year, the data may be secured for such completed business year as corresponds most nearly to the calendar year 1917. The reports for plants that were in operation only a portion of the census year will be tabulated separately; therefore it is essential to give on the title-page the exact period covered by each report.
TELEPHONES. (SCHEDULES D15-543 AND DI6-544.)
All commercial and mutual or cooperative telephone systems that had a gross income of $5,000 or more for the year 1917 must be reported on Schedule DI5-543. All other lines and systemst including independent farmer or rural lines;... must be reportea on the short schedule (Schedule DI6-544). The statistics for farmer or rural lines that. are owned and operated by commercial companies must be included in the reports for such companies made on Schedule D15-543. (See also" Combined reports.") ,
Reports are not required for private, intercommunicating lines, such as railroad lines used exclusively for the dispatching and operating of trains, lines connecting different branches or departments of commercial plants, such as mines, power plants, timber camps, etc.
The American Telephone & Telegraph Co. operates exchange systems and long-distance toll lines in every State in the Union. These properties usually have a local name and are commonly known as the "Bell system." Census reports for all Bell systems will be prepared at the office of the parent company in New York and agents should not attempt to secure these reports in the field. A list showing the Bell systems in each State will be furnished each agent. The agent must secure reports for all so-called Bell systems which do not appear on this list.
In addition to the reports for the "Bell system," arrangements have been made with that company whereby they are to secure reports from small rural or farmer lines connecting with "Bell" exchanges. They represent lines which do not operate exchanges and are known as "Bell service lines." Agents will be furnished a list of these, shoWing the name, number, or other designation, and the exchange to which connected, and no attempt should be made to secure returns from such lines.
It is probable that a few telephone companies will be found that do a telegraph business. Where a telephone company does a telegraph business incidentally, onereport should be made on Schedule D15-543 for the entire system, but in the case of large telegraph companies doing a telephone business incidentally, the combined report should be made on Schedule D13-541 for telegraph companies.
Where the company leases its wires for telegraph work, the fact should be ascertained and stated in a memorandum attached to the schedule. And if the company is using the same wire or wires for :simultaneous telegraph and telephone work, the fact should also be noted as fully as possible.
COMMERCIAL AND MUTUAL COMPANIES. (SCHEDULE Dl5-543.)
Combined reports.-A ss.parate report for each exchange of the same system in a given State is not required. If a company operates exchanges in more than one State, separate re~orts for each State should be secured if the system of accounts will permit. If only a few lines or a comparatIvely small proportion of the company's wire and stations is in another State, one report for the entire system may be prepared, showing the miles of wire, number of stations, and the number of telephone connections or calls in each State, as called for in the schedule.
When one company leases and operates another system, the report for the operating company may include the statistics for the leased system, treating it as if it were owned. In these cases the agent should be particular to see that the combined report includes the line construction, wire mileage, stations, cost of construction and equipment, and capitalization of the leased system, and that the naJP,e of the system is given in Inquiry 4. Systems which are controlled by ownership of stock, etc., and operated independently should have separate reports.
INQUIRY 5.-NAMES AND ADDRESSES OF FAR~[ER OR RURAL LINES, ETC.
The statistics for farmer or rural lines owned by the company reporting must be included in the report, but such lines, when operated independently, must be reported on Schedule Dl6-544. (See instructions·for "Small lines and systems.")
INQUIRY 6.-MILES OF WIRE.
The answers to this inquiry must show the total number of m~les of single wire (overhead and underground) in operation or ready for operation in each State on the last day of the year covered by the report. Cables are composed of a number of pairs of wires, and the total miles of single wire must be computed and reported. If the actual length of the total single wire or of the different classes is not known, careful estimates must be secured. If wire is leased care should be taken to either include the wire and telephones in the report of the lessee (operating company) or to secure a report from the lessor company.
INQUIRY 7.-MILES OF PHANTOM CIRCUITS.
The object of this circuit is to afford additional means of service. It may be described by adding, for instan<~e, to the two wires of the ordinary metallic (' physical" circuit, proper repeating coils. Under this arrangement the two wires of each "l,>hysical" circuit serve together as one side of the "phantom 11 circUIt, and thus three serviceable metallic telephone circuits are secured from each four telephone Wires.
INQUIRY 8.-NuMBER OF MILES OF POLl:!] LINE OPERATED.
The object of this inquiry is to obtain the total length of the con:struction, but not the length of the single wire, which should be reported in answer to Inquiry 6. The number of miles reported as pole line, including pole line for farmer or rural lines owned by the company, and included in the report, and that used jointly with other companies must be the actual length in miles covered by the poles on which wire is strung, whether in cables or open wire.
INQUIRY 9.-CENTRAL OFFICES AND PRIVATE BRANCH EXCHANGES.
A "public exchange" or "central" is a place where wires are interconnected by means of a switchboard for the use of the public generally. The number of these exchanges or offices by States is called for. A private branch exchange is a switchboard within a business buildmg, apartment house, hotel, etc.-;-sometimes in a residence--:-through which wires running from one building or department or office or room to another are connected, thus establishing interior communication. Conversa1;ion with the outside ~orld . through th~ private branch exchange is had by co~nectlOn WIth the public-exchange office. The number of these prIvate exchanges must be reported by the company through which they operate.
INQUIRY 10.-NeMBER OF TELEPHONES.
The terms" stations," "boxes," and" telephones" are each intended to cover the complete instrumeut or telephone set of transmitter and receiver. The total number of sets or complete in3truments installed must be reported as of December 31, 1916, and 1917. There should be no difficulty in ascertaining the number furnished regular exchange subscribers 01' the number of exchange, local pay, and outlying toll stations. The number of stations connected with private branch exchanges and those operated by the company for communication between its different offices or departments must be included.

52 APPENDIX. If there 18 no ~eparate record of the number of telephones on
farmer or rura~ hnes owned by the company, a careful estimate should be obtamed.
It is necessary to compile statistics of the number of telephones in each St~te. If the company reporting operates in more than one ~tate, gIve the names of the States and the number of telephones m each.
INQUIRY n.-ESTIMATED NUMBER OF TELEPHONE CONNECTIONS OR CALLS.
. In reply to this inquiry the total number of telephone connectIons or calls, whether completed or uncompleted should be given except those over private exchange wires. Th~ total should in~ cl~~e aI.1 long-distance and toll connections and subscribers' calls ongmatmg on telephones owned or operated by the operating company, but not interior private branch calls or free talks.
All calls or connections from stations within the same central office or exchang:e district are to be counted as connections or calls. as these. do not Imply any exchange of business between separate compames or separate exchange systems. Pay stations are very often used for long-distance service, but it is believed that all companies .will have records bearing upon this po~nt, enabling the separatIon to be made between exchange connectIOns and the "extra territorial" work.
A long-distance message may be defined as one betwwen exchange systems of different companies, and a toll message as one b.etween exc~ange syste;ms o~ the same compaJ?Y, but these definitIOns are subJect to modificatIOn, and the practIce of the com;panies submitting re;por~s may be accepted. In securing informatIOn for the schedule It WIll probably be found that a wide variation exists in the application of the terms "long-distance" and "toll message'" but the object is to separate or distinguish the long-distance and toll messages from the regular conversations withm the central office or exchange district, for which no extra charge is made.
If the company operates exchanges in more than one State give the names of States and the number of local connections 0;' calls and the number of long-distance and toll calls in each.
INQUIRY 12.-0PERATING REVENUES AND EXPENSES.
Inquiries 12A and 12B.-This is what is known as an income account, not a cash statement, and is intended to show the earnings and expenses of the company for one year.
Since the census of 1912 the larger telephone companies have adopted the uniform system of accounts as prescribed by the Interstate Commerce Commission. The schedule for the present census has been prepared to conform as nearly as possible WIth the present method of bookkeeping.
Marginal numbers on the schedule are those of primary accounts prescribed by the Interstate Commerce Commission, as they are fully defined in the manual "Uniform system of accounts for tele~ phone companies" prescribed by that commission. Agents will be given a copy of this manual, and it should be studied and used as a Teference in connection with the preparation of the reports. The method prescribed for keeping the accounts of Class A and B companies-that is, those having annual operating income of more than $50,000-is more in detail than the one applied to Class C, which have an income of $10,000 and less than $50,000 ,Per annum. As the schedule for all companies having an annual IDcome of $5.000 or more is used by the Bureau of the Census, it will no doubt be found that companies whose annual income is between that amount and the minimum of Class C companies will not have adopted the system prescribed by the Interstate Commerce Commisf:lion for larger companies. It may be necessary, therefore, to segregate the accounts as kept by the companies to conform with the items called for under Class C on the schedule. The segregation or classification of these accounts will no doubt have to be estimated in some instances and reference should be made to Rages 23 to 28 of the Interstate Commerce Commission bulletin on 'Uniform system of accounts for Class C telephone companies."
12C-Operating expenses.-(See Interstate Commerce Commission numerals.)-Under "Repairs and maintemance" include all payments for the general operation and maintenance of the company, lines, and system, including supplies and materials of all kinds (wire, telephones, etc.) consumed during the year, except as indicated by other inquiries. •
"Traffic expenses" should include all salaries and wages in connection with the maintenance and upkeep of the plant (as reported under Inquiry 14). "General and miscellaneous" may include office supplies and expenses, travel, advertising, commissions, rentals, Insurance, legal expenses, accidents and damages, and other general expenses.
In all this income and expense showing, the statements as given by the companies will be found generally correct. If, however,
they ar~ gr?ssly at varia!lc~ with t~ose of ~imilar companies in the same locahty! or. conta~n Irrecc:mcIlable mconsistences, after the agent has famlllanzed hl;m.self WIth the subject so that he can make a clear stateI!lent f~om hl.S ow~ point of view, a friendly suggestion of apparent mcons~stenC:Ies WIll no doubt clear up the difficulties and lead to correctIOns, If such are necessary.
INQUIRY 13.-BALANCE SHEET.
The balance sheet has been arranged to conform to that used b the Interstate. Co~erce Commission, and agents must familiariz~ themselves WIth therr metho~ o.f reporting in accordance with the ~nterstate C,omm,erce CommlSslOn numerals against the several Items of the mqmry.
In cases of unincorporated companies individuals firms etc which have no liabilities of capital stock and bonds' the akou~t ?cf ~as~ .i:r;ve~~ed should be. entered under "Cash in.z..estment" of
LIabIlIties. The other Items called for are self-explanatory All these are to be given at the value carried on the books of th~ company at the end of the year covered by the report.
INQUIRY l4.-EMPLOYEES, SALARIES, AND WAGES.
• ..:.ccount for all persons employed by the companv both in the management and in the operation of the line. Th~ number of employees who were engaged on new construction work and their salaries or wages should not be included in answer to this iIlquiry. The wages of such employees should show only in the amount reporte.d for cost of construction in the It. Bal/tnce sheet," Inquiry 13: GIve the number of officer.s of corporations who receive salarIes (not the number of stockholders) and the amount of their salaries for the peri01 covered by the report. Report separately the number and sala,nes and wages by sex. The salaries and wages should inc~ude the allowance for boa.rd or rent furnished as part compensatIOn.
SMALL LINES AND SYSTEMS. (SCHEDULE D16-544.)
All independent farmer or rural telephone lines that have no exchange or "central" of their own, and other lines and systems . which had a gross income of less than $5,000 for the year 1917 must be reported on the short schedule, Dl6-544. This of course' includes a,ll lines of t~ character that connect with' exchange~ of large commercial companies or systems but which are owned independently of such companiee. In many cases independent farmer or rural lines are operated in connection with but not owned by commerc~al or mutual systems. In the~e cases the report for the commercIal or mutual system through which they operate would include the" estimated total number of messages or talks" for the yea;r of such lines, but not the wire :mileage, telephones, etc., whIch should be reported separately on the short schedule.
If several farmer or rural lines jointly maintain and operate an exchang~ or "central," one report should be obtained for the several lines and the exchange, and the names of the lines given in a memorandum attached to the schedule.
o
It is intended to secure the reports for the independent farmer or rural lines and small commercial systems so far as possible by correspondence, ~nd special agents will not be required to visit places for the exclusive purpose of secu:ring reports for such lines unless especially instructed to do so. Schedules, however, must be secured for all lines of this character when the information can be obtained in places that are visited in connection with one of the otner branches of the electrical industries. Agents must also make inquiry concerning all of the farmer or rural lines named on their respective lists D.'om which reports have not been received. If the necessary informatiOn for such lines can be secured by the use of the telephone, or in any other manner, without incurring the expense of a special trip, reports should be so secured and the source of the information given on the schedule. If the agent is advised that the line has gone out of existence or has been C01;l
solidated with some other line or system, he must report the facts by letter, giving the office numbers, names, and addresses of the lines or companies involved, so that the office lists can be corrected. If the agent discovers any farmer lines in addition to those on the list for which the information can not be secured at the places that are visited, he should mail a schedule, Form D16-544, to them, together with a return penalty envelope addressed to the Director of the Census, and give their names and addresses on his daily report, with the date on which the schedules were mailed. The office will then follow up the correspo~dence and secure the report,
The names given in answer to Inqtu:ry 5 of Schedule D15-543 must. be compared with the list, and reports secured for all systems not on the list.
In many cases the commercial company can furnish all the information required for the connecting farmer lines, and it will not be necessary to make inquiry of the owners.