bureau standards report - nist
TRANSCRIPT

NATIONAL BUREAU OF STANDARDS REPORT
10 164
TEST AND EVALUATION OF THE PREFABRICATED LEWIS BUILDING
AND ITS COMPONENTS
PHASE I PART 2
FULL-SCALE BUILDING TESTS
U.S. DEPARTMENT OF COMMERCE
NATIONAL BUREAU OF STANDARDS

NATIONAL BUREAU OF STANDARDS
The National Bureau of Standards 1 was established by an act of Congress March 3, 1901. Today,
in addition to serving as the Nation’s central measurement laboratory, the Bureau is a principal
focal point in the Federal Government for assuring maximum application of the physical and
engineering sciences to the advancement of technology in industry and commerce. To this end
the Bureau conducts research and provides central national services in four broad program
areas. These are: (1) basic measurements and standards, (2) materials measurements and
standards, (3) technological measurements and standards, and (4) transfer of technology.
The Bureau comprises the Institute for Basic Standards, the Institute for Materials Research, the
Institute for Applied Technology, the Center for Radiation Research, the Center for Computer
Sciences and Technology, and the Office for Information Programs.
THE INSTITUTE FOR BASIC STANDARDS provides the central basis within the United
States of a complete and consistent system of physical measurement; coordinates that system with
measurement systems of other nations; and furnishes essential services leading to accurate and
uniform physical measurements throughout the Nation’s scientific community, industry, and com-
merce. The Institute consists of an Office of Measurement Services and the following technical
divisions:
Applied Mathematics—Electricity—Metrology—Mechanics—Heat—Atomic and Molec-
ular Physics—Radio Physics -—Radio Engineering -—Time and Frequency -—Astro-
physics -—Cryogenics.
-
THE INSTITUTE FOR MATERIALS RESEARCH conducts materials research leading to im-
proved methods of measurement standards, and data on the properties of well-characterized
materials needed by industry, commerce, educational institutions, and Government; develops,
produces, and distributes standard reference materials; relates the physical and chemical prop-
erties of materials to their behavior and their interaction with their environments; and provides
advisory and research services to other Government agencies. The Institute consists of an Office
of Standard Reference Materials and the following divisions:
Analytical Chemistry—Polymers—Metallurgy—Inorganic Materials—Physical Chemistry.
THE INSTITUTE FOR APPLIED TECHNOLOGY provides technical services to promote
the use of available technology and to facilitate technological innovation in industry and Gov-
ernment; cooperates with public and private organizations in the development of technological
standards, and test methodologies; and provides advisory and research services for Federal, state,
and local government agencies. The Institute consists of the following technical divisions and
offices:
Engineering Standards—Weights and Measures— Invention and Innovation — Vehicle
Systems Research—Product Evaluation—Building Research—Instrument Shops—Meas-
urement Engineering—Electronic Technology—Technical Analysis.
THE CENTER FOR RADIATION RESEARCH engages in research, measurement, and ap-
plication of radiation to the solution of Bureau mission problems and the problems of other agen-
cies and institutions. The Center consists of the following divisions:
Reactor Radiation—Linac Radiation—Nuclear Radiation—Applied Radiation.
THE CENTER FOR COMPUTER SCIENCES AND TECHNOLOGY conducts research and
provides technical services designed to aid Government agencies in the selection, acquisition,
and effective use of automatic data processing equipment; and serves as the principal focus
for the development of Federal standards for automatic data processing equipment, techniques,
and computer languages. The Center consists of the following offices and divisions:
Information Processing Standards—Computer Information — Computer Services— Sys-
tems Development—Information Processing Technology.
THE OFFICE FOR INFORMATION PROGRAMS promotes optimum dissemination and
accessibility of scientific information generated within NBS and other agencies of the Federal
government; promotes the development of the National Standard Reference Data System and a
system of information analysis centers dealing with the broader aspects of the National Measure-
ment System, and provides appropriate services to ensure that the NBS staff has optimum ac-
cessibility to the scientific information of the world. The Office consists of the following
organizational units:
Office of Standard Reference Data—Clearinghouse for Federal Scientific and Technical
Information '—Office of Technical Information and Publications—Library—Office of
Public Information—Office of International Relations.
1 Headquarters and Laboratories at Gaithersburg, Maryland, unless otherwise noted; mailing address Washington, D.C. 20234.
- Located at Boulder, Colorado 80302.
•' Located at 5285 Port Royal Road, Springfield, Virginia 22151.

NATIONAL BUREAU OF STANDARDS REPORT
NBS PROJECT NBS REPORT
4215412 February 1970 10 164
TEST AND EVALUATION OF THE PREFABRICATED LEWIS BUILDING
AND ITS COMPONENTS
PHASE I PART 2
FULL-SCALE BUILDING TESTS
By
Thomas W. Reichard and Edgar V. Leyendecker
Structures Section
Bui Iding Research Division
Institute for Applied Technology
for
Commanding Officer
Naval Civil Engineering Laboratory
Port Hueneme, California
IMPORTANT NOTICE
NATIONAL BUREAU OF STA
for use within the Government. I
and review. For this reason, the
whole or in part, is not authori.
Bureau of Standards, Washingtoi
the Report has been specifically|
Approved for public release by the
director of the National Institute of
Standards and Technology (NIST)
on October 9, 2015
accounting documents intended
ubjected to additional evaluation
listing of this Report, either in
Office of the Director, National
the Government agency for which
pies for its own use.
<NBS>
U.S. DEPARTMENT OF COMMERCE
NATIONAL BUREAU OF STANDARDS


Abstract
A two bay modification of the three bay Mark III Lewis
Building was tested in the laboratory to determine gross
structural inadequacies in the building. Measured vertical
and lateral load capacities are reported for the two bay
structure and estimated for a three bay structure.
1


Table of Contents
Page
Abstract i
1. Introduction 1
1.1 Objective 1
1.2 General 1
1 . 3 Scope 2
1.4 SI Conversion Units 3
2. Components and Erection of the Test Building . 4
2.1 Components 4
2.1.1 Panels 4
2.1.2 Aluminum Extrusions 5
2.1.3 Ridge and Transverse Beams .... 6
2.1.4 Gable End Member 6
2.1.5 Aluminum "Eye" Beams 7
2.2 Building Erection 7
2.2.1 General2.2.2 Caulking of Joints 102.2.3 Problems in Erecting the Building . 112.2.4 Erection and Disassembly Time ... 14
3. Loading, Instrumentation and PerformanceCriteria 15
3. 1 Loading 153. 2 Instrumentation . 18
3.2.1 Lateral Deflect ion Measurements . . 183.2.2 Vertical Deflection Measurements . 193.2.3 Load Measurements 19
3.3 Performance Criteria 20


4. Test Results 2 0
4.1 General 204.2 Racking Test No. I 214.3 Roof Load Test 274.4 Racking Test No. 2 314.5 Racking Test No. 3 36
5. Conclusions and Recommendations 40
5.1 Conclusions 40
5.1.1 Erection 405.1.2 Structural 41
5.2 Recommendations 44
5.2.1 Erection 445.2.2 Structural 44
6. Acknowledgments 45
7. References 46
i ii


TEST AND EVALUATION OF THE PREFABRICATED LEWISBUILDING AND ITS COMPONENTS
PHASE I PART 2
FULL-SCALE BUILDING TESTSby
T. W. Reicbardand
E. V. Leyendccker
1. Introduction
1 . 1 Obj ect ivc
The primary objective of this study was to evaluate the
performance of a Mark III model of the Lewis Relocatable
Structure under simulated wind and snow load. A secondary
objective was to evaluate the relocatable feature of the
structure
.
1.2 General
The Mark II T model building was prefabricated in Florida
using 4 ft wide sandwich panels described in the Phase I
Part 1 report [1]—^ and was made by the manufacturer of
the Brand A panels described in that report.
17Numbers in brackets refer to referencesraphy
.
in the hibliog-
1


The basic design of the building was detailed in h’AVFAC
Drawing No. 065-012, dated November 1, 1968.
The erection and structural details for the building were
given in a set of 8 drawings entitled "Relocatable 20 ft
6 in x 48 ft 9 in Lewis Building for the Department of the
Navy.' This set of drawings, dated February 17, 1969, was
prepared by the manufacturer of the building.
The structure was designed as a 16 ft long module, 20 ft
wide. Three such modules made up the 20 ft x 48 ft buildin
Because of space limitations in the test laboratory a two
module, 20 ft x 32 ft building was erected for these tests.
1 . 3 Scope
The purpose of the test program was to discover any gross
strucutral inadequacies in the building design and not to
develop complete data on all aspects of the structural per-
formance .
Two types of loads were imposed on the building. One type
was a simulated snow load on a 12 ft long section near the
center of the building. The second type was a simulated
wind load applied to one long wall of the building.


SI Conversion Units1 . 4
In view of present accepted practice in this country in this
technological area, coinmom U.S. units of measurement have
been used throughout this paper. In recognition of the
position of the USA as a signatory to the General Conference
on Weights and Measures, which gave official status to the
metric SI system of units in 1960, we assist readers inter-
ested in making use of the coherent system of SI units, by
giving conversion factors applicable to U.S. units used in
this paper.
Length 1 in =0.0254* meter1 ft =0.3048* meter
Area 17
. Lm . -4 2=6.4516* x 10 meter1 f t ^ =0.09290 meter^
Force 1 lb(lbf) = 4.448 newton1 kip = 4448 newton
Pressure
,
Stress
1 ps i
?= 6895. newton/me ter
"
1 ksi = 6.895x10^ newton/meter
Mass Volume
1 lb/ft^ (ibm/ft^) = 16.02 kilogram/me ter'^
Moment
1 kip-in = 113.0 newton-meter
*l£xact ly


2
.
Components and Erection of the Test Building
2 . 1 Components
The major components of the building were:
1. 4 ft x 8 1/2 ft wall panels.
2. 4 ft x 20 1/2 ft floor panels.
3. 4 ft x 11 1/2 ft roof panels.
4. 16 ft long ridge beams.
5. 20 ft long, gable shaped, transverse beams.
6. Triangular 20 ft 6 in gable end member.
7. Tight different aluminum extrusions.
8. Aluminum "Eye" beams (extruded).
9. Extruded rigid vinyl "locking cleat."
2.1.1 Pane Is
The wall, floor, and roof panels were three in thick,
symmetrical sandwich panels. The sandwich core was 11 per-
cent phenolic impregnated, 99 lb kraft paper fabricated into
a 5/4 in cell size honeycomb. The skins on the floor panels
were .050 in (nominal) mill-finish, sheet aluminum. The
skins on the wall and roof panels were 0.024 in prefinished,
stucco embossed, coiled sheet aluminum. The skins were


3105-H264 aluminum with a yield strength of 24,000 osi and
an ultimate strength of 26,000 psi. The skins were bonded
to the honeycomb with a synthetic rubber adhesive.
The floor panels were made with a special aluminum channel,
edge-member surround (extrusion G, figure 2.2). The paper
honeycomb was exposed at the edge of the roof and wall
panels
.
The lengthwise edges of the wall and roof panel skins were
bent into a "J" shaped, internal lock groove during fabri-
cation. Figure 2.1 indicates the use of the rigid vinyl
extrusion to connect the "J" shaped edges of two panels
together.
2.1.2 Aluminum Extrusions
The purpose, shape and scaled size of the
the building are shown on figure 2.2. Ext
G were used as parts of the gable end memb
and transverse beams in addition to the us
figure 2.2. The extrusions were aluminum
extrusions used in
rusions A, B, and
er, and the ridge
es indicated on
alloy 6063-T6.
5


2.1.3 Ridge and Transverse; Beams
The ridge and transverse beams were fabricated from long
pieces of the sandwich panel material described in section
2.1.1. Extrusion A was used as the bottom flange of both
types of beams as well as the top and end flanges of the
transverse beam. Extrusion B was used as the top flange of
the ridge beam. Extrusion C was used at the ends of the
transverse beam.
The extrusions on the beams were connected to the sandwich
panel material with 1/8 in diameter aluminum pop rivets at
about six in on centers.
2.1.4 Gable End Member
In this model of the building the wall panels are the same
height at the ends as on the sides. To close in the gable
ends full width, 20 ft 6 in long, triangular members were
fabricated to fit betv/een the top of the walls and the roof.
These members were fabricated from the 3 in thick sandwich
panel material (described in section 2.1.1) and edged with
aluminum extrusion A (figure 2.2). Triangular parts made
by welding 3 pieces of 1/8 in thick aluminum plate together
were used at the eave ends of these members. The individual
6


parts were fastened to the sandwich panel material with 1/8
in diameter aluminum pop rivets.
2.1.5 Aluminum ,TEye" Beams
Aluminum Eye 1 beams served as the foundation for the build-
ing. These beans were extrusions obviously made for some
other purnose as they had several special purpose projections
on the web and one flange. Neglecting these projections the
dimensions of the beams were:
Depth - 10 in
Width - 4 in
Web thickness - 3/32 in
Flange thickness - 5/32 in
Weight - 2.56 lb/ft (Including projections)
Aluminum type - 6063 -T5
2.2 Building Erection.. s .. .. —
2.2.1 Genera 1
The building was prefabricated in Florida and trucked to
Gaithersburg, Maryland in five crates (figure 2.3). The
crates and their contents were received in what appeared to
7


be good condition. During the testing of the building some
moisture was observed in the floor panels, consequently
three floor panels were cut open following the structural
tests. Water ran out of all three when cut open, but the
core was obviously wet in only one. This core was saturated
with water, but only on one end of the panel. The source
of the water is not known since the floor panel cores could
not be inspected as received due to the factory installed
closure extrusions.
The 20 ft x 32 ft portion of the building was erected by
laboratory personnel on a reinforced concrete test frame
cast on the floor of a large environmental test chamber
(figure 2.4). The aluminum "Eye" beams were connected to
nine steel -plywood plates anchored to the concrete test
frame (figures 2.4 and 2.5). The plates simulated piers
called for by the building design.
The floor panels were placed, starting at one end of the
building, after the ’'Eye" beams were connected to the "pier"
plates. Six 1/4 in aluminum stove bolts were used to fasten
the first floor panel at each intersection with the longi-
tudinal "Eye" beams (three bolts on each 20 1/2 ft side)
.
Subsequent panels were laid in order by connecting the edges
of the factory installed extrusion G (figure 2.2) in a
8


tongue and groove fashion. Three 1/4 in bolts were used to
connect the exposed side at the floor bear; intersections as
shown in figure 2.6.
After the floor panels were in place extrusion D was fastener
to the floor with stainless steel No. 8 and No. 10 sheet
metal screws. These screws were placed in a double row
along the extrusion at six in on centers in each row.
The wall panels were set into extrusion D starting at a
building corner (figure 2.7). The rigid vinyl extrusion was
inserted, from the top, into each vertical wall joint except
at the corners where extrusion II was used. Stainless steel
No. 8 sheet metal screws at six in on centers fastened both
faces of each panel to extrusion P (figure 2.8).
bxtrusion A was placed on the top of the end wall panels
and extrusion B on the top of the side walls.
The gable end members were then placed on ton of the end
walls. These members were, fastened to the end wall extru-
sion with 1/4 in aluminum stove bolts at 12 in on centers,
inside and out (figure 2.9).
9


The transverse bean and the longitudinal ridge beams were
then placed and connected to each other and the gable end
members with 1/4 in stove bolts (figures 2.24a and c)
.
The roof panels were then installed using extrusion F, at
the ridge and extrusion F at the cave. Mo. 8 sheet metal
screws were used at 6 in on centers (inside and out) to
fasten the extrusions to the panels.
Five windows and two doors were used in this building.
These components came prehung in special wall panels.
Figure 2.10 is a picture of the south end of the completed
building through the exterior doorway of the test chamber.
Figure 2.11 is a picture of the building after disassembly
and removal from the test chamber.
2.2.2 Caulking of the Joints
All through-wall joints and connections were liberally
caulked prior to placing two parts together with the excep-
tion of the lengthwise joint between the wall panels and
between the roof panels. These lengthwise panel joints
were sealed only by the extruded vinyl locking cleat (figure
2.1). A fine seam of caulking was also placed on many of
the pane 1 - to - aluminum extrusion connections after assembling.
10


The caulking material came in gun cartridges and vms a
white vinyl latex caulk'' soluble in water until set.
2.2.5 Problems in Erecting the Building
1. Tolerances - Many of the problems encountered in erect-
ing the building were due to dimensional incompatibility,
some of which could have been eliminated by providing larger
tolerances
.
a) Floorlength - The length of the floor was greater
than the length of the wall panels. This would not have
been a problem except that the skirt of the floor extrusion
(extrusion D) was designed to extend down over the floor
panels. In this instance the skirts on the end wall extru-
sions had to be cut off.
b) Gable End Member - Another example of a dimensional
problem was the triangular gable end member. Figure 2.9
illustrates this problem encountered when making the roof-
wall corner connections. As can be seen the gable end
member was so high at the corner that the extrusion along
the top of the side wall had to be moved up about 5/4 in to
line up vrith the gable end. This meant that the vertical
loads from the roof were transmitted by the sheet metal
screws instead of by bearing to the wall skins.
11


c) Tall Panels - Another example was in the length of
the wall panels. The building was designed so that vertical
roof loads v/ould be transmitted through the extrusions (A
or B) to the wall panel skins by bearing. Note the shoulder,
on the inside of these extrusions (figure 2.2) where the
skins are supposed to bear. Actually the wall nancls were
unequal in length (Some as much as 3/8 in longer than others)
so that the loads were transmitted through the screws at
many locations.
d) Ridge Beam to Gable Connection - A time consuming
problem was found when connecting the ridge bears to the
gable ends. Numerous trial fittings and cuttings were made
before the final connections were made.
2. Production errors - Although sonic of the problems listed
above could be termed production errors the following prob-
lems were caused by human error in fabrication.
a) Slip Sheeting - The most time consuming problem
encountered; in erecting the building was caused: by a produc-
tion error termed slin sheeting.' This ter’ • means that one
skin of a sandwich panel is not lined up with the other
skin. It could be a linear or angular translation. \n uilnr
translation was the more difficult problcr hero. l 'owc times
the vinyl locking cleat could not lie forced all the wav in
without heavy hammering. This procedure tends to split the
12

vinyl cleat. In one instance the cleat could not even be
hammered in all the way. When it was decided to replace
the bad panel the two partially connected panels could not
be separated without sawing.
b) Cut Outs - Poor production procedure was particularly
evident in the cut-outs in the panels containing factory
installed, windows and for the duct system through the trans-
verse beams. The window cut-outs were not always square
with the panels and were oversize. One window cut-out was
so large that some of the window-fastening screws did not
even contact the panel skins.
In making the cut-outs for tiic duct through the transverse
beams the saiv cuts were continued past the cut-out corners.
This resulted in stress-concentrating notches at each corner
of the cut-out. The transverse bean fractured at one of
these corners in a load test described in a later section.
c) Delaminated Panels - Some of the floor panels were
defective which caused some erection hold ups. Poor pro-
duction procedures in making the panels caused delamination
or loss of bond between the skins, extrusions and the core.
The panel skins were subsequently fastened to the edge
extrusions with sheet metal screws
.
d) Core Woisture - Three floor panels were cut open
following the building tests. Two of these were considered


defective (delaminated) and the other appeared to be satis-
factory. Water ran out of all three when cut open, but the
core was obviously wet in only one. This core was saturated
with water, but only on one end. A piece of the saturated
core when dried in a 220°F oven lost 55 percent of its dry
weight. This weight loss did not include the excess water
which ran out when preparing the oven specimen.
e) Predrilling - In erecting this building approxi-
mately 3,000 sheet metal screws were installed. Approxi-
mately three man-days would have been saved if the extrusions
had been predrilled for the screws.
f) Core Discontinuity - At least one roof panel was
produced with a discontinuity in the core. This was caused
when the honeycomb was not long enough for the panel. To
complete the panel another piece of core was placed in, but
with no attempt to splice the two pieces of core.
2.2.4 Erection and Disassembly Time
Erection was started Tuesday, April 1, when the crates were
opened and an inventory was made. The inventory was made
because it appeared that some items might have been lost
or stolen from one of the five crates. Although no packing
list was available it appeared that only the asphalt tile
and cement for the floor were missing. Subsequently it
14


was learned that these items had not been crated and nothing
was missing. Erection was completed Wednesday, April 9,
although a small amount of finish -caulking was performed
April 11.
Overall, 36 man days (7 1/2 hr days) were used in erecting
the building. This time could have been reduced consider-
ably if the problems noted in section 2.2.3 had not arisen
and if extreme care had not been taken in erection.
The disassembly of the building was accomplished with 10
man-days labor. This included the time for stacking the
components in preparation for crating.
The building could be erected again at another location with-
out difficulty if some of the components had not been damaged
during testing. Reassembly should, in fact, be easier since
screw holes were already drilled in the various extrusions.
3. Loading, Instrumentation and Performance Criteria
3 . 1 Loading
The Mark III was load tested under vertical roof load and
simulated lateral wind load. The vertical roof design load
15


was 35 psf and the wind design pressure was 25 psf. These
load values were obtained from the Mark III drawings.
The design wind pressure of 25 psf may be related to wind
velocity by the use of the formula
P = 0.00256 C, V2
o h
where
:
(3.1)
PQ = pressure, psf
= shape factor = 1 for the Mark III
V - wind velocity, mph
as obtained from NAVFAC’s DM2 [2], Thus 25 psf corresponds
to a 99 mph wind since = 1 for the Mark III [2].
The critical wind load pattern [2] for the building is shown
in figure 2.12a. It was assumed that the roof suction pres-
sures were not critical for the simulated wind loading,
hence a simplified loading pattern is shown in figure 2.12b.
The total wind load on the building is the sum of the wind-
ward and leeward pressures times the wall area or 1.311
(where H = Pq
x Wall Area) . Thus one design load is
1.3x25 = 32.5 psf considering the pressure on both walls.
Laboratory equipment was not available for applying a uniform
load over such large wall areas, hence it was assumed that
16


pressures could be replaced by concentrated loads on one
wall only. For convenience it was decided to apply the
simulated wind load to the leeward wall. Two loading pat-
terns were considered as shown in figures 2.12c and d.
Condition (c) provides the same base reactions as condition
(b),however it was felt that this loading could lead to a
local wall failure. Loading (d) provides the same external
eave reaction as loading (c) and lessens the chance of a
local failure. The base load of 1.311/ 2 was eliminated for
laboratory loading, leading to the applied load shown in
figure 2.12d. The loading shown in figure 2.12d provides
the same base bending moment but only one-half the base
shear shown in figure 2.12b.
The simulated wind loading is shown schematically in figures
2.13a and 2.13b. Note in the figure that the eave load was
applied at four points using ten ton capacity hydraulic
rams. The four identical rams were operated from a common
manifold to insure equal force at each load point.
The design vertical roof load was 35 psf. Laboratory equip-
ment was not available for loading the entire roof surface
uniformly. Therefore, the actual roof load was applied
over six roof panels as shown in figure 2.14. Note that
the panel directly over the transverse beam was loaded.
17

'

This loading was selected to provide information on trans-
verse beam, longitudinal ridge beams, and roof panels. The
six panels were loaded by four 4 ft x 12 ft air bags as
shown in figure 2.15.
The pressurized air bags applied load normal to the roof.
However, the vertical roof pressure is approximately 983 of
the normal roof pressure for the 2.5 on 12 slope of the
roof, hence the vertical pressure is assumed equal to the
normal pressure.
3 . 2 Instrumentation
3.2.1 Lateral Deflection Measurements
The lateral movements of the side walls in the plane of the
end walls were measured at twenty locations using LVDT
linear displacement gages (2-in. measuring range). Figure
2.16 is a schematic of the gage layout for these measurements.
The analog signals from the gages were fed into a 100
channel data processor and recorded on perforated paper
tape as well as a printed copy.
18


3.2.2 Vertical Deflection Measurements
Vertical movements of the ridge line were measured with a
surveyors level and leveling rods bonded to the ridge.
Figure 2.17 indicates the position of the five leveling
rods on the ridge line of the building. The leveling rods
were made by gluing paper centimeter scales to wooden rods.
These rods were held upright by a horizontal taut wire
fastened to the walls of the laboratory.
5.2.5 Load Measurements
a) Roof loads - The roof loads were developed by the
pressure in four air bags connected in parallel. The bag
pressure was measured with a low pressure, strain gage
pressure transducer.
b) Racking loads - The racking loads were developed
by hydraulic rams connected in parallel to a hydraulic
power supply. The ram pressure in the hydraulic system was
measured with 10,000 psi, strain gage pressure transducers.
The load on the building was calculated from the ram pres-
sure .
10


3.3 Performance Criteria
Establishing acceptable performance criteria for the Lewis
Building is beyond the scope of this report. Items such as
load factors and acceptable deflections must be determined.
These criteria are dependent on the use of the building.
The Mark III model tested (two bay building) was a modifi-
cation of the actual designed structure (three bay building)
.
The load response characteristics of the two structures are
different. Thus the two bay laboratory building cannot be
used to determine acceptability for a three bay building
under a performance criteria. It can however be used to
determine structural defects and approximate load capacities
for a three bay structure.
4 . Test Results
4 . 1 General
Four load tests were conducted on the building. These were,
in chronological order, (a) racking test No. 1, (b) roof
load test, (c) racking test No. 2 and (d) racking test
No. 3
.
20


Racking test No. 1 was performed primarily to determine the
effects of lateral loads on air leakage up to about one
design load. The roof load test was performed to determine
the behavior and strength of the roof system under vertical
load. Racking test No. 2 was performed to determine the
behavior of the building under lateral loads larger than one
design load. Racking test No. 3 measured the ultimate
capacity of the building under lateral load.
4 . 2 Racking Test No. 1
The purpose of this test was to obs
leakage of one design lateral load
32.5 psf) . The air leakage results
report [3]. Structural data are de
erve the effect on air
(one design load =
are described in another
scribed in this section.
The lateral load was cycled ten times to 15.7 psf, the load
was then increased monotonically in about three psf incre-
ments from 0,0 to 31.5 psf (0.97 design loads). At 31.5
psf the test was halted due to large horizontal movement of
the floor panels with respect to the "Eye" beam foundation.
The movement is shown in figure 2.18 by an end view of the
deformed central longitudinal "Eye" beam. The intersection
of the web with the top flange moved about 0.3 in from the
original centerline of the web. This movement is discussed
below.
21

mm

A plot of lateral load versus midlength lateral deflection
of the west wall eave and base is shown in figure 2.19.
The total deflection at the base of the wall is shown dotted
while the total deflection at the top of the wall is shown
solid (total deflection with respect to the reaction floor).
The load-deflection curves do not start at zero due to
residual deflections obtained when cycling the load ten times
to 15.7 psf. An undetermined portion of the residual deflec-
tions is due to slack in the building system. The base
deflection in figure 2.19 is initially due to the deformation
of the longitudinal "Eye" beams as shown in figure 2.18.
Between 18.9 and 22.0 psf a bolt connecting the north floor
panel to the "Eye" beam in the northwest corner of the build-
ing sheared. This accounts for the large base deflection
of about 0.15 in during this load increment. Loading was
continued up to 31.5 psf (0.97 design load) and the test was
then halted. One full design load was not reached due to a
small error in calibration of the load measuring transducer.
The total deflection at the top of wall (figure 2.19)
reflects the base movement plus additional top movement.
Net top wall deflections for all lateral gage points are
\
shown in figure 2.21 and are discussed later. The net
deflections were unaffected by the large base deflections.
22


A free body diagram for lateral forces is shown in figure
2.20. The lateral load is transferred into the "Eye" beam
foundation by shear through the 1/4-in bolts (neglecting
friction) attatching the floor panels to the "Eye" beams.
Due to the relative stiffness of the side walls, end walls,
and roof the lateral loads are transmitted by diaphragm
action through the roof out to the end walls and then into
the floor panels. These lateral loads are then transferred
into the foundation "Eye" beams almost entirely by the
1/4- in bolts attaching the two end floor panels to the "Eye"
beams. That is, almost all of the lateral load is carried
by six-1/4 in bolts (three on each end of the building),
assuming that no shear is transferred between adjacent floor
panels. Note also that the base lateral load in figure
2.12c was not applied during this test so that the total
base shear carried by the bolts in this test was only one
half of what it would be under the wind load shoivn in figure
2.12a.
The panels were attached to the foundation beams by
aluminum tie-down bolts placed only in the longitudinal
beams, as called for on the building plans. The lack of
connection between the transverse foundation "Eye beams and
floor panels permitted free movement of the floor panels
with respect to the transverse beams. Because of this the
23


longitudinal beams had large shear forces applied at the
top flange, hence the deflected shape shown in figure 2.18.
After unloading, eight 1/4 in tie-down bolts were used to
attach the floor panels at the two ends of the building to
each of the four exterior transverse foundation "Eye'’ beams
for a total of 32 additional bolts (eight equally spaced
bolts per beam). These bolts, which were not called for on
the building plans, were in place for all subsequent tests.
These bolts increased the lateral load capacity of the
foundation by about 6.3 times. The additional bolts also
decreased the shearing load causing twisting in the longi-
tudinal beams by transmitting some load into the transverse
beams. It is shown in section 4.4 that the relative deflec-
tion of the top of the wall with respect to the base was
not significantly affected by the large base movements during
this test.
The relative lateral deflections at the top of the wall are
shown in figures 2.21 a through e. Two curves are shown
for each of five plots. The west wall (loaded wall) deflec-
tions are shown solid while the east wall deflections are
shown dashed; both curves of each plot are for the same
building cross section. Except for the curve shown in
figure 2.21d, the general trend of the deflection data is
for the loaded wall to have a slightly larger lateral
24


deflection than the unloaded wall. While loading from
18.9 to 22.0 psf a tie-down bolt connecting the building
to the aluminum "Eye" beam foundation sheared off in the
northwest corner of the building. This is reflected in
figure 2.21 by a change in the load-deflection relationship
for most of the deflection data shown. This change is
usually in the form of an increase in the rate of deflection
with increasing load. The east wall deflections (shown
dotted) in figures 2.21b and c show a decrease in deflection
with loads larger than 18.9 psf. Examination of the origi-
nal test data indicates that this is probably due to the
deflection instrumentation binding and not following the
actual movement of the building. The binding may have been
caused by the bolt shearing off but, in any case, the two
curves probably reflect faulty instrumentation rather than
the actual load-deflection curves.
Vertical ridge deflection data are not shown for this test
since they were so small as to be negligible.
There was no visible damage to the building during this
test other than the slightly bent longitudinal foundation
beams (bent in the shape shown in figure 2.8) after unload-
ing .
25


Wind velocities may be obtained from the measured lateral
loads by using equation 3.1
P = 0.00256 C.V2
o h(3.1)
It was shown in section 3.1 that the total lateral load on
the Lewis Building at a given wind velocity is 1.3 Pq
(0.8 P and 0.5 P on the windward and leeward wallsK o o
respectively) . Thus the wind velocity may be computed as
where :
or
:
V ='
0 . O0 2$6 C,(3.1a)
V = wind velocity, mph
Pq
= measured load per sq ft/1.3
C, = 1h
,, j-Jmeasured load per sq . ft .
'
V ' 1.3 x 0.00256 (4.1)
The maximum lateral load capacity for racking test No. 1
was 18.9 psf (75 mph wind), assuming the tie-down bolt
fracture constitutes failure. However, even with the
fractured bolt the test structure withstood 31.5 psf (97
mph wind) before loading was arbitrarily halted. Since
actual load conditions produce twice the base shear as in
the tests, the test structure should be limited to 9.4 psf
26


(53 mph wind). Assuming a load factor of 2.0 the service
load is 4.7 psf (36 mph wind).
Similar loads may be computed for a three bay structure
assuming the same failure mode occurs. It is possible
however that a different type of failure could occur in
the longer three bay building, depending on the stiffnesses
and strengths of the various components. Based on the
assumption above, the failure load is 2/3 of two bay load
(9.4 psf) or 6.3 psf (43 mph wind) . Assuming a load factor
of 2.0 the service load is 3.2 psf (31 mph wind).
4 . 3 Roof Load Test
The design live load for the roof was 35 psf as obtained
from the building plans. Only three of the nine roof panel
sections were loaded, one of which was located symmetrically
over the transverse beam at the midlength of the building
as shown in figure 2,14.
The load versus the midlength vertical and horizontal roof
deflections are shown in figure 2.22. The vertical ridge\
deflection is shown in the right hand portion of the figure.
The west eave lateral deflection is shown in the left hand
portion of the figure. The east eave (not shown) and west
27


eave lateral deflections were equal, within a few percent.
The maximum recorded load was 38.2 psf (vs 35 psf design
load for the entire roof loaded) with an estimated (dis-
cussed below) deflection of 0.93 in at midspan. At 38.2
psf the load suddenly dropped to 25.0 psf accompanied by
a loud cracking noise before deflections could be recorded.
The estimated load-deflection path is shown dashed. The
estimated path is the projection of a straight line through
the last two known data points up to the known maximum load
of 38.2 psf, then a line was drawn from the maximum point
to the 25 psf data point. The load was increased to 32.5
psf with a vertical deflection of 1.33 in. At this point
the test was halted since the maximum load had been reached.
It was felt (based on the load-deflection curve in figure
2.22) that further loading could further damage some portion
of the building and invalidate load data obtained for future
racking tests.
Ridge deflection profiles are shown in figure 2.23 for each
stage of loading except for the maximum load of 3S.2 psf for
which deflections were not obtained.
A general view of the building interior before testing began
is shown in figure 2.24a with arrows indicating areas dam-
aged during the roof load tests. Close up views of these
28

1

damaged areas are shown in figures 2.24b, c, and d. Inspec-
tion of the interior of the building indicated that the
west longitudinal ridge beam between the transverse beam
and south end wall slipped down at the connection to the
transverse beam (about 1/4 in relative to the transverse
beam and roof), pulling the screws out of the roof panels
near the center of the building as shown in figures 2.24c
and d. Slight buckling of the transverse beam aluminum skin
at the transverse beam to wall connection was also observed;
this is shown in figure 2.24b.
The roof was loaded as shown in figure 2.25. The ridge
beams must transmit a large reaction from the roof load
through the connection into the transverse beam. Close
examination after all testing was complete showed that the
rivets connecting extrusion A to the ridge beam had been
sheared. Although this v^as not found until after all test-
ing was completed, it accounts for the observed failure.
The failure pattern is shown in figure 2.25b. As the rivets
sheared, the reaction was transferred from the connection
into roof panel P by means of the screws connecting ridge
beam B to roof panel P. These screws could not carry the
load so they pulled loose (rom the roof skin as shown in
figures 2.24d and 2.25b.
29


An approximate uniform load over the entire roof nay be
computed from these test results although the system is
inde t erminate
.
Th e f ol low ing assumpt
i
ons are made (re fer
to f
i
gure 2.14) •
1
.
There is no transfer of shear be tween roof panels.
2 < The react ion of roof panels d irect ly over the endwalls is carried only by the end wall s .
3 . The re act ion of roof panels d irect ly over thetransv ers e b earn is c arried on ly by th e transversebe am
.
4. The ri dge be ams are simply supported by the endwalls and tr ansverse beam
.
5 . Roof p ane Is other th an those in 2 and 3 arc s i mp lysupported by the rid ge beams and side walls
.
6. There is no change in the fai lure mod e .
Based on tliis s e t of assumpt
i
ons a uni form load can be c on-
puted whi ch giv es the same reaction at the rid ge beam to
trans vers e beam CO nne ction wh ich cause d failure during this
load test at 38 . 2 psf . This computed uniform load ove r the
ent ir e ro of sur f ac e i s about 28 psf.
These ass umpt ions are certain ly not ex act; however the
degree of error may be checked by comparing the computed
reaction at the transverse to ridge beam connection and
comparing this with the connection capacity. The computed
50


reaction at 38.2 psf is 95S lb (based on the assumptions
above). The measured capacity of one rivet is 102 lb. Thus
the ten rivets which failed in the connection have a capac-
ity of 1,020 lbs. This is about seven percent larger than
the computed failure reaction. This indicates that the
assumptions are reasonably accurate enough to compute an
approximate uniform load.
The ultimate roof load on the two bay laboratory structure
was 3S.2 psf. Assuming a load factor of 2.0 the service
is 10.1 psf. The load-deflection plot in figure 2.22
indicates the service load should be between 15.3 and 23.3
psf (departure from linearity). Using the same load factor
of 2.0, the service load for a uniformly loaded roof is
14.0 psf. The two bay laboratory structure and the three
bay field structure would both have the same ultimate and
service loads providing the same failure mode occurred in
each and the load responses were similar.
4 . 4 Racking Test No. 2
It was indicated in section 4.2 that insufficient holts
were provided near the ends of the building to transmit
the shear forces in the end walls into the 'Eye beam
foundation. At the end of racking test No. 1, 32 additional
31


bolts were installed to prevent large horizontal movements
between the floor panels and aluminum ,: Eye” beam foundation.
The effect of these bolts on lateral movement is shown in
figure 2.26 by comparing the base deflections and net cave
deflections between racking test No. 1 and No. 2 at the
midlength of the building. Base deflections arc compared
at the left hand portion of the figure. Residual deflections
were eliminated for comparison purposes. Racking test No.
2 shows much smaller base movement when compared with rack-
ing test No. 1. The net eave deflections are compared in
the right hand portion of the figure. The load - de flee t ion
responses are almost identical even though the base deflec-
tions are far different from each other. This indicates
that the additional 32 bolts increased the base shear resis-
tance but did not significantly affect the net load-
deflection characteristics of the wall eave deflections with
respect to the floor.
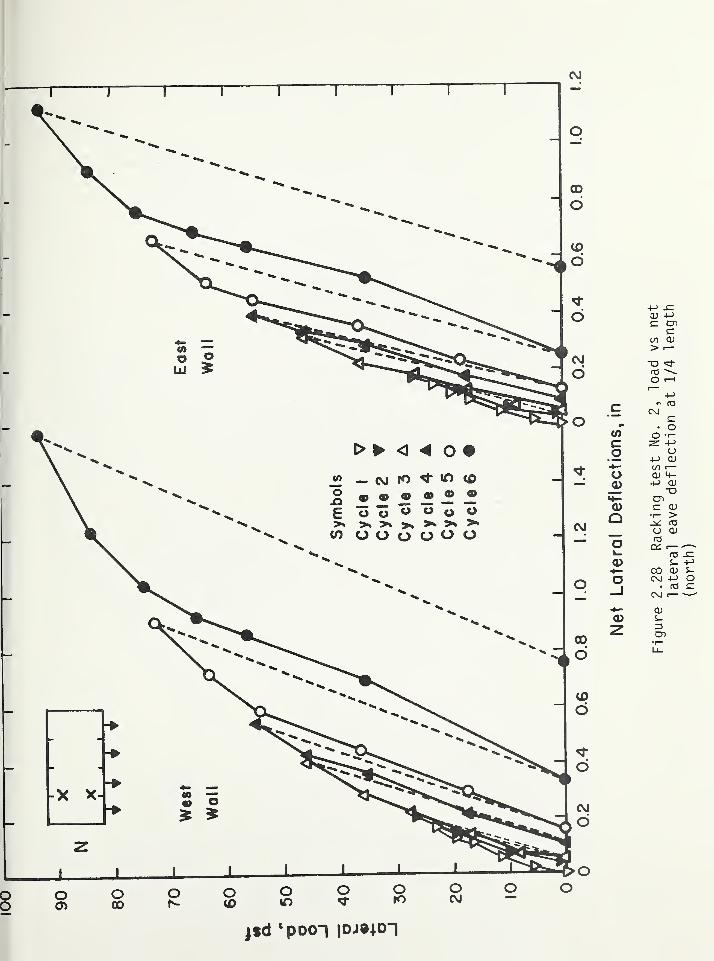
The deflected shape of the building at the beginning of the
test is taken as the zero position for plotting the net
lateral deflections in figures 2.27 thru 2.51. The lateral
load was cycled six times during racking test No. 2 with
each succeeding load being higher than the precceding load.
The maximum load applied for cycles one through six are as
follows: 22.9 psf, 26.9 psf, 46.0 psf, 55.1 psf, 72.7 psf


and 92.7 psf (2.85 design loads). All six load cycles are
shown in each of the five figures. The plot in the left
hand portion of the figure shows the west wall (loaded wall)
deflection at a cross section, the plot in the right hand
portion of the figure shows the corresponding lateral deflec-
tion for the east wall at the same cross section. Figures
2.27 and 2.30 have portions of the curves labeled as
’’est imated' in the right hand plot during cycle No. 6.
During this load increment lateral deflections exceeded the
measuring range of the LVDT ' s . The actual deflections at
a load of 92.7 psf are not known, but values were estimated
by extrapolating with a straight line from the previous two
known load-deflection points. The unload deflection point
is also a known value since deflections decreased to values
within the capacity of the LVDT ’ s upon unloading. Tn figure
2.29 the sixth cycle load-deflection curve for the west wall
is also labeled as estimated. Deflection values were obtained
for each increment of loading. However, as shown in the
figure, the measured deflection decreased when loading from
0 to 35.8 psf. Apparently during this load increment the
LVDT was disturbed, offsetting the instrument from its true
zero. A corrected zero was obtained by extending the load-
def lection curve through the deflections at 35.8 and 56.1
psf until this line intersected the zero load level. This
cxtropolated value was then placed at the residual deflection
33


from cycle five and the entire load deflection curve trans-
ferred to agree with this new zero.
Maximum lateral deflection profiles of the east and west
cave line during load cycle No. 6 are summarized in figure
2.32. The deflections at 92.7 psf are shown by solid circles
and connected by solid lines, open circles indicate the
estimated deflections at 92.7 psf. Residual deflections
after loading cycle No. 6 are shown as triangles and are
connected by dotted lines. The estimated unloaded values
are shown by open triangles.
Structural damage from racking test No. 2 is shown in
figure 2.33. Figure 2.33a is an interior view of the build-
ing before testing. Two locations of structural damage are
indicated by arrows. Close up views of these locations are
shown in figures 2.33b and c. The buckling in the trans-
verse beam shown in figure 2.33c was observed after racking
test No. 2 was complete. The fracture of the skin shown in
2.33b was not observed after racking test No. 2. This frac-
ture was not found until after all testing had been com-
pleted. However, it is felt that this damage occurred
between S3. 9 and 92.7 psf in cycle No. 6. During this load
increment a loud cracking noise was heard which could not
be accounted for after the test. Examination of the deflection
34


data shown in figure 2.29 indicates that during cycle No.
6 the east wall deflection actually decreased during the
last load increment. It is felt that if the fracture
occurred during this loading increment that the fractured
transverse beam would decrease the stiffness of the roof
system so that the east wall might not follow the west wall
as closely as on previous cycles, thus the deflection might
drop off somewhat. The midspan deflection of the east wall
in figure 2.32 is smaller than any of the other east wall
deflections, whereas the west wall deflection is larger
than any of the other west wall deflections. Thus the data
substantiates the conclusion that the beam fractured during
the last load increment.
The maximum lateral load capacity during racking test No. 2
was 83.9 psf (159 mph wind), assuming the transverse beam
fracture between 83.9 and 92.7 psf as failure. The similar
load on a three bay structure is 55.9 psf (2/3 x 83.9) pro-
vided no other component fails prior to this load. This is
equivalent to a 130 mph wind. However, even with the frac-
tured beam the test structure withstood 92.7 psf before
arbitrarily halting the loading. The similar load on a
three bay structure is 61.8 psf (2/3 x 92.7). This is
equivalent to a 136 mph wind on a three bay structure.
35


Assuming a load factor of 2.0, the service load on the two
bay structure is 42.0 psf (112 mph wind) and 28.0 psf (92
mph wind) for a three bay structure.
4 . 5 Racking Test No. 3
After examination of the load- deflect ion data from the roof
test and racking test No. 2 it was decided to determine the
ultimate lateral load capacity of the building under lateral
load. Instrumentation included the five vertical ridge
deflections and the lateral eave (and base) deflection of the
west wall (loaded wall) at midlength of the building. The
structure was loaded in increments of 10 psf up to a maximum
load of 100 psf. The vertical deflection profile of the roof
is shown in figure 2.34 for each load increment. The verti-
cal ridge deflection and net lateral eave deflection of the
west wall at midlength of the building are shown in figure
2.35. Ridge deflection data are shown by solid triangles
connected by a dashed line, eave deflections are shown as
solid circles connected by a solid line. The deflections
shown in figure 2.34 and 2.35 are relative to the deflected
shape of the building at the beginning of the test. The
load- deflect ion curve shown in figure 2.35 indicates that
100 psf was the ultimate lateral load capacity of the build-
ing. Further load-deflection data was not taken since this
36


data indicated that the maximum load had been reached, and
the sponsors of the project had indicated that they wanted
the building back after tests had been completed for possible
salvage
.
The midlength west wall lateral deflection is shown in
figure 2.36, considering the residual deflection from rack-
ing test No. 2. The load deflection data from racking test
No. 2 is shown by a series of straight lines indicating
only significant changes in the load-deflection curves. The
zero position for racking test No. 3 is then assumed to be
the unloaded position from cycle No. 6 of racking test No.
2. The load-deflection data for racking test No. 3 are
shown by a solid line, also indicating only significant
changes in the load-deflection response. The load-deflection
response for racking test No. 3, indicated that the building
was more flexible than it was during racking test No. 2.
This is one more indication that the transverse beam frac-
tured during racking test No. 2 (section 4.4). A view of
interior damage after racking test No. 3 is shown in figure
2.37. The general interior view of the building before
racking test No. 3 is shown in figure 2.37a with the major
structural damage area identified by an arrow. A closeup
of the damage is shown in figure 2.57b. As shown in
figure 2.37b the rivets connecting the bottom extrusion to
37


the transverse beam sheared off. The relative movement
between the extrusion and aluminum skin was about one in.
Most of the load in the transverse beam is carried by the
extrusions in bending. After the rivets sheared, the load
was transferred into the aluminum skin which fractured due
to stress concentration at the corner of the cut out. The
fracture of the beam reduced the stiffness of the roof
system and probably accounts for the flexible load-
deflection relationship shown in figure 2.36 for racking
test No. 3.
Exterior damage is shown in figure 2.38. Much of this
damage was concentrated around the doors of the north and
south end of the building. Damage around the north door is
shown in figures 2.38d and e. Both faces of the skin on
the panel containing the door wrinkled immediately above
the door as shown in figure 2.38d. The screws connecting
the door panel to the bottom extrusion tore through the
skin on the tension uplift side of the door panel as shown
in figure 2.38e. Similar damage is shown around the south
end door in figures 2.38b and c. The screws shearing
through the door panel skin had relative movement on the
order of 5/8 in. Typical panel to panel buckling of two
end wall panels is shown in figure 2.38f. Damage of the
38


aluminum "Eye" beams is shown in figures 2.38g and h. The
transverse "Eye" beam sheared the web from the bottom
flange of the longitudinal "Eye" beam (figure 2.38g).
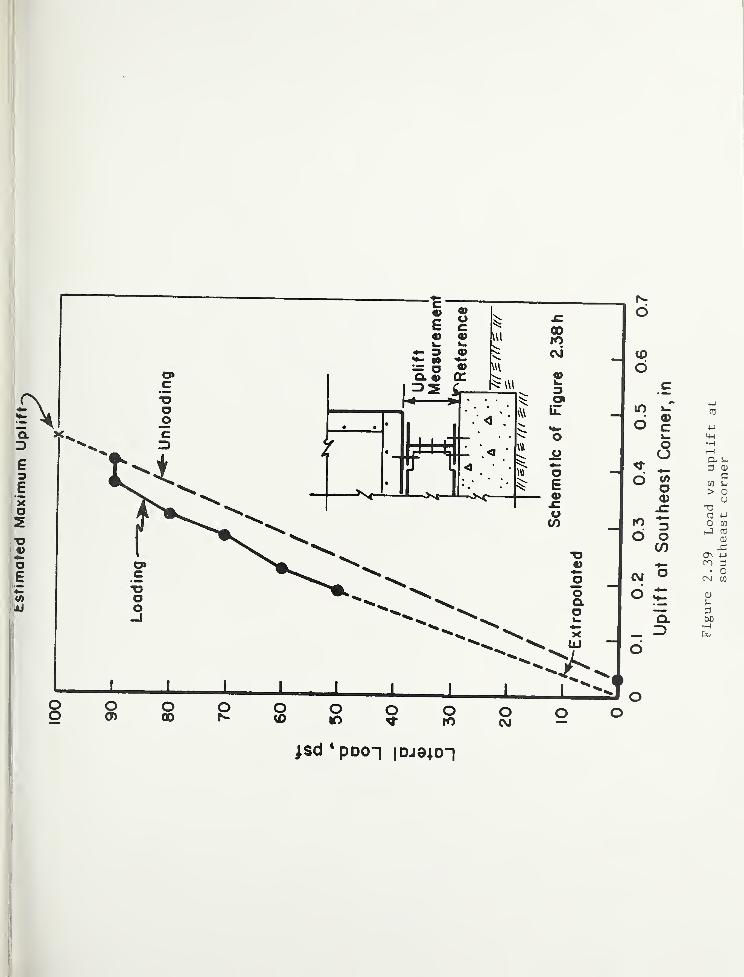
Uplift deflection liras recorded at the base of the east
wall (southeast corner of the building) after the test was
underway. The uplift is shown in figure 2.38h. The data
are shown in figure 2.39 by solid circles and connected by
solid lines. The zero value was obtained by ext ropolat ing
the first two readings. Total deflection values were then
obtained by using the extropolated zero. The maximum
uplift value was not obtained. An estimated value was
determined by connecting the unloaded deflection with the
last known deflection by a straight line and extending this
line up to 100 psf.
The maximum lateral load capacity during racking test No. 3
was 100 psf. This corresponds to a 173 mph wind. Similar
values for a three bay structure are 66.7 psf and a 142
mph wind. Service loads for a load factor of 2.0 are 50
psf and a 123 mph wind for the laboratory building and 33.3
psf and a 100 mph wind for a three bay building.
39


5. Conclusions and Recommendations
5 . 1 Conclusions
5.1.1 Erection
The erection of the Mark III building required 36 man days.
The erection was significantly hindered by poor quality
control in prefabricating the building as evidenced by the
following problems encountered during erection.
(1) Floor length greater than wall length
(2) Gable end member cut inaccurately
(3) Wall panel lengths unequal
(4) Ridge beam to gable ends required trial anderror fittings
(5) Wall panels out of square (slip sheeting)
(6) Window cut-outs oversized and out- of - square
(7) Floor panel delamination
(8) Vinyl cleats splitting
Approximately 3000 sheet metal screws were used to erect
the building. Drilling extrusions to receive these screws
required three man days; these extrusions would be pre-
drilled when relocating the building.
40


5.1.2 Structural
The bolts connecting the floor panels to the aluminum "Eye"
beams were insufficient to transmit shear forces into the
foundation, especially near the end of the building. As
detailed, these bolts were installed only in the longitu-
dinal "Eye" beams. The beams provided were not stiff enough
to prevent movement at one half the base shear design
load. An insufficient number of bolts were provided from
the standpoint of strength since one sheared at about one
half of one design load. Installation of additional bolts
in the transverse floor beams allowed the application of
1.55 of the design base shear without serious sliding.
The strength of the building under simulated wind load was
3.1 times the total horizontal load applied at the eaves
by a 99 mph wind (as computed using NAVFAC's DM2). (This
is only 1.55 times the design base shear). At the maximum
load numerous structural failures were apparent. These
failures are listed below:
(a) Wrinkling of panel skins around the doors
(b) Tearing of screws through the skin of end wallpanels
(c) Fracture of the "bottom chord" of the transversebeam.
41


Failure mode (c) limited the maximum lateral load. The
fracture occurred in a reentrant corner of the duct cut-out
in the transverse beam. The saw cuts extended as much as
1/4 in past the corners of the duct cut-out. These cuts
caused stress concentrations which led to a premature
fracture
.
The ultimate load capacity of the roof system with 33 percent
of the roof area loaded was 38.2 psf. At this load three
structural failures were evident as listed below:
(a) Failure in the longitudinal to transverse beamconnection
.
(b) The screws connecting the longitudinal ridgebeams to the roof panels pulled out of the roofpanel near the transverse beam.
(c) The transverse beam buckled at its connectioninto the wall panels
.
The roof system load capacity
since the entire roof was not
load capacity of the roof was
lation of test data. This is
value
.
cannot be stated conclusively
loaded, however, the ultimate
about 28 psf based on extrapo-
only 80 percent of the design
Ultimate and service load capacities are summarized in
table 2.1 for each load test for the two bay test structure
42


and a three bay field structure. Service loads are based
on a load factor of 2.0 this load factor appears reasonable
based on load-deflection response for the four tests. The
loads for a three bay structure were determined by extrapo-
lation of the data for the two bay test structure. The
data was extrapolated based on the assumption that the same
failure mode occurs for both structures and that their load
response is similar. Racking load capacities are given in
terms of the wind velocity in mph . The roof load capacities
are for a uniformly loaded roof. The ultimate load for each
test was based on the failure shown in the third column of
the table although larger loads might have been imposed dur-
ing a test. The following conclusions were reached based on
the previous discussion and the summary in table 2.1:
a. Racking test No. 1 indicates that a three baystructure will carry only a 31 mph service loadwind (43 mph ultimate) due to a base shearfailure. This is only 31 percent of the designwind load.
b. Racking test No. 3 indicates that with adequatetie-down bolts a three bay building will carrya 100 mph service load wind (142 mph ultimate).This is equivalent to the design wind load of100 mph.
c. The roof service load capacity is 14 psf (28psf ultimate) due to an inadequate longitudinalto transverse beam connection. This is only40 percent of the design value.
43


5.2 Recommendations
5.2.1 Erection
It is felt that the erection of the Mark III would be
considerably simplified by establishing closer fabrication
tolerances and reducing the production errors such as those
listed in section 5.1.1. Greater attention to details to
insure that all parts fit is necessary if this building is
to be widely used as a relocatable building. It is recom-
mended that at least two detail changes be made to allow
greater erection ease. These are (1) predrilling extrusions
to accept sheet metal connection screws and (2) elimination
of the triangular end gable. The first of these recommenda-
tions would save approximately 10 percent of the erection
time. Replacing the triangular end gable by running the end
wall panels from the floor to the roof would eliminate time
consuming trial and error fitting encountered in the build-
ing erection.
5.2.2 Structural
Tie-down bolts should be used to connect the floor panels
to the transverse as well as the longitudinal "Eye" beam
system. Stiffer "Eye" beams are also desircable.
44


Duct cut-out corners in the transverse beam should be
fillets rather than right angles. If possible the cut-out
should be eliminated.
The connection of the ridge beam to transverse beam should
be improved.
6 . Acknowledgments
The work described herein was carried out in the structural
laboratories of the Building Research Division at the
National Bureau of Standards. The program was sponsored by
the Naval Facilities Engineering Command, liason was pro-
vided by Mr. Paul Debtor. The Naval Civil Engineering
Laboratory (NCEL) at Port Iluenene,California was responsible
for program coordination. Monitoring was provided by W. A.
Keenan, NCEL. Mr. Kennan reviewed this report and made
several helpful suggestions.
4S


7. References
1. Reichard, T. W. and Leyendecker, E. V. ,"Test and
Evaluation of the Prefabricated Lewis Building andIts Components, Phase I Part 1, Evaluation of SandwichPanel Components," National Bureau of Standards Report10163, March 1970.
2. "Structural Engineering, NAVFAC DM-2," Department of theNavy, Naval Facilities Engineering Command, Washington,D.C., December 1967.
3. Phillips, C. W. and Kuklewicz, M. E., "Thermal Per-formance of a Mark III Relocatable Lewis Building,"National Bureau of Standards, NBS Project 4214442,June 1969.
46


Test
LoadCondition
UltimateLoad
Limitation
Load Capacities^Two BayTest
Structure
Three BayField
Structure 3
Racking No. 1 Service3
UltimateBase shear(Bolt
fracture)
36 mph wind53 mph wind
31 mph wind43 mph wind
Racking No. 2 Service3
UltimateTransversebeamfracture
112 mph wind159 mph wind
92 mph wind130 mph wind
Racking No . 3 Service3
UltimateBuildingsystem
123 mph wind173 mph wind
100 mph wind142 mph wind
Uniform RoofLoadb
Service3
UltimateBeamconnections
14 psf
28 psf14 p.sf
28 psf
a. Service load is based on a load factor of 2.0
b. Estimated uniform load on two bay test structure
c. Loads are extrapolated from two bay test data assuming the same
failure modes and similar load response.
d. Racking design load = 100 mph windUniform roof design load = 35 psf
TABLE 2.1 Summary of Load Capacities


WALL
OR
ROOF
PANEL
SKIN
Figure
2.1
Method
of
using
vinyl
cleat
to
connect
panels.


ROOF
RIDGE
ROOF
EDGE
FLOOR
PANEL
WALL
CORNER


Figure 2.3 Building as it was delivered.


00 CO
e Vj•H 0)+J •HO a.
c X)c <u
o 4-1
o
Figure
2.5
Method
of
"eye"
beams
to
simu


Bolt
Figure
2.6
All
but
last
floor
panel
in
place.


Figure 2.7 Placing a wall panel


Figure 2.8 Placing one of the3000 screws.


Figure
2.9
Detail
of
corner
connection


Figure
2.10
Completed
building
through
the
doorway
of
testing
chamber


Figure 2.11 Building ready forrelocation after testing.
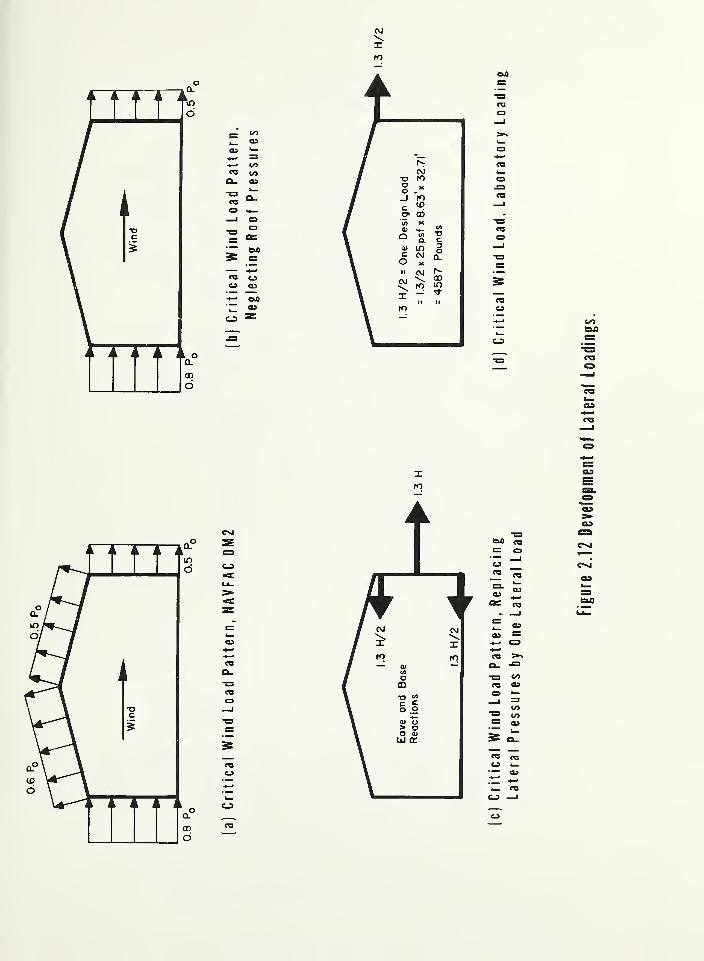
Figure
2.12
Development
of
Lateral
Loadings.


(a) Concentrated Lateral Loads
(bj Schematic of Lateral Load System
Figure 2.13 Simulated Wind Loadings.


Load
Bearing
Walls
Figure
2.14
Roof
loading


Figure
2.15
Cross
Section
Showing
Schematic
of
Roof
Loading
System


Figure
2.16
Schematic
Showing
Gage
Location
and
Identification
Numbers
for
Lateral
Deflection
Measurements.

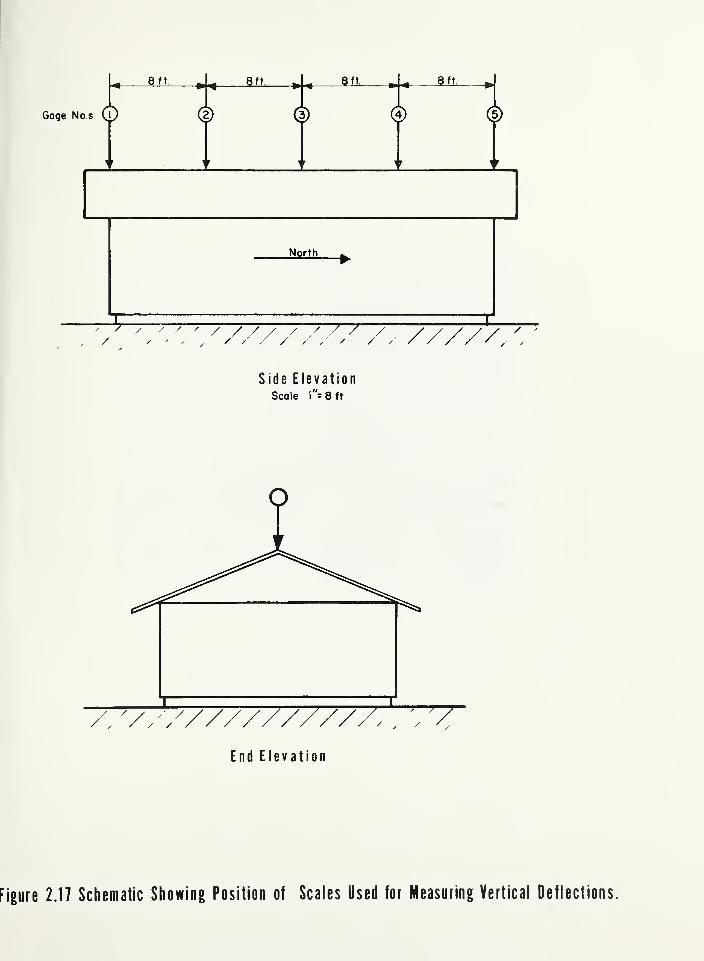
Figure 2.17 Schematic Showing Position of Scales Used for Measuring Vertical Deflections.


Figure 2.18 Horizontal movement ofbuilding on foundation, racking
test No. 1

Figure
2.19
West
wall
lateral
deflection
at
mid-length,
racking
test
No.
1


APPLIED
UJ5<a:
C\J
(
r
x<roUJ—xCO II
CO
COUJ
< LlJ
UJ I—CD UJ
Xh”01OzCDZ
oo
Figure
2.20
Free
body
diagram
showing
lateral
loads
and
lateral
reactions


8 O O 8 O O
toco
o0)
4>
O
ok.
<v
o
a>
Z
>)
oCM
|Sd*pD0"I |DJ9|D~|
OCM
Figure
2.21
Lateral
load-deflections
during
racking
test
No.
1


o o
o <> .5.y ± .
0 •> ±1 o <
J
Eave
Vertical
Ridge
Deflection,
AV-ln


-c
1O)
UJ ‘UMO0 U0l|0#|}#Q |DO;|J«A
Figure
2.23
Vertical
ridge
deflections
profile
under
roof
load


(a) General interior view before testing
(b) Damage area No. 1, Buckleat beam to East wall connection
Figure 2.24 Roof load damage areas


(c) Damage area No. 2, Screws pulledof roof panel at ridge beam to trans-
verse beam connection
(d) Closeup of separation atdamage area No. 2
Figure 2.24 Roof load damage areas


Uniform
Load
adfctf)
03ad
Cdadoo
CdX)
Figure
2.25
Separation
of
Ridge
Beams
and
Roof
Panels
Under
Roof
Load.


Lateral
Load,psf
Figure 2.26 West wall load vs. lateraldeflection at midlength,
racking tests 1 and 2


Estimated
CVJ
00
6
to
6
6
CVJ
6
co
oJ®M—a>
Qc\J E
O— a>
CD
6
CO
6
vj-
d
CVJ
o
jsd‘pcxr| |0J*4Dn
Figure
2.27
Racking
test
No.
2,
load
vs
net
lateral
eave
deflection
at
north
end

Net
Lateral
Deflections,
in


CVJ QJ -dSO 4->
6 CDCO d> 0J
-a -ara -i—
o c o E•» +->
to »> 03
c c\j
<3;o d
• oO -r-““ o 22 +->
0)U
-i-> aj
CVJ
H-a>O
CO i
—
QJ 4—+-> QJ
T3— CD—1 d QJ
o •r- >k_ 03
<D o aj
o 03
D CC 1
—
rOs-
OD QJC\J +->
a> • 03
00 2 C\J i
—
6 0JS-oCD
CDLl—
JSd‘pDO“| |DJ9|D“|


CO \> <—I
TD -M03 03o
I— co
CM 4->
<_>
• <uO i—rr 4_
tu-M T300cd cd+-> >
as •
DO CD
-3fiC CO Ou s. w05 CD —
'
CC 4->
03 _Di— 4->
O Cr.
CO +-> c• CD CD
CM £Z i
—
CDS-
DDO
Ll_


JSCPpDO-!|DJ9JD"|
+->
oj -a
<DCO> JZ
+->
-O =3ITS O
cn
oo
Net
Lateral
Deflections,
in


if)DOO
o£V>
£
o^ o ‘
^ V *H-
O o 0>Ixl _l Q
c
c£(A
co
o a*“ <D0) —
"Ocfl
ai o> >
—
i
cfl
(D T—
|
cX)
Figure
2.32
Deflected
shape
of


(a) General interior view before testing
a2 A/e. //
-G/a/A 9
(b) Damage area No. 1,
fractured bottom chord
(c) Damage area No. 2,Buckle at transverse beam to
West wall connection
Figure 2.33 Racking test No.damage areas
2


Figure
2.34
Vertical
ridge
profiles
racking
test
No.
3


ocvi
oo
CO
<3;
CM
o
00
6
CD
d
M"
6
CM
d
o
i
-DfT3
Oro
CD> •
03 OCD SI
T3 +->
SZ CO03 CD
+->
jsd ‘poon iDja^D-
)
Deflections
During
Test,
in


C/3
I+J
"O C/3
03 0)
O 4-3
i—
I
0000X cU -H •
bCPsi oc azCD 03
i—I S-i T3"O c•H (-i n3
S oM-l CN
v£> C/3 •
OO C O• o z
CN *H4-1
ai ul-i CD
3 >H&0 M-l
•H CD
Cn "O
50000000000) cn go cp ift^-rocvi —
JSd ‘pDOl |DJ0|D~|


(a) General interior view before testing
(b) Closeup of damage area
Figure 2.37 Racking test No. 3,Interior Damage


•u
3OCO 00
cx -ho -u
co
& QJ
a) -u
>4
oOX43•u
3oCO
44O
OJ
XHco
Xecd
4=00“H!-i
S-i
a)
13
ohJ
o
> QJ
S4
S-i OO 44•H QJ
M 43CU
44 X)x aw aj
>4
ooX434J3OCO
4-4
O
<U
XHco
XC3
cd
X
>4
(1)
3ohJ
ro
O3
co
QJ QJ
H 00cd
oo BC cd
•H X44CJ S4
cd odQ x
>4
0)
00 4-1
CO X• w
CN
QJ
J-4
300•H

(e) Bottom of North door
m'
A/o /f
s/s / A ?
(f) Typical buckling at end wall panels
Figure 2.38 Racking Test No. 3,Exterior Damage


(g) Sheared web of longitudinal beamat Southwest corner
(h) Uplift at Southeast corner
Figure 2.38 Racking Test No. 3
Exterior damage

Estimated
Maximum
Uplift
c
4>C
awo<v
3ocn
ClZ>
a u3 ai
cCO
>
XJ
ohJ
co
3ai
_cct\ -uco 3
• Ocn co
QJ
u3M•H


