bursa malaysia berhad (30632-p) (incorporated...
TRANSCRIPT

25 April 2018
BURSA MALAYSIA BERHAD (30632-P)(Incorporated in Malaysia)
Bursa Malaysia Berhad © 2018All Rights Reserved
CONDENSED CONSOLIDATED FINANCIAL STATEMENTSFOR THE QUARTER AND YEAR-TO-DATE ENDED 31 MARCH 2018
Confidential#
1
31.03.2018 31.03.2017 ChangesNote RM'000 RM'000 %
(Reviewed) (Reviewed)
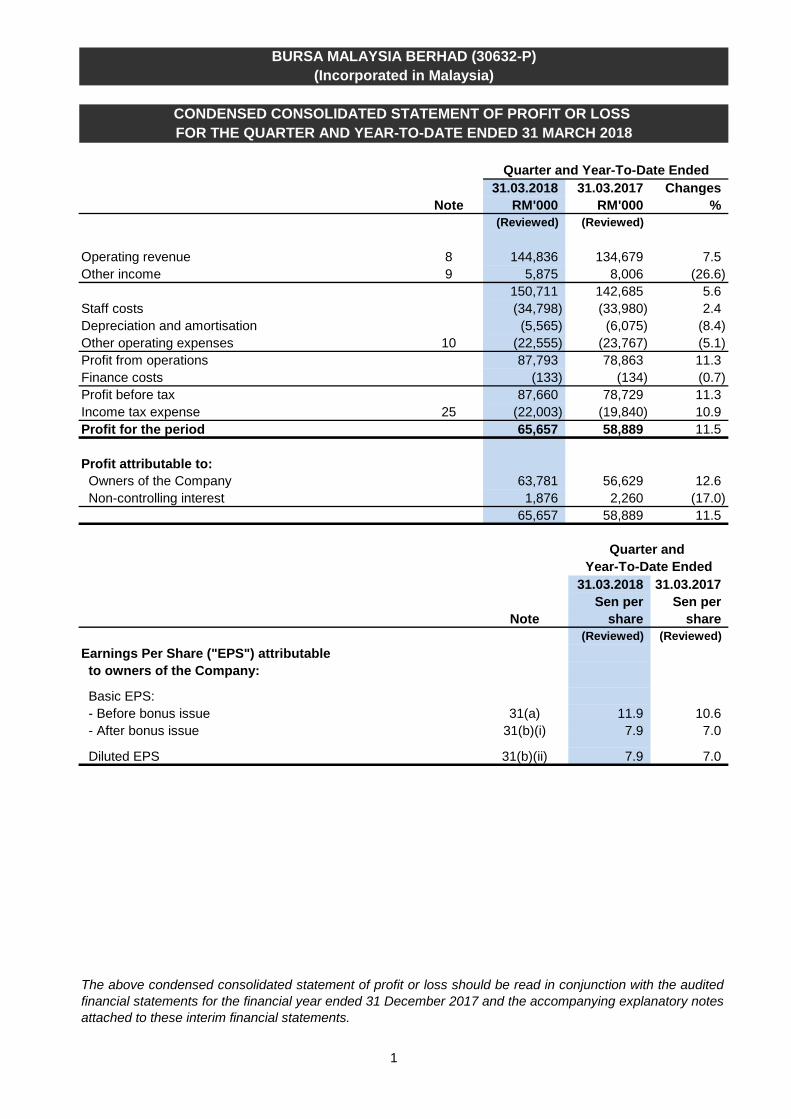
Operating revenue 8 144,836 134,679 7.5 Other income 9 5,875 8,006 (26.6)
150,711 142,685 5.6 Staff costs (34,798) (33,980) 2.4 Depreciation and amortisation (5,565) (6,075) (8.4) Other operating expenses 10 (22,555) (23,767) (5.1) Profit from operations 87,793 78,863 11.3 Finance costs (133) (134) (0.7) Profit before tax 87,660 78,729 11.3 Income tax expense 25 (22,003) (19,840) 10.9 Profit for the period 65,657 58,889 11.5
Profit attributable to: Owners of the Company 63,781 56,629 12.6 Non-controlling interest 1,876 2,260 (17.0)
65,657 58,889 11.5
31.03.2018 31.03.2017Sen per Sen per
Note share share(Reviewed) (Reviewed)
Earnings Per Share ("EPS") attributable to owners of the Company:
Basic EPS: - Before bonus issue 31(a) 11.9 10.6 - After bonus issue 31(b)(i) 7.9 7.0
Diluted EPS 31(b)(ii) 7.9 7.0
BURSA MALAYSIA BERHAD (30632-P)(Incorporated in Malaysia)
CONDENSED CONSOLIDATED STATEMENT OF PROFIT OR LOSS FOR THE QUARTER AND YEAR-TO-DATE ENDED 31 MARCH 2018
Quarter and Year-To-Date Ended
Year-To-Date EndedQuarter and
The above condensed consolidated statement of profit or loss should be read in conjunction with the auditedfinancial statements for the financial year ended 31 December 2017 and the accompanying explanatory notesattached to these interim financial statements.
Confidential#
2
BURSA MALAYSIA BERHAD (30632-P)(Incorporated in Malaysia)
31.03.2018 31.03.2017 ChangesRM'000 RM'000 %
(Reviewed) (Reviewed)
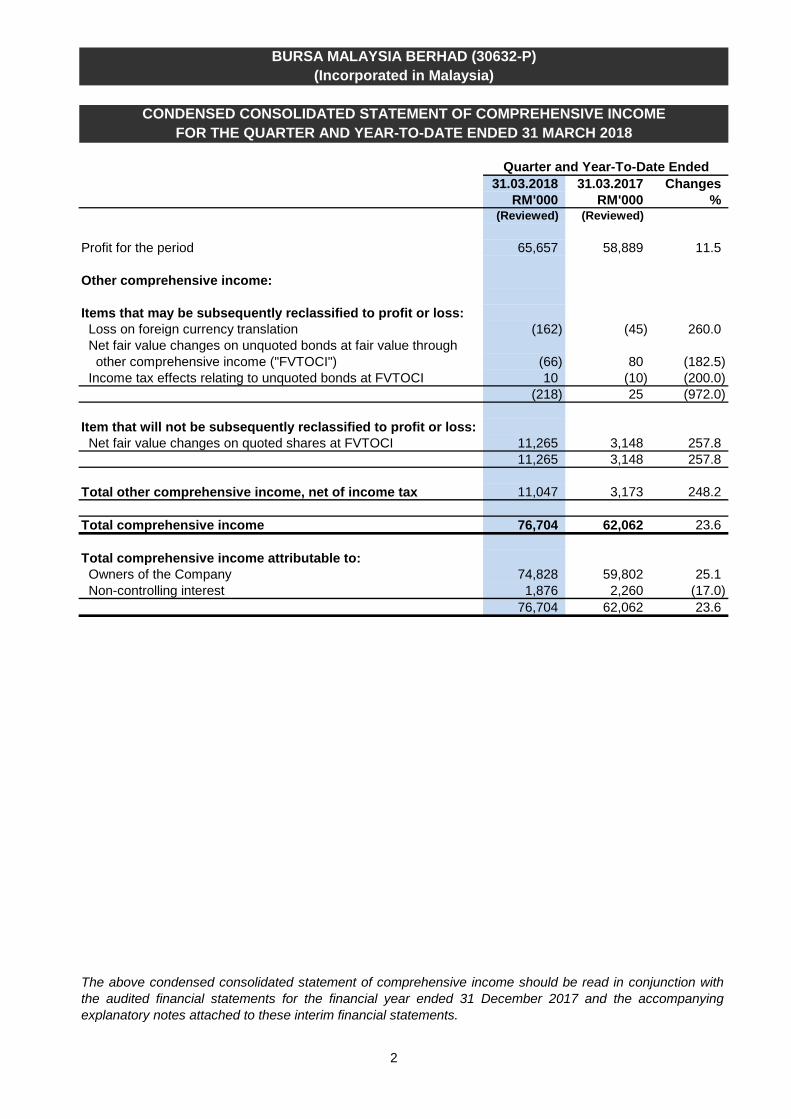
Profit for the period 65,657 58,889 11.5
Other comprehensive income: Items that may be subsequently reclassified to profit or loss: Loss on foreign currency translation (162) (45) 260.0 Net fair value changes on unquoted bonds at fair value through other comprehensive income ("FVTOCI") (66) 80 (182.5) Income tax effects relating to unquoted bonds at FVTOCI 10 (10) (200.0)
(218) 25 (972.0)
Item that will not be subsequently reclassified to profit or loss: Net fair value changes on quoted shares at FVTOCI 11,265 3,148 257.8
11,265 3,148 257.8
Total other comprehensive income, net of income tax 11,047 3,173 248.2
Total comprehensive income 76,704 62,062 23.6
Total comprehensive income attributable to: Owners of the Company 74,828 59,802 25.1 Non-controlling interest 1,876 2,260 (17.0)
76,704 62,062 23.6
FOR THE QUARTER AND YEAR-TO-DATE ENDED 31 MARCH 2018CONDENSED CONSOLIDATED STATEMENT OF COMPREHENSIVE INCOME
The above condensed consolidated statement of comprehensive income should be read in conjunction withthe audited financial statements for the financial year ended 31 December 2017 and the accompanyingexplanatory notes attached to these interim financial statements.
Quarter and Year-To-Date Ended

3
As at As at31.03.2018 31.12.2017
Note RM'000 RM'000(Reviewed) (Audited)
AssetsProperty, plant and equipment 176,608 179,298 Computer software 38,275 40,841 Right-of-use assets 8,379 8,407 Goodwill 42,957 42,957 Investment securities 287,974 281,779 Staff loans receivable 2,720 2,918 Deferred tax assets 6,379 6,747 Non-current assets 563,292 562,947
Trade receivables 26 55,128 47,218 Other receivables 20,439 15,964 Tax recoverable 3,604 4,352 Investment securities 25,027 25,039 Cash for equity margins, derivatives trading margins, security deposits and eDividend distributions 13 1,292,056 1,168,526 Cash and bank balances of Clearing Funds 14 128,642 129,628 Cash and bank balances of the Group 15 252,259 271,207 Current assets 1,777,155 1,661,934
Total assets 2,340,447 2,224,881
Equity and liabilitiesShare capital 402,169 402,169 Other reserves 192,625 179,938 Retained earnings 232,224 267,881 Equity attributable to owners of the Company 827,018 849,988 Non-controlling interest 10,970 12,469 Total equity 837,988 862,457
Retirement benefit obligations 19,386 21,860 Deferred grants 3,492 2,038 Lease liabilities 7,594 7,470 Deferred tax liabilities 1,637 1,729 Non-current liabilities 32,109 33,097
Trade payables 13 1,288,990 1,166,024 Participants' contributions to Clearing Funds 14 38,642 39,628 Other payables 135,067 115,989 Lease liabilities 514 505 Tax payable 7,137 7,181 Current liabilities 1,470,350 1,329,327 Total liabilities 1,502,459 1,362,424
Total equity and liabilities 2,340,447 2,224,881
RM RMNet assets per share attributable to owners of the Company 32 1.54 1.58
AS AT 31 MARCH 2018CONDENSED CONSOLIDATED STATEMENT OF FINANCIAL POSITION
The above condensed consolidated statement of financial position should be read in conjunction with theaudited financial statements for the financial year ended 31 December 2017 and the accompanyingexplanatory notes attached to these interim financial statements.
BURSA MALAYSIA BERHAD (30632-P)(Incorporated in Malaysia)
4
DistributableForeign
Capital currency Share Clearing Non-Share Share redemption translation grant fund FVTOCI Retained controlling Total
capital premium reserve reserve reserve reserves reserve earnings Total interest equityReviewed RM'000 RM'000 RM'000 RM'000 RM'000 RM'000 RM'000 RM'000 RM'000 RM'000 RM'000
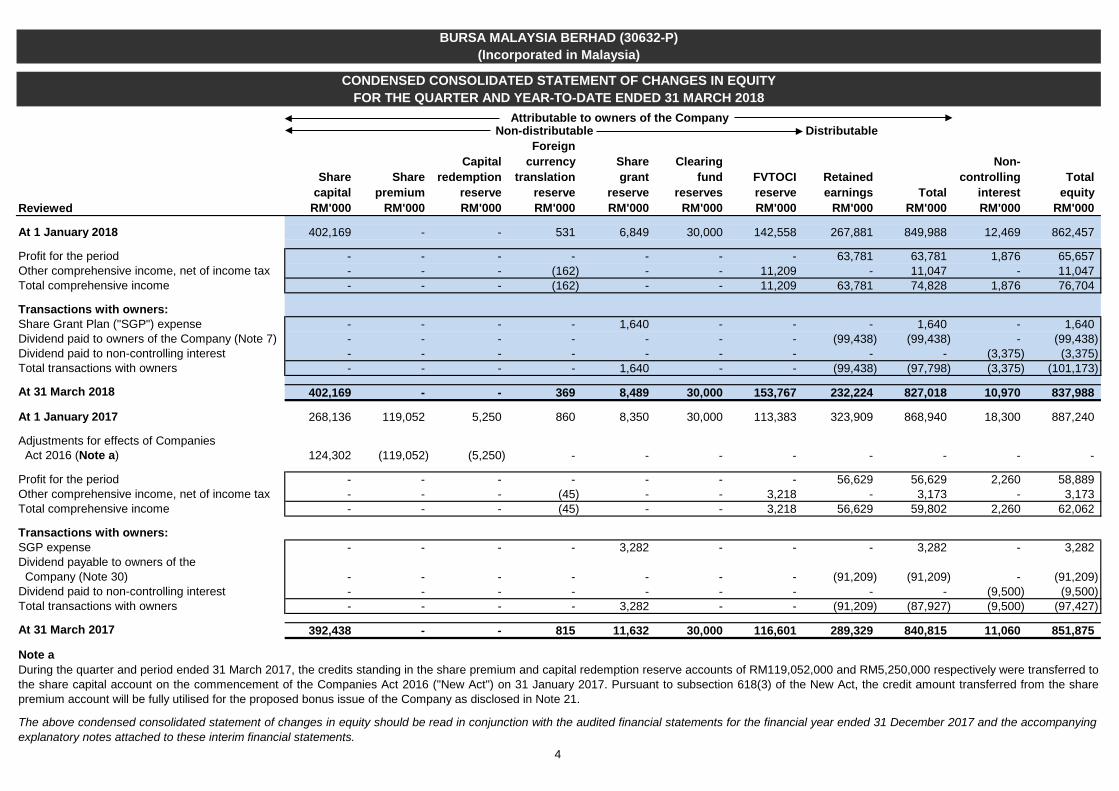
At 1 January 2018 402,169 - - 531 6,849 30,000 142,558 267,881 849,988 12,469 862,457
Profit for the period - - - - - - - 63,781 63,781 1,876 65,657 Other comprehensive income, net of income tax - - - (162) - - 11,209 - 11,047 - 11,047 Total comprehensive income - - - (162) - - 11,209 63,781 74,828 1,876 76,704
Transactions with owners: Share Grant Plan ("SGP") expense - - - - 1,640 - - - 1,640 - 1,640 Dividend paid to owners of the Company (Note 7) - - - - - - - (99,438) (99,438) - (99,438) Dividend paid to non-controlling interest - - - - - - - - - (3,375) (3,375) Total transactions with owners - - - - 1,640 - - (99,438) (97,798) (3,375) (101,173)
At 31 March 2018 402,169 - - 369 8,489 30,000 153,767 232,224 827,018 10,970 837,988
At 1 January 2017 268,136 119,052 5,250 860 8,350 30,000 113,383 323,909 868,940 18,300 887,240
Adjustments for effects of Companies Act 2016 (Note a) 124,302 (119,052) (5,250) - - - - - - - -
Profit for the period - - - - - - - 56,629 56,629 2,260 58,889 Other comprehensive income, net of income tax - - - (45) - - 3,218 - 3,173 - 3,173 Total comprehensive income - - - (45) - - 3,218 56,629 59,802 2,260 62,062
Transactions with owners: SGP expense - - - - 3,282 - - - 3,282 - 3,282 Dividend payable to owners of the Company (Note 30) - - - - - - - (91,209) (91,209) - (91,209) Dividend paid to non-controlling interest - - - - - - - - - (9,500) (9,500) Total transactions with owners - - - - 3,282 - - (91,209) (87,927) (9,500) (97,427)
At 31 March 2017 392,438 - - 815 11,632 30,000 116,601 289,329 840,815 11,060 851,875
Note a
The above condensed consolidated statement of changes in equity should be read in conjunction with the audited financial statements for the financial year ended 31 December 2017 and the accompanyingexplanatory notes attached to these interim financial statements.
BURSA MALAYSIA BERHAD (30632-P)(Incorporated in Malaysia)
CONDENSED CONSOLIDATED STATEMENT OF CHANGES IN EQUITYFOR THE QUARTER AND YEAR-TO-DATE ENDED 31 MARCH 2018
Attributable to owners of the CompanyNon-distributable
During the quarter and period ended 31 March 2017, the credits standing in the share premium and capital redemption reserve accounts of RM119,052,000 and RM5,250,000 respectively were transferred tothe share capital account on the commencement of the Companies Act 2016 ("New Act") on 31 January 2017. Pursuant to subsection 618(3) of the New Act, the credit amount transferred from the sharepremium account will be fully utilised for the proposed bonus issue of the Company as disclosed in Note 21.
5
31.03.2018 31.03.2017Note RM'000 RM'000
(Reviewed) (Reviewed)
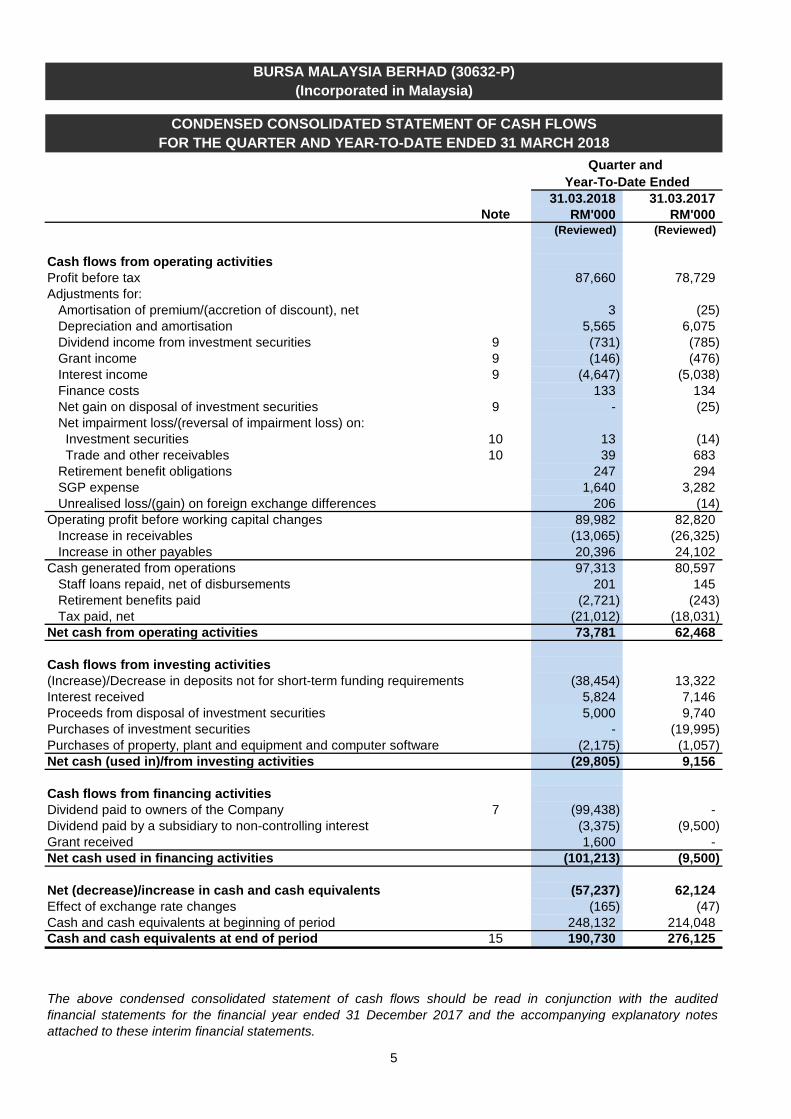
Cash flows from operating activitiesProfit before tax 87,660 78,729 Adjustments for: Amortisation of premium/(accretion of discount), net 3 (25) Depreciation and amortisation 5,565 6,075 Dividend income from investment securities 9 (731) (785) Grant income 9 (146) (476) Interest income 9 (4,647) (5,038) Finance costs 133 134 Net gain on disposal of investment securities 9 - (25) Net impairment loss/(reversal of impairment loss) on: Investment securities 10 13 (14) Trade and other receivables 10 39 683 Retirement benefit obligations 247 294 SGP expense 1,640 3,282 Unrealised loss/(gain) on foreign exchange differences 206 (14) Operating profit before working capital changes 89,982 82,820 Increase in receivables (13,065) (26,325) Increase in other payables 20,396 24,102 Cash generated from operations 97,313 80,597 Staff loans repaid, net of disbursements 201 145 Retirement benefits paid (2,721) (243) Tax paid, net (21,012) (18,031) Net cash from operating activities 73,781 62,468
Cash flows from investing activities(Increase)/Decrease in deposits not for short-term funding requirements (38,454) 13,322 Interest received 5,824 7,146 Proceeds from disposal of investment securities 5,000 9,740 Purchases of investment securities - (19,995) Purchases of property, plant and equipment and computer software (2,175) (1,057) Net cash (used in)/from investing activities (29,805) 9,156
Cash flows from financing activitiesDividend paid to owners of the Company 7 (99,438) - Dividend paid by a subsidiary to non-controlling interest (3,375) (9,500) Grant received 1,600 - Net cash used in financing activities (101,213) (9,500) Net (decrease)/increase in cash and cash equivalents (57,237) 62,124 Effect of exchange rate changes (165) (47) Cash and cash equivalents at beginning of period 248,132 214,048 Cash and cash equivalents at end of period 15 190,730 276,125
The above condensed consolidated statement of cash flows should be read in conjunction with the auditedfinancial statements for the financial year ended 31 December 2017 and the accompanying explanatory notesattached to these interim financial statements.
BURSA MALAYSIA BERHAD (30632-P)(Incorporated in Malaysia)
CONDENSED CONSOLIDATED STATEMENT OF CASH FLOWSFOR THE QUARTER AND YEAR-TO-DATE ENDED 31 MARCH 2018
Year-To-Date EndedQuarter and

6
1. BASIS OF PREPARATION
2. SIGNIFICANT ACCOUNTING POLICIES
2.1
2.2
Amendments to MFRS 11 Joint Arrangements (Annual Improvements to MFRS Standards 2015 - 2017 Cycle) Amendments to MFRS 112 Income Taxes (Annual Improvements to MFRS Standards 2015 - 2017 Cycle)
Effective for financial periods beginning on or after 1 January 2021
Effective date of these Standards have been deferred, and yet to be announced Amendments to MFRS 10 Consolidated Financial Statements and MFRS 128 Investments in Associates and Joint Ventures - Sale or Contribution of Assets between an Investor and its Associate or Joint Venture
and Joint Ventures
IC Interpretation 23 Uncertainty over Income Tax Treatments Amendments to MFRS 123 Borrowing Costs (Annual Improvements to MFRS Standards 2015 - 2017 Cycle)
MFRS 17 Insurance Contracts
Adoption of Standards, Amendments to Standards, Annual Improvements to Standards and IssuesCommittee ("IC") Interpretation
Early adoption of Standards, Amendments to Standards, Annual Improvements to Standards and ICInterpretation
As at the date of authorisation of this Condensed Report, the following Standards and Amendments to Standardshave been issued by the Malaysian Accounting Standards Board ("MASB") but are not yet effective and have notbeen adopted by the Group. These pronouncements are either not relevant or do not impact the financialstatements of the Group:
Standards issued but not yet effective
The above pronouncements are either not relevant or do not have any impact on the financial statements of theGroup.
The accounting policies adopted in the preparation of the Condensed Report are consistent with those used inthe preparation of the Group's audited financial statements for the financial year ended 31 December 2017,except for the following:
Amendments to MFRS 3 Business Combinations (Annual Improvements to MFRS Standards 2015 - 2017
Amendments to MFRS 119 Employee Benefits - Plan Amendment, Curtailment or Settlement
Cycle)
Effective for financial periods beginning on or after 1 January 2019 Amendments to MFRS 9 Financial Instruments - Prepayment Features with Negative Compensation
Amendments to MFRS 128 Investments in Associates and Joint Ventures - Long-term Interests in Associates
BURSA MALAYSIA BERHAD (30632-P)(Incorporated in Malaysia)
PART A: EXPLANATORY NOTES PURSUANT TO MFRS 134
This Condensed Report should be read in conjunction with the audited financial statements for the financial yearended 31 December 2017. The explanatory notes attached to the Condensed Report provide an explanation of eventsand transactions that are significant for an understanding of the changes in the financial position and performance ofthe Group since the financial year ended 31 December 2017.
This Condensed Report has also been prepared in accordance with paragraph 9.22 of the Main Market ListingRequirements of Bursa Malaysia Securities Berhad.
These condensed consolidated financial statements ("Condensed Report") have been prepared in accordance with theMalaysian Financial Reporting Standard ("MFRS") 134 Interim Financial Reporting , the International AccountingStandard ("IAS") 34 Interim Financial Reporting and the requirements of the Companies Act 2016 in Malaysia, whereapplicable. The Condensed Report, other than for financial instruments and retirement benefit obligations, has beenprepared under the historical cost convention. Certain financial instruments are carried at fair value in accordance withMFRS 9 Financial Instruments and the retirement benefit obligations include actuarial gains and losses in accordancewith MFRS 119 Employee Benefits .

7
BURSA MALAYSIA BERHAD (30632-P)(Incorporated in Malaysia)
PART A: EXPLANATORY NOTES PURSUANT TO MFRS 134
3. COMMENTS ABOUT SEASONAL OR CYCLICAL FACTORS
4. UNUSUAL ITEMS DUE TO THEIR NATURE, SIZE OR INCIDENCE
5. SIGNIFICANT ESTIMATES AND CHANGES IN ESTIMATES
6. DEBT AND EQUITY SECURITIES
7. DIVIDEND PAID
Second interim dividendFor the financial year ended 31 December 2017Approved and declared on 5 February 2018Date paid 5 March 2018Number of ordinary shares on which dividends were paid ('000) 537,501Dividend per share (single-tier) 18.5 senNet dividend paid (RM'000) 99,438
8. OPERATING REVENUE
31.03.2018 31.03.2017 ChangesRM'000 RM'000 %
Clearing fees 61,407 54,451 12.8 Trade fees 8,283 7,254 14.2 Others 6,583 5,500 19.7 Total Securities trading revenue 76,273 67,205 13.5
Clearing fees 4,286 4,858 (11.8) Trade fees 10,991 12,422 (11.5) Others 3,706 3,939 (5.9) Total Derivatives trading revenue 18,983 21,219 (10.5)
Bursa Suq Al-Sila ("BSAS") trading revenue 3,967 3,964 0.1 Listing and issuer services 15,673 12,744 23.0 Depository services 10,501 9,786 7.3 Market data 8,455 8,575 (1.4) Member services and connectivity 5,454 5,180 5.3 Conference fees and exhibition-related income 5,530 6,006 (7.9)
49,580 46,255 7.2 Total operating revenue 144,836 134,679 7.5
There were no changes in estimates that have had any material effect during the current quarter and year-to-dateended 31 March 2018.
The Group's performance is affected by the level of activities in the securities and derivatives markets but not by anyseasonal or cyclical factors.
Quarter and Year-To-Date Ended
The details of the dividend paid during the current quarter and year-to-date ended 31 March 2018 are as follows:
There was no dividend paid during the quarter and year-to-date ended 31 March 2017.
There were no unusual items affecting assets, liabilities, equity, net income or cash flows during the current quarterand year-to-date ended 31 March 2018.
Other than the issuance of new ordinary shares in relation to the bonus issue on 13 April 2018 as disclosed in Note21, there were no issuance, repurchase and repayment of debt and equity securities during the current quarter andyear-to-date ended 31 March 2018.
8
8. OPERATING REVENUE (CONT'D.)
OPERATING REVENUE FOR THE QUARTER AND YEAR-TO-DATE ENDED
31.03.2018 31.03.2017 Changes 31.03.2018 31.03.2017 Changes 31.03.2018 31.03.2017 Changes 31.03.2018 31.03.2017 Changes 31.03.2018 31.03.2017 ChangesRM'000 RM'000 % RM'000 RM'000 % RM'000 RM'000 % RM'000 RM'000 % RM'000 RM'000 %
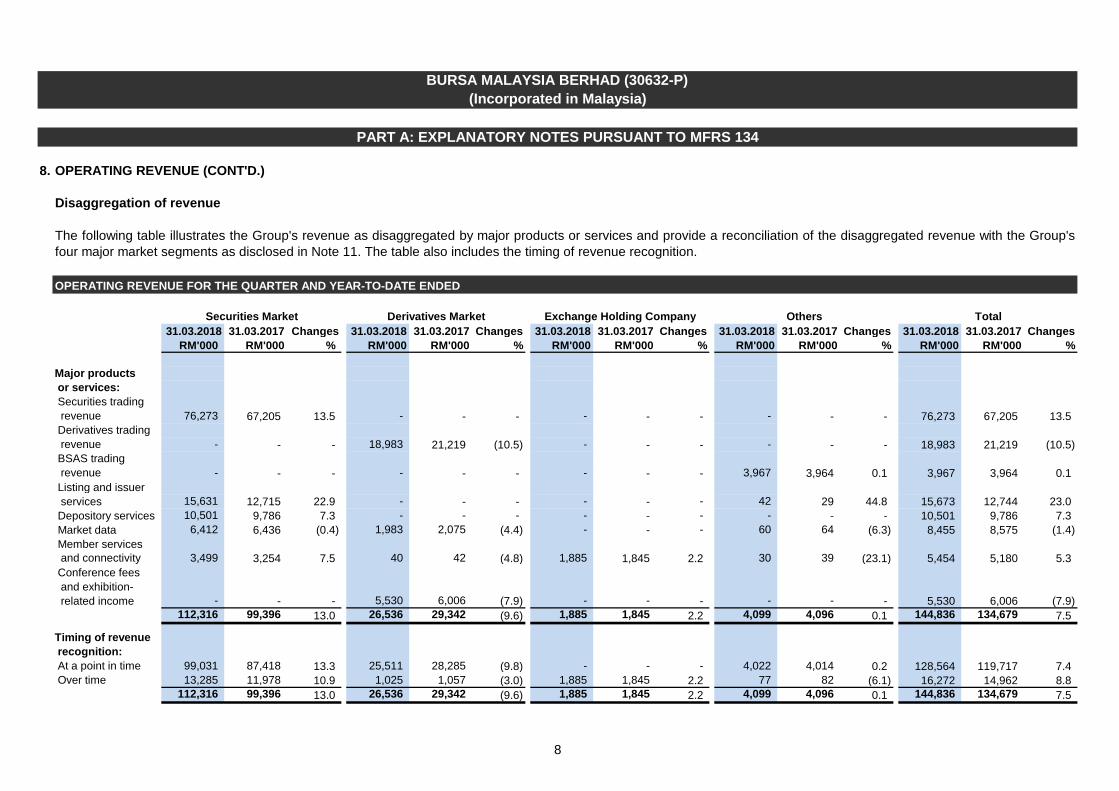
Major products or services: Securities trading revenue 76,273 67,205 13.5 - - - - - - - - - 76,273 67,205 13.5 Derivatives trading revenue - - - 18,983 21,219 (10.5) - - - - - - 18,983 21,219 (10.5) BSAS trading revenue - - - - - - - - - 3,967 3,964 0.1 3,967 3,964 0.1 Listing and issuer services 15,631 12,715 22.9 - - - - - - 42 29 44.8 15,673 12,744 23.0 Depository services 10,501 9,786 7.3 - - - - - - - - - 10,501 9,786 7.3 Market data 6,412 6,436 (0.4) 1,983 2,075 (4.4) - - - 60 64 (6.3) 8,455 8,575 (1.4) Member services and connectivity 3,499 3,254 7.5 40 42 (4.8) 1,885 1,845 2.2 30 39 (23.1) 5,454 5,180 5.3 Conference fees and exhibition- related income - - - 5,530 6,006 (7.9) - - - - - - 5,530 6,006 (7.9)
112,316 99,396 13.0 26,536 29,342 (9.6) 1,885 1,845 2.2 4,099 4,096 0.1 144,836 134,679 7.5
Timing of revenue recognition: At a point in time 99,031 87,418 13.3 25,511 28,285 (9.8) - - - 4,022 4,014 0.2 128,564 119,717 7.4 Over time 13,285 11,978 10.9 1,025 1,057 (3.0) 1,885 1,845 2.2 77 82 (6.1) 16,272 14,962 8.8
112,316 99,396 13.0 26,536 29,342 (9.6) 1,885 1,845 2.2 4,099 4,096 0.1 144,836 134,679 7.5
The following table illustrates the Group's revenue as disaggregated by major products or services and provide a reconciliation of the disaggregated revenue with the Group'sfour major market segments as disclosed in Note 11. The table also includes the timing of revenue recognition.
PART A: EXPLANATORY NOTES PURSUANT TO MFRS 134
(Incorporated in Malaysia)BURSA MALAYSIA BERHAD (30632-P)
Disaggregation of revenue
Securities Market Derivatives Market Exchange Holding Company Others Total

9
9. OTHER INCOME
31.03.2018 31.03.2017 ChangesRM'000 RM'000 %
Interest income from: Deposits and investment securities 4,616 5,000 (7.7) Others 31 38 (18.4) Dividend income 731 785 (6.9) Grant income 146 476 (69.3) Net gain on disposal of investment securities - 25 (100.0) Rental income 320 1,661 (80.7) Miscellaneous income 31 21 47.6 Total other income 5,875 8,006 (26.6)
10.
31.03.2018 31.03.2017 ChangesRM'000 RM'000 %
Administrative expenses 1,620 1,580 2.5 Building management expenses 2,532 2,692 (5.9) Central Depository System ("CDS") consumables 634 733 (13.5) Marketing and development expenses 4,631 3,817 21.3 Professional fees 493 292 68.8 Technology expenses: Information technology maintenance 4,885 4,847 0.8 Service fees 5,013 7,191 (30.3) Net loss on foreign exchange differences 475 85 458.8 Net impairment loss/(reversal of impairment loss) on: Investment securities 13 (14) (192.9) Trade and other receivables 39 683 (94.3) Miscellaneous expenses 2,220 1,861 19.3 Total other operating expenses 22,555 23,767 (5.1)
BURSA MALAYSIA BERHAD (30632-P)(Incorporated in Malaysia)
PART A: EXPLANATORY NOTES PURSUANT TO MFRS 134
Quarter and Year-To-Date Ended
OTHER OPERATING EXPENSES
Quarter and Year-To-Date Ended
10
11. SEGMENTAL INFORMATION
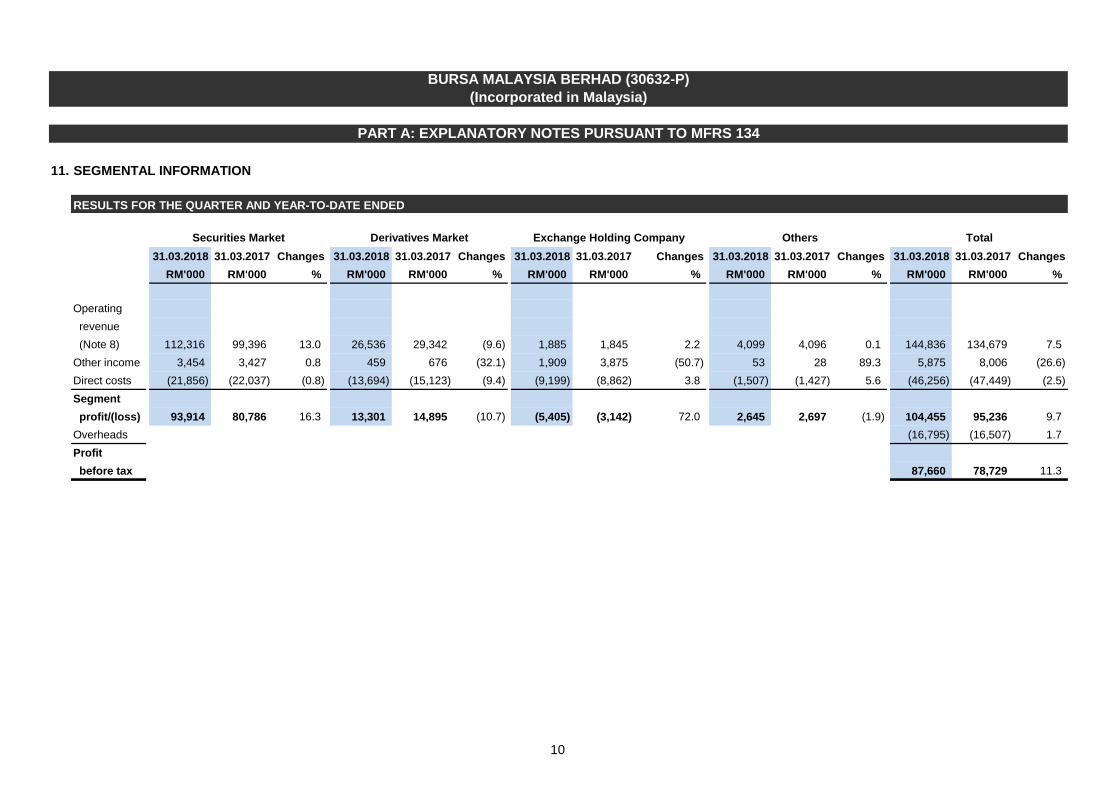
RESULTS FOR THE QUARTER AND YEAR-TO-DATE ENDED
31.03.2018 31.03.2017 Changes 31.03.2018 31.03.2017 Changes 31.03.2018 31.03.2017 Changes 31.03.2018 31.03.2017 Changes 31.03.2018 31.03.2017 ChangesRM'000 RM'000 % RM'000 RM'000 % RM'000 RM'000 % RM'000 RM'000 % RM'000 RM'000 %
Operating revenue (Note 8) 112,316 99,396 13.0 26,536 29,342 (9.6) 1,885 1,845 2.2 4,099 4,096 0.1 144,836 134,679 7.5 Other income 3,454 3,427 0.8 459 676 (32.1) 1,909 3,875 (50.7) 53 28 89.3 5,875 8,006 (26.6) Direct costs (21,856) (22,037) (0.8) (13,694) (15,123) (9.4) (9,199) (8,862) 3.8 (1,507) (1,427) 5.6 (46,256) (47,449) (2.5) Segment profit/(loss) 93,914 80,786 16.3 13,301 14,895 (10.7) (5,405) (3,142) 72.0 2,645 2,697 (1.9) 104,455 95,236 9.7 Overheads (16,795) (16,507) 1.7 Profit before tax 87,660 78,729 11.3
BURSA MALAYSIA BERHAD (30632-P)(Incorporated in Malaysia)
PART A: EXPLANATORY NOTES PURSUANT TO MFRS 134
Securities Market Derivatives Market Exchange Holding Company Others Total

11
11. SEGMENTAL INFORMATION (CONT'D.)
ExchangeSecurities Derivatives Holding
Market Market Company Others TotalRM'000 RM'000 RM'000 RM'000 RM'000
ASSETS AND LIABILITIES AS AT31 MARCH 2018
Assets 373,878 95,813 413,223 26,852 909,766 Clearing Funds 102,783 25,859 - - 128,642 Cash for equity margins, derivatives trading margins, security deposits, SBL collaterals and eDividend distributions 120,590 1,171,466 - - 1,292,056 Segment assets 597,251 1,293,138 413,223 26,852 2,330,464 Unallocated corporate assets - - - - 9,983 Total assets 597,251 1,293,138 413,223 26,852 2,340,447
Liabilities 65,658 14,584 66,529 16,216 162,987 Participants' contributions to Clearing Funds 17,783 20,859 - - 38,642 Equity margins, derivatives trading margins, security deposits, SBL collaterals and eDividend distributions 120,590 1,171,466 - - 1,292,056 Segment liabilities 204,031 1,206,909 66,529 16,216 1,493,685 Unallocated corporate liabilities - - - - 8,774 Total liabilities 204,031 1,206,909 66,529 16,216 1,502,459
ASSETS AND LIABILITIES AS AT31 DECEMBER 2017
Assets 395,584 98,654 393,025 28,365 915,628 Clearing Funds 102,577 27,051 - - 129,628 Cash for equity margins, derivatives trading margins, security deposits, SBL collaterals and eDividend distributions 117,846 1,050,680 - - 1,168,526 Segment assets 616,007 1,176,385 393,025 28,365 2,213,782 Unallocated corporate assets - - - - 11,099 Total assets 616,007 1,176,385 393,025 28,365 2,224,881
Liabilities 38,892 12,712 79,067 14,689 145,360 Participants' contributions to Clearing Funds 17,577 22,051 - - 39,628 Equity margins, derivatives trading margins, security deposits, SBL collaterals and eDividend distributions 117,846 1,050,680 - - 1,168,526 Segment liabilities 174,315 1,085,443 79,067 14,689 1,353,514 Unallocated corporate liabilities - - - - 8,910 Total liabilities 174,315 1,085,443 79,067 14,689 1,362,424
BURSA MALAYSIA BERHAD (30632-P)(Incorporated in Malaysia)
PART A: EXPLANATORY NOTES PURSUANT TO MFRS 134
12
12. RELATED PARTY DISCLOSURES
13.
As at As at31.03.2018 31.12.2017
RM'000 RM'000
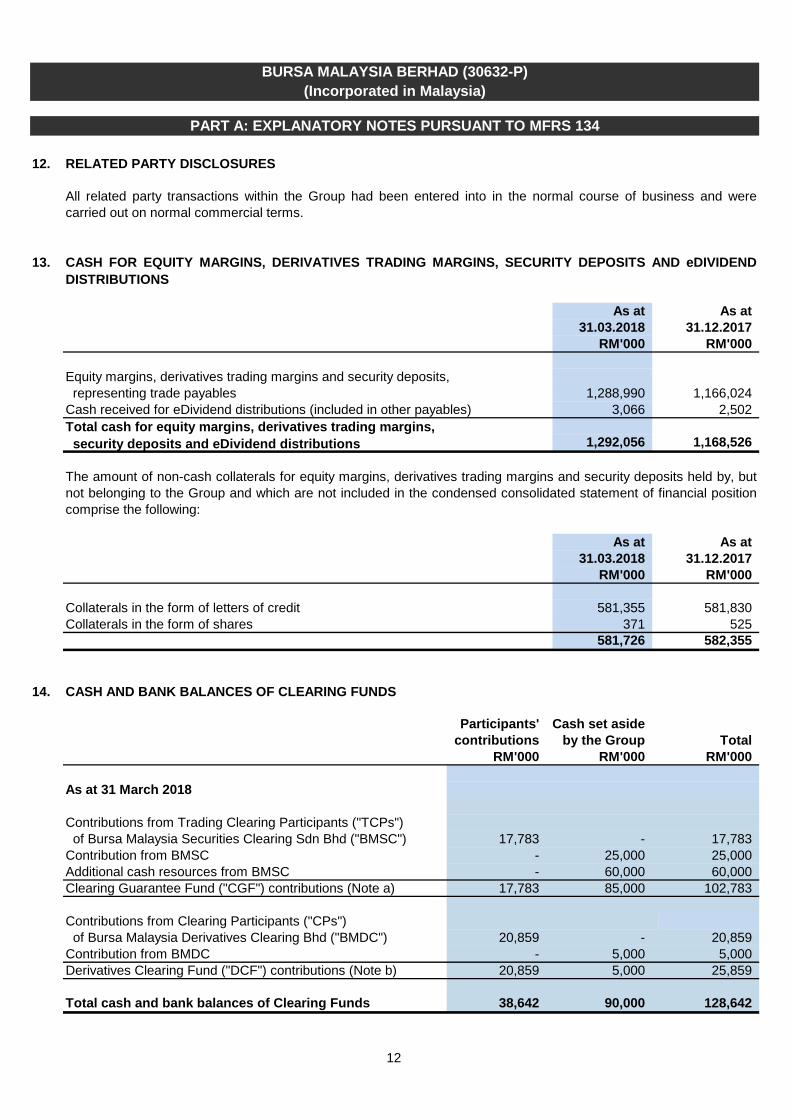
Equity margins, derivatives trading margins and security deposits, representing trade payables 1,288,990 1,166,024 Cash received for eDividend distributions (included in other payables) 3,066 2,502
1,292,056 1,168,526
As at As at31.03.2018 31.12.2017
RM'000 RM'000
Collaterals in the form of letters of credit 581,355 581,830 Collaterals in the form of shares 371 525
581,726 582,355
14. CASH AND BANK BALANCES OF CLEARING FUNDS
Participants' Cash set asidecontributions by the Group Total
RM'000 RM'000 RM'000
As at 31 March 2018
Contributions from Trading Clearing Participants ("TCPs") of Bursa Malaysia Securities Clearing Sdn Bhd ("BMSC") 17,783 - 17,783 Contribution from BMSC - 25,000 25,000 Additional cash resources from BMSC - 60,000 60,000 Clearing Guarantee Fund ("CGF") contributions (Note a) 17,783 85,000 102,783
Contributions from Clearing Participants ("CPs") of Bursa Malaysia Derivatives Clearing Bhd ("BMDC") 20,859 - 20,859 Contribution from BMDC - 5,000 5,000 Derivatives Clearing Fund ("DCF") contributions (Note b) 20,859 5,000 25,859
Total cash and bank balances of Clearing Funds 38,642 90,000 128,642
BURSA MALAYSIA BERHAD (30632-P)(Incorporated in Malaysia)
PART A: EXPLANATORY NOTES PURSUANT TO MFRS 134
All related party transactions within the Group had been entered into in the normal course of business and werecarried out on normal commercial terms.
CASH FOR EQUITY MARGINS, DERIVATIVES TRADING MARGINS, SECURITY DEPOSITS AND eDIVIDENDDISTRIBUTIONS
The amount of non-cash collaterals for equity margins, derivatives trading margins and security deposits held by, butnot belonging to the Group and which are not included in the condensed consolidated statement of financial positioncomprise the following:
Total cash for equity margins, derivatives trading margins, security deposits and eDividend distributions

13
BURSA MALAYSIA BERHAD (30632-P)(Incorporated in Malaysia)
PART A: EXPLANATORY NOTES PURSUANT TO MFRS 134
14. CASH AND BANK BALANCES OF CLEARING FUNDS (CONT'D.)
Participants' Cash set asidecontributions by the Group Total
RM'000 RM'000 RM'000
As at 31 December 2017
Contributions from TCPs of BMSC 17,577 - 17,577 Contribution from BMSC - 25,000 25,000 Additional cash resources from BMSC - 60,000 60,000 CGF contributions (Note a) 17,577 85,000 102,577
Contributions from CPs of BMDC 22,051 - 22,051 Contribution from BMDC - 5,000 5,000 DCF contributions (Note b) 22,051 5,000 27,051
Total cash and bank balances of Clearing Funds 39,628 90,000 129,628
(a)
As at As at31.03.2018 31.12.2017
RM'000 RM'000
Cash and bank balances 102,783 102,577 Bank guarantees from TCPs of BMSC 150 2,940 Total CGF 102,933 105,517
(b)
15. CASH AND BANK BALANCES OF THE GROUP
As at As at31.03.2018 31.12.2017
RM'000 RM'000
Cash and bank balances 3,969 4,299 Deposits for short-term funding requirements 186,761 243,833 Cash and cash equivalents 190,730 248,132 Deposits not for short-term funding requirements 61,529 23,075 Total cash and bank balances 252,259 271,207
The bank guarantees above were lodged and accepted by the Group prior to the effective date of the removal ofthe bank guarantee as an acceptable form of contribution to the CGF pursuant to the amendments to the Rulesof Bursa Malaysia Securities Clearing on 18 December 2017.
Total cash and non-cash components of the CGF are as follows:
There are no non-cash collaterals from CPs of BMDC for DCF held by the Group as at 31 March 2018 and 31December 2017.

14
BURSA MALAYSIA BERHAD (30632-P)(Incorporated in Malaysia)
PART A: EXPLANATORY NOTES PURSUANT TO MFRS 134
16. CAPITAL COMMITMENTS
As at As at31.03.2018 31.12.2017
RM'000 RM'000
Approved and contracted for: Computers and office automation 443 1,669 Office equipment and renovations 314 12
757 1,681
Approved but not contracted for: Computers and office automation 8,014 60 Office equipment and renovations - 50
8,014 110
17. CONTINGENT ASSETS AND LIABILITIES
18. CHANGES IN COMPOSITION OF THE GROUP
19. OPERATING LEASE ARRANGEMENTS
As at As at31.03.2018 31.12.2017
RM'000 RM'000
Not later than 1 year 208 427 Later than 1 year and not later than 5 years 54 88 Total future minimum lease receivables 262 515
The Group has entered into operating lease arrangements as the lessor for the lease of office space in the building.The future aggregate minimum lease payments receivable under operating leases contracted for but not recognisedas receivables are as follows:
There were no changes in the composition of the Group during the current quarter and year-to-date ended 31 March2018.
Capital commitments for the purchase of property, plant and equipment not provided for in the Condensed Report asat the end of the financial period are as follows:
There are no contingent assets and no changes in the contingent liability in respect of the put and call options with theChicago Mercantile Exchange ("CME") Group over the ordinary shares of Bursa Malaysia Derivatives Berhad held byCME Group since 31 December 2017.

15
BURSA MALAYSIA BERHAD (30632-P)(Incorporated in Malaysia)
PART A: EXPLANATORY NOTES PURSUANT TO MFRS 134
20. FINANCIAL INSTRUMENTS
20.1 Classification
As at As at31.03.2018 31.12.2017
RM'000 RM'000
AssetsFinancial assets at FVTOCI Investments securities: Quoted shares (outside Malaysia) 238,071 226,806 Unquoted bonds 74,930 80,012
313,001 306,818
Financial assets at amortised cost Staff loans receivable 3,220 3,453 Trade receivables 55,128 47,218 Other receivables which are financial assets* 10,058 11,440 Cash for equity margins, derivatives trading margins, security deposits, SBL collaterals and eDividend distributions 1,292,056 1,168,526 Cash and bank balances of Clearing Funds 128,642 129,628 Cash and bank balances of the Group 252,259 271,207 Total financial assets 2,054,364 1,938,290
LiabilitiesFinancial liabilities at amortised cost Trade payables 1,288,990 1,166,024 Participants' contributions to Clearing Funds 38,642 39,628 Other payables which are financial liabilities** 44,083 33,595 Lease liablities 8,108 7,975 Total financial liabilities 1,379,823 1,247,222
*
**
20.2 Fair Value
(a) Financial instruments that are carried at fair value
Financial assets at FVTOCI are measured at different measurement hierarchies (i.e. Level 1, 2 and 3).The hierarchies reflect the level of objectiveness of inputs used when measuring the fair value.
Other receivables which are financial assets include deposits, interest receivables and sundryreceivables, net of allowance for impairment loss.Other payables which are financial liabilities include amount due to the Securities Commission andsundry payables.
The following table analyses the financial assets and financial liabilities of the Group in the condensedconsolidated statement of financial position by the classes and categories of financial instruments to which theyare assigned by their measurement basis.
16
BURSA MALAYSIA BERHAD (30632-P)(Incorporated in Malaysia)
PART A: EXPLANATORY NOTES PURSUANT TO MFRS 134
20. FINANCIAL INSTRUMENTS (CONT'D.)
20.2 Fair Value (Cont'd.)
(a) Financial instruments that are carried at fair value (cont'd.)
(i)
(ii)
(iii)
Level 1 Level 2 TotalRM'000 RM'000 RM'000
As at 31 March 2018
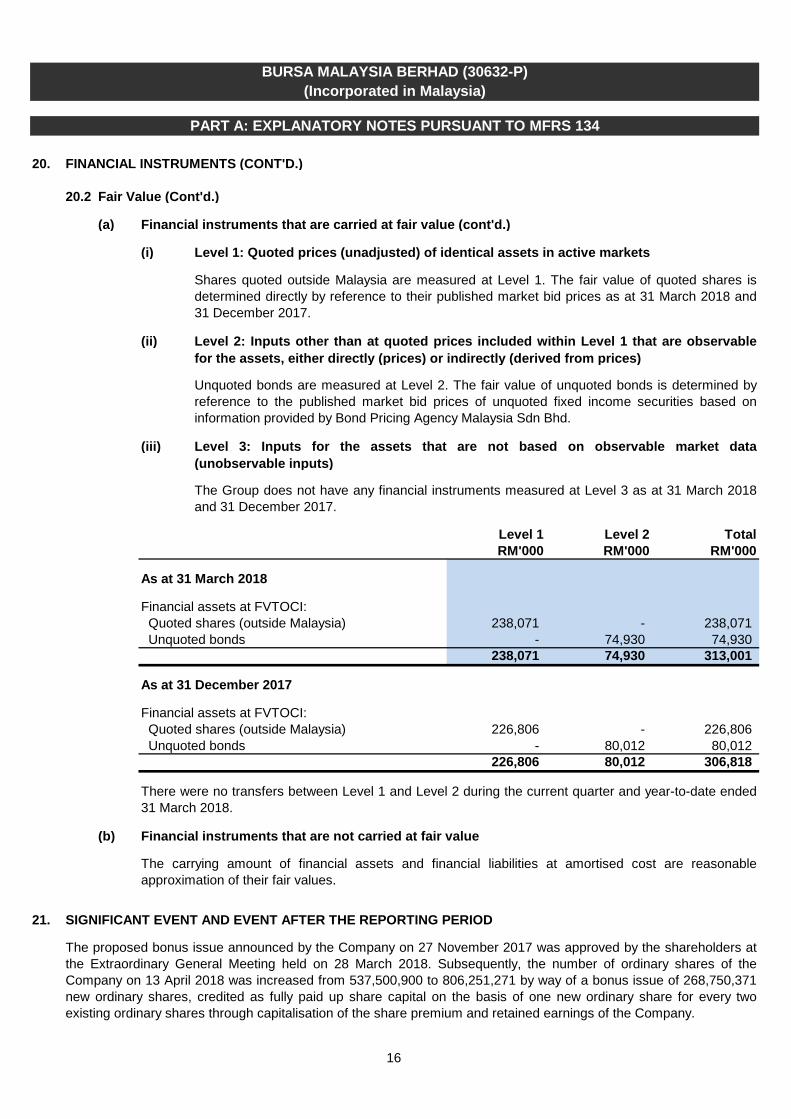
Financial assets at FVTOCI: Quoted shares (outside Malaysia) 238,071 - 238,071 Unquoted bonds - 74,930 74,930
238,071 74,930 313,001
As at 31 December 2017
Financial assets at FVTOCI: Quoted shares (outside Malaysia) 226,806 - 226,806 Unquoted bonds - 80,012 80,012
226,806 80,012 306,818
(b) Financial instruments that are not carried at fair value
21. SIGNIFICANT EVENT AND EVENT AFTER THE REPORTING PERIOD
The proposed bonus issue announced by the Company on 27 November 2017 was approved by the shareholders atthe Extraordinary General Meeting held on 28 March 2018. Subsequently, the number of ordinary shares of theCompany on 13 April 2018 was increased from 537,500,900 to 806,251,271 by way of a bonus issue of 268,750,371new ordinary shares, credited as fully paid up share capital on the basis of one new ordinary share for every twoexisting ordinary shares through capitalisation of the share premium and retained earnings of the Company.
The carrying amount of financial assets and financial liabilities at amortised cost are reasonableapproximation of their fair values.
There were no transfers between Level 1 and Level 2 during the current quarter and year-to-date ended31 March 2018.
Level 1: Quoted prices (unadjusted) of identical assets in active markets
Level 2: Inputs other than at quoted prices included within Level 1 that are observablefor the assets, either directly (prices) or indirectly (derived from prices)
The Group does not have any financial instruments measured at Level 3 as at 31 March 2018and 31 December 2017.
Unquoted bonds are measured at Level 2. The fair value of unquoted bonds is determined byreference to the published market bid prices of unquoted fixed income securities based oninformation provided by Bond Pricing Agency Malaysia Sdn Bhd.
Level 3: Inputs for the assets that are not based on observable market data(unobservable inputs)
Shares quoted outside Malaysia are measured at Level 1. The fair value of quoted shares isdetermined directly by reference to their published market bid prices as at 31 March 2018 and31 December 2017.
17
22.
(i)
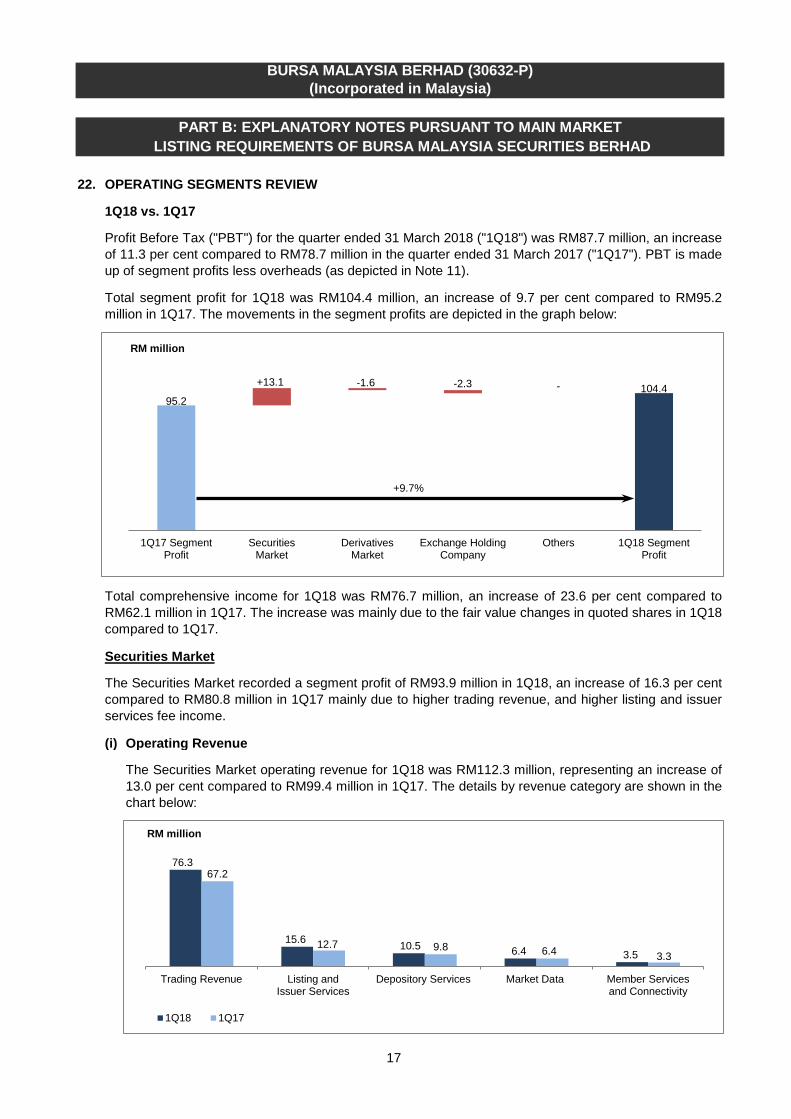
Total comprehensive income for 1Q18 was RM76.7 million, an increase of 23.6 per cent compared toRM62.1 million in 1Q17. The increase was mainly due to the fair value changes in quoted shares in 1Q18compared to 1Q17.
Securities Market
The Securities Market recorded a segment profit of RM93.9 million in 1Q18, an increase of 16.3 per centcompared to RM80.8 million in 1Q17 mainly due to higher trading revenue, and higher listing and issuerservices fee income.
Operating Revenue
The Securities Market operating revenue for 1Q18 was RM112.3 million, representing an increase of13.0 per cent compared to RM99.4 million in 1Q17. The details by revenue category are shown in thechart below:
PART B: EXPLANATORY NOTES PURSUANT TO MAIN MARKET LISTING REQUIREMENTS OF BURSA MALAYSIA SECURITIES BERHAD
BURSA MALAYSIA BERHAD (30632-P)(Incorporated in Malaysia)
OPERATING SEGMENTS REVIEW
1Q18 vs. 1Q17
Profit Before Tax ("PBT") for the quarter ended 31 March 2018 ("1Q18") was RM87.7 million, an increaseof 11.3 per cent compared to RM78.7 million in the quarter ended 31 March 2017 ("1Q17"). PBT is madeup of segment profits less overheads (as depicted in Note 11).
Total segment profit for 1Q18 was RM104.4 million, an increase of 9.7 per cent compared to RM95.2million in 1Q17. The movements in the segment profits are depicted in the graph below:
76.3
15.6 10.5 6.4 3.5
67.2
12.7 9.8 6.4 3.3
Trading Revenue Listing andIssuer Services
Depository Services Market Data Member Servicesand Connectivity
RM million
1Q18 1Q17
95.2 - 104.4+13.1 -1.6 -2.3
1Q17 SegmentProfit
SecuritiesMarket
DerivativesMarket
Exchange HoldingCompany
Others 1Q18 SegmentProfit
RM million
+9.7%

18
PART B: EXPLANATORY NOTES PURSUANT TO MAIN MARKET LISTING REQUIREMENTS OF BURSA MALAYSIA SECURITIES BERHAD
BURSA MALAYSIA BERHAD (30632-P)(Incorporated in Malaysia)
22.
(i)
>
>
>
1Q18 1Q17 Changes (%)FBMKLCI (points) 1,863.46 1,740.09 7.1 ADV (OMT and DBT) (RM'billion) 2.93 2.54 15.4 Average daily trading volume (OMT and DBT) (billion shares) 3.27 2.79 17.2 Effective clearing fee rate (basis points) 2.31 2.32 (0.4) Velocity (per cent) 35 34 2.9 Number of Initial Public Offerings ("IPOs") 7 4 75.0 Number of new structured warrants listed 269 168 60.1 Total funds raised: IPOs (RM'billion) 0.21 0.87 (75.9) Secondary issues (RM'billion) 2.56 3.35 (23.6) Market capitalisation as at end of period (RM'billion) 1,895.66 1,801.30 5.2 Number of trading days 61 61 -
(ii)
Segment expenses marginally decreased by 0.8 per cent to RM21.9 million in 1Q18 compared toRM22.0 million in 1Q17.
1Q18 vs. 1Q17 (Cont'd.)
Securities Market (Cont'd.)
Operating Revenue (Cont'd.)
OPERATING SEGMENTS REVIEW (CONT'D.)
Operating Expenses
Trading revenue increased by 13.5 per cent to RM76.3 million in 1Q18. 1Q18 saw a higherAverage Daily trading Value ("ADV") for On-Market Trades ("OMT") and Direct Business Trades("DBT") of RM2.93 billion compared to RM2.54 billion in 1Q17.
Listing and issuer services revenue increased by 22.9 per cent to RM15.6 million in 1Q18. Theincrease was mainly due to higher listing fees, as well as perusal and processing fees earnedfrom higher number of corporate exercises and structured warrants listed in 1Q18.
Depository services revenue increased by 7.3 per cent to RM10.5 million in 1Q18 due to higherCDS custody fees.
Key operating drivers in the Securities Market are as follows:
19
PART B: EXPLANATORY NOTES PURSUANT TO MAIN MARKET LISTING REQUIREMENTS OF BURSA MALAYSIA SECURITIES BERHAD
BURSA MALAYSIA BERHAD (30632-P)(Incorporated in Malaysia)
22.
(i)
>
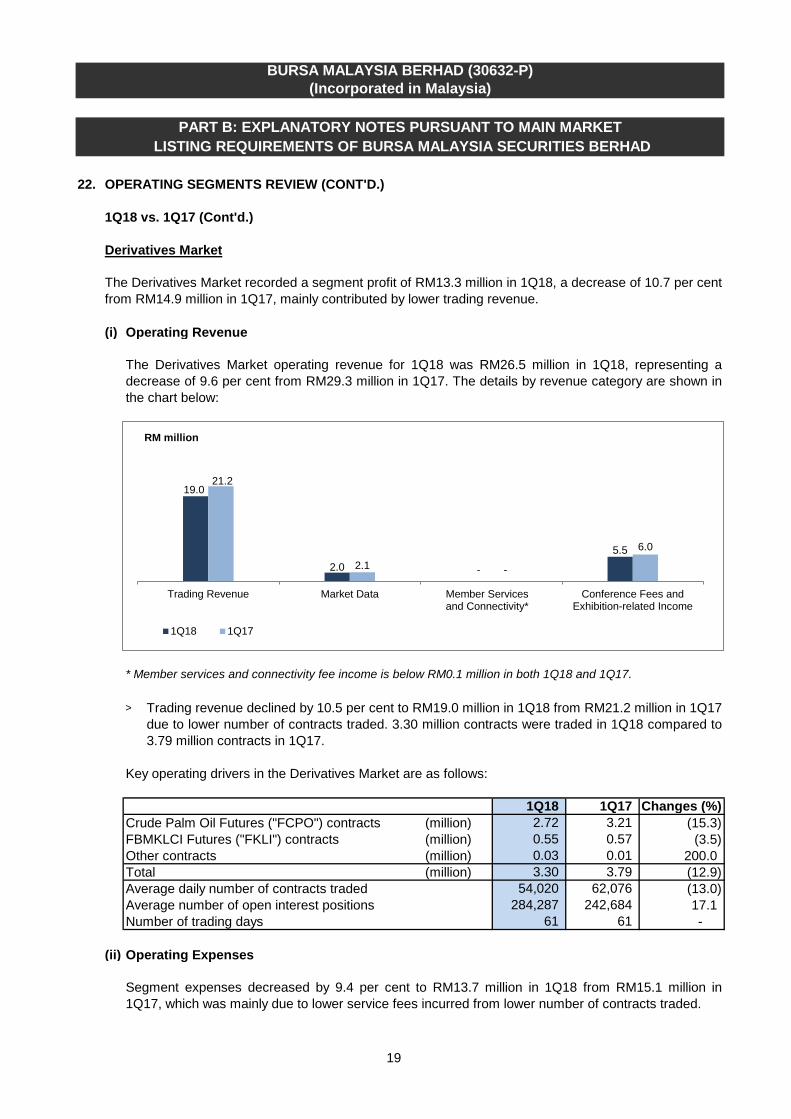
1Q18 1Q17 Changes (%)Crude Palm Oil Futures ("FCPO") contracts (million) 2.72 3.21 (15.3) FBMKLCI Futures ("FKLI") contracts (million) 0.55 0.57 (3.5) Other contracts (million) 0.03 0.01 200.0 Total (million) 3.30 3.79 (12.9) Average daily number of contracts traded 54,020 62,076 (13.0) Average number of open interest positions 284,287 242,684 17.1 Number of trading days 61 61 -
(ii)
1Q18 vs. 1Q17 (Cont'd.)
Derivatives Market
The Derivatives Market recorded a segment profit of RM13.3 million in 1Q18, a decrease of 10.7 per centfrom RM14.9 million in 1Q17, mainly contributed by lower trading revenue.
Operating Revenue
The Derivatives Market operating revenue for 1Q18 was RM26.5 million in 1Q18, representing adecrease of 9.6 per cent from RM29.3 million in 1Q17. The details by revenue category are shown inthe chart below:
OPERATING SEGMENTS REVIEW (CONT'D.)
* Member services and connectivity fee income is below RM0.1 million in both 1Q18 and 1Q17.
Trading revenue declined by 10.5 per cent to RM19.0 million in 1Q18 from RM21.2 million in 1Q17due to lower number of contracts traded. 3.30 million contracts were traded in 1Q18 compared to3.79 million contracts in 1Q17.
Key operating drivers in the Derivatives Market are as follows:
Operating Expenses
Segment expenses decreased by 9.4 per cent to RM13.7 million in 1Q18 from RM15.1 million in1Q17, which was mainly due to lower service fees incurred from lower number of contracts traded.
19.0
2.0 -
5.5
21.2
2.1 -
6.0
Trading Revenue Market Data Member Servicesand Connectivity*
Conference Fees andExhibition-related Income
RM million
1Q18 1Q17

20
PART B: EXPLANATORY NOTES PURSUANT TO MAIN MARKET LISTING REQUIREMENTS OF BURSA MALAYSIA SECURITIES BERHAD
BURSA MALAYSIA BERHAD (30632-P)(Incorporated in Malaysia)
22.
Overheads marginally increased by 1.7 per cent to RM16.8 million in 1Q18 compared to RM16.5 millionin 1Q17.
The Exchange Holding Company recorded a higher segment loss of RM5.4 million in 1Q18 compared toRM3.1 million in 1Q17 mainly due to lower rental income earned.
Others
OPERATING SEGMENTS REVIEW (CONT'D.)
1Q18 vs. 1Q17 (Cont'd.)
Exchange Holding Company
This segment is made up of BSAS business, bonds trading and offshore exchange. The segment profitdecreased by 1.9 per cent to RM2.6 million in 1Q18.
Overheads
21
PART B: EXPLANATORY NOTES PURSUANT TO MAIN MARKET LISTING REQUIREMENTS OF BURSA MALAYSIA SECURITIES BERHAD
BURSA MALAYSIA BERHAD (30632-P)(Incorporated in Malaysia)
23.
Financial Results
31.03.2018 31.12.2017 ChangesRM'000 RM'000 %
Operating revenue 144,836 130,022 11.4 Other income 5,875 11,181 (47.5)
150,711 141,203 6.7 Staff costs (34,798) (37,295) (6.7) Depreciation and amortisation (5,565) (5,783) (3.8) Other operating expenses (22,555) (23,365) (3.5) Profit from operations 87,793 74,760 17.4 Finance costs (133) (134) (0.7) PBT 87,660 74,626 17.5
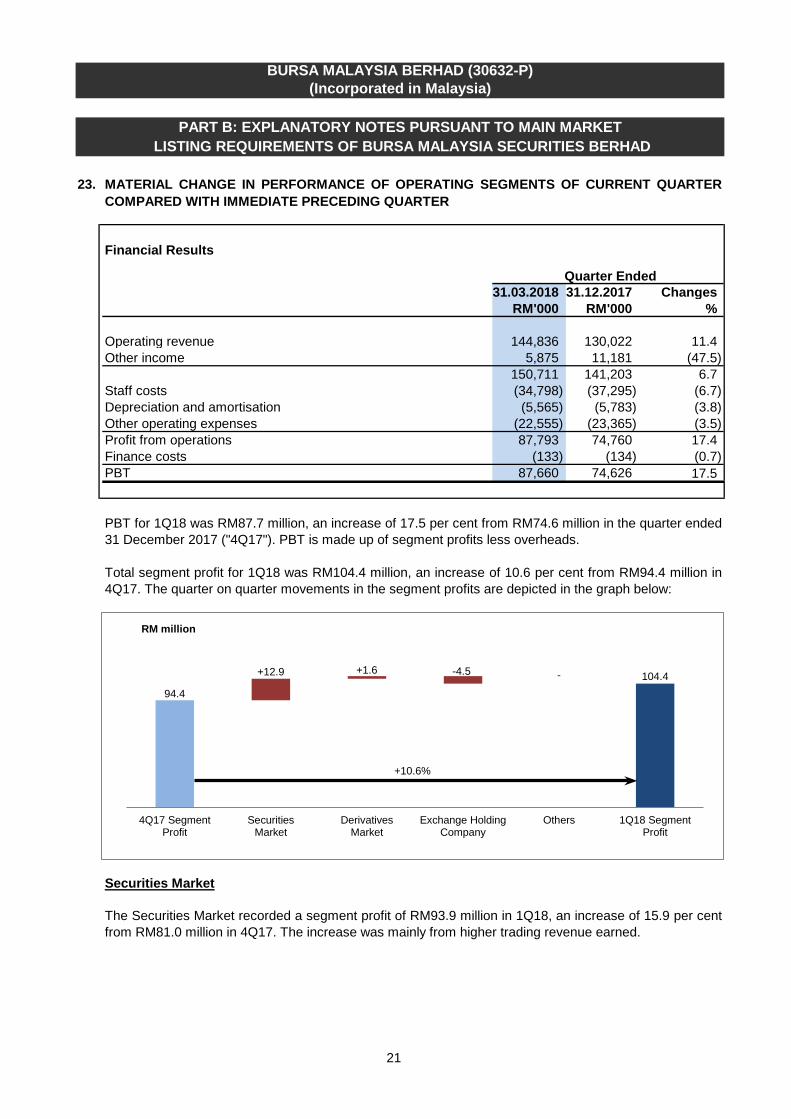
The Securities Market recorded a segment profit of RM93.9 million in 1Q18, an increase of 15.9 per centfrom RM81.0 million in 4Q17. The increase was mainly from higher trading revenue earned.
PBT for 1Q18 was RM87.7 million, an increase of 17.5 per cent from RM74.6 million in the quarter ended31 December 2017 ("4Q17"). PBT is made up of segment profits less overheads.
Total segment profit for 1Q18 was RM104.4 million, an increase of 10.6 per cent from RM94.4 million in4Q17. The quarter on quarter movements in the segment profits are depicted in the graph below:
Quarter Ended
MATERIAL CHANGE IN PERFORMANCE OF OPERATING SEGMENTS OF CURRENT QUARTERCOMPARED WITH IMMEDIATE PRECEDING QUARTER
Securities Market
94.4 104.4+12.9 +1.6 -4.5 -
4Q17 SegmentProfit
SecuritiesMarket
DerivativesMarket
Exchange HoldingCompany
Others 1Q18 SegmentProfit
RM million
+10.6%
22
PART B: EXPLANATORY NOTES PURSUANT TO MAIN MARKET LISTING REQUIREMENTS OF BURSA MALAYSIA SECURITIES BERHAD
BURSA MALAYSIA BERHAD (30632-P)(Incorporated in Malaysia)
23.
(i)
>
>
1Q18 4Q17 Changes (%)FBMKLCI (points) 1,863.46 1,796.81 3.7 ADV (OMT and DBT) (RM'billion) 2.93 2.62 11.8 Average daily trading volume (OMT and DBT) (billion shares) 3.27 2.66 22.9 Effective clearing fee rate (basis points) 2.31 2.19 5.5 Velocity (per cent) 35 31 12.9 Number of IPOs 7 3 133.3 Number of new structured warrants listed 269 234 15.0 Total funds raised: IPOs (RM'billion) 0.21 0.04 425.0 Secondary issues (RM'billion) 2.56 4.24 (39.6) Market capitalisation as at end of period (RM'billion) 1,895.66 1,906.84 (0.6) Number of trading days 61 62 (1.6)
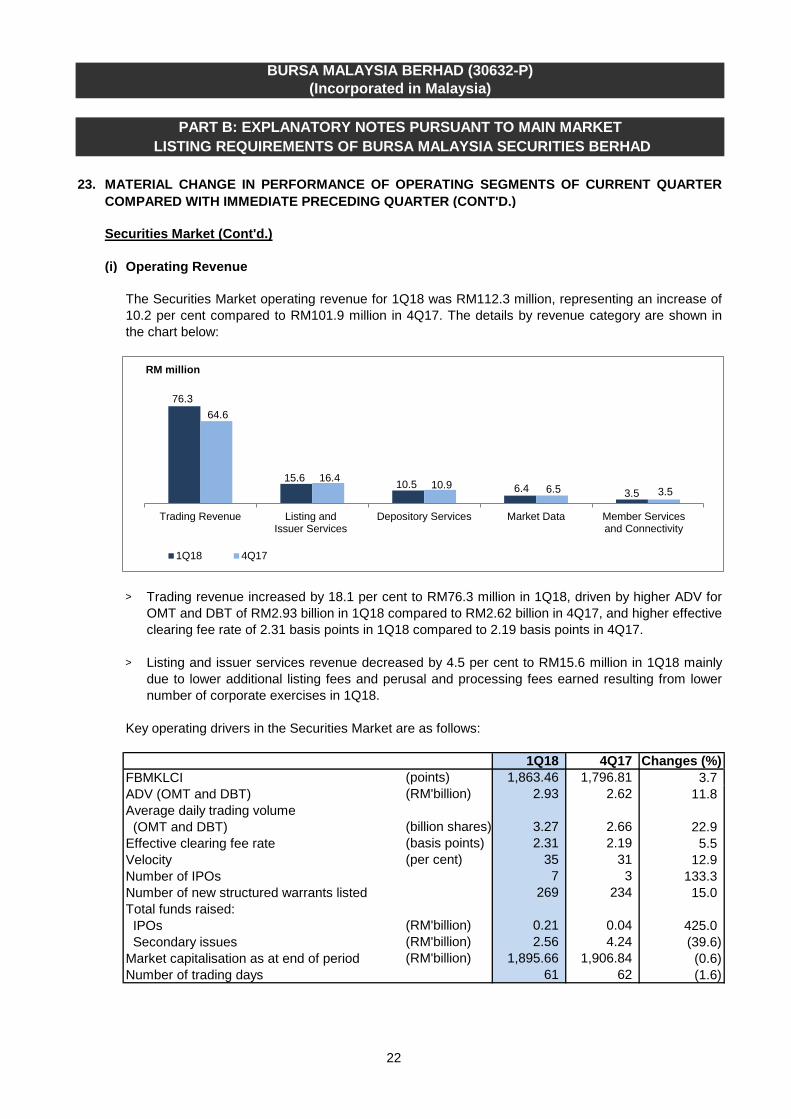
The Securities Market operating revenue for 1Q18 was RM112.3 million, representing an increase of10.2 per cent compared to RM101.9 million in 4Q17. The details by revenue category are shown inthe chart below:
Trading revenue increased by 18.1 per cent to RM76.3 million in 1Q18, driven by higher ADV forOMT and DBT of RM2.93 billion in 1Q18 compared to RM2.62 billion in 4Q17, and higher effectiveclearing fee rate of 2.31 basis points in 1Q18 compared to 2.19 basis points in 4Q17.
Key operating drivers in the Securities Market are as follows:
Listing and issuer services revenue decreased by 4.5 per cent to RM15.6 million in 1Q18 mainlydue to lower additional listing fees and perusal and processing fees earned resulting from lowernumber of corporate exercises in 1Q18.
Operating Revenue
Securities Market (Cont'd.)
MATERIAL CHANGE IN PERFORMANCE OF OPERATING SEGMENTS OF CURRENT QUARTERCOMPARED WITH IMMEDIATE PRECEDING QUARTER (CONT'D.)
76.3
15.6 10.5 6.4 3.5
64.6
16.4 10.9 6.5 3.5
Trading Revenue Listing andIssuer Services
Depository Services Market Data Member Servicesand Connectivity
RM million
1Q18 4Q17
23
PART B: EXPLANATORY NOTES PURSUANT TO MAIN MARKET LISTING REQUIREMENTS OF BURSA MALAYSIA SECURITIES BERHAD
BURSA MALAYSIA BERHAD (30632-P)(Incorporated in Malaysia)
23.
(ii)
(i)
>
>
1Q18 4Q17 Changes (%)FCPO contracts (million) 2.72 2.88 (5.6) FKLI contracts (million) 0.55 0.47 17.0 Other contracts (million) 0.03 0.02 50.0 Total (million) 3.30 3.37 (2.1) Average daily number of contracts traded 54,020 54,348 (0.6) Average number of open interest positions 284,287 284,822 (0.2) Number of trading days 61 62 (1.6)
MATERIAL CHANGE IN PERFORMANCE OF OPERATING SEGMENTS OF CURRENT QUARTERCOMPARED WITH IMMEDIATE PRECEDING QUARTER (CONT'D.)
Operating Expenses
Securities Market (Cont'd.)
Operating Revenue
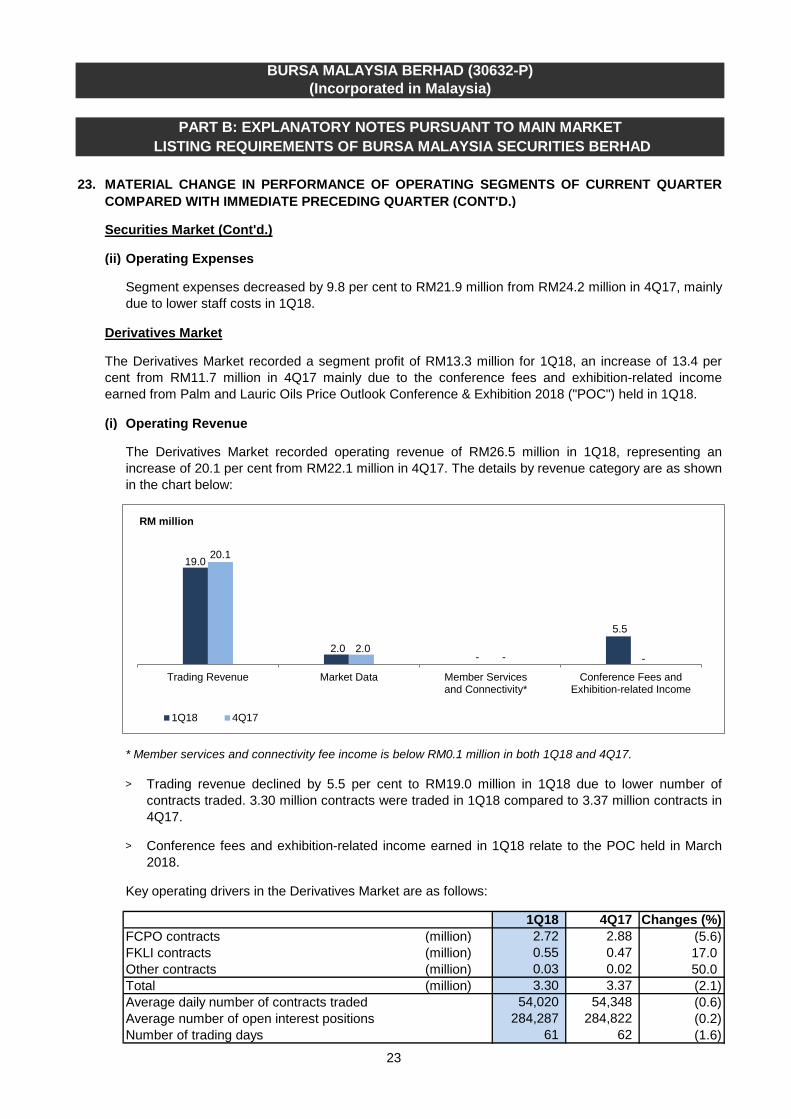
The Derivatives Market recorded operating revenue of RM26.5 million in 1Q18, representing anincrease of 20.1 per cent from RM22.1 million in 4Q17. The details by revenue category are as shownin the chart below:
* Member services and connectivity fee income is below RM0.1 million in both 1Q18 and 4Q17.
Trading revenue declined by 5.5 per cent to RM19.0 million in 1Q18 due to lower number ofcontracts traded. 3.30 million contracts were traded in 1Q18 compared to 3.37 million contracts in4Q17.
Conference fees and exhibition-related income earned in 1Q18 relate to the POC held in March2018.
Derivatives Market
Key operating drivers in the Derivatives Market are as follows:
Segment expenses decreased by 9.8 per cent to RM21.9 million from RM24.2 million in 4Q17, mainlydue to lower staff costs in 1Q18.
The Derivatives Market recorded a segment profit of RM13.3 million for 1Q18, an increase of 13.4 percent from RM11.7 million in 4Q17 mainly due to the conference fees and exhibition-related incomeearned from Palm and Lauric Oils Price Outlook Conference & Exhibition 2018 ("POC") held in 1Q18.
19.0
2.0-
5.5
20.1
2.0 - -
Trading Revenue Market Data Member Servicesand Connectivity*
Conference Fees andExhibition-related Income
RM million
1Q18 4Q17

24
PART B: EXPLANATORY NOTES PURSUANT TO MAIN MARKET LISTING REQUIREMENTS OF BURSA MALAYSIA SECURITIES BERHAD
BURSA MALAYSIA BERHAD (30632-P)(Incorporated in Malaysia)
23.
(ii)
Others
Overheads
This segment is made up of BSAS business, bonds trading and offshore exchange. The segment profitwas fairly stable at RM2.6 million in 1Q18 and 4Q17.
Segment expenses increased by 27.0 per cent to RM13.7 million in 1Q18 from RM10.8 million in4Q17, mainly due to expenses incurred for POC.
Derivatives Market (Cont'd.)
Overheads decreased by 15.2 per cent to RM16.8 million mainly due to lower staff costs.
MATERIAL CHANGE IN PERFORMANCE OF OPERATING SEGMENTS OF CURRENT QUARTERCOMPARED WITH IMMEDIATE PRECEDING QUARTER (CONT'D.)
The Exchange Holding Company recorded a higher segment loss of RM5.4 million in 1Q18 compared toRM0.9 million in 4Q17 mainly due to lower dividend and rental income earned in 1Q18.
Operating Expenses
Exchange Holding Company

25
24. COMMENTARY ON PROSPECTS AND TARGETS
●
●●●●●
With the above initiatives and barring any unforeseen circumstances, the Exchange expects the positivemomentum in the market to continue and to achieve a sustainable performance for the current financialyear.
The Securities Market segment is expected to be resilient, given the strong fundamentals of the economyand the continued improvements in corporate earnings into 2018. Nevertheless, domestic and externalfactors such as monetary policy shifts in advanced economies and rising trade protectionism by majortrading partners may continue to influence trading volatilities in the local market. In the DerivativesMarket, trading and hedging activities will continue to be influenced by volatility in commodity prices andthe underlying equity market. The inclusion of the traceability feature, extension of trading hours, tenureof contracts and position limits for FCPO contracts announced by the Exchange during the quarter willfurther enhance derivatives trading. As for the Islamic Capital Market, the Exchange will continue with itsefforts in promoting Shariah-compliant investing on the Bursa Malaysia-i platform through engagementswith market players, focusing on widening the investor base. Bursa Suq Al-Sila', on the other hand, willcontinue to extend its reach into new regions in 2018.
BURSA MALAYSIA BERHAD (30632-P)(Incorporated in Malaysia)
PART B: EXPLANATORY NOTES PURSUANT TO MAIN MARKET LISTING REQUIREMENTS OF BURSA MALAYSIA SECURITIES BERHAD
The International Monetary Fund (“IMF”), in its April 2018 report, maintained its 2018 global growthprojection of 3.9%, whilst the World Bank forecasted a global economic growth of 3.1%. For Malaysia’seconomic growth in 2018, IMF expects the Gross Domestic Product (“GDP”) to grow at 5.3% which iswithin its earlier projection range of 5.0% to 5.5%, and the World Bank has projected Malaysia’s GDP togrow at 5.4% in 2018, higher than the earlier estimated growth of 5.2%. Bank Negara Malaysia in its2017 annual report projected the Malaysian economy to expand by 5.5% to 6.0%, underpinned bysustained domestic demand growth and the strengthening of global economic conditions.
The Exchange is currently engaged in the establishment of a stock market trading link between BursaMalaysia and Singapore Exchange. In addition, Bursa Malaysia will continue with its initiatives to enhancethe breadth and depth of the ecosystem, which amongst others, through digitalisation of services,liberalisation of rules framework and greater diversification of the investor base.
All new investors to be given a fee waiver on trading and clearing fees for six (6) months.
As part of the continuing initiatives to further enhance the vibrancy and liquidity in the equity market, thefollowing have been introduced to-date:
Stamp duty waiver on shares of mid and small cap companies for three (3) years from 1 March 2018to 28 February 2021;Liberalisation of margin financing rules;Intra day short selling allowed for all investors;A new category of traders who trade on their own account, known as “Trading Specialists”;A volume-based incentive programme; and

26
25.
31.03.2018 31.03.2017 ChangesRM'000 RM'000 %
Income tax 21,717 19,407 11.9 Deferred tax 286 433 (33.9) Total income tax expense 22,003 19,840 10.9
26.
As at As at31.03.2018 31.12.2017
RM'000 RM'000
Trade receivables 56,392 48,398 Less: Allowance for impairment loss (1,264) (1,180)
55,128 47,218
As at As at31.03.2018 31.12.2017
RM'000 RM'000
Neither past due nor impaired 44,169 39,398 Past due not impaired: < 30 days 4,571 3,293 31 - 60 days 1,808 1,904 61 - 90 days 3,518 505 91 - 180 days 495 1,181 > 181 days 1,217 1,533 Impaired 614 584 Gross trade receivables 56,392 48,398 Less: Allowance for impairment loss (1,264) (1,180)
55,128 47,218
The effective tax rates of the Group for the current and previous corresponding periods were higher thanthe statutory tax rate of the respective periods principally due to certain expenses being not deductible fortax purposes.
TRADE RECEIVABLES
The ageing analysis of the Group's trade receivables is as follows:
Trade receivables that are past due not impaired are creditworthy debtors. The Group has no significantconcentration of credit risk that may arise from exposures to a single clearing participant or counterparty.
For years of assessment 2017 and 2018, the Malaysian statutory tax rate has been reduced by 1% to 4%, based on the prescribed incremental percentage of chargeable income from business, compared to thatof the immediate preceding year of assessment. The Group has accounted for the reduction in the taxrate in the current and previous corresponding periods, based on the percentage of increase inchargeable income of the Company and its subsidiaries.
BURSA MALAYSIA BERHAD (30632-P)(Incorporated in Malaysia)
PART B: EXPLANATORY NOTES PURSUANT TO MAIN MARKET LISTING REQUIREMENTS OF BURSA MALAYSIA SECURITIES BERHAD
Quarter and Year-To-Date Ended
INCOME TAX EXPENSE
Income tax is calculated at the Malaysian statutory tax rate of 24% of the estimated assessable profit forthe current and previous corresponding periods.
27
BURSA MALAYSIA BERHAD (30632-P)(Incorporated in Malaysia)
PART B: EXPLANATORY NOTES PURSUANT TO MAIN MARKET LISTING REQUIREMENTS OF BURSA MALAYSIA SECURITIES BERHAD
27.
28.
29.
30.
Final dividendFor the financial year ended 31 December 2016Approved and declared on 29 March 2017Date payable 18 April 2017Entitlement to dividends based on record of Depositors as at 5 April 2017Dividend per share (single-tier) 17.0 sen
31.
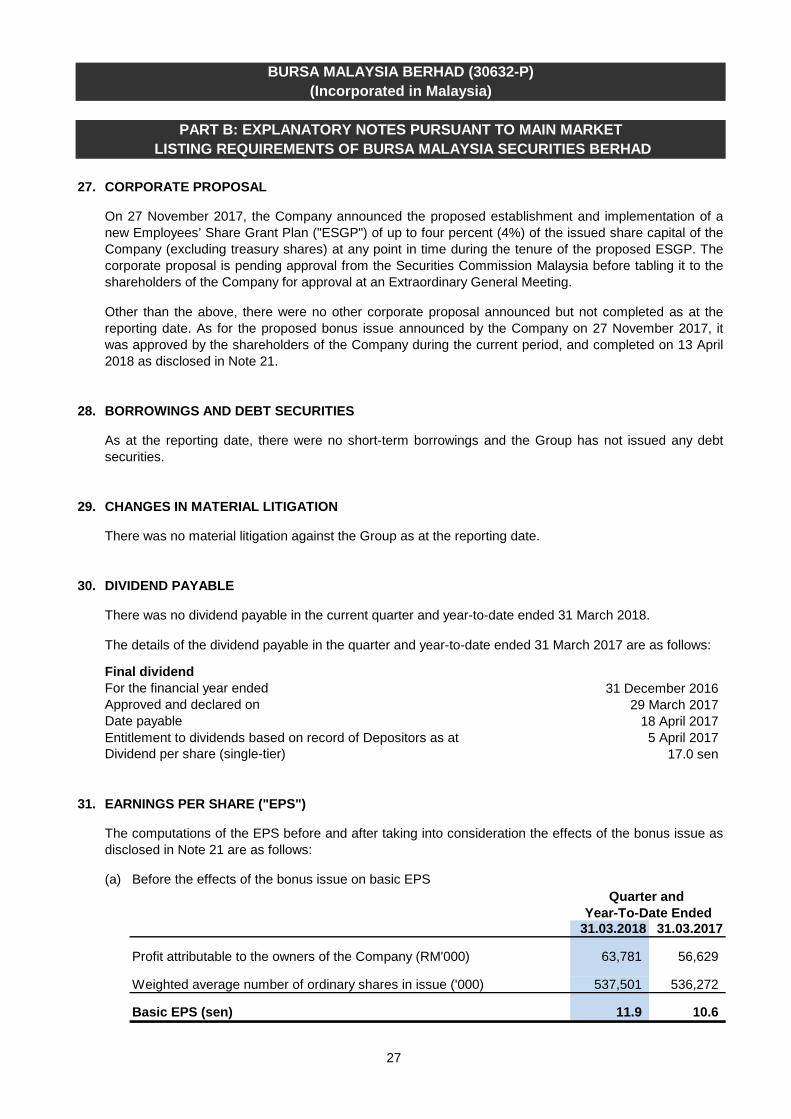
(a)
31.03.2018 31.03.2017
Profit attributable to the owners of the Company (RM'000) 63,781 56,629
Weighted average number of ordinary shares in issue ('000) 537,501 536,272
Basic EPS (sen) 11.9 10.6
The details of the dividend payable in the quarter and year-to-date ended 31 March 2017 are as follows:
EARNINGS PER SHARE ("EPS")
Year-To-Date Ended
The computations of the EPS before and after taking into consideration the effects of the bonus issue asdisclosed in Note 21 are as follows:
As at the reporting date, there were no short-term borrowings and the Group has not issued any debtsecurities.
CHANGES IN MATERIAL LITIGATION
BORROWINGS AND DEBT SECURITIES
DIVIDEND PAYABLE
Before the effects of the bonus issue on basic EPSQuarter and
There was no dividend payable in the current quarter and year-to-date ended 31 March 2018.
CORPORATE PROPOSAL
There was no material litigation against the Group as at the reporting date.
On 27 November 2017, the Company announced the proposed establishment and implementation of anew Employees’ Share Grant Plan ("ESGP") of up to four percent (4%) of the issued share capital of theCompany (excluding treasury shares) at any point in time during the tenure of the proposed ESGP. Thecorporate proposal is pending approval from the Securities Commission Malaysia before tabling it to theshareholders of the Company for approval at an Extraordinary General Meeting.
Other than the above, there were no other corporate proposal announced but not completed as at thereporting date. As for the proposed bonus issue announced by the Company on 27 November 2017, itwas approved by the shareholders of the Company during the current period, and completed on 13 April2018 as disclosed in Note 21.
28
BURSA MALAYSIA BERHAD (30632-P)(Incorporated in Malaysia)
PART B: EXPLANATORY NOTES PURSUANT TO MAIN MARKET LISTING REQUIREMENTS OF BURSA MALAYSIA SECURITIES BERHAD
31.
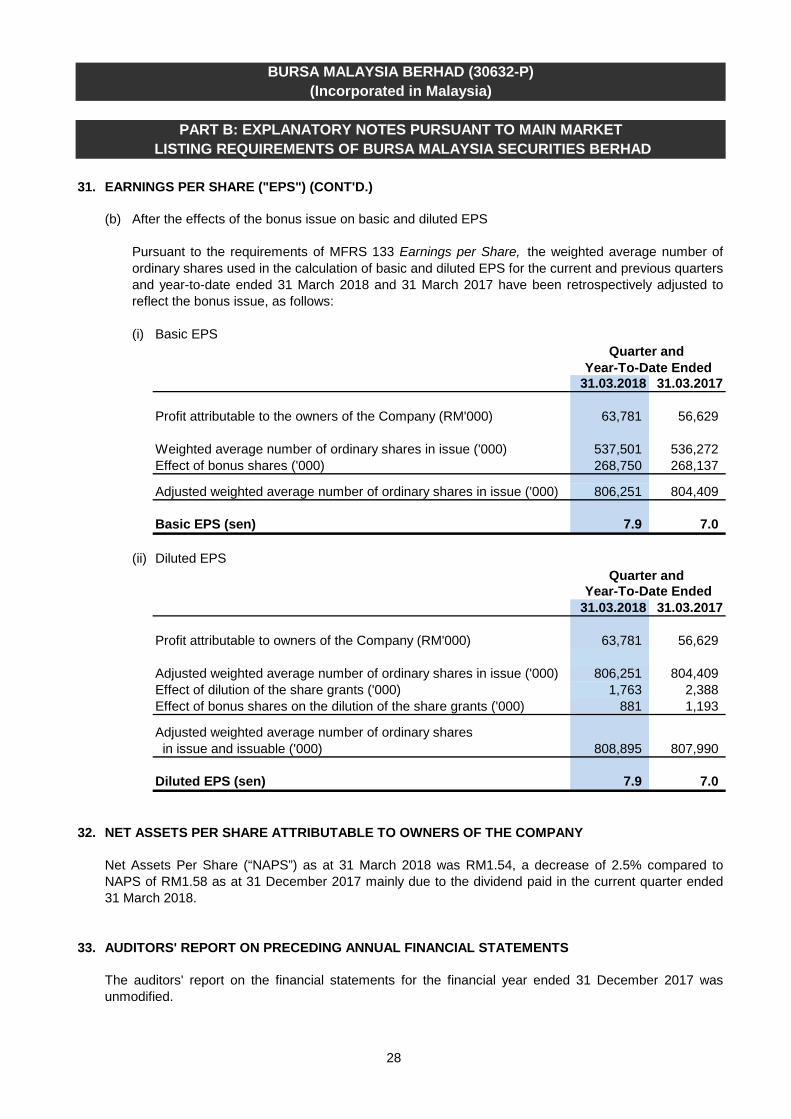
(b)
(i) Basic EPS
31.03.2018 31.03.2017
Profit attributable to the owners of the Company (RM'000) 63,781 56,629
Weighted average number of ordinary shares in issue ('000) 537,501 536,272 Effect of bonus shares ('000) 268,750 268,137
Adjusted weighted average number of ordinary shares in issue ('000) 806,251 804,409
Basic EPS (sen) 7.9 7.0
(ii) Diluted EPS
31.03.2018 31.03.2017
Profit attributable to owners of the Company (RM'000) 63,781 56,629
Adjusted weighted average number of ordinary shares in issue ('000) 806,251 804,409Effect of dilution of the share grants ('000) 1,763 2,388 Effect of bonus shares on the dilution of the share grants ('000) 881 1,193
Adjusted weighted average number of ordinary shares in issue and issuable ('000) 808,895 807,990
Diluted EPS (sen) 7.9 7.0
32.
33.
Pursuant to the requirements of MFRS 133 Earnings per Share, the weighted average number ofordinary shares used in the calculation of basic and diluted EPS for the current and previous quartersand year-to-date ended 31 March 2018 and 31 March 2017 have been retrospectively adjusted toreflect the bonus issue, as follows:
EARNINGS PER SHARE ("EPS") (CONT'D.)
Year-To-Date EndedQuarter and
After the effects of the bonus issue on basic and diluted EPS
Quarter and Year-To-Date Ended
NET ASSETS PER SHARE ATTRIBUTABLE TO OWNERS OF THE COMPANY
Net Assets Per Share (“NAPS”) as at 31 March 2018 was RM1.54, a decrease of 2.5% compared toNAPS of RM1.58 as at 31 December 2017 mainly due to the dividend paid in the current quarter ended31 March 2018.
AUDITORS' REPORT ON PRECEDING ANNUAL FINANCIAL STATEMENTS
The auditors' report on the financial statements for the financial year ended 31 December 2017 wasunmodified.

29
BURSA MALAYSIA BERHAD (30632-P)(Incorporated in Malaysia)
PART B: EXPLANATORY NOTES PURSUANT TO MAIN MARKET LISTING REQUIREMENTS OF BURSA MALAYSIA SECURITIES BERHAD
34.
35. AUTHORISED FOR ISSUE
The Condensed Report was authorised for issue by the Board in accordance with a resolution of theDirectors on 25 April 2018.
The Board of Directors ("Board") had engaged the external auditors to review and report on theCondensed Report of Bursa Malaysia Berhad for the quarter and year-to-date ended 31 March 2018 inaccordance with the International Standard on Review Engagements 2410, “Review of Interim FinancialInformation Performed by the Independent Auditor of the Entity ”.
The external auditors reported to the Board that nothing had come to their attention to cause them tobelieve that the Condensed Report was not prepared, in all material respects, in accordance with theMFRS 134 Interim Financial Reporting and the IAS 34 Interim Financial Reporting . The report was madeto the Board in accordance to the terms of the engagement letter with the external auditors and for noother purpose.
REVIEW BY EXTERNAL AUDITORS