bursts of explosive events in the solar network
TRANSCRIPT

BURSTS OF EXPLOSIVE EVENTS IN THE SOLAR NETWORK
D. E. INNES1, P. BREKKE2, D. GERMEROTT1 and K. WILHELM1
1Max-Planck-Institut fur Aeronomie, D-37189 Katlenburg-Lindau, Germany2Institute of Theoretical Astrophysics, University of Oslo, Blindern, N-0315 Oslo, Norway
(Received 14 March 1997; accepted 28 May 1997)
Abstract. Observations of the quiet-Sun network in the UV emission line Si IV 1393 A over a timeperiod of two hours are presented. Bursts of explosive events, highly Doppler-shifted emission, seemto be sporadically emitted from the brighter regions of the network lanes. Individual events havetypical lifetimes of � 1–6 min and come in bursts of up to 30 min. The most spectacular burst inthis dataset, shown in the accompanying movie, lasts � 30 min and shows a wide variety of lineprofiles with both red and blue shifts � 180 km s�1. There appears to be no characteristic form orevolutionary pattern to the line profiles in either the individual events or series of events. There areabout twice as many blue shifts as red shifts.
1. Introduction
Explosive events are frequent, small-scale bursts of high-velocity plasma seenthroughout the quiet-Sun network (Brueckner and Bartoe, 1983; Dere, Bartoe,and Brueckner, 1984). They show up as highly broadened and/or shifted lineprofiles from ions with characteristic temperatures in the range 2�104 –5�105 K.Investigations of explosive events with the NRL High-Resolution Telescope andSpectrograph (HRTS) on several rocket flights and Spacelab 2 have shown that atany one time there are up to 30 000 events on the Sun, distributed mainly in ornear the network lanes (Dere, 1994). Typically, explosive events are characterisedby Doppler shifts � 100 km s�1, a lifetime � 60 s and size � 2000 km. Theseobservations, however, show a large variety of line profiles (Dere, Bartoe, andBrueckner, 1986, 1989; Cook et al., 1987). There are about equal numbers ofprofiles that show red, blue and simultaneous red and blue Doppler shifts. Whenthe red and blue shifts appear together they are sometimes offset by a coupleof arcseconds along the spectrometer slit. This was one of the features that ledDere et al. (1991) to speculate that the red and blue shifts indicate two oppositelydirected jet streams. Recent observations with the high-resolution ultraviolet (UV)spectrometer SUMER on board SOHO show that this is indeed the case (Inneset al., 1997). The profile shifts change from red to blue when scanning across acentral high intensity source and the spatial extent of the red and blue shifts movesoutwards from the source during the lifetime of the event.
There is considerable evidence from coordinated high-resolution UV and mag-netic field measurements that explosive events are related to magnetic reconnectionin the solar network (Dere, 1994). HRTS observations show that explosive eventsoccur in the network lanes at the boundaries of supergranulation cells and along
Solar Physics 175: 341–348, 1997. CD
ROMc 1997 Kluwer Academic Publishers. Printed in Belgium.

342 D. E. INNES ET AL.
the neutral line separating regions of opposite magnetic polarity (Dere et al., 1991;Porter and Dere, 1991). The magnetic network boundary contains many intense,low-lying flux tubes. If flux tubes of opposite polarity are forced together by, forexample, convective motions at their footpoints, the anti-parallel fields may recon-nect. Under conditions in the chromospheric network, where the plasma � is low,theory predicts a bi-directional jet emanating from the reconnection site (Petschek,1964; Priest, 1982).
The explosive event lifetime is, however, much shorter than the time scale forphotospheric flux cancellation which is of the order if a couple of hours (Livi,Wang, and Martin, 1985). Dere (1994) has suggested that explosive (reconnection)events occur in short bursts at discrete locations along the network boundary. Theavailable 4-min rocket flight and Spacelab 2 data could not provide a long-termstudy of explosive events. The aim of this paper is to show the network behaviour asseen in the Si IV emission line over a period of two hours. As predicted by Dere, wesee that explosive events occur at small discrete locations in sporadic bursts. Theaccompanying movie gives an impressive display of how the line profiles along a100 � 10500 strip of the network vary over a 30-min period.
These events may be related to the coronal high-velocity events that have beenobserved in lines with higher characteristic temperatures, 5� 105 –3� 106 K, andat larger velocities, 200–1200 km s�1(Kjeldseth-Moe and Cheng, 1990). So far,only a few of these coronal events have been detected and analysed, and it has notyet been possible to establish their relationship to the lower temperature networkevents.
2. Instrumentation
The observations described here were obtained with SUMER on 28 May 1996at Sun centre between 8 and 10 UT. A full description of the instrument and itsperformance is given in Wilhelm et al. (1995, 1997) and Lemaire et al. (1997).Briefly, SUMER is a UV telescope and spectrometer with a wavelength resolutionelement of 44 mA over the range 800–1610 A (in first order). Along the N–S directed entrance slit the spatial resolution is 100. In the E–W direction theresolution depends on the slit width and step size. For the observations shown herethe resolution is 100.
The data cover fifty wavelength pixels (2 A) centred on the Si IV 1393 A linealong the 100� 12000 entrance slit. During our observations the lower 1500 of the slitwere obscured and therefore appear dark in the images. Consecutive 10 s exposureswere made for a full two-hour period. The same position on the Sun was trackedusing the standard rotation compensation scheme outlined in Wilhelm et al. (1995).In effect, this resulted in a step of 0:7600 every � 4:5 min. We have checked thedata and can see no obvious changes in the intensities or line profiles associated

BURSTS OF EXPLOSIVE EVENTS IN THE SOLAR NETWORK 343
Figure 1. The position of the SUMER slit with respect to the chromospheric network seen in Si II1309 A before the sequence. The horizontal tick marks at 4200
; 6300; 8500, and 10000 indicate the
position of the central pixels used to construct the profiles in Figure 2.
with this movement. The data in the movie covers 190 frames equivalent to 30 minof evolution.
Before and after the two-hour sequence, a map (6000� 10500) of the area in
Si II 1309 A was made. The position of the slit with respect to the Si II 1309 Achromospheric network at the start is shown in Figure 1. This shows a typicalquiet-Sun region. In Si II the bright emission is clearly concentrated in networklanes that delineate dark cell-like structures. The SUMER slit crosses bright Si II
regions at the top and a quarter of the way up from the bottom. Nearer the slitcentre the slit seems to cross a fainter, not so well defined, boundary region. TheSi II network pattern is very similar at the end of the two hours. The supergranularcell structure and the positions of the bright and dark network lanes moved at thestandard rotation velocity.
344 D. E. INNES ET AL.
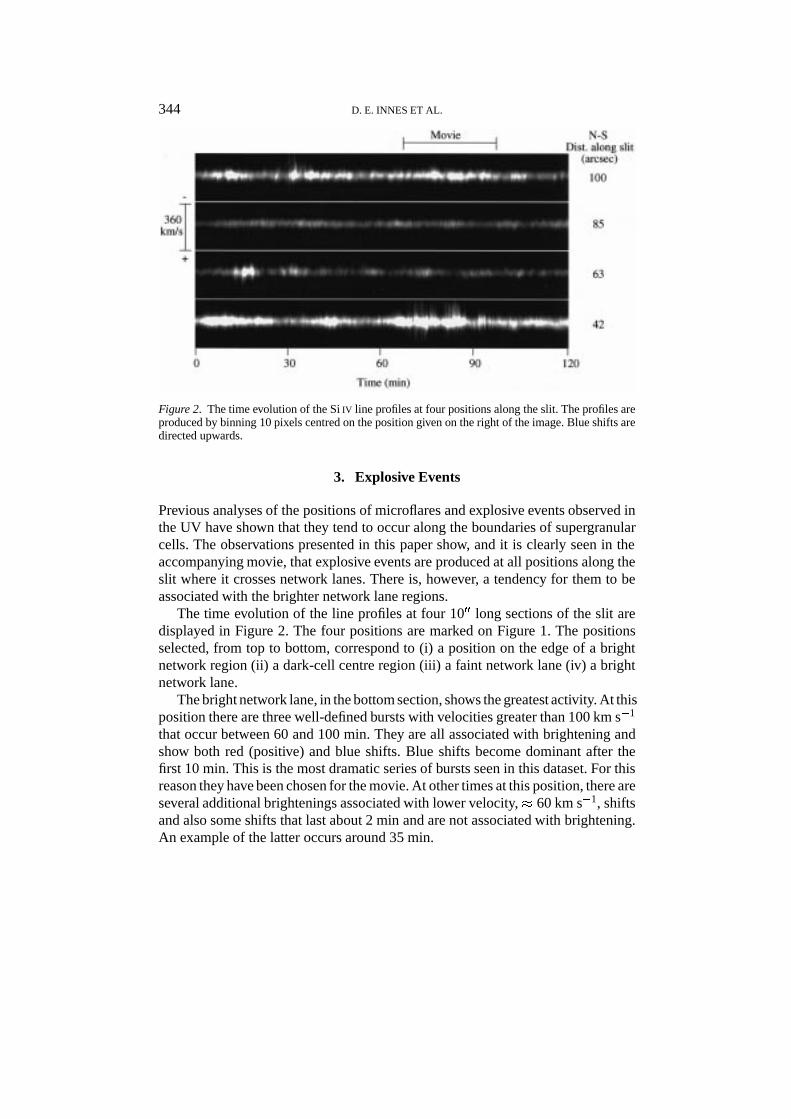
Figure 2. The time evolution of the Si IV line profiles at four positions along the slit. The profiles areproduced by binning 10 pixels centred on the position given on the right of the image. Blue shifts aredirected upwards.
3. Explosive Events
Previous analyses of the positions of microflares and explosive events observed inthe UV have shown that they tend to occur along the boundaries of supergranularcells. The observations presented in this paper show, and it is clearly seen in theaccompanying movie, that explosive events are produced at all positions along theslit where it crosses network lanes. There is, however, a tendency for them to beassociated with the brighter network lane regions.
The time evolution of the line profiles at four 1000 long sections of the slit aredisplayed in Figure 2. The four positions are marked on Figure 1. The positionsselected, from top to bottom, correspond to (i) a position on the edge of a brightnetwork region (ii) a dark-cell centre region (iii) a faint network lane (iv) a brightnetwork lane.
The bright network lane, in the bottom section, shows the greatest activity. At thisposition there are three well-defined bursts with velocities greater than 100 km s�1
that occur between 60 and 100 min. They are all associated with brightening andshow both red (positive) and blue shifts. Blue shifts become dominant after thefirst 10 min. This is the most dramatic series of bursts seen in this dataset. For thisreason they have been chosen for the movie. At other times at this position, there areseveral additional brightenings associated with lower velocity,� 60 km s�1, shiftsand also some shifts that last about 2 min and are not associated with brightening.An example of the latter occurs around 35 min.

BURSTS OF EXPLOSIVE EVENTS IN THE SOLAR NETWORK 345
The series along the top also shows several events accompanied by brightening.The event at � 30 min shows an interesting line profile development. The figureshows a very thin streak to positive velocities at the beginning of this event.Inspection of the individual spectra reveals that the event producing this red shiftlasts for 2 min and the high-velocity red shifts last for at most 40 s. The intensitythen declines. The subsequent brightening and blue shift look like a separate event.
The fainter Si II network lane region is also fainter and less active in Si IV.Along this section, there are several events lasting 5–10 min each. The first ofthese produces the strongest red shifts in the dataset. All the other events arecomparatively faint and not necessarily associated with brightening. The timeseries along the dark-cell centre shows considerably less variation than at the otherpositions. The intensity variations are less than a factor 2.5 and all the shifts areless than 60 km s�1.
In general, both widely symmetric and strongly asymmetric profiles are recor-ded. The profiles and the intensities change significantly between one frame andthe next; however over 3 or 4 frames the changes usually show a definite trend. Forexample, the intensity increases or decreases steadily and shifts seen in one framecan also be seen in neighbouring frames.
4. The Movie
The movie on the CD-ROM shows a half-hour sequence of Si IV data. The times areindicated in Figure 2. One frame from the movie is shown in Figure 3. On the left,the image of the Sun in He II 304 A taken on 29 May 1995 by EIT (Delaboudiniereet al., 1995) shows that the Sun was very quiet at this time. The central sectiondisplays the spectrum along the slit after each 10 s exposure. This image is the rawimage to which the standard on-board flat-field has been applied. No correctionshave been made to rectify the geometric distortion. The velocity scale is measuredrelative to the centroid of the line profile summed along the slit at a time whenno explosive event could be seen along the slit. This scale is only accurate to20 km s�1. Red shifts (positive velocities) are on the right and blue shifts are onthe left. The white tick marks along the slit direction indicate the region of thespectrum that has been summed together to produce the profile on the right. Thisprofile shows the average number of counts in the marked section of the image asa function of wavelength. Wavelength increases to the right. The dashed line is theaverage profile along the slit at a time when no explosive events could be seen.
The frame displayed in Figure 3 is chosen because it was one of the mostspectacular in the movie. It shows a very strong event in the bright network lane,three closely spaced in the faint network lane and a fifth event on the edge of thebright network region at the top of the slit. Most frames show only one or two events.

346D
.E.IN
NE
SE
TA
L.
Figure 3. A frame from the movie showing, from left to right, the EIT He II 304 A image taken 28 May 1996 with the position of the SUMER slit marked,the Si IV spectra along the slit at 460 s from the beginning of the movie, and the average number of counts across the line for the section of the slit indicatedin the central section. (EIT image by courtesy of J.B. Gurman and the EIT consortium).

BURSTS OF EXPLOSIVE EVENTS IN THE SOLAR NETWORK 347
5. Conclusion
It seems as though explosive events occur in bursts as predicted by Dere (1994).The individual events last 1–6 min and can occur several times. The brightestregions show the most activity. The highest shifts come from the brightest parts.Brightenings do not always produce shifts.
If one looks at the profiles in detail it can be seen that each event has a uniqueevolution. The number of blue shifts outnumber the red shifts by a factor of roughly2. This predominance for blue shifts was not seen in the Spacelab data (Cook etal., 1987) however that was a large-area Sun survey. If the explosive events arebi-directional jets (Innes et al., 1997), it is not surprising that at Sun-centre blueshifts are seen significantly more often than red shifts. If the jet source is about 1000km above the photosphere (Dere, 1994), any jet stream directed towards the Sunwill be stopped by the high-density chromospheric/photospheric material whereasjets directed outwards from the Sun can stream into the corona. The blue stream istherefore expected to be longer and blue shifts will be more plentiful.
These observations lend support to the furnace model, proposed by Axford andMcKenzie (1992), in which it is postulated that frequent small-scale reconnectionevents in the network are the source of wave energy that drives the high speed solarwind.
Acknowledgements
We would like to thank Udo Schuhle and Detlef Gigas for their assistance with theSUMER operations at Goddard. The SUMER project is financially supported byDARA, CNES, NASA and the ESA PRODEX programme (Swiss contribution).SUMER is part of SOHO, the Solar and Heliospheric Observatory, of ESA andNASA.
Appendix. CD-ROM Movie Caption
Time evolution of Si IV 1393 A profiles taken with SUMER at Sun centre on28 May 1996 around 9 UT. The spectra, taken with an exposure time of 10 s, showa 2 A wide spectral window centred on 1393 A, along the 100
� 12000 N–S directedentrance slit. During the observations the Sun was tracked at a rate given by thestandard rotation compensation described in Wilhelm et al. (1995). On the left isthe image of the Sun in He II 304 A taken with EIT showing the position of theSUMER slit. On the right is the average line profile along the section of the slitmarked with white tick marks on the vertical axis of the box around the SUMERspectra.

348 D. E. INNES ET AL.
References
Axford, W. I. and McKenzie, J. F.: 1992, in E. Marsch and R. Schwenn (eds), Solar Wind Seven,Pergamon Press, London, p. 1.
Brueckner, G. E. and Bartoe, J.-D. F.: 1983, Astrophys. J. 272, 329.Cook, J. W. et al.: 1987, in J. L. Linsky and R. E. Stencel (eds), Cool Stars, Stellar Systems and the
Sun, Lecture Notes in Physics 291, 150.Delaboudiniere, J.-P. et al.: 1995, Solar Phys. 162, 291.Dere, K. P.: 1994, Adv. Space Res. 14, 13.Dere, K. P., Bartoe, J.-D. F., and Brueckner, G. E.: 1984, Astrophys. J. 281, 870.Dere, K. P., Bartoe, J.-D. F., and Brueckner, G. E.: 1986, Astrophys. J. 310, 456.Dere, K. P., Bartoe, J.-D. F., and Brueckner, G. E.: 1989, Solar Phys. 123, 41.Dere, K. P., Bartoe, J.-D. F., Brueckner, G. E., Ewing, J., and Lund, P.: 1991, J. Geophys. Res. 96,
9399.Innes, D. E., Inhester, B., Axford, W. I., and Wilhelm, K.: 1997, Nature 386, 811.Kjeldseth-Moe, O. and Cheng, C. C.: 1990, in P. Maltby and E. Leer (eds), Proceedings of the Mini-
Workshop on Physical Processes in the Solar Transition Region and Corona, University of Oslo,Oslo, p. 37.
Lemaire, P. et al.: 1997, Solar Phys. 170, 105.Livi, S. H. B., Wang, J., and Martin, S. F.: 1985, Australian J. Phys., 38, 855.Petschek, H. E.: 1964, AAS-NASA Symp. on Solar Flares, NASA SP-50, 425.Priest, E. R.: 1982, Solar Magnetohydrodynamics, D. Reidel Publ. Co., Dordrecht, Holland.Porter, J. G. and Dere, K. P.: 1991, Astrophys. J. 370, 775.Wilhelm, K. et al.: 1995, Solar Phys. 162, 189.Wilhelm, K. et al.: 1997, Solar Phys. 170, 75.