bus1mis management information systems semester 1, 2012 excel: basic skills week 2 lecture 2
TRANSCRIPT
BUS1MIS Management Information Systems
Semester 1, 2012
Excel: Basic Skills
Week 2 Lecture 2
Spreadsheets
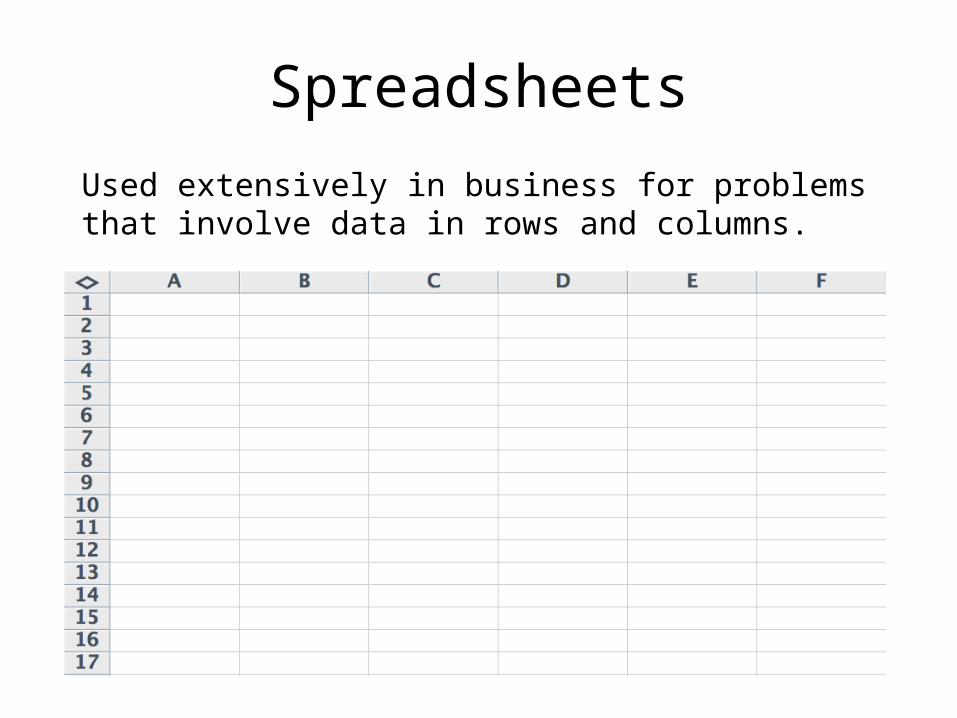
Used extensively in business for problems that involve data in rows and columns.

Spreadsheets
An intersection of a row and column is known as a Cell.
Each cell is referred to by its column followed by its row.

SpreadsheetsCells can contain:
• Labels• Values• References to other cells• Formulae• References to other cells AND formulae
SpreadsheetsSpreadsheets can be used by business in many ways.
For example:
• Planning and/or maintaining a budget.• Performing “what-if?” analysis• Displaying complex data in a graphical form
Household Budget
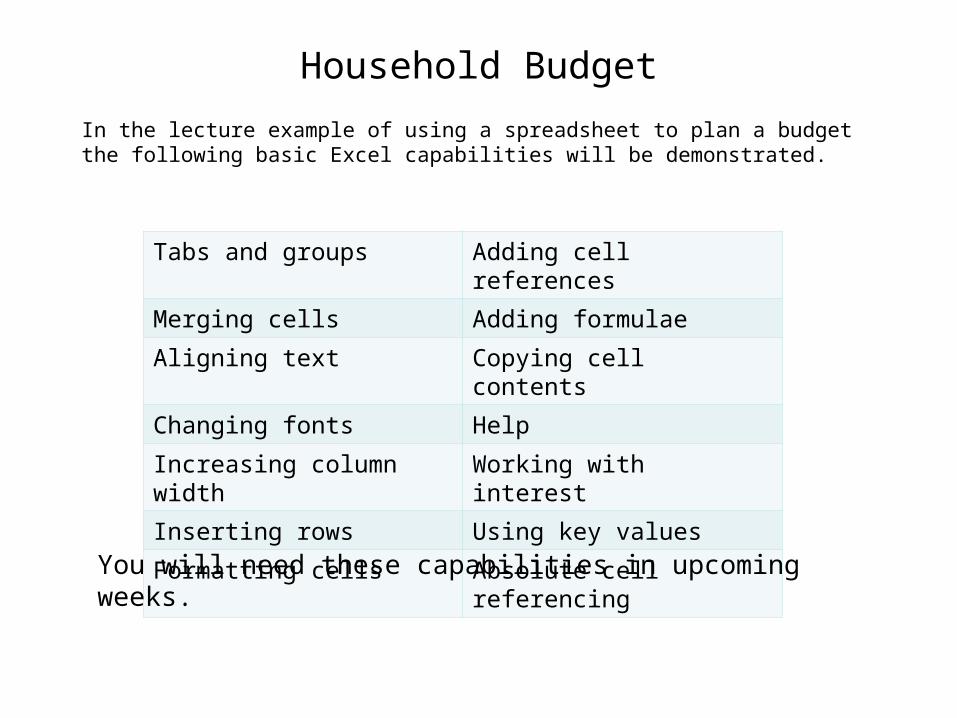
In the lecture example of using a spreadsheet to plan a budget the following basic Excel capabilities will be demonstrated.
Tabs and groups Adding cell references
Merging cells Adding formulae
Aligning text Copying cell contents
Changing fonts Help
Increasing column width Working with interest
Inserting rows Using key values
Formatting cells Absolute cell referencing
You will need these capabilities in upcoming weeks.


What-If? Analysis
Spreadsheets are useful for planning whether an intended competitive advantage is likely to be a good investment.
A well-designed, flexible spreadsheet allows different business scenarios to be modeled.
The lecture example will display how the use of key value tables in a spreadsheet allows “what-if?’ scenarios to be explored.
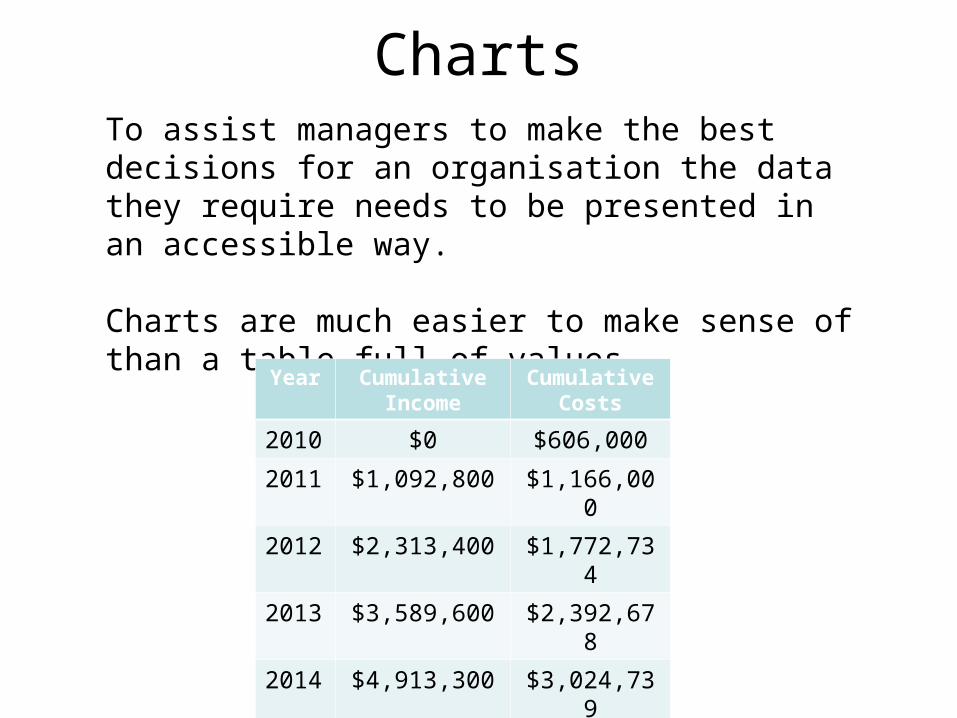
ChartsTo assist managers to make the best decisions for an organisation the data they require needs to be presented in an accessible way.
Charts are much easier to make sense of than a table full of values.
Year Cumulative Income
Cumulative Costs
2010 $0 $606,000
2011 $1,092,800 $1,166,000
2012 $2,313,400 $1,772,734
2013 $3,589,600 $2,392,678
2014 $4,913,300 $3,024,739
2015 $6,268,900 $3,663,721
2016 $7,624,500 $4,304,364

Charts
The lecture example will demonstrate the simple but extensive chart making facilities that Excel has.

Specifying Ranges
C1:E1
A1:A6
C4:E9
A9
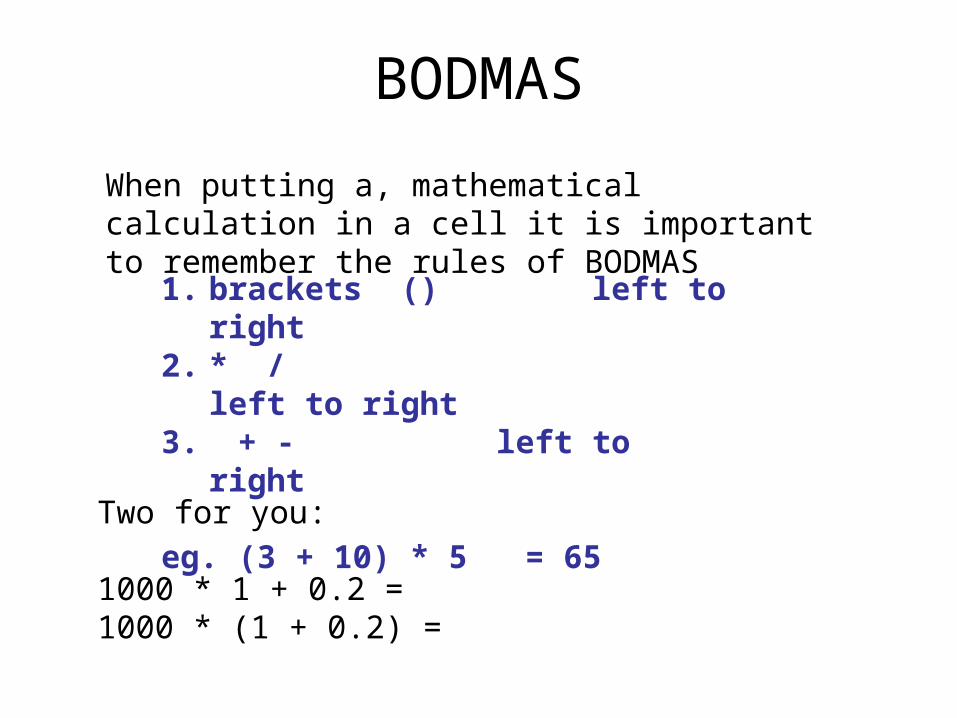
BODMAS
When putting a, mathematical calculation in a cell it is important to remember the rules of BODMAS
1. brackets () left to right2. * / left to right3. + - left to right eg. (3 + 10) * 5 = 65
Two for you:
1000 * 1 + 0.2 =1000 * (1 + 0.2) =