business & climate change still trying …
DESCRIPTION
Business & Climate Change Still trying …. Kevin Leahy - Managing Director, Environmental & Energy Policy, Duke Energy OSU CHANGINGCLIMATE Webinar Jan. 31, 2012. Disclaimer. Speaking for myself – not Duke Energy Numbers are, in many cases, approximations. Some data is old. - PowerPoint PPT PresentationTRANSCRIPT
1
Business & Climate Change
Still trying …
Kevin Leahy - Managing Director, Environmental & Energy Policy, Duke Energy
OSU CHANGINGCLIMATE WebinarJan. 31, 2012
2
Disclaimer
• Speaking for myself – not Duke Energy• Numbers are, in many cases, approximations.
Some data is old.• Translating from other’s work to put forward
the generalized views.• Before citing – go to original sources.
3
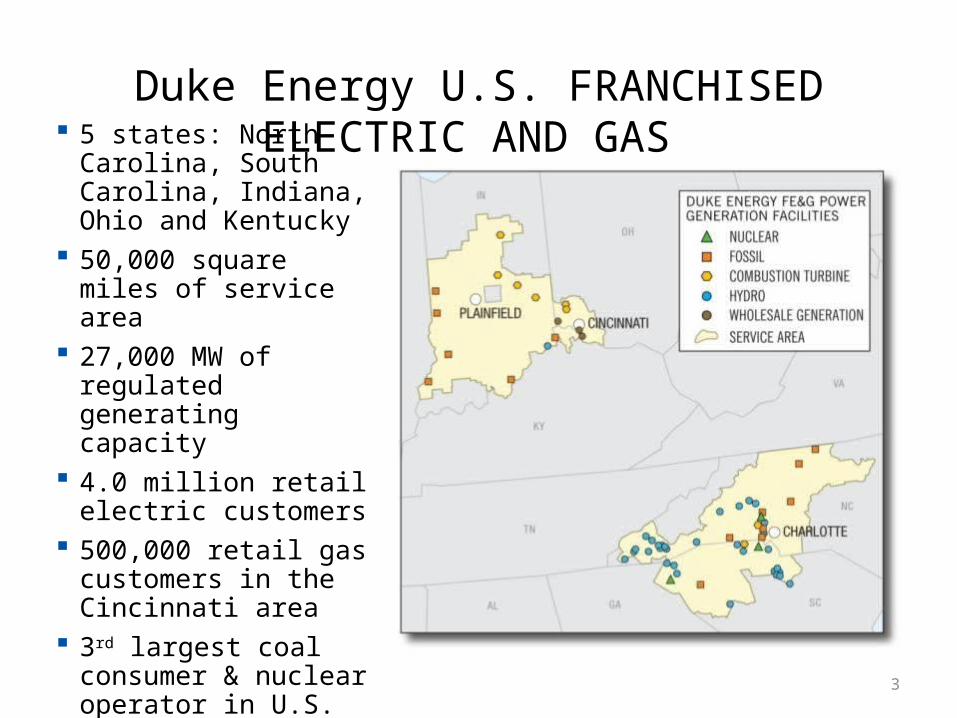
Duke Energy U.S. FRANCHISED ELECTRIC AND GAS
5 states: North Carolina, South Carolina, Indiana, Ohio and Kentucky
50,000 square miles of service area
27,000 MW of regulated generating capacity
4.0 million retail electric customers
500,000 retail gas customers in the Cincinnati area
3rd largest coal consumer & nuclear operator in U.S.
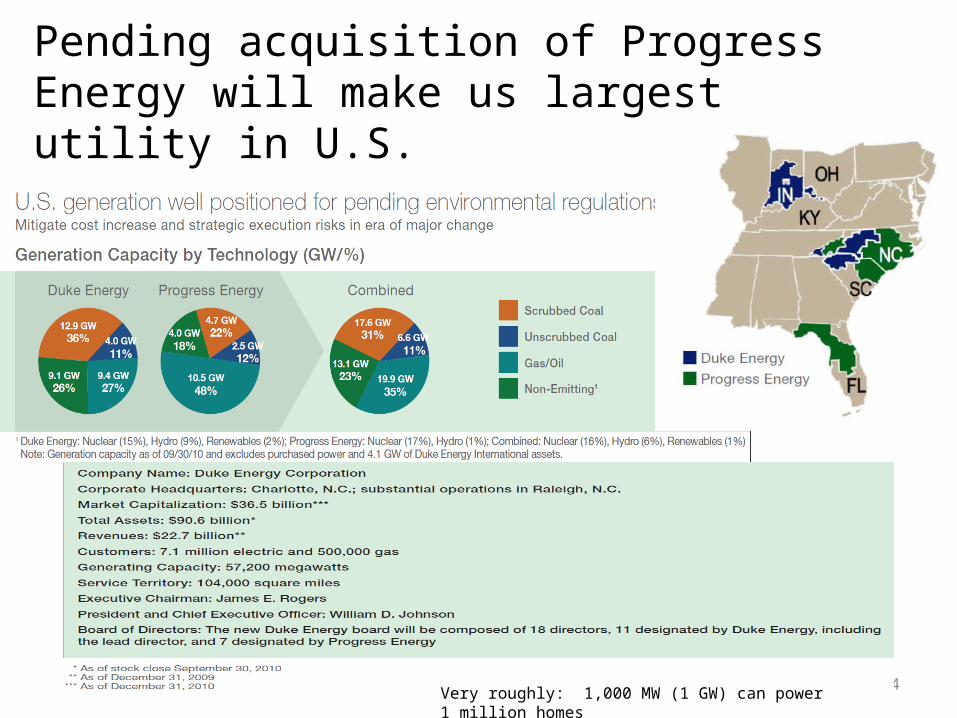
Pending acquisition of Progress Energy will make us largest utility in U.S.
4Very roughly: 1,000 MW (1 GW) can power 1 million homes
5
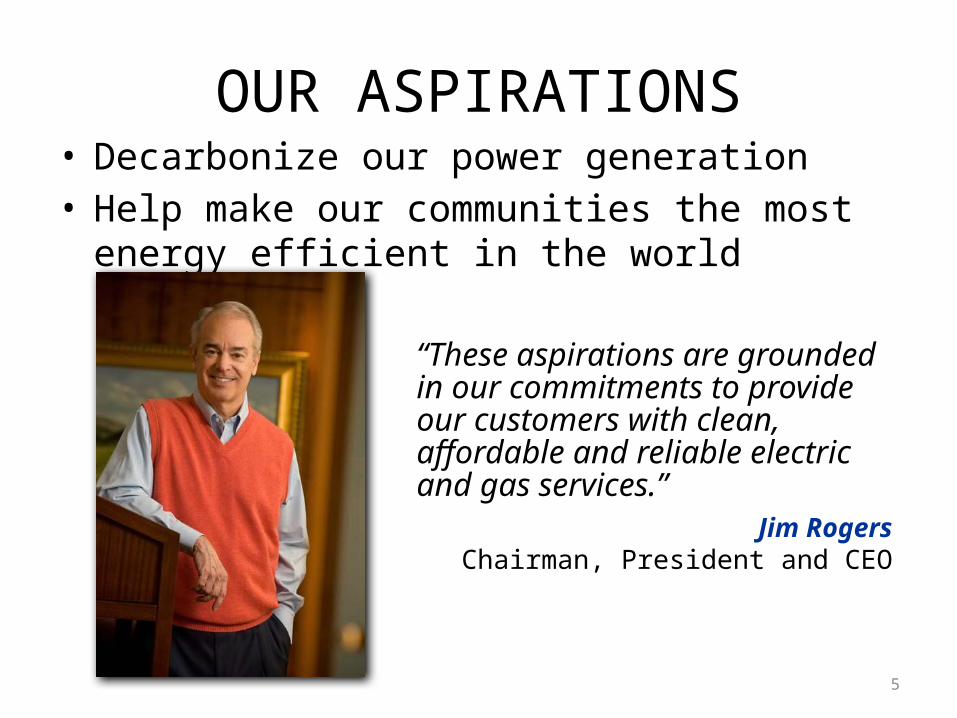
OUR ASPIRATIONS• Decarbonize our power generation• Help make our communities the most energy
efficient in the world
“These aspirations are grounded in our commitments to provide our customers with clean, affordable and reliable electric and gas services.”
Jim RogersChairman, President and CEO
6
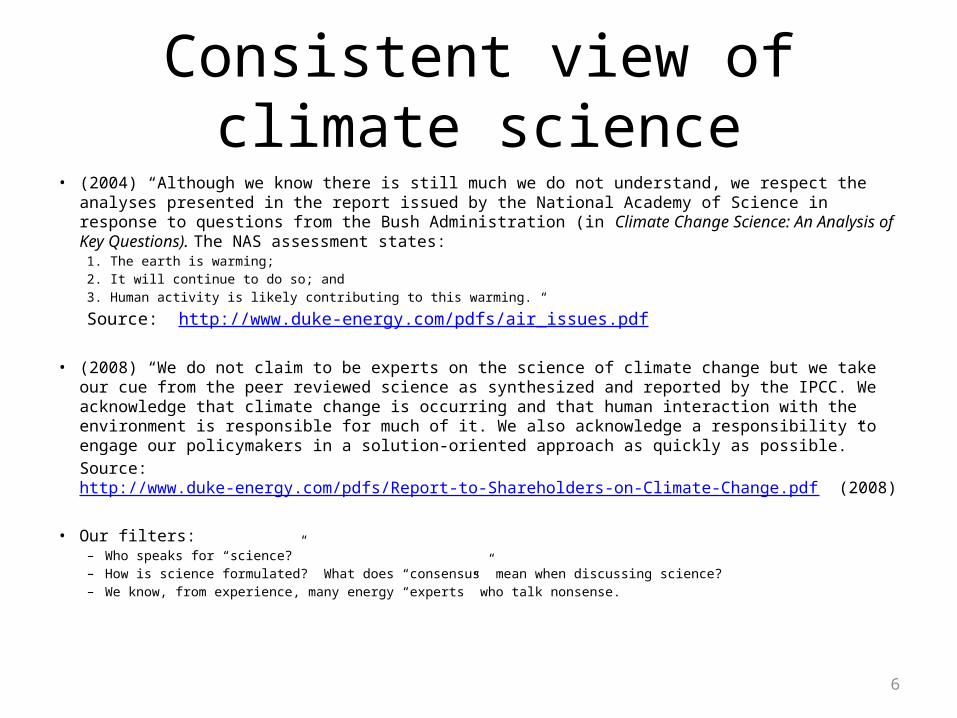
Consistent view of climate science• (2004) “Although we know there is still much we do not understand, we respect the analyses
presented in the report issued by the National Academy of Science in response to questions from the Bush Administration (in Climate Change Science: An Analysis of Key Questions). The NAS assessment states:
1. The earth is warming; 2. It will continue to do so; and 3. Human activity is likely contributing to this warming. “
Source: http://www.duke-energy.com/pdfs/air_issues.pdf
• (2008) “We do not claim to be experts on the science of climate change but we take our cue from the peer reviewed science as synthesized and reported by the IPCC. We acknowledge that climate change is occurring and that human interaction with the environment is responsible for much of it. We also acknowledge a responsibility to engage our policymakers in a solution-oriented approach as quickly as possible.”Source: http://www.duke-energy.com/pdfs/Report-to-Shareholders-on-Climate-Change.pdf (2008)
• Our filters: – Who speaks for “science?”– How is science formulated? What does “consensus” mean when discussing science?– We know, from experience, many energy “experts” who talk nonsense.
7
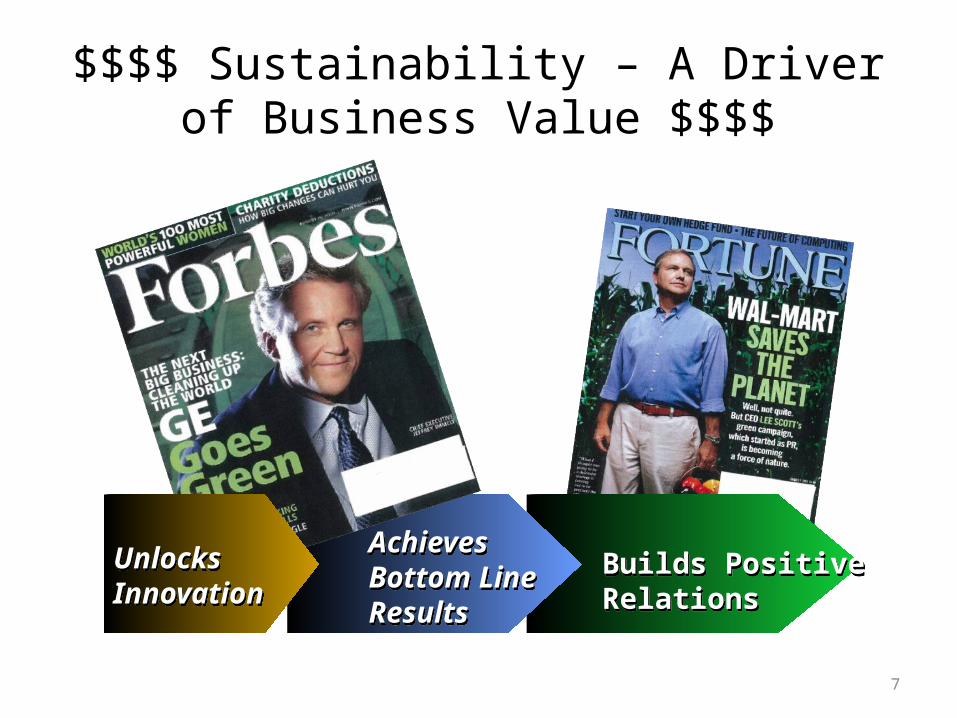
$$$$ Sustainability – A Driver of Business Value $$$$
Unlocks InnovationUnlocks Innovation
Achieves Bottom Line Results
Achieves Bottom Line Results
Builds PositiveRelationsBuilds PositiveRelations
8
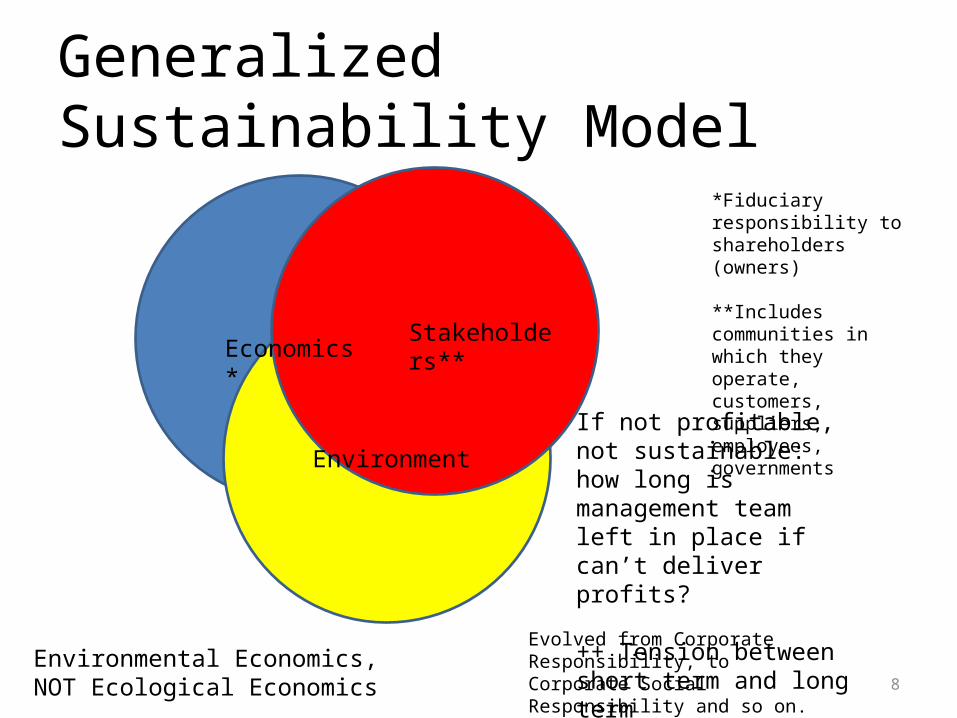
Generalized Sustainability Model
*Fiduciary responsibility to shareholders (owners)
**Includes communities in which they operate, customers, suppliers, employees, governments
Evolved from Corporate Responsibility, to Corporate Social Responsibility and so on.
Stakeholders**
If not profitable, not sustainable: how long is management team left in place if can’t deliver profits?
++ Tension between short term and long term
Environment
Economics*
Environmental Economics, NOT Ecological Economics
9
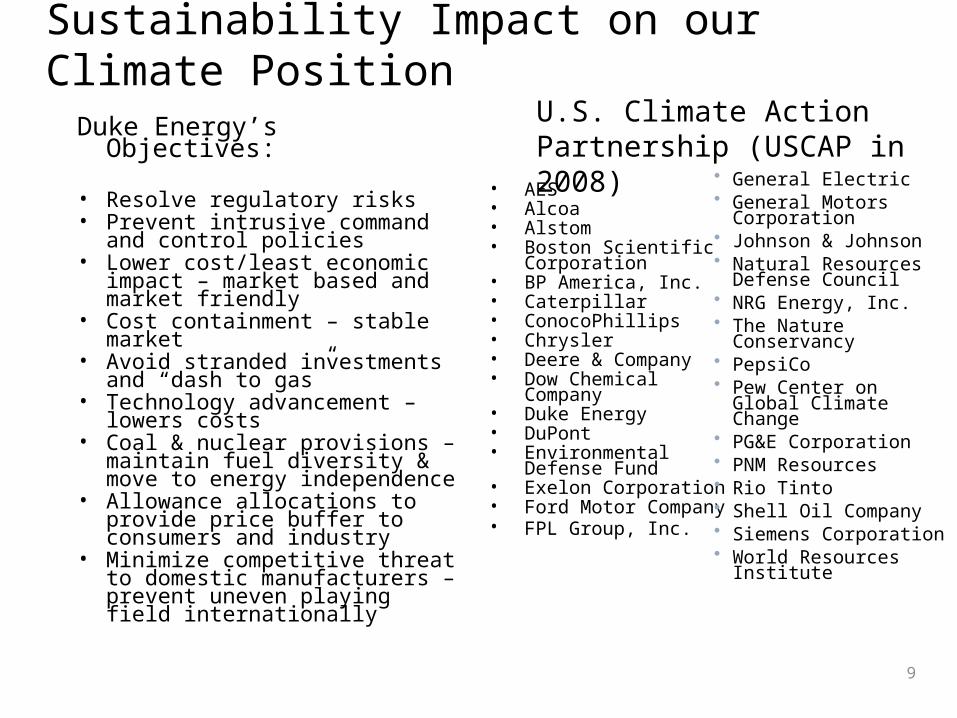
Sustainability Impact on our Climate Position
Duke Energy’s Objectives:
• Resolve regulatory risks• Prevent intrusive command and
control policies• Lower cost/least economic
impact – market based and market friendly
• Cost containment – stable market• Avoid stranded investments and
“dash to gas”• Technology advancement –
lowers costs• Coal & nuclear provisions –
maintain fuel diversity & move to energy independence
• Allowance allocations to provide price buffer to consumers and industry
• Minimize competitive threat to domestic manufacturers – prevent uneven playing field internationally
• AES• Alcoa • Alstom• Boston Scientific
Corporation • BP America, Inc. • Caterpillar • ConocoPhillips • Chrysler • Deere & Company • Dow Chemical Company • Duke Energy • DuPont • Environmental Defense
Fund • Exelon Corporation • Ford Motor Company • FPL Group, Inc.
• General Electric • General Motors Corporation • Johnson & Johnson • Natural Resources Defense
Council • NRG Energy, Inc. • The Nature Conservancy • PepsiCo • Pew Center on Global
Climate Change • PG&E Corporation • PNM Resources • Rio Tinto • Shell Oil Company • Siemens Corporation • World Resources Institute
U.S. Climate Action Partnership (USCAP in 2008)
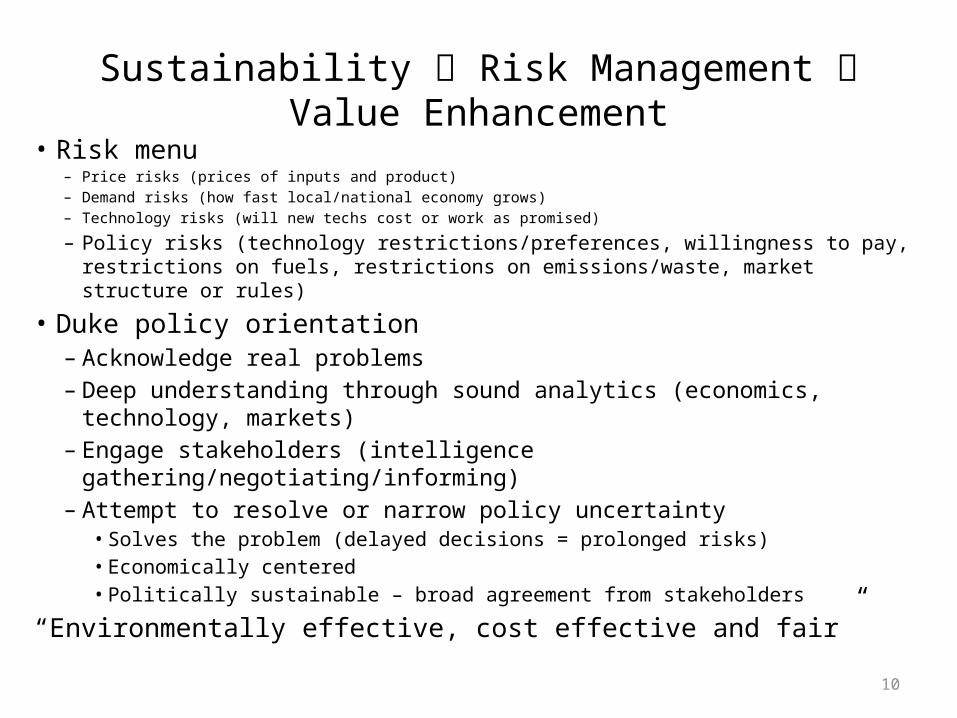
Sustainability Risk Management Value Enhancement
• Risk menu– Price risks (prices of inputs and product)– Demand risks (how fast local/national economy grows)– Technology risks (will new techs cost or work as promised)
– Policy risks (technology restrictions/preferences, willingness to pay, restrictions on fuels, restrictions on emissions/waste, market structure or rules)
• Duke policy orientation– Acknowledge real problems– Deep understanding through sound analytics (economics, technology,
markets)– Engage stakeholders (intelligence gathering/negotiating/informing)– Attempt to resolve or narrow policy uncertainty
• Solves the problem (delayed decisions = prolonged risks)• Economically centered• Politically sustainable – broad agreement from stakeholders
“Environmentally effective, cost effective and fair”10
11
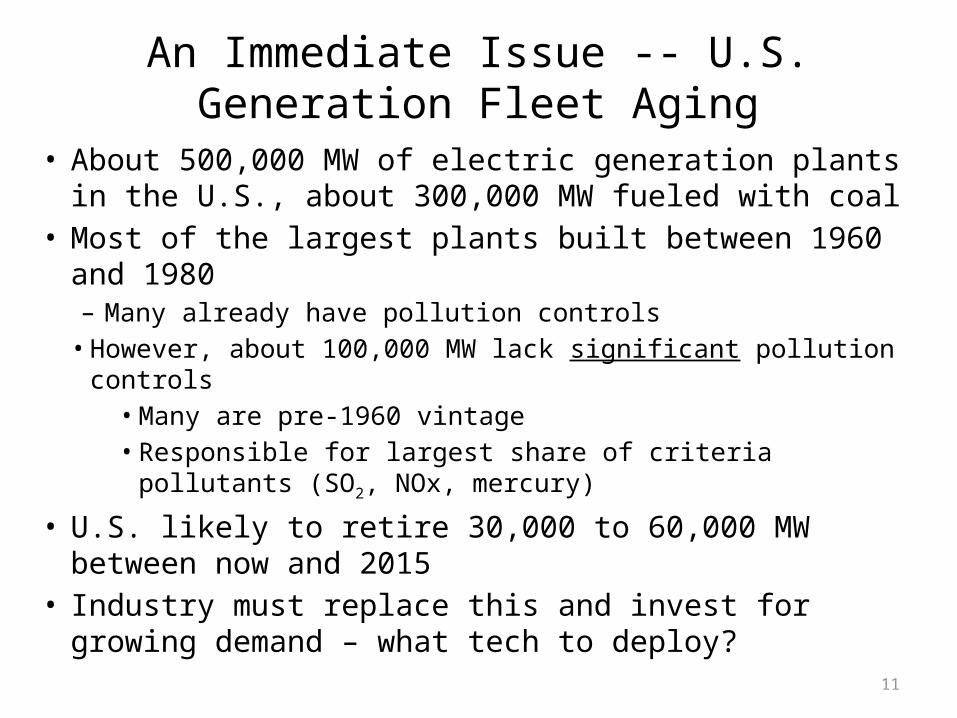
• About 500,000 MW of electric generation plants in the U.S., about 300,000 MW fueled with coal
• Most of the largest plants built between 1960 and 1980– Many already have pollution controls• However, about 100,000 MW lack significant pollution controls
• Many are pre-1960 vintage• Responsible for largest share of criteria pollutants (SO2, NOx,
mercury)
• U.S. likely to retire 30,000 to 60,000 MW between now and 2015
• Industry must replace this and invest for growing demand – what tech to deploy?
An Immediate Issue -- U.S. Generation Fleet Aging
12
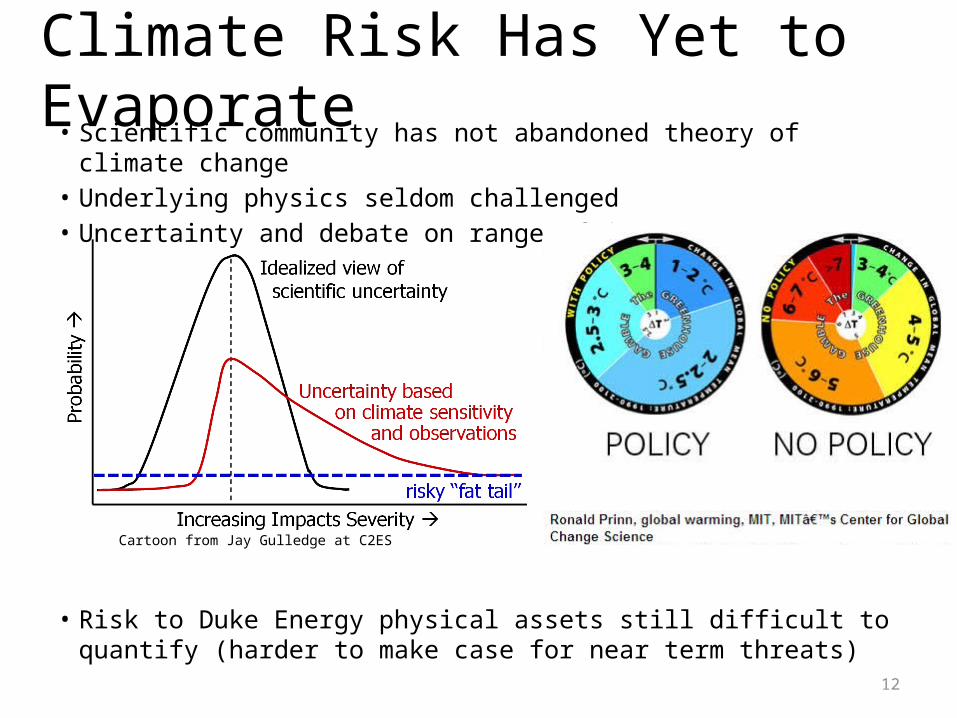
Climate Risk Has Yet to Evaporate• Scientific community has not abandoned theory of climate change• Underlying physics seldom challenged• Uncertainty and debate on range of impacts
• Risk to Duke Energy physical assets still difficult to quantify (harder to make case for near term threats)
Cartoon from Jay Gulledge at C2ES
13
Policy and Financial Risk Remain• As long as science unwavering and weather doesn’t cooperate, issue
unlikely to go away
• Taboo on climate policy talk does not eliminate firms’ economic risk
• Future GHG restrictions within vague timeframe are highly plausible
• Market based policies lowest economic cost & most efficient – likely default (after everything else tried)– Buzz about carbon tax to address budget problems
• Ongoing source of significant financial risks in large, long lived capital investments
14
Impact of Policy Uncertainty – delayed or sub-optimal investment
• If possible outcomes lead to highly divergent price paths – value of “delay option” (delaying the investment) increases – firms hold back until uncertainty resolved
• Macroeconomic example: High volatility in oil prices (not absolute price level) causes increase in value of delay option for investments, triggering economic slowdowns
(see Oil Price Uncertainty by Elder & Serletis, Journal of Money, Credit and Banking -- sep 2010)
• Uncertainty likely to drive electric sector technology investment choices. This will increase future electricity price volatility, increasing risk exposure for wider economy– Impact of price volatility on economy was not analyzed during the 08-09
debates
15
Electric Utilities’ Challenge• Many still incorporate CO2 price in investment plans
– Large uncertainty around when, how much and how fast prices will change• Difficult to explain – why not higher or lower, sooner or later?
– Negative hit to coal – few new plant announcements– Fuzziness of “when and how much” increases difficulty for many in
explaining aggressive investment in advanced techs (nuclear, CCS or renewables) • challenge for regulators and investors [aggressive = 15+ new nuclear units
for the U.S. by 2025]
• Faced with this uncertainty, option to delay investment increases in value – will defer investment as long as possible
• If must add capacity will minimize capital at risk and opt for lowest Cap-ex – Combined Cycle Natural Gas– If shale gas solves past problems of price volatility, good bet! If not …
16
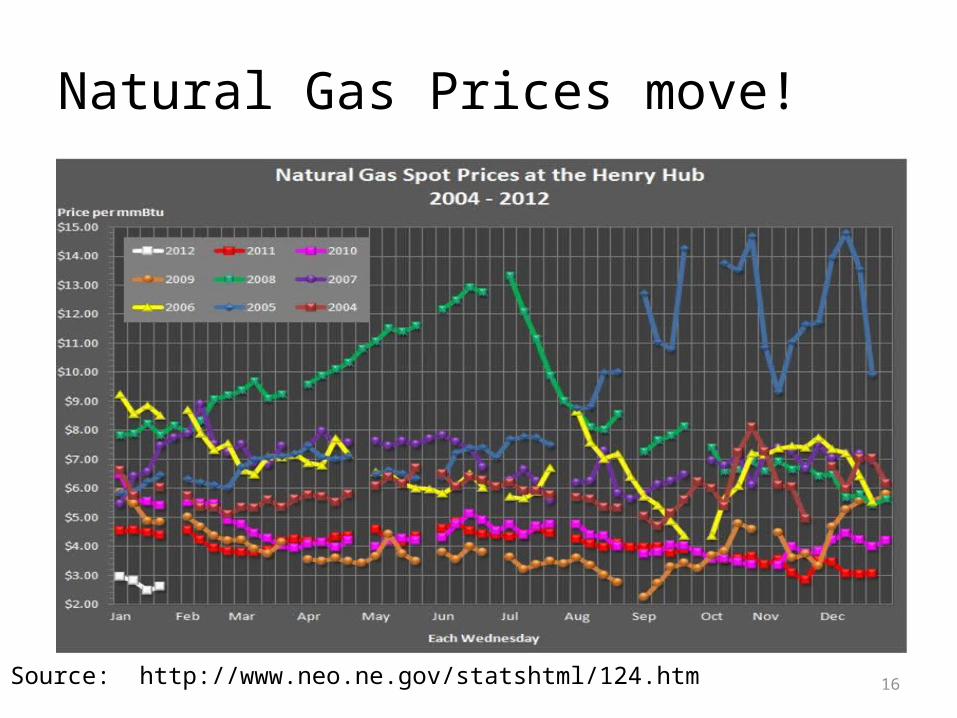
Natural Gas Prices move!
Source: http://www.neo.ne.gov/statshtml/124.htm
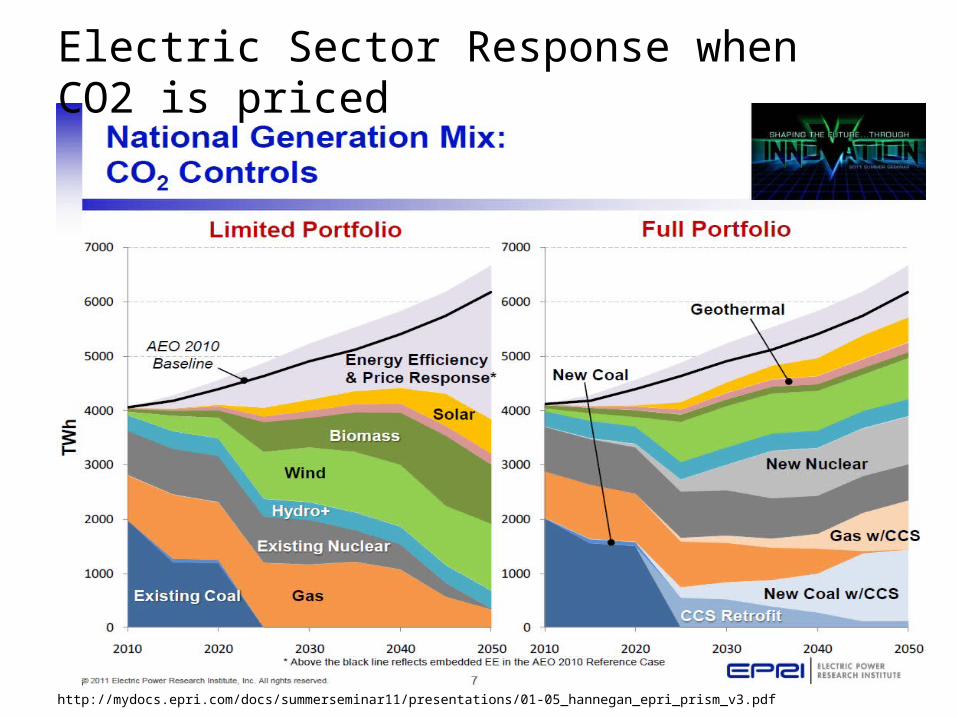
http://mydocs.epri.com/docs/summerseminar11/presentations/01-05_hannegan_epri_prism_v3.pdf
Electric Sector Response when CO2 is priced
18
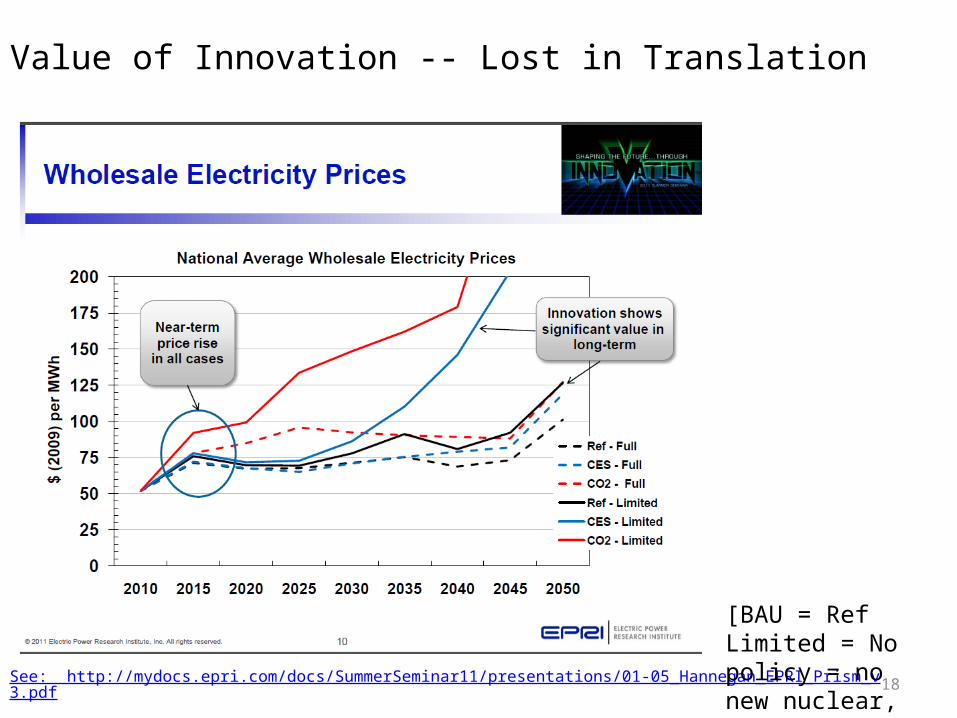
Value of Innovation -- Lost in Translation
See: http://mydocs.epri.com/docs/SummerSeminar11/presentations/01-05_Hannegan_EPRI_Prism_v3.pdf
Technology Innovation paired with climate policy can cause electric prices to match those of the Business as Usual (the “no policy” case)
[BAU = Ref Limited = No policy = no new nuclear, no advanced coal, few renewables]
Losing opportunity for Innovation through deployment
• Projects to advance technology being sidelined– Few able to step out and take multi-billion dollar
project risks on nascent technologies
• Rebirth of domestic manufacturing of major nuclear components being deferred or cancelled (some components last made in U.S. in the 1980s)
• Innovation through doing (experience curves) to drive down cost not happening in U.S. – lab based projects insufficient
20
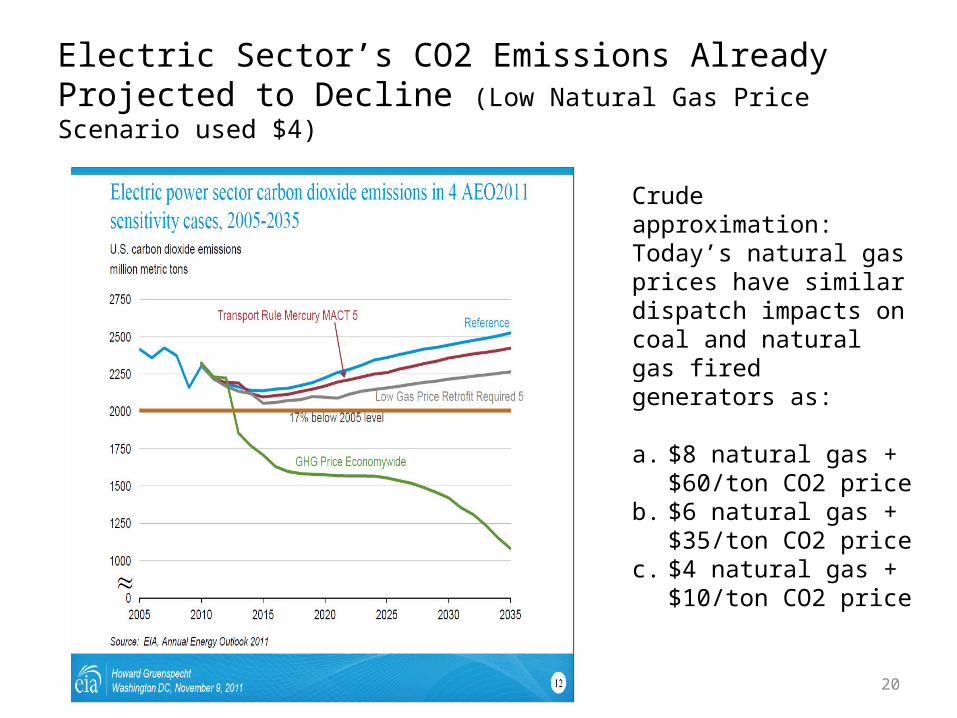
Electric Sector’s CO2 Emissions Already Projected to Decline (Low Natural Gas Price Scenario used $4)
Crude approximation:Today’s natural gas prices have similar dispatch impacts on coal and natural gas fired generators as:
a. $8 natural gas + $60/ton CO2 price
b. $6 natural gas + $35/ton CO2 price
c. $4 natural gas + $10/ton CO2 price
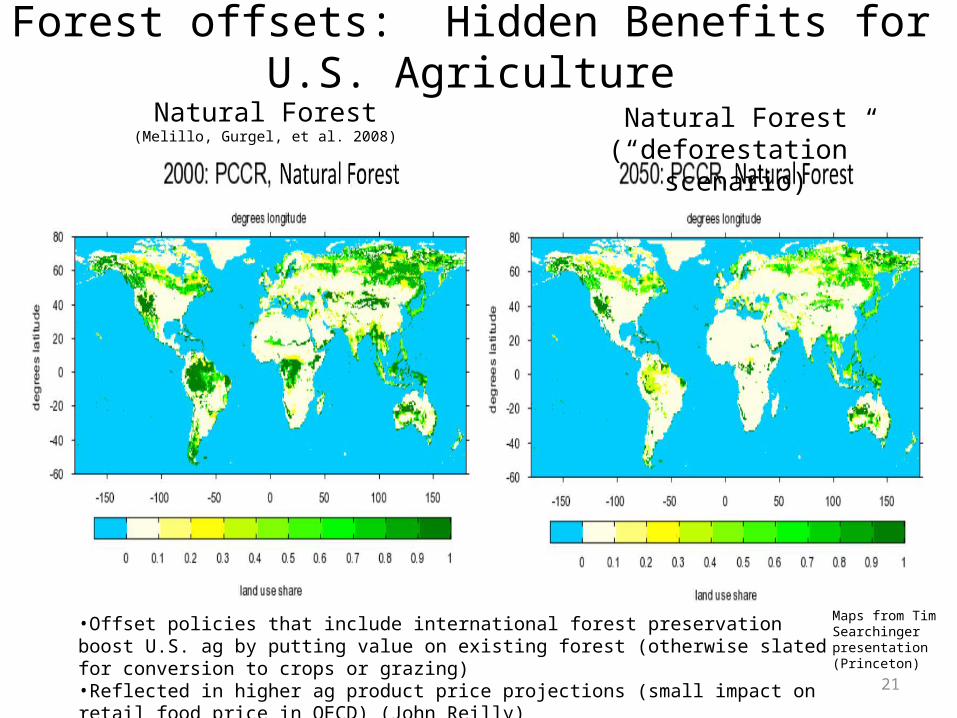
Forest offsets: Hidden Benefits for U.S. Agriculture
21
•Offset policies that include international forest preservation boost U.S. ag by putting value on existing forest (otherwise slated for conversion to crops or grazing)•Reflected in higher ag product price projections (small impact on retail food price in OECD) (John Reilly)
Natural Forest (“deforestation” scenario)
Natural Forest(Melillo, Gurgel, et al. 2008)
Maps from Tim Searchinger presentation (Princeton)
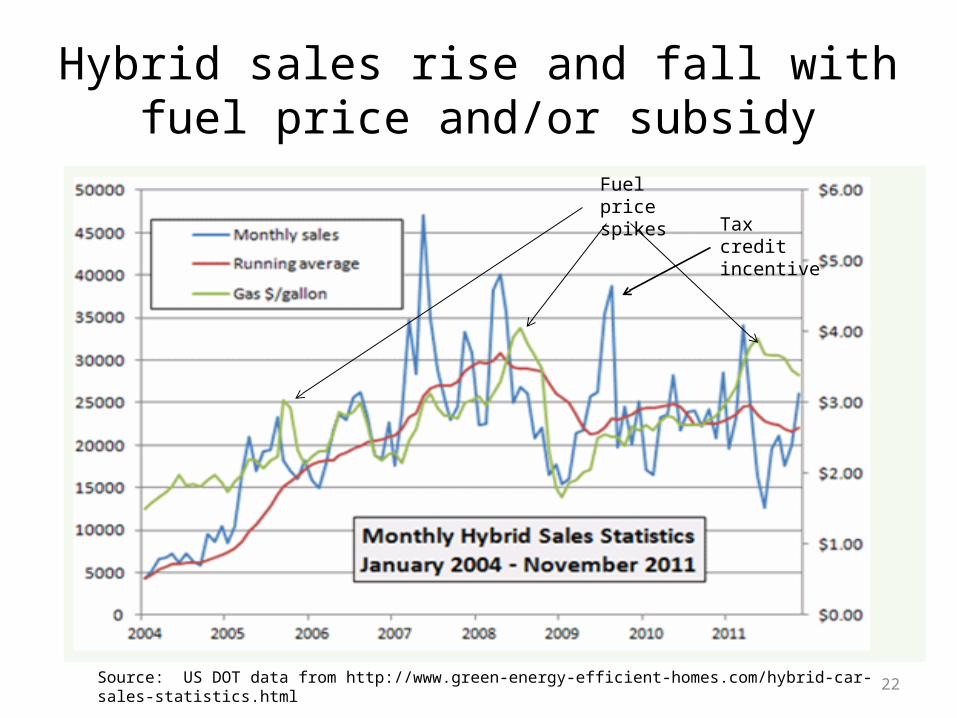
Hybrid sales rise and fall with fuel price and/or subsidy
22Source: US DOT data from http://www.green-energy-efficient-homes.com/hybrid-car-sales-statistics.html
Tax credit incentive
Fuel price spikes
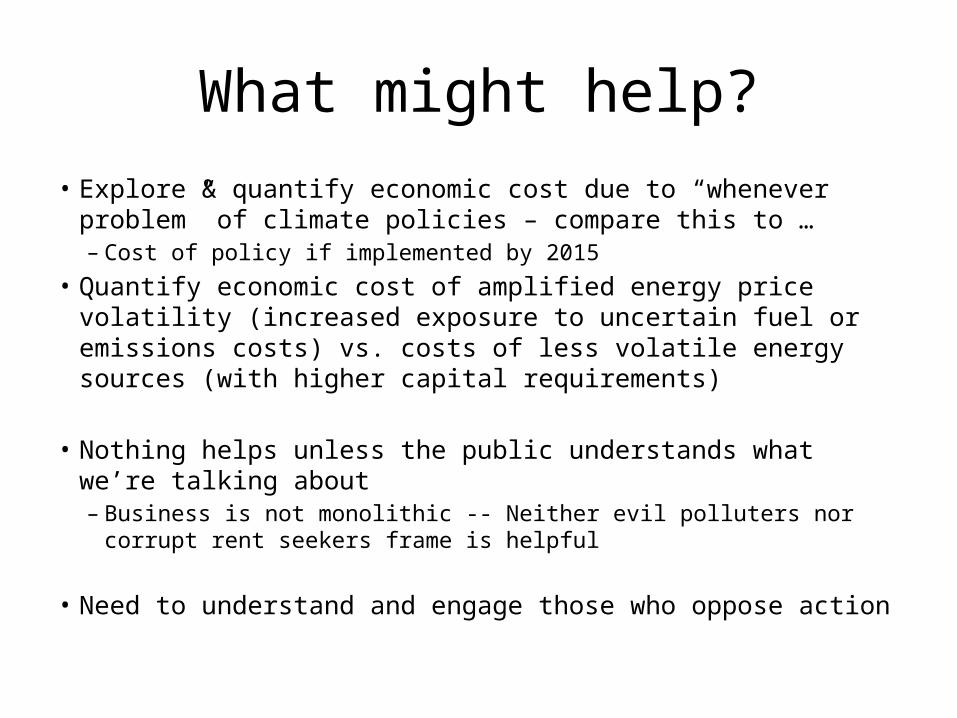
What might help?• Explore & quantify economic cost due to “whenever problem” of
climate policies – compare this to … – Cost of policy if implemented by 2015
• Quantify economic cost of amplified energy price volatility (increased exposure to uncertain fuel or emissions costs) vs. costs of less volatile energy sources (with higher capital requirements)
• Nothing helps unless the public understands what we’re talking about– Business is not monolithic -- Neither evil polluters nor corrupt rent
seekers frame is helpful
• Need to understand and engage those who oppose action
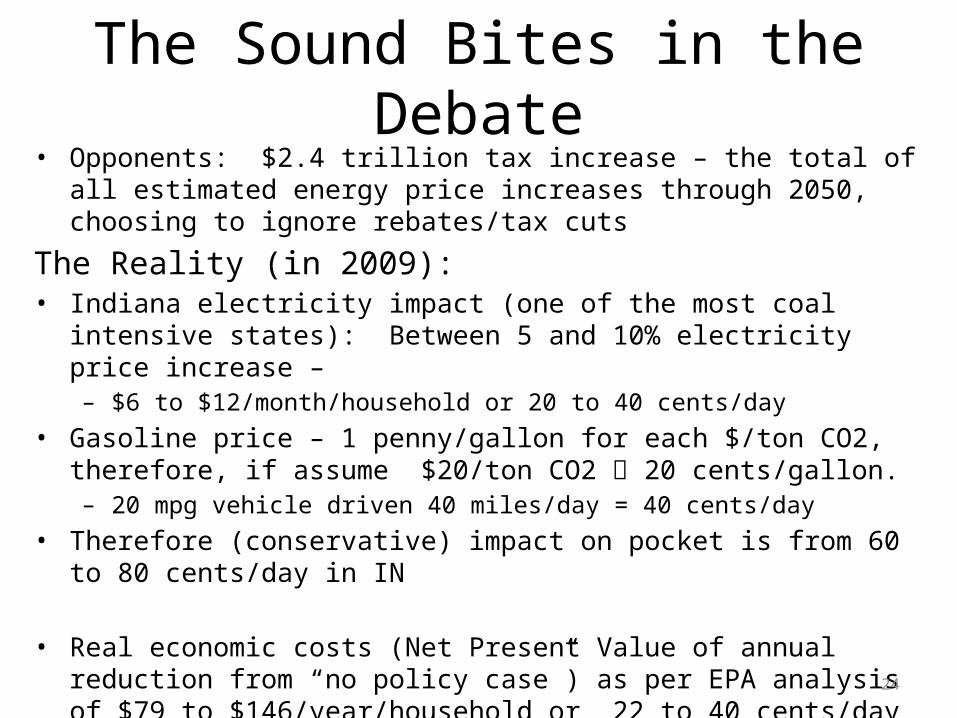
The Sound Bites in the Debate• Opponents: $2.4 trillion tax increase – the total of all estimated energy price
increases through 2050, choosing to ignore rebates/tax cuts
The Reality (in 2009):• Indiana electricity impact (one of the most coal intensive states): Between 5
and 10% electricity price increase – – $6 to $12/month/household or 20 to 40 cents/day
• Gasoline price – 1 penny/gallon for each $/ton CO2, therefore, if assume $20/ton CO2 20 cents/gallon. – 20 mpg vehicle driven 40 miles/day = 40 cents/day
• Therefore (conservative) impact on pocket is from 60 to 80 cents/day in IN
• Real economic costs (Net Present Value of annual reduction from “no policy case”) as per EPA analysis of $79 to $146/year/household or 22 to 40 cents/day– 2.6 people/household cost of 8.5 to 15 cents/day/person
24
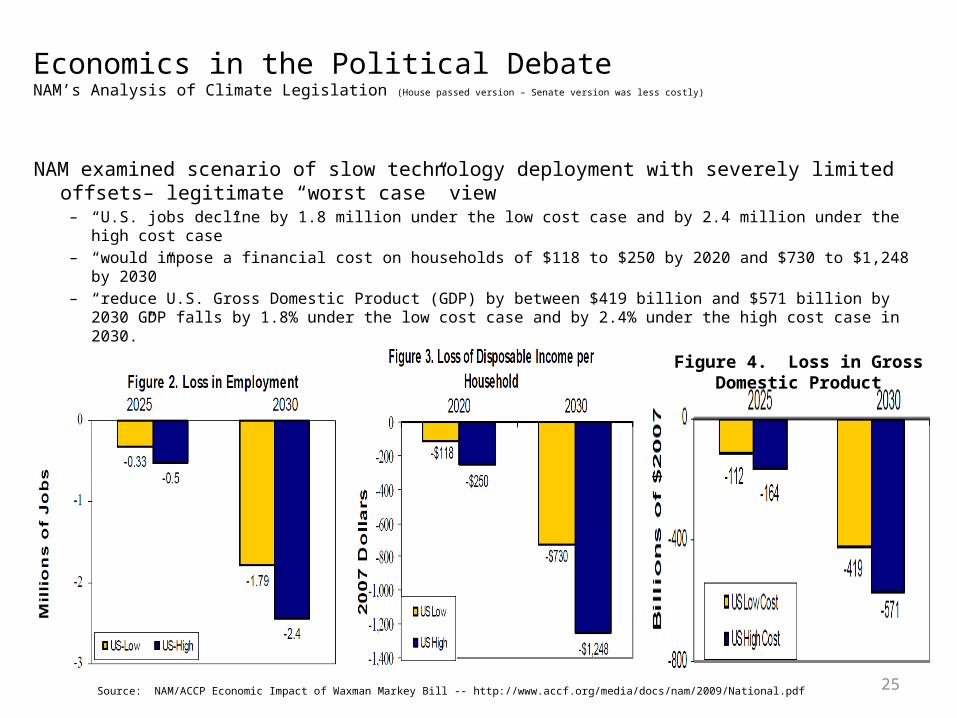
Economics in the Political DebateNAM’s Analysis of Climate Legislation (House passed version – Senate version was less costly)
NAM examined scenario of slow technology deployment with severely limited offsets– legitimate “worst case” view– “U.S. jobs decline by 1.8 million under the low cost case and by 2.4 million under the high cost case”– “would impose a financial cost on households of $118 to $250 by 2020 and $730 to $1,248 by 2030”– “reduce U.S. Gross Domestic Product (GDP) by between $419 billion and $571 billion by 2030 GDP falls
by 1.8% under the low cost case and by 2.4% under the high cost case in 2030.”
Source: NAM/ACCP Economic Impact of Waxman Markey Bill -- http://www.accf.org/media/docs/nam/2009/National.pdf
Figure 4. Loss in Gross Domestic Product
25
26
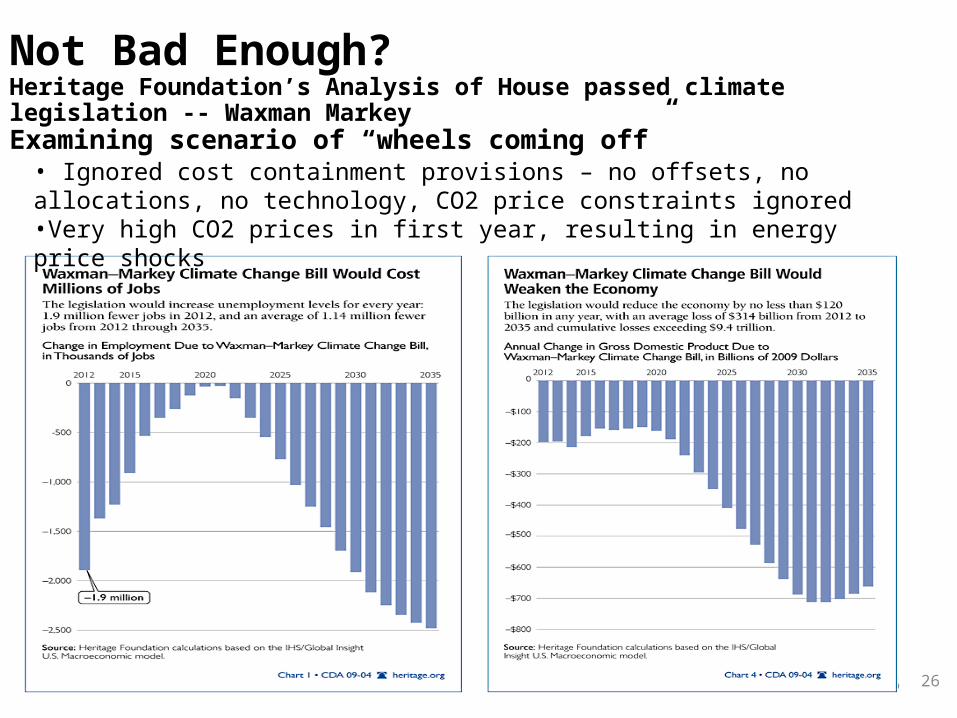
Not Bad Enough?Heritage Foundation’s Analysis of House passed climate legislation -- Waxman MarkeyExamining scenario of “wheels coming off”• Ignored cost containment provisions – no offsets, no allocations, no technology, CO2 price constraints ignored•Very high CO2 prices in first year, resulting in energy price shocks
26
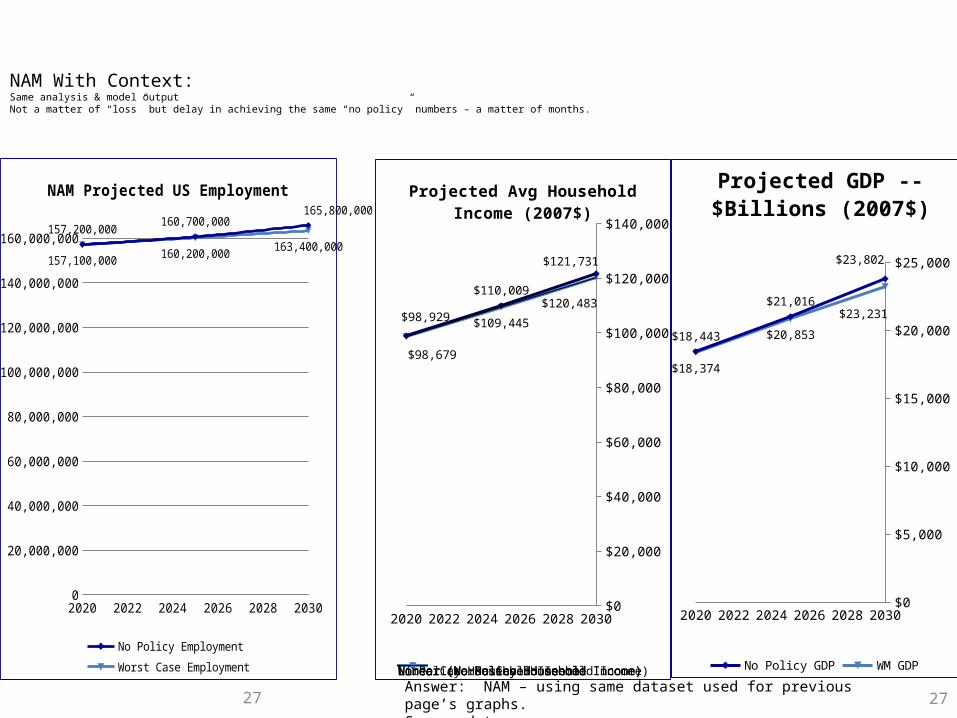
NAM With Context:Same analysis & model outputNot a matter of “loss” but delay in achieving the same “no policy” numbers – a matter of months.
27
2020 2022 2024 2026 2028 2030$0
$5,000
$10,000
$15,000
$20,000
$25,000
$18,374
$20,853
$23,231
$18,443
$21,016
$23,802
Projected GDP -- $Billions (2007$)
No Policy GDP WM GDP
Answer: NAM – using same dataset used for previous page’s graphs.Source data: http://www.accf.org/media/dynamic/3/media_381.pdf, page 5
2020 2022 2024 2026 2028 2030$0
$20,000
$40,000
$60,000
$80,000
$100,000
$120,000
$140,000
$98,679
$109,445$120,483
$98,929
$110,009
$121,731
Projected Avg Household Income (2007$)
No Policy Household IncomeLinear (No Policy Household Income)Linear (No Policy Household Income)Worse Case Household IncomeLinear (Worse Case Household Income)
0
20,000,000
40,000,000
60,000,000
80,000,000
100,000,000
120,000,000
140,000,000
160,000,000157,100,000
160,200,000163,400,000
157,200,000160,700,000
165,800,000NAM Projected US Employment
No Policy Employment Worst Case Employment
27
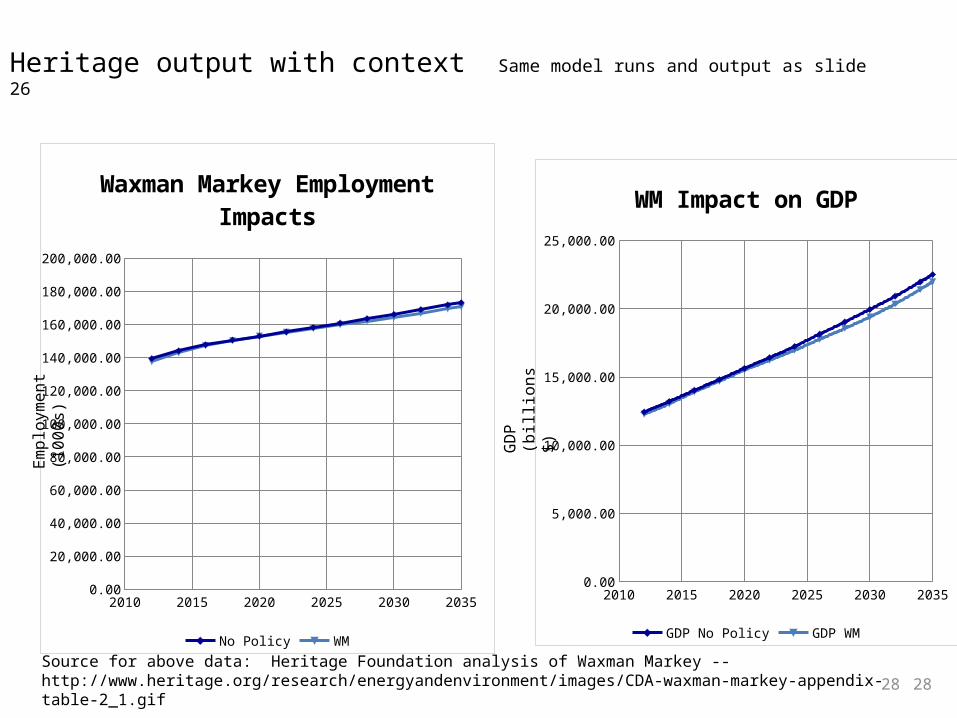
Heritage output with context Same model runs and output as slide 26
28
2010 2015 2020 2025 2030 20350.00
20,000.00
40,000.00
60,000.00
80,000.00
100,000.00
120,000.00
140,000.00
160,000.00
180,000.00
200,000.00
Waxman Markey Employment Impacts
No Policy WM
Empl
oym
ent (
1000
s)
2010 2015 2020 2025 2030 20350.00
5,000.00
10,000.00
15,000.00
20,000.00
25,000.00
WM Impact on GDP
GDP No Policy GDP WM
GD
P (b
illio
ns
$)
Source for above data: Heritage Foundation analysis of Waxman Markey -- http://www.heritage.org/research/energyandenvironment/images/CDA-waxman-markey-appendix-table-2_1.gif 28

29
Whiteboard