business continuity institute supply chain resilience ......it also benchmarks business continuity...
TRANSCRIPT
B u s i n e s s C o n t i n u i t y I n s t i t u t eSUPPLY CHAIN RESILIENCE REPORT
2015
Contents
Executive Summary 3
Section 1
Section 2
Supply Chain Disruption 6
Annex
Section 3
Supply Chain Resilience and Business Continuity 20
Section 4
Conclusion 32
1 | Executive Summary
INTRODUCTIONCurrently on its
seventh edition, the Supply Chain Resilience
Report is an influential industry resource which tracks the
origins, causes and consequences of supply chain disruption across
industry sectors and regions worldwide. It also benchmarks business continuity
(BC) arrangements in place - including the uptake of insurance - in different organizations
which build supply chain resilience. It is one of the most comprehensive, practitioner-
led studies in the field. Some of the highlights:

Section 1
03
Section 1 Executive Summary
Frequency and Origins of Disruption Experienced at least 1 instance of supply chain disruption
Do not have full visibility of supply chains
Disruptions originate from Tier 1
Do not analyse the source of disruption
100%
74%72%
50%31%
Consequences of Disruption 100%
Top 5 consequences of disruption are loss of productivity 58%Customer complaints 40%Increased cost of working 39%Loss of revenue 38%Impaired service outcomes 36%
Newer Sources of Disruption Emerge8th Product Quality Incident - its last appearance in the top 10 was 2012 at 9th
9th Business Ethics Incident - the first time ever it has appeared in the top 10
10th Lack of Credit - its last appearance in the top 10 was 2009 at 9th
Outsourcer service failure drops out of the top 3 for the first time since 2012
Top Three Causes of Supply Chain Disruption
Unplanned IT & telecommunications outage
Cyber attack & data breach Adverse weather
64% 50%54%

04
Executive Summary Section 1Section 1
33% Respondents report
high top management commitment to supply
chain resilience
Supply Chain Resilience and Business Continuity
Economic Impacts of Disruption 100%
14% |Report cumulative losses of at least €1 million
9% | Report a losses of at least €1 million arising from a single incident
< 1% | Claimed a single incident loss in the region of €500 million
Organizations do not insure losses from supply chain disruption 58%
Horizon Scanning RisksThe top three drivers of supply chain disruption
This is the second most significant risk in
the next five yearsThese are viewed as the top risks in the next 12 months
Unplanned IT & telecommunications outage
Cyber attack & data breach Adverse weather New laws & regulations
74% of large business have BC arrangements
74%
54% of SME’s have BC arrangements
54%
VS
68%Report having supply chain
BC arrangements

2 | Supply Chain Disruption

Frequency and Origins The lack of supply chain visibility is a perennial issue that has been highlighted by the BCI
Supply Chain Resilience Report. This year is no exception as many organizations lack firm-wide reporting of supply chain incidents. While 28% of organizations report supply chain incidents across the whole enterprise, this still means that almost three-quarters of firms (72%) do not have that full visibility. In fact, more than a third (35%) do not report incidents at all (Figure 1).
06
Section 2Supply Chain Disruption
Figure 1. Question 7: Do you record, measure, and report on performance-affecting supply chain disruptions (i.e. where an unplanned cost has been incurred or loss of productivity or revenue experienced)? (Answers are expressed in percentage, N=411)
Further feedback by BC and supply chain professionals cite common reasons for such – the absence of a supply chain continuity policy, silos among departments which hinder reporting, and lack of priority by top management. These findings underscore the need for top leadership to get involved and drive changes that improve the visibility of supply chain incidents across the organization.
YES, this is coordinated & reported across the whole enterprise
YES, within certain departments/ functions, but NOT aggregated
NO
28%
37%
35%
07
Section 2 Supply Chain Disruption
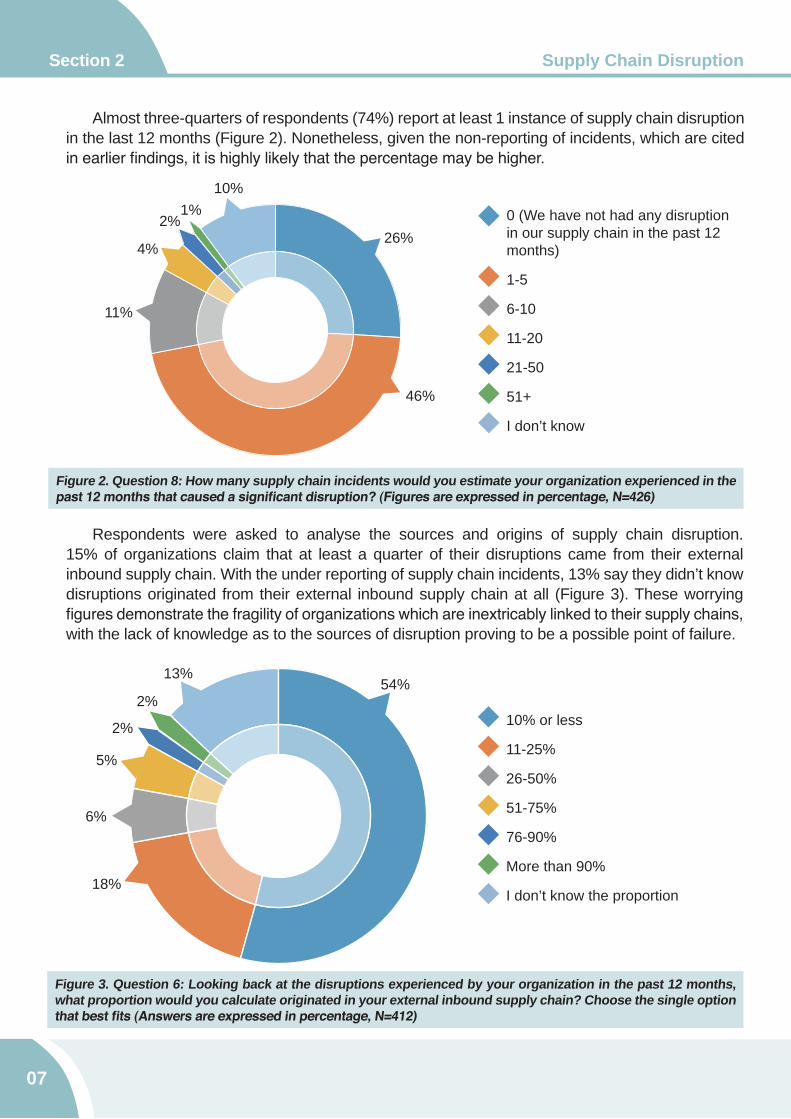
Figure 2. Question 8: How many supply chain incidents would you estimate your organization experienced in the past 12 months that caused a significant disruption? (Figures are expressed in percentage, N=426)
0 (We have not had any disruption in our supply chain in the past 12 months)
1-5
6-10
11-20
21-50
51+
I don’t know
26%
46%
11%
4%
2%1%
10%
Almost three-quarters of respondents (74%) report at least 1 instance of supply chain disruption in the last 12 months (Figure 2). Nonetheless, given the non-reporting of incidents, which are cited in earlier findings, it is highly likely that the percentage may be higher.
Respondents were asked to analyse the sources and origins of supply chain disruption. 15% of organizations claim that at least a quarter of their disruptions came from their external inbound supply chain. With the under reporting of supply chain incidents, 13% say they didn’t know disruptions originated from their external inbound supply chain at all (Figure 3). These worrying figures demonstrate the fragility of organizations which are inextricably linked to their supply chains, with the lack of knowledge as to the sources of disruption proving to be a possible point of failure.
Figure 3. Question 6: Looking back at the disruptions experienced by your organization in the past 12 months, what proportion would you calculate originated in your external inbound supply chain? Choose the single option that best fits (Answers are expressed in percentage, N=412)
10% or less
11-25%
26-50%
51-75%
76-90%
More than 90%
I don’t know the proportion
54%
18%
6%
5%
2%
2%
13%

08
Section 2Supply Chain Disruption
This year’s survey asked a slightly different question considering the predominant source of disruption to their supply chains. Multiple answers were allowed and half of respondents answered Tier 1 (50%) with more than a quarter (29%) mentioning Tier 2 and lower. Once more, results reveal the lack of supply chain visibility with 31% not analysing their supply chains at all (Figure 4).
Figure 4. Question 9: Considering the supply chain incidents you are aware of in the last 12 months, which of the following apply in your experience? The predominant source of disruption across all events was… (Answers are expressed in percentage, N=383)
0 10 20 30 40 50 60%
With our immediate supplier (TIER 1)
21%
50%
8%
With your supplier’s supplier (TIER 2)
Much lower down the supply chain (i.e. TIER 3, TIER 4, etc.)We do NOT analyse the full supply chain to identify original source of the disruption
31%
09
Section 2 Supply Chain Disruption
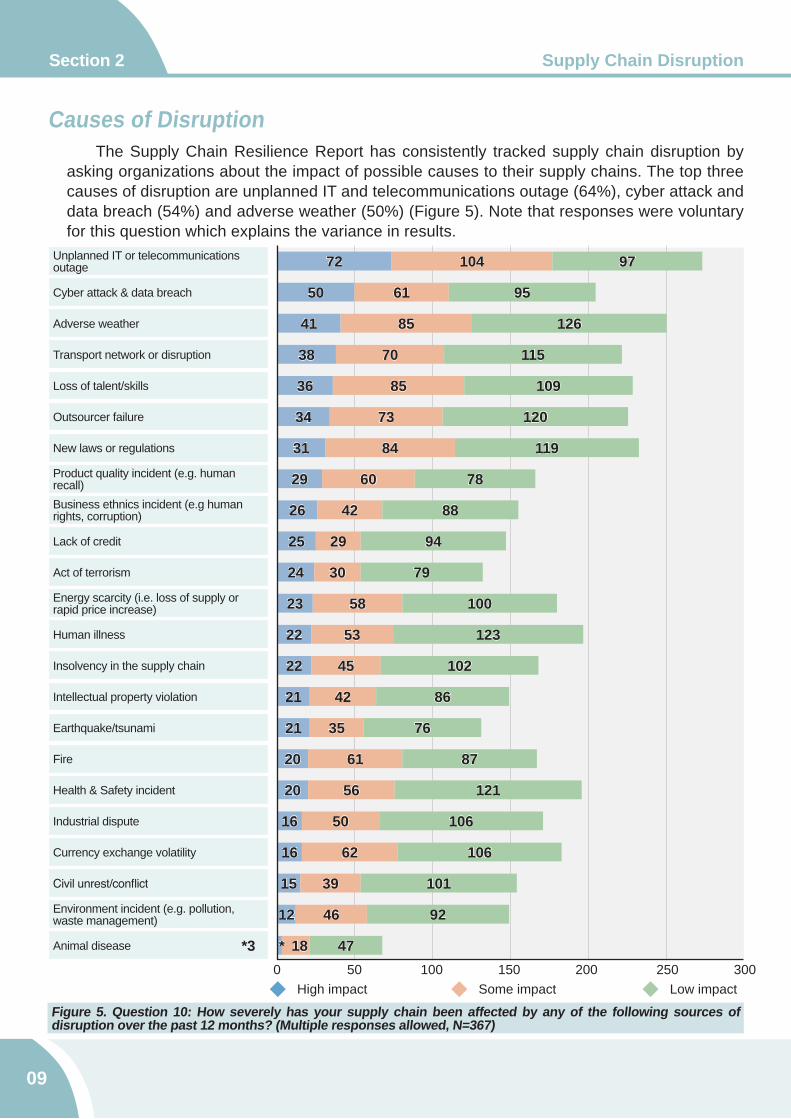
Causes of Disruption The Supply Chain Resilience Report has consistently tracked supply chain disruption by
asking organizations about the impact of possible causes to their supply chains. The top three causes of disruption are unplanned IT and telecommunications outage (64%), cyber attack and data breach (54%) and adverse weather (50%) (Figure 5). Note that responses were voluntary for this question which explains the variance in results.
Figure 5. Question 10: How severely has your supply chain been affected by any of the following sources of disruption over the past 12 months? (Multiple responses allowed, N=367)
Cyber attack & data breach
Adverse weather
Transport network or disruption
Loss of talent/skills
Outsourcer failure
New laws or regulations
Product quality incident (e.g. human recall)
Unplanned IT or telecommunications outage
Business ethnics incident (e.g human rights, corruption)
Energy scarcity (i.e. loss of supply or rapid price increase)
Environment incident (e.g. pollution,waste management)
Lack of credit
Act of terrorism
Human illness
Insolvency in the supply chain
Intellectual property violation
Earthquake/tsunami
Fire
Health & Safety incident
Industrial dispute
Currency exchange volatility
Civil unrest/conflict
Animal disease
72 104 97
50 61 95
41 85 126
38 70 115
36 85 109
34 73 120
31 84 119
29 60 78
26 42 88
25 29 94
24 30 79
23 58 100
22 53 123
22 45 102
21 42 86
21 35 76
20 61 87
20 56 121
16 50 106
16 62 106
15 39 101
12 46 92
*3 18* 470 50 100 150 200 250 300
Some impactHigh impact Low impact

Section 2Supply Chain Disruption
Cyber attack and data breach make it to the top three for the first time in the survey. This reflects a steady increase in concern over these threats as reflected by earlier BCI findings in the 2014 BCI Supply Chain Resilience Report and the 2015 BCI Horizon Scan Report. The dependence on technology to facilitate increasingly complex supply chain arrangements may produce a single point of failure which may explain the results.
Movers in the survey include outsourcer service failure which now drops from third to sixth, the first time it is out of the top three since 2012. Newer sources of disruption emerge in the top 10 which include product quality incident, business ethics incident and lack of credit. Product quality incidents jump eight places from 16th to eighth this year. Business ethics incidents as a source of supply chain disruption makes it to the top 10 at ninth for the first time ever in the survey which reveals the relationship of corporate governance to operations. The lack of credit at 10th, possibly heightened by the recent Eurozone crisis and possible Chinese economic slowdown, also demonstrates the relationship of external economic events to supply chains.
Acts of terrorism fed by instability in many parts of the world, jump from 21st to 11th as a source of supply chain disruption in this year’s survey. On the other end of the rankings, civil unrest/conflict, environmental incidents and animal disease take the last three places at 22nd, 23rd and 24th respectively.
The rise of cyber attacks and data breaches as causes of supply chain disruption may explain the increase of organizations reporting non-physical disruption, which rises to 34% from 24.9% last year (Figure 6).
Figure 6. Question 11: What has been your experience of physical and non-physical disruption in your supply chain? We have experienced… (Answers are expressed in percentage, N=323)
10
Physical disruption
Non-physical disruption
Both physical & non-physical disruption
30%
34%
36%

Figure 7. Question 12: Did external social media discussions play any role in the supply chain incidents you experienced? (Answers are expressed in percentage, N=349)
The role of social media discussions have been highlighted in the last few years of this survey. In 2015, 15% of respondents report experiencing negative social media discussions, a drop from 24% last year (Figure 7). This may be a result of more organizations becoming more aware of reputation management and the need to monitor and engage with social media especially during incidents.
11
Section 2 Supply Chain Disruption
YES, we experienced NEGATIVE discussions
YES, we experienced POSITIVE discussions
NO, there were no external social media discussions
I don’t know
15%
7%
59%
19%
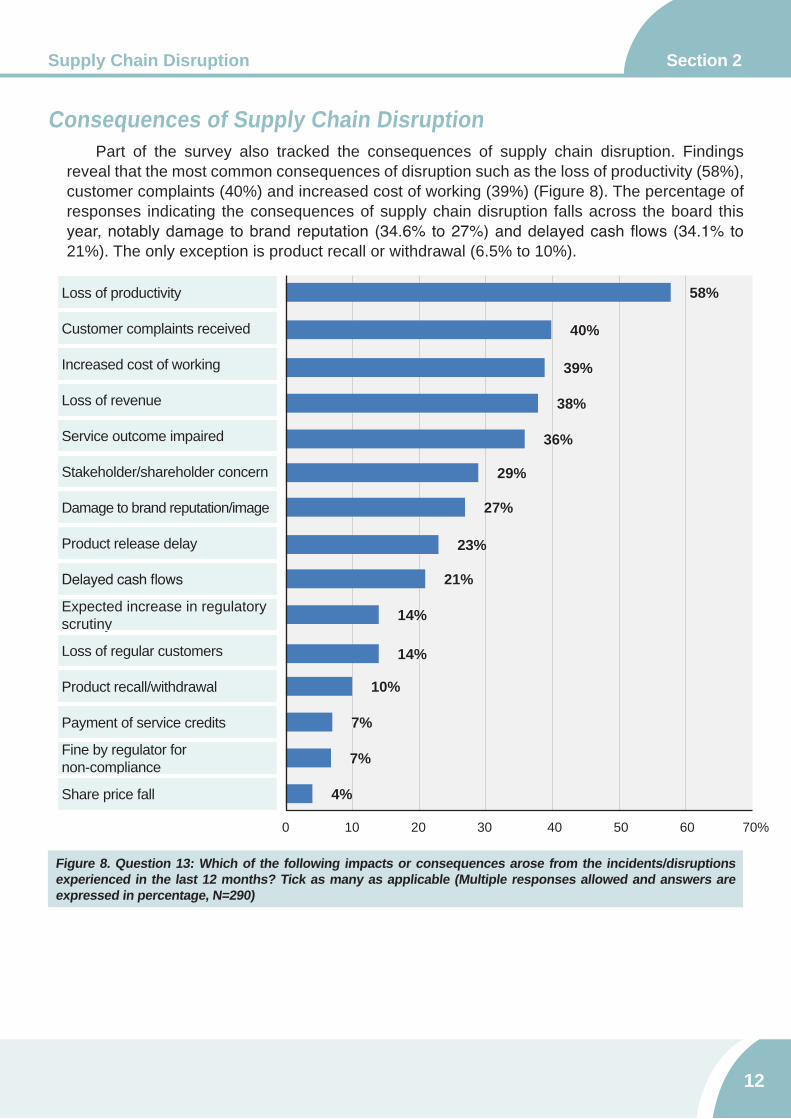
Consequences of Supply Chain Disruption Part of the survey also tracked the consequences of supply chain disruption. Findings
reveal that the most common consequences of disruption such as the loss of productivity (58%), customer complaints (40%) and increased cost of working (39%) (Figure 8). The percentage of responses indicating the consequences of supply chain disruption falls across the board this year, notably damage to brand reputation (34.6% to 27%) and delayed cash flows (34.1% to 21%). The only exception is product recall or withdrawal (6.5% to 10%).
Figure 8. Question 13: Which of the following impacts or consequences arose from the incidents/disruptions experienced in the last 12 months? Tick as many as applicable (Multiple responses allowed and answers are expressed in percentage, N=290)
12
Section 2Supply Chain Disruption
Loss of productivity
Customer complaints received
Increased cost of working
Loss of revenue
Service outcome impaired
Stakeholder/shareholder concern
Damage to brand reputation/image
Product release delay
Delayed cash flows
Product recall/withdrawal
Expected increase in regulatory scrutiny
Loss of regular customers
Payment of service credits
Fine by regulator fornon-compliance
Share price fall
58%
40%
39%
38%
36%
29%
27%
23%
21%
14%
14%
10%
7%
7%
4%
0 10 20 30 40 50 60 70%
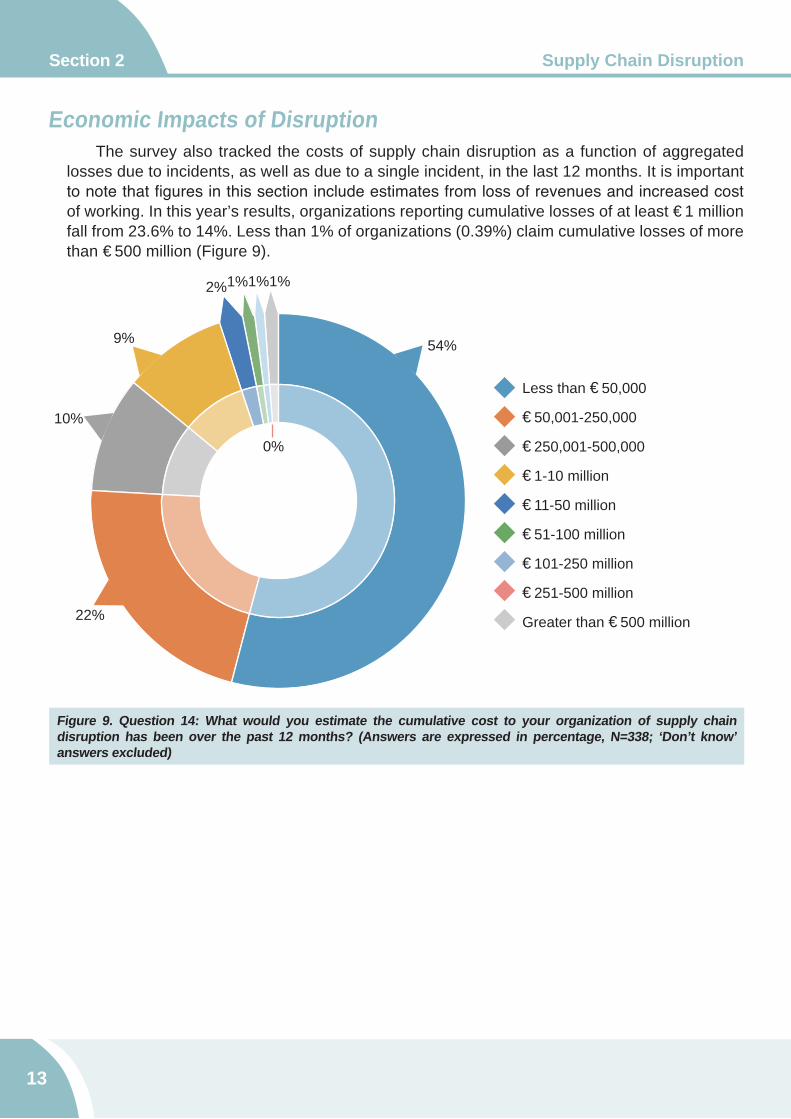
Economic Impacts of Disruption The survey also tracked the costs of supply chain disruption as a function of aggregated
losses due to incidents, as well as due to a single incident, in the last 12 months. It is important to note that figures in this section include estimates from loss of revenues and increased cost of working. In this year’s results, organizations reporting cumulative losses of at least €1 million fall from 23.6% to 14%. Less than 1% of organizations (0.39%) claim cumulative losses of more than €500 million (Figure 9).
Figure 9. Question 14: What would you estimate the cumulative cost to your organization of supply chain disruption has been over the past 12 months? (Answers are expressed in percentage, N=338; ‘Don’t know’ answers excluded)
Section 2 Supply Chain Disruption
13
Less than €50,000
€50,001-250,000
€250,001-500,000
€1-10 million
€11-50 million
€51-100 million
€101-250 million
€251-500 million
Greater than €500 million
54%
22%
10%
9%
0%
2%1%1%1%

Less than 10% of organizations (9%) claim losses of at least €1 million as a result of a single incident. Once more, less than 1% of the respondents report a single loss of more than €500 million (Figure 10). These substantial reductions in losses may be down to several factors which include improved coordination among departments, better reputation management especially through social media, and increasing supply chain visibility through firm-wide reporting1.
Figure 10. Question 16: What was the approximate financial cost of your most significant supply chain incident in the last 12 months? (Answers are expressed as percentage, N=338; ‘Don’t know’ answers excluded)
141. These findings came from comments gathered from respondents in a free-form section of the questionnaire.
Section 2Supply Chain Disruption
Less than €50,000
€50,001-250,000
€250,001-500,000
€1-10 million
€11-50 million
€51-100 million
€101-250 million
€251-500 million
Greater than €500 million
67%
15%
9%
6%
0%
2% 1%
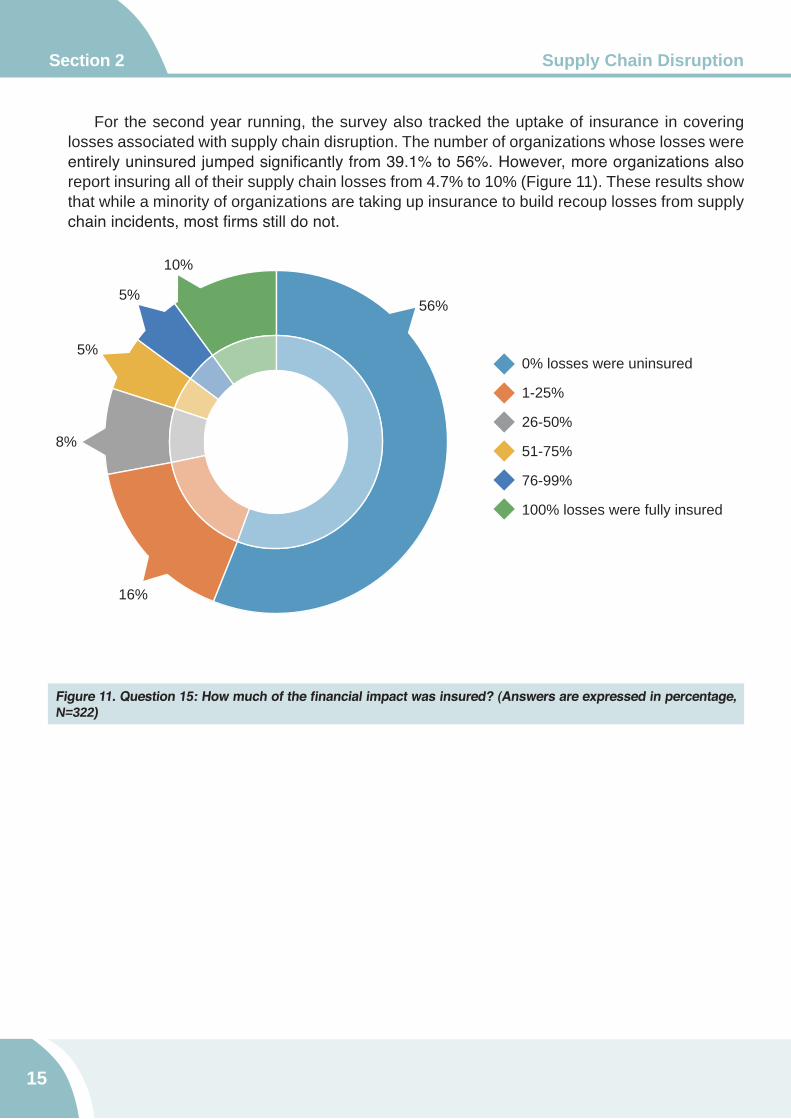
For the second year running, the survey also tracked the uptake of insurance in covering losses associated with supply chain disruption. The number of organizations whose losses were entirely uninsured jumped significantly from 39.1% to 56%. However, more organizations also report insuring all of their supply chain losses from 4.7% to 10% (Figure 11). These results show that while a minority of organizations are taking up insurance to build recoup losses from supply chain incidents, most firms still do not.
Figure 11. Question 15: How much of the financial impact was insured? (Answers are expressed in percentage, N=322)
15
Section 2 Supply Chain Disruption
0% losses were uninsured
1-25%
26-50%
51-75%
76-99%
100% losses were fully insured
56%
16%
8%
5%
5%
10%
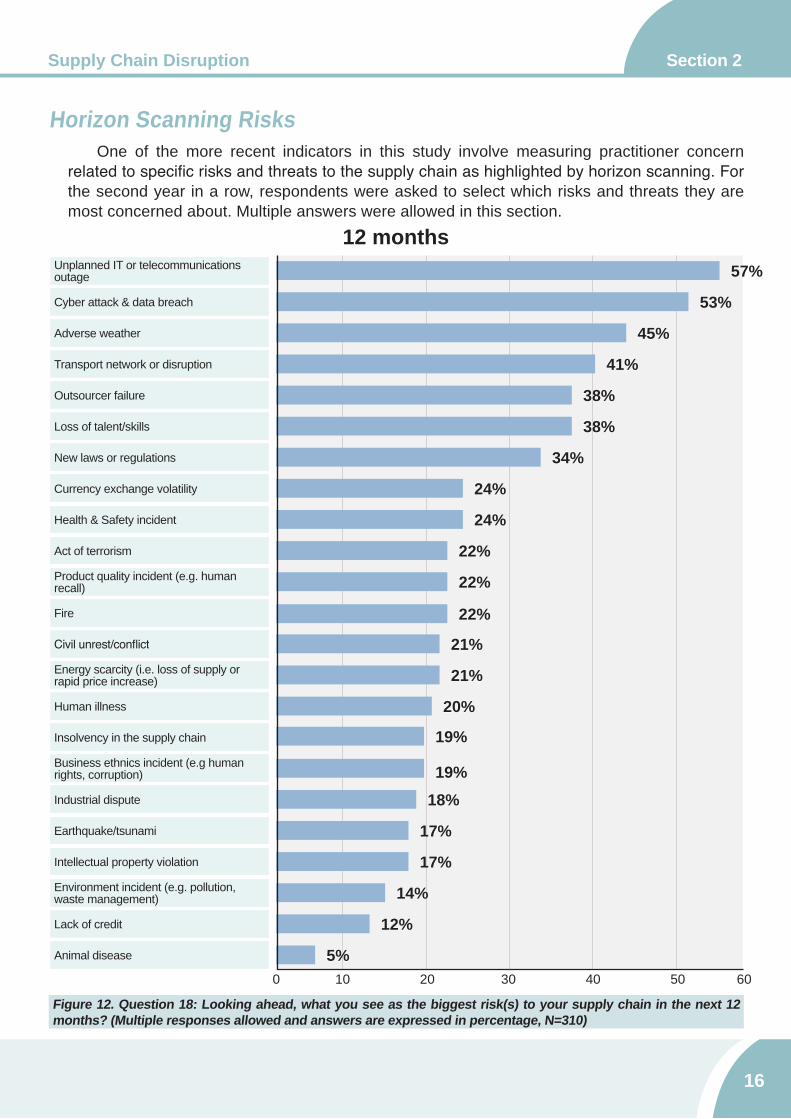
Horizon Scanning Risks One of the more recent indicators in this study involve measuring practitioner concern
related to specific risks and threats to the supply chain as highlighted by horizon scanning. For the second year in a row, respondents were asked to select which risks and threats they are most concerned about. Multiple answers were allowed in this section.
Figure 12. Question 18: Looking ahead, what you see as the biggest risk(s) to your supply chain in the next 12 months? (Multiple responses allowed and answers are expressed in percentage, N=310)
Cyber attack & data breach
Adverse weather
Transport network or disruption
Loss of talent/skills
Outsourcer failure
New laws or regulations
Product quality incident (e.g. human recall)
Unplanned IT or telecommunications outage
Business ethnics incident (e.g human rights, corruption)
Energy scarcity (i.e. loss of supply or rapid price increase)
Environment incident (e.g. pollution,waste management)
Lack of credit
Act of terrorism
Human illness
Insolvency in the supply chain
Intellectual property violation
Earthquake/tsunami
Fire
Health & Safety incident
Industrial dispute
Currency exchange volatility
Civil unrest/conflict
Animal disease
57%
53%
45%
41%
38%
38%
34%
24%
24%
22%
22%
22%
21%
21%
20%
19%
19%18%
17%
17%
14%
12%
5%0 10 20 30 40 50 60
12 months
16
Section 2Supply Chain Disruption
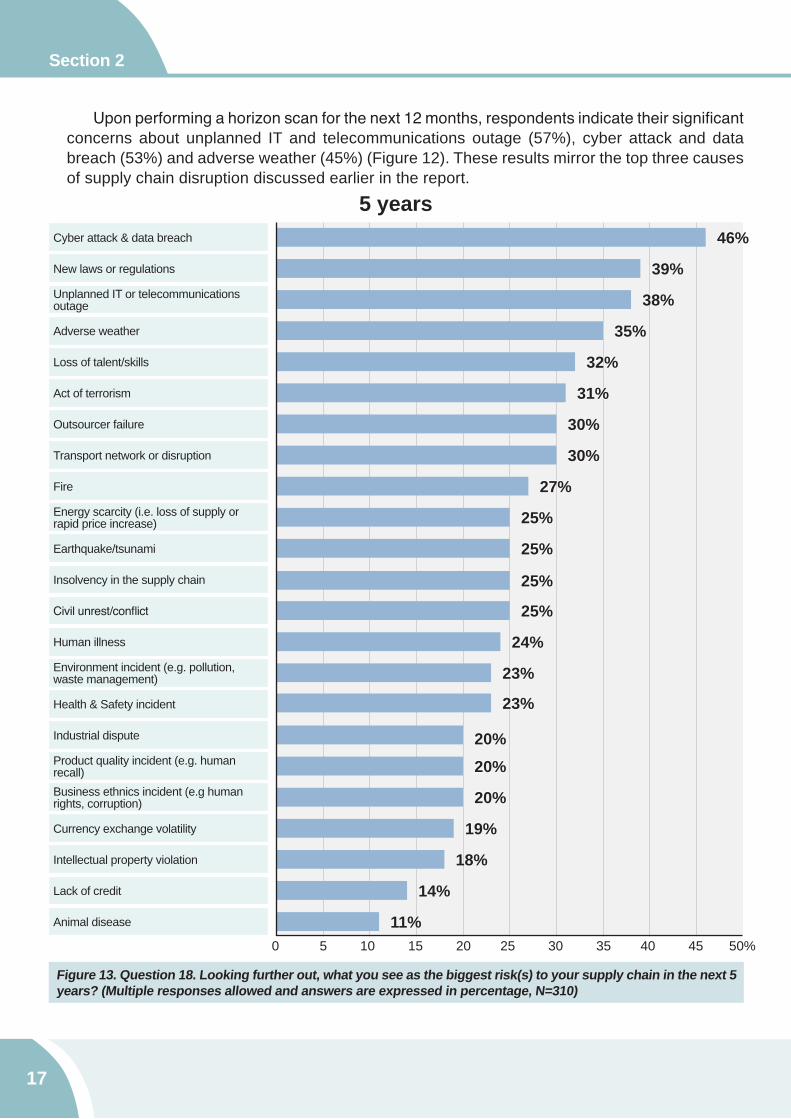
Figure 13. Question 18. Looking further out, what you see as the biggest risk(s) to your supply chain in the next 5 years? (Multiple responses allowed and answers are expressed in percentage, N=310)
Upon performing a horizon scan for the next 12 months, respondents indicate their significant concerns about unplanned IT and telecommunications outage (57%), cyber attack and data breach (53%) and adverse weather (45%) (Figure 12). These results mirror the top three causes of supply chain disruption discussed earlier in the report.
Cyber attack & data breach
Adverse weather
Transport network or disruption
Loss of talent/skills
Outsourcer failure
New laws or regulations
Product quality incident (e.g. human recall)
Unplanned IT or telecommunications outage
Business ethnics incident (e.g human rights, corruption)
Energy scarcity (i.e. loss of supply or rapid price increase)
Environment incident (e.g. pollution,waste management)
Lack of credit
Act of terrorism
Human illness
Insolvency in the supply chain
Intellectual property violation
Earthquake/tsunami
Fire
Health & Safety incident
Industrial dispute
Currency exchange volatility
Civil unrest/conflict
Animal disease
46%
39%
38%
35%
32%
31%
30%
30%
27%
25%
25%
25%
25%
24%
23%
23%
20%20%
20%
19%
18%
14%
11%0 5 10 15 20 25 30 35 40 45 50%
5 years
17
Section 2
Meanwhile, outsourcer service failure loom less as a concern as it drops from third to fifth (41% to 38%). Concerns about transport network disruptions increase as it jumps from eighth to fourth (27% to 41%). Currency exchange rate volatility also leaps from 16th to joint eighth in the rankings (12.6% to 24%).
Upon performing a horizon scan on the next five years, the concern for cyber attacks and data breach become more significant as it tops the survey for the second year running at 46% (Figure 13). New laws and regulations now place second at 39% with unplanned IT and telecommunications outages (38%), adverse weather (35%) and loss of talent and skills (32%) rounding out the top five. Outsourcer service failure falls further down from third to joint seventh (42.3% to 30%) in this year’s survey. In a show of concern over lingering security threats, acts of terrorism jump four places from 10th last year to sixth (20.2% to 31%).
18
Section 2Supply Chain Disruption
Case Study:Cyber Attack in the Supply Chain
In September 2014 Home Depot, by far the largest home improvement firm in North America, suffered a major cyber-attack that involved the violation of 56 million debit and credit cards, as well as of 90 million customer accounts. Over 2,000 stores were affected in both the United States and Canada, forcing the company to pay roughly $62 million in terms of legal expenses and overtime, and banks to make up for an additional $92 million cost to replace the credit cards at risk2.
2. Hardekopf B. Home Depot breach hit 56 million credit and debit cards. http://www.lowcards.com/home-depot-breach-hit-56-million-credit-debit-cards-27571 (Accessed 22/09/2015)3. Smith D. Is your supply chain safe? http://www.supplychainquarterly.com/topics/Technology/20150622-is-your-supply-chain-safe-from-cyberattacks/ (Accessed 22/09/2015)4. Elgin B, Riley M, Lawrence D. Home Depot hacked after months of security warnings. http://www.bloomberg.com/bw/articles/2014-09-18/home-depot-hacked-wide-open (Accessed 22/09/2015)
The data breach occurred following the successful theft, by hackers, of a third party vendor’s identity along the company’s supply chain. The attackers exploited such weak links in the chain to hijack their credentials, which they used to access and navigate within Home Depot’s online system, as this was symbiotically shared with its suppliers. Once in the network, cybercriminals were able to deliver malicious software all the way up to the endpoint of the chain, Home Depot itself. They infected their self-checkout points in every store in North America, copying credit card numbers and customers’ details for over four months without giving any sort of suspicion, and causing disastrous consequences for the company’s reputation and finances3 . Apparently, gaps in the encryption systems as well as the use of old software turned the damage into a disaster, but the source of the attack did lie in a supply chain weakness4. The size and dynamicity of today’s supplying systems have come to require higher and more appropriate cyber security standards, where companies need to consider their partner’s safety measures as their own, since today a firm’s security extends to each and every member of its chain, as a peripheral weak link could easily affect its vital core.

3 | Supply Chain Resilience and Business Continuity
20
Supply Chain Resilience and Business Continuity Section 3
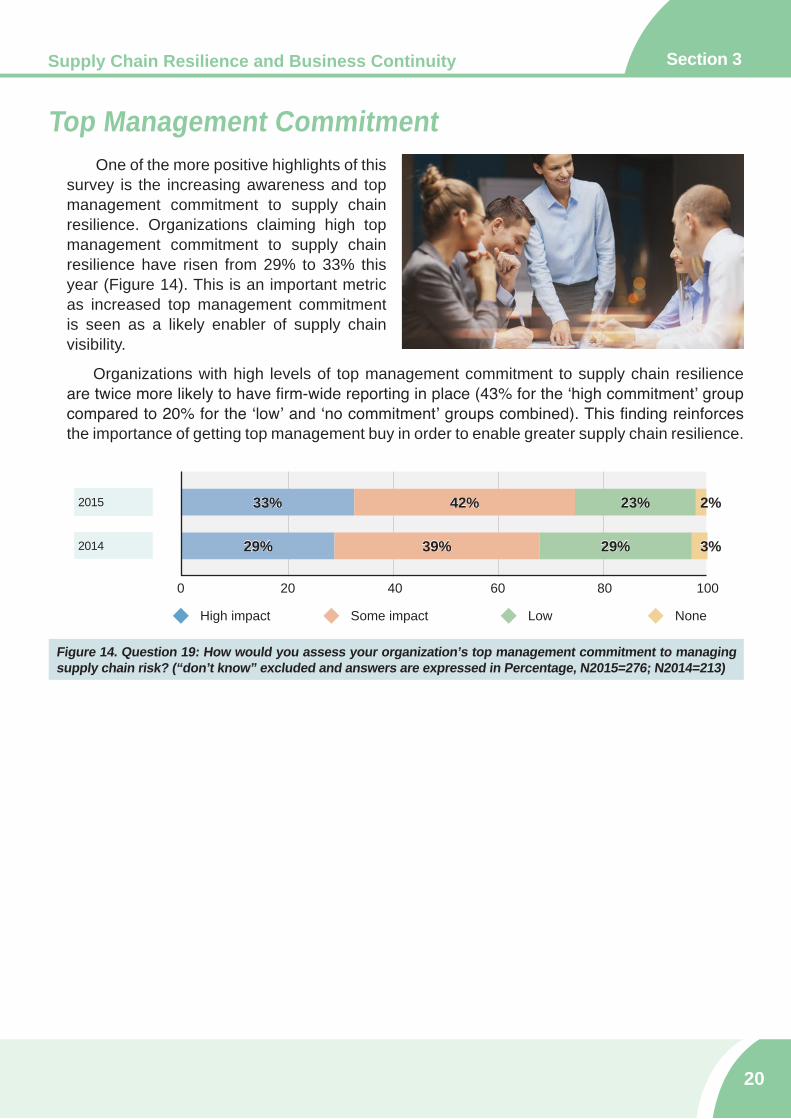
Figure 14. Question 19: How would you assess your organization’s top management commitment to managing supply chain risk? (“don’t know” excluded and answers are expressed in Percentage, N2015=276; N2014=213)
2015 33% 42% 23%
2014 29% 39% 29%
0 20 40 60 80 100
Some impact
2%
Low
3%
NoneHigh impact
Top Management Commitment One of the more positive highlights of this
survey is the increasing awareness and top management commitment to supply chain resilience. Organizations claiming high top management commitment to supply chain resilience have risen from 29% to 33% this year (Figure 14). This is an important metric as increased top management commitment is seen as a likely enabler of supply chain visibility.
Organizations with high levels of top management commitment to supply chain resilience are twice more likely to have firm-wide reporting in place (43% for the ‘high commitment’ group compared to 20% for the ‘low’ and ‘no commitment’ groups combined). This finding reinforces the importance of getting top management buy in order to enable greater supply chain resilience.
21
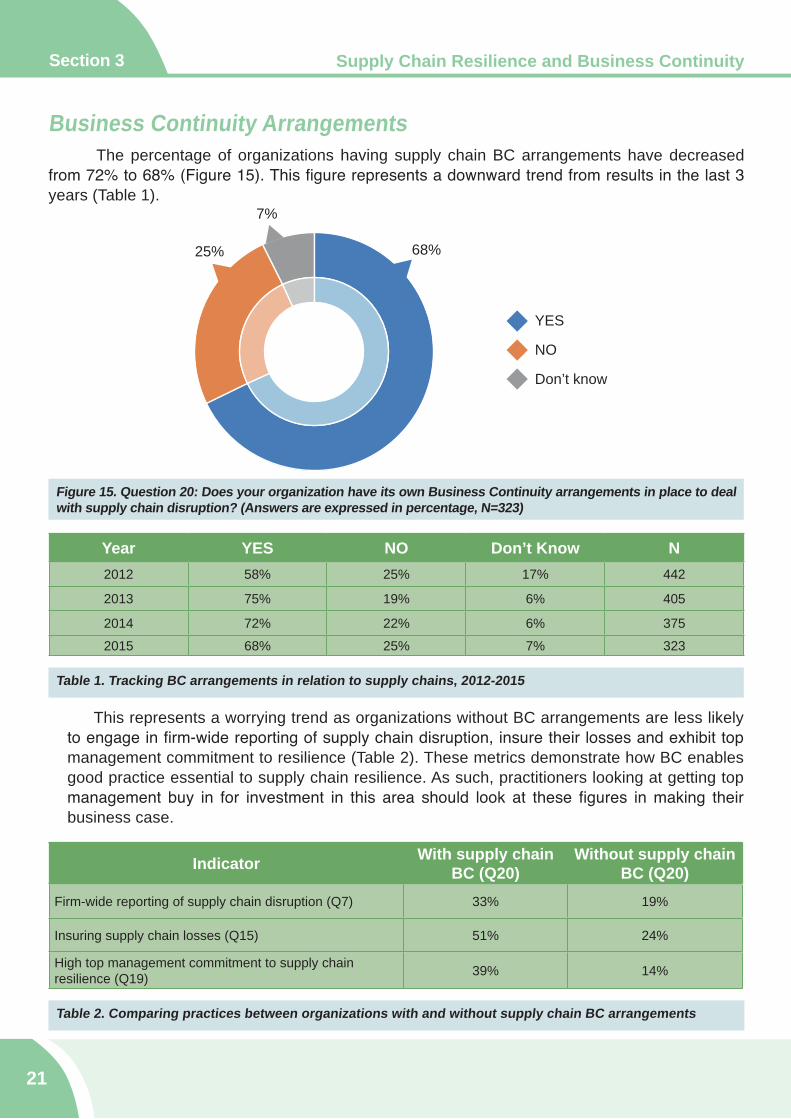
Section 3
Business Continuity Arrangements The percentage of organizations having supply chain BC arrangements have decreased from 72% to 68% (Figure 15). This figure represents a downward trend from results in the last 3 years (Table 1).
Supply Chain Resilience and Business Continuity
Figure 15. Question 20: Does your organization have its own Business Continuity arrangements in place to deal with supply chain disruption? (Answers are expressed in percentage, N=323)
Year YES NO Don’t Know N2012 58% 25% 17% 442
2013 75% 19% 6% 405
2014 72% 22% 6% 3752015 68% 25% 7% 323
Table 1. Tracking BC arrangements in relation to supply chains, 2012-2015
This represents a worrying trend as organizations without BC arrangements are less likely to engage in firm-wide reporting of supply chain disruption, insure their losses and exhibit top management commitment to resilience (Table 2). These metrics demonstrate how BC enables good practice essential to supply chain resilience. As such, practitioners looking at getting top management buy in for investment in this area should look at these figures in making their business case.
Indicator With supply chain BC (Q20)
Without supply chainBC (Q20)
Firm-wide reporting of supply chain disruption (Q7) 33% 19%
Insuring supply chain losses (Q15) 51% 24%
High top management commitment to supply chain resilience (Q19) 39% 14%
Table 2. Comparing practices between organizations with and without supply chain BC arrangements
YES
NO
Don’t know
68%25%
7%

22
Retail Continuity and Resilience Governance Section 3
Nonetheless, except for insuring supply chain losses, there is little difference between SMEs and large businesses in terms of good practices that enable supply chain resilience (Table 3).
Indicator SMEs Large businesses
Firm-wide reporting of supply chain disruption (Q7) 27% 29%
Insuring supply chain losses (Q15) 31% 51%
High top management commitment to supply chain resilience (Q19) 33% 31%
Table 3. Comparing practices between organizations with and without supply chain BC arrangements
Given the contribution of BC in building supply chain resilience, further efforts should focus on increasing its uptake among SMEs. As many SMEs have the perception of BC being a complex, time-consuming effort, organizations such as the BCI should assist practitioners operating in these businesses through relevant tools, methods and metrics.
Segmenting the data according to the size of businesses also reveals a continuing gap between small and medium enterprises (SMEs) and large business in BC uptake. Once more, SMEs are less likely to adopt supply chain BC arrangements than their large business counterparts (54% compared to 74%) (Figure 16).
Figure 16. Question 20: Does your organization have its own Business Continuity arrangements in place to deal with supply chain disruption? (Answers are expressed in percentage, SMEs=96, large businesses=227)
0 20 40 60 80 100
No Don’t KnowYes
Large businesses
54% 36% 10%
74% 20% 6%
SMEs
23
Section 3 Retail Continuity and Resilience Governance
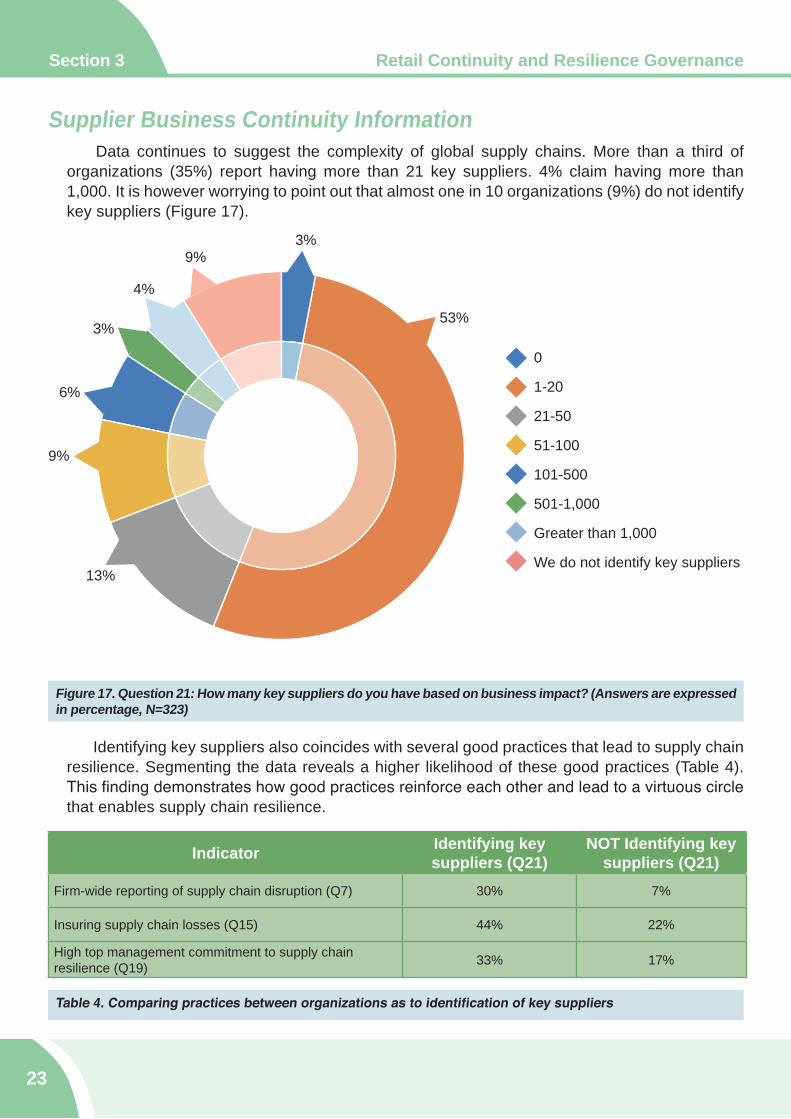
Supplier Business Continuity Information Data continues to suggest the complexity of global supply chains. More than a third of
organizations (35%) report having more than 21 key suppliers. 4% claim having more than 1,000. It is however worrying to point out that almost one in 10 organizations (9%) do not identify key suppliers (Figure 17).
Figure 17. Question 21: How many key suppliers do you have based on business impact? (Answers are expressed in percentage, N=323)
Identifying key suppliers also coincides with several good practices that lead to supply chain resilience. Segmenting the data reveals a higher likelihood of these good practices (Table 4). This finding demonstrates how good practices reinforce each other and lead to a virtuous circle that enables supply chain resilience.
Indicator Identifying key suppliers (Q21)
NOT Identifying key suppliers (Q21)
Firm-wide reporting of supply chain disruption (Q7) 30% 7%
Insuring supply chain losses (Q15) 44% 22%
High top management commitment to supply chain resilience (Q19) 33% 17%
Table 4. Comparing practices between organizations as to identification of key suppliers
0
1-20
21-50
51-100
101-500
501-1,000
Greater than 1,000
We do not identify key suppliers
3%
53%
13%
9%
6%
3%
4%
9%

24
Retail Continuity and Resilience Governance Section 3
Findings reveal that 60% of organizations ask their key suppliers (new or existing) about their BC arrangements (Figure 18). Once more, this behaviour coincides with other good practices (Table 5). Further analysis reveals that SMEs are less likely to ask key suppliers than large businesses (45% compared to 60%). This further reinforces the necessity to focus on good practices and organizational culture in building supply chain resilience especially among SMEs.
Figure 18. Question 22: Do you or your organization ask key suppliers (new/existing) whether they have Business Continuity arrangements in place? (Answers are expressed in percentage, N=312)
IndicatorAsking key suppliers
about BC arrangements(Q22)
NOT asking key suppliers about BC arrangements
(Q22)
Firm-wide reporting of supply chain disruption (Q7) 35% 22%
Insuring supply chain losses (Q15) 50% 31%
High top management commitment to supply chain resilience (Q19) 37% 22%
Table 5. Comparing practices between organizations as to asking key suppliers about BC arrangements
YES
NO
Don’t know
60%
28%
12%
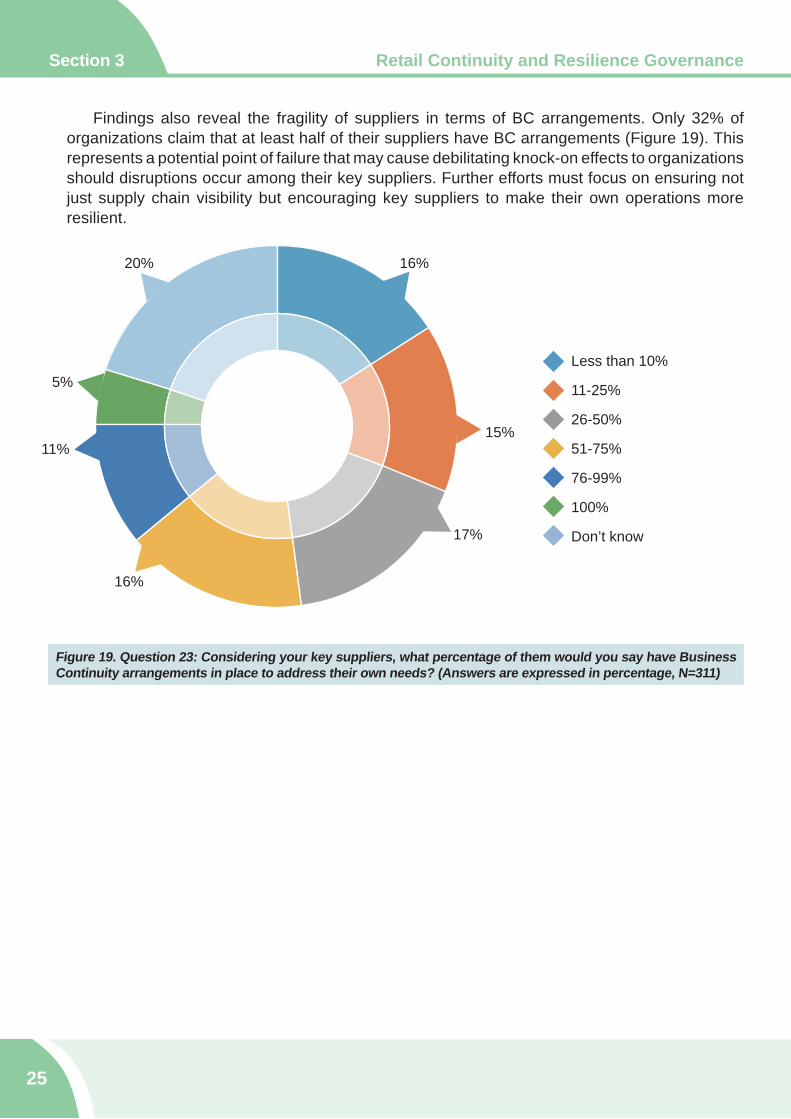
Findings also reveal the fragility of suppliers in terms of BC arrangements. Only 32% of organizations claim that at least half of their suppliers have BC arrangements (Figure 19). This represents a potential point of failure that may cause debilitating knock-on effects to organizations should disruptions occur among their key suppliers. Further efforts must focus on ensuring not just supply chain visibility but encouraging key suppliers to make their own operations more resilient.
25
Section 3 Retail Continuity and Resilience Governance
Figure 19. Question 23: Considering your key suppliers, what percentage of them would you say have Business Continuity arrangements in place to address their own needs? (Answers are expressed in percentage, N=311)
Less than 10%
11-25%
26-50%
51-75%
76-99%
100%
Don’t know
16%
15%
17%
16%
11%
5%
20%
26
Retail Continuity and Resilience Governance Section 3
Figure 21. Question 25: How do you collect this information? We... (Multiple responses allowed and answers are expressed in percentage, N=279)
Don’t collect any information
Provide them with a self-assessment questionnaire
Audit them
Require copies of supplier documentation
Request an independent audit
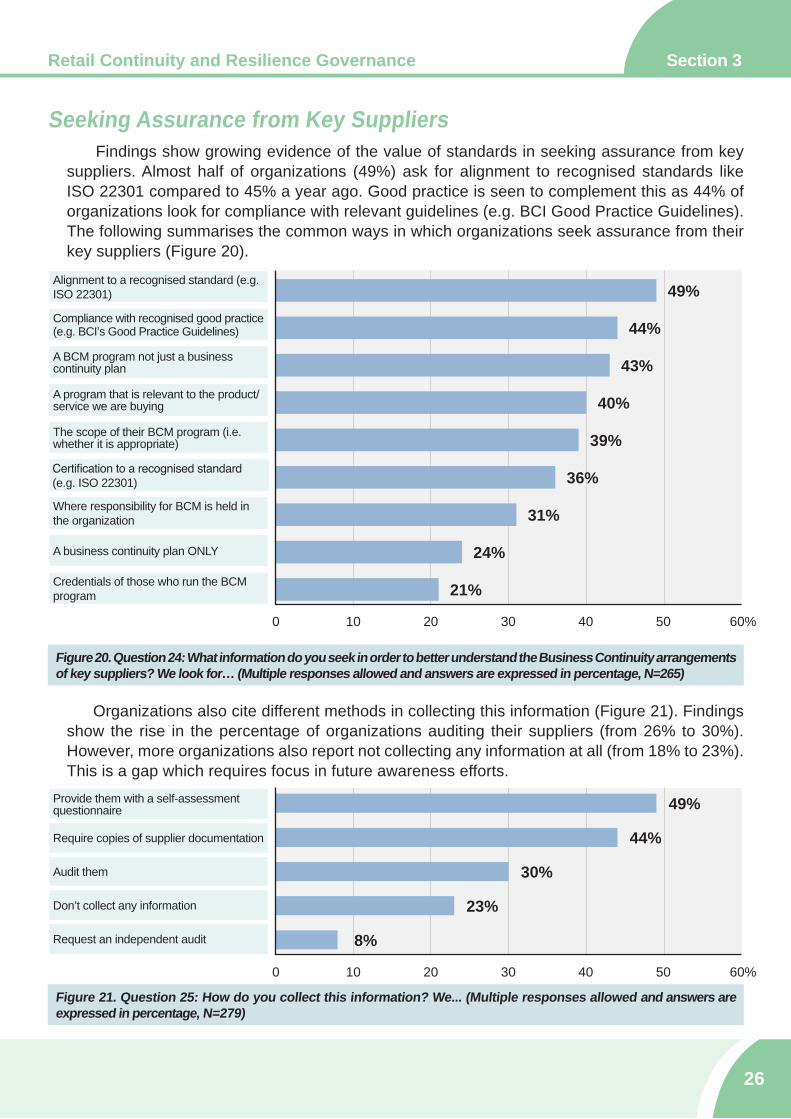
Organizations also cite different methods in collecting this information (Figure 21). Findings show the rise in the percentage of organizations auditing their suppliers (from 26% to 30%). However, more organizations also report not collecting any information at all (from 18% to 23%). This is a gap which requires focus in future awareness efforts.
Figure 20. Question 24: What information do you seek in order to better understand the Business Continuity arrangements of key suppliers? We look for… (Multiple responses allowed and answers are expressed in percentage, N=265)
Seeking Assurance from Key Suppliers Findings show growing evidence of the value of standards in seeking assurance from key
suppliers. Almost half of organizations (49%) ask for alignment to recognised standards like ISO 22301 compared to 45% a year ago. Good practice is seen to complement this as 44% of organizations look for compliance with relevant guidelines (e.g. BCI Good Practice Guidelines). The following summarises the common ways in which organizations seek assurance from their key suppliers (Figure 20).
Alignment to a recognised standard (e.g. ISO 22301)
A program that is relevant to the product/service we are buying
A business continuity plan ONLY
The scope of their BCM program (i.e. whether it is appropriate)
Where responsibility for BCM is held in the organization
Compliance with recognised good practice (e.g. BCI’s Good Practice Guidelines)
A BCM program not just a business continuity plan
Certification to a recognised standard (e.g. ISO 22301)
Credentials of those who run the BCM program
49%
44%
43%
40%
39%
36%
31%
24%
21%
0 10 20 30 40 50 60%
49%
44%
30%
23%
8%
0 10 20 30 40 50 60%

Documented outcome reports & action plans
Observed exercises conducted by suppliers
Joint exercises based around likely scenarios
Ran desktop exercises
Have NOT checked/validated their plans
Checked pre-test scope & post-test reports
Held workshops
56%
26%
16%
15%
14%
12%
10%
0 10 20 30 40 50 60%
27
Section 3 Retail Continuity and Resilience Governance
This largely passive approach is reflected in reviewing the effectiveness of BC arrangements. Almost a fifth of organizations (19%) never review BC arrangements with their suppliers, with 35% doing so in an ad hoc basis (Figure 23). Once more, these findings demonstrate the need for organizations to adopt a more active approach to assurance and engage their suppliers accordingly.
Figure 23. Question 27: How often do you review your Business Continuity requirements with key suppliers and their capability to meet them? Tick as many as applicable. (Multiple responses allowed answers are expressed in percentage, N=286)
Assessing Effectiveness of Supplier Business Continuity Findings reveal the continuing gap in validating supplier BC. While 60% of respondents
report asking their key suppliers about their BC arrangements, almost the same percentage do not validate their suppliers’ plans (56%). It far outnumbers organizations who validate supplier BC (Figure 22). This passive stance towards supplier BC remains a big issue as the lack of validation may significantly weaken an organization’s supply chain resilience.
Figure 22. Question 26: How have you checked/validated that key suppliers’ Business Continuity arrangements might work in practice? We… (Multiple responses allowed and answers are expressed in percentage, N=285)
Ad hoc
A major change event at their end
Schedule review meetings with key suppliers
A new, significant external risk/threat is identified
At contract renewal
Never
A major change event at our end
38%
35%
28%
19%
19%
16%
14%
0 5 10 15 20 25 30 35 40%

Many organizations’ clients also remain passive in terms of supplier assurance. Less than a quarter of the organizations (23%) sampled report that at least majority of their clients require assurance when tendering for new business. 28% of organizations claim that their clients rarely require assurance or don’t ask at all (Figure 24).
Figure 24. Question 28: When tendering for new business clients over the past 12 months, how often have you had to provide assurance to clients that your own Business Continuity arrangements are sufficient? (Answers are expressed in percentage, N=283)
28
Retail Continuity and Resilience Governance Section 3
Every tender/proposal (100%)
Majority (51-99%)
Sometimes (25-50%)
Rarely (1-24%)
Not at all (0%)
Don’t know
Not applicable
7%
16%
18%28%
10%
10%
11%

Figure 25. Question 29: Does Business Continuity feature as part of your supplier contractual discussions? (Answers are expressed in percentage, N=281)
More than a quarter of organizations (27%) do not discuss BC in contractual discussions with suppliers (Figure 25). Given that BC is an enabler of other good practices which build supply chain resilience, this is a worrying finding. It is important for practitioners to embed BC in their organization’s supply chains and future efforts should focus on making this a part of the conversation among suppliers.
YES, it is an integral part of our procurement process from the start
YES, but only where the contract risk is deemed high
YES, but after the purchase decisions have essentially been taken
NO
29%
29%15%
27%
29
Section 3 Retail Continuity and Resilience Governance
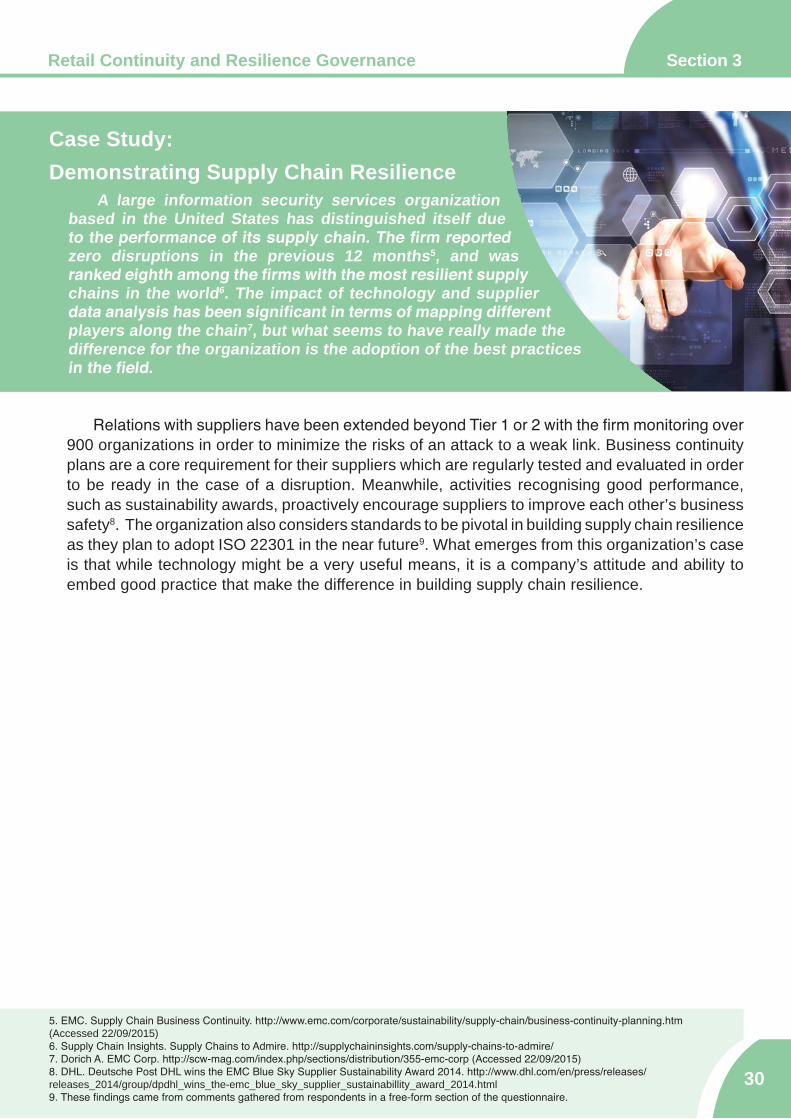
Relations with suppliers have been extended beyond Tier 1 or 2 with the firm monitoring over 900 organizations in order to minimize the risks of an attack to a weak link. Business continuity plans are a core requirement for their suppliers which are regularly tested and evaluated in order to be ready in the case of a disruption. Meanwhile, activities recognising good performance, such as sustainability awards, proactively encourage suppliers to improve each other’s business safety8. The organization also considers standards to be pivotal in building supply chain resilience as they plan to adopt ISO 22301 in the near future9. What emerges from this organization’s case is that while technology might be a very useful means, it is a company’s attitude and ability to embed good practice that make the difference in building supply chain resilience.
Case Study: Demonstrating Supply Chain Resilience
A large information security services organization based in the United States has distinguished itself due to the performance of its supply chain. The firm reported zero disruptions in the previous 12 months5, and was ranked eighth among the firms with the most resilient supply chains in the world6. The impact of technology and supplier data analysis has been significant in terms of mapping different players along the chain7, but what seems to have really made the difference for the organization is the adoption of the best practices in the field.
30
Retail Continuity and Resilience Governance Section 3
5. EMC. Supply Chain Business Continuity. http://www.emc.com/corporate/sustainability/supply-chain/business-continuity-planning.htm (Accessed 22/09/2015)6. Supply Chain Insights. Supply Chains to Admire. http://supplychaininsights.com/supply-chains-to-admire/7. Dorich A. EMC Corp. http://scw-mag.com/index.php/sections/distribution/355-emc-corp (Accessed 22/09/2015)8. DHL. Deutsche Post DHL wins the EMC Blue Sky Supplier Sustainability Award 2014. http://www.dhl.com/en/press/releases/releases_2014/group/dpdhl_wins_the-emc_blue_sky_supplier_sustainabillity_award_2014.html 9. These findings came from comments gathered from respondents in a free-form section of the questionnaire.

4 | Conclusion
ConclusionIn its seven editions, the BCI Supply Chain Resilience
Report has tracked the origins, causes and impacts of supply chain disruption. This report also demonstrates the integral role of supply chains in organizational resilience. Benchmarking supply chain behaviours is a crucial first step for organizations in determining the fitness for purpose of their BC arrangements and introducing further improvements that impact resilience. The following summarise a few of the insights uncovered in this year’s research.
1 The reliance on technology in managing complex, global supply chains has influenced its overall risk profile as shown by growing evidence of non-physical causes of disruption.
Unplanned IT and telecommunications outages, cyber attacks and data breach remain the top causes of disruption and is seen as significant risks ahead. Incidents of non-physical disruptions continue to grow which should prompt organizations to assess their resilience in this space.
2 Implementing supply chain BC enables good practice and creates a virtuous cycle of behaviours leading to greater resilience.
Findings reveal that organizations with supply chain BC are more likely to engage in behaviours that increase visibility, mitigate the impact of losses, and exhibit top management commitment essential to resilience. This underscores the value of BC as an important ‘protective discipline’ and its contribution towards supply chain resilience.
3 Leadership is an essential driver of supply chain resilience.
Results show that high levels of top management commitment to supply chain resilience are more likely to encourage good practice across the organization. It is a key challenge for BC and supply chain practitioners to engage their top management in order to leverage their efforts in building supply chain resilience.
4 Supply chain visibility remains one of the biggest challenges to resilience.
The data shows the complex nature of supply chains with many organizations relying on a growing number of key suppliers. Disruptions continue to occur at lower levels which may induce severe knock-on effects to organizations at the end of the supply chains. It is therefore important for organizations to focus on reporting disruption firm-wide and increase supplier visibility.
32
Section 4Conclusion
Organizations cite the benefits of supply chain resilience which include raised staff morale, greater preparedness against disruption, improved corporate reputation and lower recovery costs. These ultimately benefit an organization’s bottom line which make it imperative for practitioners to engage their top management and demonstrate how improved supply chain resilience can increase competitive advantage. As such, studies like these are important tools in making that business case and leading organizations towards greater investment in this area.
33
Section 4 Conclusion
5 Assurance and validation are integral parts of supply chain BC.
Organizations are encouraged to close gaps in supply chain resilience by engaging their suppliers. There should be a clear effort in maintaining a robust system of assurance and ensuring that suppliers’ BC arrangements are validated. BC must be a part of the conversation between organizations and its suppliers from tender onwards, building it as a key part of the business relationship.

Annex
Notable distinctions for supply chain respondents include the following:
• Respondents have identified cyber-attacks and data breach (56%) jointly as the second main cause of disruption, while last year they ranked respectively seventh (24%) and eighth (22%). IT and telecom outages are still, for the fourth year in a row, the greatest cause of disruption (74%), being also the number one concern in the next 12 months (57%). Horizon scanning for the next five years, IT and telecom outages drop to number three (38%), as respondents consider cyber-attacks and data breach (46%) and new laws and regulations (39%) as the top two threats.
• Disruptions have led to both financial and reputation costs in 2015, as loss of productivity heads the chart (58%), followed by customer complaints (40%). These might suggest a connection with other consequences of disruption such as loss of revenue (38%) and damages to the brand’s reputation (27%). Furthermore, increased stakeholder concern (29%) and regulatory scrutiny (14%) are both present in the top ten. What these data might suggest is a chain of consequences that looks like a downward spiral, causing serious harm unless prevented in time.
• Only 20% of the respondents had insured more than 50% of their losses. In particular, 57% of the respondents had insured none of their supply chain losses.
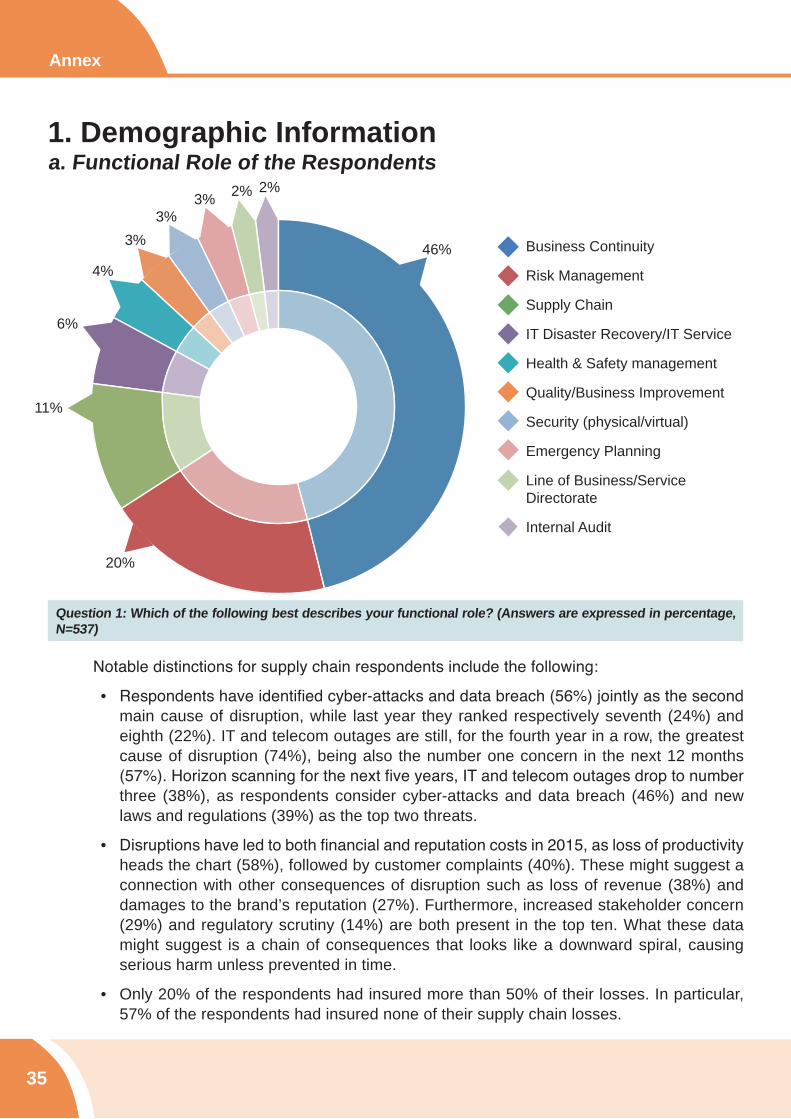
1. Demographic Informationa. Functional Role of the Respondents
Question 1: Which of the following best describes your functional role? (Answers are expressed in percentage, N=537)
Business Continuity
Risk Management
Supply Chain
IT Disaster Recovery/IT Service
Health & Safety management
Quality/Business Improvement
Security (physical/virtual)
Emergency Planning
Line of Business/Service Directorate
Internal Audit
46%
20%
11%
6%
4%
3%3%
3% 2% 2%
35
Annex

• A vast majority of large enterprises tend to both have their own BC arrangements in place (74%) and to ask their suppliers about them (66%). Differently, SMEs seem to follow a different trend, as slightly more than half of them (54%) have adopted BC measures for their supply chains and even fewer (45%) ask their suppliers whether they do.
• More than half (56%) of the respondents have not validated their BC plans with their key suppliers, with over a third (39%) of them having to provide BC insurances to their partners only rarely or not at all. Furthermore, BC would often be excluded during contractual discussions (27%) or be considered only if the risk is deemed high enough (30%).
b. Industry SectorThere were 537 respondents working in 14 SIC industry sectors.
Question 2: Please indicate the primary activity of your organization using the SIC 2007 categories (Answers are expressed in percentage, N=537).
Financial & Insurance Services
Professional Services
Manufacturing
IT & Communications
Engineering & Construction
Public Administration & Defence (e.g. local/municipal or central government, emergency services)
Transport & Storage
Retail & Wholesale
Energy & Utility Services
Health & Social Care
Education
Media & Entertainment
Support Services
Agriculture, Forestry & Fishing
Mining & Quarrying
24%
16%
12%11%
8%
7%
5%
5%
4%
4%2% 1% 1%
0%
Annex
36

37
Annex Annex
c. Geographical BaseRespondents were based in 67 countries and the following data summarizes the responses per region.

Annex Annex
38

39
Annex
d. Number of employees
Question 4. Approximately how many employees work at your organization? (Answers are expressed in percentage, N=537)
e. Approximate Annual Revenues
Question 5. If you are a working in a private sector organization, please let us know the approximate annual revenues of your business (Answers are expressed in percentage, N=537)
Less than €1 million
€1-10 million
€11-100 million
€101-500 million
€501 million - €1 billion
€1-10 billion
€11-50 billion
Greater than €50 billion
I don’t know
13%
10%
14%
12%
5%
12%
5%
5%
24%
0-250
251-500
501-1,000
1,001-5,000
5,001-10,000
10,001-50,000
50,001-100,000
Greater than 100,000
29%
12%
20%
7%
9%
14%
5%4%

Annex
40
2. Causes Of Disruptiona. by Region/Country
Rank North America Central & Latin America Europe MENA
1 Adverse weather (35%) Transport network disruption (60%) IT/Telecom outage (63%) Loss of talent/skills (48%)
2 IT/Telecom outage (34%) IT/Telecom outage (55%) Cyber attack (40%) Fire (45%)
3 Transport network disruption (25%) Fire (55%) Loss of talent/skills (37%) IT/Telecom outage (41%)
4 Outsourcer failure (24%) New laws & regulations (50%) Adverse weather (35%) Adverse weather (38%)
5 Loss of talent/skills (24%) Cyber attack (50%) New laws and regulations (34%)
Health & Safety Incident (38%)
Rank Asia Sub-Saharan Africa Oceania UK
1 IT/Telecom outage (45%) IT/Telecom outage (53%) IT/Telecom outage (31%) IT/Telecom outage (65%)
2 Adverse weather (42%) Energy scarcity (53%) Adverse weather (31%) Adverse weather (43%)
3 Transport network disruption (42%)
New laws or regulations (47%) Loss of talent/skills (21%) Loss of talent/skills (42%)
4 Cyber attack (42%) Loss of talent/skills (41%) Cyber attack & data breach (16%)
Cyber attack & data breach (37%)
5 Business ethics incident (39%)
Currency exchange rate volatility (41%) Outsourcer failure (10%) New laws or regulations
(33%)
Rank US Canada Australia Qatar
1 Adverse weather (36%) IT/Telecom outage (44%) IT/Telecom outage (29%) IT/Telecom outage (38%)
2 IT/Telecom outage (32%) Adverse weather (25%) Adverse weather (29%) Adverse weather (38%)
3 Outsourcer failure (26%) Fire (19%) Loss of talent/skills (18%) Loss of talent/skills (38%)
4 Transport network disruption (26%) Loss of talent/skills (19%) Human illness (18%) Outsourcer failure (38%)
5 Product quality incident (25%)
Transport network disruption (19%) Cyber-attack (18%) Civil unrest/conflict (31%)

41
Annex
b. by Industry Sector
c. by Size of Business
Rank Financial & Insurance Service Health & Social Care Public Administration
& Defence Manufacturing
1 IT/Telecom outage (60%) Loss of talent (53%) IT/Telecom outage (53%) Adverse weather (37%)
2 Cyber-attack (33%) Health & Safety incident (27%) Loss of talent/skills (46%) Transport network
disruption (32%)
3 Loss of talent/skills (29%) IT/Telecom outage (20%) Adverse weather (7%) IT/Telecom outage (30%)
4 Outsourcer failure (29%) Product quality incident (20%)
Transport network disruption (7%)
Product quality incident (25%)
5 New laws or regulations (28%) Adverse weather (20%) New laws or regulations
(7%)New laws or regulations
(23%)
Rank Retail & Wholesale Engineering & Construction Professional Services
1 IT/Telecom outage (48%) Product quality incident (58%) IT/Telecom outage (52%)
2 Adverse weather (48%) Adverse weather (50%) Cyber attack (43%)
3 Cyber attack (43%) Loss of talent skills (50%) Loss of talent/skills (38%)
4 Product quality incident (38%) New laws or regulations (46%) Transport network disruption (36%)
5 Currency exchange rate volatility (38%) Environmental incident (37%) New laws or regulations (36%)
Rank IT & Communications Transport & Storage Energy & Utility
1 IT/Telecom outage (55%) Adverse weather (60%) Outsourcer failure (44%)
2 Adverse weather (37%) IT/Telecom outage (50%) Product quality incident (44%)
3 Transport network disruption (37%) Loss of talent/skills (40%) Health & Safety incident (44%)
4 Cyber attack (37%) New laws or regulations (40%) Adverse weather (37%)
5 Industrial dispute (32%) Outsourcer failure (35%) Environmental incident (37%)
Rank SMEs Large Businesses
1 IT/Telecom outage (43%) IT/Telecom/outage (50%)
2 Loss of talent/skills (38%) Adverse weather (37%)
3 Transport network disruption (33%) New laws or regulations (31%)
4 New laws or regulations (31%) Loss of talent/skills (31%)
5 Outsourcer failure (28%) Cyber attack (31%)

AcknowledgementsThe BCI thanks the Chartered Institute for Purchasing and Supply (CIPS) for promoting the
2015 Supply Chain Resilience Survey.
We would also like to thank Zurich Insurance for supporting this research for the seventh year running.
We also acknowledge the support given by the following individuals during the survey fieldwork: Nick Wildgoose and Luke Mundo (Zurich Insurance), and Kuniyuki Tashiro MBCI (Business Continuity Institute). Andrew Scott CBCI (BCI Senior Communications Manager) and Anne Greenish (BCI Editorial Manager) reviewed this report.
About the AuthorsPatrick Alcantara DBCI (BCI Senior Research Associate) wrote this
report. He is a senior research practitioner with extensive publication, project management and public speaking experience. He has delivered research projects for organizations such as Zurich, BSI and the UK Department of Business Innovation & Skills. He is also part of the Editorial Board of the international, peer-reviewed Journal of Business Continuity & Emergency Planning. He obtained a Diploma in Business Continuity Management from Bucks New University and was awarded a Distinction for a Masters by the Institute of Education (now University College London) and Deusto University. He can be contacted at [email protected].
Gianluca Riglietti wrote the Annex and case studies. He has also performed additional research for this report. He is a Research Assistant for the BCI. He recently finished his MA in Geopolitics, Territory and Security from King’s College London. His previous professional experience includes working for the Italian presidency of the Council of Ministers in the European Union. He can be contacted at [email protected].
About the BCIFounded in 1994 with the aim of promoting a more resilient
world, the Business Continuity Institute (BCI) has established itself as the world’s leading Institute for business continuity and resilience. The BCI has become the membership and certifying organization of choice for business continuity and resilience professionals globally with over 8,000 members in more than 100 countries, working in an estimated 3,000 organizations in the private, public and third sectors.
The vast experience of the Institute’s broad membership and partner network is built into its world class education, continuing professional development and networking activities. Every year, more than 1,500 people choose BCI training, with options ranging from short awareness raising tools to a full academic qualification, available online and in a classroom. The Institute stands for excellence in the resilience profession and its globally recognised Certified grades provide assurance of technical and professional competency. The BCI offers a wide range of resources for professionals seeking to raise their organization’s level of resilience, and its extensive thought leadership and research programme helps drive the industry forward. With approximately 120 Partners worldwide, the BCI Partnership offers organizations the opportunity to work with the BCI in promoting best practice in business continuity and resilience.
The BCI welcomes everyone with an interest in building resilient organizations from newcomers, experienced professionals and organizations. Further information about the BCI is available at www.thebci.org.
Contact the BCIAndrew Scott
Senior Communications Manager
10-11 Southview ParkMarsack Street
Caversham RG4 5AFUnited Kingdom
+44 (0) 118 947 8215www.thebci.org

About ZurichZurich is a thought leader in supply chain risk management.
It has developed supply chain risk assessment tools and an innovative and award winning supply chain insurance product. The company has extensive experience of working with clients to help them make their supply chains more resilient.
Zurich Insurance Group (Zurich) is a leading multi‐line insurance provider with a global network of subsidiaries and offices in Europe, North America, Latin America, Asia‐Pacific and the Middle East as well as other markets. It offers a wide range of general insurance and life insurance products and services for individuals, small businesses, mid‐sized and large companies as well as multinational corporations. Zurich employs about 60,000 people serving customers in more than 170 countries. Founded in 1872, the Group is headquartered in Zurich, Switzerland. Zurich Insurance Company Ltd (ZURN) is listed on the SIX Swiss Exchange and has a level I American Depositary Receipt program (ZFSVY) which is traded over‐the‐counter on OTCQX. For further information about Zurich, go to: www.zurich.com.
Contact the BCI
Nick Wildgoose Global Supply Chain
Product Leader
Zurich Global CorporateLondon Underwriting Centre
3 Minster Court, Mincing LaneLondon EC3R 7DD
United Kingdom
+44 (0) 20 7648 [email protected]


10-11 Southview ParkMarsack StreetCavershamRG4 5AFUnited Kingdom
+44 (0)118 947 8215www.thebci.org
Correct as of November 2015