business cycles and their impact on the south african economy · pdf filebusiness cycles and...
TRANSCRIPT
Business Cycles and Their Impact
on the South African Economy
Quarterly Bulletin – October to December 2012

Executive Summary
Business cycles are a part of the global and national economies. They are the pattern of
expansion and contraction which occurs around the overall trend of aggregate economic
activity. They occur because of, usually unexpected, positive or negative events in an
economy, which may cause unemployment rates to rise or fall as a result of increased or
reduced economic activity. In recent years, the business cycle of the world suffered the
largest downturn since the Great Depression. This downturn resulted from the global
financial crisis during 2008 which was followed by the Euro-debt crises. Business cycles
affect every country and are thus important for all to understand. Gross Domestic
Product is used as a business cycle indicator because the cycle is related to aggregate
economic activities. Business cycles are monitored and predicted with the use of
composite indicators, such as those by the South African Reserve Bank. The components
of the composite leading indicator include the average number of hours worked per
factory worker in the manufacturing sub-sector and the index of the prices of all classes
of shares traded on the JSE. The electricity capacity and the skills shortage are a few of
the domestic factors which have the capability to cause business cycles.
Governments have an important role to play in business cycles as seen in the example of
poor management by the previous Greek government contributing to that country’s
economic downturn and the prudent management of the South African government
reducing the domestic impact of the global recession. The role of government can
include counter-cyclical policies to offset the impact of business cycles. The South African
government had a budget surplus of 0.7 percent of GDP in 2007, due to its saving which
was intended as a counter-cyclical policy. This enabled it to increase spending to offset
the global recession of 2008 without incurring a crippling budget deficit. Projections of
the South African business cycle in the near-future are provided for.

List of Abbreviations
BER Bureau for Economic Research
GDP Gross Domestic Product
GWH Giga-watt Hours
HSRC Human Sciences Research Council
ILO International Labour Organisation
IMF International Monetary Fund
JSE Johannesburg Stock Exchange
QE Quantitative Easing
R South African Rands
Repo rate Repurchase rate
S&P Standard & Poor’s
SARB South African Reserve Bank
Stats SA Statistics South Africa
UIF Unemployment Insurance Fund
US$ United States Dollar
USA United States of America
WEO World Economic Outlook
1. Introduction
2. General Theory
2.1. What is a Business Cycle?
2.2. A Brief History of Business Cycle Theory
3. Global Business Cycles
3.1. The Great Depression
3.1.1. Response by the USA Government
3.2. The Financial Crisis
3.2.1. Response by Governments
3.3. The Euro-Area Debt Crises
3.3.1. Response by Governments
4. Business Cycles in South Africa
4.1. Critical Analysis
4.2. External Factors
4.2.1. International Trade
4.2.2. Investor Confidence
4.3 Domestic Factors
4.3.1. Electricity Capacity
4.3.2. The Skills Shortage
4.3.3. Labour Unrest
5. The Role of Government
6. Projections
7. Conclusion
8. References

1. Introduction
Within the generally upward trend of economic growth, are the semi-regular upward and
downward business cycle movements that can define anywhere from two years to a
decade as being prosperous or poverty-stricken. These cycles are amongst the most
distinctive elements of the national and the global economy. A business cycle contraction
or expansion is by definition wide-spread across the economy and it thus impacts every
economic agent within its area of effect. In particular, the increasingly globalised world
economy of modern times often results in national business cycles of major economies
spreading beyond their borders. Therefore, individuals, firms and governments should
also pay particular attention to not only their own business cycles but also to those of
other countries.
This document broadly considers business cycles to analyse their nature. It begins with
the general economic theory around business cycles to provide grounding in the basics
and provide context for the rest of the document. Several well-known examples of global
business cycles and those in major economies are then evaluated before a more detailed
examination of business cycles in South Africa. This document also reviews the role of
government during business cycles and then considers several projections of the future
movements of the South African business cycle.
2. General Theory
In order to properly discuss business cycles, it is necessary to define them and provide a
brief grounding on the existing economic theory which surrounds them. This section
provides more information on what a business cycle is and gives a brief history of
business cycle theory.
2.1. What is a Business Cycle?
Mohr (2005) defines a business cycle as the pattern of expansion and contraction which
aggregate economic activity, measured as real Gross Domestic Product (GDP), displays
around its overall trend.
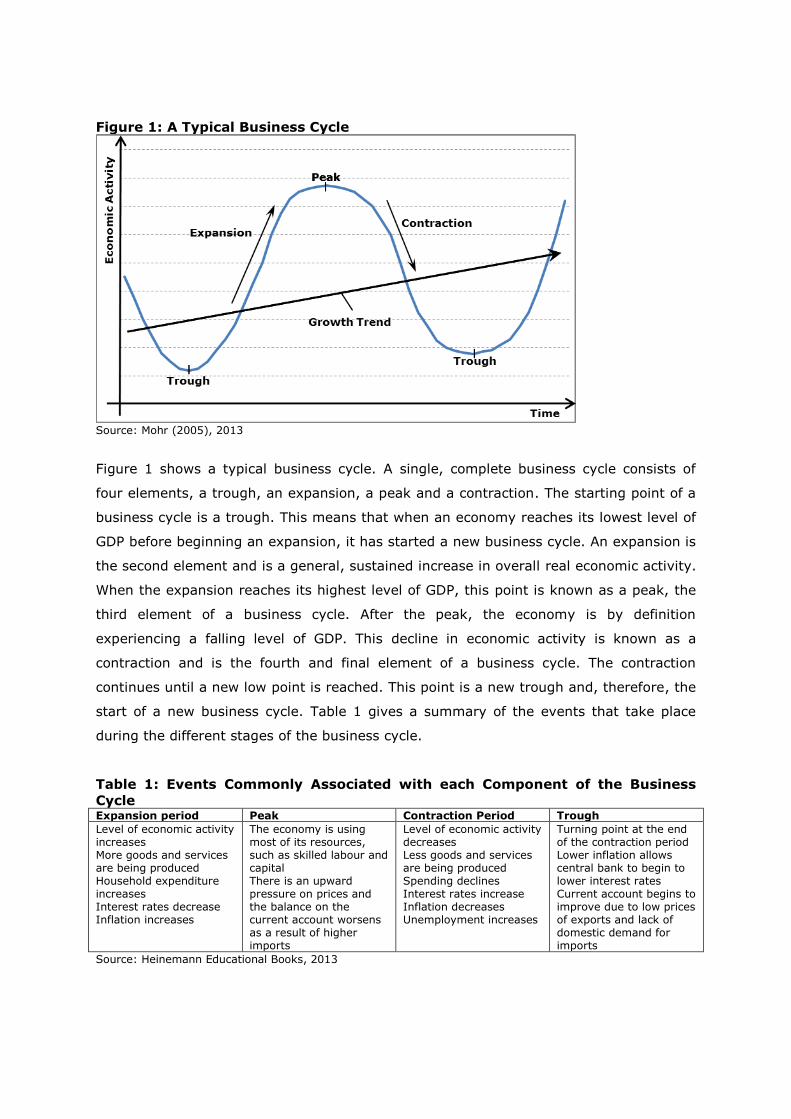
Figure 1: A Typical Business Cycle
Source: Mohr (2005), 2013
Figure 1 shows a typical business cycle. A single, complete business cycle consists of
four elements, a trough, an expansion, a peak and a contraction. The starting point of a
business cycle is a trough. This means that when an economy reaches its lowest level of
GDP before beginning an expansion, it has started a new business cycle. An expansion is
the second element and is a general, sustained increase in overall real economic activity.
When the expansion reaches its highest level of GDP, this point is known as a peak, the
third element of a business cycle. After the peak, the economy is by definition
experiencing a falling level of GDP. This decline in economic activity is known as a
contraction and is the fourth and final element of a business cycle. The contraction
continues until a new low point is reached. This point is a new trough and, therefore, the
start of a new business cycle. Table 1 gives a summary of the events that take place
during the different stages of the business cycle.
Table 1: Events Commonly Associated with each Component of the Business
Cycle Expansion period Peak Contraction Period Trough
Level of economic activity increases More goods and services are being produced Household expenditure increases Interest rates decrease Inflation increases
The economy is using most of its resources, such as skilled labour and capital There is an upward pressure on prices and the balance on the current account worsens as a result of higher imports
Level of economic activity decreases Less goods and services are being produced Spending declines Interest rates increase Inflation decreases Unemployment increases
Turning point at the end of the contraction period Lower inflation allows central bank to begin to lower interest rates Current account begins to improve due to low prices of exports and lack of domestic demand for imports
Source: Heinemann Educational Books, 2013

It is necessary to remove seasonality from the data when examining any business cycle.
The upswing experienced in most economies over the festive season could, for example,
otherwise be potentially misinterpreted as unusually short and regular business cycles.
Genuine business cycles almost always occur over the course of more than a single year.
Figure 2: GDP Seasonally Adjusted and Unadjusted, SA, 2003Q1-2012Q4
Source: SARB, 2013
Figure 2 shows the GDP of South Africa, both adjusted and unadjusted, from the first
quarter of 2003 to the fourth quarter of 2012. Visible in the unadjusted data are small
cycles which repeat themselves every year, peaking in the final quarter of a year and
falling again at the start of the following year. These little cycles have been removed
from the seasonally adjusted data, making it easier to see any larger, multi-year,
business cycles which may be present.
2.2. A Brief Review of Business Cycle Literature
Economists of the classical school asserted that economies were naturally stable and
that any major fluctuations were caused by inept government intervention. This theory
does not, however, account satisfactorily for the regularity of business cycles,
particularly since significant government interventions in an economy often lag the
business cycle rather than leading it. Classical economists respond to this criticism by
claiming that, due to the lag between the implementation of government policy and its
full impact on the economy, the response to the previous cycle is the cause of the
following one.

The first person to theorise about the existence of business cycles was Karl Marx. He did
not, however, use the term himself. Business cycles were not a recognised phenomenon
during Marx’s life. He theorised, however, that the accumulation of labour-replacing
capital would cause fluctuations in the levels of demand and output in a capitalist
economy. As profits fall due to competition, capitalists buy machines and dismiss
workers to try and reduce costs, but a belief in the labour-theory of value would suggest
that this is counter-productive because labour is the only source of profit. This self-
causing loss of profits and employment was the downswing of Marx’s proto-business
cycle. The cycle would then begin another expansion because unemployment reduced
the cost of labour and bankruptcy allowed machines to be bought for less than their
labour-equivalent-value. These two factors would allow profits to be made by firms once
more and this in turn would cause labour to be rehired. At least until the next inevitable
crisis. These recurrent crises would later be known as the contraction phases of business
cycles.
John Maynard Keynes was an economist who is best remembered for the prominence his
work gained during the Great Depression. According to Grant and Brue (2007), Keynes
attributed fluctuations in the economy to fluctuations in investment spending because he
believed that the impacts on overall economic activity of changes in investment were
larger than the initial changes. In contrast to the classical school, Keynesian economists
recommend that governments institute counter-cyclical policies to moderate the
business cycle. Keynesians advocate that governments take expansionary action during
recessions, such as raising their spending or increasing the money supply, in an attempt
to begin a positive multiplier effect in their economy. Contractionary action during
excessively inflationary upswings is also recommended, such as raising taxes or reducing
the money supply, to counteract overspending.
Modern economists still hold to several of Keynes’ assertions, though by no means all.
They generally do not, for example, share his belief that even the most wasteful
spending builds the economy. Also, economists now attempt to predict and chart
business cycles through the use of leading, coincident and lagging indicators.
Table 2: Examples of Leading, Coincident and Lagging Indicators Leading Coincident Lagging
1. M1 money supply1 2. Number of building plans
approved 3. Number of job advertisements
1. Total wholesale, retail & new vehicle sales
2. Utilisation of production capacity in manufacturing
1. Ratio of inventories to sales in the manufacturing & trade sectors
2. Predominant prime overdraft rate of banks
1 According to Chetty, Greyling, Schoeman, Van Zyl and Wentzel (2005), the M1 money supply consists of the coins and banknotes in circulation added to all deposits in on-demand bank accounts held by the private sector.

Source: National Bureau of Economic Research. 1992
Table 2 shows several examples of leading, coincident and lagging indicators. According
to Zarnowitz (1992), leading indicators are time-series which tend to reach turning
points in their own cycles, before the rest of the economy does so. Leading indicators are
used in attempts to predict business cycles. Coincident indicators tend to reach their
turning points at approximately the same time as the overall economy. Significant
movements in the coincident indicators can confirm that the next stage of a business
cycle has been reached. Lagging indicators are those which tend to have turning points
later than the rest of the economy.
Figure 3: Theoretical Relationship between GDP and a Leading Indicator
Source: Idealised business cycle and indicator. Gauteng Treasury Calculations, 2013
Figure 3 shows an example of the ideal relationship between GDP and a leading
indicator. The turning points, both peaks and troughs, of a leading indicator preferably
occur noticeably prior to those of the GDP series. Figure 3 illustrates a theoretical
example of a leading indicator which always turns before GDP. The reality is almost
always less clear, with false indications and late turns reducing reliability to a greater or
lesser degree. Furthermore, even an indicator as reliable as the one modelled above
would still have its usefulness determined by how far in advance of GDP its turning
points are recorded.
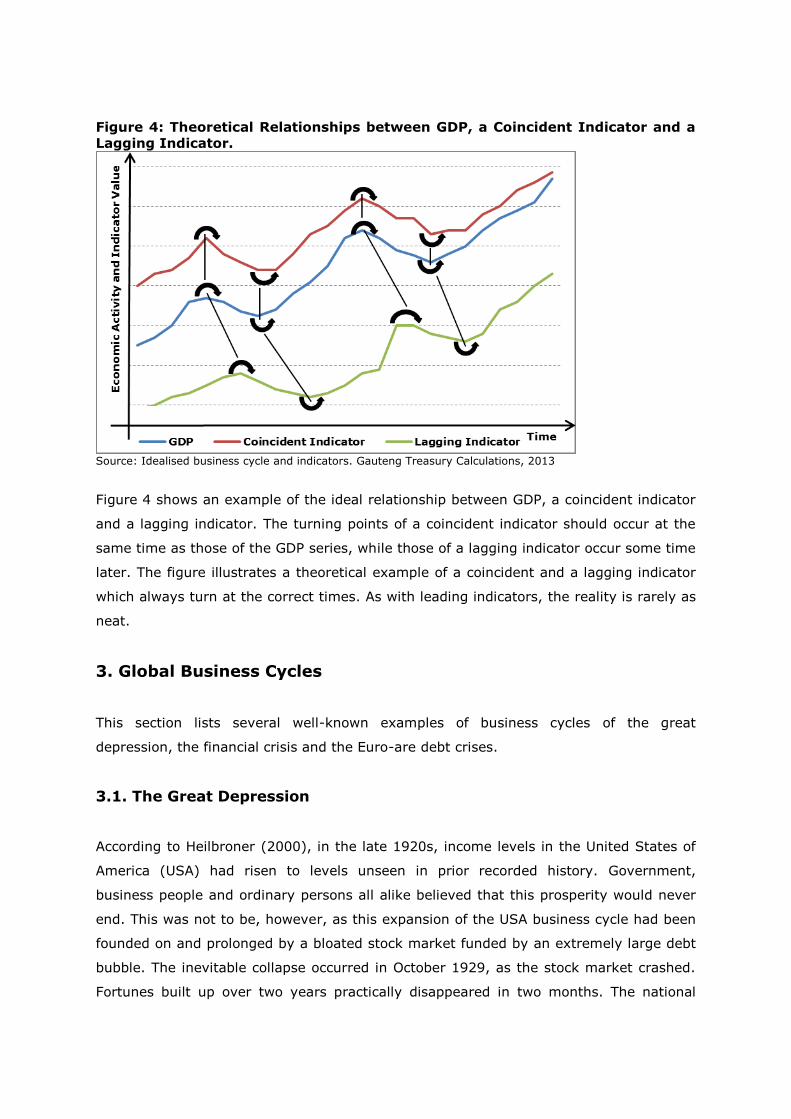
Figure 4: Theoretical Relationships between GDP, a Coincident Indicator and a
Lagging Indicator.
Source: Idealised business cycle and indicators. Gauteng Treasury Calculations, 2013
Figure 4 shows an example of the ideal relationship between GDP, a coincident indicator
and a lagging indicator. The turning points of a coincident indicator should occur at the
same time as those of the GDP series, while those of a lagging indicator occur some time
later. The figure illustrates a theoretical example of a coincident and a lagging indicator
which always turn at the correct times. As with leading indicators, the reality is rarely as
neat.
3. Global Business Cycles
This section lists several well-known examples of business cycles of the great
depression, the financial crisis and the Euro-are debt crises.
3.1. The Great Depression
According to Heilbroner (2000), in the late 1920s, income levels in the United States of
America (USA) had risen to levels unseen in prior recorded history. Government,
business people and ordinary persons all alike believed that this prosperity would never
end. This was not to be, however, as this expansion of the USA business cycle had been
founded on and prolonged by a bloated stock market funded by an extremely large debt
bubble. The inevitable collapse occurred in October 1929, as the stock market crashed.
Fortunes built up over two years practically disappeared in two months. The national
income of the USA fell by US$12 billion to US$75 billion between 1929 and 1930. It
continued to decline, reaching US$39 billion by 1933. Unemployment rose from
approximately 2 million persons in 1929 to a high of 14 million during this Great
Depression. As a rate, unemployment peaked at 24.9 percent in 1933, over 20
percentage points higher than the 4.4 percent recorded in 1928.
3.1.1. Response by the USA Government
In 1934, policy such as President Theodore Roosevelt’s New Deal was implemented by
the government of the USA as part of a plan to increase its spending and offer relief to
those harmed most by the Great Depression. John Keynes published The General Theory
of Employment, Interest and Money in 1935, recommending government spending as a
cure for a contracting economy. Public spending programmes still did not rise to a point
that would spark full employment, however, because there were still many persons in
business and several in government itself who were uncomfortable with the idea of
government taking too large a role in the economy (Heilbroner, 2000). Even so, roads,
dams, housing and other infrastructure began to be built all around the USA, backed by
government expenditure. This stimulus amounted to a yearly increase in government
expenditure from approximately US$10 billion in 1933 to reach the US$15 billion spent
in 1936. The increase proved less than sufficient because private investment recovered
to only two-thirds of its pre-Depression level and, while unemployment did fall, 9 million
persons remained out of work. Full employment in the USA was only attained in 1942,
during World War II, when government expenditure rose to US$103 billion.
3.2. The Financial Crisis
A report published by KPMG in 2009 states that the first event in the series that led to
the financial crisis was the alteration of USA lending policies to allow even Americans
with no income and no collateral to be granted mortgage loans. The interest rates
charged on these loans were below the prime rate and they were thus known as sub-
prime. It was a popular practice at the time to group risky assets together into packages
because it was believed that the risk of the entire package failing was lower than that of
any individual part. This practice is still popular today, because the essential theory is
sound. Packaging sub-prime loans into these groups was an error, however, as the
individual loans proved to be more similar to one another than anticipated and risk was
thus not diversified in these groups. This error was compounded by selling on these
grouped sub-prime loans to financial institutions from around the globe. Banks in South
Africa were not able to purchase these grouped loans due to tight banking regulations

and the implementation of the National Credit Act No. 34 of 2005 (NCA). The NCA was
prudent financial legislation put in place by government shortly before the crisis, though
for different reasons.
After the sub-prime loans had been traded across most of the world, global demand
entered a growth phase and prices therefore began to increase. Throughout the world,
inflation started to rise, reducing the disposable income of households. This naturally
included those USA households which had been granted sub-prime loans. Central banks
around the world reacted to this inflation by raising interest rates. This further eroded
disposable incomes and made loans, including sub-prime loans, more difficult to repay
than they had been originally. These factors led to many of the sub-prime borrowers,
most of whom were not the best of credit risks to begin with, to default on their loans.
The sub-prime borrowers had similar financial situations, thus if one borrower in a
package defaulted, it was likely that many other borrowers in the group would default as
well, because the same factors which led to that default would apply to most of the other
borrowers in that package. The overall loan-package would then collapse. As investors
saw the damage being done to financial markets by the loan defaults, they began to
disinvest and several bank runs2 occurred, worsening the problem and creating a full-
blown global financial crisis. This financial crisis then translated into the real economy
and started a global recession.
According to the IMF (2013), global output growth fell from 2.8 percent in 2008 to
negative 0.6 percent in 2009. The average growth of the advanced economies fell from
0.1 percent to negative 3.5 percent over same period. The growth of the emerging &
developing economies group slowed, 6.1 to 2.7 percent, but did not turn negative.
3.2.1 Response by Governments
Countries, particularly the largest developed economies, responded to the recession by
implementing large stimulus packages and expanding their money supplies through an
unorthodox measure known as quantitative easing.3 Economic growth in the USA, for
example, had already fallen to negative 0.3 percent in 2008, from 1.9 percent in 2007.
The country responded with the US$787 billion American Recovery and Reinvestment
2 According to www.investopedia.com, a run is, “[a] situation in which numerous bank customers try to withdraw their bank deposits simultaneously and the bank's reserves are not sufficient to cover the withdrawals”. 3 Quantitative easing is policy whereby a central bank expands the money supply by buying financial assets with new money. In modern times, this money is typically generated electronically rather than going to the expense of printing it.
Act, which was signed into law in February 2009 and increased to US$840 billion in 2012
funding tax reliefs and investment in infrastructure. The Federal Reserve Bank also
bought over US$1.7 trillion in financial assets from the private sector with newly-created
electronic money. The recession in the USA still deepened in 2009, with negative 3.1
percent GDP growth for the year. By the end of 2010, however, growth had recovered to
2.4 percent.
In South Africa, GDP growth in 2009 contracted by 1.5 percent, after growing by positive
3.5 percent in 2008. In his presentation of the 2009 Medium-Term Budget Policy
Statement, Finance Minister, Honourable Pravin Gordhan stated that government
expenditure would increase by R127 billion despite an estimated R34 billion decrease in
tax revenue. Combined with the financing requirements of state-owned enterprises such
as Eskom, the government borrowing requirement increased to R285 billion in 2009,
from R89 billion in 2008. The response to the recession required that the government
budget balance fall from a 0.7 percent surplus in 2007 to a 5 percent deficit by 2009.
Growth recovered to 3.1 percent in 2010 and prudent fiscal management reduced the
government deficit to 4.8 percent.
3.3. The Euro-Area Debt Crises
The world has been recovering from the 2008 global recession for some time, but more
instabilities have been exposed by the pressure put on countries’ finances. Some of
these instabilities threaten to pull the global economy back down into recession once
more, one such threat being the sovereign debt crises suffered by the Euro-area.
European countries with weaker economies, such as Italy and Greece, took on a great
deal of debt while raising their citizens’ standard of living to match those of more
prosperous Euro-area countries. This debt reduced their ability to respond when they
were struck by the global recession mentioned in section 3.2. The governments of many
other countries were to some extent able to at least offset recessionary pressures. They
did this by increasing government spending in spite of the recession. Governments, such
as several Euro-area members, which had incurred unsustainable levels of debt lacked
the fiscal flexibility to respond effectively. Financial market confidence in the Euro-area
was negatively affected, because investors were concerned that these countries would
default on their debts. Since the banks in the Euro-area held much of the debt of their
governments, they were distrusted as well. As a result, runs began on banks in exposed
countries such as Greece and Portugal. As trust in the region declined, sources of foreign
credit began to dry up.

3.3.1. Response by Governments
Measures began to be put in place to move the region toward recovery, but the austerity
required by these measures sparked protest action. Austerity measures include cutting
public sector salaries and pensions, reducing employment in the public sector and raising
the ratio of taxation to expenditure. The austerity programmes have since been
accompanied by financial relief for Euro-area countries from the European Central Bank,
itself primarily funded by the rich Euro-area countries, such as Germany, which have
largely weathered the storm so far. The linkages between Europe and countries on many
other continents mean that this economic adversity in Europe has influenced the rest of
the world and will continue to do so for some time to come.
4. Business Cycles in South Africa
This section describes the manner in which business cycles are monitored in the country
and then discusses several foreign (external) and domestic (internal) factors which affect
the business cycle.
4.1. Critical Analysis
Amongst its other functions, the mandate of the South African Reserve Bank (SARB) is
its focus on keeping inflation between the target band of 3 to 6 percent. The SARB is,
however, a flexible inflation-targeter4 and thus, when considering its policies, also
considers the deviation of actual output from its potential. As such, the SARB has kept
the repurchase (repo) rate low despite indications that inflation may temporarily rise
above 6 percent in 2013. The Bank also monitors a number of economic indicators,
many of which are relevant to business cycles, and produces publications about South
African business cycles.
4 This information was sourced from Governor Gill Marcus’s speech to the Gordon Institute of Business Science on the 30th of May, 2012.
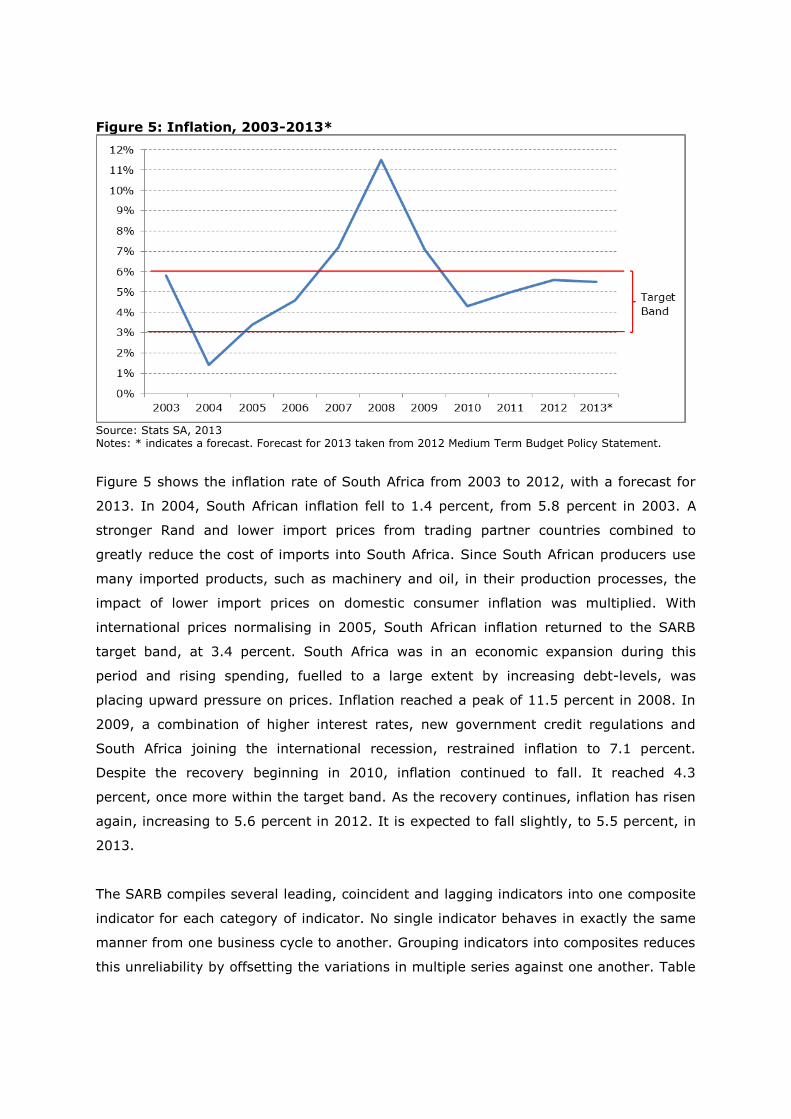
Figure 5: Inflation, 2003-2013*
Source: Stats SA, 2013 Notes: * indicates a forecast. Forecast for 2013 taken from 2012 Medium Term Budget Policy Statement.
Figure 5 shows the inflation rate of South Africa from 2003 to 2012, with a forecast for
2013. In 2004, South African inflation fell to 1.4 percent, from 5.8 percent in 2003. A
stronger Rand and lower import prices from trading partner countries combined to
greatly reduce the cost of imports into South Africa. Since South African producers use
many imported products, such as machinery and oil, in their production processes, the
impact of lower import prices on domestic consumer inflation was multiplied. With
international prices normalising in 2005, South African inflation returned to the SARB
target band, at 3.4 percent. South Africa was in an economic expansion during this
period and rising spending, fuelled to a large extent by increasing debt-levels, was
placing upward pressure on prices. Inflation reached a peak of 11.5 percent in 2008. In
2009, a combination of higher interest rates, new government credit regulations and
South Africa joining the international recession, restrained inflation to 7.1 percent.
Despite the recovery beginning in 2010, inflation continued to fall. It reached 4.3
percent, once more within the target band. As the recovery continues, inflation has risen
again, increasing to 5.6 percent in 2012. It is expected to fall slightly, to 5.5 percent, in
2013.
The SARB compiles several leading, coincident and lagging indicators into one composite
indicator for each category of indicator. No single indicator behaves in exactly the same
manner from one business cycle to another. Grouping indicators into composites reduces
this unreliability by offsetting the variations in multiple series against one another. Table
3 presents the components of the South African Composite Leading Indicator, as an
example.
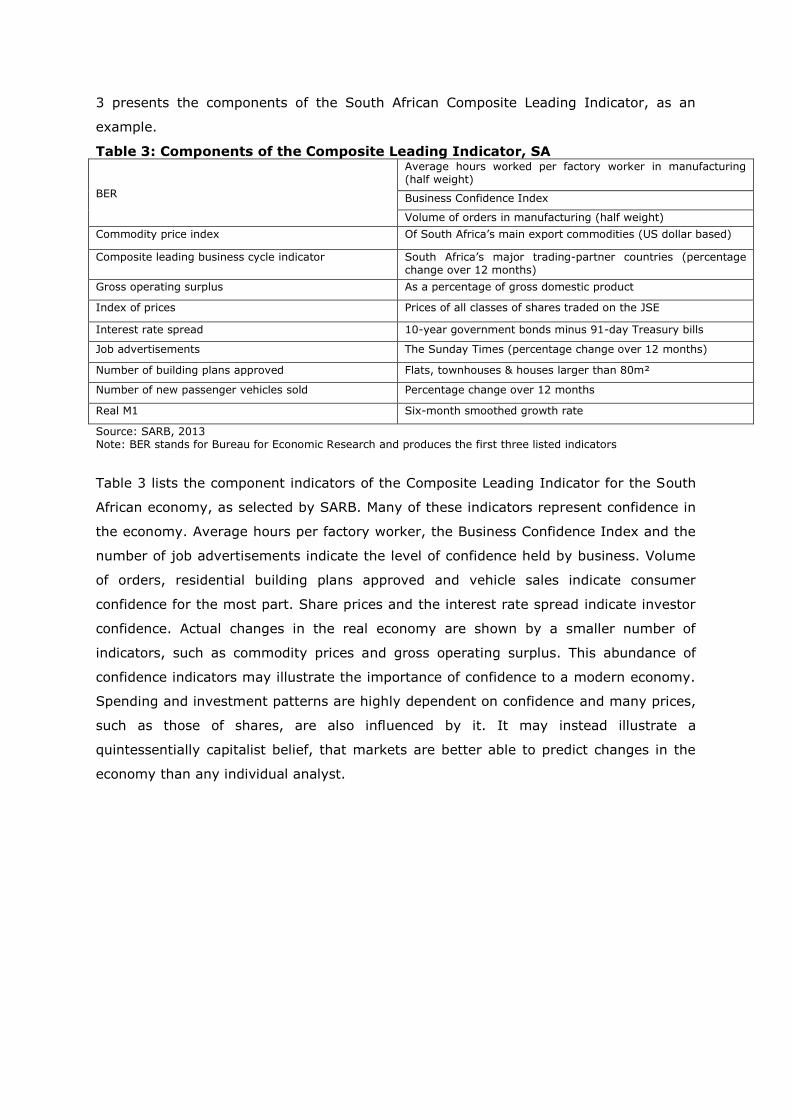
Table 3: Components of the Composite Leading Indicator, SA
BER
Average hours worked per factory worker in manufacturing (half weight)
Business Confidence Index
Volume of orders in manufacturing (half weight)
Commodity price index Of South Africa’s main export commodities (US dollar based)
Composite leading business cycle indicator South Africa’s major trading-partner countries (percentage change over 12 months)
Gross operating surplus As a percentage of gross domestic product
Index of prices Prices of all classes of shares traded on the JSE
Interest rate spread 10-year government bonds minus 91-day Treasury bills
Job advertisements The Sunday Times (percentage change over 12 months)
Number of building plans approved Flats, townhouses & houses larger than 80m²
Number of new passenger vehicles sold Percentage change over 12 months
Real M1 Six-month smoothed growth rate
Source: SARB, 2013 Note: BER stands for Bureau for Economic Research and produces the first three listed indicators
Table 3 lists the component indicators of the Composite Leading Indicator for the South
African economy, as selected by SARB. Many of these indicators represent confidence in
the economy. Average hours per factory worker, the Business Confidence Index and the
number of job advertisements indicate the level of confidence held by business. Volume
of orders, residential building plans approved and vehicle sales indicate consumer
confidence for the most part. Share prices and the interest rate spread indicate investor
confidence. Actual changes in the real economy are shown by a smaller number of
indicators, such as commodity prices and gross operating surplus. This abundance of
confidence indicators may illustrate the importance of confidence to a modern economy.
Spending and investment patterns are highly dependent on confidence and many prices,
such as those of shares, are also influenced by it. It may instead illustrate a
quintessentially capitalist belief, that markets are better able to predict changes in the
economy than any individual analyst.
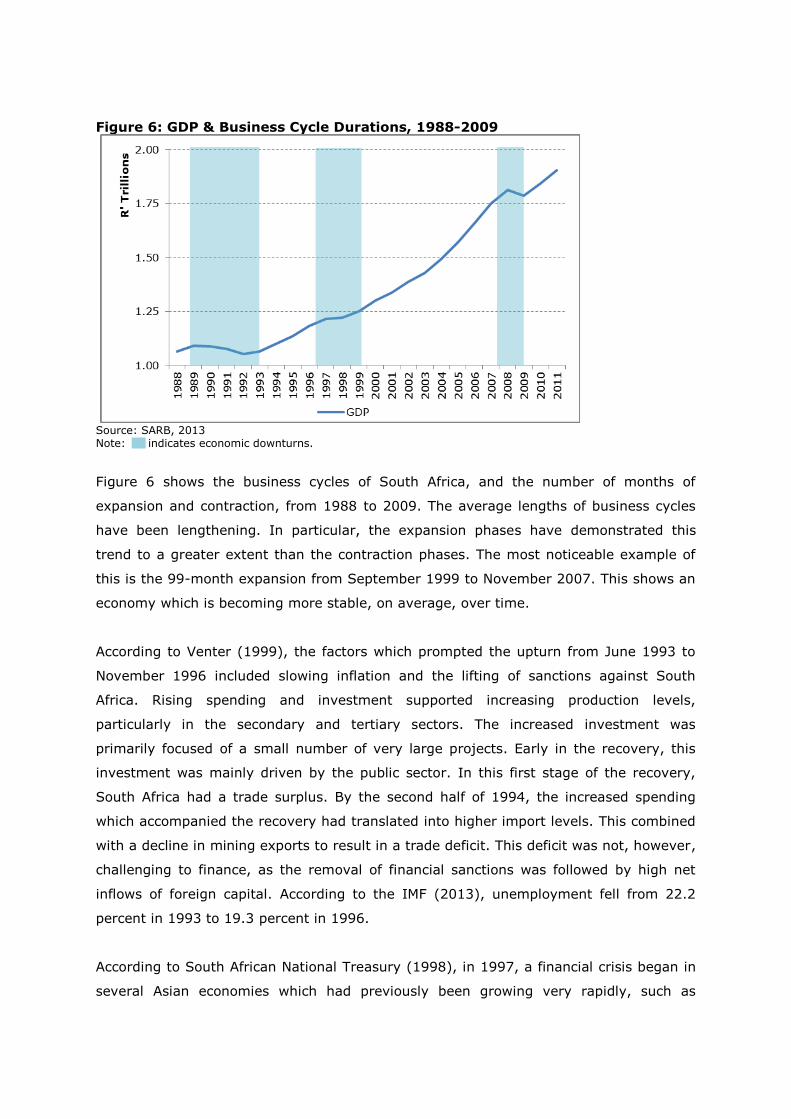
Figure 6: GDP & Business Cycle Durations, 1988-2009
Source: SARB, 2013 Note: indicates economic downturns.
Figure 6 shows the business cycles of South Africa, and the number of months of
expansion and contraction, from 1988 to 2009. The average lengths of business cycles
have been lengthening. In particular, the expansion phases have demonstrated this
trend to a greater extent than the contraction phases. The most noticeable example of
this is the 99-month expansion from September 1999 to November 2007. This shows an
economy which is becoming more stable, on average, over time.
According to Venter (1999), the factors which prompted the upturn from June 1993 to
November 1996 included slowing inflation and the lifting of sanctions against South
Africa. Rising spending and investment supported increasing production levels,
particularly in the secondary and tertiary sectors. The increased investment was
primarily focused of a small number of very large projects. Early in the recovery, this
investment was mainly driven by the public sector. In this first stage of the recovery,
South Africa had a trade surplus. By the second half of 1994, the increased spending
which accompanied the recovery had translated into higher import levels. This combined
with a decline in mining exports to result in a trade deficit. This deficit was not, however,
challenging to finance, as the removal of financial sanctions was followed by high net
inflows of foreign capital. According to the IMF (2013), unemployment fell from 22.2
percent in 1993 to 19.3 percent in 1996.
According to South African National Treasury (1998), in 1997, a financial crisis began in
several Asian economies which had previously been growing very rapidly, such as
Thailand. The growth in these economies had encouraged increases in debt-levels and
asset prices. Much of this debt was in foreign currencies, partly due to confidence
prompted when those governments instituted fixed exchange rate policies. Many of the
investments fuelled by this debt did not perform as well as expected and when asset
prices declined significantly in Thailand it began a chain of asset devaluations, stock
market crashes and currency speculation throughout the previously fast-growing Asian
countries. This pressure was too great for the various governments to maintain their
currency pegs and the resultant currency depreciations amplified the impact on their
economies. South Africa, and many other non-Asian emerging & developing economies,
was also affected by this crisis. The slowdown in the Asian economies was translated
through trade channels to their trading partners, many of which were trading partners of
South Africa as well. Also, market sentiment turned against emerging & developing
economies in general, even those with little or no financial exposure to Asian markets.
Foreign investment was thus withdrawn from South Africa. These pressures caused the
South African economy to grow more slowly until mid-1999.
According to Venter (2009), at 99 consecutive months, the economic expansion from
September 1999 to November 2007 was the longest ever recorded for South Africa. The
economic growth recorded during the first half of this recovery was only moderate and
interspersed with short periods of very low growth. The average growth rate from 1999
to 2003 was 2.7 percent. After an initial decrease from 25.2 percent in 1998 to 23.3
percent in 1999, unemployment returned to an upward trend during the early recovery
and reached a peak of 30.4 percent in 2002. Manufacturing was one of the better
performing sub-sectors during this time, supported by increased demand for South
African exports by the country’s rapidly growing major trading partners. Rising
government and household expenditure also supported the early expansion. During the
second half of this expansion, economic growth was much more rapid, with an average
growth rate of 5.3 percent from 2004 to 2007. The prices of assets and commodities
increased very quickly over this period. Services industries performed very well over this
period, supported by sustained strong growth in expenditure. Domestic expenditure and
continued international demand maintained further manufacturing growth. The
construction sector also benefitted from increased demand for projects of every type.
Unemployment fell from 28 percent in 2003 to 22.2 percent in 2007. However, domestic
demand was becoming increasingly fuelled by debt and household debt levels were
reaching record highs.
When interest rates were raised in response to rising price levels, beginning in mid-
2006, this put the already heavily-indebted South African household under significant

pressure. Not long after this, the first effects of the global financial crisis began to be
felt, as detailed in Section 3.2, and electricity constraints then began to have their
impact in 2008. These factors all contributed to South Africa entering recession in 2009.
Unemployment rose to 24 percent in 2009. The mining and manufacturing sub-sectors
were amongst the hardest hit, due to falling demand for exports by the country’s major
trading partners. Household expenditure fell as well, though government spending rose,
due to government measures to combat the recession.
4.2. External Factors
South Africa has a largely open economy and it is thus closely integrated with that of the
rest of the world. As such, the health of its economy now relies to a significant extent on
the health of its trading partners and on inflows of foreign capital.
4.2.1. International Trade
Figure 7: GDP and Exports, 2004-2011
Source: IHS Global Insight, 2013
Figure 7 shows the GDP of South Africa and the aggregate value of the exports, for the
period from 2004 to 2011. From 2004 to 2008, both GDP and exports were increasing.
In 2008, GDP reached R1,814.5 billion and exports reached R704.3 billion. In 2009,
however, the global recession led to a fall in South Africa’s exports as the country’s
trading partners were no longer able to maintain their previous expenditure levels.
Exports thus fell to R556.4 billion. GDP also fell in 2009, to R1,786.6. The fact that GDP
fell at the same time as exports illustrates the link between South Africa’s economy and
that of the rest of the world. The SARB appears to acknowledge this link because the
leading indicators of the major trading partners of South Africa have been included in the
South African Composite Leading Indicator, as shown in Table 3. This inference is
reinforced by the rise of both GDP and exports in 2010, to R1,838.3 billion and R626.3
billion, respectively.
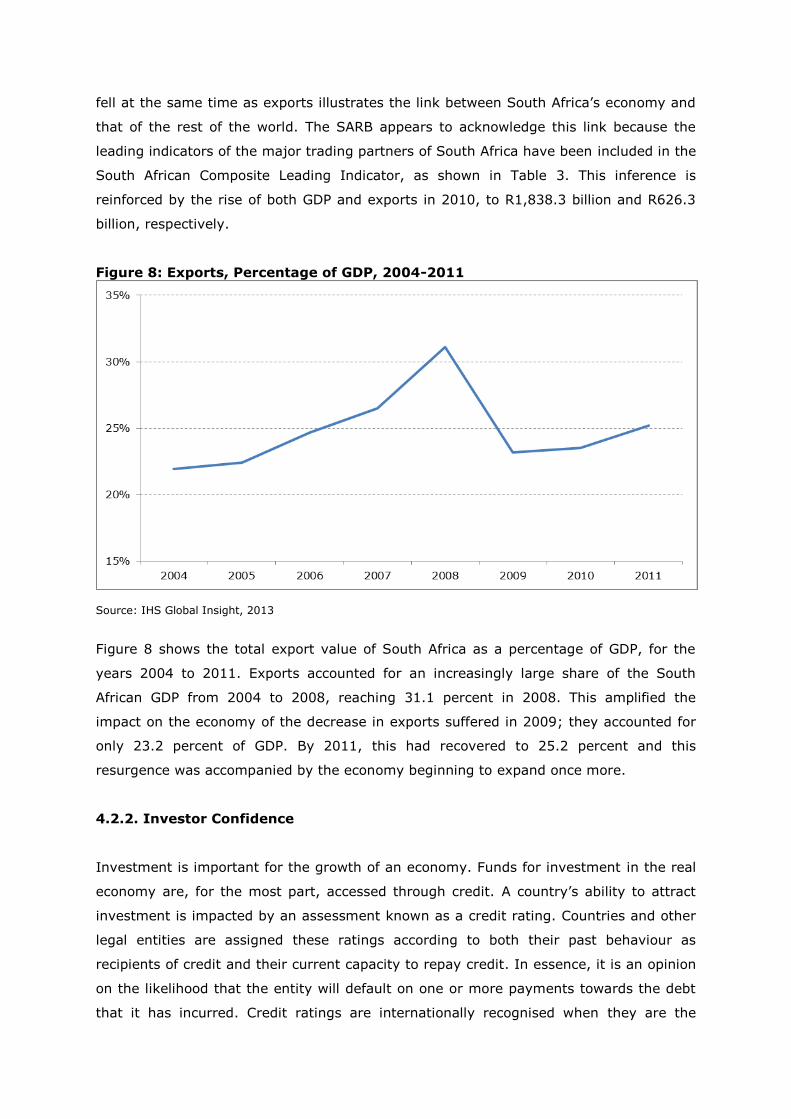
Figure 8: Exports, Percentage of GDP, 2004-2011
Source: IHS Global Insight, 2013
Figure 8 shows the total export value of South Africa as a percentage of GDP, for the
years 2004 to 2011. Exports accounted for an increasingly large share of the South
African GDP from 2004 to 2008, reaching 31.1 percent in 2008. This amplified the
impact on the economy of the decrease in exports suffered in 2009; they accounted for
only 23.2 percent of GDP. By 2011, this had recovered to 25.2 percent and this
resurgence was accompanied by the economy beginning to expand once more.
4.2.2. Investor Confidence
Investment is important for the growth of an economy. Funds for investment in the real
economy are, for the most part, accessed through credit. A country’s ability to attract
investment is impacted by an assessment known as a credit rating. Countries and other
legal entities are assigned these ratings according to both their past behaviour as
recipients of credit and their current capacity to repay credit. In essence, it is an opinion
on the likelihood that the entity will default on one or more payments towards the debt
that it has incurred. Credit ratings are internationally recognised when they are the

formalised opinions of organisations specialising in these assessments of credit
worthiness. Agencies such as Moody’s, Standard & Poor’s (S&P), Morgan Stanley and
Fitch are well-known for credit rating assessments. They are thus trusted to provide
guidance on investment, debt and or debt issuance considerations. Questions can be
raised as to their true trustworthiness, however, as these organisations gave high
ratings to sub-prime loan packages and they are not held directly accountable for any
errors in their ratings. Table 4 presents several of S&P’s brief summary descriptions of
their credit rating symbols.
Table 4: Selected Credit Rating Definitions AAA Extremely strong capacity to meet financial commitments. Highest Rating.
A Strong capacity to meet financial commitments, but somewhat susceptible to adverse economic conditions and changes in circumstances.
BBB Adequate capacity to meet financial commitments, but more subject to adverse economic conditions.
B More vulnerable to adverse business, financial and economic conditions but currently has the capacity to meet financial commitments.
CCC Currently vulnerable and dependent on favourable business, financial and economic conditions to
meet financial commitments.
C Currently highly vulnerable obligations and other defined circumstances.
D Payment default on financial commitments.
Source: S&P, 2013
Note: An entities’ credit rating is often further qualified with a ‘+’ or ‘-’. This denotes its relative level of risk compared to other entities with the same letter rating.
S&P has assigned South Africa a foreign long-term credit rating of BBB and a local short-
term rating of A-2. According to S&P, a rating of A-2 means that South Africa, “…has
satisfactory capacity to meet its financial commitments. However, it is somewhat more
susceptible to the adverse effects of changes in circumstances and economic conditions
than obligors in the highest rating category.” A lower rating for the country in foreign-
currency obligations may reflect that South Africa has smaller foreign currency reserves
than others such as China.
On the 27th of September 2012, Moody’s Investor Services downgraded its South African
government bond credit rating to Baa1. This means that Moody’s has rated these bonds
to be medium-grade and subject to moderate credit risk. Lower credit ratings mean that
it will be more difficult for government to respond to slow growth with an infrastructure
drive, as it intended. It will have to pay more for the credit to fund the drive, scale back
to offset the higher interest costs or raise taxes.
4.3 Domestic Factors
South Africa has recorded few truly self-inflicted recessions. For the most part, when the
country has entered recession, it has been due to external factors. Domestic factors,
however, can restrict the ability of the country to react to the changing economic

landscape, thus limiting options to reduce or even reverse recessionary pressures. Some
of the domestic factors which contribute to this challenge are the electricity capacity,
skills shortage and labour unrest, as discussed below.
4.3.1. Electricity Capacity
Figure 9: Electricity Generated and Available for Distribution, January 2004 –
November 2012
Source: Stats SA, 2013
Figure 9 shows the Giga-watt hours (GWH) of electricity available for distribution in
South Africa each month from January 2004 to November 2012. Electricity displayed an
upward trend at first, beginning the period under review at 15,856GWH and rising until it
peaked at 20,471 in August 2007. From then on, the trend has been largely negative,
particularly in November and December 2008. Statistics South Africa (Stats SA)
attributed the decreases in those two months to factors such as such as load shedding
and a continuous drive from Eskom to encourage users to reduce their electricity
consumption. Another factor which reduced supply was the fact that, in November,
electricity imports into South Africa were significantly lowered by difficulties with the
Apollo converter station in Mozambique. The latest data at time of writing placed
electricity available for distribution in November 2012 at 19,671GWH or 800GWH below
the August 2007 peak.
A lack of electricity capacity constrains growth in many areas of the economy. AngloGold
Ashanti (2008) refers to the electricity shortage of January 2008 as, “one of the most
critical moments that… the mining industry [has] faced in South Africa”. While the
country did benefit from the increased prices of many of its exports, other countries such

as Australia were able to compound their benefits by also increasing production. South
African mines were unable to do so due to lack of additional electricity. Mining is not the
only heavy industry which cannot expand without additional electricity. Smelting
operations in the country have been constrained as well, for example.
4.3.2. The Skills Shortage
“High quality education and appropriate competences and capabilities held by both
individuals and firms are a prerequisite for growth, development and citizenship. Skills
development, therefore, continues to remain top of the national development agenda
and will remain so for the foreseeable future. It is important for the greater economic
development of our country, but also to foster greater inclusion and restore dignity
among our citizenry.”
Human Sciences Research Council (HSRC), 2012.
Beyond the general benefits of improved skills, higher skill levels can also aid an
economy in recession by easing the movement of resources from newly unprofitable
economic sub-sectors to ones with more potential in the current landscape. South Africa,
however, has a limited capacity to engage in this type of shift, as the country is
challenged by a skills shortage.
According to HSRC (2009), the correct skills are required for workers to adapt to new
realities. High unemployment rates correlate with unmet demands by employers for
skilled labour. This suggests that many new labour market entrants lack the skills
required for employment. New skills are particularly important for venturing into new
industries. An example of this is the green economy, as discussed by the International
Labour Organisation (ILO) in its Skills for Green Jobs in South Africa (2010) publication.
According to the report, the realisation of the potential of the green economy, such as
environmental benefits and increased employment, is being held back by a lack of skills.
Shifting resources idled by the recession into green projects could have helped South
Africa to recover from the recession more rapidly and currently could speed economic
growth.
4.3.3. Labour Unrest
Late in 2012, unprotected strikes spread across the mining industry. Violence was often
a part of these strikes, as epitomised by the tragic events at Marikana. According to the
Congress of South African Trade Unions (COSATU), the triggering incident of this

increase in labour unrest appears to have been a wage-increase granted to certain types
of mineworkers, but not others. This apparently brought to a head tensions created by
high debt-levels suffered by mineworkers.
This unrest has contributed to other negative factors, such as the missed opportunity to
expand mining production and reduced investor confidence, as often reflected in credit
rating downgrades. The impact has spread to other sectors of the economy, though the
exact degree to which it has done so currently remains uncertain. Reduced income in the
mining sub-sector translates into less money spent in the rest of the economy and
mining outputs are used as inputs by other industries. Also, mining output is one of
South Africa’s primary exports. The decrease in mining thus contributed to the large
trade deficit in January 2013. With its impact being multiplied in this manner, this labour
unrest has the potential to be more serious than its direct effect alone. If further events
of similar impact occur in the near future, this could potentially send the economy into
another contraction phase.
5. The Role of Government
The financial crisis and accompanying global recession show the necessity that
governments not assume that economic upswings will last indefinitely. When the
economy is in an expansion, it is imperative that governments use the greater
availability of funding and positive economic momentum to build up reserves which will
act as buffers to protect the economy from negative shocks. Governments which are
already labouring under large budget deficits have less ability to react to their country
entering a prolonged economic contraction. According to Sutherland (2010), on average,
governments which have larger deficits take smaller actions to offset negative shocks.
Countries with budget surpluses before the crisis were able to implement large stimulus
programmes, while others were in such poor fiscal shape that they were forced to
implement austerity measures. Austerity during a recession is pro-cyclical and worsens
the decrease in GDP, but it may still be needed to repair deeper faults in the economy.
Greece is an example of a country which was forced by its economic circumstances to
put austerity measures into place during recession, even though this will likely prolong
and deepen that recession.

Figure 10: GDP & Growth, Greece, 2000-2012
Source: WEO, 2013 Note: # indicates estimates
Figure 10 shows the current GDP of Greece and the real growth rate, for the years 2000
to 2011, with an estimate for 2012. The GDP of Greece was US$127.6 billion in 2000
and grew by an average of 3.7 percent per annum until it reached a peak of US$342.8
billion in 2008. In 2009, the Greek economy fell into recession and GDP decreased by
3.3 percent to US$322.6 billion. Austerity measures and a lack of trust in the finances of
the country have left the GDP of Greece still falling by 5.5 percent per year, on average.
The country’s GDP is estimated to have been US$255 billion in 2012. If the government
of Greece had been in better fiscal condition when the crisis began, it may have been
able to offset the resultant recessionary pressures rather than deepening the contraction
with unfortunately necessary austerity measures. The economy of fellow Euro-area
economy Germany lost 5.1 percent of its output in 2009 but had already recovered to
positive 4 percent growth by the end of 2010.
High inflation can also make it more difficult for governments to respond to recessions
by limiting the ability of central banks to reduce interest rates without creating the
potential for inflation to run out of control in the future. Lowering interest rates is
desirable during economic contraction because it can encourage spending and
investment by making credit cheaper. Another constraint is that reducing interest rates
has an increasingly small effect as the rate nears zero. Households retain more of their
income to spend if they are making lower interest payments on already-incurred debt,
while businesses are able to access loans for investment purposes at a lower price. This

should at least partially offset the increased wariness induced by the recession. A
government also sets the capital requirements of the banks in its country. Banks with
larger capital reserves were better able to absorb the losses caused by the financial crisis
as these reserves acted as buffers.
In South Africa, inflation was above the SARB target band of 3 to 6 percent in 2007 and
2008, but it was not as high as in several other countries and SARB had already raised
the repo rate to contain it. This combined with a government budget in surplus to allow
government to take action to offset the recession without incurring a crippling level of
debt or letting inflation run rampant.
Figure 11: Government Budget Balance (% of GDP), Inflation & Repo Rate,
2002-2011
Source: SARB & Stats SA, 2013.
Figure 11 shows the Consumer Price Index (CPI) inflation rate, the repo rate and the
government budget balance for South Africa for the years 2002 to 2011. The budget was
in deficit from the beginning of the period until 2006, when government began saving
due to the then-new counter-cyclical policy. The 2007 Medium-Term Budget Policy
Statement (MTBPS) indicated the, “need to raise government savings in response to the
cyclical element of revenue collection”. The budget surplus peaked at 0.7 percent of GDP
in 2007. When the world went in recession in 2008, government increased spending to
offset the contractionary pressures. This resulted in a budget deficit of 0.4 percent,
which rose to 4.9 percent in 2009. Since then, prudent fiscal management has reduced
the deficit to 4.2 percent as of 2011. This is important for combating the recession, since
Sutherland (2010) suggests that the benefits of increased government spending can be

offset to a lesser or greater extent depending on the accompanying level of government
debt. This is because increased government debt causes private persons to anticipate
higher taxation in future, leading them to reduce private spending in favour of increased
saving to prepare for the more austere times ahead. There is also the risk that credit
rating agencies would downgrade their ratings for South Africa in response to a
continually growing deficit. The combination of these factors result in the appearance
that it would be unfeasible for government to increase spending any further to counter-
act slow economic growth.
Inflation had been rising since reaching a trough of 1.4 percent in 2004, peaking at 11.5
percent in 2008. SARB had been raising the repo rate in response, with an average repo
rate of 11.6 percent in 2008. In 2009, recessionary pressures were beginning to affect
the South African economy and inflation fell to 7.1 percent. SARB also lowered interest
rates to support spending, with the repo averaging 8.3 percent. Both rates continued to
fall in 2010. In 2011, with the economic recovery well under way, inflation began to rise
once more but, since it remained within the target band, SARB was able to reduce the
repo further to maintain support for the recovery.
Social safety nets such as the Unemployment Insurance Fund (UIF) can also offset a
recession to some degree through their normal functioning. During a recession,
unemployment rises. This loss of income inhibits spending; it would do so to an even
greater degree if newly unemployed persons did not receive UIF payments.
6. Review and Outlook for the South African Economy
This section details two types of forecast of the future growth of the South African
economy; a composite leading indicator from the SARB and a GDP forecast from the
IMF. The composite leading indicator can be used to make projections for the direction of
movement in GDP in the next 6 to 12 months.
Figure 12: Composite Leading and Coincident Indicators, January 2006 –
November 2012

Source: SARB, 2013 Note: indicates the period when GDP growth was negative
Figure 12 shows the monthly composite leading and coincident indicators for South
Africa from January 2006 to November 2012. A composite indicator is an index
constructed by taking the weighted averages of several individual indicators. Both the
leading and coincident composite indicators were increasing from January 2006 until the
leading indicator fell slightly in June. According to Venter (2011), demand was growing
during this period, as well as prices. After this, the leading indicator remained largely flat
while the coincident indicator continued rising, though at a decreasing rate. Since the
coincident indicator moves at approximately the same time as GDP, as explained in
Section 2.2, this suggests that economic growth was positive at this time, though it was
beginning to slow. Furthermore, prices and interest rates had reached heights that
obliged already heavily-indebted consumers to reduce their consumption levels. In March
2008, the leading indicator began a noticeable downswing and this was followed by the
coincident indicator in August. During this period, interruptions in electricity supplies
caused a reduction in national output growth; followed by the global recession, which
reduced demand for South African exports to the point where the country entered
recession. The leading indicator also successfully predicted the recovery by increasing in
July 2009. The coincident indicator followed suit in December. In the real economy,
recovery in India and China led to revitalised demand for South African mining and
manufacturing exports and real wages increased due to monetary policy easing. These
factors combined to begin the recovery of the South African economy. Presently, the
leading indicator is largely flat once more. If the previous pattern holds, this would
suggest that the growth of the South African economy will continue to be positive.
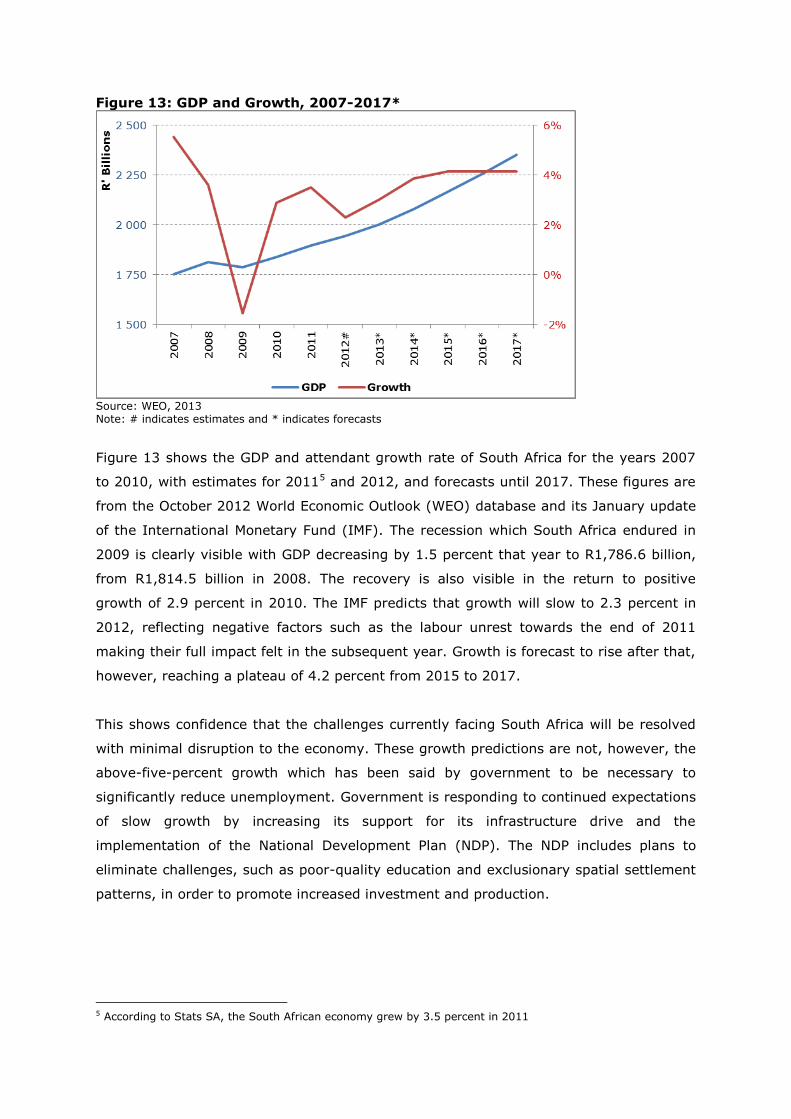
Figure 13: GDP and Growth, 2007-2017*
Source: WEO, 2013 Note: # indicates estimates and * indicates forecasts
Figure 13 shows the GDP and attendant growth rate of South Africa for the years 2007
to 2010, with estimates for 20115 and 2012, and forecasts until 2017. These figures are
from the October 2012 World Economic Outlook (WEO) database and its January update
of the International Monetary Fund (IMF). The recession which South Africa endured in
2009 is clearly visible with GDP decreasing by 1.5 percent that year to R1,786.6 billion,
from R1,814.5 billion in 2008. The recovery is also visible in the return to positive
growth of 2.9 percent in 2010. The IMF predicts that growth will slow to 2.3 percent in
2012, reflecting negative factors such as the labour unrest towards the end of 2011
making their full impact felt in the subsequent year. Growth is forecast to rise after that,
however, reaching a plateau of 4.2 percent from 2015 to 2017.
This shows confidence that the challenges currently facing South Africa will be resolved
with minimal disruption to the economy. These growth predictions are not, however, the
above-five-percent growth which has been said by government to be necessary to
significantly reduce unemployment. Government is responding to continued expectations
of slow growth by increasing its support for its infrastructure drive and the
implementation of the National Development Plan (NDP). The NDP includes plans to
eliminate challenges, such as poor-quality education and exclusionary spatial settlement
patterns, in order to promote increased investment and production.
5 According to Stats SA, the South African economy grew by 3.5 percent in 2011
7. Conclusion
This document has provided the definition of a business cycle as the pattern of
expansion and contraction which aggregate economic activity exhibits around its overall
trend. One complete business cycle is constituted of a trough, an expansion, a peak and
a contraction. The Great Depression, financial crisis and Euro-area debt crises are
examples of well-known business cycles.
The SARB monitors these cycles and attempts to predict them by compiling leading,
coincident and lagging composite indicators. External factors are very significant for
South African business cycles as the country has a relatively small, mostly open
economy. Major output fluctuations in South Africa are most often the result of changes
in international economic conditions. Foreign, external, economic events most often
affect South Africa through trade channels and the confidence which foreign investors
have in the South African economy can also be a factor.
While external factors have had the greatest influence so far, this is at least partly
because of domestic factors which limit the ability of the country to respond to the
changing economic landscape. These limitations include electricity capacity, labour
unrest and a shortage of skills. Projections suggest that the economy of South Africa will
continue to grow, though at an unspectacular pace. However, if the limiting domestic
challenges could be resolved, the country would be better able to adapt and might be
able to reach greater economic growth. South Africa would then be less at the mercy of
external business cycles. The South African government’s response to the business
cycles experienced by the country due to the global financial crisis successfully
moderated the impact of the recession. The NCA reduced the impact of the global
financial crisis and counter-cyclical management of the deficit offset the accompanying
recession which was carried to South Africa through trade channels. However, a
government budget deficit that remains above 4 percent suggests that, in the short-
term, the fiscal flexibility to further increase spending, to invigorate a sluggish economy,
may be limited.

8. References
AngloGold Ashanti. 2008. AngloGold Ashanti’s response to the power crisis. Accessed
from www.anglogold.co.za/subwebs/informationforinvestors/reports08/power-crisis.htm
Chetty, S., Greyling, L., Schoeman, C.H., Van Zyl, G., Wentzel, A. 2005. Fundamental
Economic Theory. B&D Printers. 2005.
Congress of South African Trade Unions. 2012. COSATU and NUM statement on the
current wildcat strikes in the mining industry. Accessed from
www.cosatu.org.za/show.php?ID=6567
De Lange, J. 2012. Lender avarice drove desperate miners. Accessed from
www.miningmx.com/page/news/markets/1466914-Lender-avarice-drove-desperate-
miners
Grant, R., Brue, S. 2007. The History of Economic Thought. Thomson South-Western.
2007.
Heilbroner, R. 2000. The Worldly Philosophers. Penguin.
Heinemann Educational Books. 2007. Enjoy Economics.
Human Sciences Research Council. 2009. Skills Shortages in South Africa. HSRC Press.
Human Sciences Research Council. 2012. Strategies to Skill the Nation: Review of
Government’s Skill Development Strategy. HSRC Press.
International Monetary Fund. 2012. World Economic Outlook Database October 2012.
Accessed from http://www.imf.org/external/pubs/ft/weo/2012/02/weodata/index.aspx
International Monetary Fund. 2013. World Economic Outlook Update January 2013.
Accessed from http://www.imf.org/external/pubs/ft/weo/2013/update/01/index.htm
Kearns, J., Lowe, P. 2011. Australia’s Prosperous 2000s: Housing and the Mining Boom.
Accessed from www.rba.gov.au/publications/confs/2011/kearns-lowe.pdf
KPMG. 2009. Economic Insight Quarterly Review, Quarter Two, 2009, Issue 8.
Marx, K. 1867. Das Kapital. Verlag Otto Meissner Hamburg.
Mohr, P. 2005. Economic Indicators, 3rd Edition. Unisa Press.
Moody’s Investor Services. 2013. Rating Symbols and Definitions. Accessed from
www.moodys.com/researchdocumentcontentpage.aspx?docid=PBC_79004
National Planning Commission. 2013. National Development Plan 2030, Our future –
make it work. Accessed from
http://www.npconline.co.za/MediaLib/Downloads/Downloads/Executive%20Summary-
NDP%202030%20-%20Our%20future%20-%20make%20it%20work.pdf
Recovery Accountability and Transparency Board. 2013. Breakdown of Funding By
Category. Accessed from
http://www.recovery.gov/Transparency/fundingoverview/Pages/fundingbreakdown.aspx
Recovery Accountability and Transparency Board. 2013. The Recovery Act. Accessed
from http://www.recovery.gov/About/Pages/The_Act.aspx
South African National Treasury. 2009. Budget Speech, 2009. Accessed from
http://www.treasury.gov.za/documents/national%20budget/2009/speech/speech.pdf
South African National Treasury. 1998. Medium Term Budget Policy Statement, 1998.
Accessed from http://www.treasury.gov.za/documents/mtbps/1998/2.pdf
South African National Treasury. 2009. Medium Term Budget Policy Statement, 2009.
Accessed from
http://www.treasury.gov.za/documents/mtbps/2009/mtbps/National%20Treasury%20M
edium%20Term%20Budget%20Policy.pdf
South African Reserve Bank. 2012. The Changing Mandates of Central Banks: The
Challenges for Domestic Policy. Accessed from
http://www.resbank.co.za/Publications/Speeches/Detail-Item-
View/Pages/default.aspx?sarbweb=3b6aa07d-92ab-441f-b7bf-
bb7dfb1bedb4&sarblist=a01d874c-c3f6-4b93-a9dc-c984cf8652cf&sarbitem=344
South African Reserve Bank. 2013. Online download facility. Accessed from
http://www.resbank.co.za/Research/Statistics/Pages/OnlineDownloadFacility.aspx
Standard & Poor’s. 2013. Credit Ratings Definitions & FAQs. Accessed from
www.standardandpoors.com/ratings/definitions-and-faqs/en/us
Standard & Poor’s. 2013. Ratings, South Africa (Republic of). Accessed from
http://www.standardandpoors.com/prot/ratings/entity-
ratings/en/us/?entityID=272272&
sectorCode=SOV
Statistics South Africa. 2013. Electricity generated and available for distribution.
Accessed from
www.statssa.gov.za/publications/statspastfuture.asp?PPN=P4141&SCH=5135
Sutherland, D., Hoeller, P., Egert, B., Rohn, O. 2010. “Counter-cyclical Economic Policy”,
OECD Economics Department Working Papers, No. 760, OECD Publishing. Accessed from
http://www.oecd-
ilibrary.org/docserver/download/5kmfw36tj97h.pdf?expires=1360313748&id=id&accnam
e=guest&checksum=12343A7FAB9F4BBAABAD07134E09A692
The Presidency. 2013. State of the Nation Address by His Excellency Jacob G Zuma,
President of the Republic of South Africa on the occasion of the Joint Sitting of
Parliament Cape Town. Accessed from
www.info.gov.za/speech/DynamicAction?pageid=461&sid=34250&tid=98676
Venter, J.C. 1999. Business cycles in SA during 1993 – 1997. SARB.
Venter, J.C. 2009. Business cycles in South Africa during the period 1999 to 2007. SARB.
Venter, J.C. 2011. Business cycles in South Africa during the period 2007 to 2009. SARB.
Zarnowitz, V. 1992. Business Cycles: Theory, History, Indicators, and Forecasting.
National Bureau of Economic Research. University of Chicago Press. January 1992.