business development issues in latin...
TRANSCRIPT

1Julio 2007
Iberdrola Renovables SA
BUSINESS DEVELOPMENT ISSUES IN LATIN AMERICA
February 2008

2
Contents
I. Iberdrola Group NumbersII. Iberdrola Renewables Growth StrategyIII. “Renewable” countriesIV. Some Data about Latin AmericaV. One Example: The Case of ColombiaVI. Conclusions

Iberdrola Group Numbers
Energy Production (GWh) 86.800
Energy Sales (GWh) 115.508
Nº of Customers (Gas & Electricity) (millions) 24
Installed capacity (MW) 41.001
11.38
Stock Market Value
(30 October 2007)
51.44
Net Profit(Profit year 2006: 1.660 M euros)
Total Assets 68.13
Operational Data Nine months of 2007
Financial Data Nine months 2007
(Billion euros)
Income
1.61 Nº of Employees 26.375

4
Iberdrola focusses in the Atlantic Region: Four strategic markets
North America:2º Wind energy producer (in US)
3º Gas storing (in US)
Latin America: 1º Private generation Co Mexico
1º Distribution Co Brazil
United Kindom:3rd Distribution Co
Among the5 major retailers1ª Wind energy producer
Spain:1 º Utility
Iberdrola Group Strategic Markets

ProductionProduction MixMix 20062006
NuclearNuclear27%27%
CombComb. . CycleCycle40%40%
CoalCoal6%6%
OilOil2%2% HydroHydro
14%14%
WindWind9%9%
Cogeneration Cogeneration 2%2%
Iberdrola Group Production Numbers
2005 2006
CombinedCombinedCycleCycle
EmissionEmissionFreeFree
91.99191.99183.00983.009
Production GrowthProduction Growth
+15%+15%+15%
+18%+18%+18%
+10,8%+10,8%
Driven by Low Emission TechnologiesDriven by Low Emission Technologies
-32%--32%32% Coal + OilCoal + Oil
* Hidráulica + Nuclear + Eólica
GWhGWh

6
Iberdrola Renovables Evolution
1.070 MW
2001
2003
2004-05
2007
2006
2001
Startegic Plan2001-2006
Leader in Spain CORE
Getting into European market
Getting intoUS market
Acquisition ofScottish Power
4.434 MW
2006
7.342 MW
2007
Stock market

Iberdrola Renovables Near Future
Pipeline42.000 MW
Rest
USA
Spain
18% 16%
51%
Installed Wind Capacity 7.704 MW
Spain
USA
United Kindom
Res
4.214 MW(62%)
507 MW(7%)
1,741 MW(26%)
364 MW(5%)
United Kindom
15%
World Leader in Wind Energy
13.500 MW by 201013.500 MW by 2010

8
Iberdrola Renovables: Growth Strategy
Regulating frame / Infrastructures
Growth
Potential
+
+_
_
Asia
Latin America
Medit. S- E Canada
Spain
USA
FranceU.K.
Poland
Greece
Portugal
GermanyEast Europe
Short termMedium Term
Case-by- case oportunities
Low Interest

9
Installed Capacity (MW) Mechanism
Countries In 2006 Ac Dec 2006
Feed-In Certifictes
Germany 1.773 20.200 Spain 1.572 11.600 Danmark 9 3.136 Italy 224 1.941 Netherlands 345 1.553 U.K. 616 1.958 Portugal 529 1.553 France 708 1.478 Sweden 27 519 Austria 146 965 Greece 173 746 Belgium 28 188 Total 6.150 45.837
Renewable Countries: Clues for success
Feed-In tarif: key for success
More than 90% installed wind capacity in countries with feed-in tarif.
High growth rates in countries with feed-in tarif
No significant successes where certificates
* Data as of Dec 2006

10
Fuente: Communication from the Commission : “The support of electricity from renewable energy sources”, dic 2005
Bélgica
Italia
RUPrices for end user of wind energy are higher in countries with certificates
Feed-in results in less cost for end user
Due to higher risks, profitability required by investors under certificate schemes are higher. Final customer pays more at the end
Din
amar
ca
EspañaFi
nlan
dia
11
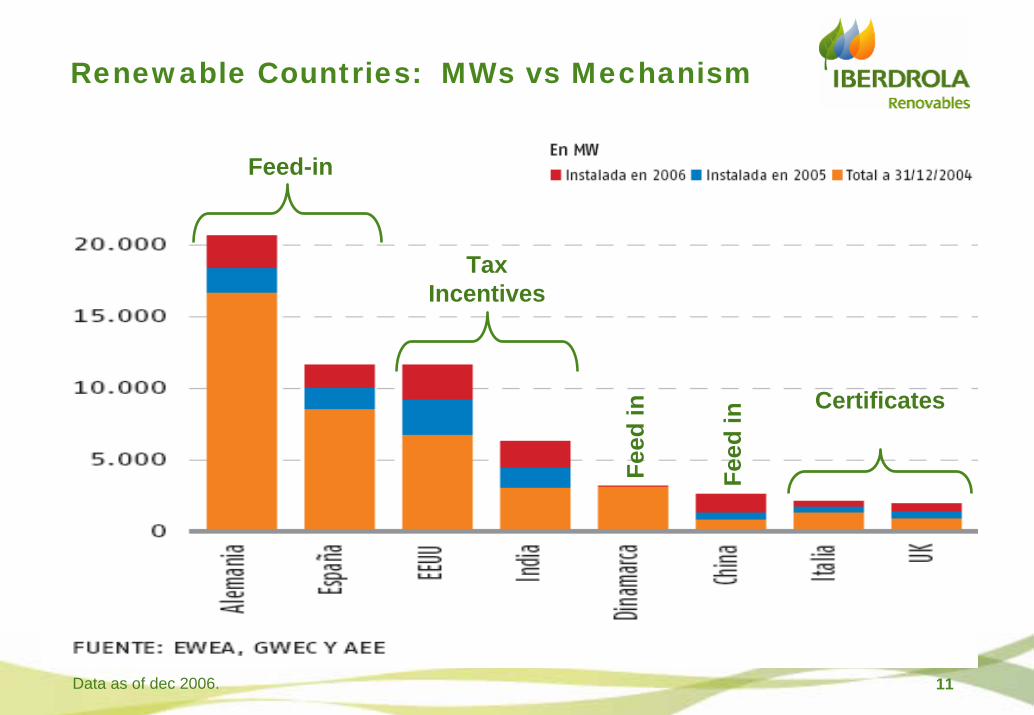
Renewable Countries: MWs vs Mechanism
Data as of dec 2006.
Feed-in
TaxIncentives
Feed
in
Feed
in
Certificates

12
Renewable countries: average prices of wind energy in 2007
PAIS REGULACION €/MWh - 2007
USA Certificates/Incentives 81Spain Feed In (RD 436) 79United Kindom Certificates 114Greece Feed in/ Investment subsidees 90Francia Feed in 82,5Polonia Certificates 74Brasil Feed in (PROINFA) 82

Latin America: some figures (aprox)
13
LATAM MEXICO BRASIL REP DOM CHILE COLOMBIA PANAMA PERU ECUADOR ARGENTINA GUATEMALA COSTA RICA
Installed (MW) 300.000 58.633 96.634 3.394 12.720 13.280 1.540 6.548 4.398 24.352 1.758 2.048
Generation mix 52%H 45%T21%H 72%T
7%O 76%H 21%T 3%O 14%H 83%T 3% G 39%H 61%T 66%H 33% T 1%O 44%H 56%T 50%H 50%T 50%H 50%T 42%H 54%T 4%N 38%H 60%T 2% G 63%H 19%T 17% G
Demand growth 5% 5,20% 4% 4,40% 5,50% 4,70% 5% 6,50% 6,20% 7% 7,00% 7%
Rating (S&P) BBB+ BB+ B+ A+ BB BB+ BB+ CCC+ B+ BB BB
Price range (Apr)75-85
$/MWh 65-80 $/MWh 70-75 $/MWh 55-60 $/MWh 45-55 $/MWh100-120 $/MWh
50-60 $/MWh
90-100 $/MWh 30-35 $/MWh110-120 $/MWh
Electric market Liberalized Generation Lib Liberalized Liberalized Liberalized Liberalized Liberalized Liberalized Liberalized Liberalized Monopoliy ICE
Types of contracts PPAs - Licts PPAs - Licts PPAs - SPOT PPAs - SPOT PPAs - SPOT PPAs PPAs - SPOT PPAs - SPOT PPAs - SPOT PPAs - SPOT Licitaciones
Allowed parties CFE - Clients Distribution Cos Distribs - Clients Distribs - Clients Distribs - Clientes Distribution CoDistribs -Clientes Distribs - Clientes Gens-Dist-Clientes Distribs -- Grandes Cl ICE
Applicable laws X Law 5/07 -Regl 2008 law 2008 Law 08 Law 2004 Law 2003 / Reg 2005 NA
Types of support Incentive Feed in (-) Feed in Certificate Incentive Incentive Feed in Feed in Incentive Feed in (-)
Wind Potential
Capacity > 200.000 30.000 > 100.000 5.000 10.000 10.000 2.000 3.000 1.000 >100.000 3.000 5.000
Hours 2500-40004000 (Sur) 3000 (W) 3.000 (N) > 2.500 (S) 3000- (Norte-Este) 3.000 (C-N) 3.500 (Norte) 3.000 3.000 2.500 3.500 (S) 3.000© 2500 (Centro) 3500
Wind share > 15.000 5000 10.000 400 700 600 150 600 250 1000 150 200

Latin America: Some facts from figures
• Huge undeveloped wind potential• Generation mix base on Hydro + Thermal• High rates of growth: concerns about availability in the future• Wide ranges of prices. Some very low• Ratings below investment grade: higher requirements• Liberalized markets: energy competes per price• In many countries renewable cannot compete w/o support• Some interesting support initiatives but limited support, so far
14

Example of Colombia: Price history
Source: Empresa Operadora del Mercado ‐ XM S.A.‐
(1 Euro = 2.781 CO $ ------- 75 CO $ = 2,69 cents of euro)

Example of Colombia: Price forecast
Source : Estimates of generation costs, including the “cargo por confiabilidad”, under different generation mixes
30
35
40
45
50
55
60
65
Jan-
08
Jan-
09
Jan-
10
Jan-
11
Jan-
12
Jan-
13
Jan-
14
Jan-
15
Jan-
16
Jan-
17
Jan-
18
Jan-
19
Jan-
20
Jan-
21
Jan-
22
US$/M
Wh
Black = MIX 1 (H + G) Red = MIX 2 (H + G + C) BLUE= MIX 3 (H + G + C + R)

Example of Colombia: Present Situation
Profitability considering average investment and financing conditions together with Colombia electricity market conditions is in the range of 1% to 5%
Profitability considering average investment and financing conditions together with Colombia electricity market conditions is in the range of 1% to 5%
Commissioning : 2009
Investment : 2.200mUS$/MW
Capacity Factor: 35-40% (above normal, considering the best resources of the country: Guajira)
Electricity market price(*): 30 US$/MWh
Other Income (*) (“cargo por confiabilidad” , “certificates”…): 10-20$/MWh
Operational Inputs : Average market valuesOperational Inputs : Average market values
Depreciation: 20 years
Corporate tax: 33% of EBIT
Tax Incentives: Tax credit up to 40% of the total investment during life cycle
Financial InputsFinancial Inputs
(*) Crecimiento anual = Inflación

Example of Colombia: Effect of somepotential measures
Additional Income (Certificates, CDMs, extras to market price,…)Additional Income (Certificates, CDMs, extras to market price,…)
Mild financing schemes (effect on ROE) *Mild financing schemes (effect on ROE) *
1 year : + 50 bp above base case (equity)
Possible measures to increase profitability to a prospective investor can be of two types, orcombinations
Possible measures to increase profitability to a prospective investor can be of two types, orcombinations
Exemption periodExemption period Lower Interest RatesLower Interest Rates
18
Total increase above the assumptions: +10 US $/MWh ----------- +300 bp above base case +20 US $/MWh ----------- +450 bp above base case
+30 US $/MWh ----------- +630 bp above base case
Note: Base case Equity: 70% senior debt at an interest rate of 5%
2 years: +100 bp above base case (equity)
3 years : +170 bp above base case (equity)
2,5%: +260 bp above base case (equity)
4,0%: +90 bp above base case (equity)
0,0%: +653 bp above base case (equity)
* Return on equity has been calculated estimating no witholding tax and 100% of cash flows and reserves (after debt) converted to dividends